Network-Based Traitor-Tracing Technique Using Traffic Pattern
Scientific Journal of Informatics Vol. 5, No. 2, Nov 2018
p-ISSN 2407-7658 http://journal.unnes.ac.id/nju/index.php/sji e-ISSN 2460-0040
91
Associative Analysis Data Mining Pattern Against
Traffic Accidents Using Apriori Algorithm
Ruswati1, Acep Irham Gufroni2, Rianto3
1,2,3Informatics Departement, Faculty of Engineering, Universitas Siliwangi, Indonesia
Email: [email protected], [email protected], [email protected]
Abstract
Traffic accidents are one of the causes of high mortality in the community. Based on
information from the World Health Organization (WHO) the number of accident victims in
each year amounts to 1,300,000 fatalities, this is caused by traffic accidents that exist
throughout the world. The police recorded data on accidents that occurred in several regions of East Priangan namely Ciamis and Tasikmalaya Regencies for the 2016-2017 period
reaching an accident rate of ± 1500. The analysis that can be done to reduce the intensity of
the occurrence of these events is to use data mining processing techniques. The right method
is used by looking at the condition of the data obtained, namely the Association Rules method with the calculation of the Apriori Algorithm. This method will look for patterns of
data relations that are formed from combinations of an itemset, so that knowledge will
appear from large datasets. The pattern of the relationship sought is the linkages of itemset
variables involved in the accident by involving 4 variables that describe the identity of the perpetrators, namely gender, age, profession and level of education and 22 attributes of the
dataset. The minimum limit of support, confidence and lift ratio values used in the Apriori
Algorithm calculation rules are 15%, 70% and 1.1. This value is used to get many rules that
have a high level of occurrence accuracy. The results of the combination pattern calculation were 3 times iterations on each number of data in each region, the pattern of associations
found in the Tasikmalaya region were the relation of the professional variables and the age
of the perpetrator with the attribute of the Student profession dataset and the boundary group
ages 16 to 30 years, while for the pattern associations found in the area of Ciamis Regency, namely the relation between age and education level with the attribute dataset of the 16 to
30 year age group and high school education level. The accuracy of the value obtained is
calculated manually and uses one of the data mining applications as a comparison of value
accuracy, namely Tanagra 1.4.
Keywords: Apriori Algorithm, Association Rules, Data Mining, Traffic Accidents
1. INTRODUCTION Traffic accidents have become a social problem that is considered 'normal' for
Indonesian people because the intensity of the events is getting higher. Statistical
data shows that the number of traffic accidents nationally continues to increase
every year. Traffic accidents in 2014 recorded 95,906 accident cases, then in 2015
there were 98,970 accident cases and in 2016 it increased to 105,374 accident cases.
The number of traffic accidents in 2017 has decreased, the National Police noted
that the number of accidents decreased by 6% from the previous year to 98,419
accidents.

Scientific Journal of Informatics , Vol. 5, No. 2, November 2018 92
The area of Ciamis and Tasikmalaya Districts has become the attention of the
police regarding traffic accidents, the police have recorded around 1500 cases of
traffic accidents that occurred during the 2016-2017 period. So, a strategy is needed
to find patterns of relationships between data to reduce the occurrence of accidents
[1].
Finding knowledge from large amounts of data can use one of the data processing
technologies, namely data mining techniques [2]. Association Rules is one of the
data mining methods used to find relation patterns between data by determining
association rules from data [3]. The Association Rules are also called Market
Basketball Analysis because at the beginning they found the concept related to the
items in the shopping basket, the concept directly shows the behavior patterns of
consumers when shopping [4, 5].
Method Association Rules has a number of algorithm choices including the type of
data mining association rules, one of the right algorithms with the aim of the
research being done is using the Apriori Algorithm [6, 7]. The results that will be
obtained from the analysis process are the finding of a pattern of relations between
accident data in the Tasikmalaya and Ciamis districts by using associative data
mining rules [8].
2. METHODS
2.1. SEMMA Stage The data mining preparation process uses SEMMA, this stage is often used in
solving data mining problems, the steps that will be taken to produce a knowledge
from the data that has been obtained are as follows [9]:
Figure 1. SEMMA diagram [10]

Scientific Journal of Informatics , Vol. 5, No. 2, November 2018 93
The stages that are passed are as follows:
1) Sample
Collection of data that will become the main data mining processing material, the
completeness of the data in each item that is also considered at this stage.
2) Explore
The stage of looking for data patterns or also called the clustering process is the
process of grouping a number of data/objects into groups of data so that the group
contains similar data, this stage is called the pro processing stage in the KDD series.
3) Modify
Create and change variables, or eliminate unnecessary variables to focus on the
process of selecting models and mining processes.
4) Model
Choose and apply modeling techniques that are appropriate to the conditions of the
data obtained in order to obtain optimal results.
5) Assess
Assess data by evaluating the usefulness and discovery functions of the data mining
process that has been obtained.
The diagramming process is carried out to process the initial data obtained until the
evaluation of the final results. The amount of initial data entered at the Sample
stage is as much as 1503 data on accident cases. Then in the Explore stage, the data
were grouped based on the area of each Polres, the data group was divided into 2
regions [10] of Tasikmalaya with a total of 795 data and the area of Ciamis Regency
as many as 565 data [11]. After arriving at the Modify stage, the amount of data
becomes 1360 accident data with the variable description of the involved actors,
namely gender (male and female), age-grouped into 5 age limits, namely: 10 ≤ age
≤ 15, 16 ≤ age ≤ 30, 31 ≤ ages ≤ 40, 41 ≤ ages ≤ 50, and age> 50, professions are
grouped into 11 profession actors, namely: PNS, TNI, Police, Employees, Students,
College Students, Drivers, Traders, Farmers, Laborers and Entrepreneur, and levels
education (elementary, junior high, high school, college). The number of attributes
involved is 22 attributes [08].
The determination of the data mining calculation process model is the association
rule model using the Apriori algorithm to get the relationships between available
data to see the involvement of variables involved in the accident in each region,
namely Tasikmalaya and Ciamis Regency. The model is chosen because it is in
accordance with the objectives of the research conducted. The final stage of
SEMMA is to assess the usefulness of the conclusions of the data that has been
obtained.
2.2. Association Rules with Apriori Algorithms The Apriori algorithm includes the types of association rules in data mining.
Association Rules are data mining techniques to find association rules between a
combination of items [6]. Here are the stages of the Apriori Algorithm process in
association rules shown in Figure 2.

Scientific Journal of Informatics , Vol. 5, No. 2, November 2018 94
Figure 2. Flowchart apriori algorithms
There are several stages in the process of calculating association rules using the
Apriori algorithm, including the following:
1) Formation of Itemset Candidates
Candidate itemset is itemsets that will be calculated with the support value using
the formula Support. If the value can be more or equal to the minimum support
value, the itemset includes the itemset frequency, but if the value can be less than
the minimum support value, the itemset will not enter the next calculation process.
2) Frequency of Itemset
Scientific Journal of Informatics , Vol. 5, No. 2, November 2018 95
Itemset frequency is a collection of itemset from k-iterations that have more or
equal support values with the specified minimum support.
3) Calculation of Confidence Value
The confidence value of association rules is a measure of the accuracy of a rule or
the strong relationship between items in the rules of association A and B.
4) Calculation of Lift Ratio Value
Lift ratio is done to calculate the strength of random event rules that occur in each
combination.
The association rule calculation method consists of 3 basic calculations, namely
determining the support value, confidence and lift ratio [12]. The minimum value
used as the minimum support limit is 0.15, the minimum confidence limit is 70%,
and the lift ratio is 1.1 [12]. The formula for each calculation is [6]:
a. Support
Support value of an item is obtained by the formula:
Support (A) = 𝑡ℎ𝑒 𝑛𝑢𝑚𝑏𝑒𝑟 𝑜𝑓 𝑡𝑟𝑎𝑛𝑠𝑎𝑐𝑡𝑖𝑜𝑛𝑠 𝑐𝑜𝑛𝑡𝑎𝑖𝑛𝑖𝑛𝑔 𝐴
𝑡𝑜𝑡𝑎𝑙 𝑡𝑟𝑎𝑛𝑠𝑎𝑐𝑡𝑖𝑜𝑛 x 100
The support value of a combination of 2 items, obtained from the formula:
Support (A ∩ B) = 𝑡ℎ𝑒 𝑛𝑢𝑚𝑏𝑒𝑟 𝑜𝑓 𝑡𝑟𝑎𝑛𝑠𝑎𝑐𝑡𝑖𝑜𝑛𝑠 𝑐𝑜𝑛𝑡𝑎𝑖𝑛𝑖𝑛𝑔 𝐴 𝑎𝑛𝑑 𝐵
𝑡𝑜𝑡𝑎𝑙 𝑡𝑟𝑎𝑛𝑠𝑎𝑐𝑡𝑖𝑜𝑛 x 100
etc.
b. Confidence
The confidence value of the A→B rule is obtained from the formula:
Confidence = P (A|B) = 𝑡ℎ𝑒 𝑛𝑢𝑚𝑏𝑒𝑟 𝑜𝑓 𝑡𝑟𝑎𝑛𝑠𝑎𝑐𝑡𝑖𝑜𝑛𝑠 𝑐𝑜𝑛𝑡𝑎𝑖𝑛𝑖𝑛𝑔 𝐴 𝑎𝑛𝑑 𝐵
𝑛𝑢𝑚𝑏𝑒𝑟 𝑜𝑓 𝑡𝑟𝑎𝑛𝑠𝑎𝑐𝑡𝑖𝑜𝑛 𝑐𝑜𝑛𝑡𝑎𝑖𝑛𝑖𝑛𝑔 𝐴 x 100
c. Lift Ratio
Before calculating the lift ratio, the expected confidence value is obtained,
obtained from the formula:
Expected confidence = 𝑡ℎ𝑒 𝑛𝑢𝑚𝑏𝑒𝑟 𝑜𝑓 𝑒𝑣𝑒𝑛𝑡𝑠 𝑐𝑜𝑛𝑡𝑎𝑖𝑛𝑖𝑛𝑔 𝐵
𝑡𝑜𝑡𝑎𝑙 𝑒𝑣𝑒𝑛𝑡𝑠
The results of the calculation of the expected confidence value will be used
as a comparison value with the confidence value that has been calculated,
obtained from the formula:
Lift ratio = 𝑐𝑜𝑛𝑓𝑖𝑑𝑒𝑛𝑐𝑒
𝑒𝑥𝑝𝑒𝑐𝑡𝑒𝑑 𝑐𝑜𝑛𝑓𝑖𝑑𝑒𝑛𝑐𝑒
3. RESULT AND DISCUSSION
3.1 Association Rules using Apriori Algorithm
1) Formation of Candidates 1 Itemset
Candidate 1 itemset in the Tasikmalaya area data produces 22 items and items that
produce more or equal support values with the specified minimum support that is
8 items.
Candidate 1 itemset in the data area of Ciamis Regency produces 22 items and
items that produce more or equal support values with the specified minimum
support of 10 items.
Scientific Journal of Informatics , Vol. 5, No. 2, November 2018 96
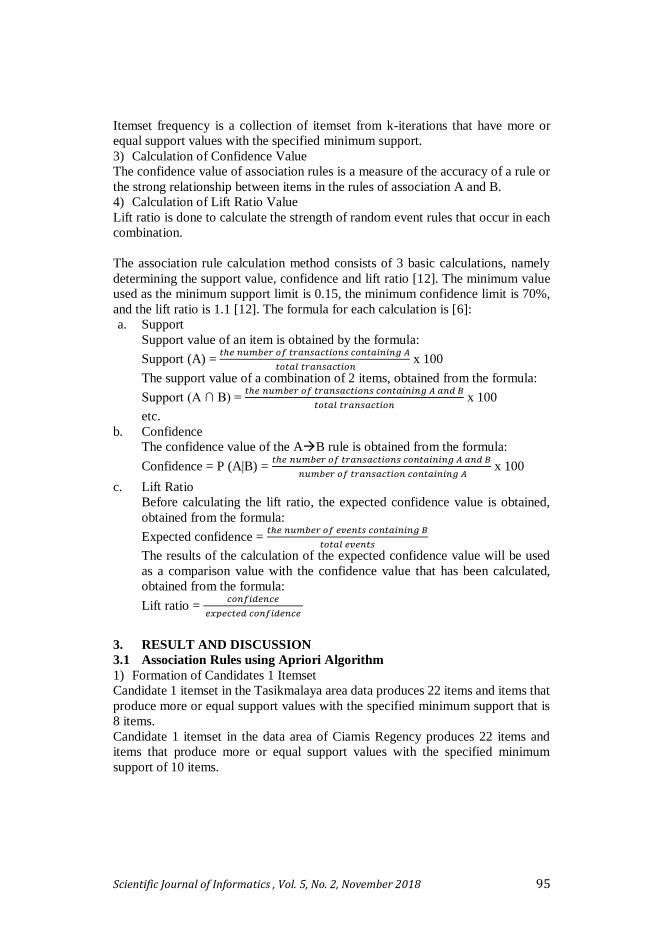
2) The frequency of 1 Itemset
The results table for itemset selection that has a support value meets the minimum
limit. The results are shown in Table 1 and Table 2.
Table 1. The Frequency of 1 itemsets tasikmalaya region data No. Item Name Support Support (%)
1 Male 767 96,47%
2 16 ≤ age ≤ 30 415 52,20%
3 41 ≤ age ≤ 50 125 15,72%
4 Employee 159 20%
5 Student 169 21,25%
6 Entrepreneur 251 31,57%
7 Middle school 221 27,79%
8 High school 418 52,57%
Table 2. The Frequency of 1 itemsets data ciamis regency
No. Item Name Support Support (%)
1 Male 545 96,46%
2 16 ≤ age ≤ 30 240 42,47%
3 31 ≤ age ≤ 40 91 16,10%
4 41 ≤ age ≤ 50 97 17,16%
5 age > 50 93 16,46%
6 Employee 237 41,94%
7 Student 108 19,11%
8 Elementary school 88 15,57%
9 Middle school 157 27,78%
10 High school 293 51,85%
3) Formation of Candidate 2 Itemset
Candidates 2 itemset involve a combination of 2 related items. Possible
relationships have the value of each combination that occurs namely gender ˄ age,
gender ˄ profession, gender ˄ education, age ˄ profession, age ˄ education,
professional ˄ education.
The number of combinations generated from Tasikmalaya area data is 159
combinations and those included in the high-frequency category are 11 item set.
The number of combinations generated from the Ciamis Regency data area is 159
combinations and those included in the high-frequency category are 13 itemsets.
4) The frequency of 2 Itemset
The results table for itemset selection that has a support value meets the minimum
limit. The results are shown Table 3 and Table 4.
Scientific Journal of Informatics , Vol. 5, No. 2, November 2018 97
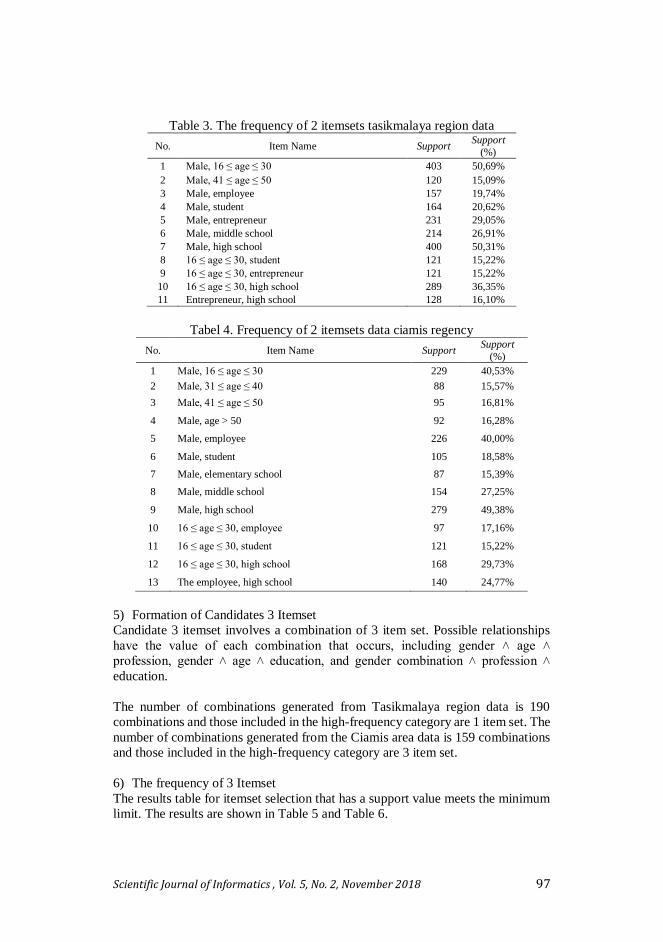
Table 3. The frequency of 2 itemsets tasikmalaya region data
No. Item Name Support Support
(%)
1 Male, 16 ≤ age ≤ 30 403 50,69%
2 Male, 41 ≤ age ≤ 50 120 15,09%
3 Male, employee 157 19,74%
4 Male, student 164 20,62%
5 Male, entrepreneur 231 29,05%
6 Male, middle school 214 26,91%
7 Male, high school 400 50,31%
8 16 ≤ age ≤ 30, student 121 15,22%
9 16 ≤ age ≤ 30, entrepreneur 121 15,22%
10 16 ≤ age ≤ 30, high school 289 36,35%
11 Entrepreneur, high school 128 16,10%
Tabel 4. Frequency of 2 itemsets data ciamis regency
No. Item Name Support Support
(%)
1 Male, 16 ≤ age ≤ 30 229 40,53%
2 Male, 31 ≤ age ≤ 40 88 15,57%
3 Male, 41 ≤ age ≤ 50 95 16,81%
4 Male, age > 50 92 16,28%
5 Male, employee 226 40,00%
6 Male, student 105 18,58%
7 Male, elementary school 87 15,39%
8 Male, middle school 154 27,25%
9 Male, high school 279 49,38%
10 16 ≤ age ≤ 30, employee 97 17,16%
11 16 ≤ age ≤ 30, student 121 15,22%
12 16 ≤ age ≤ 30, high school 168 29,73%
13 The employee, high school 140 24,77%
5) Formation of Candidates 3 Itemset
Candidate 3 itemset involves a combination of 3 item set. Possible relationships
have the value of each combination that occurs, including gender ˄ age ˄
profession, gender ˄ age ˄ education, and gender combination ˄ profession ˄
education.
The number of combinations generated from Tasikmalaya region data is 190
combinations and those included in the high-frequency category are 1 item set. The
number of combinations generated from the Ciamis area data is 159 combinations
and those included in the high-frequency category are 3 item set.
6) The frequency of 3 Itemset
The results table for itemset selection that has a support value meets the minimum
limit. The results are shown in Table 5 and Table 6.
Scientific Journal of Informatics , Vol. 5, No. 2, November 2018 98
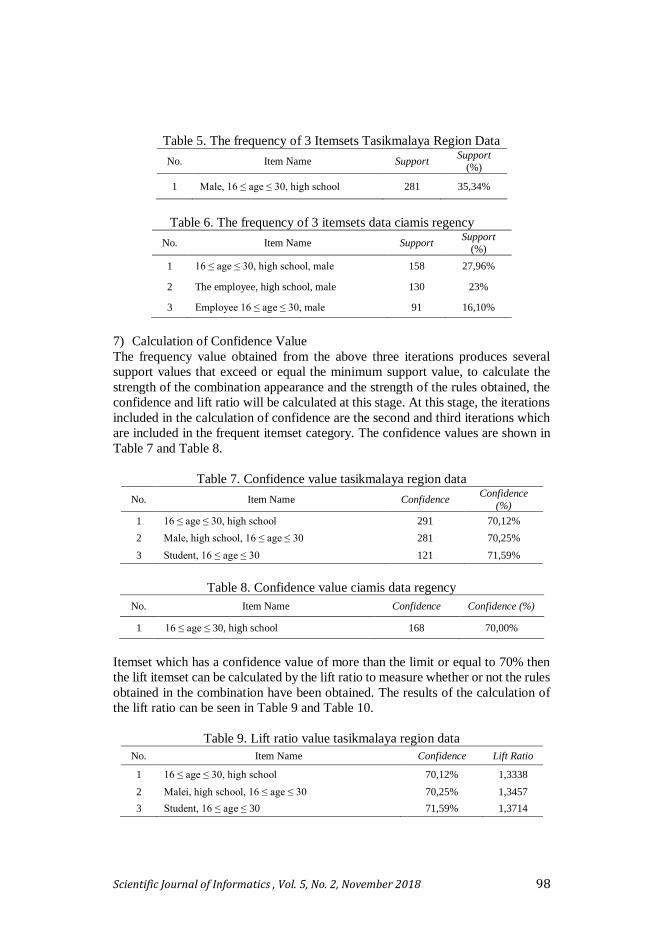
Table 5. The frequency of 3 Itemsets Tasikmalaya Region Data
No. Item Name Support Support
(%)
1 Male, 16 ≤ age ≤ 30, high school 281 35,34%
Table 6. The frequency of 3 itemsets data ciamis regency
No. Item Name Support Support
(%)
1 16 ≤ age ≤ 30, high school, male 158 27,96%
2 The employee, high school, male 130 23%
3 Employee 16 ≤ age ≤ 30, male 91 16,10%
7) Calculation of Confidence Value
The frequency value obtained from the above three iterations produces several
support values that exceed or equal the minimum support value, to calculate the
strength of the combination appearance and the strength of the rules obtained, the
confidence and lift ratio will be calculated at this stage. At this stage, the iterations
included in the calculation of confidence are the second and third iterations which
are included in the frequent itemset category. The confidence values are shown in
Table 7 and Table 8.
Table 7. Confidence value tasikmalaya region data
No. Item Name Confidence Confidence
(%)
1 16 ≤ age ≤ 30, high school 291 70,12%
2 Male, high school, 16 ≤ age ≤ 30 281 70,25%
3 Student, 16 ≤ age ≤ 30 121 71,59%
Table 8. Confidence value ciamis data regency
No. Item Name Confidence Confidence (%)
1 16 ≤ age ≤ 30, high school 168 70,00%
Itemset which has a confidence value of more than the limit or equal to 70% then
the lift itemset can be calculated by the lift ratio to measure whether or not the rules
obtained in the combination have been obtained. The results of the calculation of
the lift ratio can be seen in Table 9 and Table 10.
Table 9. Lift ratio value tasikmalaya region data
No. Item Name Confidence Lift Ratio
1 16 ≤ age ≤ 30, high school 70,12% 1,3338
2 Malei, high school, 16 ≤ age ≤ 30 70,25% 1,3457
3 Student, 16 ≤ age ≤ 30 71,59% 1,3714
Scientific Journal of Informatics , Vol. 5, No. 2, November 2018 99
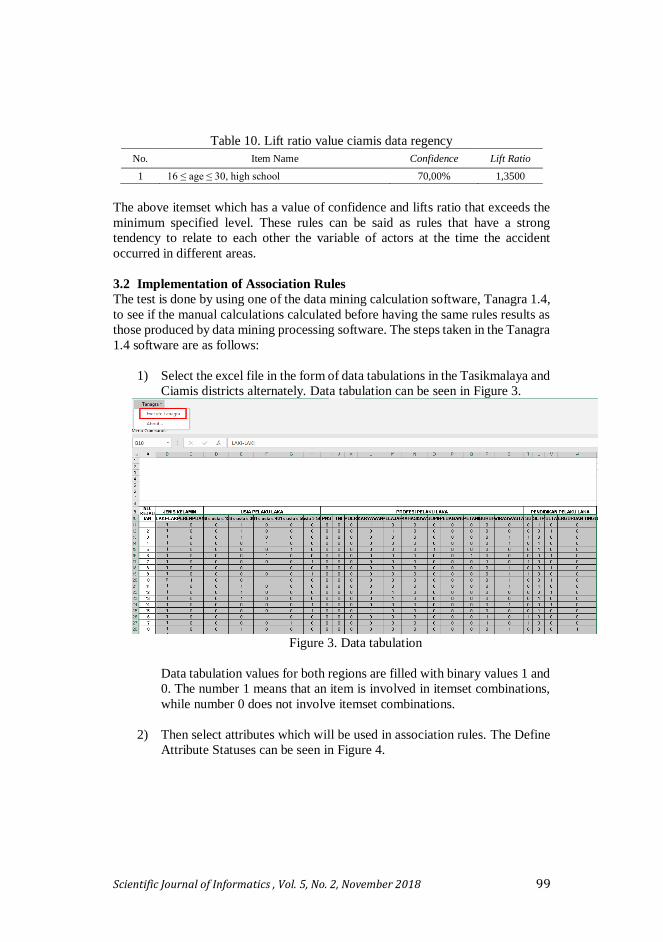
Table 10. Lift ratio value ciamis data regency
No. Item Name Confidence Lift Ratio
1 16 ≤ age ≤ 30, high school 70,00% 1,3500
The above itemset which has a value of confidence and lifts ratio that exceeds the
minimum specified level. These rules can be said as rules that have a strong
tendency to relate to each other the variable of actors at the time the accident
occurred in different areas.
3.2 Implementation of Association Rules
The test is done by using one of the data mining calculation software, Tanagra 1.4,
to see if the manual calculations calculated before having the same rules results as
those produced by data mining processing software. The steps taken in the Tanagra
1.4 software are as follows:
1) Select the excel file in the form of data tabulations in the Tasikmalaya and
Ciamis districts alternately. Data tabulation can be seen in Figure 3.
Figure 3. Data tabulation
Data tabulation values for both regions are filled with binary values 1 and
0. The number 1 means that an item is involved in itemset combinations,
while number 0 does not involve itemset combinations.
2) Then select attributes which will be used in association rules. The Define
Attribute Statuses can be seen in Figure 4.

Scientific Journal of Informatics , Vol. 5, No. 2, November 2018 100
Figure 4. Define attribute statuses
There are 22 attributes used for the calculation process of support and
confidence values. Selecting attributes that will be used in the itemset
combination process at a later stage. The description of the letter C on the
side of the attribute name indicates that the attribute contains numbers
instead of letters.
3) The Process Association Rules in the Tanagra application are found on
the menus in the bottom tab, namely the Association. So that the itemset
frequency value is obtained, the selected menu is frequent itemsets. The
Frequent Itemsets can be seen Figure 5.
Figure 5. Frequent itemsets
The value entered is in accordance with the minimum support limit used,
which is 0.15 with a maximum support of 1 or 100%. The minimum length

Scientific Journal of Informatics , Vol. 5, No. 2, November 2018 101
is inputted with a value of 2 and the maximum length enters a value of 3
so that the combination involves 2 to 3 items.
4) Itemset obtained from inputting the minimum support value is shown in
Figure 6.
Figure 6. Frequent itemset data in tasikmalaya region
There are 16 itemsets that have a support value exceeding the specified
minimum limit, itemset combination starting from 2 to 3 combinations.
Te Frequent Itemset data of Ciamis Regency Region shown in Figure 7.
Figure 7. Frequent itemset data of ciamis regency region
Has the same number of itemset as data in the Tasikmalaya region, there
are 15 itemsets that have a support value exceeding the specified
minimum limit, itemset combination starting from 2 to 3 combinations.
5) Still, on the same menu, namely the Association to get the confidence and
rules values, the Apriori menu option and enter a confidence limit value

Scientific Journal of Informatics , Vol. 5, No. 2, November 2018 102
of 70% and a lift ratio of 1.1. Association rule parameter is shown in
Figure 8.
Figure 8. Association rule parameter
6) Rules obtained from calculations using the Tanagra 1.4 application for
data in each region shown in Figure 9.
Figure 9. Tasikmalaya region data rules
Produces 3 rules which each rule produces an average value of 70.00%.
Ciamis Regency Area Data Rules is shown in Figure 10.
Figure 10. Ciamis regency area data rules
Get 1 rule with a confidence value of 70.00%. The combination that can
be obtained is age ˄ education → 16 ≤ age ≤ 30 ˄ high school.
3.3 Comparison of the Calculation Results of the Apriori Algorithm Rule
Using Tanagra
Comparison of itemset from each calculation in the data of Tasikmalaya and
Ciamis Districts can be seen in Table 11.

Scientific Journal of Informatics , Vol. 5, No. 2, November 2018 103
Table 11. Comparison of rules results
No. Name of
Region Item Name
Manual Calculation Tanagra Software
Confidence Lift
Ratio Confidence
Lift
Ratio
1 Tasikmalaya
16 ≤ age ≤ 30, high
school 70,12% 1,3338 70,120% 1,33363
Male, high school,
16 ≤ age ≤ 30 70,25% 1,3457 70,250% 1,34575
Student, 16 ≤ age ≤
30 71,59% 1,3714 71,598% 1,37157
2 Ciamis 16 ≤ age ≤ 30, high
school 70,00% 1,3500 70,00% 1,34983
The values obtained from the calculation process of support, confidence and lift
ratios in each region have the same number of values, but have the provisions in
determining rounding numbers behind a different comma, so that the results
obtained have a difference or a difference of 0.007 or in the form of a percentage
of 0.07%. The difference with the difference in numbers is considered to have the
same value.
4. CONCLUSION
The conclusion that can be drawn from this research is the Rules that have lift ratio
values above 1.1 and confidence more or equal to the minimum confidence can be
referred to like rules that have the strongest tendency to relate between variable
actors when an accident occurs. In the Tasikmalaya area data, the pattern obtained
from the manual calculation process and using the application is the existence of a
relationship between the variable professional perpetrators ∩ Age → "If the
Student profession is 16 ≤ of age ≤ 30" with the strong value of the tendency of the
rules appear 1.3714. District data of Ciamis regency, the rules of association that
can be obtained are the relationship between the variables of Age ∩ Last Education
→ "If aged 16 ≤ age ≤ 30 then high school education level" with the strong values
of the trend rules appear as much as 1.3500.
5. REFERENCES
[1] Aribowo, A. S. (2015). Analisa Asosiatif Data Mining Untuk Mengetahui
Pola Kecelakaan Lalu Lintas. Telematika, 8(2), 2–7.
[2] Fauzy, M., & Asror, I. (2016). Penerapan Metode Association Rule
Menggunakan Algoritma Apriori Pada Simulasi Prediksi Hujan Wilayah
Kota Bandung. Jurnal Ilmiah Teknologi Informasi Terapan, 2(3).
[3] Utari, P. N., & Hakim, R. B. (2015). Penerapan Metode Association Rule
Menggunakan Algoritma Apriori untuk Analisa Pola Data Kecelakaan
Pesawat Dari Tahun 1967-2014 di Indonesia. Prosiding Seminar Nasional
Matematika dan Pendidikan Matematika UMS. pp. 753–763.
[4] Suryanto. (2017). Data Mining untuk Klasifikasi dan Klasterisasi Data.
Bandung: Informatika.
[5] Sari, E. N. (2013). Analisa Algoritma Apriori Untuk Menentukan Merek
Pakaian Yang Paling Diminati Pada Mode Fashion Group Medan. Pelita
Informatika: Informasi dan Informatika, 4(3), 35–39.

Scientific Journal of Informatics , Vol. 5, No. 2, November 2018 104
[6] Vulandari, R. T. (2017). Konsep Dasar Data Mining, 1st ed. Yogyakarta:
Gava Media.
[7] Tampubolon, K., Saragih, H., & Reza, B. (2013). Implementasi Data Mining
Algoritma Apriori pada Sistem Persediaan Alat-Alat Kesehatan. Informasi
dan Teknologi Ilmiah (INTI), 1(1), 93-106.
[8] Saragih, R. (2017). Implementasi Apriori Pada Data Kecelakaan Lalu Lintas
Dalam Pencarian Relasi Antar Variabel Pelaku. Algoritma: Jurnal Ilmu
Komputer Dan Informatika, 1(01), 12–17.
[9] Olson, D. L., & Delen, D. (2008). Advanced data mining techniques. Springer
Science & Business Media.
[10] Yanto, R., & Di Kesuma, H. (2017). Pemanfaatan Data Mining Untuk
Penempatan Buku Di Perpustakaan Menggunakan Metode Association Rule.
Jurnal Teknik Informatika dan Sistem Informasi, 4(1), 1-10.
[11] Setianingsih, D., & Hakim, R. B. (2015). Penerapan Data Mining dalam
Analisis Kejadian Tanah longsor di Indonesia dengan Menggunakan
Association Rule Algoritma Apriori. pp. 731–741.
[12] Kuswardani, D., Widyanto, M. R., & Trihandini, I. (2011). Metode
Association Rule Untuk Analisis Citra Ct Organ Pasien Kanker Ovarium.
Jurnal Ilmiah Kursor, 6(2), 111–120.


![Dense Associative Memory for Pattern Recognitionpapers.nips.cc/...memory-for-pattern-recognition.pdf · Pattern recognition and models of associative memory [1] are closely related.](https://static.fdocuments.us/doc/165x107/5fb0165218a43607cd66c0bd/dense-associative-memory-for-pattern-pattern-recognition-and-models-of-associative.jpg)