Association of Metropolitan School Districts Presentation to Legislators December 14, 2007.
22
Association of Metropolitan School Districts Presentation to Legislators December 14, 2007
-
Upload
austen-shields -
Category
Documents
-
view
219 -
download
2
Transcript of Association of Metropolitan School Districts Presentation to Legislators December 14, 2007.

Association of Metropolitan School Districts
Presentation to Legislators
December 14, 2007
Association of Metropolitan School Districts
AMSD represents:
• 28 Metro Area School Districts
• 3 Joint Powers Districts
• 3 Associate Members
• 269,623 students
• 33.2% of the K-12 students in Minnesota
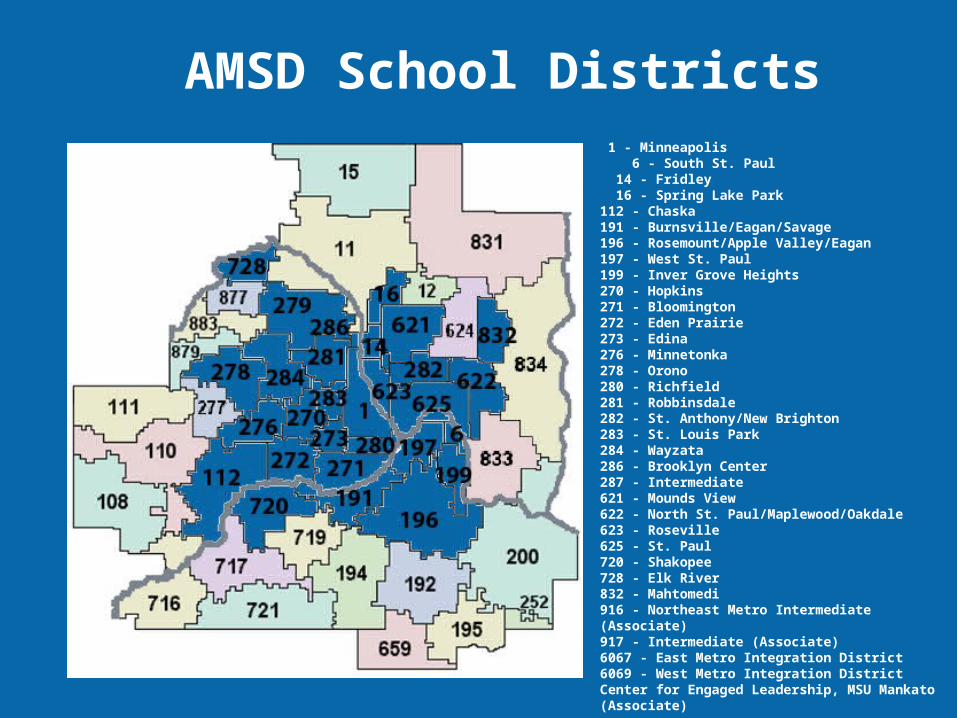
1 - Minneapolis 6 - South St. Paul 14 - Fridley 16 - Spring Lake Park112 - Chaska191 - Burnsville/Eagan/Savage196 - Rosemount/Apple Valley/Eagan197 - West St. Paul199 - Inver Grove Heights270 - Hopkins271 - Bloomington272 - Eden Prairie273 - Edina276 - Minnetonka278 - Orono280 - Richfield281 - Robbinsdale282 - St. Anthony/New Brighton283 - St. Louis Park284 - Wayzata286 - Brooklyn Center287 - Intermediate 621 - Mounds View622 - North St. Paul/Maplewood/Oakdale623 - Roseville625 - St. Paul720 - Shakopee728 - Elk River832 - Mahtomedi916 - Northeast Metro Intermediate (Associate)917 - Intermediate (Associate)6067 - East Metro Integration District6069 - West Metro Integration DistrictCenter for Engaged Leadership, MSU Mankato (Associate)
AMSD School Districts

AMSD’s Mission
To advocate for
state education
policy that enables
metropolitan
school districts to
improve student
learning

Budget Survey
AMSD Member Districts, Fiscal Year 2009 •Current law•Current programs
Total shortfall: $74,733,244
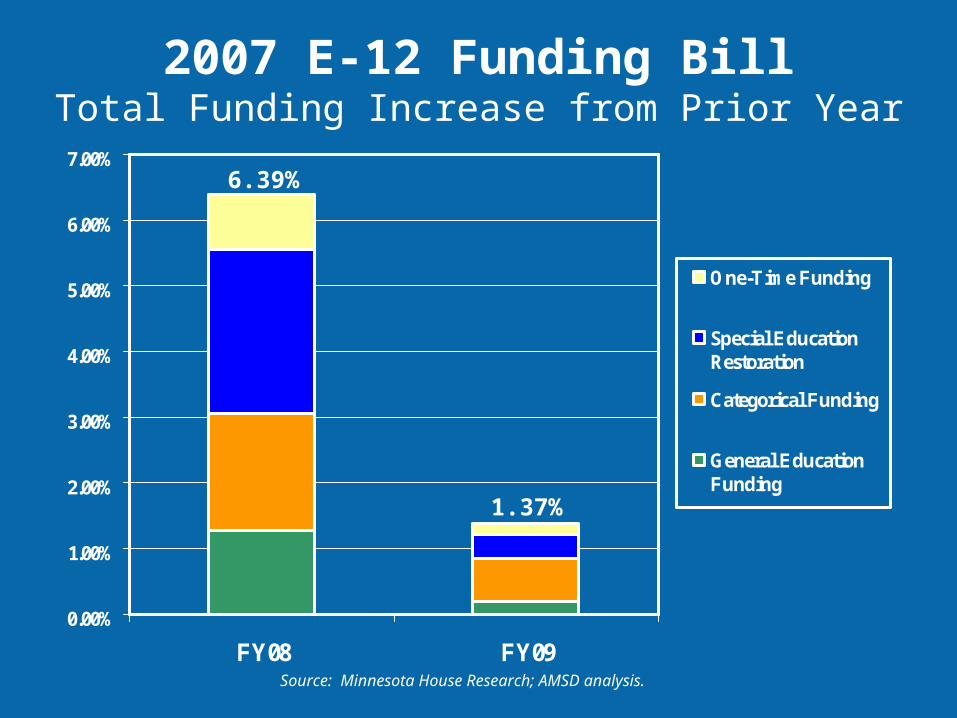
2007 E-12 Funding BillTotal Funding Increase from Prior Year
0.00%
1.00%
2.00%
3.00%
4.00%
5.00%
6.00%
7.00%
FY08 FY09
One-Time Funding
Special EducationRestoration
Categorical Funding
General EducationFunding
6.39%
1.37%
Source: Minnesota House Research; AMSD analysis.
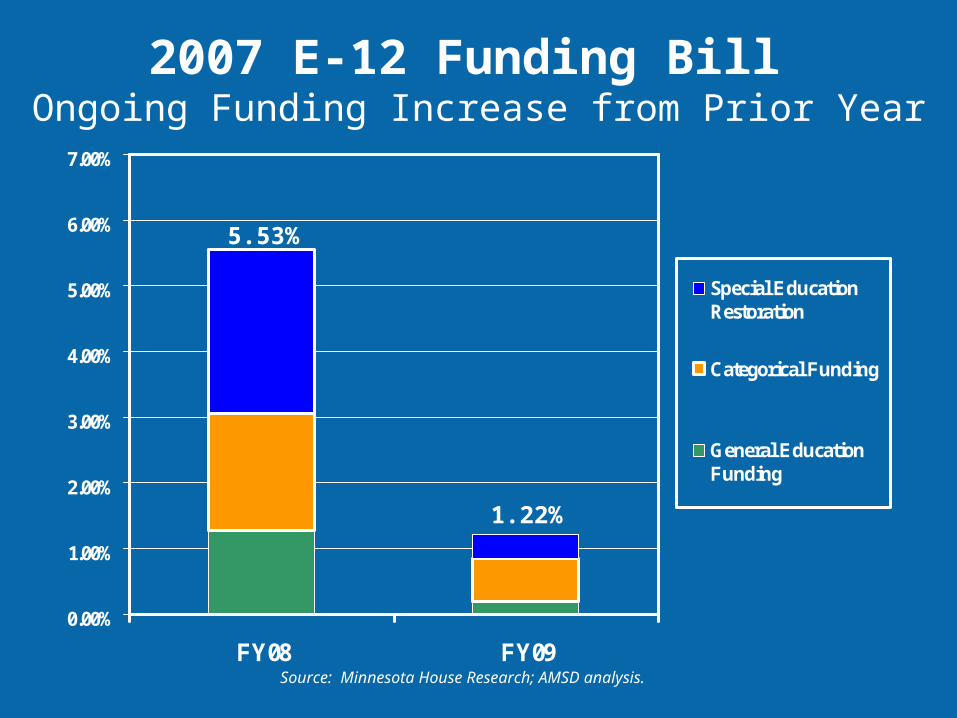
2007 E-12 Funding Bill Ongoing Funding Increase from Prior Year
0.00%
1.00%
2.00%
3.00%
4.00%
5.00%
6.00%
7.00%
FY08 FY09
Special EducationRestoration
Categorical Funding
General EducationFunding
5.53%
1.22%
Source: Minnesota House Research; AMSD analysis.

2007 E-12 Funding Bill General and Categorical Funding Increase
from Prior Year
0.00%
1.00%
2.00%
3.00%
4.00%
5.00%
6.00%
7.00%
FY08 FY09
Categorical Funding
General EducationFunding
3.07%
0.85%
Source: Minnesota House Research; AMSD analysis.

2007 E-12 Funding Bill General Education Funding Increase
from Prior Year
0.00%
1.00%
2.00%
3.00%
4.00%
5.00%
6.00%
7.00%
FY08 FY09
General EducationFunding
1.28%
0.19%
Source: Minnesota House Research; AMSD analysis.

Special Education FundingEstimated Statewide adjustment factors
(proration)
Special Education Regular Excess Cost
FY 2008 88.3% 81.4% FY 2009 87.5% 72.6% FY 2010 85.2% 60.8% FY 2011 86.6% 58.8%
*Source: Education Funding Update Presentation by Tom Melcher, Program Finance Director, MN Department of Education at Aug. 15, 2007 Superintendent’s Conference.

K-12 Facilities and Infrastructure Investments,
1999-2007
Actual State and Local Investments
Facilities Needs Identified by 1999
Task ForceAdjusted for Inflation
$ B
illi
on
s
20
15
10
5
0
$14.67$10.0
5
Investments since 1999
Investments based on 1999 law
$8.39
$1.66

Minnesota School District Technology Needs SupportMinnesota received a “D” grade in technology by Education
Week magazine
Source: Education Week, “The Information Edge,” May 4, 2006.
RANKING FOR SELECTED STATES IN ACCESS TO TECHNOLOGY
Students Per Instructional
Computer
Students Per Instructional
Computer Located in Classrooms
Students Per Internet-
Connected Computer in Classrooms
South Dakota 1 1 1
North Dakota 7 7 7
Iowa 12 17 16Wisconsin 11 28 28Minnesota 28 45 43

Tax Effort Remains Higher in Metro Area
Source: Minnesota Department of Revenue, U.S. Department of Commerce, Bureau of Economic Analysis, AMSD analysis. Figures reflect residential property only; for agricultural land, the property
tax paid is prorated to reflect the house, garage, and one acre standard used by the Department of Revenue.
$800.00
$900.00
$1,000.00
$1,100.00
$1,200.00
$1,300.00
$1,400.00
$1,500.00
Net
Pro
perty
Tax
Pay
able
Per
$7
5,00
0 Per
sona
l Inc
ome
STATEWIDE 11-COUNTY AREA OTHER 76 COUNTIES
$1,290
$1,420
$1,023
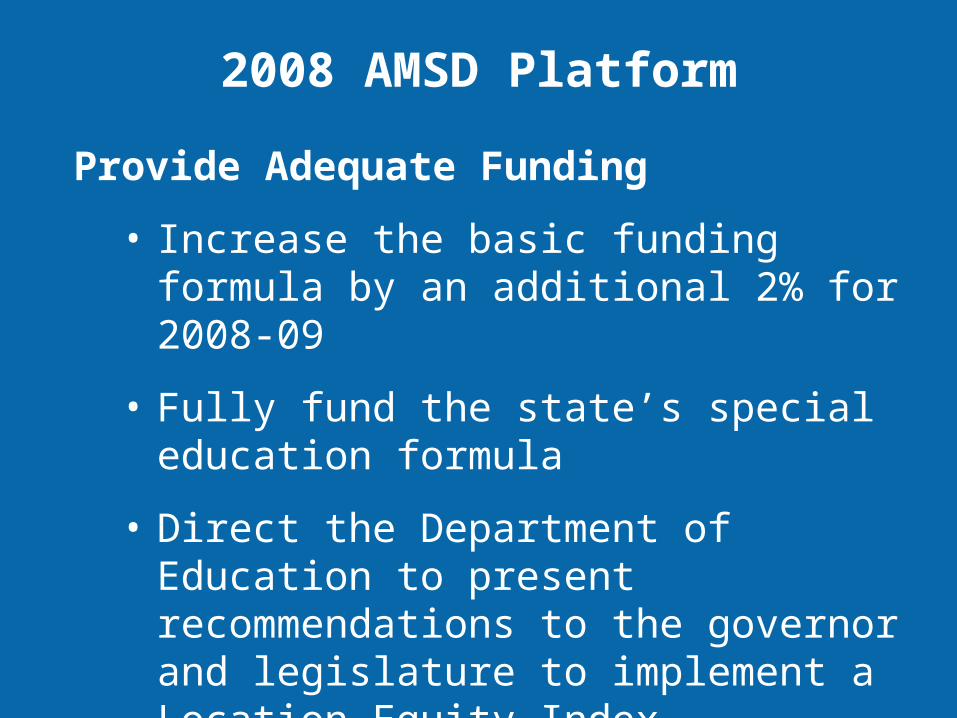
2008 AMSD Platform
Provide Adequate Funding
• Increase the basic funding formula by an additional 2% for 2008-09
• Fully fund the state’s special education formula
• Direct the Department of Education to present recommendations to the governor and legislature to implement a Location Equity Index

2008 AMSD Platform
Protect and Preserve School Buildings and Infrastructure
• Increase access to the Alternative Levy and Bonding Program
• Increase Deferred Maintenance Revenue to $100 per pupil
• Increase Lease Levy Authority to $150 per pupil for school districts and to $50 per pupil for intermediate school districts
• Provide a reliable funding stream for technology

2008 AMSD Platform
Reduce Mandates and Preserve Local Control
• Allow districts to work with their employees to determine benefit plans
• Allow locally-elected school boards to determine when primary elections are necessary
• Repeal requirement of providing information and applications for MN health care programs
• Simplify levy renewal ballot language
• Repeal prohibition on pre-Labor Day school starts

Citizen Perceptions of Education
2007 poll of metro area residents performed by Decision Resources, Ltd., and presented to the AMSD Board of Directors on Sept. 14, 2007 by Dr. Bill Morris.
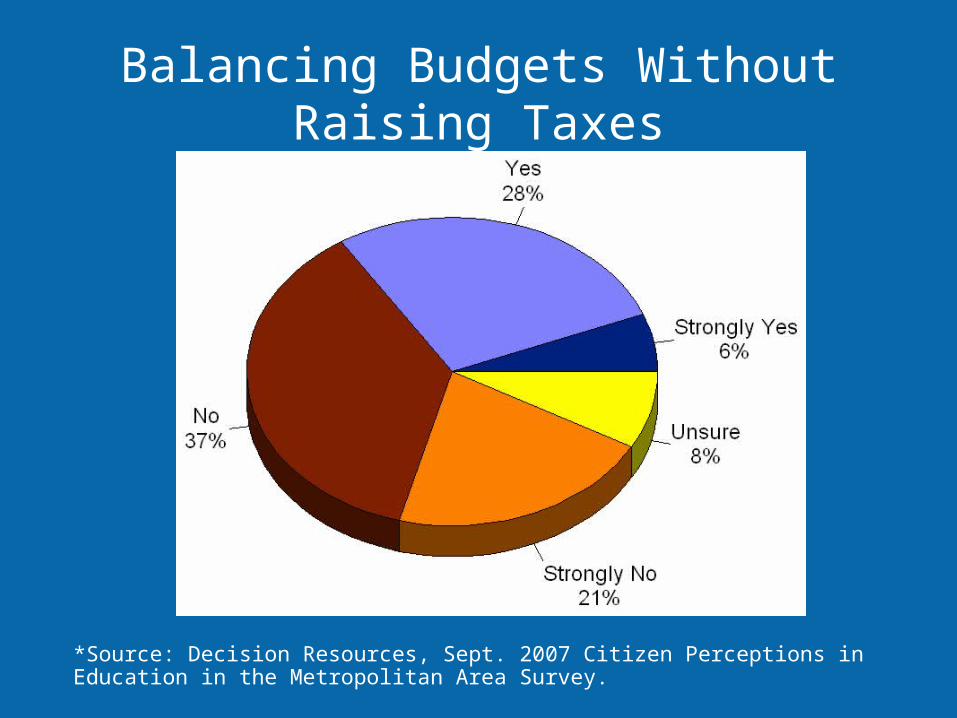
*Source: Decision Resources, Sept. 2007 Citizen Perceptions in Education in the Metropolitan Area Survey.
Balancing Budgets Without Raising Taxes

Increase Sales Tax 1% For Education
*Source: Decision Resources, Sept. 2007 Citizen Perceptions in Education in the Metropolitan Area Survey.

Constitutional Mandate to Increase State Formula by
Inflation Rate
*Source: Decision Resources, Sept. 2007 Citizen Perceptions in Education in the Metropolitan Area Survey.

*Source: Decision Resources, Sept. 2007 Citizen Perceptions in Education in the Metropolitan Area Survey.
Pre-Labor Day School Start

Contact Us at AMSDScott Croonquist, Executive Director, 651-999-7326
Kevin Sampers, Research Director, [email protected]
Laura Dale, Office Manager, [email protected]
Kris AmundsonChris GeorgacasGovernment Relations ConsultantsGoff and Howard, Inc., 651-292-8062