Association of Lean Implementation on Perceived ...
152
Louisiana State University LSU Digital Commons LSU Master's eses Graduate School 2014 Association of Lean Implementation on Perceived Organizational Maturity Levels of Managers and Staff in the Public Sector Patrick Eduardo O'Mara Louisiana State University and Agricultural and Mechanical College, [email protected] Follow this and additional works at: hps://digitalcommons.lsu.edu/gradschool_theses Part of the Mechanical Engineering Commons is esis is brought to you for free and open access by the Graduate School at LSU Digital Commons. It has been accepted for inclusion in LSU Master's eses by an authorized graduate school editor of LSU Digital Commons. For more information, please contact [email protected]. Recommended Citation O'Mara, Patrick Eduardo, "Association of Lean Implementation on Perceived Organizational Maturity Levels of Managers and Staff in the Public Sector" (2014). LSU Master's eses. 5. hps://digitalcommons.lsu.edu/gradschool_theses/5
Transcript of Association of Lean Implementation on Perceived ...

Louisiana State UniversityLSU Digital Commons
LSU Master's Theses Graduate School
2014
Association of Lean Implementation on PerceivedOrganizational Maturity Levels of Managers andStaff in the Public SectorPatrick Eduardo O'MaraLouisiana State University and Agricultural and Mechanical College, [email protected]
Follow this and additional works at: https://digitalcommons.lsu.edu/gradschool_theses
Part of the Mechanical Engineering Commons
This Thesis is brought to you for free and open access by the Graduate School at LSU Digital Commons. It has been accepted for inclusion in LSUMaster's Theses by an authorized graduate school editor of LSU Digital Commons. For more information, please contact [email protected].
Recommended CitationO'Mara, Patrick Eduardo, "Association of Lean Implementation on Perceived Organizational Maturity Levels of Managers and Staff inthe Public Sector" (2014). LSU Master's Theses. 5.https://digitalcommons.lsu.edu/gradschool_theses/5

ASSOCIATION OF LEAN IMPLEMENTATION ON PERCEIVED ORGANIZATIONAL MATURITY LEVELS OF MANAGERS AND STAFF IN THE PUBLIC SECTOR
A Thesis
Submitted to the Graduate Faculty of the Louisiana State University and
Agricultural and Mechanical College in partial fulfillment of the
requirements for the degree of Master of Science
in
The Department of Mechanical and Industrial Engineering
by
Patrick O’Mara B.S., Louisiana State University, 2012
December 2014

ii
ACKNOWLEDGEMENTS
First and foremost, I would like to express my earnest gratitude to my major advisor, Dr. Laura
Ikuma, for her insightful guidance, full support and continuous encouragement, which made this study
possible. I would also like to thank Dr. Isabelina Nahmens and Dr. Craig Harvey for serving on my
committee.
I also would like to thank all faculty and staff of the department of Industrial Engineering and my
fellow graduate research assistants Vanessa Seitz, Sophie Swartz and Maribel Castro. They have been
supportive throughout the process of writing this thesis, and have made my experience at LSU an
enjoyable one.
Finally, I dedicate this thesis to God and my family: My mother and father Alice and Carlos, and
my brother and sister, Christian and Alis. They have been a constant source of love, support and
encouragement throughout my entire life.

iii
TABLE OF CONTENTS ACKNOWLEDGEMENTS ............................................................................................................................ ii
LIST OF TABLES ....................................................................................................................................... vi
LIST OF FIGURES .................................................................................................................................... vii
ABSTRACT .............................................................................................................................................viii
1 INTRODUCTION .................................................................................................................................... 1 1.1. Research Objective................................................................................................................... 3 1.2. Scope ....................................................................................................................................... 3 1.3. Significance .............................................................................................................................. 4
2 LITERATURE REVIEW ............................................................................................................................. 5 2.1 Public Sector: The Need for Improvement and Problems Faced ................................................ 6 2.2 Organizational Culture of the Public Sector .............................................................................. 7
2.2.1 Organizational Environment ............................................................................................. 8
2.2.2 Organizational Goals......................................................................................................... 9
2.2.3 Organizational Structures ................................................................................................. 9
2.2.4 Organizational Values ..................................................................................................... 10
2.3 Lean Background .................................................................................................................... 10 2.4 Lean Beyond Manufacturing .................................................................................................. 11 2.5 Lean in Enterprise Transformation ......................................................................................... 13 2.6 Enabling and Facilitating Factors in Lean Implementation....................................................... 16
2.6.1 Top Management Support .............................................................................................. 19
2.6.2 Organizational Culture .................................................................................................... 20
2.6.3 Strategy and Communication of Goals ............................................................................ 21
2.6.4 Continuous Training and Development ........................................................................... 22
2.7 Lean in the Public Sector ........................................................................................................ 22 2.8 The Role of Assessment in Lean Transformation ..................................................................... 27
3 RESEARCH METHODOLOGY ................................................................................................................ 33 3.1 Data Collection Chart ............................................................................................................. 33 3.2 Assessment Tools ................................................................................................................... 34
3.2.1 Employee Demographics Survey ..................................................................................... 34 3.2.2 Government Lean Self-Assessment Tool (GLESAT) .......................................................... 35
3.3 Experimental Design .............................................................................................................. 36 3.3.1 Participants .................................................................................................................... 36 3.3.2 Dependent Variables ...................................................................................................... 37 3.3.3 Independent Variables ................................................................................................... 37 3.3.4 Setting ............................................................................................................................ 37 3.3.5 Procedure....................................................................................................................... 37
3.4 Data Analysis .......................................................................................................................... 39 3.4.1 Lean Level Significance ................................................................................................... 40

iv
3.4.2 Job Role Significance ...................................................................................................... 40 3.4.3 Gap Analysis of the Current and Desired State ................................................................ 41 3.4.4 Comparative Analysis of Lean Levels ............................................................................... 42
4 RESULTS ............................................................................................................................................. 43 4.1. Descriptive Statistics .............................................................................................................. 43 4.2. GLESAT Overall Scores ............................................................................................................ 45 4.3. Section 1: Enterprise Leadership ............................................................................................ 47 4.4. Section 2: Life Cycle and Enabling Processes .......................................................................... 48 4.5. Section 3: Enabling Infrastructure .......................................................................................... 50 4.6. Hypothesis Testing ................................................................................................................. 51
4.6.1 Hypothesis 1 ................................................................................................................... 51
4.6.2 Hypothesis 2 ................................................................................................................... 51
4.6.3 Hypothesis 3 ................................................................................................................... 51
4.6.4 Hypothesis 4 ................................................................................................................... 52
4.6.5 Hypothesis 5 ................................................................................................................... 52
5 DISCUSSION AND CONCLUSION .......................................................................................................... 53 5.1. GLESAT Results ....................................................................................................................... 54 5.2. Barriers of Implementation .................................................................................................... 58 5.3. Limitations ............................................................................................................................. 60 5.4. Future Research ..................................................................................................................... 61 5.5. Recommendations ................................................................................................................. 62 5.6. Outcomes .............................................................................................................................. 68 5.7. Conclusion ............................................................................................................................. 68
6 REFERENCES ....................................................................................................................................... 71
APPENDIX A: LSU IRB APPROVAL ........................................................................................................... 76
APPENDIX B: CONSENT FORM ............................................................................................................... 77
APPENDIX C: RECRUITMENT EMAIL TEXT ............................................................................................... 79
APPENDIX D: DEMOGRAPHICS QUESTIONNAIRE .................................................................................... 81
APPENDIX E: GOVERNMENT LEAN ENTERPRISE SELF-ASSESSMENT TOOL (GLESAT) ................................ 83
APPENDIX F: GLESAT RESULTS DATA .................................................................................................... 112
APPENDIX G: NON-LEAN GROUP ANALYSIS .......................................................................................... 114
APPENDIX H: LEAN GROUP DATA AND ANALYSIS ................................................................................. 118
APPENDIX I: GLESAT ANALYSIS FOR NON-LEAN GROUP........................................................................ 122

v
APPENDIX J: GLESAT ANALYSIS FOR LEAN GROUP ................................................................................ 130
APPENDIX K: SWOT DISTRIBUTION FOR PRACTICES OF NON-LEAN PROGRAM ..................................... 138
APPENDIX L: SWOT DISTRIBUTION FOR PRACTICES OF LEAN PROGRAM .............................................. 140
VITA .................................................................................................................................................... 142

vi
LIST OF TABLES
Table 1. Barriers and success factors during the implementation of Lean initiatives ............................... 17
Table 2. Criteria table ............................................................................................................................ 31
Table 3. Participant distribution ............................................................................................................. 36
Table 4. Participant demographic information ....................................................................................... 43
Table 5. T-test for participant familiarity with Lean and time spent in Lean six sigma ............................ 45
Table 6. Overall GLESAT scores for current and desired state ................................................................. 45
Table 7. ANOVA results for GLESAT overall scores.................................................................................. 45
Table 8: Section 1 scores for current and desired state .......................................................................... 47
Table 9. ANOVA results for Lean transformation and leadership section of the GLESAT ......................... 47
Table 10. Section 2 scores for current and desired state ........................................................................ 49
Table 11. ANOVA results for Lean lifecycle process section of the GLESAT ............................................. 49
Table 12. Section 3 for current and desired state ................................................................................... 50
Table 13. ANOVA results for the enabling infrastructure section of the GLESAT ..................................... 50
Table 14. Barriers of Lean implementation ............................................................................................ 59
Table 15. Three-dimensional analysis criteria table for the Non-Lean group........................................... 63
Table 16. High priority practices for the Non-Lean group ....................................................................... 65
Table 17. Three-dimensional analysis criteria table for the Lean group. ................................................. 66
Table 18. High priority practices for the Lean group ............................................................................... 67

vii
LIST OF FIGURES
Figure 1. Lean Iceberg model ................................................................................................................. 14
Figure 2. GLESAT structure .................................................................................................................... 30
Figure 3. Data collection plan ................................................................................................................ 33
Figure 4. Generic Capability Maturity Level ............................................................................................ 35
Figure 5. Gap between managers and staff for current state ................................................................. 46
Figure 6. Gap between managers and staff for desired state ................................................................. 47
Figure 7. Mapping GLESAT scores of the Non-Lean group to SWOT analysis ........................................... 63
Figure 8. Mapping GLESAT scores of the Lean group to SWOT analysis .................................................. 66

viii
ABSTRACT
Extensive research has shown the impact of Lean implementation at the process level of an
organization to increase quality, reduce cycle time, and reduce operational costs. However, little
research has been done to associate Lean with improvement at the strategic level of an organization.
The objectives of the present research were to (a) study the association of Lean implementation with
maturity levels of employees (b) study the relationship between Lean implementation in the levels of
agreement with cohesion between managers and staff in evaluating perceived current state and desired
state of organizational practices (c) identify potential barriers of Lean implementation that may affect
the establishment of a culture of continuous improvement. The research took place in two different
departments within the Office of Public Health (OPH) of Louisiana that were classified as Lean and Non-
Lean. A total of 53 participants volunteered to participate in the study (25 Non-Lean and 28 Lean), and
46 were used in the analysis. The Government Lean Self-Assessment Tool (GLESAT) was used to assess
the level of maturity and identify gap scores between managers and staff. The assessment consisted of
55 practices divided into three main sections: 1) enterprise leadership 2) lifecycle and enabling
processes 3) enabling infrastructure. The overall scores of the Lean group were significantly higher than
the Non-Lean group by 41.18% for the current state and 13.53% for the desired state. However, Gap
scores between managers and staff did not differ significantly between Lean and Non-Lean groups for
either perceived current state or desired state of organizational practices. In terms of barriers of Lean
implementation, participants identified lack of management support, lack of training, lack of
communication, lack of strategy, poor organizational culture of improvement, employee resistance and
understaffing as the main problems faced in the organization. In conclusion, Lean implementation can
be associated with higher perceived organizational maturity of employees. Good organizational
maturity is crucial in the development and support of a transformation plan, where the organization

ix
understands its current performance and strengths so further plans can be developed to improve the
organization’s weaknesses. However, results of the present study showed that Lean does not affect the
levels of cohesion between managers and staff in evaluating perceived current state and desired state of
organizational practices.

1
1 INTRODUCTION
Managers in the public sector play a critical role in the way that services are provided to the
public and have to make sure that taxpayer funds are spent in an effective and efficient manner (Schiele
& McCue, 2011). Managers seeking to improve the way services are delivered and to be more cost
effective need to focus their attention on systems where there is a considerable amount of cost incurred
and significant opportunities for process improvement exist (Miller, 2009). Some process improvement
methods or techniques have been transferred from the private sector to the public sector given their
considerable success. Methodologies such Six Sigma, Balanced Scorecard, benchmarking and Lean have
been implemented in the public sector bringing positive results to the organization in terms of
quantitative and qualitative outcomes (Holzer, Charbonneau, & Kim, 2009; Radnor, 2010). However, it is
important to be careful when trying to transfer methodologies from the private to public sector given
that management-labor relations in the public sector are based on different principles and laws than
those in the private sector (Scorsone, 2005).
Lean techniques and tools have been growing in popularity across public sector leaders looking
to improve their systems. Lean has been shown to improve public services and to transform them
positively (Bhatia & Drew, 2006). Lean has been successfully applied in a range of areas in the public
sector from hospital management to accounts payable processes in local governments (Waterman &
McCue, 2012). Lean can be used in the public sector to improve the quality of the service delivered to
customers and value for money spent on the process (Schiele & McCue, 2011).
Lean is defined as a philosophy that functions as a guide to increase quality, reduce costs, and
increase satisfaction of staff and customers by implementing a set of tools and techniques that serve
different purposes in particular areas or circumstances of the process (Radnor, 2010; Waterman &
McCue, 2012). However, the success of these continuous improvement changes is not only related to

2
their substantial nature or content but also to the process undertaken prior and during their
implementation (Armenakis & Bedeian, 1999). Therefore, there are some conditions that need to be in
place to make the change happen and achieve a continuous long term effect. Readiness to change or the
level of organizational maturity is considered one of the most important conditions (Armenakis, 1993).
Organizational maturity is the collective awareness of members of an organization towards the
existence and the source of a problem in the organization and the full support of solutions to solve it
(Smelser, 1951). The level of maturity can be reflected in the organization members’ attitudes,
intentions and beliefs towards whether changes are really needed and the organization’s capacity to
accomplish those changes (Armenakis, 1993). Drew, McCallum, and Roggenhofer (2004) discussed how
behaviors of management and members of an organization can affect the process of change and
highlighted the importance of this mindset and behavior to achieve successful Lean transformation. The
implications of overlooking organizational maturity may be that an appropriate intervention doesn’t
produce the intended organization changes because its members were not ready (Armenakis, 1993). In
order to successfully implement and sustain Lean in the long term, organizations need to develop a
cultural system focused on the customer where any action taken is focused on improving the
effectiveness of the goods or services delivered where key leaders work with other employees to
support all the initiatives in a consistent way throughout all levels of the organization(Carlino &
Flinchbaugh, 2005).
The success of continuous improvement initiatives require commitment throughout the
organization where top managers as well as the rest of the members involved in the process need to
share similar values and understand the need for change and embrace it. Most case studies of
implementing Lean in the public sector reflect outcomes on process improvement and cost reduction
(Furterer & Elshennawy, 2005; Waterman & McCue, 2012). However, there is no substantial data to

3
conclude if the implementation of Lean is associated with the level of maturity and shared values of the
employees.
1.1. Research Objective
The purpose of this research is to identify whether Lean implementation is associated to the
levels of perceived current organizational maturity and desired Lean state in an organization. In
addition, the present research aims to identify if there is a significant gap between managers and staff in
their perceived level of current organizational maturity and desired Lean state that may affect
negatively in their performance and implementation process of Lean. More specifically, the objectives of
the study are:
1. Identify whether Lean implementation increases the level of perceived current organizational
maturity and desired Lean state
2. To identify the existence of significant gaps in the level of perceived current organizational
maturity and desired Lean state between managers and staff in the public sector.
3. To analyze whether the implementation of Lean tools and initiatives is associated with a
reduction in the gap of perceived organizational maturity level and desired Lean state of the
organization.
4. To identify barriers and enablers in the implementation of Lean tools and initiatives in the public
sector.
1.2. Scope
This study compared the levels of perceived current organizational maturity level and desired
Lean state of a public sector program between managers and critical staff. The research consisted of a
survey intended to be a self-assessment of the perceived present state and the desired state of the
program to determine the extent to which Lean principles, practices, and behavior have become parts of

4
the organization. The results of the survey were used to identify a possible gap between them that may
affect the performance of the program and the association of Lean initiatives on those gaps. In addition,
this study aims to identify possible barriers and enablers that may affect the implementation of Lean
initiatives.
The study was performed in two different programs within the Office of Public Health (OPH).
Each program was categorized as being in one of two Lean levels: Non-Lean and Lean. The study
assessed a total of 53 participants. Participants included program functional management levels
including program executive leadership, directors, office management and non-managerial employees
that are critical in the process of implementing improvement initiatives.
1.3. Significance
The current research investigates the association of Lean implementation with the levels of
perceived current organizational maturity and desired Lean state of a program between managers and
staff. This research will develop a better understanding of the association of Lean implementation in the
levels of agreement and cohesion between managers and staff in evaluating perceived current state and
desired state of organizational practices. Moreover, the present research presents barriers of Lean
implementation identified by the participants.

5
2 LITERATURE REVIEW
Lean has rapidly gained popularity as a process management philosophy in both private and
public administrative and service organizations (Jorgensen, Matthiesen, Nielsen, & Johansen, 2007).
Lean provides opportunities to improve processes by reducing waste and service time while enhancing
quality (Womack & Jones, 2003). In addition, successful Lean implementation brings opportunities for a
positive and fulfilling working environment for employees due to their involvement and ownership in
improving current processes and developing new ones (Womack, Jones, & Roos, 1990) . However, the
implementation of Lean is not always a positive experience for the employees (Carter et al., 2011;
Harrison, 1997) due to bad management approaches and the high degree of standardization of the work
functions associated with Lean (Jorgensen et al., 2007). These causes may increase resistance among
employees that impedes the sustainability of Lean in the long term. The goals of implementing Lean
initiatives should not only be the improvement of current processes but also the introduction of cultural
change that helps to increase the understanding of critical processes and to streamline the values and
priorities of all organization members towards achieving a shared goal. Undertaking organizational
assessments can help change agents to make specific choices about proper strategies needed to help
foster employee enthusiasm for improvement initiatives to avoid such resistance.
This literature review discusses the association of Lean implementation with the perceived
organizational maturity of managers and staff in the public sector. The first section provides an
introduction of the public sector to understand their need for improvement and some characteristics
that shape their organizational culture. Then, an overview of Lean including its origin, expansion to
other industries, benefits at the process and strategic level of an organization, and barriers and
facilitating factors during Lean implementation is presented. Moreover, a section discussing the
expansion of Lean to the public sector is reviewed. The last section introduces the role of assessment in

6
Lean transformation. A review of different Lean assessment tools that have been used in other studies is
presented to select the most appropriate tool for the present research.
2.1 Public Sector: The Need for Improvement and Problems Faced
Governments have the responsibility to provide good quality services such as education,
healthcare, and transportation to its people. These services require enormous funds to support the
infrastructure needed, which in many cases is not enough to meet the expectations of delivering good
quality service. This forces governments to reduce the workforce and cut some programs to be able to
keep others available. However, the funds saved taking those measures may not be enough or may
deteriorate the quality of service provided by the public institution. The need to improve the value for
money spent at all levels of public sector organizations is an important issue that is always under
discussion (Bhatia & Drew, 2006).
Public sector organizations are continuously subjected to external pressures such as fiscal
stress, market value changes, new government policies and the expectation of improved government
services that demand a need for change in the way services are delivered (Schiele & McCue, 2011;
Zhonghua & Ye, 2012). Public managers looking to cause a positive impact in terms of quality and cost
reduction of services need to focus on areas where there is a significant amount of operational cost
incurred and possibilities for process improvement (Schiele & McCue, 2011). Public sector organizations
can learn from the private sector to find suitable methods that improve the cost and quality of services
delivered (Zhonghua & Ye, 2012). Unfortunately, public sector organizations face a number of factors
that make improvement of their performance difficult in distinction to their private sector counterpart.
While private organizations are owned by entrepreneurs, public organizations are agencies owned by
the government and funded with public funds (Lan & Rainey, 1992). Also, public sector organizations
typically have different stakeholders including politicians, government administrators, and the public

7
that demand different goals that are potentially conflicting with those of the organization itself (Boyne,
2002). This reflects in employees facing high scrutiny through continuous reviews and external audits by
the stakeholders looking for indications of mismanagement of public funds. In turn, this creates an
environment that makes those involved in the process focus more in procedural compliance instead of
value for money spent (Schiele & McCue, 2011). The high amount of rules and procedures required to
be followed affects the efficiency of the organization by increasing the complexity of performing tasks
that would otherwise be considered as simple (Schiele & McCue, 2011; Thai, 2001).
In sum, it is important to note that public and private organizations differ in a variety of different
aspects and the understanding of these characteristics can be critical for the success of new
improvement initiatives. The following section highlights the most important characteristics of public
sector organizations that contrast with their private sector counterpart.
2.2 Organizational Culture of the Public Sector
Although failure of planned organizational change may be due to many factors, few are so
critical as employees’ attitudes towards the change event (Jones, Jimmieson, & Griffiths, 2005).
Employees’ attitude towards change is shaped in the most part by the culture of the organization
(Jordan, Lindsay, & Schraeder, 2012). Although there is no clear consensus of what defines
organizational culture, many authors agree that the culture of an organization is defined by its values,
goals, structure, and environment (Boyne, 2002; Jones et al., 2005). Identifying these characteristics of
an organization is critical in the process of implementing change initiatives as they provide insight of the
readiness to change of the organization. Boyne (2002) identified four main categories of theoretical
effects of “publicness” that influence how the basic functions of management are carried out in the
public sector. These categories are classified as:

8
1. Organizational environment
2. Organizational goals
3. Organizational structures
4. Organizational values
2.2.1 Organizational Environment
Public organizations are complex systems that operate through networks of interdependent
organizations that place their own demands and constraints on managers (Boyne, 2002). When the
goals between stakeholders are different, their requirements are likely to be conflicting (Hardy &
Phillips, 1998). In addition, public organizations are constantly under political pressure to achieve quick
results before the political cycle in order to receive an equal or larger share of resources in the next
round of appropriations (Bozeman & Kingsley, 1998). The potential problem with this is that most
government executives or elected officials didn’t join government to manage. For instance, they may
not care about processes and are driven by a desire to advance a policy issue or a political agenda
(Miller, 2009). This means that politicians normally get excited and focus on creating new bold programs
to solve existing problems instead of improving current existing programs.
Another characteristic of the public sector is that there is typically little to no competition in the
provision of services by the public sector. Boyne (2002) explains that even if there is competition, public
institutions have a dominant position in the market against its competitors (e.g., education and health
care in certain countries). Dixit reports that most public service organizations can be considered
monopolies, which results in poor quality service at a high cost of operation (Dixit, 2002).
Lastly, another factor that influences the environment is the high level of scrutiny in the public
sector. Jordan et al. (2012) explain that the public sector faces high levels of scrutiny from the public,

9
along with the increase in the expectations of conduct that embody honesty, fairness and
responsiveness.
2.2.2 Organizational Goals
One of the most frequent observations about public organizations’ goals is that they are
multiple, hard to measure, intangible, and in many situations conflicting (Lan & Rainey, 1992). Public
organizations need to satisfy the goals imposed by their multiple stakeholders making unclear what
direction the organization needs to take. For instance, it is important that public managers balance and
integrate conflicting objectives (Boyne, 2002).
Goals in the public sector may be unclear or ambiguous to those within the organization. Lan
and Rainey (1992) report that compared to private managers, public managers perceive the goals of the
organization as less clear and less easy to measure. For instance, if the manager perceives the goals to
be unclear and hard to measure, it is expected that they have an unclear perception of the efficiency of
the organization. This frequently happens because the purpose of the organization is appointed through
political processes instead of being selected by managers themselves (Boyne, 2002).
2.2.3 Organizational Structures
Organizations in the public sector have generally very formal and rigid procedures for decision
making, creating a less flexible and risk averse system than their counterparts in the private sector
(Bozeman & Kingsley, 1998; Lan & Rainey, 1992). In terms of operating practices / procedures, public
sector organizations are often characterized as being mechanistic, infused with ancient traditions, rules,
policies and protocol (Jordan et al., 2012) . These characteristics create a complex environment based
on bureaucratic processes that involve a high service cost, low productivity, and decrease of
organizational commitment in the organization (Boyne, 2002). In addition, the culture of the
organization becomes a “culture of fear” where the employees are not willing to innovate with new

10
methods or strategies to make the organization more efficient in an attempt to avoid conflict (Boyne,
2002; Bozeman & Kingsley, 1998; Hilger, 2010).
2.2.4 Organizational Values
A main difference between public and private sector could be attributed to the values shared by
the people of the organization. These values concern the aspirations and attitudes of their staff towards
work and life in general (Boyne, 2002). Public servers are believed to be less materialistic and have a
stronger vocation to serve the public than their counterpart in the private sector. Bright (2009) pointed
out in his study that workers in the public sector tend to be less motivated by monetary incentives than
their counterpart in the private sector. Bright (2009) expands saying that workers in the public sector
may join the organization for several reasons such as following the same ideal, or trying to cause an
impact in society.
2.3 Lean Background
The term "Lean" or "Lean production" was first used by Womack et al. (1990) in "The machine
that changed the world". However, its principles were developed by Taiichi Ohno at Toyota Motor
Company in the 1950s. Ohno characterized the key objectives of the Toyota production system (Lean)
through two key principles: continuous improvement (efficiency through the elimination of waste) and
respect for the workers (Emiliani, 2006). The International Motor Vehicle Program defines Lean as a
philosophy which when implemented, reduces the time from which the client made the order until you
supplied, eliminating sources of waste in the production flow (Sanjay & Peter, 2006). There is abundant
literature that validates the success in the implementation of Lean techniques (Barton & Delbridge,
2006; Cagliano, Caniato, & Spina, 2006; Melton, 2005; Taj, 2005; Tsung-Ming & Chao-Ton, 2007). Lean
Manufacturing is often associated with benefits such as inventory reduction, reduction of manufacturing
time, increase in quality, flexibility and customer satisfaction (Taj, 2005). In a Lean state a perfect

11
workflow is achieved by getting the right things, at the right time, and in the right quantity while
minimizing any process waste and maintaining flexibility for future process improvements or ability to
change (Womack et al., 1990). Womack and Jones (2003) summarized Lean into five principles that
enable the organization to do more with less effort, equipment, time, and space while getting closer to
provide customers with exactly what they want.:
1. Identify Value -Specify value from the customers’ viewpoint so they can be provided with
exactly what they want.
2. Identification of value stream - Identify all steps in the value stream and eliminate every step,
which does not create value.
3. Flow - Make the remaining value-creating steps occur in a tight and integrated sequence so the
product will flow smoothly toward the customer.
4. Pull –Produce no good or service until it is demanded by a customer
5. Perfection - Pursue perfection through continuous improvement.
Lean is more than a box of tools that can use to solve a problem. Instead, it needs to be applied
as a philosophy by which the organization is based to create a desired corporate culture (Sanjay & Peter,
2006). It is important to analyze and understand the context under which any tool will be used given
that the wrong use can lead to failure (Womack et al., 1990).
2.4 Lean Beyond Manufacturing
Lean principles were originally developed for manufacturing operations as a set of tools and
practices to be used by workers and managers to reduce waste in production systems resulting in
reduced costs, improved quality, and reduced cycle times (Corbett, 2007). As western manufacturers
noticed the superior performance achieved by Lean producers in Japan over the traditional mass

12
production system, western companies tried to emulate the structural part of Lean with shop-floor
techniques as an attempt to remain competitive in the market.
The concept of Lean has been expanding to different industries as a valid approach for
structuring and development of organizations (Hines, Holwe, & Rich, 2004; Höök & Stehn, 2008). Under
the premise that the problems faced in manufacturing companies were universal, Womack et al. (1990)
began promoting a thesis of transferability of Lean principles to non-manufacturing companies.
Attempts to implement Lean in non-manufacturing industries span a wide variety of industries from
healthcare (Radnor, Holweg, & Waring, 2012; Teich & Faddoul, 2013) to the public sector (Maleyeff &
Campus, 2007; Waterman & McCue, 2012) with successful results in cost reduction and increased
quality (Pedersen & Huniche, 2011). For example, Radnor et al. (2012) presented a case study of the
implementation of Lean in the English national health service (NHS). The aim of the study was to look
further at how Lean is applied in healthcare organizations and to determine the contextual factors that
moderate implementation. Radnor et al. (2012) assessed four public healthcare organizations that have
implemented Lean in one or several parts of their organization. The findings of the study showed that
although Lean is being implemented in healthcare organizations, it is generally focused towards the
“tool level” and not to a more system-wide approach. Organizations generally were involved the
application of specific tools such as Kaizen, rapid improvement events, and 5S systems, which tend to
produce small scale and localized productivity. Radnor et al. (2012) further analyzed some of the
possible causes of why Lean is not being fully implemented and compares the healthcare industry to the
manufacturing industry to explain the causes. Radnor et al. (2012) explained that although both
manufacturing and healthcare are successful in identifying the “customer value”, healthcare is
predominantly designed to be capacity-led. For instance, there is limited ability to influence demand or
make full use of freed-up resources. Radnor et al. (2012) closes stating that the problems faced in the

13
healthcare industry are more managerial and organizational in origin and they need to be addressed to
improve the productivity at the systems level.
Transition from traditional to Lean environment is more about culture change in the
organization than about process issues. Although any organization seeking to implement Lean initiatives
share the same goal of improving performance by reducing the waste of operations, the approach or
strategy of implementation needs to be tailored to the realities of specific environments (Corbett, 2007).
2.5 Lean in Enterprise Transformation
Enterprises can be defined as complex highly integrated systems comprised of organizations and
processes with multifaceted interdependencies and interrelationships across boundaries (Nightingale &
Rhodes, 2004). Organizations are obligated to continuously change the way they operate to achieve
their strategic business objectives (Nightingale, 2009). However, many of these organizations
undergoing Lean transformation struggle to find the balance between showing short term success and
achieving a long term impact at the enterprise level (Nightingale, 2009). Failing to consider the whole
“enterprise system” may lead to short term improvements that are not sustainable over time and may
sub-optimize the enterprise as a whole (Nightingale, 2009).
Lean can be divided at two levels: operational and strategic. The operational level focuses on
improving lower level operations by the implementation of Lean tools or practices. These tools or
practices may be specific to some industries and may not transfer to other sectors satisfactorily. On the
other hand, the strategic level focuses on customer-centered principles that apply at all levels of the
organization causing a bigger impact in the long term (Hines et al., 2004). Many companies trying to
implement Lean achieve only a local impact in their organization since they focus only on the
operational level. These companies implement Lean tools at the shop-floor level but fail to implement

14
the strategic level with the organizational culture and mindset needed to achieve an impact on the
overall system’s performance (Hines et al., 2004).
A good conceptual model to help understand the composition of a Lean system and how the
operational and strategic levels relate to each other was developed by Hines, Found, Griffiths, and
Harrison (2008) called “The Iceberg Model” that describes the two levels of Lean: operational and
strategic. This framework (Figure 1) is composed of two main parts: the visible part of the iceberg
(above water) represents the operational level including process management, technology available,
and tools and techniques. The part below water represents the strategic level conformed by enabling
elements of alignment and strategy such as leadership, behavior, and engagement.
Figure 1. Lean Iceberg model Source: (Hines et al., 2008)
This model provides a good visual representation of the importance of the human role in Lean.
According to this model, a proper strategy should be the foundation of the whole process, supported by
determined leadership and engaged workforce to understand and apply a set of tools and techniques to
improve the way work is being done in the organization (Radnor, 2010). Several studies in both public
and private organizations support the Lean iceberg model concluding that strong management support,

15
workers commitment and development of a proper strategy are critical factors for the successful
implementation of Lean initiatives (Achanga, Shehab, Roy, & Nelder, 2006; Maleyeff & Campus, 2007;
Pedersen & Huniche, 2011; Scherrer-Rathje, Boyle, & Deflorin, 2009).
The iceberg model provides an introduction of key elements for Lean implementation. However,
there is no specific roadmap on the implementation of Lean of those elements in an organization. Some
authors have developed more systematic models and divide the implementation process of Lean in
different phases identified during Lean implementation (Drew et al., 2004; Harbour, 2001; Jorgensen et
al., 2007). Jorgensen et al. (2007) provide a model based on literature review and experiences from 12
Danish companies currently implementing Lean. The model presented by Jorgensen et al. (2007) aim to
support an organization in the process of Lean transformation by describing the stages of Lean capability
necessary for sustained implementation and suggest a framework for assessing a company’s current
level of Lean capability maturity. He identified five different phases during a Lean implementation:
1. Sporadic optimization - This level is characterized by occasional rather random efforts at
optimization in various organizational units, but these activities are not planned or implemented
on the basis of an overall strategy or a specific philosophy. The optimization projects are
typically led by experts with little to no general employee involvement. Organizational
mechanisms and systems are not integrated with lean philosophy and/or lean objectives.
2. Basic lean understanding and implementation - Lean has now been chosen as the philosophy
that will serve as the basis for operation control and optimization. The experts and general
workforce have received basic training and pilot projects have been initiated in isolated units
within the organization for the purpose of experimenting with the individual lean tools and
methods. This is the phase where the program implements lean systems and tools, such as
Kaizens and Kanban systems.

16
3. Strategic lean interventions - The implementation of lean is now a part of the organization’s
strategy and projects and activities are planned on the basis of established goals and objectives.
Knowledge of and practical experience with lean tools and methods as well as a lean philosophy
are widely acknowledged and recognized at all levels of the organization, although initiatives are
still primarily implemented according to an established plan. Satisfactory performance
improvements are achieved. Specific HR systems (i.e. selection, compensation, training
functions) are aligned with lean objectives to support lean goals.
4. Proactive lean culture - Lean activities occur continuously from all areas of the program. To
think and act lean has become a part of the daily work, and CI is more of a habit than a specific
task, although efforts have not yet been made to extend these efforts outside of the
organization’s own boundaries. The practical understanding of lean tools and methods is quite
high and these are used actively by all members of the organization to develop and implement
performance improvements. All HR functions are aligned with lean objectives for the purpose of
supporting long term sustainability. Focus on, e.g. career development via lean and extended
developmental activities (e.g. external education).
5. Lean in the enterprise - The lean strategy is no longer just an internal strategy and its impact
is visible in activities throughout the enterprise level. Lean activities are planned, implemented,
and monitored across the enterprise boundaries. Knowledge sharing and knowledge transfer
are important components of the act ivies across the enterprise and organizational structures
support inter-organizational network building.
2.6 Enabling and Facilitating Factors in Lean Implementation
Organizations are complex and dynamic systems that interact with a number of internal and
external factors that may make implementation of any process improvement initiative difficult. Some

17
authors focused on the implementation process of Lean initiatives in different industries have
investigated the factors that may facilitate or hinder the process of implementation of Lean. However,
most of the case studies available are based on the manufacturing industry which may have different
characteristics compared to other industries (Achanga et al., 2006; Janssen & Estevez, 2013; Losonci,
Demeter, & Jenei, 2011; Pedersen & Huniche, 2011; Sanjay & Peter, 2006; Scherrer-Rathje et al., 2009).
Some of the most common factors include limited implementation experience, a tendency of workers to
return to old routines (resistance), low management commitment, lack of training and education, poor
communication and failure to link Lean with the organization’s goals (Achanga et al., 2006; Radnor,
2010; Schiele & McCue, 2011). Factors influencing the success of Lean initiatives may vary depending on
the type of industry and the organizational environment of the organization. Table 1 shows a collection
of barriers and enablers during the implementation of Lean initiatives
Table 1. Barriers and success factors during the implementation of Lean initiatives
Issue Barrier Enabler
Resources Insufficient resources (technical, financial, human)
Sufficient resources
Management Lack of management awareness and support
Management commitment
Objective Cost-cutting, layoffs Improve processes and work
Link to strategy Misaligned Aligned
Employees Employee resistance Employee commitment and belief in the process
Need for change No real or perceived crisis Burning platform
Knowledge or experience
Limited experiences in change management
Long history of successfully managed projects
Staffing Poor selection of change agents and improvement teams
Presence of improvement champion and dedicated staff
Time plan Slow pace of change Realistic timescales for changes

18
(Table 1 continued)
Issue Barrier Enabler
Culture Need for culture change Supportive organizational culture for change
Competence building Inadequate training and education Comprehensive training and education
Ownership to improvements
No ownership to improvement initiatives
Ownership to improvement
Impacts Failure to document benefits from Lean
Significant, visible impacts from Lean
Dominant mindset Individual thinking Whole systems thinking
Knowledge transfer Little to none transfer of knowledge Knowledge transfer
Rewards No rewards or recognition from participating in Lean
Recognition of success to members of the process
Communication Poor communication Effective communication between all levels of the organization
Most authors agree that top management support, good organizational culture, good strategy
and communication and continuous training and development is necessary to achieve a successful
implementation of Lean at the enterprise level in the long term (Achanga et al., 2006; Humbert, Mesia,
& Griffin, 2012; Nightingale, 2009; Pedersen & Huniche, 2011; Scherrer-Rathje et al., 2009; Schiele &
McCue, 2011). Pedersen and Huniche (2011) carried out a study to identify the determinants of Lean
implementation in a public Danish institution. They conducted direct interviews with 29 managers and
employees of the public institution that have been involved in the planning and implementation of Lean
projects over the past 2 years by the time of the interview. The authors divided the results into four
main success factor groups: the first factor consisted of goals and values within the organization.
Pedersen and Huniche (2011) explain that all employees and managers in the organization may not

19
share the same goals and values regarding how work should be done in the organization affecting the
support of any Lean initiative by creating resistance to change. The second success factor relates to the
importance and complexity of the project. Most of the interviewees reported that they were more
willing to participate in smaller and simpler projects that didn’t involve interaction with other
departments given the low success rate of complex interdepartmental projects. The third success factor
involves a balance of power in the department where all managers and staff need to be involved in the
development and coordination of the project to avoid future resistance that may lead to the failure of
the project. Finally, resources available are important for the implementation of the project. Most
workers identified time as a key issue given that these kinds of projects increase their workload since
they need to take part of their regular work day to be part of them.
The knowledge of these factors is crucial given the complexity of the implementation of Lean
which usually faces a large number of obstacles and usually does not happen properly in the first
attempt (Achanga et al., 2006; Scherrer-Rathje et al., 2009; Schiele & McCue, 2011). Furthermore, many
researchers agree that the process of transformation to Lean differs as a function of the characteristics
of the organization. Prior to its implementation, it is crucial to analyze the organization environment to
conveniently adapt the implementation process (Furterer & Elshennawy, 2005; Höök & Stehn, 2008;
Sánchez, Gómez, Bolea, Arjona, & Ceballos, 2012). The following section discusses four factors identified
in the literature as critical to have a sustained Lean organization in the long term.
2.6.1 Top Management Support
Before starting to implement Lean initiatives in an organization, it is critical to establish
management support. Several studies have found a positive correlation between management
commitment and the success of Lean (Achanga et al., 2006; Soriano-Meier & Forrester, 2002). In
organizational change, managers need to play the roles of coaches and champions of change and not

20
the role of a person who is constantly monitoring the organization for signs of resistance (Armenakis,
1993). Furthermore, management should have a clear understanding of the initiatives, good education,
and willingness to support improvement initiatives since they are the ones that provide inspiration,
energy and support necessary to create readiness for change (Achanga et al., 2006; Armenakis, 1993).
Senior managers need to introduce a clear vision of the concept of Lean, provide the resources
necessary, and create a culture that fully supports improvement (Achanga et al., 2006; Schiele & McCue,
2011). In addition, senior managers need to consistently display the desired ways of Lean for others to
observe and imitate (Boyne, 2002).
2.6.2 Organizational Culture
The concept of organizational culture could be referred to as “the way things are done around
the organization” in a practical and philosophical point of view (Höök & Stehn, 2008; Schein, 2004). The
culture in an organization is highly influenced by practices used by its employees. Höök and Stehn (2008)
explain that Lean culture can relate to this definition since the concept has been developing throughout
the years and is now a valid concept for structuring and developing organizations. Lean should be
viewed more as a philosophy to run the organization than as a process to fix things given that when
more people believe in this philosophy the implementation process of improvement initiatives becomes
easier and improvements of higher magnitude can be accomplished (Sanjay & Peter, 2006).
Lean is a dynamic process that involves changes and may challenge the organizational structures
and management process of any organization. These changes may influence the core values and beliefs
held by the organization, policies or guidelines for decision making, current processes, and even the way
that people work together within the organization, opening possibilities to some level of resistance
(Schiele & McCue, 2011). Liker (2004) explains that one of the factors that led the Toyota system to its
success is their organizational culture of discipline. He expands by discussing how an organization can

21
implement these management principles which are the basis of the reputation that Toyota has gained
regarding its quality and efficiency. The establishment of a supportive and innovative organizational
culture is critical for the implementation of Lean (Achanga et al., 2006).
2.6.3 Strategy and Communication of Goals
Planning and explaining the purpose behind Lean transformation is critical in the process and it
may decrease fear and resistance of other members in the organization. The definition of clear and
measurable goals is associated with both quantitative performance such as efficiency, and production
targets as well as quality performance like innovation and employee morale (Verbeeten, 2008).
Verbeeten expands saying that performance measurement systems should be developed with the
people that work with those processes in order to create ownership. Creating ownership in the
measurement system increases the morale, belief, and commitment of employees facilitating its
implementation. For instance, it is important that key leaders and staff share the same values and belief
towards the measurement system in order to achieve a long-term improvement effect.
In creating readiness for change, a message for change needs to be communicated among
members of an organization. This message should address two issues. The first is an awareness of the
need for change, which is the discrepancy between the current state and the desired end state of the
organization. Creating the belief that change is necessary requires showing relevant contextual factors
such as changes in governmental regulations that explain how the current performance of the
organization differs from that desired or needed end state (Armenakis, 1993). The second issue refers to
individual and collective efficacy of members involved in the process of change. Although awareness for
change is a powerful motivator, this may also bring some negative thoughts from workers feeling
overwhelmed or thinking that their work and hard effort is not appreciated. For instance, it is important
that this counter reaction is corrected by building confidence among members of the organization by

22
highlighting their capacity to overcome any negative behavior that doesn’t add to the success of the
change initiatives (Armenakis, 1993; Bandura, 1982).
2.6.4 Continuous Training and Development
Training the employees involved in the process about the philosophy and tools of Lean is
important to establish a basis of knowledge so the employees can start applying that knowledge on the
process they are responsible for managing and become more aware of the type of benefits that are
possible with its use (Schiele & McCue, 2011). Allowing employees to be part of the process of
identifying and opportunities for value creating, and participating in rapid improvement events
increases employee commitment causing that other people involved to see Lean as a sustainable way of
managing work on a day to day basis (Bhatia & Drew, 2006; Sanjay & Peter, 2006; Schiele & McCue,
2011).
2.7 Lean in the Public Sector
The public sector has been developing new strategies to change the way it delivers services to
the public. The need by government to deliver more for less combined with an increasing demand of the
public asking for better performance and quality of services have forced the public sector to adopt
industrial practices. Different strategies and methodologies such as TQM, Six Sigma, and Lean have been
applied to improve the way the public sector delivers services with some showing more success than
others (Dixit, 2002; Lan & Rainey, 1992; Verbeeten, 2008). In particular, Lean is considered a good
management approach for the public sector as it shares the same core value of customer focus related
to the public sector. Radnor and Boaden (2008) define Lean within the public sector a philosophy that
aims to develop good practices that allow a reduction of waste and improvement of flow through the
development of a culture of continuous improvement that involve everyone. Lean has been growing in
popularity in the public sector in recent years showing positive results in terms of culture and cost

23
effectiveness (Radnor, 2010). Lean can help public sector organizations to streamline processes by
addressing the causes of organizational inefficiency, building management systems and capabilities to
sustain new ways of working by engaging managers and staff to engage in a culture of continuous
improvement (Gebre, Hallman, Minukas, & O'Brien, 2012). Although some authors have criticized the
transferability of Lean to the public sector, Lean is a philosophy that continues to evolve to fit particular
characteristics of each industry (Hines et al., 2004). Most authors agree that although Lean can be
transferred successfully to the public sector, it requires significant modifications (Radnor, 2010;
Scorsone, 2005). For example, it is important to consider during Lean transformation that some tasks
that may not add any value to the process are required by law and cannot be changed.
The use and adaptation of Lean techniques in the public sector can be viewed as an innovative
managerial response to government demands for more efficient services and large reductions in public
spending (Carter et al., 2011). Radnor and Boaden (2008) divided Lean and techniques used in the public
sector in three categories: assessment, improvement, and monitoring. Assessment looks at the
processes at the organizational level to understand the current state of the processes and map the
desired end state. Improvement includes the tools to support and improve processes such as 5S,
structured problem solving, and Kaizen. Monitoring relates to the measurement and monitoring of the
impact of the processes and their improvement in terms of quality, time, costs, and satisfaction levels. A
major difference that contrasts Lean from other approaches is that Lean is both a managerial philosophy
that aims to change the organization’s culture and values and also a set of tools and practices that
attempt to improve processes (Waterman & McCue, 2012). Lean may improve the way the public sector
is designed and manage by improving the way goods and services are provided while balancing the
needs of different stakeholders involved in the process. By combining a set of tools and techniques such
as root-cause problem solving approaches, implementation of goals and process measures used to
monitor and control results, and flexible standardization of processes, Lean can set the base of process

24
improvement initiatives within the organization (Schiele & McCue, 2011). However, not all academics
are as optimistic with the use of Lean in the public sector. Carter et al. (2011) discusses that the
reorganization of processes and workflow under Lean involves the implementation of a Tayloristic
management approach that degenerates the job enrichment and empowerment of front line workers in
the public sector. Carter et al. (2011) expands saying that the introduction of performance surveillance
systems and standardization of processes associated with Lean not only degrades the work life of
employees but also forces previously autonomous skilled workers with substantive knowledge of
sophisticated processes or techniques to perform what he considers as semi-skilled “assembly line
work”.
On the other hand, Radnor (2010) points out that most public sector organizations where Lean
initiatives have been implemented indicate significant impact related to cost, quality, time, and
satisfaction from both staff and customers. A positive aspect of Lean is that other approaches or tools
such as TQM and Six Sigma can be integrated without contradicting the core objective of Lean (Hines et
al., 2004). For example, Furterer and Elshennawy (2005) combined two improvement methods
consisting of Lean and Six Sigma. The authors implemented Lean Six Sigma tools and principles to the
financial administration processes in a local government entity to streamline the processes and reduce
the completion time of the financial process. The processes of the department include payroll, accounts
receivable, purchasing and accounts payable, and monthly reconciliation. The major problems faced
before the Lean Six Sigma implementation were that the processes were inefficient, error-prone, and
lengthy with an extensive number of non-value added steps. In addition, the department didn’t have
any qualitative or quantitative system to measure the performance. The results of implementing a Lean
Six Sigma program included a significant reduction of processing time with payroll time reduced by 60%,
purchasing and accounts payable processing time reduced by 40%, accounts receivable processing time

25
reduced by 90%, and monthly reconciliation processing time reduced by 87%. In addition, the number of
financial system problems reported decreased by half, going from 13 per month to about 6 per month.
Another example of Lean implementation in a local government organization is presented by
Radnor (2010) who carried out a study in a public institution in the UK that employees more than 10,000
people and provides logistics services to a wide number of sectors including automotive, technology,
aerospace, defense, leisure and rail. The goal of the study was to examine which Lean manufacturing
tools and techniques can be transferred and implemented into the public department as well as their
impact as viewed by the staff within the department. Radnor (2010) conducted a case study approach
visiting ten sites within the department interviewing 296 employees throughout the organization. The
ten sites included five large processing offices, two distributed processing offices, and three national
processing centers. The purpose of the interviews was to gain understanding of the level of
implementation and knowledge of Lean tools of the departments. The results showed an improvement
in productivity, quality and better understanding of the process and its levels of waste (non-value
activities) by the implementation of Lean. However, these improvements were achieved mostly by
focusing on the operations (standard work, 5S, takt time, workload balancing, visual management, key
performance indicators, process hubs) and implementation (diagnostic, seven wastes, value stream
mapping,) tools rather than continuous improvement ones (problem solving, go and see, workplace
audit, location assessment, Lean environment), meaning that there was a bigger focus on waste
reduction rather than understanding value which could lead to a highly efficient process that provides
the wrong service or product. Radnor (2010) concluded that one of the causes of this result was the lack
of technical knowledge of the tools and level of maturity within the organization. Another major finding
by Radnor (2010) was the direct correlation between the engagement of senior leaders and the attitude
of staff towards Lean. Radnor (2010) noted that to implement Lean within the public sector, people in
the organization need to have a maturity level that changes the culture of the organization to be aware

26
of the need to improve processes and be willing to accept and sustain any changes that may be
performed. This study supports other studies (Pedersen & Huniche, 2011; Waterman & McCue, 2012)
that highlight the importance of implementing not only the operational level of Lean but also the
strategic level with the cultural change to avoid resistance and facilitate the transition.
Most examples of Lean implementation in the public sector show that the major problems faced
during Lean implementation are centered at the strategic level of Lean. This coincides with the literature
of critical success factors of Lean implementation in other industries presented in section 2.6. However,
it is fair to say that Lean in the public sector is still under-researched in comparison to other areas like
manufacturing and healthcare where more precise and specific information is available (Radnor, 2010).
Most of the literature reflects assessments of the success of Lean that are usually restricted to
measuring the impact of Lean at the operational and financial level leaving aside the impact at the
human or strategic level of Lean implementation (Losonci et al., 2011).
The impact of implementing Lean is not as easy to measure at the strategic level as it is at the
operational level. The strategic level has a more comprehensive and wider content where Lean is not
viewed just as a tool but as a way of thinking to pursue excellence in the production or services provided
emphasizing customer value and the entire system flow (Wang & Huzzard, 2011). Many authors
support that the use of assessment tools can provide information of the impact of Lean at the strategic
level (Doolen, 2005; Jorgensen et al., 2007; Nightingale & Mize, 2002; Perkins, Abdimomunova, Valerdi,
Shields, & Nightingale, 2010). Assessment tools can be used as a roadmap to Lean implementation as
they provide information of the current state of organization and the impact of the improvement
initiatives at both the process and strategic level (Jorgensen et al., 2007). The following section discusses
the benefits of the use of assessment tools in Lean implementation and introduces some of the tools
that have been developed by other authors.

27
2.8 The Role of Assessment in Lean Transformation
Assessment tools are critical to successful Lean implementation as they facilitate the necessary
organizational learning and development to sustain Lean in the long term (Abdimomunova & Valerdi,
2010; Jorgensen et al., 2007). Assessment allows an organization to determine trends and analyze the
impact of changes in organizational conditions in performance (Abdimomunova & Valerdi, 2010; Van de
Ven & Ferry, 1980). It also stimulates managers to implement improvement initiatives in opportunity
areas. Last, assessment shows the impact of previous improvement initiatives (Van de Ven & Ferry,
1980)
A good Lean assessment tool needs to include both a technical perspective and an
organizational perspective. The technical perspective is related to the operational level of Lean and
includes performance, methods, and tools in relationship to the company’s strategic scope (Jorgensen et
al., 2007). The organizational perspective is related to the strategic level of Lean and reflects
management, organizational and human capabilities, culture, and learning (Hines et al., 2004). The Lean
assessment tool should measure these two perspectives in a balanced way to evaluate the possible
synergy created by focusing attention on both perspectives simultaneously. Parker (2003) carried field
research at a UK-based company that manufactures and assembles large vehicles to study whether Lean
implementation was related to negative effects on employee outcomes. The author assessed four
groups with varying involvement with Lean twice over a 3-year period. The results from the study
indicated that employees in all Lean production groups were negatively affected with those involved in
the assembly lines showing the worst results with reduced organizational commitment and role breadth
efficacy. In addition, mediational analyses showed that the negative effects of Lean were in part
attributable to declines in perceived job characteristics such as autonomy, skill utilization, and
participation in decision making. Although these results may seem discouraging, they cannot be
generalized as there are a wide number of factors that could have affected the results of the studies

28
such as the methodology, assessment tool, or even the organizational culture of the company where the
study was conducted. Unfortunately, research that studies the impact of Lean at the strategic level is
very scarce and there is no consensus of best methods and tools used to do this kind of research.
However, academic and industrial researchers have developed tools to assess the impact of Lean. Some
of these assessments have been used in previous research as a tool to link Lean implementation with
organizational performance (Abdimomunova & Valerdi, 2010; Doolen, 2005). Some tools include:
Survey of Perceptions of a Company's Leanness – It is 36 question survey tool used to assess a
company's leanness. The survey is available in different versions to be used by various
stakeholders like executives, employees, investors, suppliers, and customers. The topics
addressed by the survey include waste identification and reduction, value stream management,
continuous improvement, flow, employee development, and leadership.
The Lean Company Survey - Benchmarking survey used to request information on performance
changes attributable to lean, infrastructure details, functional involvement in lean, and
implementation details
Strategos Lean Assessment - This assessment helps to investigate, evaluate, and measure nine
key areas of manufacturing. The result is a deeper understanding of key issues, problem areas,
and potential solutions. The Lean Manufacturing Assessment has a questionnaire that explores
nine key areas. There are 3-6 questions for each area with multiple-choice answers. A scoring
worksheet totals the score for each section and provides an overall Lean Index.
Lean Checklist Self-Assessment - Assessment tool that allows the organization to establish a
baseline measurement of Lean progress. The topics include a range of management and lean
practices.

29
Lean Enterprise Self-Assessment Tool (LESAT) - The LESAT is an enterprise level assessment tool
designed to guide leadership through the transformation process towards a more lean
enterprise. The LESAT was developed by a team of professionals from industry, government and
academia representatives working together under the Lean Advancement Initiative (LAI) and is
intended to be a self-assessment that integrates the perspectives and standpoints of critical
members in the enterprise leadership to guide through the transformation process of a more
lean organization . The tool has 54 questions divided in three sections: lean transformation
leadership, life cycle processes, and enabling infrastructure.
Government Lean Enterprise Self-Assessment Tool (GLESAT) - The GLESAT is a modified version
for government of the Lean Enterprise Self-Assessment Tool (LESAT) developed by a team of
professionals from industry, government and academia representatives working together under
the Lean Advancement Initiative (LAI). This tool is intended to be a self-assessment of the
perceived present state and the readiness for change of the organization helping to determine
the extent to which Lean principles, practices, and behavior have become parts of the
organization. The version used in the present study (GLESAT) contains 55 practices divided in
three sections, each broken down into different parts as shown in figure 2. The first section
(enterprise leadership) is comprised of 28 practices and refers to the processes and leadership
attributes that support the transformation to Lean principles and practices. The second group
(lifecycle and enabling processes) has 19 questions and refers to the processes responsible for
the product or services from creation to its delivery. Lastly, the third group (enabling
infrastructure) has 8 questions and refers to the processes that provide and manage the
resources that enable the enterprise operations (Abdimomunova & Valerdi, 2010).

30
Figure 2. GLESAT structure Source: (Nightingale & Mize, 2002)
A major problem found during the review of Lean assessment tools was that most of the tools
are specific to the manufacturing industry and would require modifications if implemented in the public
sector. Also, the majority of the assessment tools focus exclusively on the operational level and not the
strategic level (Jorgensen et al., 2007). Table 2 provides a table with the criteria used to select the
assessment tool for the represent research.

31
Table 2. Criteria table Source: modified from (Doolen, 2005)
The Lean assessment tool selected for the present research was the GLESAT. An important
criterion to select the Lean assessment tool was its transferability to the public sector. Table 2.8.1 shows
that only the GLESAT is designed specifically to the public sector while the other tools have emphasis on
the manufacturing industry. The second criterion was the availability of the tool. Most of the Lean
Tool Author Industry Availability
Survey of Perceptions of a
Company's Leannes
Jordan and Michel
(2001)Manufacturing No
The Lean Company SurveyLean Learning Center
(2003)Manufacturing No
Strategos Lean Assessment Strategos consultants Manufacturing No
Lean Checklist Self-Assessment
Rober Abair
Associates, Inc.
(2002)
Manufacturing Yes
Lean Enterprise Self-Assessment
Tool (LESAT)
Nightingale and mize
(2002)Manufacturing Yes
Government Lean Enterprise Self-
Assessment Tool (GLESAT)Nightingale (2008) Public Sector Yes

32
assessment tools have been developed by consultant companies and would involve some cost to use the
tool for research purposes. However, The GLESAT was developed for research and industrial purposes
and it is available to be used for the present research without any cost. Third, the GLESAT has an
emphasis on assessing the strategic level of Lean which is the focus of the present research. This tool
assesses areas such as management support, effective communication, continuous learning and
development, and organizational enablers of the organization. These factors were identified in the
literature as key success factor for successful Lean implementation in the public sector, making this tool
a valuable resource to be used in the present research. However, a downside of this tool is the lack of
literature reporting its implementation. Although there is literature on the implementation of the LESAT
(Abdimomunova & Valerdi, 2010; Nightingale & Rhodes, 2004) which is very similar to the GLESAT in
terms of structure and content, there is no report of the implementation of the GLESAT to the
knowledge of the authors.

33
3 RESEARCH METHODOLOGY
The aims of this study were to develop a better understanding of the association of Lean
implementation in the levels of agreement and cohesion between managers and staff in evaluating
perceived current state and desired state of organizational practices. The study took place within two
different programs of the Office of Public Health (OPH) of the Department of Health and Hospitals (DHH)
for Louisiana. The surveys used for the study were the Government Lean Enterprise Self-Assessment
tool (GLESAT) and an Employee’s demographic survey. The GLESAT is a self-assessment of the perceived
present state and the readiness for change of the organization helping to determine the extent to which
Lean principles, practices, and behavior have become parts of the organization.
3.1 Data Collection Chart
The study was conducted in 2 different programs within OPH. Figure 3 shows that each
participating program was assessed in parallel and was classified as Lean or Non-Lean. Each participant
assessed the current state and the desired state of each of the 55 assessed practices of their program.
The data collected was analyzed separately by the job role of the respondent in the organization
(manager or staff).
Figure 3. Data collection plan

34
3.2 Assessment Tools
Two surveys were used to assess this study: Employee demographics, and the Government Lean
Enterprise Self-Assessment Tool.
3.2.1 Employee Demographics Survey
The demographic survey was a 10 question survey (Appendix C) that provided information
about the name of the program, years of work experience at the participating program, role in the
program, years of work experience in the private sector, years of work experience in the public sector,
familiarity with Lean tools and principles, percent of work time spent on process improvement projects,
number of Lean projects involved, barriers of Lean implementation and Lean practices used in the
program.
The survey listed 4 barriers that have been identified in previous research of Lean
implementation in the public sector as critical for the successful implementation and sustainability of
Lean in the long term (Pedersen & Huniche, 2011; Radnor & Boaden, 2008). These critical barriers
include:
1. Lack of management support – Management support is critical in implementing any
change in the organization. Lack of management support can lead to reluctance to
implement a transformation plan.
2. Poor organizational culture - refers to a culture where staff accepts initiatives for change
and develops a sense of ownership. A poor organizational culture creates high
resistance towards change
3. Lack Strategy and poor communication – A clear message of the goal and strategy needs
to be communicated across all sites. It is important to disseminate success stories and
facilitate the transfer of knowledge within and between departments.

35
4. Lack of Training – A good understanding of tools and process is important for employee
commitment and deployment of the transformation plan.
The survey included these critical barriers as a way to facilitate the identification of such
barriers. In addition, another cell was included for the participant to add other barriers that he/she felt
as a barrier of Lean implementation.
3.2.2 Government Lean Self-Assessment Tool (GLESAT)
The main tool used was the Government Lean Enterprise Self-Assessment Tool (GLESAT,
Appendix D). Respondents assessed 55 practices through two sets of ratings, one for the perceived
current state performance and one for the future or desired state performance of the program (Perkins
et al., 2010). Each practice was assessed on a capability maturity scale of 1 to 5 where level 1 is the
lowest or minimal awareness of the practice and 5 is a world-class or recognized best practice (Figure 4).
Figure 4. Generic Capability Maturity Level Source: (Nightingale & Mize, 2002)
Level 1 •Some awareness of this practice; sporadic improvement
Level 2
•General awareness; informal approach deployed in a few areas with varying degrees of effectiveness and sustainment.
Level 3
•A systematic approach/methodology deployed in varying stages across most areas; facilitated with metrics; good sustainment.
Level 4
•On-going refinement and continuous improvement across the enterprise; improvement gains are sustained.
Level 5
•Exceptional, well-defined, innovative approach is fully deployed across the extended enterprise (across internal and external value streams); recognized as best practice.

36
The results of this survey were analyzed by individually looking at the scores of each practice,
averaging across sections, or looking at the overall score. Review and analysis on an individual level can
help identify weaknesses and strengths of specific areas and can help visualize areas for improvement.
Looking across whole sections can be used as a leading indicator for evaluating organizational
performance and identify possible areas for improvement.
3.3 Experimental Design
3.3.1 Participants
Participants of this study were program functional managers and staff that perform daily
functions of the program. Although the proposed sample size was of 60 participants, 7 participants were
not able to perform the study due to availability during the established time frame. Table 3 shows the
distribution of the participants by group (Lean and non-Lean) and by job role (Manager and staff). The
non-Lean group had 25 participants in total for a participation rate of 83%. The Lean group had 28
participants in total for a participation rate of 93.3%.
Table 3. Participant distribution
Group Manager Staff Total
Non-Lean 13 12 25
Lean 15 13 28
Total 28 25 53
Out of 53 participants, 46 samples (22 participants from the Non-Lean group and 24 participants
from the Lean group) were considered valid. The main cause of discarding 7 samples was due to the
participants filling more than one possible answer in some of the assessed practices.

37
3.3.2 Dependent Variables
The dependent variable was the level of perceived current organizational maturity and desired
Lean state of the respondents across each of the programs which were further categorized into the
three main sections of the questionnaire: enterprise leadership, life cycle and enabling processes, and
enabling infrastructure.
3.3.3 Independent Variables
The independent variables include the job function (Manager or staff), the Lean level of each
program at the time of the assessment (Lean and Non-Lean) and the state of the practice being assessed
(current vs desired).
3.3.4 Setting
The study was performed in two different programs within the Office of Public Health (OPH).
The main goal of OPH is to improve population health and reduce disparities in health outcomes by
promoting policies and environmental change that prevent transmission of infectious diseases and the
reduction of environmental hazards (Louisiana Department of Health and hospitals, 2013). This office is
composed of six centers that provide oversight to more than 50 programs and initiatives. These
programs are created to serve a specific population in Louisiana and have specific goals and objectives
that support the main goals of OPH.
The programs selected for this study were picked based on their availability and willingness to
participate in the research. Each program was categorized as either Lean or Non-Lean depending on
their experience with Lean:
3.3.5 Procedure
The Institutional Review Board of LSU approved the research. Office executives of OPH were
contacted via email to request authorization to perform the study and support on identifying possible

38
programs that could participate. Once the possible programs were identified, an email requesting
availability and willingness to participate in the study was sent to the program director (see Appendix B).
Once the program director agreed to participate, a meeting was scheduled to introduce the objective of
the studies, discuss the activities of the program, identify program staff and managers that would
participate in the study and schedule the dates to perform the study. Then, possible identified
participants were contacted via email to request their participation in the study and obtain information
about their availability and possible dates to perform the study. The process of assessing each program
was performed independently from each other and the order of the programs assessed was based on
availability of the program directors and staff of the program.
On the day of the assessment, verbal and written explanation of the experiment was given to
the participants. Participants had the opportunity to ask questions at any time during and after the
assessment. Then, participants were asked to read and sign the consent form (Appendix A) before
starting the study. During the first part of the study, participants completed the demographics survey. In
the second part, the participants had to first read the instructions of the assessment and then answer
the 55 questions of the GLESAT which are divided into three main sections. Once the participant read
the question and the levels of maturity, he or she had to identify the “current” level or state of the
program (C) and the “desired” state that he or she believes that is tangible and optimum for the
program in a 1 year timeframe. Furthermore, there was an “evidence or opportunities” section where
the participant had the chance to provide written comments regarding that practice that may facilitate
the improvement process identifying enablers or barriers faced. Participants were allowed to ask any
questions before, during, and after the assessment to the researcher. The assessment process was
designed to last 45 to 60 minutes. The participant’s name and program were deleted from all
information of the consolidated raw data breaking any link between the response and the name of the
person with the original response.

39
3.4 Data Analysis
The data was entered into a spreadsheet for further analysis in a numerical format. Tests of
normality (Kolmogorov-Smirnov) and homogeneity of variance (Levene’s test of equality of variances)
were performed at a significance level of 0.05 prior to conducting any inferential statistics. The null
hypothesis for normality test stated that the data is normally distributed and alternative hypothesis
stated that the data was not normally distributed. Results from the normality test revealed insufficient
information to reject the null hypothesis (minimum p-vale = 0.200). The null hypothesis for Levene’s test
stated that the group variances are equal and alternative hypothesis stated that that the group
variances are not equal. Results from the Levene’s test revealed insufficient information to reject the
null hypothesis (minimum p-value = 0.179). There is insufficient evidence to claim that the variances
between the groups are not equal. The data met the preconditions to use ANOVA.
To perform further analysis, the data received by the respondents was clustered by Lean level
(Lean and Non-Lean), state (current and desired) and by job role (managers and staff). Assessing the
current performance or Lean state provides insights regarding current Lean adoption in the organization
and current maturity in the organization where low scores represent practices that have not been
adopted yet and may require more attention while current high scores indicate perceived organizational
success in that practice. The desired scores provide feedback on the participant’s perceived importance
of different practices to the organization. This means that the desired scores can be seen as a reflection
of the priorities and values of the organization (Perkins et al., 2010). A high desired score represents
practices that are of extreme importance to the participant while a low score may indicate a low priority
practice or a misunderstanding of the potential that the practice may bring to the program. Comparing
the average current state indicates the perceived current Lean state and maturity of managers and staff
while comparing the average desired state illustrates if there is a difference in priorities and values
between managers and staff.

40
The scores of the each section were determined by clustering the data by job role and then
calculating the mean scores for the overall results of the GLESAT and then by each section separately.
The analysis was divided in three main sections: 1. Lean level significance, 2. Job role significance, 3. Gap
analysis of current and desired Lean states and 4.Comparative analysis between Non-Lean and Lean. In
order to test the hypotheses framed in the next sections, a three-Way analysis of variance (ANOVA) was
conducted on GLESAT scores at a significance level of 0.05. The three independent variables tested
included: Lean level (Non-Lean and Lean), state (current and desired), and job role (manager and staff).
SPSS 22 was used to perform all statistical analysis.
3.4.1 Lean Level Significance
The following hypotheses were framed to determine if overall scores of the Non-Lean group and
the Lean group differed significantly:
Hypothesis test 1: H01: There is no difference in current state overall scores of the Non-Lean
group and Lean group
H11: There is a difference in current state overall scores of the Non-Lean
group and Lean group
Hypothesis test 2: H02: There is no difference in desired state overall scores of the Non-Lean
group and Lean group
H12: There is a difference in desired state overall scores of the Non-Lean
group and Lean group
3.4.2 Job Role Significance
The following hypotheses were framed to determine if perceived current organizational
maturity and desired Lean state of the program between managers and staff differ significantly:

41
Hypothesis test 3: H03: There is no difference in perceived current level of program maturity
between two job roles.
H13: There is a difference in perceived current level of program maturity
between two job roles.
Hypothesis test 4: H04: There is no difference in perceived desired Lean state level of program
between two job roles.
H14: There is a difference in perceived desired Lean state level of program
between two job roles.
3.4.3 Gap Analysis of the Current and Desired State
A gap analysis consists of calculating the difference between manager and staff responses on
the three main sections of the GLESAT. This analysis was performed for each participating program
independently and then grouped by their Lean level. The gap score was used to assess the association of
Lean with gap reduction.
For current Lean state, a large gap would indicate that managers and staff have a significantly
different perspective on how they perceive the Lean state of the program while a small gap would
indicate the opposite. In addition, a positive value in the current state could suggest that managers are
more optimistic on the way they perceive their program is performing than the staff. A negative value
would indicate that the staff has a more optimistic perception than the managers of how their program
is performing.
For the desired Lean state, a large gap in the scores suggests that managers and staff may share
different values, have different priorities, or have a different vision on how the program should or could
run. A small gap would indicate that values and priorities of managers and staff are streamlined and are

42
aiming at developing an organization under the same Lean principles. The following proposition is
framed:
P1: As program has higher Lean scores in its practices, the gap in perceived current and
desired Lean state between managers and staff is reduced.
3.4.4 Comparative Analysis of Lean Levels
The following hypothesis was framed to check whether the gap between ratings of staff and
managers decreases:
Hypothesis test 5: H05: the gap size for the scores between managers and staff do not differ
significantly from each other in the non-Lean and Lean groups
H15: : the gap size for the scores between managers and staff do differ
significantly from each other in the non-Lean and Lean groups

43
4 RESULTS
The present research was carried out in two programs within the Office of Public Health with
one of them currently undergoing Lean implementation. The data was collected over the course of 17
meetings organized in association with the program managers. Participants completed the assessment
in approximately 50 minutes.
4.1. Descriptive Statistics
The data obtained from the GLESAT was classified by Lean level (Lean or Non-Lean), by state
(current or desired), and by job role (manager or staff). Then, the data was analyzed looking to the
overall score of the current and desired state of each program and then looking at each of the three
sections that compose the GLESAT: (1) Enterprise leadership, (2) life cycle and enabling processes, and
(3) Enabling infrastructure.
Table 4 shows the results of the Lean and non-Lean group obtained from the demographic
section of the study. The table shows the number and percentages of the responses of each question.
The percentage was calculated dividing the number of responses of each question by the total number
of participants of the Lean level group.
Table 4. Participant demographic information
Lean Non-Lean
Number of participants Number of Participants
Years working in the program
0-2 0 (0%) 7 (32%)
2-5 0 (0%) 1 (5%)
5-10 7 (29%) 4 (18%)
10+ 17 (71%) 10 (45%)
Years of experience in public sector
0-2 2 (8%) 1 (5%)
2-5 1 (4%) 2 (9%)
5-10 4 (17%) 5 (23%)
10+ 17 (71%) 14 (64%)

44
(Table 4 continued)
Lean Non-Lean
Number of participants Number of Participants
Perceived familiarity with Lean tools
No Knowledge 0 (0%) 5 (23%)
Poor 4 (17%) 10 (45%)
Moderate 15 (63%) 7 (32%)
Very Good 7 (29%) 0 (0%)
Excellent 1 (4%) 0 (0%)
Percent of time spent working on Lean six sigma
0-20 3 (13%) 21 (95%)
21-40 12 (50%) 1 (5%)
41-60 6 (25%) 0 (0%)
61-80 3 (13%) 0 (0%)
81-100 0 (0%) 0 (0%)
Participants of the Lean group had longer time working on their program than participants from
the Non-Lean group. All 24 participants from the Lean group had more than 5 years working in the
program compared to 14 out of 22 from the Non-Lean group. In addition, the Lean group was more
familiar with Lean with 23 out of 24 participants having at least moderate knowledge compared to only
7 out of 22 in the Non-Lean group.
The different level of Leanness between the two programs was validated performing an
independent samples t-test (Table 5) on the results of the two groups in questions 6 and 7 of the
demographics questionnaire (appendix 7.4). Question 6 of the demographics questionnaire refers to the
perceived familiarity with Lean of the participant while question 7 asked the participant to give an
estimate of the percent of their working time using Lean Six Sigma. Average results of question 6
showed that the perceived familiarity with Lean of the Non-Lean group was significantly lower than the
Lean group. Average results for question 7 showed that the Non-Lean group spent significantly less time
on average (2.59%) than the Lean group Lean six (52.1% ) incorporating Lean six sigma in their work
processes.

45
Table 5. T-test for participant familiarity with Lean and time spent in Lean six sigma
Group N Mean P-Value T-Value
Perceived familiarity with Lean Non-Lean 22 2.136
0.0000 -5.52 Lean 23 3.304
Percent of working time spent in Lean Six Sigma
Non-Lean 22 2.59% 0.0000 -11.94
Lean 23 52.1%
4.2. GLESAT Overall Scores
Scores for this section were determined by calculating the mean for each participant of all 55
practices that compose the three sections of the GLESAT. The mean and standard deviation of the
overall score broken down by Lean level, state and job role and the ANOVA results are presented in
table 6 and table 7.
Table 6. Overall GLESAT scores for current and desired state
Overall - Current State Overall - Desired State
Level Job role N Mean (SD) Level Job role N Mean (SD)
Non-Lean Manager 11 1.60 (0.49)
Non-Lean Manager 11 3.25 (0.73)
Staff 11 1.8 (0.61) Staff 11 3.55 (0.65)
Lean Manager 10 2.48 (0.40)
Lean Manager 10 3.81 (0.38)
Staff 14 2.31 (0.61) Staff 14 3.90 (0.45)
Table 7. ANOVA results for GLESAT overall scores
Source F P-Value Observed Power
Lean Level 24.061 .000* .998
State 187.943 .000* 1.000
Job role 1.089 .300 .178
Lean level * State .869 .354 .151
Lean level * Job role 1.967 .164 .284
State * Job role .446 .506 .101
Lean level * State * Job role .249 .619 .078

46
Table 7 shows the ANOVA results for the GLESAT overall scores. The overall scores of the Lean
group were higher than the Non-Lean group by 41.18% for the current state and 13.53% for the desired
state. ANOVA Results showed that Lean level, F (1, 84) =24.061, p<0.001, power=.998 and State F (1, 84)
=187.943, p<0.001, power=1.00 were the main significant effects. However, there was no significant
difference in the responses between managers and staff in the overall scores (job role F (1, 84) =1.089,
p=0.300, power=0.178).
The gap between managers and staff calculated by subtracting the scores of the staff group to
the overall scores of the manager group (manager scores – staff scores) for the current and desired
state. Average results showed a reduction in the gap scores between managers and staff of the Lean
group compared to the Non-Lean group in both current and desired state. For the current state, the gap
score of the Lean group was 15% smaller than the Non-Lean group. For the desired state, the gap score
of the Lean group was 70% smaller than the Non-Lean group (Figure 5 and 6). However, ANOVA results
showed that the interaction between Lean level and state, F(1,84)=0.869, p=0.354, power=0.151, Lean
level and job role F (1,84)=1.967, p=0.164, power=0.284, state and job role F (1,84)=0.446, p=0.506,
power=0.101 and Lean level, state, and job, F (1, 84) =0.249, p=0.619, power=0.078, were not
significant. This means that that although there was a difference in the overall average scores between
managers and staff of the Lean and Non-Lean group, this difference was not statistically significant
Figure 5. Gap between managers and staff for current state
0
1
2
3
4
5
Non-Lean LeanOve
rall
asse
ssm
ent
sco
re
Lean level
Manager
Staff

47
Figure 6. Gap between managers and staff for desired state
4.3. Section 1: Enterprise Leadership
Scores for this section were determined by calculating the mean for each participant of all 28
practices that compose the enterprise leadership section of the GLESAT. The mean and standard
deviation of the overall score broken down by Lean level, state and job role and the ANOVA results are
presented in table 8 and table 9.
Table 8: Section 1 scores for current and desired state
Section 1 - Current State Section 1 - Desired State
Lean Level Job role Sample Mean (SD) Lean Level Job role Sample Mean (SD)
Non-Lean Manager 11 1.50 (0.52)
Non-Lean Manager 11 3.23 (0.74)
Staff 11 1.74 (0.62) Staff 11 3.53 (0.71)
Lean Manager 10 2.62 (0.40)
Lean Manager 10 3.94 (0.42)
Staff 14 2.40 (0.62) Staff 14 4.06 (0.42)
Table 9. ANOVA results for Lean transformation and leadership section of the GLESAT
Source F Sig. Observed Power
Lean level 41.813 .000* 1.000
State 191.589 .000* 1.000
Job role .950 .333 .161
Lean level * State 1.362 .246 .211
Lean level * Job role 1.914 .170 .277
State * Job role .729 .396 .135
Lean level * State * Job role .389 .534 .095
-1
1
3
5
Non-Lean LeanOve
rall
asse
ssm
en
t sc
ore
Lean level
Manager
Staff

48
Table 9 shows the ANOVA results for the Lean transformation leadership section of the GLESAT
(Section 1). Section 1 scores of the Lean group were higher than the Non-Lean group by 53.7% for the
current state and 18.64% for the desired state. ANOVA results showed that Lean level, F (1, 84) =41.813,
p<0.001, power=1.00 and state F (1, 84) =191.589, p<0.001, power=1.00, were the main significant
effects. However, there was no significant difference in the responses between managers and staff in
section 1 of the GLESAT (job role, F (1, 84) =0.950, p=0.333, power=0.161).
Average results showed a reduction in the gap scores between managers and staff of the Lean
group compared to the Non-Lean group in both current and desired state. For the current state, the gap
score of the Lean group was 8.33% smaller than the Non-Lean group. For the desired state, the gap
score of the Lean group was 60% smaller than the Non-Lean group. However, ANOVA results showed
that the interaction between Lean level and status, F(1,84)=1.362, p=0.246, power=0.211, Lean level and
job F (1,84)=1.914, p=0.170, power=0.77, status and job F (1,84)=0.227, p=0.396, power=0.135 and Lean
level, state, and job, F (1, 84) =0.389, p=0.534, power=0.095, were not a main significant effect. This
means that that although there was a difference in section 1 scores between managers and staff of the
Lean and Non-Lean group, this difference was not statistically significant.
4.4. Section 2: Life Cycle and Enabling Processes
Scores for this section were determined by calculating the mean for each participant of all 19
practices that compose the life cycle and enabling process section of the GLESAT. The mean and
standard deviation of the overall score broken down by Lean level, state and job role and the ANOVA
results are presented in table 10 and table 11.

49
Table 10. Section 2 scores for current and desired state
Section 2 - Current State Section 2 - Desired State
Level Job role Sample Mean (SD) State Job role Sample Mean (SD)
Non-Lean Manager 11 1.74 (0.50)
Non-Lean Manager 11 3.31 (0.73)
Staff 11 1.92 (0.61) Staff 11 3.54 (0.63)
Lean Manager 10 2.25 (0.45)
Lean Manager 10 3.58 (0.54)
Staff 14 2.24 (0.60) Staff 14 3.72 (0.54)
Table 11. ANOVA results for Lean lifecycle process section of the GLESAT
Source F Sig. Observed Power
Lean Level 6.564 .012* .717
State 148.345 .000* 1.000
Job role 1.150 .287 .185
Lean Level * State .553 .459 .114
Lean Level * Job role .325 .570 .087
State * Job role .154 .696 .067
Lean Level * State * Job role .042 .838 .055
Table 11 shows the results for the Lean lifecycle process section of the GLESAT (Section
2).Section 2 scores of the Lean group were higher than the Non-Lean group by 21.86% for the current
state and 6.71% for the desired state. ANOVA Results showed that Lean level, F (1, 84) =6.564, p=0.012,
power=0.717, and state F (1, 84) =148.345, p<0.001, power=1.00 were the main significant effects.
However, there was no significant difference in the responses between managers and staff in section 2
of the GLESAT (job role, F (1, 84) =1.150, p=0.287, power=0.185).
Average results showed a reduction in the gap scores between managers and staff of the Lean
group compared to the Non-Lean group in both current and desired state. For the current state, the gap
score of the Lean group was 94.44% smaller than the Non-Lean group. For the desired state, the gap
score of the Lean group was 39.13% smaller than the Non-Lean group. However, results showed that the
interaction between Lean level and status, F(1,84)=0.553, p=0.459, power=0.114, Lean level and job F
(1,84)=0.325, p=0.570, power=0.087, status and job F (1,84)=0.154, p=0.696, power=0.067 and Lean
level, state, and job, F (1, 84) =0.14, p=0.838, power=0.055, were not a main significant effect. This

50
means that that although there was a difference in section 2 scores between managers and staff of the
Lean and Non-Lean group, this difference was not statistically significant
4.5. Section 3: Enabling Infrastructure
The mean and standard deviation of the overall score broken down by Lean level, state and job
role and the ANOVA results are presented in table 12 and table 13. Scores for this section were
determined by calculating the mean for each participant of all 8 practices that compose the enabling
infrastructure section of the GLESAT.
Table 12. Section 3 for current and desired state
Section 3 - Current State Section 3 - Desired State
Level Job role Sample Mean (SD) State Job role Sample Mean (SD)
Non-Lean Manager 11 1.63 (0.48)
Non-Lean Manager 11 3.22 (0.76)
Staff 11 2.15 (0.81) Staff 11 3.69 (0.70)
Lean Manager 10 2.44 (0.40)
Lean Manager 10 3.81 (0.50)
Staff 14 1.99 (0.48) Staff 14 3.64 (0.50)
Table 13. ANOVA results for the enabling infrastructure section of the GLESAT
Source F Sig. Observed Power
Lean Level 5.211 .005(*) .616
State 138.342 .000(*) 1.000
Job role .514 .476 .109
Lean Level * State .050 .824 .056
Lean Level * Job role 9.478 .003(*) .860
Job role * State .191 .663 .072
Lean Level * Job role * State .427 .515 .099
Table 13 shows the results for the enabling infrastructure section of the GLESAT (Section 3).
Section 3 scores of the Lean group were significantly higher than the Non-Lean group by 15.34% for the
current state and 7.51% for the desired state. ANOVA results showed that Lean level, F (1, 84) =5.211,
p=0.025, power=0.616, and State F (1, 84) =138.342, p<0.001, power=1.00 were the main significant
effects. However, results showed that job role, F (1, 84) =0.514, p=0.476, power=0.109, was not a main
significant effect.

51
Average results showed a reduction in the gap scores between managers and staff of the Lean
group compared to the Non-Lean group in both current and desired state. For the current state, the gap
score of the Lean group was 13.46% smaller than the Non-Lean group. For the desired state, the gap
score of the Lean group was 63.83% smaller than the Non-Lean group. Results showed that the
interaction between Lean level and status, F (1,84)=9.478, p=0.003, power=0.860 was a significant main
effect. However, Lean level and job F (1,84)=0.05, p=0.824, power=0.056, status and job F (1,84)=0.191,
p=0.663, power=0.072, and Lean level, state, and job, F (1, 84) =0.427, p=0.515, power=0.099, were not
a main significant effect.
4.6. Hypothesis Testing
This section includes the hypotheses testing of the null hypotheses and alternative hypotheses
stated in the research methodology section based on the p-values from the ANOVA.
4.6.1 Hypothesis 1
ANOVA results showed that current state scores were influenced by Lean level, p<0.001,
therefore the null hypothesis is rejected. There is a significant difference in the current state scores
between the Non-Lean and Lean group for the overall results and the three sections of the GLESAT.
4.6.2 Hypothesis 2
ANOVA results showed that desired state scores were influenced by Lean level, p<0.001,
therefore the null hypothesis is rejected. There is a significant difference in the desired state scores
between the Non-Lean and Lean group for the overall results and the three sections of the GLESAT.
4.6.3 Hypothesis 3
ANOVA results showed that there was not enough evidence to reject the null hypothesis,
p>0.05. Thus, there is no significant difference in current state scores between managers and staff in the
overall results or any of the sections of the GLESAT.

52
4.6.4 Hypothesis 4
ANOVA results showed that there was not enough evidence to reject the null hypothesis,
p>0.05. Thus, there is no significant difference in desired scores between managers and staff in the
overall results or any of the sections of the GLESAT.
4.6.5 Hypothesis 5
The two way interaction between Lean level and job role provided by the ANOVA showed that
there was not enough evidence to reject the null hypothesis, p>0.05. Thus, the gap scores between
managers and staff do not differ significantly from each other in the non-Lean and Lean groups.
53
5 DISCUSSION AND CONCLUSION
The purpose of this research was to study the association of Lean implementation with
organizational maturity in the public sector. More specifically, the research evaluated the association of
Lean implementation in the levels of agreement and cohesion between managers and staff in evaluating
perceived current state and desired state of organizational practices. Current state refers to the current
performance of the practice assessed. The desired state is designed to represent a realistic and
achievable level of performance of the practice assessed in a timeframe of 1 year (Perkins et al., 2010).
Many authors agree that implementing Lean can improve team interaction and cohesion by
enhancing factors such as team communication, awareness, understanding, innovation and learning
(Schiele & McCue, 2011; Tsasis & Bruce-Barrett, 2008). Team cohesion has important influences on the
ability of teams to perform effectively over time and has a positive effect on team satisfaction and team
viability (Tekleab, Quigley, & Tesluk, 2009). The results of the present study provide empirical data to
discuss the association of lean implementation with improvements on team communication and
awareness and understanding of organizational practices. In the study, participants of the Lean group
expressed during the assessment that Lean has impacted upon tools, practices and behaviors leading to
improved quality and productivity. These outcomes were reflected in the assessment scores where the
Lean group had higher scores than the Non-Lean group on practices that involved process quality, good
organizational communication and improvement of current processes (I.C.3, I.D.3, I.D.7, I.E.2, and I.E.3).
Also, participants mentioned that performance became more visible and accountable by using statistical
information to look at productivity to challenge performance and design new transformation plans with
realistic performance targets. These affirmations were looked at in the assessment scores where the
Lean group had higher scores than the Non-Lean group (I.A, I.E, I.G, II.A, II.C, and II.D). Performance
accountability represents a great improvement from traditional ways of operation in the public sector

54
which in contrast to the private sector, they lack competition and accountability in the services provided
creating high operational cost and poor quality in the services provided(Boyne, 2002).
5.1. GLESAT Results
The first two hypotheses were framed to determine if GLESAT scores for the current and desired
state of the Non-Lean group and the Lean group differ significantly. A three-way ANOVA was performed
at a significance level of α=0.05 for the overall scores obtained for the entire GLESAT. The p-values
obtained helped determining if there were any significant differences between the three variables (Lean
level, state, and job role) and the interaction between them. Results showed a significant difference in
the overall average scores of the assessment for both the current and desired state between the Non-
Lean and Lean program. The overall average score of the Lean group was 41.1% higher than the Non-
Lean group for the current state and by 13.52% for the desired state. The scores for the current state of
the Lean group mean that they have an overall higher maturity than the Non-Lean group on the
assessed practices. This result seems logical as a team that has worked with Lean for a longer period of
time is likely to have more Lean experience leading to higher maturity in their practices. Results for the
desired state indicate that the Lean group has higher expectations to improve their practices when
compared to the Non-Lean group.
The Lean Transformation and Leadership section of the GLESAT (Section 1) assesses the
leadership of an enterprise and their ability to effect a transformation to a Lean enterprise. This means
that this section focuses on practices created and maintained by upper-level management to guide
enterprise leaderships (Nightingale & Mize, 2002). Results showed a significant difference in the overall
average scores of the assessment for both the current and desired state between the Non-Lean and
Lean program. The overall average score of the Lean group was higher by 53.70% than the Non-Lean
group for the current state and by 18.63% for the desired state. The sub-sections with the highest

55
contrast were I.B (Adopt Lean paradigm) and I.E (create and refine implementation plan) with the Lean
group having higher scores by 133% and 53% than the Non-Lean group. This sub sections assess
practices that involve management support, training in Lean, commit resources for Lean and employee
empowerment. These results for the current state could mean that management from the Lean group
does a better job establishing the necessary support and incentives to create a Lean environment than
its counterpart of the Non-Lean group. Results of this section coincide with Barton and Delbridge (2006),
who found that management from companies using a Lean approach take various steps to enhance a
continuous improvement and innovation philosophy where lower level employees are encouraged to
participate in team based problem solving of current practices and the design of new practices for the
company. For the desired state, the results indicate that the Lean group has higher priority and
expectations for improving their practices than the Non-Lean group (Perkins et al., 2010). Higher
expectations in this section could be linked to a high level of commitment from the employees to
implement better strategies and practices that support a Lean environment. Having a high level of
employee commitment is a critical enabler for implementing change strategies as it reduces the
resistance among employees and supports a long term sustainability for the new practices (Pedersen &
Huniche, 2011; Schiele & McCue, 2011). Results for this section also showed a lower standard deviation
in the average scores of the Lean group for both the current and the desired state. This low variability
supports the statement of the previous paragraph about having a better cohesion, understanding, and
agreement in the Lean group in comparison to the Non-Lean group.
The Lean Lifecycle Process section of the GLESAT (Section 2) assesses enterprise level practices
that provide value to the customer and stakeholders (Nightingale & Mize, 2002). The practices in this
section align with the core principles of Lean and its “Customer-centered” philosophy. Results showed a
significant difference in the overall average scores of the assessment for both the current and desired
state between the Non-Lean and Lean program. The overall average score of the Lean group was higher
56
by 21.85% than the Non-Lean group for the current state and by 6.7% for the desired state. The biggest
difference in section 2 scores between the two groups was found on practices that involved
incorporating customer value in the design of product of services (II.C.1, II.C.3, II.D.2, II.D.3, II.E.1) with
more than 40% increase for the Lean group compared to the Non-Lean group. These results for the
current state indicate that the Lean group has a higher enterprise maturity on the processes or services
that provide value to the customers. This result agrees with researchers that support Lean as a
management philosophy that focuses on identifying customer value and managing the value stream to
provide better products or services(Sanjay & Peter, 2006; Teich & Faddoul, 2013; Womack et al., 1990).
Womack et al. (1990) discusses how the Toyota production system has influenced the methods of
production of the modern world by improving business relationship with customers and developing a
process focused on what the customer really wanted. Results for the desired state indicate that the Lean
group has higher priorities or expectations on performance compared to the Non-Lean group. This result
may indicate a higher level of understanding of the importance of improving practices that provide value
to the customer and the commitment to accomplish it.
The Enabling Infrastructure section of the GLESAT (Section 3) contains those Lean practices
pertinent to the enterprise infrastructure necessary to support the implementation of Lean principles,
practices and behavior at both the organizational and process level (Nightingale & Mize, 2002). Results
showed a significant difference in the overall average scores of the assessment for both the current and
desired state between the Non-Lean and Lean program. The overall average score of the Lean group was
higher by 15.34% than the Non-Lean group for the current state and by 7.51% for the desired state.
Practice III.A.1 (Financial system supports Lean transformation) and III.A.3 (Promulgate the learning
organization) had the highest percent difference between the two groups with 42.86% and 25% higher
in the Lean group compared to the Non-Lean group. These results indicate that the Lean group has
better infrastructure in terms of organizational and process enablers that support the leadership and

57
processes of the organization. This result could indicate that the Lean group has implemented a better
strategy for implementing Lean at both the organizational (strategic) and process level. Results for the
desired state showed that the Lean group has higher expectations and priorities in improving the
practices that support this section compared to the Non-Lean group. In a similar way to results for the
current state in this section, higher results for the desired state could be due to higher support and
commitment of upper management to deploy a better strategy and resources to implement a Lean
culture compared to the Non-Lean group.
The third and fourth hypotheses were framed to determine if perceived current organizational
maturity and desired Lean state between managers and staff differed significantly. Results showed that
there was no significant difference in the current state or desired state results between managers and
staff in the overall scores or any of the sections of the GLESAT. Despite the non-significance of the
results, staff had higher scores than managers in the Non-Lean group for the overall scores and the
three sections of the GLESAT when assessing both the current state and desired state of their program.
In the Lean group, the difference varied between the current and the desired state. For the current
state, managers had higher scores than staff in the overall scores and each of the three sections. This
could be interpreted as managers being more optimistic than staff of current practices being
implemented in the program (Perkins et al., 2010). For the desired state, managers had lower scores
than staff in the overall scores and each of the sections. Like the conclusion drawn for the Non-Lean
group, this result could mean that the staff group is more optimistic about their capabilities to improve
their current practices in the future.
The fifth hypothesis of the study was framed to check the association of Lean implementation
with a reduction of the gap scores of the assessment between managers and staff. Results showed that
even though the Lean group had a smaller gap in the scores between managers and staff compared to

58
the Non-Lean group, the reduction was not significant. This means that no conclusive remark could be
made based on the results. Results also showed a lower standard deviation for the overall results in the
Lean group for both the current state and the desired state compared to the Non-Lean. This could mean
that Lean implementation resulted in higher cohesion, understanding and agreement between
participants of the Lean group. Perkins et al. (2010) attributes low levels of variance to strong cohesion,
communication and cooperation across organizational boundaries while high levels of variance are
attributed to lack of training, education, knowledge and understanding of the practices. Those factors
can introduce a better overall understanding of the processes that lead the organization creating more
awareness of current practices and expectations for improvement.
5.2. Barriers of Implementation
Different authors found in the literature have identified different barriers for the
implementation of Lean. Some of the most common barriers include lack of management support,
employee resistance, and organizational culture (Achanga et al., 2006; Pedersen & Huniche, 2011;
Schiele & McCue, 2011). The present study asked participants in the demographics section to identify
barriers of implementation of Lean initiatives. The survey identified four barriers and had an empty cell
to identify any other barrier not listed that the participants perceived as a barrier. The four barriers
listed included: Lack of management support, lack of training, lack of communication, lack of strategy,
and poor organizational culture towards improvement. In addition to the barriers listed, participants
identified employee resistance and understaffing as barriers of Lean implementation. Results shown in
table 14 list the barriers identified by managers and staff from the Lean group. The Non-Lean group
didn’t identify any barriers due to their lack of knowledge about the topic.

59
Table 14. Barriers of Lean implementation
Barrier Manager (n=10) Staff (n=14)
Lack of management support 2 9
Lack of training 4 6
Lack of communication 3 4
Lack of strategy 3 4
Poor organizational culture towards improvement 7 1
Results obtained in the present study show a different perspective from other studies found in
the literature. Although different research has identified barriers of Lean implementation (Achanga et
al., 2006; Pedersen & Huniche, 2011; Schiele & McCue, 2011), none of the literature found classified the
responses by the job role of the participants to identify any relation between responses and job roles.
Lack of training, communication and strategy were identified by both managers and staff with a similar
number of responses. This result supports the research performed by Sanjay and Peter (2006), which
found lack of direction, lack of planning, and a lack of adequate project sequencing as the major
difficulties encountered by companies attempting to apply Lean. However, responses for management
support and organizational culture had contrasting results between managers and staff. A low number
of managers (2) identified management support as a barrier compared to 9 identified by staff. Poor
organizational culture was identified by 7 managers as a barrier while only 1 of the staff considered it a
barrier. Although there is no specific guide for Lean implementation, these barriers can be minimized
designing a good implementation strategy providing good communication across the value chain,
training, and incorporating both staff and the customer on the design phase of transformation (Sanjay &
Peter, 2006)

60
5.3. Limitations
The following were potential limitations associated with the study:
1. Lean knowledge: Some of the participants identified the assessment tool as being “non-
friendly”. Although a glossary of terms and proper guidance was provided to the participants
during the study, some participants found some of the practices to be confusing and hard to
understand. This behavior was mostly found in the Non-Lean group. The reason could be related
to the lack of understanding and knowledge of terminology associated to Lean. This lack of
knowledge was identified by the participants in the demographics section. For the Non-Lean
group, 5 participants rated themselves as having no knowledge of Lean, 10 participants rated
themselves as having poor knowledge, 6 as moderate knowledge, and 1 participant as having
good knowledge of Lean. For the Lean group, 1 participant rated himself as having poor
knowledge, 15 participants rated themselves as having moderate knowledge, 8 participants
rated themselves as having very good knowledge, and 1 participant rated himself as having
excellent knowledge of Lean. These results link the lack of understanding of the assessment tool
with poor knowledge of Lean. As a consequence, the final results may have been affected for
some practices.
2. Different internal variables between programs: The study was performed in two different
programs. Although the two programs are under the same office, each perform different
activities, has a different size, program management, resources and a different organizational
structure. All these variables may affect the results of the study as different organizational
culture may affect the way a person perceives the current performance and motivation for
improvement.
3. Motivation: Lack of motivation is a factor that may have affected the results of the assessment.
Although upper management encouraged the participants to perform the assessment, some of

61
the participants may have not been motivated or willing to take the assessment seriously to
properly identify the current practices. Abdimomunova and Valerdi (2010) found that
organizational culture and behaviors during the assessment process may impact the assessment
results. For future research it would be appropriate to schedule an introduction session for the
participants where management along with the facilitator introduces the benefits of the
assessment to enhance the motivation and positive behavior towards the assessment.
5.4. Future Research
Based on the limitations, this study suggests few ideas for future research. Following are
propositions that can be set as a base for future studies:
1. Future research can be based on a longitudinal study that assesses the current and desired state
of the program before and after implementation. The same variables and research questions
used in the present research could be studied: maturity level, desired state and gap reduction. A
longitudinal study would eliminate or decrease the effect of variables such as program
management, functions, and structure that could have affected the results of the present study.
2. Other assessment tools could be reviewed and tested on participants to provide feedback on
their understanding and ease of use of the tools. Testing other assessments could provide
feedback for the development of more friendly assessments that would be easier for the
participants to respond providing higher accuracy in the responses.
3. The present research could be introduced to other industries to study if the results may vary
depending on the industry where Lean is implemented. Although Lean is becoming very popular
among the public sector, there are still many gaps on strategies for its implementation. For
instance, it would be interesting to find out if Lean implementation has different results in

62
industries where there are more formal strategies for its implementation at both the strategic
and process level.
5.5. Recommendations
A three-dimensional analysis was performed for the scores of each practice of the GLESAT for
the Non-Lean and the Lean group across three dimensions: current state performance, variance and gap
between current and desired state scores. This analysis uses the criteria developed by the Lean
Advancement Initiative (LAI) during the use of the LESAT to assess functional units (Perkins et al., 2010).
Table 15 shows the criteria and interpretation used to evaluate the scores of each practice of the
GLESAT for the Non-Lean. The score range of each variable was set using the average value of the
variable across all assessed practices in the Non-Lean group. For the current state, values below the
score range are weak areas that need to be improved while a value above the score range indicate a
strong practice that could be maintained or improved if needed. Variance scores above the score range
indicate high disagreement between the members of the organization regarding their perception of the
current state of the practice. Low variance scores indicate strong agreement in the perceived current
state of the practice assessed. Gap results are the difference between the current and desired state of
the practice. High gap scores indicate a big difference between where participants perceive they are and
where they want to be. Those practices are a potential opportunity for improvement with strong
support of the employees. Practices with low gap scores have perceived good performance or are low
priority for the employee. Appendix 7.9 shows an analysis of each practice with a generic
recommendation for further steps.

63
Table 15. Three-dimensional analysis criteria table for the Non-Lean group. Source: modified from (Perkins et al., 2010)
Metric Level Score range
Interpretation Recommendation
Current State High ≥ 1.72 Strongest areas Maintain or improve
Low < 1.72 Weakest areas Improve
Variance High ≥ 0.78 More disagreement. Need for training/education Education needed
Low < 0.78 Strong agreement No education needed
Gap High ≥ 1.68
Opportunity to close the gap through Lean improvement Take action
Low < 1.68 Opportunity to raise expectations or accept as is No action
To highlight areas for potential improvement, results of the current state and gap of each
practice were displayed on a scatter plot mapping the practices into the categories of a SWOT
(Strengths, Weaknesses, Opportunities, and Threats) analysis (Figure 7) and listed on a table for further
discussion (appendix 7.10). The horizontal axis represents the current state of each practice while the
vertical axis represents the gap score of each practice.
Figure 7. Mapping GLESAT scores of the Non-Lean group to SWOT analysis

64
For the Non-Lean group, the distribution of practices into the SWOT categories was as follows:
Strength: 22 practices
Weakness: 12 practices
Opportunity: 7 practices
Threat (High priority): 14 practices
Practices with high current state score and low gap score are considered as strengths of the
organization. The high scores of the current state indicate that the organization has been doing a good
job in this area while the low gap score indicate that the organization is satisfied with the performance
of this practice. Practices with both low current state and low gap scores can be interpreted as
weaknesses. The low current state scores indicate deficient practices that could be improved while the
low gap score indicate that these practices are not considered as high priority. The low gap score could
due to lack of understanding of the practice. Practices falling into this group should be addressed
through education and training for the employees to gain understanding of the potential benefits of
improving the practice and reduce resistance towards this change. Practices falling into the
Opportunities category have a combination of high current performance and high gap scores. This
indicates that although progress has been achieved in the improvement of this practice, the
organization has high aspirations with regards to the assessed practice. For instance, it is likely that
improvement of these practices will have a strong commitment from members of the organization.
Practices with low current state level and high gap level are underperforming practices within the
organization. These practices should be of high priority to the organization for improvement. The low
current state score indicates that the organization was either unaware of the practice or have not paid
good attention on the performance of it while the high gap score might suggest that there is a
realization about the important role that this practice has in the organization as well as potential gains

65
from improving it. Table 16 shows the 14 practices that are considered as high priority and should be
addressed in the short term.
Table 16. High priority practices for the Non-Lean group
Threat (High Priority) Practices
I.A.1. Integration of lean in strategic planning process
I.B.2. Senior management commitment
I.B.3 Lean Enterprise Vision
I.B.4. A sense of urgency
I.D.2. Relationships based on mutual trust
I.D.4. Employee empowerment
I.D.7. Lean change agents
I.E.2. Commit resources for lean improvements
I.E.3. Provide education and training
I.F.2. Tracking detailed implementation
I.G.3. Nurturing the process
I.G.5. Impacting enterprise strategic planning
II.D.2. Foster lean behavior throughout the value stream
III.A.3. Promulgate the learning organization
The majority of the practices listed are part of the Lean transformation and leadership section of
the GLESAT. These practices are related to the strategic level of the organization involving areas related
to the culture of the organization and transformational planning for change. Further discussion of these
practices should take place to design a transformational plan for implementation of Lean initiatives. It is
recommended that a Lean specialist is included in the design phase of a new transformation plan to help
identify best approaches and tools to use during the implementation of phase of Lean. In addition,
continuous training should take place in the organization to introduce the benefits of Lean and start
developing a new organizational culture supportive of process improvement.
For the Lean group, an analysis of each practice independently with a generic recommendation
for further steps was performed (appendix 7.10). Different values were used to set the score ranges

66
since this group had higher overall scores than the Non-Lean group. The score range of each variable
was set using the average value of the variable across all assessed practices in the Lean group (Table 17).
Table 17. Three-dimensional analysis criteria table for the Lean group. Source: modified from (Perkins et al., 2010)
Metric Level Score range
Interpretation Recommendation
Current State High ≥ 2.35 Strongest areas Maintain or improve
Low < 2.35 Weakest areas Improve
Variance High ≥ 0.79 More disagreement. Need for training/education Education needed
Low < 0.79 Strong agreement No education needed
Gap High ≥ 1.50
Opportunity to close the gap through Lean improvement Take action
Low < 1.50 Opportunity to raise expectations or accept as is No action
Results of the current state and gap of each practice were displayed on a scatter plot mapping
the practices into the categories of a SWOT (Strengths, Weaknesses, Opportunities, and Threats)
analysis (Figure 8) and listed on a table for further discussion (appendix 7.10).
Figure 8. Mapping GLESAT scores of the Lean group to SWOT analysis

67
For the Non-Lean group, the distribution of practices into the SWOT categories was as follows:
Strength: 16 practices
Weakness: 13 practices
Opportunity: 16 practices
Threat (High priority): 10 practices
Table 18 shows the 10 practices that are considered as high priority and should be addressed in
the short term.
Table 18. High priority practices for the Lean group
High Priority Areas
I.D.5. Incentive alignment
I.D.6. Innovation encouragement
I.D.7. Lean change agents
I.E.3. Provide education and training
I.G.4. Capturing lessons learned
II.C.5. Create a multidisciplinary approach
II.D.4. Transition product/service in a lean fashion
II.E.2. Provide post delivery service, support and sustainability
II.E.3. Maintain challenge of existing processes
III.A.2. Enterprise stakeholders pull required financial information
The Lean group showed a similar distribution for high priority practices between section 1 and 2
of the GLESAT as the non-Lean group. By focusing on transformation exercises on the listed practices,
the organization can have substantial gain identifying opportunities for improvement with a strong level
of support. Training plays a critical role in the implementation phase and sustainability of Lean. It is

68
recommended that the program continues introducing and training the tools and benefits of Lean to its
members to continue improving the functions of the program.
5.6. Outcomes
1. The Lean group had an overall higher organizational maturity compared to the Non-Lean
group. Results of the GLESAT showed that the Lean group had higher overall scores in all
practices for both the current and the desired state.
2. Results showed that there was no difference in responses between managers and staff
for either the Lean or Non-Lean group. This means that the responses of the participants
in the assessment were not affected by the job role of participants.
3. Several barriers to Lean implementation were identified including lack of management
support, lack of training, lack of communication, lack of strategy, poor organizational
culture, employee resistance and understaffing as barriers of Lean implementation.
These barriers match previous research that identified them as critical factors for the
implementation and sustainability of Lean in the long term.
4. High priority practices were identified for both the Lean and the Non-Lean group. The
Non-Lean group had 14 high priority practices while the Lean group had 10. These
practices should be improved in the short term.
5.7. Conclusion
The present research sought to study the association of Lean implementation to the
improvement of various factors that are part of the strategic level of an organization. Most authors
agree that the implementation of Lean can bring a positive impact at the process level of an organization
in terms of quality, processing time and cost of the services or products provided. However, there are
different points of view of how Lean implementation affects the strategic level of an organization. Some

69
authors suggest that the Lean can increase employee understanding, interaction and behaviors in a
positive way while some others suggest the opposite associating Lean to a Tayloristic approach that
reduces employee morale and skill utilization. The current study examined the association of Lean with
perceived organizational maturity by comparing the assessment scores between the two groups: Lean
and Non-Lean. The Lean group had an overall higher organizational maturity compared to the Non-Lean
group. These results are encouraging for public sector organizations that plan on implementing Lean to
their programs as good organizational maturity is not only a good indicator that the organization is
adopting best practices in the way services are delivered but it also plays an important role in the
culture of the organization and their behavior towards change. Second, the present study sought to find
the association of Lean implementation to an increase in understanding, communication, and cohesion
between managers and staff. Results showed that there was no statistical difference in the gap scores of
managers and staff of the Lean group compared to the Non-Lean group.
The barriers of Lean implementation found in this research include lack of management support,
lack of training, lack of communication, lack of strategy, poor organizational culture, employee
resistance and understaffing as barriers of Lean implementation. These findings coincide with other
studies found in the literature (Achanga et al., 2006; Pedersen & Huniche, 2011). An interesting finding
was the high contrast found in barriers that involved the role of the participant (e.g. low response rate
for staff identifying employee resistance as a barrier or low response rate of managers identifying
management support as a barrier).
Finally, an analysis of individual practices of the GLESAT was provided. Results of the analysis
should be used as a starting point for managers to identify weaknesses and strengths of the organization
as well as possibilities for improvement. Practices identified as priorities and opportunities should be
addressed in the short term discussing openly with the members of the organization the current

70
situation to find possible solutions for improvement. Looking at individual practices of the GLESAT, the
Lean group outscored the Non-Lean group by more than 100% difference in practices such as sense of
urgency for change, understanding the current value stream, integration of a strategic planning process,
and senior management commitment. These findings provide a good indication that Lean
implementation can have a positive impact in the public sector not only at the process level but also at
the strategic level by improving organizational maturity, awareness of current practices, and a sense of
urgency to improve current practices. The improvement of those factors can reduce the resistance to
change, motivate employees to improve performance and enable a better development and
implementation of a transformation plan to improve the way the public sector operates. In addition, it is
important that managers provide continuous training and communication among all levels of employees
to assure that a culture of continuous improvement prevails in the long term.

71
6 REFERENCES
1. Abdimomunova, Leyla, & Valerdi, Ricardo. (2010). An organizational assessment process in support of enterprise transformation. Information, Knowledge, Systems Management, 9(3), 175-195. doi: 10.3233/iks-2010-0165
2. Achanga, Pius, Shehab, Esam, Roy, Rajkumar, & Nelder, Geoff. (2006). Critical success factors for lean implementation within SMEs. Journal of Manufacturing Technology Management, 17(4), 460-471.
3. Armenakis. (1993). Creating Readiness for Organizational Change. Human Relations, 46(6), 681-703. doi: 10.1177/001872679304600601
4. Armenakis, & Bedeian. (1999). Organizational Change: A Review of Theory and Research in the 1990s. Journal of Management, 25(3), 293-315.
5. Bandura, Albert. (1982). Self-efficacy mechanism in human agency. American psychologist, 37(2), 122.
6. Barton, Harry, & Delbridge, Rick. (2006). Delivering the "learning factory"? Evidence on HR roles in contemporary manufacturing. Journal of European Industrial Training, 30(5), 385-395.
7. Bhatia, Nina, & Drew, John. (2006). Applying lean production to the public sector. The McKinsey Quarterly, 3(1), 97-98.
8. Boyne, George A. (2002). Public and private management: what's the difference? Journal of Management Studies, 39(1), 97-122.
9. Bozeman, Barry, & Kingsley, Gordon. (1998). Risk culture in public and private organizations. Public Administration Review, 109-118.
10. Bright, Leonard. (2009). Why do public employees desire intrinsic nonmonetary opportunities? Public Personnel Management, 38(3), 15-37.
11. Cagliano, Raffaella, Caniato, Federico, & Spina, Gianluca. (2006). The linkage between supply chain integration and manufacturing improvement programmes. International Journal of Operations & Production Management, 26(3), 282-299.
12. Carlino, Andy, & Flinchbaugh, Jamie. (2005). The hitchhiker's guide to lean (1 ed.): Society of Manufacturing Engineers.
13. Carter, Bob, Danford, Andy, Howcroft, Debra, Richardson, Helen, Smith, Andrew, & Taylor, Phil. (2011). 'All they lack is a chain': lean and the new performance management in the British civil service. New Technology, Work & Employment, 26(2), 83-97. doi: 10.1111/j.1468-005X.2011.00261.x

72
14. Corbett, Stephen. (2007). Beyond manufacturing: The evolution of lean production. McKinsey Quarterly(3), 94-96.
15. Dixit, Avinash. (2002). Incentives and Organizations in the Public Sector: An Interpretative Review. Journal of Human Resources, 37(4), 696-727.
16. Doolen. (2005). A Review of Lean Assessment in Organizations: An Exploratory Study of Lean Practices by Electronics Manufacturers.
17. Drew, John, McCallum, Blair, & Roggenhofer, Stefan. (2004). Journey to lean: making operational change stick: Palgrave Macmillan.
18. Emiliani, ML. (2006). Origins of lean management in America: the role of Connecticut businesses. Journal of Management History, 12(2), 167-184.
19. Furterer, Sandra, & Elshennawy, Ahmad K. (2005). Implementation of TQM and lean Six Sigma tools in local government: a framework and a case study. Total Quality Management & Business Excellence, 16(10), 1179-1191. doi: 10.1080/14783360500236379
20. Gebre, Hallman, Minukas, & O'Brien. (2012). Transforming government performance through lean management. McKinsey Center for Government.
21. Harbour, R. (2001). It's not easy being Lean. Automotive Industries, 11, 5-18.
22. Hardy, Cynthia, & Phillips, Nelson. (1998). Strategies of Engagement: Lessons from the Critical Examination of Collaboration and Conflict in an Interorganizational Domain. Organization Science, 9(2), 217-230.
23. Harrison, Bennett. (1997). Lean and mean: The changing landscape of corporate power in the age of flexibility: Guilford Press.
24. Hilger, Dennis. (2010). Management by performance: evolution, current development and challenges of public performance management. International Journal of Business Research, 10(5), 40-55.
25. Hines, Peter, Found, Pauline, Griffiths, Gary, & Harrison, Richard. (2008). Staying Lean: Thriving. Not Just Surviving, Lean Enterprise Research Centre, Cardiff.
26. Hines, Peter, Holwe, Matthias, & Rich, Nick. (2004). Learning to evolve: A review of contemporary lean thinking. International Journal of Operations & Production Management, 24(10), 994-1011. doi: 10.1108/01443570410558049
27. Holzer, M., Charbonneau, E., & Kim, Y. (2009). Mapping the terrain of public service quality improvement: twenty-five years of trends and practices in the United States International review of administrative sciences, 75, 403-418.
28. Höök, Matilda, & Stehn, Lars. (2008). Lean principles in industrialized housing production: the need for a cultural change. Lean Construction Journal, 20-33.

73
29. Humbert, E, Mesia, R, & Griffin, T. (2012). Senior leadership and middle management impact on lean enterprise initiatives. International handbook of academic research and teaching, 9.
30. Janssen, Marijn, & Estevez, Elsa. (2013). Lean government and platform-based governance—Doing more with less. Government Information Quarterly, 30, Supplement 1(0), S1-S8. doi: http://dx.doi.org/10.1016/j.giq.2012.11.003
31. Jones, Renae A., Jimmieson, Nerina L., & Griffiths, Andrew. (2005). The Impact of Organizational Culture and Reshaping Capabilities on Change Implementation Success: The Mediating Role of Readiness for Change. Journal of Management Studies, 42(2), 361-386. doi: 10.1111/j.1467-6486.2005.00500.x
32. Jordan, Mark H., Lindsay, Douglas R., & Schraeder, Mike. (2012). An Examination of Salient, Non-Monetary, Factors Influencing Performance in Public Sector Organizations: A Conceptual Model. Public Personnel Management, 41(4), 661-684.
33. Jorgensen, Frances, Matthiesen, Rikke, Nielsen, Jacob, & Johansen, John. (2007). Lean maturity, lean sustainability. Advances in Production Management Systems, 371-378.
34. Lan, Zhiyong, & Rainey, Hal G. (1992). Goals, Rules, and Effectiveness in Public, Private, and Hybrid Organizations: More Evidence on Frequent Assertions about Differences. Journal of Public Administration Research and Theory: J-PART(1), 5. doi: 10.2307/1181868
35. Liker, Jeffrey K. (2004). The toyota way: Esensi.
36. Losonci, Dávid, Demeter, Krisztina, & Jenei, István. (2011). Factors influencing employee perceptions in lean transformations. International Journal of Production Economics, 131(1), 30-43. doi: 10.1016/j.ijpe.2010.12.022
37. Louisiana Department of Health and hospitals. (2013). OPH 2013 Business Plan. from http://www.dhh.louisiana.gov/index.cfm/page/1193/n/288
38. Maleyeff, John, & Campus, Hartford. (2007). Improving service delivery in government with lean six sigma: IBM Center for the Business of Government Washington, DC.
39. Melton, Trish. (2005). The benefits of lean manufacturing: What lean thinking has to offer the process industries. Chemical Engineering Research and Design, 83(6), 662-673.
40. Miller, Ken. (2009). The Promise of Going 'Lean': it's The Latest, Buzziest Trend in Government Management. Just Don't Call it a Fad. Government, 21.
41. Nightingale. (2009). Principles of enterprise systems. Paper presented at the International Symposium on Engineering Systems, MIT, Cambridge, MA.
42. Nightingale, & Mize, Joe (2002). Development of a lean enterprise transformation maturity model. Information, Knowledge, Systems Management, 3(1), 15-30.
43. Nightingale, & Rhodes, Donna (2004). Enterprise systems architecting: Emerging art and science within engineering systems. Paper presented at the Proceedings of the ESD External Symposium.

74
44. Parker, Sharon K. (2003). Longitudinal effects of lean production on employee outcomes and the mediating role of work characteristics. Journal of Applied Psychology, 88(4), 620-634. doi: 10.1037/0021-9010.88.4.620
45. Pedersen, Esben Rahbek Gjerdrum, & Huniche, Mahad. (2011). Determinants of lean success and failure in the Danish public sector: A negotiated order perspective. International Journal of Public Sector Management, 24(5), 403-420.
46. Perkins, L Nathan, Abdimomunova, Leyla, Valerdi, Ricardo, Shields, Tom, & Nightingale, Deborah. (2010). Insights from enterprise assessment: How to analyze LESAT results for enterprise transformation. Information, Knowledge, Systems Management, 9(3), 153-174. doi: 10.3233/iks-2010-0164
47. Radnor. (2010). Transferring Lean into government. Journal of Manufacturing Technology Management, 21(3), 411-428. doi: 10.1108/17410381011024368
48. Radnor, & Boaden. (2008). Editorial: Lean in Public Services;Panacea or Paradox? Public Money; Management, 28(1), 3-8.
49. Radnor, Holweg, & Waring. (2012). Lean in healthcare: The unfilled promise? Social Science and Medicine, 74(3), 364-371. doi: 10.1016/j.socscimed.2011.02.011
50. Sánchez, González, Gómez, Campos, Bolea, González, Arjona, Hidalgo, & Ceballos, Sánchez. (2012). Diseño de un modelo para implantar LEAN con éxito [Design to implement a Lean model successfully] Paper presented at the 6th International Conference on Industrial Engineering and Industrial Management.
51. Sanjay, Bhasin, & Peter, Burcher. (2006). Lean viewed as a philosophy. Journal of Manufacturing Technology Management, 17(1), 56-72.
52. Schein, Edgar H. (2004). Organizational culture and leadership (3rd ed.): San Francisco : Jossey-Bass, 2004.
53. Scherrer-Rathje, Maike, Boyle, Todd A., & Deflorin, Patricia. (2009). Lean, take two! Reflections from the second attempt at lean implementation. Business Horizons, 52(1), 79-88. doi: 10.1016/j.bushor.2008.08.004
54. Schiele, Joseph J., & McCue, Clifford P. (2011). Lean thinking and its implications for public procurement: moving forward with assessment and implementation. Journal of Public Procurement, 11(2), 206-239.
55. Scorsone. (2005). What are the Challenges in Transferring Lean Thinking to Government? doi: 10.1111/j.1467-9302.2008.00621.x
56. Smelser, Neil J. (1951). Theory of collective behavior. Public Opinion Quarterly, 15, 532-546.
57. Soriano-Meier, Horacio, & Forrester, Paul L. (2002). A model for evaluating the degree of leanness of manufacturing firms. Integrated Manufacturing Systems, 13(2), 104.

75
58. Taj, Shahram. (2005). Applying lean assessment tools in Chinese hi-tech industries. Management Decision, 43(4), 628-643. doi: 10.1108/00251740510593594
59. Teich, Sorin T., & Faddoul, Fady F. (2013). Lean Management--The Journey from Toyota to Healthcare. Rambam Maimonides Medical Journal, 4(2), 1-9. doi: 10.5041/RMMJ.10107
60. Tekleab, Amanuel G., Quigley, Narda R., & Tesluk, Paul E. (2009). A Longitudinal Study of Team Conflict, Conflict Management, Cohesion, and Team Effectiveness. Group & Organization Management, 34(2), 170-205.
61. Thai, Khi V. (2001). Public procurement re-examined. Journal of Public Procurement, 1(1), 9-50.
62. Tsasis, Peter, & Bruce-Barrett, Cindy. (2008). Organizational change through lean thinking. Health Services Management Research, 21(3), 192-198.
63. Tsung-Ming, Yang, & Chao-Ton, Su. (2007). Application of hoshin kanri for productivity improvement in a semiconductor manufacturing company. Journal of Manufacturing Technology Management, 18(6), 761-775.
64. Van de Ven, Andrew H, & Ferry, Diane L. (1980). Measuring and assessing organizations: Wiley New York.
65. Verbeeten, Frank H. M. (2008). Performance management practices in public sector organizations. Accounting, Auditing & Accountability Journal, 21(3), 427.
66. Wang, Yaqian, & Huzzard, Tony. (2011). The impact of lean thinking on organizational learning. Paper presented at the OLKC 2011–Making Waves, Conference Proceedings, Hull University Business School.
67. Waterman, Jason, & McCue, Clifford. (2012). Lean thinking within public sector purchasing department: the case of the u.k public service. Journal of Public Procurement, 12(4), 505-527.
68. Womack, James P, Jones, Daniel T, & Roos, Daniel. (1990). The machine that changed the world: The story of lean production. Rawson Association, USA.
69. Womack, James P, & Jones, DT. (2003). Banish waste and create wealth in your corporation: New York: Free Press.
70. Zhonghua, Cai, & Ye, Wang. (2012). Research Frontiers in Public Sector Performance Measurement. Physics Procedia, 25, 793-799. doi: 10.1016/j.phpro.2012.03.159

76
APPENDIX A: LSU IRB APPROVAL

77
APPENDIX B: CONSENT FORM
Study Title: Association of Lean implementation on perceived organizational maturity levels of
managers and staff in the public sector
Performance site:
Investigators:
Laura Ikuma, Ph.D. ([email protected]) (225)578-5364, LSU, 2156 Patrick F. Taylor Hall
Patrick O’Mara ([email protected]) 225-249-2845
Purpose of the study: The present research project has the following purposes:
1. To identify the existence of a significant gap in the perceived current Lean maturity level and
desired Lean state between managers and staff in the public sector.
2. To analyze whether the implementation of Lean tools and initiatives is associated on reducing
the gap of perceived maturity level and desired Lean state.
Participants: Program functional management levels including program executive leadership, directors,
office management and non-managerial employees that are critical in the process of implementing
improvement initiatives.
Number of participants: 15-30 per participating program. 90-180 for the entire study
Study Procedure: After reading this consent form, a verbal explanation of the purpose and procedure of
the experiment will be given. If you agree with the terms of participation, you will sign the consent form.
You will be asked to fill two types of survey. Before starting the assessment, you will need to read the
instructions on how to properly fill these surveys. The first survey (GLESAT) is intended to be a self-
assessment of the perceived present state and the readiness for change of the organization helping to
determine the extent to which Lean principles, practices, and behavior have become parts of the
organization. Each question or practice is assessed on a capability maturity scale of 1 to 5 where level 1
is the lowest or minimal awareness of the practice and 5 is a world-class or recognized best practice. The
second survey is an 8 question demographic survey that asks for information about the participant and
is used for data grouping purposes. The assessment process is designed to last from 45 to 60 minutes.
Benefits and Compensation: There are no direct benefits or compensation for participation. However,
by participating in this study you will be helping a graduate student to fulfill his graduation requirements
and greatly contributing to understanding the impact of implementing Lean tools and principles at the
strategic level of an organization.
Risks/Discomfort: There are no risks associated with this experiment.

78
Right to Refuse: Your participation in the study is completely voluntary and you may refuse to answer
any question if you are not comfortable with it. You can stop participating in the study at any time and
for any reason if you so decide.
Privacy: All information you supply during the research will be held in confidence and your name will not
appear in any report or publication of the research. Your name and program name will be deleted from
all information of the consolidated raw data breaking any link between the response and the name of
the person with the original response.
Signatures: This study has been approved by the LSU institutional review board (IRB) and their contact
information can be found on the following page. By signing below, you state that you have read and
understood the idea and purpose of this survey and voluntarily give your consent to participating in it.
This sheet with your signature will be separated from the actual survey to protect your identity.
Note the following page as it contains the contact information of the IRB and Principal Investigators.
Signature:____________________ Date:_________________
THANK YOU FOR YOUR PARTICIPATION!

79
APPENDIX C: RECRUITMENT EMAIL TEXT
Program Manager Recruitment Text
My name is Patrick O’Mara, graduate student from the Mechanical and Industrial Engineering
Department at LSU. I am conducting research which involves employees of OPH programs that take part
in improvement initiatives. I would be very grateful if you could participate in my study by agreeing to
complete a 55 question survey designed to last 30 to 45 minutes. To minimize any inconvenience to
your workday, I can schedule this survey any time and visit you personally to give the survey. To
participate, please email me at [email protected] with your phone number, available date and
time to perform the study and the name of an assistant that can help me coordinate the study.…
I selected your program from a list provided by OPH executives of programs that are implementing or
have implemented process improvement initiatives. The purpose of the study is to compare the
perceived current maturity level and desired Lean state of the program between managers and critical
staff. The results of the survey can be used to identify the gaps between them that may affect the
performance of the program and the association of Lean initiatives on those gaps. This study has been
approved by the LSU institutional review board (IRB). All information provided during the research will
be held in confidence and the program name or participant’s name will not appear in any report or
publication of the research.
A benefit of participating in this study is that you can request a SWOT (Strengths, weaknesses,
opportunities and threats) analysis of your program developed by the author of the research to identify
the weaknesses and strengths of your program and identify potential areas for improvement if you
agree to do so. In addition, the results of the study will benefit public sector institutions that plan
process improvement initiatives by providing knowledge of 1) the impact of such initiatives on the
employees’ maturity level and 2) how the initiatives may align their priorities and values to have better
performance in achieving a common goal. Last, participating in this study will help me fulfill my
graduation requirements.
If you agree to participate, please respond to this email ([email protected]) with your phone
number, available dates and times to perform the study and the name of an assistant that can help me
coordinate the study (if necessary). Again, I would like to thank you in advance for your time and
consideration.
If you have any questions or concerns about the study you are free to contact me or my supervisor, Dr.
Laura Ikuma at [email protected].
Thank you so much,

80
Participant Recruitment Email Text
Hello!
My name is Patrick O’Mara, graduate student from the Mechanical and Industrial Engineering
Department at LSU. I am conducting research which involves employees of OPH programs that take part
in improvement initiatives. I would be very grateful if you could participate in my study by agreeing to
complete a 55 question survey designed to last 30 to 45 minutes. To minimize any inconvenience to
your workday, I can schedule this survey any time and visit you personally to give the survey. To
participate, please email me at [email protected] with your phone number and possible dates
and times to perform the study.
The purpose of the study is to compare the perceived current maturity level and desired Lean state of
the program between managers and critical staff. The results of the survey can be used to identify the
gaps between them that may affect the performance of the program and the association of Lean
initiatives on those gaps. This study has been approved by the LSU institutional review board (IRB). All
information provided during the research will be held in confidence and the program name or
participant’s name will not appear in any report or publication of the research.
The results of the study will benefit public sector institutions that plan process improvement initiatives
by providing knowledge of 1) the impact of such initiatives on the employees’ maturity level and 2) how
the initiatives may align their priorities and values to have better performance in achieving a common
goal. Last, participating in this study will help me fulfill my graduation requirements.
If you agree to participate, please respond to this email ([email protected]) with your phone
number and available date and time to perform the study. Again, I would like to thank you in advance
for your time and consideration.
If you have any questions you are free to contact me or my supervisor, Dr. Laura Ikuma at
Thank you so much.

81
APPENDIX D: DEMOGRAPHICS QUESTIONNAIRE
Part I. Demographic information
Instructions: Please answer the following questions. These questions are for data grouping
purposes and the information obtained will remain anonymous. We appreciate your answers on
all questions, but you may skip any questions you do not wish to answer.
Question Answer
1. What program do you
currently work for?
2. Years working in the
program
a. 0-2 years
b. 2-5 years
c. 5-10 years
d. 10+ years
3. What is your role in the
program?
a. Non-Supervisor: You do not
supervise other employees.
b. Supervisor: You are responsible for
employees´ performance appraisals and
approval of their leave, but you do not
supervise other supervisors.
c. Manager: You are in management
position and supervise one or more
supervisors.
d. Executive: Member of the Senior
Executive Service or equivalent.
4. Years of experience in
private sector?
a. 0-2 years
b. 2-5 years
c. 5-10 years
d. 10+ years
5. Years of experience in the
public sector
a. 0-2 years
b. 2-5 years
c. 5-10 years
d. 10+ years
6. How would you rate your
familiarity with Lean tools
and techniques?
a. No knowledge
b. Poor
c. Moderate
d. Very Good
e. Excellent

82
(Appendix D continued)
Question Answer
7. What percent of your time
do you spend working on
Lean six sigma (Process
improvement) projects
8. How many Lean projects
have you been involved in?
a. 0
b. 1
c. 2
d. 3
e. 4
f. more than 5: __________
9. Identify all barriers that
you have found for the
implementation and
sustainability of Lean six
a. Management support
b. Organizational culture
c. Lack of strategy and communication
d. Lack of training
e. Other: ____________________
9. Circle all Lean practices or
tools that have been used in
your program.
Rank your perceived impact
of the tool on the organization
on the cell to the right of the
tool.
(1 is little impact and 5 is big
impact in the program)
a. 5S 1 2 3 4 5
b. Kaizen 1 2 3 4 5
c. Visual Stream Mapping (VSM) 1 2 3 4 5
d. Six Sigma 1 2 3 4 5
e. Standardized work 1 2 3 4 5
f.Total Quality Management(TQM) 1 2 3 4 5
Other practice: 1 2 3 4 5
1 2 3 4 5
Thank You for Participating!!

83
APPENDIX E: GOVERNMENT LEAN ENTERPRISE SELF-ASSESSMENT TOOL (GLESAT) Survey ID:______
1. Survey: Government Lean Self-Assessment Tool
Instructions: Please score each practice on two dimensions. First, provide a current score (C) based on your perception of the
enterprise’s present performance. Each practice has five capability levels that provide guidelines and evidence to help assess the
appropriate score. Next provide a desired score (D) based on what the enterprise should achieve after the predetermined period (often,
the time selected aligns with the enterprise strategic planning process). The intention is not to set all desired scores at the highest
possible capability level but to prioritize those practices that you think are both achievable and have a high payoff.
Key Guidelines:
1. Attempt to assess every practice; leave a blank only if it is not applicable or if you do not know
2. For the current level of each practice mark the box labeled “C”. For the desired level, mark the box labeled “D”
3. Read each practice from left to right starting with the practice and indicator. When scoring a practice, every capability level
assumes that all lower capability levels have been fulfilled (i.e., you should only select level three if you meet the criteria set
out in level two as well).
4. If you believe the enterprise is between levels, select the lower level
5. When possible note evidence for the current capability level selected.
6. Identify opportunities to achieve the desired capability level
7. If you have questions, seek clarification or assistance from the assessment facilitator

84
Section I: Lean Transformation/Leadership
Part I.A. Enterprise Strategic Planning
Level 1 Level 2 Level 3 Level 4 Level 5
I.A.1
Integration of Lean in
Strategic Planning Process
Lean impacts value delivery in
terms of cycle
time and capability
Concepts and benefits
of lean principles and
practices are not
evident in culture or
strategic plans.
Lean is recognized, but
relegated to lower
levels of the enterprise
and application is
fragmented.
The value implications of
lean are understood
and lean implementation
plans are formulated,
but not integrated into
the strategic plan.
Transitioning to lean is
adopted as a key
enterprise strategy and
included in the strategic
plan.
Strategic plans
leverage the results of
lean implementation
to achieve shorter
cycle times and
affordable capability.
Lean Indicators (Examples)
Evidence
Opportunities
LP #Lean Practices
Capability Levels
• Lean implementation is included explicitly in the enterprise strategic plan.
• Strategic planning makes allowance for anticipated gains from lean improvements.
DC DC DC DCDCDC

85
Level 1 Level 2 Level 3 Level 4 Level 5
I.A.2
Focus on Customer
Value
Customers pull value
from enterprise value
stream
Means of defining value
to customer(s) is informal
and unstructured.
Structured process for
defining value is applied
to selected customers.
How the enterprise can
best contribute to
customer's success is
well defined and
incorporated into most
projects/programs.
Customer definition of
value strongly influences
the strategic direction.
Enterprise processes are
enhanced, as customer
value becomes the
predominant driving force
throughout the extended
enterprise.
Lean Indicators (Examples)
Evidence
Opportunities
LP #Lean Practices
Capability Levels
• Enterprise employs a formal process for determining customer value.
• The enterprise understands what constitutes success for its customers.
• A formal process exists to measure and assess customer satisfaction.
• Customer value strongly influences policies, practices, and behavior.
DC DC DC DCDC
Level 1 Level 2 Level 3 Level 4 Level 5
I.A.3
Leveraging the
Extended Enterprise
Value stream extends
from customer through
the enterprise to
supporting organizations
Relations between
organizations reflect a
"we-they" mentality.
Initial opportunities
identified for establishing
extended enterprise
linkages.
Strategic planning
process explicitly includes
consideration of key
stakeholders in value
streams.
Integration and balancing of
stakeholder values are
achieved via collaborations
between supporting
organizations and strategic
partnering.
Integration of the extended
enterprise contributes to
innovation, value delivery,
responsiveness and
affordable capability.
Lean Indicators (Examples)
Evidence
Opportunities
LP #Lean Practices
Capability Levels
• Strategic planning is strongly influenced by stakeholder and customer value.
• Strategic planning encompasses the total enterprise, including customer, alliances/partners, employees, and supporting
organizations.
• Risk and responsibilities are apportioned when leveraging the extended enterprise partners.
DC DC DC DCDC

86
Part I.B Adopt Lean Paradigm
Level 1 Level 2 Level 3 Level 4 Level 5
I.B.1
Learning and Education in
“Lean” for Enterprise
Leadership“Unlearning” the old,
learning the new
Little interest in learning
lean principles is evident
among enterprise
leadership.
Leaders are actively
seeking opportunities to
learn about lean. There
is an initial grasp of the
extent of the paradigm
shift for the enterprise.
The leaders are
adopting lean learning
and continuously
applying lean principles
across the enterprise.
Leaders contribute to
the development or
refinement of the body
of knowledge about
lean.
Lessons learned in
implementing lean are
actively shared across
the organization and
within the extended
enterprise.
Lean Indicators (Examples)
Evidence
Opportunities
Level 1 Level 2 Level 3 Level 4 Level 5
I.B.2
Senior Management
CommitmentSenior management
leading it personally
Level of commitment
among senior leaders
and management is
variable – some
endorse while others
may actively resist.
Senior management
buys into group
commitment; senior
leaders / managers
who cannot or will not
adapt are replaced.
Lean is integral to
enterprise-wide meetings,
senior staff meetings, etc.;
senior managers
personally and visibly
lead lean transition.
Senior leaders are
championing the
transformation to lean
within the enterprise.
Senior leaders and
management mentor
and foster lean
champions internally
and throughout the
extended enterprise.
Lean Indicators (Examples)
Evidence
Opportunities
LP #Lean Practices
Capability Levels
• There is a consensus commitment supporting a transformation to lean.
• Management provides support and recognition for positive actions
• Senior management are champions in transforming the enterprise.
LP #Lean Practices
Capability Levels
• A formal lean education process for senior leaders has been established.
• Majority of enterprise leaders have received significant exposure and education in lean principles, practices and behavior.
• Leaders regularly apply and use lessons learned in lean.
DC DC DC DCDC
DC DC DC DCDC
DC

87
Level 1 Level 2 Level 3 Level 4 Level 5
I.B.3
Lean Enterprise VisionNew mental model of the
enterprise
Senior leaders have
varying visions of lean,
from none to welldefined.
Senior leaders adopt
common vision of lean.
Lean vision has been
communicated and is
understood by most
employees.
Common vision of
lean is shared by the
extended enterprise.
Stakeholders have
internalized the lean
vision and are an active
part of achieving it.
Lean Indicators (Examples)
Evidence
Opportunities
Level 1 Level 2 Level 3 Level 4 Level 5
I.B.4
A Sense of UrgencyThe primary driving force
for lean
Scan of environment
identifies competitive
threats to
responsiveness and
need for action.
Enterprise senior
leaders develop an
urgent and compelling
case for the lean
transformation.
Urgent and compelling
case for lean
transformation has been
communicated and the
organization rallies
behind it.
Urgent and
compelling case for
lean is expanded to
and accepted by key
supporting
organizations.
Urgent and compelling
case for lean is
expanded to and
accepted throughout the
extended enterprise.
Lean Indicators (Examples)
Evidence
Opportunities
LP #Lean Practices
Capability Levels
• A compelling case for lean has been developed and communicated.
• The implications and time scales of the vision have been translated for each area of the enterprise.
• Lean transformation progress is integral to leadership discussions and events.
LP #Lean Practices
Capability Levels
• The role that lean plays in achieving the vision is clearly defined.
• The vision has been communicated to all levels and has extensive buy-in by most employees.
• The vision incorporates a new mental model of how the organization would act and behave according to lean principles and
practices.
DC DC DC DCDC
DC DC DC DCDC
DC

88
Part I.C Focus on the Value Stream
Level 1 Level 2 Level 3 Level 4 Level 5
I.C.1.
Understanding the
Current Value StreamHow we now deliver
value to customers
The documented process
flow differs from the
actual flow. There is an
initial understanding of
the need for formal
mapping and analysis.
Key stakeholders and
what they value are
identified. Present
processes are mapped
and initial analysis is
underway.
Principal current value
stream(s) are defined,
allowing the identification of critical
interactions. Significant opportunities for
eliminating waste and creating value are
identified and aligned with the strategic
objectives.
Depth and breadth of
knowledge of value
stream elements and
supporting processes
exposes interdependencies
across the enterprise.
Updated value
streams and their
independencies are
evaluated across the
extended enterprise.
Lean Indicators (Examples)
Evidence
Opportunities
Level 1 Level 2 Level 3 Level 4 Level 5
I.C.2.
Enterprise Flow"Single piece flow" of
materials and
information
Material and
information flows are
disjointed and optimized
process by process.
“Push” mentality
prevails.
Some primary flow
paths have been
overhauled to overcome
significant barriers to
flow.
Primary flow paths are simplified and
aligned to the value stream(s), which
allows information and material to flow
as required.
Material and
information flow
seamlessly throughout
the enterprise.
Material and information
flow seamlessly and
responsively throughout
the extended enterprise.
Lean Indicators (Examples)
Evidence
Opportunities
LP #Lean Practices
Capability Levels
• Information flows have been rationalized to assure interoperability among enterprise elements.
• Material flow paths have been simplified and shortened to enhance flow.
• Information and material flows are responsive to stakeholder needs.
LP #Lean Practices
Capability Levels
• A formal process has been established for identifying customer and stakeholder value.
• The practice and language of value stream mapping is recognized as an important part of an iterative improvement process.
• Current value streams of major customers/product lines have been mapped, and hand off points and interfaces clearly defined.
DC DC DC DCDC
DC DC DC DCDC
DC

89
Level 1 Level 2 Level 3 Level 4 Level 5
I.C.3.
Designing the Future
Value StreamValue stream to meet the
enterprise vision
Management
understands that the
present processes do
not meet the future lean
enterprise objectives.
A concept for future
value stream(s) design
has been created based on
balanced stakeholder
requirements.
Future value stream(s) are developed,
which encompass future enterprise goals
and satisfy stakeholder
requirements.
Future value stream(s)
are refined to
accommodate a
changing environment.
Future value stream(s)
are refined to dynamically
accommodate a changing
environment across the
extended enterprise.
Lean Indicators (Examples)
Evidence
Opportunities
Level 1 Level 2 Level 3 Level 4 Level 5
I.C.4.
Performance MeasuresPerformance measures
drive enterprise behavior
Performance measures
are ad hoc, inconsistent
and focused on functional
areas rather than value
streams.
Baseline performance
measures are established to
stimulate progress towards
the lean future state and
are visible throughout the
enterprise.
Performance measurement system uses
a minimal and balanced set of measures
based on strategic objectives and
aligning local with enterprise metrics.
Measurement systems
and target-setting pulls
performance improvement
throughout the enterprise.
A common targetsetting
and measurement process
pulls performance
improvement across the
extended enterprise.
Lean Indicators (Examples)
Evidence
Opportunities
LP #Lean Practices
Capability Levels
• A balanced and minimal set of performance measures are used to track lean implementation progress towards the strategic direction.
• Performance measures used assure that local and enterprise measures are aligned.
LP #Lean Practices
Capability Levels
• A formal process has been established to identify how the enterprise can best deliver value to customers and stakeholders.
• The future value stream(s) reflects new and improved ways to realize value and minimize non-value adding activities.
• Future value stream(s) designs have been generated for the primary value stream(s) and their supporting processes.
DC DC DC DCDC
DC DC DC DCDC

90
Part I.D. Develop Lean Structure and Behavior
Level 1 Level 2 Level 3 Level 4 Level 5
I.D.1.
Enterprise Organizational
Orientation
Organize to support
value delivery
The enterprise operates as
functional or team silos.
Initial efforts are underway
to identify functional
or team barriers and
understand their full
implications.
Partially deployed
crossfunctional/cross-team
processes are aligned with
enterprise value stream(s).
Extensive crossfunctional/
cross-team processes are
implemented across the
enterprise. Functional units
now serve as knowledge
centers for
skill retention.
Cross-functional/cross-
team, process-based
orientation is aligned across
the extended
enterprise.
Lean Indicators (Examples)
Evidence
Opportunities
Level 1 Level 2 Level 3 Level 4 Level 5
I.D.2.
Relationships Based on
Mutual Trust"Win-win" vs. "wethey"
Relationships tend to
be determined by
organizational role,
resulting in a “wethey”
perspective.
Selective application
of enterprise perspective
results in breaking down of
organizational barriers and
developing mutual
trust.
Stable and cooperative
relationships exist across
the enterprise;
cooperative relations are
established with some
enterprise partners.
Mutual respect and trust
exists across the extended
enterprise with equitable
sharing of benefits from
continuous improvement
initiatives.
Stakeholders modify
behavior so as to enhance
extended enterprise
performance (win-win).
Lean Indicators (Examples)
Evidence
Opportunities
LP #Lean Practices
Capability Levels
• Communication barriers based upon organizational position have been significantly reduced.
• Stable and cooperative relationships exist among most enterprise stakeholders.
LP #Lean Practices
Capability Levels
• Functional/team barriers have been minimized.
• There is extensive use of cross-functional/cross-team processes across the enterprise.
• Career progression potential exists across both processes and functions.
DC DC DC DCDC
DC DC DC DCDC
DC

91
Level 1 Level 2 Level 3 Level 4 Level 5
I.D.3
Open and Timely
CommunicationsInformation exchanged when
required
Communication is
largely top-down,
limited and lagging.
Basic communication
mechanisms are employed
but are not uniform;
communication strategy is
under development.
Enterprise leaders are
accessible and visible,
developing two-way
communications in open,
concise and timely form.
Communication processes
are undergoing continuous
refinement and information
is exchanged or can be
pulled as required.
Comprehensive system of
two-way communication is
employed throughout the
extended enterprise.
Lean Indicators (Examples)
Evidence
Opportunities
Level 1 Level 2 Level 3 Level 4 Level 5
I.D.4.
Employee EmpowermentDecision-making at lowest
possible
level
Centralized decisionmaking
occurs in a
hierarchical structure with
limited delegation of
authority.
Appropriate structure and
training is being put
in place to enable
empowerment.
Organizational environment
and management system
supports limited
decisionmaking at point of
application and need.
Decision processes are
continually refined to
promote increased
accountability and
ownership at point of use.
Decision-making across the
extended enterprise is
delegated to the point of
application.
Lean Indicators (Examples)
Evidence
Opportunities
LP #Lean Practices
Capability Levels
• Managers and supervisors serve as mentors and educators, promoting lower level decision-making.
• The extent and types of empowerment are tailored to match the environment and people empowered.
• Empowerment enables swift and effective decision-making closest to the point of use.
LP #Lean Practices
Capability Levels
• Open and timely communications exist among stakeholders (i.e., regular meetings with employees, newsletters, etc.)
• Technology has been leveraged to speed communications flow and accessibility, while filtering unnecessary communications.
• Employee input is valued and plays a key part in decision-making.
DC DC DC DCDC
DC DC DC DCDC

92
Level 1 Level 2 Level 3 Level 4 Level 5
I.D.5.
Incentive AlignmentReward the behavior you want
There is sporadic use
of incentives and an
awareness that some
incentives discourage
lean behavior.
Incentives that
reward and
encourage lean
behavior are
deployed in some
areas.
Organizational leader
performance reviews and
employee incentives are
linked directly to
attainment of lean
objectives.
Incentive systems
successfully contribute to
achievement and
sustainability of lean
objectives.
Lean incentives are
deployed, with measurable
success across the
extended enterprise.
Lean Indicators (Examples)
Evidence
Opportunities
Level 1 Level 2 Level 3 Level 4 Level 5
I.D.6
Innovation
Encouragement
From risk aversion
to risk rewarding
Innovation initiatives
are sporadic and ad
hoc; security, stability
and risk aversion
drive most decisionmaking.
Initial efforts are
underway to develop
systems, processes and
procedures for fostering
innovations.
Innovation initiatives are
underway in selected
areas; measures for
assessing impact are in
use.
Innovation initiatives are
flourishing across the
enterprise; prudent risk
taking is encouraged and
rewarded.
Comprehensive innovation
program is implemented
and positive results
recognized across the
extended enterprise.
Lean Indicators (Examples)
Evidence
Opportunities
LP #Lean Practices
Capability Levels
• The review process for suggestions has been streamlined and gives clear visibility of the progress of each suggestion.
• Suggestion programs have been properly incentivized to give recognition to originators of innovative ideas.
LP #Lean Practices
Capability Levels
• Incentives include a balance of money and non-monetary rewards / recognition to encourage lean activity.
• Incentives are based on performance measures that encourage lean activity.
• Incentives encourage local improvements that will benefit multiple processes or value steam performance.
DC DC DC DCDC
DC DC DC DCDC

93
Part I.E. Create and Refine Transformation Plan
Level 1 Level 2 Level 3 Level 4 Level 5
I.D.7.
Lean Change Agents
The inspiration and
drivers of change
Change agents are
sporadically distributed, but
without change
authority.
There is formal
identification of change
agents, along with role
definition, authority
delegation and program of
education and training for
change agents.
Appropriately skilled
change agents are
assigned to key areas
with the authority to effect
changes.
Change becomes
selfgenerating,
initiated by employees as
well as change agents.
Change agents are
providing a critical
resource of lean
knowledge, skill and
experience in transforming
the extended enterprise.
Lean Indicators (Examples)
Evidence
Opportunities
LP #Lean Practices
Capability Levels
DC DC DC DCDC
Level 1 Level 2 Level 3 Level 4 Level 5
I.E.1.
Enterprise-Level Lean
Transformation Plan
Charting the course
across the extended
enterprise
Individual planning efforts
are mostly bottom up
initiatives with little
priority or coordination
established at enterprise
level.
Enterprise-level view
identifies lean
implementation projects,
which are prioritized to
meet long and shortterm
strategic objectives.
Enterprise improvement
plans are coordinated
and prioritized across
enterprise value stream(s),
with a timeline for
expected measurable
results.
Lean transformation
plan is continuously
refined through learning
from implementation
results and changing
strategic requirements.
Lean transformation
plan balances mutual
benefits of
stakeholders across
the extended
enterprise.
Lean Indicators (Examples)
Evidence
Opportunities
LP #Lean Practices
Capability Levels
• A process is in place to incorporate lessons learned into the enterprise-level lean transformation plan.
• The milestone targets of the lean transformation plan are broken-down by section and deployed across the enterprise.
• Plans balance long-term and short-term stakeholder objectives for the best overall solution.
DC DC DC DCDCDC

94
Level 1 Level 2 Level 3 Level 4 Level 5
I.E.2.
Commit Resources for
Lean ImprovementsResource provision for
lean
Little or no resources
are provided for
process improvement or
waste elimination.
Limited enterprise-level
resources are committed
and often applied to the
symptom rather than the
root cause.
Resources are allocated
as required for execution
of the lean
transformation plan and
prioritized across the
value stream.
A pool of earmarked
resources is provided for
lean initiatives with
minimal justification
required.
A pool of earmarked
resources is provided
for lean initiatives
across the extended
enterprise.
Lean Indicators (Examples)
Evidence
Opportunities
Level 1 Level 2 Level 3 Level 4 Level 5
I.E.3.
Provide Education and
TrainingJust-in-time learning
There is little coordination
of education and training
programs to facilitate
change.
Education and training
covers a set of skills
required to support the
lean transformation
projects.
Education and training
program is comprised of
a balanced and sequenced
set of elements to support
the coordinated
transformation plan.
Education and training
at all levels is periodically
reviewed to check
alignment and suitability to
the lean transformation
plan.
Education and training
program supports the
upcoming needs of
the extended enterprise
transformation plan.
Lean Indicators (Examples)
Evidence
Opportunities
LP #Lean Practices
Capability Levels
• Education and training programs, including refreshers, are provided on a just-in-time basis.
• Education and training has a balanced and sequenced set of elements to support the lean transformation plan.
• The application of lean principles learned in training and education is formally appraised.
LP #Lean Practices
Capability Levels
• Resources are committed to support the level and speed of lean transformation required.
• Time to build on improvements by personal contribution is given at all levels.
• The procedure to apply for improvement resources has been simplified, and gives priority to improvements that benefit multiple
areas.
DC DC DC DCDC
DC DC DC DCDC

95
Part I.F. Implement Lean Initiatives
Level 1 Level 2 Level 3 Level 4 Level 5
I.F.1.
Development of Detailed
Plans Based on Enterprise
PlanCoordinating lean
improvements
Improvements are
generally optimized for
individual areas and
employees cannot clearly
see the links between
localized and enterprise
goals.
Key goals of the enterprise lean
transformation plan are understood
by most employees. Process
owners are involved in developing
detailed plans linked to the
goals/strategic objectives of the
enterprise plan.
Detailed lean
implementation plans
supporting the enterprise
level plan are developed and
coordinated across
processes.
Detailed lean
implementation plans
accounting for any
interdependencies are
refined and integrated
across the enterprise. Best
practices are shared.
Implementation plans
from extended enterprise
are coordinated with and
support the lean
transformation plan.
Lean Indicators (Examples)
Evidence
Opportunities
Level 1 Level 2 Level 3 Level 4 Level 5
I.F.2.
Tracking Detailed
ImplementationAssessing actual
outcomes against goals
Results of process
improvement initiatives
are observed but not
quantified.
Process is under development to
permit tracking and
quantification of progress of the
detailed lean implementation.
Data from some projects is being
reviewed.
There is a project
management process
implemented to track
progress of detailed lean
projects against milestones,
with feedback provided to
enterprise level.
Appropriate corrective
action is initiated within
individual projects.
The project management
process can readily assess
detailed plans and can
accommodate revisions
mandated by changes to the
enterprise level lean
transformation plan.
The project management
process is deployed across
the extended enterprise to
enable real-time
tracking.
Lean Indicators (Examples)
Evidence
Opportunities
LP #Lean Practices
Capability Levels
• Lean initiatives are coordinated and tracked, with the individual results “rolled up” and assessed against enterprise-level milestones
and targets.
• Responsibility and accountability for improvement success is assigned locally to enable fast corrective action on deviations from the
plan.
• Changes to processes/value stream map(s) are documented and updated regularly.
LP #Lean Practices
Capability Levels
• Detailed implementation plans are aligned to milestone targets of the enterprise-level plan.
• A process is in place to incorporate lessons learned in detailed implementation plans.
• Detailed improvement plans are coordinated throughout the enterprise where shared implications exist.
DC DC DC DCDC
DC DC DCDCDC

96
Part I.G. Focus on Continuous Improvement
Level 1 Level 2 Level 3 Level 4 Level 5
I.G.1.
Structured Continuous
Improvement ProcessesUniformity in how we get
better
Improvement initiatives
are ad hoc and not
data driven.
An improvement
process for the
enterprise is broadly
defined and being
selectively applied.
Systematic, structured
methodology for
continuous improvement
and value creation is
developed and
deployed across many
areas.
Structured continuous
improvement process is
deployed at all levels
across the enterprise,
using value analysis to
target improvements.
Structured continuous
improvement process
is fully ingrained
throughout the
extended enterprise.
Lean Indicators (Examples)
Evidence
Opportunities
Level 1 Level 2 Level 3 Level 4 Level 5
I.G.2.
Monitoring Lean ProgressAssessing progress
toward achieving
enterprise objectives
Enterprise leaders are
not actively involved in
the review of overall
lean implementation
plan progress.
Implementation plan
progress is reviewed
against enterprise level
milestones and success
criteria, for some
projects.
A formal methodology is used by
enterprise leaders to analyze the
overall progress across all lean
implementation projects. Current
plans are adjusted based on
learning from lean
implementations.
Results of implementation
projects are aggregated to
permit reallocation of
resources and to ensure
on-going alignment with
strategic objectives.
Senior managers monitor lean
progress throughout the
extended enterprise.
Results are impacting
future enterprise strategic
planning.
Lean Indicators (Examples)
Evidence
Opportunities
LP #Lean Practices
Capability Levels
• Lean transformation progress is judged by the aggregate benefits, not individual or localized improvements.
• Leaders actively participate in monitoring implementation progress and addressing deficiencies within the transformation plan.
• Lean progress reviews are documented in a common format and disseminated.
LP #Lean Practices
Capability Levels
• A consistent improvement/transformation approach is implemented, sustaining improvements gained.
• The continuous improvement process challenges people to tackle the root cause, rather than the symptom.
• Lean principles are being applied to most enterprise systems and processes, utilizing lessons learned.
DC DC DC DCDC
DC DC DC DCDC
DC

97
Level 1 Level 2 Level 3 Level 4 Level 5
I.G.3.
Nurturing the ProcessAssure senior leaders’
involvement
There is growing awareness
that successful lean
implementation is highly
dependent upon senior
management support and
encouragement
Some senior managers
are providing
encouragement, support
and recognition, which
is not consistent across
the enterprise.
Managers seek to
identify and remove barriers to
lean implementation. Teams and
individuals who successfully
implement lean practices are
recognized and rewarded.
Senior managers across the
entire enterprise are highly
visible in their involvement,
support and encouragement
of the lean initiative. An
enthusiastic atmosphere is
evident.
Senior leaders and
managers champion
and nurture a culture
of continuous
improvement in the
extended enterprise.
Lean Indicators (Examples)
Evidence
Opportunities
Level 1 Level 2 Level 3 Level 4 Level 5
I.G.4.
Capturing Lessons LearnedEnsuring that successes
lead to more successes
Lessons learned from
improvement activities
are not documented,
residing only in the
memories of participants.
Lessons learned in some
areas are documented
and maintained in
paper files, design
rulebooks, etc.
A formal process for readily
capturing and communicating
lessons learned is being applied.
Employee contributions are
actively sought.
Lessons learned are
consistently captured,
communicated and regularly
used in a structured manner.
An enterprise knowledge base
is created.
A formal knowledge
management process is
adopted. Lessons learned are
routinely and explicitly
incorporated into the
formulation of new lean
initiatives.
Lean Indicators (Examples)
Evidence
Opportunities
LP #Lean Practices
Capability Levels
• “Best” practice, suggestions and lessons learned are maintained in a concise and clear standard format.
• A formal process has been established throughout the enterprise for capturing and reusing lessons learned.
• Lessons learned are periodically reviewed to maintain relevance of information kept.
LP #Lean Practices
Capability Levels
• Management actively supports and is involved in ensuring the success of improvements.
• Positive actions and the effort taken are recognized and rewarded, even if improvements are not fully successful.
DC DC DC DCDC
DC DC DC DCDC

98
Section II: Life Cycle Processes
Part II.A. Set-up the Enterprise
Level 1 Level 2 Level 3 Level 4 Level 5
I.G.5. Impacting Enterprise
Strategic Planning
Results lead to strategic
opportunities
Results of lean
implementation are not
fed back to strategic
planning process.
Benefits of lean
implementation are
beginning to influence
the strategic planning
process.
Senior management considers
potential impact of performance
improvement initiatives in its
assessment of new organizational
or program opportunities.
Forecasted improvements
from lean implementation are
incorporated into enterprise
planning and budgeting
decisions.
Senior management integrates
forecasted future results of lean
implementation in its
assessment of new
opportunities and future
organizational needs.
Lean Indicators (Examples)
Evidence
Opportunities
LP #Lean Practices
Capability Levels
• Business results reflect improvements resulting from lean implementation.
• Strategic planning makes allowance for anticipated gains from lean improvements.
• Gains realized from lean implementation are leveraged to achieve growth, profitability, market position and employment
stability.
DC DC DC DCDC
Level 1 Level 2 Level 3 Level 4 Level 5
II.A.1
Leverage Lean Capability
for New OpportunitiesExploiting new
opportunities arising
from lean enabled
capabilities
Improvement initiatives
are ad hoc and are
focused on operational
efficiency.
Improvement gains provide resources
to facilitate future improvements.
Potential opportunities from applying
lean thinking across core
competences are recognized and
plans have been developed.
Benefits sustained from
applying lean thinking
within the enterprise are
used to retain current
capabilities and/or
develop new opportunities
There is full use of the
enhanced capabilities
and customer knowledge
throughout the enterprise to
leverage opportunities
for providing greater value to
customers.
The strategic plan
dynamically incorporates
extended enterprise
capabilities and stakeholder
interests to identify and
leverage
opportunities.
Lean Indicators (Examples)
Evidence
Opportunities
LP #Lean Practices
Capability Levels
• Reduced cost, increased quality and faster response times from waste eliminated are used to maintain or develop new
opportunities.
• The ability to improve and refine processes quickly is used extensively to respond to changing customer requirements.
• A process is used to scan the environment to exploit opportunities arising from the enhanced capabilities of the lean enterprise.
DC DC DC DCDCDC
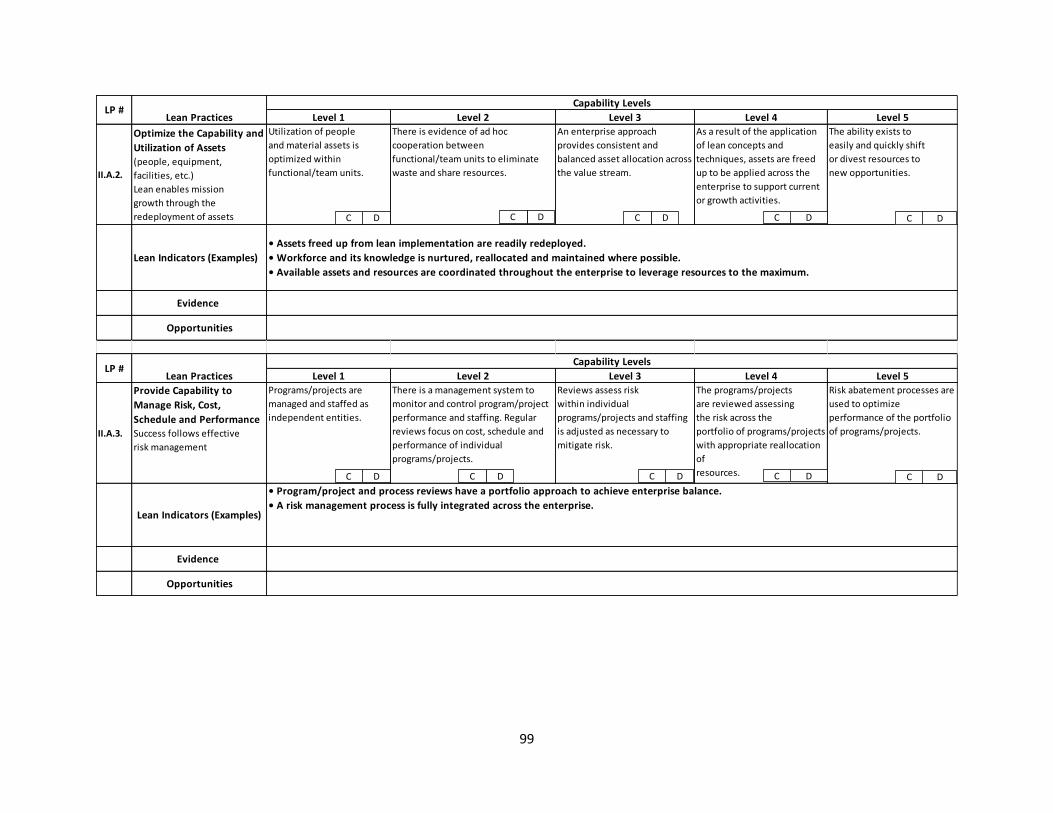
99
Level 1 Level 2 Level 3 Level 4 Level 5
II.A.2.
Optimize the Capability and
Utilization of Assets(people, equipment,
facilities, etc.)
Lean enables mission
growth through the
redeployment of assets
Utilization of people
and material assets is
optimized within
functional/team units.
There is evidence of ad hoc
cooperation between
functional/team units to eliminate
waste and share resources.
An enterprise approach
provides consistent and
balanced asset allocation across
the value stream.
As a result of the application
of lean concepts and
techniques, assets are freed
up to be applied across the
enterprise to support current
or growth activities.
The ability exists to
easily and quickly shift
or divest resources to
new opportunities.
Lean Indicators (Examples)
Evidence
Opportunities
Level 1 Level 2 Level 3 Level 4 Level 5
II.A.3.
Provide Capability to
Manage Risk, Cost,
Schedule and PerformanceSuccess follows effective
risk management
Programs/projects are
managed and staffed as
independent entities.
There is a management system to
monitor and control program/project
performance and staffing. Regular
reviews focus on cost, schedule and
performance of individual
programs/projects.
Reviews assess risk
within individual
programs/projects and staffing
is adjusted as necessary to
mitigate risk.
The programs/projects
are reviewed assessing
the risk across the
portfolio of programs/projects
with appropriate reallocation
of
resources.
Risk abatement processes are
used to optimize
performance of the portfolio
of programs/projects.
Lean Indicators (Examples)
Evidence
Opportunities
LP #Lean Practices
Capability Levels
• Program/project and process reviews have a portfolio approach to achieve enterprise balance.
• A risk management process is fully integrated across the enterprise.
LP #Lean Practices
Capability Levels
• Assets freed up from lean implementation are readily redeployed.
• Workforce and its knowledge is nurtured, reallocated and maintained where possible.
• Available assets and resources are coordinated throughout the enterprise to leverage resources to the maximum.
DC DC DC DCDC
DC DC DC DCDC

100
Part II.B. Build Relationships
Level 1 Level 2 Level 3 Level 4 Level 5
II.A.4
Allocate Resources for
Program/Project
Development Efforts
Teaming for success
Program/project
development efforts rely
on functional units for
allocation of the
required skills.
Some but not all skills /resources
necessary are dedicated and assigned
to program development. Skilled
resources are narrowly guarded
within programs/projects.
Some of the skilled resources
are routinely shared across
programs/projects. Formal
methods are being developed
for determining team makeup
and assignment of necessary
skills.
Resources and skills are
routinely balanced and
shared across the
portfolio of
programs/projects.
“Virtual organizations” are
created as needed from the
extended enterprise and
provided with the skills and
resources necessary to
execute the development
effort(s).
Lean Indicators (Examples)
Evidence
Opportunities
LP #Lean Practices
Capability Levels
DC DC DC DCDC
Level 1 Level 2 Level 3 Level 4 Level 5
II.B.1
Define and Develop
Relationships with
Stakeholders
Aligning stakeholder
values through
relationships that build
credibility
Some stakeholders have
been identified and
relationships are based
on situational necessity.
Temporary relationships
are established with
major stakeholders to
support upcoming events.
Relationships are developed and
maintained with key stakeholders
throughout the life cycle. There is a
plan or process to engage other
stakeholders in the product/service
value chain.
Relationship building is
a key program/project
strategy. Stakeholder
relationships are
nurtured over time and
foster high enterprise
credibility.
Relationships have
been established
across the extended
enterprise, are selfsustaining, and
result in widespread stakeholder
trust.
Lean Indicators (Examples)
Evidence
Opportunities
LP #Lean Practices
Capability Levels
• Relationships are defined and developed in line with the enterprise strategic plan to ensure efficient creation of value for the
extended enterprise.
• Stakeholders in the extended enterprise value the relationships established.
• Robust relationships provide stakeholders the ability to adapt to changing requirements and unanticipated disruptions.
DC DC DC DCDCDC

101
Level 1 Level 2 Level 3 Level 4 Level 5
II.B.2.
Optimize the RelationshipCreating effective
relationships to achieve
customer value
Relationships are at
arm’s length and
adversarial. Relationships
are defined only by contract
language or formal
agreements.
Beside the formal
relationship agreements,
objectives, roles and
responsibilities are
communicated
informally between
stakeholders.
Shared values are established and
communicated in key stakeholder
relationships, who are involved
early in the design/development of
relationship processes and
program/project plans.
A seamless relationship
is established between
stakeholders that is dynamic to
changes and provides insight into
values of others, such that
organizational boundaries
become blurred.
Stakeholders in the
extended enterprise
balance competencies in their
relationships for best
program / service
value.
Lean Indicators (Examples)
Evidence
Opportunities
Level 1 Level 2 Level 3 Level 4 Level 5
II.B.3.
Foster Innovation and
Knowledge-SharingIncentivizing innovation
through stakeholder
involvement
Primary focus on
internal expertise, with
little cognizance of tacit
(experience-based) or
explicit (formal)
knowledge of other
stakeholders.
Internal organizational
structures and processes
are established to
leverage stakeholder
knowledge and
innovation.
Strategic planning
includes stakeholders in
pursuance of a common
strategic vision. Shared
metrics for continuous
improvement are
utilized.
Knowledge transfer
mechanism is created
for open and rapid
access by all
stakeholders.
Mutually beneficial
arrangements to foster innovation
between stakeholders. Process for
communication of needed changes
in vision, strategy, metrics, and
implementation.
Lean Indicators (Examples)
Evidence
Opportunities
LP #Lean Practices
Capability Levels
• Long-term collaborative relationships are established and maintained where possible.
• Processes to facilitate sharing and transfer of innovation, knowledge and technology are deployed.
• A mutually beneficial continuous improvement process is established between stakeholders over the product/service life cycle.
LP #Lean Practices
Capability Levels
• Relationships focus on program/service life cycle value rather than organizational objectives.
• Interactions between stakeholders are effortless.
• Stakeholders balance capabilities for best value to the program/service.
DC DC DC DCDC
DC DC DC DCDC

102
Part II.C. Develop the Plan
Level 1 Level 2 Level 3 Level 4 Level 5
II.C.1.
Establish a Requirement
Definition Process to
Optimize Life Cycle ValueStakeholder pull vs.
technology/product
push
Requirements are
defined internally based
on past experience,
rather than on a formal
requirements definition
process.
Requirements definition
process, which balances
cost, schedule and
performance, is partially
developed, deployed
and documented.
Requirements definition
process leverages value
chain capabilities and
focuses on overall life
cycle implications.
An iterative requirements
definition process spans
the value chain resulting
in a minimal set of
requirements that
balances cost and
performance.
The requirements process is a
strategic advantage for the
extended enterprise
contributing to increased
responsiveness and new
capabilities.
Lean Indicators (Examples)
Evidence
Opportunities
Level 1 Level 2 Level 3 Level 4 Level 5
II.C.2.
Capture Data from Extended
Enterprise to Optimize Future
Requirement Definitions
Closed loop processes
are in place to capture
operational performance data
Ad hoc communication
processes represent the
primary source of data
that is collected and
analyzed for impacts to
present requirements.
A proactive process is
being developed to
collect product/service
usage data as the basis
for future requirements.
Data are collected
across the present
value chain and used to
feed future design
solutions and
requirement definitions.
Process allows real-time
access, collection and
dissemination of data
from across the extended
enterprise for analysis by
stakeholders for future
use.
The process is established
across the extended enterprise
to actively seek data on needs,
usage and process capability to
populate a data repository that
can be mined for future
requirements.
Lean Indicators (Examples)
Evidence
Opportunities
LP #Lean Practices
Capability Levels
• Customer feedback is actively sought and provided as input to the requirements definition process.
• A product/service database is maintained and extensively used to establish future requirements definitions.
• Enhanced knowledge of customer and stakeholder requirements and desires is used to leverage future requirements.
LP #Lean Practices
Capability Levels
• There is a process in place to determine clear and concise product and life cycle requirements, with acceptable ranges.
• The process ensures a balanced representation from all stakeholders across the value chain.
• Structured methods are used to elicit and gather needs from the different stakeholders/customers.
DC DC DC DCDC
DC DC DC DCDC
DC

103
Level 1 Level 2 Level 3 Level 4 Level 5
II.C.3.
Incorporate Stakeholder
Value into Design of
Products and Processes Understanding stakeholder
value facilitates fewer
development perturbations
Stakeholder inputs are
captured only at the
beginning of the
development.
Stakeholder inputs are
considered qualitatively
through top-level liaison
and occasional reviews.
Stakeholder values are
represented on Integrated
Product Teams (IPT) and
feedback mechanisms exist
to facilitate timely
design iterations.
Stakeholders are actively
involved with IPT at
multiple levels to jointly
improve the effectiveness
and quality of the product
and process design.
Stakeholders involved with IPT
in continuous communication.
Sharing of benefits well
established; value
quantification and tradeoffs
continuous, automatic part of
process.
Lean Indicators (Examples)
Evidence
Opportunities
Level 1 Level 2 Level 3 Level 4 Level 5
II.C.4
Incorporate Downstream
Stakeholder Values into
Products and ProcessesUnderstanding downstream
stakeholders allows value to
flow seamlessly
Downstream activities
are considered late in
process.
Downstream activities
are considered earlier in
projects, but in an ad hoc
manner. Cost
considerations are
limited.
Multi-functional teams
include some
downstream disciplines
and key downstream
stakeholders.
Priorities of downstream
stakeholders are quantified
as early as
possible, and used for
process evaluation and
improvement.
Downstream stakeholders’
values in the extended
enterprise are quantified, and
balanced via tradeoffs,
as a continuous part of
the process.
Lean Indicators (Examples)
Evidence
LP #Lean Practices
Capability Levels
• There is early consideration and incorporation of downstream stakeholders issues throughout product and process development.
• The scope of considerations integrated into product and process development has been extended to include downstream
activities and cost implications.
• Processes flow with reduced cycle time and integrate upstream and downstream stakeholder values.
LP #Lean Practices
Capability Levels
• Stakeholders participate throughout the development process.
• Designs satisfy stakeholder value requirements, without unnecessary functionality.
DC DC DC DCDC
DC DC DC DCDC

104
Part II.D. Implement the Plan
Level 1 Level 2 Level 3 Level 4 Level 5
II.C.5.
Create a Multidisciplinary
Approach
Breaking down of functional
silos enables
seamless communication
and value flow
Development is
performed in functional
organizations.
Multidisciplinary
development is used to a
limited extent.
Multidisciplinary
development is used
extensively; metrics are
established for process
evaluation.
Multidisciplinary
techniques are deployed for
most programs/product
development efforts;
metrics are used for process
evaluation and
improvement.
Product and process
definition is seamlessly
integrated both internally and
with the upstream and
downstream
stakeholders.
Lean Indicators (Examples)
Evidence
Opportunities
LP #Lean Practices
Capability Levels
• Resources and skills are balanced across projects and programs, to aid maximum re-use and sharing of knowledge.
• Suitability and timing of information released, is matched to the requirements of subsequent processes.
DC DC DC DCDC
Level 1 Level 2 Level 3 Level 4 Level 5
II.D.1
Utilize Knowledge and
Capability in Decision
Making
Strategic leveraging of
stakeholder capability
Decision processes
employ knowledge
available at the time to
address the current
crisis or issue.
An informal decision process is in
place that is used in some areas
or under some conditions which
draws knowledge
from a broad set of experts to
apply to the decision process.
Decision processes have
been established which
gather knowledge from
many stakeholders to be
used in a majority of
decisions. It is not adverse
to ask for help.
Decision processes are
integrated with
organizational strategic
objectives and applied
to a broad set of
decisions.
Decision processes leverage
the knowledge and
capabilities of the
extended enterprise
and take into account
the enterprise goals
and objectives.
Lean Indicators (Examples)
Evidence
Opportunities
LP #Lean Practices
Capability Levels
• Decision making capability constitutes a major consideration in enterprise level long-range, strategic planning.
• Knowledge is maintained and shared throughout the extended enterprise.
DC DC DC DCDCDC

105
Level 1 Level 2 Level 3 Level 4 Level 5
II.D.2
Foster Lean Behavior
Throughout the Value
StreamPromoting stakeholder
innovation and flexibility
Processes and
relationships are
established based on
past/historical norms.
There are pockets within the
value stream where the
objectives of the task, program,
or mission influence creation of
new processes to maximize
value.
All members of the value
stream have established
processes that foster open
sharing of information with
“no spin” assessments
Senior leadership
involvement allows
stakeholders to develop
innovative approaches
that are flexible to
changing conditions.
Stakeholders along
the value stream are
empowered to develop
flexible and innovative
processes based on value
delivered to the extended
enterprise.
Lean Indicators (Examples)
Evidence
Opportunities
Level 1 Level 2 Level 3 Level 4 Level 5
II.D.3
Align Customer
Requirements and
Expectations with the
Extended Enterprise
CapabilitiesAligning customer and
stakeholder expectations
New projects are started
by aligning customer
requirements with internal
enterprise capabilities.
Other stakeholders are not
consulted or involved in
this process.
An external stimulus
drives the need to align
key stakeholder capabilities with
customer requirements.
Customers and key
stakeholders work
collaboratively to align
capabilities and
requirements on key
project/process
milestones.
Stakeholders actively
engage with customers
to align customer
requirements and
enterprise capabilities
as a normal way of doing
business.
Customers’ actual and
future requirements
align in real-time with
the extended enterprise’s
capabilities.
Lean Indicators (Examples)
Evidence
Opportunities
LP #Lean Practices
Capability Levels
• Stakeholder capabilities are aligned with current and future customer requirements.
• Stakeholders and customers are engaged as indicated by constant communication to align capabilities with customer
requirements.
• Products/services are delivered as expected, on-time and without unplanned Herculean efforts or rework on the part of some
stakeholders.
LP #Lean Practices
Capability Levels
• Conversion to lean has freed up resources for re-deployment.
• Bottleneck have been identified and eliminated to allow processes to flow seamlessly.
• Work is performed only when “pulled” from subsequent “customers” in the value chain.
DC DC DC DCDC
DC DC DC DCDC

106
Part II.E. Learn, Improve, and Sustain
Level 1 Level 2 Level 3 Level 4 Level 5
II.D.4
Transition Product/Service
to the
Customer
Right product for a ready
customer that meets all
stakeholder requirements
Primary focus is
program/service
completion, with
insufficient emphasis on
customer transition
activities.
There is an internal
activity considering the
customer transition.
Activities are limited to
rehashing existing
plans.
Customers and key
stakeholders are active
as contributors and
reviewers of internally
developed transition
plans.
Customers and key
stakeholders actively
collaborate to develop
and execute transition
activities.
There is a seamless
transition of
product/service to
customer with all
stakeholders aligned
to support the
customer.
Lean Indicators (Examples)
Evidence
Opportunities
LP #Lean Practices
Capability Levels
• The customers collaborate early in product/service development and are supported after the delivery of the product/service.
• Support such as training, facilities, special equipment and other resources are in place in time for product/service delivery.
• The transition to new product/service happens seamlessly without major perturbations.
DC DC DC DCDC
Level 1 Level 2 Level 3 Level 4 Level 5
II.E.1
Enhance Value of
Delivered Products and
Services to Customers and
the Enterprise
Responding to the voice of the
customer
Product/service support
system reacts to customer
needs, usually on-time
and from inventory or
internal resources.
Support system delivers
products / services on
time, but with
disruptions to production
flow and associated
resources.
Support system flow paths are
identified and are beginning to be
integrated with lean product
development and production
flows.
Standardized customer and
product support processes
provide responsive information
and product flow fully integrated
with
development and production
flows.
Customer needs for
post-delivery products
/ services are anticipated in
enterprise plans and fulfilled
by adaptation and extension of
capabilities already provided.
Lean Indicators (Examples)
Evidence
Opportunities
LP #Lean Practices
Capability Levels
• Solutions to product / service issues are coordinated throughout the extended enterprise to find fast, cost effective solutions.
• Customer and product support processes have been standardized and are regularly reviewed against customer feedback.
• Disruptions to design and production flow from support services has been minimized.
DC DC DC DCDCDC

107
Level 1 Level 2 Level 3 Level 4 Level 5
II.E.2.
Provide Post Delivery
Service, Support and
SustainabilityProviding customer
solutions
High level of spares or
support necessary because of
unknown failure rates, long
lead times for spare
replenishment or service
incompatible with customer
expectations.
Collection of deficiency
data permits both
determination of service
and support levels for
preventative activities and a
reduction of spare part
levels.
The enterprise is increasingly
involved in addressing customer
service/support solutions.
Commonality is used to reduce
spare part and support levels; root
cause analyses are fed back into
product design.
The enterprise is part of the
customer’s service/support
solution by ensuring availability
through replacement of critical
components or support needs
before failure or loss of capability.
The enterprise has become the
customer’s total system
capability solution. Support
and sustainment issues are
addressed before they impact
customer total system
capability.
Lean Indicators (Examples)
Evidence
Opportunities
Level 1 Level 2 Level 3 Level 4 Level 5
II.E.3
Maintain Challenge of
Existing ProcessesEnsure a culture of
continuous improvement
Ad hoc feedback in
progress with variable
formats. Primary focus is
on program or service
delivery.
Lessons learned have been
periodically gathered from
key stakeholders. Even
though lessons learned are
collected in the enterprise
known issues are
experienced again.
Feedback is gathered at
major milestones from the
customer and key stakeholders.
Lessons learned are effectively
used to a varying degree across the
enterprise.
Leaning is shared across
the enterprise, among
customers and between
stakeholders. Within the
enterprise learning takes
place between projects
throughout their life
cycles.
Seamless integration
of learning, robust to
change that provides
total system solutions
across the life cycle
for all stakeholders.
Lean Indicators (Examples)
Evidence
Opportunities
LP #Lean Practices
Capability Levels
• Lessons learned are shared across projects or over life cycle periods.
• There is low problem or issue repetitions in the enterprise.
• There is a central repository of lessons learned with robust user interfaces.
LP #Lean Practices
Capability Levels
• Customer feedback is proactively maintained and used to predict any emerging service issues and enhance future designs.
• There is a close relationship between the enterprise and the customer organization.
• The enterprise has internalized the customers total system capability needs and collaborates with the customers to ensure long
term capability solutions.
• Spares levels are reduced in line with short predicable lead times for replacement spares.
DC DC DC DCDC
DC DC DC DCDC

108
Section III: Enabling Infrastructure
Part III.A Lean Organizational Enablers
Level 1 Level 2 Level 3 Level 4 Level 5
III.A.1.
Financial System
Supports Lean
TransformationLean requires
appropriate financial
data
Finance system provides
basic budget and cost
accounting data; there
is little awareness and
exploration of broader
support roles for
finance.
Initial efforts are
underway to adapt or
modify systems to
compensate for the
inadequacies of the
formal financial system.
Finance system is
overhauled to provide
data and financial
information to support
and enable a lean
transformation at any
level.
Financial system scope
is expanded to integrate
with nontraditional
measures of value creation
(e.g., intellectual
capital,balanced scorecard).
Financial systems provide
seamless information
exchange across the extended
enterprise, with emphasis on
value creation for all
stakeholders.
Lean Indicators (Examples)
Evidence
Opportunities
Level 1 Level 2 Level 3 Level 4 Level 5
III.A.2.
Enterprise Stakeholders
Pull Required Financial
InformationData on demand
Lagging financial
information is reported
through regularly scheduled
standardized reports.
Specific requests for
measures require
extraordinary effort.
Finance actively provides
traditional financial
information to assist
users in planning and
programming activities.
Users are able to
directly access and
use financial
information to make
trade-off decisions.
Users are able to pull
financial and other value
creation information to
support decision analysis
in the format desired.
Users across the
extended enterprise
generate and share
timely financial and
performance data.
Data reflects extended
enterprise results.
Lean Indicators (Examples)
Evidence
Opportunities
LP #Lean Practices
Capability Levels
• Financial and performance measurement data can be accessed as needed in user-defined format.
• Financial information can be extrapolated to forecast outcomes.
• System provides up to date information on request and rationalizes information no longer used.
LP #Lean Practices
Capability Levels
• Financial measures that conflict with lean activity are no longer used to measure progress and performance.
• The financial system handles a balanced set of financial and non-financial measures to assist decision-making.
• The financial system has been overhauled to ensure fast and efficient processing of information as required.
DC DC DC DCDC
DC DC DC DCDC
DC

109
Level 1 Level 2 Level 3 Level 4 Level 5
III.A.3.
Promulgate the
Learning OrganizationLearning Organizations
create a flexible
workforce
The human resources
processes concentrate
on recruiting,
placement and
benefits. Personnel
training is ad hoc and
not aligned to
organizational needs.
A well-defined personnel
development process,
aligned with
organizational needs, is
applied for selected
employees.
Personnel development
process is extended to all
employees and incorporates
the anticipated future needs
of the enterprise. Resources
and facilities are dedicated
for learning.
A learning climate is
promoted within the
enterprise through ready
access to information and
input to strategy/policy
making. Opportunities for
extending learning
experiences are provided.
A learning climate is
promoted throughout
the extended
enterprise by the
sharing of capabilities,
knowledge, skills and
best practice.
Lean Indicators (Examples)
Evidence
Opportunities
Level 1 Level 2 Level 3 Level 4 Level 5
III.A.4.
Enable the Lean Enterprise
with Information Systems
and ToolsFacilitate the flow of
information and
knowledge
The information
infrastructure consists
mainly of stand-alone
systems. The need for
systems integration is
recognized but no
improvement plan
exists.
Elements of a common
information infrastructure
have been determined, and
an implementation
plan is under development.
Maintenance of legacy
systems consume most IT
resources.
The information
infrastructure has been
formalized and is in use in
selected locations. Legacy
systems are rationalized and
aligned across the value
stream.
An information
infrastructure is
deployed that supports
seamless information
exchange across the
enterprise.
Information systems
are fully interoperable
and the pertinent
information is easily
accessible and usable
across the extended
enterprise.
Lean Indicators (Examples)
Evidence
Opportunities
LP #Lean Practices
Capability Levels
• Compatible information systems and tools exist across the extended enterprise.
• Information systems facilitate fast and effective transfer and retrieval of information required.
• Information systems and tools complement lean processes and practices and are easily adapted to accommodate change.
LP #Lean Practices
Capability Levels
• Intellectual capital is regarded as an asset.
• Employees have individual training plans, which are aligned to the current and projected skill base requirements.
• Employees actively capture and incorporate lessons learned into future training and practices.
DC DC DC DCDC
DC DC DC DCDC

110
Part III.B. Lean Process Enablers
Level 1 Level 2 Level 3 Level 4 Level 5
III.A.5.
Integration of
Environmental Protection,
Health and Safety into the
Enterprise“Cleaner, healthier,
safer”
The enterprise
complies with all
known legal and
regulatory requirements
and reacts if issues are
identified.
Consideration is given to
means of mitigating
conditions that cause
environmental, health
and safety issues.
A process is in place to
proactively identify
Environmental protection,
Health and Safety (EHS) risks
and manage them
appropriately, with a
preference for source
prevention.
Forward thinking solutions
to potential life cycle EHS
risks are implemented early
in product (service) design
and throughout the value
stream.
EHS risk prevention and
mitigation is part of the natural
way business is conducted
across the extended
enterprise, creating a
sustainable environment and
creating a capability
advantage.
Lean Indicators (Examples)
Evidence
Opportunities
LP #Lean Practices
Capability Levels
DC DC DC DCDC
Level 1 Level 2 Level 3 Level 4 Level 5
III.B.1.
Process Standardization
Strive for consistency
and re-use
Processes vary by
program or product
line.
Key processes in the
organization have been
identified that could
benefit from
standardization, with
initial efforts underway.
Selected processes are
standardized across the
enterprise.
Process standardization
and reuse is consistently
employed across the
enterprise.
Extended enterprise
interface processes
have been standardized.
Lean Indicators (Examples)
Evidence
Opportunities
LP #Lean Practices
Capability Levels
DC DC DC DCDCDC

111
Level 1 Level 2 Level 3 Level 4 Level 5
III.B.2.
Common Tools and SystemsAssuring compatibility,
reducing costs
Tools and systems vary
by program or work
center.
Have identified high
leverage opportunities
for common tools and
systems; initial
deployment in a few
areas.
Plans are in place for
achieving common tools
and systems and have
been implemented to
varying degrees across
the enterprise.
Common tools and
systems have been
implemented throughout
the enterprise.
Compatibility of tools
and systems with
those of enterprise
partners in the
extended enterprise.
Lean Indicators (Examples)
Evidence
Opportunities
Level 1 Level 2 Level 3 Level 4 Level 5
III.B.3.
Variation ReductionReduce uncertainty by
reducing variation
There is limited use of
variation reduction tools
and methods. There is
some evidence of variation
understanding in parts of
the organization.
There is evidence that
sources of variation are
being identified and
analyzed. Initial efforts
are underway to reduce
variability.
A formal approach that
balances customer
value and variation
reduction is
implemented in many
parts of the enterprise.
Considerable benefits
are realized from
reduced variation in
processes and practices
across the enterprise.
Benefits of reduced
variation are realized
across the extended
enterprise.
Lean Indicators (Examples)
Evidence
Opportunities
LP #Lean Practices
Capability Levels
• Process ownership and visual displays of process variation enable quick and easy identification of adverse trends.
• High levels of process stability are maintained by utilizing mistake proofing and root cause identification techniques to the
fullest.
• Variation reductions achieved enable short predicable lead times for information and material flow.
LP #Lean Practices
Capability Levels
• Policies have been established and deployed that require the use of common tools and systems throughout the enterprise.
• Common tools and systems provide easy access and reuse of knowledge across the product life cycle.
• Enterprise-wide use of common tools and systems provides enhanced compatibility between processes and aids employee
transfer.
DC DC DC DCDC
DC DC DC DCDC

112
APPENDIX F: GLESAT RESULTS DATA
SECTION 1 - LEAN TRANSFORMATION/LEADERSHIP
RESPONDENT/GROUP NUMBER
TTL LINK Lean Practice 1 2 3 4 5 6 7 8 9 10 11 12 13 14 15 16 17 18 19 20 21 22 23 24 25 26 27 28 29 30 31 32 33 34 35 36 37 38 39 40
I.A Enterprise strategic
planning I.A.1. Integration of lean in strategic planning process
Current
1 4 4 4 4 4 4 4 4 2 2 2 4 2 4 3 4 5 3 4 4 4 4 1 1 2 1 2 1 0 0 0 1 1 1 1 1 1 0 1 3 1 1 3Desired 5 5 5 5 5 5 5 5 5 5 4 4 5 4 5 4 5 5 4 5 5 5 5 2 4 4 3 4 3 4 1 1 2 3 4 3 5 3 3 3 5 4 3 5
I.A.2. Focus on customer value Current 1 3 3 3 3 3 1 3 1 2 3 1 2 3 3 4 3 1 2 4 3 3 3 1 1 1 1 1 2 3 3 1 3 3 2 1 2 1 3 3 3 2 1 3Desired 5 5 4 4 4 4 3 4 3 4 5 4 5 4 4 5 4 3 4 5 4 4 4 2 3 4 2 2 3 4 5 4 5 4 4 3 3 5 5 5 4 5 2 5
I.A.3. Leveraging the extended enterprise Current 1 3 3 2 3 4 3 3 1 1 1 1 2 3 3 3 4 1 2 2 3 3 2 1 2 2 1 2 2 2 1 2 4 2 1 1 4 3 3 2 2 4 1Desired 2 4 4 3 4 5 5 4 2 4 3 4 3 4 4 4 5 2 4 4 5 5 5 3 3 3 2 3 3 4 4 3 5 3 4 4 5 4 5 4 4 5 3
I.B Adopt Lean Paradigm I.B.1. Learning and education in ‘lean’ for enterprise leaders Current 1 4 3 3 2 4 2 3 3 4 2 3 2 4 3 5 3 5 3 2 4 3 2 2 2 1 2 2 1 1 2 2 1 0 1 2 2 2 2 2 2 2 4 2 2 2Desired 4 5 5 4 3 5 4 5 4 5 3 4 3 5 4 5 4 5 4 4 5 4 3 5 3 3 3 3 2 3 3 2 2 2 2 4 5 3 5 4 3 4 5 3 3 4
I.B.2. Senior management commitment Current 3 3 1 1 1 3 3 4 3 5 4 2 4 3 2 4 1 1 1 1 1 1 2 1 1 1 1 2 2 2 2 0 1 3 0 0 1Desired 4 5 2 4 2 4 4 5 4 5 4 3 5 4 4 5 2 3 2 3 2 2 4 3 4 4 3 4 4 3 5 3 2 4 5 3 2
I.B.3 Lean Enterprise Vision Current 1 3 4 4 2 2 2 4 2 2 3 1 1 4 3 3 3 4 3 2 3 2 2 2 1 1 1 1 1 1 0 1 1 1 1 1 2 2 0 0 1 0 1 1 2Desired 5 5 5 5 3 4 4 5 4 3 4 5 2 5 4 4 4 5 4 3 5 4 3 4 2 3 2 3 2 3 3 4 3 2 2 4 4 5 3 2 4 5 3 2 4
I.B.4. A sense of urgency Current 1 4 2 3 3 3 3 4 3 4 2 1 2 3 3 3 2 5 3 2 3 3 3 1 1 1 0 0 1 1 1 1 2 1 1 1 1 1 1 3 0 2 0 1 1 2Desired 5 5 4 4 4 5 5 5 4 5 3 4 3 5 4 4 4 5 5 3 4 5 5 4 2 3 1 2 3 3 3 2 5 2 2 4 3 2 5 4 2 4 4 3 2 3
I.C Focus on the Value Stream
I.C.1. Understanding the current value stream
Current
1 3 3 3 2 3 2 3 3 2 2 1 1 3 4 3 4 3 3 3 3 3 3 1 1 1 1 1 1 3 2 1 2 2 1 1 3 2 2 1 0 1 2Desired 3 4 4 4 3 5 3 4 4 4 3 5 2 4 5 4 5 5 3 5 4 5 5 2 4 2 2 2 3 5 4 3 3 3 3 3 3 3 3 3 4 3 3
I.C.2. Enterprise flow Current 1 3 3 2 3 2 2 3 2 2 2 2 3 2 3 4 3 3 2 2 2 3 1 1 1 1 1 1 2 3 2 3 2 1 1 2 2 3 3 3 4 2 1 2Desired 2 4 5 3 5 3 3 4 3 4 4 3 4 3 4 5 4 4 5 4 5 5 2 4 2 3 3 3 4 5 3 4 3 3 3 3 4 4 4 5 5 3 2 3
I.C.3. Designing the future value stream Current 1 3 2 2 4 2 2 2 3 1 1 2 2 2 3 2 5 3 3 2 3 3 1 0 0 1 1 1 1 2 1 2 3 2 2 2 1 2 1 1 3 4 1 1 1Desired 5 4 4 3 5 4 3 3 4 3 5 4 3 3 4 3 5 4 4 5 4 5 5 1 2 2 2 3 2 4 2 3 4 3 3 5 3 5 3 4 5 5 3 2 3
I.C.4. Performance measures Current 1 4 4 5 3 4 3 4 4 3 2 3 2 3 4 5 3 4 5 4 4 3 4 1 1 1 1 1 1 1 4 2 2 2 1 2 1 1 1 1 3 4 4 2 3 2Desired 5 5 5 5 4 5 4 5 5 4 5 4 4 4 5 5 5 5 5 4 5 4 5 3 2 3 2 2 3 3 5 3 3 4 2 4 5 3 5 2 5 5 5 4 5
I.D Develop lean Structure
and Behavior I.D.1. Enterprise organizational orientation
Current
1 3 2 3 3 4 1 3 3 2 2 1 3 3 4 3 4 3 2 2 3 3 2 1 1 1 1 1 3 3 3 2 3 2 1 1 2 2 1 3 3 4 2 3 2Desired 5 4 3 4 4 5 2 4 4 3 4 5 4 4 5 4 5 4 3 3 4 4 5 2 3 2 2 3 4 5 5 5 4 3 3 4 3 4 3 4 5 5 3 4 4
I.D.2. Relationships based on mutual trust Current 1 4 2 2 2 4 3 4 2 3 1 1 2 3 3 3 3 2 1 2 3 1 1 1 1 1 1 1 1 3 2 2 1 2 1 1 3 1 2 3 4 0 1 3 1Desired 5 5 3 4 3 5 5 5 3 4 3 5 3 4 4 4 4 4 2 3 5 4 4 2 4 2 2 3 3 5 5 3 4 3 3 4 4 4 3 4 5 5 3 4 4
I.D.3. Open and timely communications Current 1 3 3 4 3 4 3 3 3 2 1 1 2 2 3 4 3 4 2 2 2 3 3 2 2 2 1 1 1 2 3 3 2 1 1 2 2 3 3 3 2 4 4 1 4 1Desired 5 5 4 5 4 5 5 4 4 4 3 5 3 4 4 5 4 5 4 3 3 4 5 4 3 4 2 3 3 3 5 5 4 3 2 4 4 4 5 5 3 5 5 3 5 5
I.D.4. Employee empowerment Current 2 3 1 4 3 2 4 2 1 1 1 2 1 3 3 3 4 3 1 1 3 3 1 2 4 0 2 3 1 3 2 1 2 2 2 3 3 3 2 3 4 4 2 4 1Desired 5 4 5 5 4 4 5 3 3 3 4 4 3 4 4 4 5 5 2 2 4 4 3 5 2 4 4 3 4 3 4 4 3 4 4 3 5 4 4 5 5 4 5 4
I.D.5. Incentive alignment Current 2 3 2 1 2 3 1 2 2 1 1 1 1 1 1 1 3 1 2 1 2 1 1 1 1 0 0 0 1 2 1 1 2 1 1 1 1 1 0 3 4 1 2 1Desired 4 5 3 5 3 4 2 3 3 3 4 4 5 3 3 4 5 3 3 3 5 4 2 2 3 2 3 2 2 4 3 4 3 2 4 5 3 4 3 4 5 3 4 5
I.D.6. Innovation encouragement Current 1 1 2 1 3 3 2 2 1 1 1 2 1 3 1 2 1 1 3 2 2 2 1 1 1 1 1 1 3 3 2 2 2 2 1 1 1 2 4 3 1 3 1Desired 5 4 5 2 4 5 3 3 3 3 5 5 2 4 3 4 3 2 4 4 4 5 2 4 2 3 3 2 5 5 4 4 3 4 5 3 4 3 5 4 3 4 3
I.D.7. Lean change agents Current 1 1 2 2 3 1 2 2 4 2 2 2 1 2 2 2 2 3 2 2 2 1 1 1 1 0 1 0 2 1 3 1 2 1 2 2 0 3 0 1 2Desired 4 3 4 3 5 3 3 3 5 4 5 4 3 3 3 4 3 4 4 4 5 2 3 3 2 2 3 4 4 3 4 2 3 2 4 4 2 5 2 2 3
I.E Create and Refine
Implementation Plan I.E.1. Enterprise level lean implementation plan
Current
1 2 3 2 3 4 3 3 1 3 2 3 2 2 3 3 3 3 3 3 2 2 1 1 1 1 1 1 0 2 1 2 1 2 1 1 1 1 3 3 3 2 2 1Desired 5 4 5 3 4 5 4 4 2 4 4 4 3 3 3 4 4 4 4 3 4 3 5 2 3 3 2 2 2 4 4 3 2 3 3 3 2 5 4 4 3 3 3
I.E.2. Commit resources for lean improvements Current 1 3 3 1 3 3 2 2 2 3 2 1 2 2 2 3 4 2 3 2 3 2 3 1 2 2 1 1 1 2 2 1 2 2 2 1 2 1 2 0 3 2 0 2Desired 3 4 5 2 4 5 3 3 3 4 5 4 3 3 3 4 5 4 4 3 5 4 5 3 4 4 3 3 3 4 3 5 3 3 3 3 3 5 4 3 5 3 3 3
I.E.3. Provide education and training Current 1 2 3 3 2 4 2 2 3 2 3 1 2 2 1 2 3 3 1 1 2 3 2 1 1 1 1 1 1 1 2 2 1 2 1 1 1 1 1 1 2 3 3 1 3 1Desired 5 5 5 4 3 5 3 3 4 3 5 5 5 3 3 4 4 4 4 3 3 5 5 2 2 3 3 2 2 2 4 4 4 3 2 4 4 2 5 2 3 5 2 4 5
I.F Implement Lean Initiatives
I.F.1. Development of detailed plans based on enterprise plan
Current
3 2 3 3 1 4 2 3 3 1 2 2 1 2 2 2 4 3 2 1 1 2 2 2 1 1 1 1 1 1 3 1 2 2 2 1 1 1 1 1 2 3 1 0 1Desired 5 4 4 4 2 5 3 4 4 3 5 5 2 3 3 3 4 4 3 2 1 4 4 3 2 3 2 2 2 2 4 3 5 4 3 3 3 2 4 3 4 5 2 2 3
I.F.2. Tracking detailed implementation Current 1 3 3 3 3 4 3 3 3 2 3 1 1 2 3 3 3 4 3 3 5 3 3 2 1 1 2 0 1 1 3 1 1 1 2 2 1 2 2 1 0 1Desired 2 5 5 4 4 5 5 5 4 4 5 4 4 4 4 4 4 5 4 3 5 4 5 4 2 3 3 2 3 2 5 3 4 2 3 4 2 4 3 3 2 4
I.G Focus on Continuous
Improvement I.G.1. Structured continuous improvement process
Current
1 2 2 3 2 3 3 3 3 2 2 2 2 2 3 3 2 4 3 2 2 4 2 2 1 1 1 1 1 2 3 1 4 2 2 1 2 1 2 3 2 3 1 1 3Desired 5 4 3 4 3 5 4 4 4 4 5 5 3 4 4 4 4 5 4 3 4 5 3 4 2 3 3 3 3 3 5 4 5 4 3 3 3 2 4 3 4 4 2 2 4
I.G.2. Monitoring lean progress Current 2 3 2 3 2 4 3 3 2 3 2 2 2 3 2 3 3 4 3 2 5 3 3 2 1 2 1 1 1 1 0 2 3 1 2 2 1 1 2 2 4 4 1 2Desired 4 4 3 5 3 5 4 4 4 5 4 4 3 5 3 4 4 5 4 3 5 4 5 5 2 4 3 2 2 2 4 3 5 3 3 3 3 2 5 2 5 2 4
I.G.3. Nurturing the process Current 1 2 3 2 2 4 2 2 2 1 2 2 1 3 2 2 3 5 2 2 2 2 3 3 1 2 2 0 1 1 2 1 1 2 1 2 1 1 1 3 3 2 1 2Desired 2 4 5 3 3 5 3 3 3 3 4 5 2 5 3 3 5 5 4 3 3 4 5 4 2 4 3 3 2 2 5 4 4 5 2 4 4 3 5 3 5 3 2 5
I.G.4. Capturing lessons learned Current 1 1 3 2 4 2 2 1 1 3 1 2 3 2 2 3 2 2 2 2 3 1 2 1 1 1 1 1 1 3 1 3 3 1 2 1 2 1 5 3 1 3 2Desired 4 5 4 3 5 3 4 3 5 5 4 3 4 3 3 5 4 4 3 3 4 3 4 2 4 3 3 3 3 5 4 4 5 2 4 3 4 5 5 5 3 4 4
I.G.5. Impacting enterprise strategic planning Current 1 3 2 2 2 3 3 3 3 3 2 2 2 2 2 3 4 2 2 3 4 2 2 1 1 2 0 1 1 1 2 2 1 1 1 1 1 3 4 1 0 1Desired 2 4 4 4 3 5 4 4 5 5 4 4 3 4 3 4 5 4 3 4 5 4 2 2 3 3 2 3 2 3 3 4 2 3 5 2 4 4 5 3 2 3

113
SECTION II - LIFE CYCLE PROCESSES
RESPONDENT/GROUP NUMBER
TTL LINK Lean Practice 1 2 3 4 5 6 7 8 9 10 11 12 13 14 15 16 17 18 19 20 21 22 23 24 25 26 27 28 29 30 31 32 33 34 35 36 37 38 39 40
II.A. Set-up the Enterprise II.A.1. Leverage lean capability for new opportunities Current 1 3 3 2 2 2 3 1 3 2 3 1 2 1 2 3 3 2 1 2 3 3 1 1 1 1 1 1 1 2 1 2 3 1 1 2 1 1 2 2 3 1 1 2Desired 3 4 4 3 3 4 4 2 5 4 4 2 3 3 3 5 4 4 2 3 4 4 2 2 4 3 2 2 2 3 2 4 4 2 2 4 3 5 3 4 5 2 2 4
II.A.2. Optimise the capability and utilization of assets Current 1 1 3 1 2 4 2 2 2 1 2 1 2 3 2 2 4 2 2 2 3 3 2 1 2 0 2 1 2 2 2 2 2 1 1 2 2 2 0 1 3 3 2 2 2Desired 2 3 4 2 3 5 3 4 3 4 3 5 3 4 3 4 5 4 2 4 5 4 2 2 4 1 3 3 3 4 3 4 3 2 3 4 3 5 2 4 5 5 3 3 3
II.A.3. Provide capability to manage risk, cost, schedule and
performance
Current
1 1 4 2 2 2 2 2 2 2 1 1 3 2 3 4 4 2 2 2 2 3 2 1 1 1 1 1 1 3 2 4 1 1 1 1 1 2 2 3 4 2 2 1Desired 3 5 5 3 4 3 3 4 4 3 5 3 4 3 4 4 5 4 3 3 4 5 2 2 3 2 3 2 2 5 3 5 3 2 3 4 2 5 3 4 5 4 3 3
II.A.4. Allocate resources for program/project development
efforts
Current
2 1 3 1 3 3 3 2 1 2 2 2 2 2 2 3 4 3 1 3 3 3 3 1 2 1 1 1 2 3 2 3 2 1 2 2 1 3 4 3 3 1 3 2Desired 4 3 4 2 4 5 4 3 2 3 4 4 3 3 3 4 5 4 2 4 4 4 4 2 4 3 3 3 3 5 4 5 4 2 4 4 3 5 4 5 4 3 4 4
II. B. Build Relationships II.B.1. Define and develop relationships with stakeholders Current 1 3 3 2 4 3 3 2 1 3 2 2 3 3 2 4 1 2 3 2 2 3 1 2 2 1 1 2 4 2 1 1 2 2 2 1 3 1 3 3 3 1 4 1Desired 3 5 4 3 5 4 4 3 4 4 4 4 4 3 4 5 3 3 4 4 3 5 2 4 3 2 3 3 5 4 5 4 3 4 4 3 5 3 5 4 4 3 5 3
II.B.2. Optimize the relationship Current 1 3 4 2 4 3 3 2 3 2 1 2 3 3 3 3 1 3 2 3 2 3 2 2 2 2 2 2 3 1 2 3 2 1 1 3 3 3 2 3 3 2 3 2Desired 4 4 5 3 5 4 4 3 5 4 5 3 4 3 4 4 3 3 3 4 4 5 3 4 3 2 3 3 5 4 5 5 3 3 3 4 5 4 3 4 4 3 4 4
II.B.3. Foster innovation and knowledge-sharing Current 1 2 3 1 2 3 2 3 1 2 2 2 2 2 2 2 1 2 1 1 4 4 2 2 1 1 2 1 1 2 2 1 2 2 2 1 2 3 2 2 3 3 2 3 1Desired 5 4 4 2 3 5 3 4 2 4 3 4 3 3 3 3 3 3 3 2 5 5 3 4 2 4 3 2 2 5 2 5 4 3 3 4 3 5 3 4 5 5 3 4 3
II.C. Develop the Plan II.C.1. Establish a requirements definition process to optimize
life cycle value
Current
1 2 2 2 4 3 2 4 3 2 1 2 2 2 4 2 2 4 3 2 1 1 1 1 1 1 3 1 3 2 2 1 2 1 1 4 2 2 1 3Desired 3 3 3 3 5 4 4 5 5 4 4 4 3 3 5 4 3 5 4 3 3 2 4 2 3 1 4 3 4 3 3 3 4 4 2 5 4 4 2 3
II.C.2. Capture data from the extended enterprise to optimize
future requirement definitions
Current
1 3 3 3 2 4 2 3 3 1 3 3 1 3 2 4 1 3 5 3 2 4 2 2 1 1 1 4 2 4 2 1 2 1 2 3 2 3 2Desired 3 4 5 4 4 5 5 4 5 3 4 4 3 4 3 5 3 3 5 4 3 5 3 4 3 3 3 5 4 5 4 2 4 3 4 3 4 4
II.C.3. Incorporate stakeholder value into design of products
and processes
Current
1 3 4 2 2 3 2 2 2 1 2 2 2 2 2 3 2 2 2 1 4 2 2 0 1 1 2 3 1 2 2 2 1 1 1 2 2 1 2 1Desired 3 4 5 3 3 4 4 4 3 2 4 4 3 4 3 4 3 2 4 3 2 5 3 4 3 2 3 3 4 3 4 4 3 2 3 3 4 3 2 3 3
II.C.4. Incorporate downstream stakeholder values into
products and processes
Current
1 2 4 1 2 4 2 2 4 2 1 4 2 2 2 2 1 4 2 3 2 1 1 3 2 2 2 1 3 2 3 2 2 2 2 2 3 2Desired 2 4 5 2 3 5 3 3 5 5 3 5 3 3 4 3 4 5 4 3 3 4 3 4 3 4 4 3 4 4 5 3 3 4 3 5 5 3
II.C.5. Create a multidisciplinary approach Current 1 3 2 1 2 3 2 3 2 1 2 3 2 2 2 1 2 2 2 2 1 2 1 0 2 1 1 4 2 4 2 2 2 1 2 2 1 4 2 2 1Desired 4 4 3 2 3 4 3 5 5 5 3 4 4 3 2 4 2 3 3 5 3 3 4 1 4 3 3 5 4 5 3 3 3 4 3 5 2 5 3 3 5
II.D. Implement the Plan II.D.1. Utilize knowledge and capability in decision making Current 1 3 3 1 1 3 2 3 3 3 2 1 2 2 2 2 1 4 1 2 1 1 2 1 1 2 1 3 2 3 2 1 1 1 1 2 3 2 3 2 2 2Desired 4 4 5 2 2 5 4 4 4 5 4 4 4 3 3 4 2 4 3 5 4 2 4 4 3 3 3 4 3 4 3 2 3 3 3 4 5 5 3 3 3
II.D.2. Foster lean behavior throughout the value stream Current 1 3 2 2 2 3 3 2 3 3 2 1 2 3 2 2 1 4 2 3 2 2 2 2 1 2 1 1 1 1 2 1 2 3 1 2 1 2 1 2 1 3 3 1 3 1Desired 4 4 3 3 3 5 4 3 4 4 5 4 3 4 4 3 3 5 4 3 4 4 4 2 2 4 4 4 3 3 4 3 5 4 2 4 4 3 5 4 2 4 5 2 4 3
II.D.3. Align customer requirements and expectations with the
extended enterprise
Current
1 3 3 2 3 2 2 3 3 1 2 3 2 2 1 4 1 2 2 2 2 3 2 1 1 1 1 3 2 3 1 2 2 1 2 1 4 1 3 1 3 1Desired 4 4 4 3 4 3 3 4 4 4 4 4 4 3 3 5 3 3 3 3 4 4 3 3 3 3 2 5 3 5 3 3 3 3 3 5 5 3 5 3 3 3
II.D.4. Transition product/service in a lean fashion Current 1 2 2 2 3 1 3 1 3 1 1 2 2 2 1 2 1 2 1 2 3 2 1 1 1 1 1 2 2 2 2 2 2 1 2 1 3 3 2 2Desired 5 4 4 3 4 3 4 3 4 4 5 5 4 3 2 3 2 4 3 4 3 3 3 3 3 3 2 4 3 3 3 3 3 4 3 4 4 3 4
II.E. Learn, Improve and
SustainII.E.1. Enhance value of delivered products and services to
customers and the enterprise
Current
1 2 3 2 3 1 3 2 3 2 2 3 2 3 2 3 3 2 2 1 3 3 2 2 2 2 2 1 3 2 1 1 1 1 1 1 2 1 2 3 2 2Desired 4 3 4 3 4 2 4 3 5 4 4 4 3 4 3 4 4 3 3 3 5 5 3 4 3 3 3 3 5 5 2 3 3 3 3 5 3 3 5 3 2
II.E.2. Provide post delivery service, support and sustainability Current 1 3 3 2 3 2 3 3 2 2 2 2 3 3 1 1 1 3 3 3 2 1 2 1 1 1 2 2 4 2 1 2 1 2 2 3 1Desired 5 5 5 3 5 3 4 5 4 5 4 3 4 3 2 3 3 4 4 4 5 2 4 3 2 2 4 3 5 3 3 4 3 4 4 2
II.E.3. Maintain challenge of existing processes Current 1 3 2 3 2 4 2 2 3 3 1 2 2 2 3 3 2 2 1 2 2 2 2 1 2 1 2 1 1 3 2 2 2 1 2 1 1 2 2 3 3 1 2 3Desired 5 5 4 4 3 5 4 3 4 4 4 4 3 3 4 4 3 3 3 3 4 3 4 2 4 3 4 3 3 4 3 3 4 2 4 2 3 4 4 5 2 3 3
SECTION III - ENABLING INFRASTRUCTURE
RESPONDENT/GROUP NUMBER
TTL LINK Lean Practice 1 2 3 4 5 6 7 8 9 10 11 12 13 14 15 16 17 18 19 20 21 22 23 24 25 26 27 28 29 30 31 32 33 34 35 36 37 38 39 40
III.A. Lean Organizational
Enablers III.A.1. Financial system supports lean transformation
Current
1 2 1 2 4 2 2 4 1 1 1 2 2 3 1 2 1 2 3 2 1 1 2 1 1 2 1 2 1 2 2 2 1 2 1 1 1Desired 2 4 2 3 5 4 3 5 3 5 5 4 3 4 3 3 3 3 5 2 2 4 3 3 2 4 2 3 3 3 3 4 3 5 2 2 2
III.A.2. Enterprise stakeholders pull required financial
information
Current
1 3 2 2 2 2 2 2 2 1 2 1 3 2 1 2 2 2 2 2 1 1 1 1 1 1 2 2 1 3 2 1 2 1 1 4 3 2Desired 3 4 3 4 3 5 4 3 5 3 4 5 5 3 3 3 2 3 3 3 2 3 3 3 3 2 4 5 2 4 3 2 3 3 4 5 4 3
III.A.3. Promulgate the learning organization Current 1 1 3 3 2 4 2 1 3 3 2 1 2 2 3 1 1 2 2 1 2 1 1 1 2 1 2 3 1 2 2 2 1 1 1 1 1 4 1 3 2 1Desired 2 3 5 4 3 5 3 3 4 5 4 5 3 3 4 4 3 3 3 3 4 2 3 3 5 2 4 5 4 3 5 3 3 3 3 5 3 5 3 3 2
III.A.4. Enable the lean enterprise with information systems and
tools
Current
1 2 2 4 2 4 2 2 1 2 2 1 2 2 4 4 2 3 2 2 2 1 2 1 2 2 2 4 1 4 1 2 1 2 1 3 2 2 3 2 2Desired 5 4 5 5 3 5 4 3 2 3 4 4 4 3 4 5 4 4 4 4 3 2 4 4 3 4 3 5 5 5 2 4 3 3 5 4 5 4 3 3
III.A.5. Integration of environmental protection, heath and safety
into the enterprise
Current
1 3 3 2 3 3 2 1 3 2 1 1 3 1 4 1 3 3 3 3 3 1 2 1 1 1 1 2 1 2 5 3 3 2 3 3 1 3 3 1 2 2Desired 5 5 5 3 5 4 3 2 4 5 5 3 5 2 5 2 3 4 4 5 3 2 4 3 3 3 2 4 3 3 5 4 5 4 4 4 1 5 5 2 3 4
III.B. Lean Process Enablers III.B.1. Process standardization Current 1 4 2 2 2 4 2 3 4 1 3 1 2 2 4 1 4 3 3 3 2 2 2 1 2 2 1 1 1 3 1 3 4 1 2 1 3 1 1 4 2 4 1 3 3Desired 2 5 3 3 3 5 4 5 5 3 5 4 4 3 5 2 4 4 3 4 4 4 4 2 4 4 3 3 1 4 3 5 5 2 4 3 4 5 2 4 5 2 4 5
III.B.2. Common tools and systems Current 1 1 3 3 2 4 2 2 4 3 2 1 2 3 2 2 4 2 4 3 3 1 1 1 1 1 1 1 4 1 2 1 1 2 1 4 1 4 1 4 1 2 4Desired 5 2 5 4 3 5 3 3 5 4 4 5 4 4 3 4 5 3 5 4 4 4 2 3 3 3 3 2 5 3 4 3 2 3 4 5 2 3 2 3 5
III.B.3. Variation reduction Current 1 1 4 2 4 2 3 2 1 1 1 2 2 3 1 2 2 3 2 2 2 2 2 1 1 1 2 2 3 1 2 1 3 1 4 3 3 1 2 3Desired 3 2 5 3 5 3 4 3 3 3 4 4 4 4 2 3 3 4 4 4 4 3 4 2 2 2 3 5 4 2 3 4 5 4 4 4 2 3 5
Management
Staff

114
APPENDIX G: NON-LEAN GROUP ANALYSIS
SECTION 1 - LEAN TRANSFORMATION/LEADERSHIP
Section X.X Averages
TTL LINK Current Desired Gap
I.A Enterprise strategic
planning 1.7 3.6 1.9
I.B Adopt Lean Paradigm 1.2 3.1 1.9
I.C Focus on the Value
Stream 1.7 3.3 1.6
I.D Develop lean Structure
and Behavior 1.8 3.6 1.8
I.E Create and Refine
Implementation Plan 1.5 3.2 1.8
I.F Implement Lean
Initiatives 1.3 3.0 1.7
I.G Focus on Continuous
Improvement 1.6 3.3 1.7
SECTION II - LIFE CYCLE PROCESSES
Section X.X Averages
TTL LINK Current Desired Gap
II.A. Set-up the Enterprise 1.7 3.3 1.6
II. B. Build Relationships 2.0 3.6 1.6
II.C. Develop the Plan 1.9 3.4 1.6
II.D. Implement the Plan 1.7 3.4 1.7
II.E. Learn, Improve and
Sustain 1.8 3.3 1.6
SECTION III - ENABLING INFRASTRUCTURE
Section X.X Averages
TTL LINK Current Desired Gap
III.A. Lean Organizational
Enablers 1.8 3.4 1.6
III.B. Lean Process Enablers 2.0 3.3 1.5

115
SECTION 1 - LEAN TRANSFORMATION/LEADERSHIP
TALLYS
TTL LINK Lean Practice State Mean Variance Range Level 1 Level 2 Level 3 Level 4 Level 5
I.A Enterprise strategic
planningI.A.1. Integration of lean in strategic
planning process Current1.1 0.7 3.0 15 2 2 0 0
Desired 3.3 1.3 4.0 2 2 8 6 3
Gap 2.2 0.8 3.0 4 11 4 2 0
I.A.2. Focus on customer value Current 2.0 0.8 2.0 5 4 8 0 0
Desired 3.8 1.3 3.0 0 4 4 6 7
Gap 1.8 0.8 3.0 6 8 3 1 0
I.A.3. Leveraging the extended enterprise Current 2.1 1.0 3.0 5 9 2 3 0
Desired 3.7 0.7 3.0 0 1 8 7 4
Gap 1.6 0.6 2.0 9 6 3 0 0
I.B Adopt Lean ParadigmI.B.1. Learning and education in ‘lean’ for
enterprise leaders Current1.8 0.6 4.0 2 15 0 1 0
Desired 3.2 0.9 3.0 0 5 10 4 3
Gap 1.5 0.5 3.0 9 7 2 0 0
I.B.2. Senior management commitment Current 1.2 0.6 3.0 7 5 1 0 0
Desired 3.2 1.0 3.0 0 6 7 6 2
Gap 2.0 1.1 4.0 6 7 5 0 1
I.B.3 Lean Enterprise Vision Current 1.0 0.3 2.0 9 3 0 0 0
Desired 3.1 1.0 3.0 0 7 7 5 2
Gap 2.1 1.0 4.0 5 8 6 0 1
I.B.4. A sense of urgency Current 1.0 0.5 3.0 14 3 1 0 0
Desired 2.9 1.1 4.0 0 8 7 4 2
Gap 1.9 0.9 3.0 10 9 2 2 0
I.C Focus on the Value
StreamI.C.1. Understanding the current value
stream Current1.5 0.6 3.0 6 6 2 0 0
Desired 3.1 0.6 3.0 0 4 12 3 1
Gap 1.6 0.8 4.0 9 8 1 1 0
I.C.2. Enterprise flow Current 1.9 0.8 3.0 5 7 5 1 0
Desired 3.4 0.8 3.0 0 3 10 6 3
Gap 1.5 0.4 2.0 14 9 1 0 0
I.C.3. Designing the future value stream Current 1.5 0.9 4.0 9 6 2 1 0
Desired 3.1 1.4 4.0 0 6 8 3 4
Gap 1.6 0.5 2.0 8 8 3 0 0
I.C.4. Performance measures Current 1.9 1.2 3.0 10 6 2 3 0
Desired 3.6 1.5 3.0 0 5 6 3 7
Gap 1.8 0.9 3.0 6 8 1 2 0
I.D Develop lean Structure
and Behavior I.D.1. Enterprise organizational orientation Current2.0 0.9 3.0 6 6 7 1 0
Desired 3.6 1.0 3.0 0 3 7 7 5
Gap 1.6 0.4 2.0 11 9 2 0 0
I.D.2. Relationships based on mutual trust Current 1.6 1.0 4.0 10 4 4 1 0
Desired 3.6 0.9 3.0 0 3 7 8 4
Gap 2.0 1.2 4.0 10 5 6 0 1
I.D.3. Open and timely communications Current 2.2 1.1 3.0 6 7 5 3 0
Desired 3.9 1.1 3.0 0 2 7 5 8
Gap 1.7 0.5 3.0 9 12 0 1 0
I.D.4. Employee empowerment Current 2.4 1.2 4.0 1 8 6 4 0
Desired 4.0 0.6 3.0 0 1 4 11 5
Gap 1.5 0.6 3.0 9 8 2 0 0
I.D.5. Incentive alignment Current 1.2 1.0 4.0 12 3 1 1 0
Desired 3.3 1.0 3.0 0 5 7 6 3
Gap 2.1 0.9 3.0 7 8 5 2 0
I.D.6. Innovation encouragement Current 1.8 0.9 3.0 8 5 4 1 0
Desired 3.6 1.0 3.0 0 3 7 7 4
Gap 1.8 0.7 3.0 8 10 2 1 0
I.D.7. Lean change agents Current 1.3 0.8 3.0 5 5 2 0 0
Desired 3.0 0.9 3.0 0 8 6 5 1
Gap 1.7 0.5 3.0 10 11 0 1 0
I.E Create and Refine
Implementation PlanI.E.1. Enterprise level lean implementation
plan Current1.5 0.7 3.0 11 5 3 0 0
Desired 3.0 0.7 3.0 0 6 9 4 1
Gap 1.6 0.7 3.0 11 7 1 1 0I.E.2. Commit resources for lean
improvements Current1.5 0.6 3.0 4 11 1 0 0
Desired 3.5 0.6 2.0 0 0 14 4 3
Gap 2.0 0.8 3.0 10 10 2 2 0
I.E.3. Provide education and training Current 1.5 0.5 2.0 14 4 3 0 0
Desired 3.2 1.3 3.0 0 8 4 6 3
Gap 1.8 1.1 3.0 12 5 3 2 0
I.F Implement Lean
InitiativesI.F.1. Development of detailed plans based
on enterprise plan Current1.3 0.5 3.0 12 4 2 0 0
Desired 3.0 1.0 3.0 0 8 7 4 2
Gap 1.7 0.4 2.0 5 10 2 0 0
I.F.2. Tracking detailed implementation Current 1.3 0.6 3.0 6 5 1 0 0
Desired 3.0 0.8 3.0 0 6 7 4 1
Gap 1.7 0.4 2.0 7 9 2 0 0
I.G Focus on Continuous
ImprovementI.G.1. Structured continuous improvement
process Current1.8 0.9 3.0 6 6 4 1 0
Desired 3.3 0.8 3.0 0 4 9 6 2
Gap 1.5 0.5 3.0 10 9 1 0 0
I.G.2. Monitoring lean progress Current 1.7 1.1 4.0 7 7 1 2 0
Desired 3.1 1.2 3.0 0 7 6 3 3
Gap 1.5 0.8 4.0 8 6 1 1 0
I.G.3. Nurturing the process Current 1.5 0.6 3.0 9 7 2 0 0
Desired 3.5 1.3 3.0 0 5 5 5 5
Gap 2.0 1.2 4.0 4 4 7 1 0
I.G.4. Capturing lessons learned Current 1.9 1.3 4.0 7 3 5 0 1
Desired 3.8 0.9 3.0 0 2 6 7 5
Gap 1.9 0.7 4.0 3 12 2 1 0I.G.5. Impacting enterprise strategic
planning Current1.3 0.9 4.0 12 3 1 1 0
Desired 3.1 0.9 3.0 0 6 8 3 2
Gap 1.7 0.6 3.0 6 9 1 1 0

116
SECTION II - LIFE CYCLE PROCESSES
TALLYS
TTL LINK Lean Practice State Mean Variance Range Level 1 Level 2 Level 3 Level 4 Level 5
II.A. Set-up the EnterpriseII.A.1. Leverage lean capability for new
opportunities Current1.5 0.5 2.0 10 6 2 0 0
Desired 3.0 1.1 3.0 0 9 4 6 2
Gap 1.6 0.7 3.0 10 7 1 1 0II.A.2. Optimise the capability and
utilization of assets Current1.7 0.6 3.0 6 13 2 0 0
Desired 3.3 1.1 4.0 0 3 10 5 3
Gap 1.6 0.4 2.0 9 9 2 0 0II.A.3. Provide capability to manage risk,
cost, schedule and performance Current1.7 1.0 3.0 11 5 2 2 0
Desired 3.2 1.2 3.0 0 6 8 3 4
Gap 1.5 0.5 2.0 9 7 2 0 0II.A.4. Allocate resources for
program/project development efforts Current2.0 0.8 3.0 5 7 6 1 0
Desired 3.7 0.8 3.0 0 2 6 9 4
Gap 1.7 0.3 2.0 4 15 0 0 0
II. B. Build RelationshipsII.B.1. Define and develop relationships with
stakeholders Current2.0 1.0 3.0 8 7 4 2 0
Desired 3.7 0.9 3.0 0 2 8 7 5
Gap 1.7 0.6 3.0 5 11 1 1 0
II.B.2. Optimize the relationship Current 2.2 0.5 2.0 4 11 8 0 0
Desired 3.7 0.7 3.0 0 1 9 8 4
Gap 1.5 0.5 3.0 12 7 2 0 0II.B.3. Foster innovation and knowledge-
sharing Current1.9 0.5 2.0 3 10 4 0 0
Desired 3.5 1.2 3.0 0 4 7 5 5
Gap 1.7 0.9 4.0 10 6 3 1 0
II.C. Develop the PlanII.C.1. Establish a requirements definition
process to optimize life cycle value Current1.7 0.9 3.0 7 5 3 1 0
Desired 3.2 1.0 4.0 0 4 6 7 1
Gap 1.4 0.7 3.0 9 6 2 0 0II.C.2. Capture data from the extended
enterprise to optimize future requirement
definitions Current
2.1 0.9 3.0 4 8 2 2 0
Desired 3.6 0.7 3.0 0 1 6 7 2
Gap 1.6 0.3 1.0 4 10 0 0 0II.C.3. Incorporate stakeholder value into
design of products and processes Current1.5 0.5 3.0 8 9 1 0 0
Desired 3.1 0.4 2.0 0 3 11 5 0
Gap 1.6 0.4 2.0 7 9 1 0 0
II.C.4. Incorporate downstream stakeholder
vlues into products and processes Current
2.1 0.3 2.0 0 10 3 0 0
Desired 3.8 0.6 2.0 0 0 6 5 3
Gap 1.6 0.4 2.0 7 7 1 0 0
II.C.5. Create a multidisciplinary approach Current 1.9 1.1 4.0 5 10 0 3 0
Desired 3.6 1.2 4.0 0 1 9 4 5
Gap 1.7 0.9 3.0 13 4 3 1 0
II.D. Implement the PlanII.D.1. Utilize knowledge and capability in
decision making Current1.8 0.6 2.0 8 9 4 0 0
Desired 3.4 0.7 3.0 0 2 11 5 2
Gap 1.6 0.4 2.0 7 9 1 0 0II.D.2. Foster lean behavior throughout the
value stream Current1.6 0.6 2.0 10 6 4 0 0
Desired 3.5 0.9 3.0 0 4 5 10 3
Gap 1.9 0.8 3.0 11 9 4 1 0II.D.3. Align customer requirements and
expectations with the extended enterprise Current 1.8 0.9 3.0 10 5 4 1 0
Desired 3.5 0.9 3.0 0 1 14 0 5
Gap 1.7 0.7 4.0 8 11 0 1 0II.D.4. Transition product/service in a lean
fashion Current1.7 0.4 2.0 4 10 2 0 0
Desired 3.2 0.3 2.0 0 1 12 5 0
Gap 1.6 0.5 2.0 10 6 2 0 0
II.E. Learn, Improve and
Sustain
II.E.1. Enhance value of delivered products
and services to customers and the
enterprise Current
1.7 0.4 2.0 12 10 2 0 0
Desired 3.4 0.9 3.0 0 2 12 1 4
Gap 1.6 0.8 4.0 4 8 1 1 0II.E.2. Provide post delivery service, support
and sustainability Current1.8 0.7 3.0 5 7 1 1 0
Desired 3.2 0.9 3.0 0 4 5 5 1
Gap 1.5 0.3 1.0 5 8 0 0 0II.E.3. Maintain challenge of existing
processes Current1.8 0.6 2.0 7 9 4 0 0
Desired 3.3 0.7 3.0 0 4 8 7 1
Gap 1.5 0.4 2.0 6 11 0 0 0

117
SECTION III - ENABLING INFRASTRUCTURE
TALLYS
TTL LINK Lean Practice State Mean Variance Range Level 1 Level 2 Level 3 Level 4 Level 5
III.A. Lean Organizational
Enablers III.A.1. Financial system supports lean
transformation Current1.4 0.3 1.0 8 7 0 0 0
Desired 2.9 0.8 3.0 0 6 7 3 1
Gap 1.5 0.5 2.0 8 5 2 0 0III.A.2. Enterprise stakeholders pull
required financial information Current1.6 0.8 3.0 7 5 2 1 0
Desired 3.2 0.8 3.0 0 4 9 4 2
Gap 1.6 0.5 2.0 12 7 2 0 0III.A.3. Promulgate the learning
organization Current1.7 0.7 3.0 11 7 2 1 0
Desired 3.5 1.1 3.0 0 3 9 3 5
Gap 1.9 0.7 3.0 6 9 3 1 0III.A.4. Enable the lean enterprise with
information systems and tools Current2.1 0.9 3.0 6 9 3 2 0
Desired 3.8 1.1 3.0 0 2 6 5 6
Gap 1.8 1.1 3.0 10 5 2 2 0III.A.5. Integration of environmental
protection, heath and safety into the
enterprise Current
2.0 1.1 4.0 3 7 5 0 1
Desired 3.4 1.2 4.0 2 3 6 8 3
Gap 1.4 0.5 2.0 8 11 0 0 0
III.B. Lean Process
Enablers III.B.1. Process standardization Current2.0 1.3 3.0 10 3 5 3 0
Desired 3.5 1.5 4.0 0 4 5 6 5
Gap 1.6 0.7 4.0 11 10 0 1 0
III.B.2. Common tools and systems Current 2.0 1.6 3.0 9 3 1 5 0
Desired 3.2 1.1 3.0 0 5 8 3 3
Gap 1.5 0.4 2.0 12 7 1 0 0
III.B.3. Variation reduction Current 1.9 0.9 3.0 7 6 4 1 0
Desired 3.4 1.2 3.0 0 5 4 5 3
Gap 1.5 0.6 2.0 9 3 3 0 0

118
APPENDIX H: LEAN GROUP DATA AND ANALYSIS
SECTION 1 - LEAN TRANSFORMATION/LEADERSHIP
Section X.X Averages
TTL LINK Current Desired Gap
I.A Enterprise strategic
planning 2.8 4.3 1.5
I.B Adopt Lean Paradigm 2.8 4.2 1.4
I.C Focus on the Value
Stream 2.7 4.1 1.4
I.D Develop lean Structure
and Behavior 2.2 3.9 1.7
I.E Create and Refine
Implementation Plan 2.3 3.9 1.6
I.F Implement Lean
Initiatives 2.5 3.9 1.4
I.G Focus on Continuous
Improvement 2.4 3.9 1.5
SECTION II - LIFE CYCLE PROCESSES
Section X.X Averages
TTL LINK Current Desired Gap
II.A. Set-up the Enterprise 2.2 3.6 1.4
II. B. Build Relationships 2.3 3.7 1.4
II.C. Develop the Plan 2.3 3.7 1.4
II.D. Implement the Plan 2.1 3.7 1.6
II.E. Learn, Improve and
Sustain 2.3 3.8 1.5
SECTION III - ENABLING INFRASTRUCTURE
Section X.X Averages
TTL LINK Current Desired Gap
III.A. Lean Organizational
Enablers 2.1 3.7 1.6
III.B. Lean Process Enablers 2.3 3.8 1.5

119
SECTION 1 - LEAN TRANSFORMATION/LEADERSHIP
TALLYS
TTL LINK Lean Practice State Mean Variance Range Level 1 Level 2 Level 3 Level 4 Level 5
I.A Enterprise strategic
planningI.A.1. Integration of lean in strategic
planning process Current3.5 1.0 4.0 0 4 2 15 1
Desired 4.8 0.2 1.0 0 0 0 5 18
Gap 1.3 0.7 4.0 12 3 1 1 0
I.A.2. Focus on customer value Current 2.5 0.9 3.0 3 3 13 2 0
Desired 4.1 0.4 2.0 0 0 3 14 6
Gap 1.6 0.7 3.0 11 7 2 1 0
I.A.3. Leveraging the extended enterprise Current 2.3 1.0 3.0 7 5 10 2 0
Desired 3.9 0.9 3.0 0 3 3 11 6
Gap 1.5 0.5 2.0 10 6 3 0 0
I.B Adopt Lean ParadigmI.B.1. Learning and education in ‘lean’ for
enterprise leaders Current3.0 1.0 4.0 0 7 9 5 2
Desired 4.3 0.5 2.0 0 0 4 10 10
Gap 1.3 0.5 3.0 18 4 2 0 0
I.B.2. Senior management commitment Current 2.9 1.5 4.0 6 2 6 4 1
Desired 4.0 0.9 3.0 0 2 1 8 5
Gap 1.1 0.5 3.0 16 2 1 0 0
I.B.3 Lean Enterprise Vision Current 2.6 0.9 3.0 4 9 7 5 0
Desired 4.1 0.7 3.0 0 1 4 10 9
Gap 1.5 0.8 3.0 18 7 0 2 0
I.B.4. A sense of urgency Current 2.8 1.0 4.0 3 5 12 3 1
Desired 4.3 0.5 2.0 0 0 3 10 11
Gap 1.6 0.8 4.0 12 8 2 1 0
I.C Focus on the Value
StreamI.C.1. Understanding the current value
stream Current2.7 0.7 3.0 4 4 14 2 0
Desired 4.0 0.8 3.0 0 1 5 9 8
Gap 1.4 0.6 4.0 12 7 0 1 0
I.C.2. Enterprise flow Current 2.5 0.5 3.0 0 11 9 1 0
Desired 3.9 0.8 3.0 0 1 6 9 6
Gap 1.5 0.5 2.0 13 6 2 0 0
I.C.3. Designing the future value stream Current 2.3 1.0 4.0 5 10 7 1 1
Desired 4.0 0.6 2.0 0 0 7 9 7
Gap 1.7 1.2 4.0 13 5 1 3 0
I.C.4. Performance measures Current 3.4 1.2 4.0 1 2 7 10 3
Desired 4.6 0.3 2.0 0 0 1 8 15
Gap 1.2 0.8 4.0 12 3 1 1 0
I.D Develop lean Structure
and Behavior I.D.1. Enterprise organizational orientation Current2.6 0.8 3.0 2 6 11 3 0
Desired 4.0 0.6 3.0 0 1 4 12 6
Gap 1.4 0.9 3.0 16 1 1 2 0
I.D.2. Relationships based on mutual trust Current 2.3 1.0 3.0 7 7 7 3 0
Desired 4.0 0.8 3.0 0 1 6 9 7
Gap 1.7 1.0 3.0 13 5 2 2 0
I.D.3. Open and timely communications Current 2.6 0.9 3.0 4 7 10 4 0
Desired 4.2 0.5 2.0 0 0 4 11 9
Gap 1.6 0.8 3.0 12 8 0 2 0
I.D.4. Employee empowerment Current 2.3 1.2 3.0 9 4 8 3 0
Desired 3.9 0.8 3.0 0 2 5 10 6
Gap 1.6 0.7 3.0 11 7 2 1 0
I.D.5. Incentive alignment Current 1.6 0.5 2.0 18 7 3 0 0
Desired 3.6 0.9 3.0 0 2 10 6 5
Gap 2.0 1.0 3.0 2 8 5 2 0
I.D.6. Innovation encouragement Current 1.7 0.6 2.0 10 8 4 0 0
Desired 3.7 1.1 3.0 0 3 6 7 6
Gap 2.0 1.0 3.0 6 8 4 2 0
I.D.7. Lean change agents Current 2.0 0.5 3.0 2 14 2 1 0
Desired 3.8 0.6 2.0 0 0 9 8 4
Gap 1.8 0.5 2.0 8 10 3 0 0
I.E Create and Refine
Implementation PlanI.E.1. Enterprise level lean implementation
plan Current2.5 0.6 3.0 1 7 12 1 0
Desired 3.8 0.6 3.0 0 1 6 12 4
Gap 1.3 1.0 4.0 14 4 0 2 0I.E.2. Commit resources for lean
improvements Current2.3 0.6 3.0 2 10 9 1 0
Desired 3.8 0.8 3.0 0 1 8 8 6
Gap 1.5 0.4 2.0 13 7 2 0 0
I.E.3. Provide education and training Current 2.1 0.7 3.0 7 10 7 1 0
Desired 4.0 0.9 3.0 0 1 8 6 9
Gap 1.8 1.0 3.0 9 6 4 2 0
I.F Implement Lean
InitiativesI.F.1. Development of detailed plans based
on enterprise plan Current2.2 0.8 3.0 6 11 6 2 0
Desired 3.5 1.1 4.0 1 3 7 9 4
Gap 1.3 0.6 3.0 12 5 2 0 0
I.F.2. Tracking detailed implementation Current 2.8 0.9 4.0 4 3 15 2 1
Desired 4.3 0.5 3.0 0 1 1 13 9
Gap 1.5 0.6 3.0 9 9 2 0 0
I.G Focus on Continuous
ImprovementI.G.1. Structured continuous improvement
process Current2.5 0.5 3.0 0 13 8 2 0
Desired 4.0 0.5 2.0 0 0 5 13 6
Gap 1.6 0.7 3.0 11 7 2 1 0
I.G.2. Monitoring lean progress Current 2.8 0.6 3.0 0 10 11 2 1
Desired 4.1 0.5 2.0 0 0 5 11 8
Gap 1.4 0.4 3.0 12 8 1 0 0
I.G.3. Nurturing the process Current 2.3 0.8 4.0 4 14 5 1 1
Desired 3.7 1.0 3.0 0 2 10 5 7
Gap 1.4 0.4 3.0 9 9 1 0 0
I.G.4. Capturing lessons learned Current 2.0 0.7 3.0 5 11 5 1 0
Desired 3.8 0.6 2.0 0 0 9 9 5
Gap 1.8 0.9 3.0 11 8 2 2 0I.G.5. Impacting enterprise strategic
planning Current2.5 0.5 3.0 0 12 8 2 0
Desired 3.9 0.8 3.0 0 2 4 12 5
Gap 1.4 0.3 2.0 10 10 0 0 0

120
SECTION II - LIFE CYCLE PROCESSES
TALLYS
TTL LINK Lean Practice State Mean Variance Range Level 1 Level 2 Level 3 Level 4 Level 5
II.A. Set-up the EnterpriseII.A.1. Leverage lean capability for new
opportunities Current2.1 0.7 2.0 6 8 9 0 0
Desired 3.4 0.8 3.0 0 4 7 10 2
Gap 1.3 0.2 1.0 14 7 0 0 0II.A.2. Optimise the capability and
utilization of assets Current2.1 0.8 3.0 4 12 4 2 0
Desired 3.5 1.0 3.0 0 4 7 8 4
Gap 1.4 0.8 4.0 10 6 1 1 0II.A.3. Provide capability to manage risk,
cost, schedule and performance Current2.2 0.8 3.0 4 13 3 3 0
Desired 3.7 0.7 3.0 0 1 9 8 5
Gap 1.5 1.0 4.0 11 8 0 2 0II.A.4. Allocate resources for
program/project development efforts Current2.3 0.7 3.0 1 8 10 1 0
Desired 3.6 0.7 3.0 0 3 6 12 2
Gap 1.2 0.2 1.0 17 5 0 0 0
II. B. Build RelationshipsII.B.1. Define and develop relationships with
stakeholders Current2.5 0.7 3.0 3 8 9 2 0
Desired 3.9 0.5 2.0 0 0 7 11 4
Gap 1.4 0.4 3.0 8 8 1 0 0
II.B.2. Optimize the relationship Current 2.5 0.7 3.0 3 6 11 2 0
Desired 3.9 0.6 2.0 0 0 7 10 5
Gap 1.4 0.8 4.0 9 5 1 1 0II.B.3. Foster innovation and knowledge-
sharing Current2.0 0.7 3.0 4 13 3 2 0
Desired 3.5 0.9 3.0 0 3 11 6 4
Gap 1.4 0.5 3.0 15 7 0 1 0
II.C. Develop the PlanII.C.1. Establish a requirements definition
process to optimize life cycle value Current2.4 0.9 3.0 3 11 3 4 0
Desired 3.8 0.7 2.0 0 0 9 7 5
Gap 1.4 0.4 2.0 9 7 1 0 0II.C.2. Capture data from the extended
enterprise to optimize future requirement
definitions Current
2.7 1.2 4.0 5 4 10 3 1
Desired 4.0 0.7 2.0 0 0 7 8 7
Gap 1.3 0.5 3.0 12 7 1 0 0II.C.3. Incorporate stakeholder value into
design of products and processes Current2.2 0.7 3.0 3 13 3 2 0
Desired 3.5 0.7 3.0 0 3 8 9 2
Gap 1.3 0.3 2.0 11 7 0 0 0
II.C.4. Incorporate downstream stakeholder
values into products and processes Current
2.3 1.2 3.0 6 11 2 5 0
Desired 3.7 0.9 3.0 0 2 10 6 6
Gap 1.4 0.6 3.0 11 5 3 0 0
II.C.5. Create a multidisciplinary approach Current 2.0 0.4 2.0 4 12 4 0 0
Desired 3.5 1.0 3.0 0 3 8 6 4
Gap 1.6 1.2 4.0 8 3 4 1 0
II.D. Implement the PlanII.D.1. Utilize knowledge and capability in
decision making Current2.0 0.8 3.0 5 7 6 1 0
Desired 3.8 0.9 3.0 0 3 3 11 4
Gap 1.7 0.7 3.0 5 8 4 0 0II.D.2. Foster lean behavior throughout the
value stream Current2.3 0.5 3.0 4 13 7 1 0
Desired 3.7 0.6 3.0 0 1 8 12 3
Gap 1.5 0.7 3.0 9 7 3 0 0II.D.3. Align customer requirements and
expectations with the extended enterprise Current 2.2 0.7 3.0 5 10 7 1 0
Desired 3.6 0.3 2.0 0 0 9 12 1
Gap 1.4 0.4 2.0 11 5 2 0 0II.D.4. Transition product/service in a lean
fashion Current1.8 0.6 2.0 8 9 4 0 0
Desired 3.6 0.7 3.0 0 2 7 9 3
Gap 1.8 1.1 4.0 8 8 2 2 0
II.E. Learn, Improve and
Sustain
II.E.1. Enhance value of delivered products
and services to customers and the
enterprise Current
2.3 0.5 2.0 1 9 10 0 0
Desired 3.7 0.6 3.0 0 1 8 10 3
Gap 1.4 0.3 2.0 13 6 1 0 0II.E.2. Provide post delivery service, support
and sustainability Current2.3 0.6 2.0 4 7 10 0 0
Desired 4.0 0.8 3.0 0 1 6 7 7
Gap 1.7 0.8 4.0 9 8 2 1 0II.E.3. Maintain challenge of existing
processes Current2.2 0.5 3.0 3 13 6 1 0
Desired 3.7 0.5 2.0 0 0 9 11 3
Gap 1.5 0.6 3.0 15 7 1 1 0

121
SECTION III - ENABLING INFRASTRUCTURE
TALLYS
TTL LINK Lean Practice State Mean Variance Range Level 1 Level 2 Level 3 Level 4 Level 5
III.A. Lean Organizational
Enablers III.A.1. Financial system supports lean
transformation Current2.0 0.9 3.0 8 9 2 2 0
Desired 3.6 1.1 3.0 0 3 8 4 5
Gap 1.6 1.0 4.0 6 7 0 2 0III.A.2. Enterprise stakeholders pull
required financial information Current1.9 0.3 2.0 5 14 2 0 0
Desired 3.6 0.8 3.0 0 1 11 4 4
Gap 1.7 0.9 4.0 6 7 2 1 0III.A.3. Promulgate the learning
organization Current2.0 0.8 3.0 5 8 5 1 0
Desired 3.6 0.7 3.0 0 1 10 6 4
Gap 1.6 0.6 3.0 8 8 1 1 0III.A.4. Enable the lean enterprise with
information systems and tools Current2.3 0.9 3.0 2 13 1 4 0
Desired 3.9 0.7 3.0 0 1 5 10 5
Gap 1.6 0.8 4.0 7 7 2 1 0III.A.5. Integration of environmental
protection, heath and safety into the
enterprise Current
2.3 0.9 3.0 7 3 11 1 0
Desired 3.9 1.3 3.0 0 3 5 4 9
Gap 1.6 1.2 4.0 9 6 1 2 0
III.B. Lean Process
Enablers III.B.1. Process standardization Current2.5 1.1 3.0 6 9 5 5 0
Desired 3.8 0.9 3.0 0 2 6 9 6
Gap 1.3 0.5 3.0 8 8 1 0 0
III.B.2. Common tools and systems Current 2.5 1.0 3.0 3 8 6 4 0
Desired 4.0 0.8 3.0 0 1 5 9 7
Gap 1.5 0.9 3.0 11 4 1 2 0
III.B.3. Variation reduction Current 2.0 0.8 3.0 8 10 3 2 0
Desired 3.5 0.7 3.0 0 2 8 9 2
Gap 1.5 0.4 2.0 7 8 1 0 0

122
APPENDIX I: GLESAT ANALYSIS FOR NON-LEAN GROUP *Highlighted cells are high priority practices
Practice Current
State Variance Gap Interpretation Recommendation
I.A.1. Integration of lean in strategic planning process
1.10 0.70 2.20
Weak area with opportunity to close gap through improvement
Discuss practice and take action to improve
I.A.2. Focus on customer value
1.95 0.85 1.81
Opportunity to close the gap through improvements
Discuss practice and take action to improve
I.A.3. Leveraging the extended enterprise
2.10 1.04 1.60
Practice with disagreement. Opportunity to close the gap through improvement
Practice needs further open discussion or may benefit from additional training to create better alignment between respondents
I.B.1. Learning and education in ‘lean’ for enterprise leaders
1.77 0.56 1.45
Practice can be improved but is not of high priority to the organization
Maintain or improve
I.B.2. Senior management commitment
1.20 0.60 2.00
Weak area with opportunity to close gap through improvement
Discuss practice and take action to improve
I.B.3 Lean Enterprise Vision
1.00 0.30 2.10
Weak area with strong agreement of the current state of the practice. There is opportunity to close the gap through lean improvement
Practice needs further open discussion or may benefit from additional training to create better alignment between respondents
I.B.4. A sense of urgency
1.05 0.52 1.86
Weak area with opportunity to close gap through improvement
Discuss practice and take action to improve

123
(Appendix 7.9 continued)
Practice Current
State Variance Gap Interpretation Recommendation
I.C.1. Understanding the current value stream
1.45 0.58 1.60
Weak area with opportunity to close gap through improvement
Discuss practice and take action to improve
I.C.2. Enterprise flow 1.91 0.85 1.50
Practice can be improved but is not of high priority to the organization
Maintain or improve
I.C.3. Designing the future value stream
1.50 0.93 1.64
Opportunity to close the gap through improvements
Discuss practice and take action to improve
I.C.4. Performance measures
1.86 1.17 1.76
Practice with disagreement. Opportunity to close the gap through improvement
Practice needs further open discussion or may benefit from additional training to create better alignment between respondents
I.D.1. Enterprise organizational orientation
2.05 0.90 1.59
Opportunity to close the gap through improvements
Discuss practice and take action to improve
I.D.2. Relationships based on mutual trust
1.64 1.00 1.95
Practice with disagreement. Opportunity to close the gap through improvement
Practice needs further open discussion or may benefit from additional training to create better alignment between respondents
I.D.3. Open and timely communications
2.18 1.11 1.68
Practice with disagreement. Opportunity to close the gap through improvement
Practice needs further open discussion or may benefit from additional training to create better alignment between respondents

124
(Appendix 7.9 continued)
Practice Current
State Variance Gap Interpretation Recommendation
I.D.4. Employee empowerment
2.41 1.21 1.52
Practice with disagreement. Opportunity to close the gap through improvement
Practice needs further open discussion or may benefit from additional training to create better alignment between respondents
I.D.5. Incentive alignment
1.80 0.90 2.10
Opportunity to close the gap through improvements
Discuss practice and take action to improve
I.D.6. Innovation encouragement
1.76 0.89 1.81
Opportunity to close the gap through improvements
Discuss practice and take action to improve
I.D.7. Lean change agents
1.25 0.83 1.70
Weak area with opportunity to close gap through improvement
Discuss practice and take action to improve
I.E.1. Enterprise level lean implementation plan
1.48 0.66 1.60
Weak area with opportunity to close gap through improvement
Discuss practice and take action to improve
I.E.2. Commit resources for lean improvements
1.52 0.56 1.95
Opportunity to close the gap through improvements
Discuss practice and take action to improve
I.E.3. Provide education and training
1.45 0.55 1.81
Weak area with opportunity to close gap through improvement
Discuss practice and take action to improve
I.F.1. Development of detailed plans based on enterprise plan
1.33 0.53 1.67
Weak area with opportunity to close gap through improvement
Discuss practice and take action to improve
I.F.2. Tracking detailed implementation
1.28 0.57 1.72
Weak area with opportunity to close gap through improvement
Discuss practice and take action to improve

125
(Appendix 7.9 continued)
Practice Current
State Variance Gap Interpretation Recommendation
I.G.1. Structured continuous improvement process
1.81 0.86 1.48
Practice can be improved but is not of high priority to the organization
Maintain or improve
I.G.2. Monitoring lean progress
1.70 1.06 1.53
Practice with disagreement. Opportunity to close the gap through improvement
Practice needs further open discussion or may benefit from additional training to create better alignment between respondents
I.G.3. Nurturing the process
1.50 0.60 2.00
Opportunity to close the gap through improvements
Discuss practice and take action to improve
I.G.4. Capturing lessons learned
1.85 1.29 1.90
Practice with disagreement. Opportunity to close the gap through improvement
Practice needs further open discussion or may benefit from additional training to create better alignment between respondents
I.G.5. Impacting enterprise strategic planning
1.32 0.89 1.74
Weak area with opportunity to close gap through improvement
Discuss practice and take action to improve
II.A.1. Leverage lean capability for new opportunities
1.48 0.46 1.57
Weak area with strong agreement of the current state of the practice. There is opportunity to close the gap through lean improvement
Practice needs further open discussion or may benefit from additional training to create better alignment between respondents
II.A.2. Optimize the capability and utilization of assets
1.68 0.61 1.59
Opportunity to close the gap through improvements
Discuss practice and take action to improve

126
(Appendix 7.9 continued)
Practice Current
State Variance Gap Interpretation Recommendation
II.A.3. Provide capability to manage risk, cost, schedule and performance
1.71 1.01 1.52
Practice with disagreement. Opportunity to close the gap through improvement
Practice needs further open discussion or may benefit from additional training to create better alignment between respondents
II.A.4. Allocate resources for program/project development efforts
2.05 0.85 1.67
Opportunity to close the gap through improvements
Discuss practice and take action to improve
II.B.1. Define and develop relationships with stakeholders
1.95 1.00 1.73
Opportunity to close the gap through improvements
Discuss practice and take action to improve
II.B.2. Optimize the relationship
2.23 0.47 1.45
Practice can be improved but is not of high priority to the organization
Maintain or improve
II.B.3. Foster innovation and knowledge-sharing
1.86 0.53 1.67
Opportunity to close the gap through improvements
Discuss practice and take action to improve
II.C.1. Establish a requirements definition process to optimize life cycle value
1.74 0.87 1.42
Practice can be improved but is not of high priority to the organization
Maintain or improve
II.C.2. Capture data from the extended enterprise to optimize future requirement definitions
2.06 0.93 1.63
Opportunity to close the gap through improvements
Discuss practice and take action to improve

127
(Appendix 7.9 continued)
Practice Current
State Variance Gap Interpretation Recommendation
II.C.3. Incorporate stakeholder value into design of products and processes
1.53 0.49 1.58
Strong agreement in the area. Opportunity to close the gap through improvement initiatives
Discuss practice and take action to improve
II.C.4. Incorporate downstream stakeholder values into products and processes
2.14 0.29 1.64
Strong agreement in the area. Opportunity to close the gap through improvement initiatives
Discuss practice and take action to improve
II.C.5. Create a multidisciplinary approach
1.90 1.15 1.65
Practice with disagreement. Opportunity to close the gap through improvement
Practice needs further open discussion or may benefit from additional training to create better alignment between respondents
II.D.1. Utilize knowledge and capability in decision making
1.81 0.56 1.55
Opportunity to close the gap through improvements
Discuss practice and take action to improve
II.D.2. Foster lean behavior throughout the value stream
1.64 0.62 1.91
Opportunity to close the gap through improvements
Discuss practice and take action to improve
II.D.3. Align customer requirements and expectations with the extended enterprise
1.80 0.91 1.65
Opportunity to close the gap through improvements
Discuss practice and take action to improve
II.D.4. Transition product/service in a lean fashion
1.74 0.43 1.56
Strong agreement in the area. Opportunity to close the gap through improvement initiatives
Discuss practice and take action to improve

128
(Appendix 7.9 continued)
Practice Current
State Variance Gap Interpretation Recommendation
II.E.1. Enhance value of delivered products and services to customers and the enterprise
1.70 0.43 1.63
Strong agreement in the area. Opportunity to close the gap through improvement initiatives
Discuss practice and take action to improve
II.E.2. Provide post delivery service, support and sustainability
1.75 0.73 1.53
Opportunity to close the gap through improvements
Discuss practice and take action to improve
II.E.3. Maintain challenge of existing processes
1.81 0.56 1.50
Practice can be improved but is not of high priority to the organization
Maintain or improve
III.A.1. Financial system supports lean transformation
1.41 0.26 1.53
Weak area with strong agreement of the current state of the practice. There is opportunity to close the gap through lean improvement
Practice needs further open discussion or may benefit from additional training to create better alignment between respondents
III.A.2. Enterprise stakeholders pull required financial information
1.63 0.80 1.58
Opportunity to close the gap through improvements
Discuss practice and take action to improve
III.A.3. Promulgate the learning organization
1.67 0.73 1.90
Opportunity to close the gap through improvements
Discuss practice and take action to improve
III.A.4. Enable the lean enterprise with information systems and tools
2.05 0.89 1.79
Opportunity to close the gap through improvements
Discuss practice and take action to improve

129
(Appendix 7.9 continued)
Practice Current
State Variance Gap Interpretation Recommendation
III.A.5. Integration of environmental protection, health and safety into the enterprise
2.00 1.10 1.43 Area with high disagreement
Practice needs further open discussion or may benefit from additional training to create better alignment between respondents
III.B.1. Process standardization
2.00 1.33 1.57
Practice with disagreement. Opportunity to close the gap through improvement
Practice needs further open discussion or may benefit from additional training to create better alignment between respondents
III.B.2. Common tools and systems
1.95 1.65 1.47 Area with high disagreement
Practice needs further open discussion or may benefit from additional training to create better alignment between respondents
III.B.3. Variation reduction
1.94 0.88 1.53
Opportunity to close the gap through improvements
Discuss practice and take action to improve

130
APPENDIX J: GLESAT ANALYSIS FOR LEAN GROUP *Highlighted cells are high priority practices
Practice Current
State Variance Gap Interpretation Recommendation
I.A.1. Integration of lean in strategic planning process
3.48 0.98 1.30
Weak area with opportunity to close gap through improvement
Discuss practice and take action to improve
I.A.2. Focus on customer value
2.52 0.90 1.61
Opportunity to close the gap through improvements
Discuss practice and take action to improve
I.A.3. Leveraging the extended enterprise
2.35 0.96 1.52
Practice with disagreement. Opportunity to close the gap through improvement
Practice needs further open discussion or may benefit from additional training to create better alignment between respondents
I.B.1. Learning and education in ‘lean’ for enterprise leaders
3.00 1.04 1.25
Practice can be improved but is not of high priority to the organization
Maintain or improve
I.B.2. Senior management commitment
2.88 1.45 1.13
Weak area with opportunity to close gap through improvement
Discuss practice and take action to improve
I.B.3 Lean Enterprise Vision
2.58 0.95 1.54
Weak area with strong agreement of the current state of the practice. There is opportunity to close the gap through lean improvement
Practice needs further open discussion or may benefit from additional training to create better alignment between respondents
I.B.4. A sense of urgency
2.75 0.98 1.58
Weak area with opportunity to close gap through improvement
Discuss practice and take action to improve

131
(Appendix 7.10 continued)
Practice Current
State Variance Gap Interpretation Recommendation
I.C.1. Understanding the current value stream
2.65 0.69 1.39
Weak area with opportunity to close gap through improvement
Discuss practice and take action to improve
I.C.2. Enterprise flow 2.45 0.45 1.45
Practice can be improved but is not of high priority to the organization
Maintain or improve
I.C.3. Designing the future value stream
2.35 0.96 1.65
Opportunity to close the gap through improvements
Discuss practice and take action to improve
I.C.4. Performance measures
3.42 1.21 1.17
Practice with disagreement. Opportunity to close the gap through improvement
Practice needs further open discussion or may benefit from additional training to create better alignment between respondents
I.D.1. Enterprise organizational orientation
2.61 0.79 1.39
Opportunity to close the gap through improvements
Discuss practice and take action to improve
I.D.2. Relationships based on mutual trust
2.30 1.04 1.65
Practice with disagreement. Opportunity to close the gap through improvement
Practice needs further open discussion or may benefit from additional training to create better alignment between respondents
I.D.3. Open and timely communications
2.63 0.85 1.58
Practice with disagreement. Opportunity to close the gap through improvement
Practice needs further open discussion or may benefit from additional training to create better alignment between respondents

132
(Appendix 7.10 continued)
Practice Current
State Variance Gap Interpretation Recommendation
I.D.4. Employee empowerment
2.26 1.20 1.61
Practice with disagreement. Opportunity to close the gap through improvement
Practice needs further open discussion or may benefit from additional training to create better alignment between respondents
I.D.5. Incentive alignment
1.60 0.50 2.00
Opportunity to close the gap through improvements
Discuss practice and take action to improve
I.D.6. Innovation encouragement
1.60 0.58 2.00
Opportunity to close the gap through improvements
Discuss practice and take action to improve
I.D.7. Lean change agents
2.00 0.50 1.76
Weak area with opportunity to close gap through improvement
Discuss practice and take action to improve
I.E.1. Enterprise level lean implementation plan
2.48 0.62 1.35
Weak area with opportunity to close gap through improvement
Discuss practice and take action to improve
I.E.2. Commit resources for lean improvements
2.35 0.60 1.48
Opportunity to close the gap through improvements
Discuss practice and take action to improve
I.E.3. Provide education and training
2.13 0.72 1.83
Weak area with opportunity to close gap through improvement
Discuss practice and take action to improve
I.F.1. Development of detailed plans based on enterprise plan
2.21 0.78 1.29
Weak area with opportunity to close gap through improvement
Discuss practice and take action to improve
I.F.2. Tracking detailed implementation
2.79 0.87 1.46
Weak area with opportunity to close gap through improvement
Discuss practice and take action to improve

133
(Appendix 7.10 continued)
Practice Current
State Variance Gap Interpretation Recommendation
I.G.1. Structured continuous improvement process
2.46 0.52 1.58
Practice can be improved but is not of high priority to the organization
Maintain or improve
I.G.2. Monitoring lean progress
2.75 0.63 1.38
Practice with disagreement. Opportunity to close the gap through improvement
Practice needs further open discussion or may benefit from additional training to create better alignment between respondents
I.G.3. Nurturing the process
2.29 0.82 1.42
Opportunity to close the gap through improvements
Discuss practice and take action to improve
I.G.4. Capturing lessons learned
2.04 0.68 1.78
Practice with disagreement. Opportunity to close the gap through improvement
Practice needs further open discussion or may benefit from additional training to create better alignment between respondents
I.G.5. Impacting enterprise strategic planning
2.48 0.53 1.39
Weak area with opportunity to close gap through improvement
Discuss practice and take action to improve
II.A.1. Leverage lean capability for new opportunities
2.13 0.66 1.30
Weak area with strong agreement of the current state of the practice. There is opportunity to close the gap through lean improvement
Practice needs further open discussion or may benefit from additional training to create better alignment between respondents
II.A.2. Optimize the capability and utilization of assets
2.13 0.75 1.39
Opportunity to close the gap through improvements
Discuss practice and take action to improve

134
(Appendix 7.10 continued)
Practice Current
State Variance Gap Interpretation Recommendation
II.A.3. Provide capability to manage risk, cost, schedule and performance
2.22 0.81 1.52
Practice with disagreement. Opportunity to close the gap through improvement
Practice needs further open discussion or may benefit from additional training to create better alignment between respondents
II.A.4. Allocate resources for program/project development efforts
2.35 0.69 1.22
Opportunity to close the gap through improvements
Discuss practice and take action to improve
II.B.1. Define and develop relationships with stakeholders
2.45 0.74 1.41
Opportunity to close the gap through improvements
Discuss practice and take action to improve
II.B.2. Optimize the relationship
2.55 0.74 1.36
Practice can be improved but is not of high priority to the organization
Maintain or improve
II.B.3. Foster innovation and knowledge-sharing
2.04 0.74 1.42
Opportunity to close the gap through improvements
Discuss practice and take action to improve
II.C.1. Establish a requirements definition process to optimize life cycle value
2.38 0.95 1.43
Practice can be improved but is not of high priority to the organization
Maintain or improve
II.C.2. Capture data from the extended enterprise to optimize future requirement definitions
2.68 1.18 1.32
Opportunity to close the gap through improvements
Discuss practice and take action to improve

135
(Appendix 7.10 continued)
Practice Current
State Variance Gap Interpretation Recommendation
II.C.3. Incorporate stakeholder value into design of products and processes
2.19 0.66 1.29
Strong agreement in the area. Opportunity to close the gap through improvement initiatives
Discuss practice and take action to improve
II.C.4. Incorporate downstream stakeholder values into products and processes
2.25 1.15 1.42
Strong agreement in the area. Opportunity to close the gap through improvement initiatives
Discuss practice and take action to improve
II.C.5. Create a multidisciplinary approach
1.95 0.45 1.57
Practice with disagreement. Opportunity to close the gap through improvement
Practice needs further open discussion or may benefit from additional training to create better alignment between respondents
II.D.1. Utilize knowledge and capability in decision making
2.05 0.85 1.71
Opportunity to close the gap through improvements
Discuss practice and take action to improve
II.D.2. Foster lean behavior throughout the value stream
2.25 0.54 1.46
Opportunity to close the gap through improvements
Discuss practice and take action to improve
II.D.3. Align customer requirements and expectations with the extended enterprise
2.23 0.66 1.41
Opportunity to close the gap through improvements
Discuss practice and take action to improve
II.D.4. Transition product/service in a lean fashion
1.81 0.56 1.81
Strong agreement in the area. Opportunity to close the gap through improvement initiatives
Discuss practice and take action to improve

136
(Appendix 7.10 continued)
Practice Current
State Variance Gap Interpretation Recommendation
II.E.1. Enhance value of delivered products and services to customers and the enterprise
2.32 0.51 1.36
Strong agreement in the area. Opportunity to close the gap through improvement initiatives
Discuss practice and take action to improve
II.E.2. Provide post delivery service, support and sustainability
2.29 0.61 1.67
Opportunity to close the gap through improvements
Discuss practice and take action to improve
II.E.3. Maintain challenge of existing processes
2.22 0.54 1.52
Practice can be improved but is not of high priority to the organization
Maintain or improve
III.A.1. Financial system supports lean transformation
1.95 0.89 1.60
Weak area with strong agreement of the current state of the practice. There is opportunity to close the gap through lean improvement
Practice needs further open discussion or may benefit from additional training to create better alignment between respondents
III.A.2. Enterprise stakeholders pull required financial information
1.90 0.31 1.65
Opportunity to close the gap through improvements
Discuss practice and take action to improve
III.A.3. Promulgate the learning organization
2.00 0.80 1.62
Opportunity to close the gap through improvements
Discuss practice and take action to improve
III.A.4. Enable the lean enterprise with information systems and tools
2.29 0.91 1.62
Opportunity to close the gap through improvements
Discuss practice and take action to improve

137
(Appendix 7.10 continued)
Practice Current
State Variance Gap Interpretation Recommendation
III.A.5. Integration of environmental protection, health and safety into the enterprise
2.33 0.93 1.57 Area with high disagreement
Practice needs further open discussion or may benefit from additional training to create better alignment between respondents
III.B.1. Process standardization
2.48 1.08 1.35
Practice with disagreement. Opportunity to close the gap through improvement
Practice needs further open discussion or may benefit from additional training to create better alignment between respondents
III.B.2. Common tools and systems
2.45 1.02 1.55 Area with high disagreement
Practice needs further open discussion or may benefit from additional training to create better alignment between respondents
III.B.3. Variation reduction
2.05 0.85 1.48
Opportunity to close the gap through improvements
Discuss practice and take action to improve

138
APPENDIX K: SWOT DISTRIBUTION FOR PRACTICES OF NON-LEAN
PROGRAM
Strength Weakness Opportunity Threat (High
Priority)
I.A.3. Leveraging the extended enterprise
I.C.1. Understanding the current value stream
I.A.2. Focus on customer value
I.A.1. Integration of lean in strategic planning process
I.C.2. Enterprise flow I.C.3. Designing the future value stream
I.C.4. Performance measures
I.B.2. Senior management commitment
I.D.1. Enterprise organizational orientation
I.E.1. Enterprise level lean implementation plan
I.D.5. Incentive alignment I.B.3 Lean Enterprise Vision
I.D.3. Open and timely communications
I.F.1. Development of detailed plans based on enterprise plan
I.D.6. Innovation encouragement
I.B.4. A sense of urgency
I.G.1. Structured continuous improvement process
I.G.2. Monitoring lean progress
I.G.4. Capturing lessons learned
I.D.2. Relationships based on mutual trust
II.A.4. Allocate resources for program/project development efforts
II.A.1. Leverage lean capability for new opportunities
II.B.1. Define and develop relationships with stakeholders
I.D.4. Employee empowerment
II.B.2. Optimize the relationship
II.A.2. Optimize the capability and utilization of assets
III.A.4. Enable the lean enterprise with information systems and tools
I.D.7. Lean change agents
II.B.3. Foster innovation and knowledge-sharing
II.A.3. Provide capability to manage risk, cost, schedule and performance
I.E.2. Commit resources for lean improvements
II.C.1. Establish a requirements definition process to optimize life cycle value
II.C.3. Incorporate stakeholder value into design of products and processes
I.E.3. Provide education and training
II.C.2. Capture data from the extended enterprise to optimize future requirement definitions
II.E.1. Enhance value of delivered products and services to customers and the enterprise
I.F.2. Tracking detailed implementation
II.C.4. Incorporate downstream stakeholder values into products and processes
III.A.1. Financial system supports lean transformation
I.G.3. Nurturing the process
II.C.5. Create a multidisciplinary
III.A.2. Enterprise stakeholders pull
I.G.5. Impacting enterprise strategic

139
approach required financial information
planning
(Appendix 7.11 continued)
Strength Weakness Opportunity Threat (High
Priority)
II.D.1. Utilize knowledge and capability in decision making
II.D.2. Foster lean behavior throughout the value stream
II.D.3. Align customer requirements and expectations with the extended enterprise
III.A.3. Promulgate the learning organization
II.D.4. Transition product/service in a lean fashion
II.E.2. Provide post delivery service, support and sustainability
II.E.3. Maintain challenge of existing processes
III.A.4. Enable the lean enterprise with information systems and tools
III.A.5. Integration of environmental protection, health and safety into the enterprise
III.B.1. Process standardization
III.B.2. Common tools and systems
III.B.3. Variation reduction

140
APPENDIX L: SWOT DISTRIBUTION FOR PRACTICES OF LEAN PROGRAM
Strength Weakness Opportunity Threat (High
Priority)
I.A.1. Integration of lean in strategic planning process
I.E.2. Commit resources for lean improvements
I.A.2. Focus on customer value
I.D.5. Incentive alignment
I.B.1. Learning and education in ‘lean’ for enterprise leaders
I.F.1. Development of detailed plans based on enterprise plan
I.B.3 Lean Enterprise Vision
I.D.6. Innovation encouragement
I.B.2. Senior management commitment
I.G.3. Nurturing the process
I.B.4. A sense of urgency I.D.7. Lean change agents
I.C.1. Understanding the current value stream
II.A.1. Leverage lean capability for new opportunities
I.D.3. Open and timely communications
I.E.3. Provide education and training
I.C.2. Enterprise flow II.A.2. Optimize the capability and utilization of assets
I.G.1. Structured continuous improvement process
I.G.4. Capturing lessons learned
I.C.4. Performance measures
II.A.4. Allocate resources for program/project development efforts
III.B.2. Common tools and systems
II.C.5. Create a multidisciplinary approach
I.D.1. Enterprise organizational orientation
II.B.3. Foster innovation and knowledge-sharing
I.A.3. Leveraging the extended enterprise
II.D.4. Transition product/service in a lean fashion
I.E.1. Enterprise level lean implementation plan
II.C.3. Incorporate stakeholder value into design of products and processes
I.C.3. Designing the future value stream
II.E.2. Provide post delivery service, support and sustainability
I.F.2. Tracking detailed implementation
II.C.4. Incorporate downstream stakeholder values into products and processes
I.D.2. Relationships based on mutual trust
II.E.3. Maintain challenge of existing processes
I.G.2. Monitoring lean progress
II.D.2. Foster lean behavior throughout the value stream
I.D.4. Employee empowerment
III.A.2. Enterprise stakeholders pull required financial information
I.G.5. Impacting enterprise strategic planning
II.D.3. Align customer requirements and expectations with the extended enterprise
II.A.3. Provide capability to manage risk, cost, schedule and performance
II.B.1. Define and develop relationships with stakeholders
II.E.1. Enhance value of delivered products and services to customers and the enterprise
II.D.1. Utilize knowledge and capability in decision making

141
(Appendix 7.12 continued)
Strength Weakness Opportunity Threat (High
Priority)
II.B.2. Optimize the relationship
III.B.3. Variation
reduction
III.A.1. Financial system supports lean transformation
II.C.1. Establish a requirements definition process to optimize life cycle value
III.A.3. Promulgate the learning organization
II.C.2. Capture data from the extended enterprise to optimize future requirement definitions
III.A.4. Enable the lean enterprise with information systems and tools
III.B.1. Process standardization
III.A.5. Integration of environmental protection, health and safety into the enterprise

142
VITA Patrick O’Mara was born in 1988 in Barquisimeto, Venezuela. He received his Bachelors’ degree in
Industrial Engineering from Louisiana State University in December 2012. On January 2013, he began
Graduate school with a Master’s of Science in Industrial Engineering under the supervision of Dr. Laura
Ikuma. During his studies at LSU he held a position as Graduate Research Assistant. He is currently
working full time as a quality and process improvement engineer for Arcelormittal in Laplace, Louisiana.