Assistance to Firefighters Grant SAFER Grants Fire Prevention and Safety Grants.
22
Assistance to Firefighters Assistance to Firefighters Grant Grant SAFER Grants SAFER Grants Fire Prevention and Safety Fire Prevention and Safety Grants Grants
-
Upload
patricia-mckinney -
Category
Documents
-
view
215 -
download
0
Transcript of Assistance to Firefighters Grant SAFER Grants Fire Prevention and Safety Grants.

Assistance to Firefighters GrantAssistance to Firefighters GrantSAFER GrantsSAFER Grants
Fire Prevention and Safety GrantsFire Prevention and Safety Grants

Office of Grants and Training Preparedness Directorate
U.S. Department of Homeland Security

Distribution of 2006 AFG Applications by StateState Applied % Total Sum Of FedShare % Total
Alabama 595 3.27% $69,333,040.00 2.98%
Alaska 54 0.30% $9,650,050.00 0.41%
Arizona 135 0.74% $22,475,770.00 0.97%
Arkansas 386 2.12% $41,070,105.00 1.76%
California 441 2.43% $73,192,203.00 3.14%
Colorado 142 0.78% $21,269,866.00 0.91%
Connecticut 202 1.11% $30,959,767.00 1.33%
Delaware 35 0.19% $6,122,957.00 0.26%
District of Columbia 2 0.01% $370,000.00 0.02%
Florida 259 1.43% $49,293,180.00 2.12%
Georgia 282 1.55% $43,481,289.00 1.87%
Guam 1 0.01% $287,600.00 0.01%
Hawaii 3 0.02% $579,144.00 0.02%
Idaho 125 0.69% $14,398,789.00 0.62%
Illinois 770 4.24% $92,365,399.00 3.97%
Indiana 444 2.44% $62,412,573.00 2.68%
Iowa 547 3.01% $54,667,761.00 2.35%
Kansas 262 1.44% $27,851,686.00 1.20%
Kentucky 509 2.80% $62,462,372.00 2.68%
Louisiana 217 1.19% $24,898,171.00 1.07%
Maine 236 1.30% $34,928,079.00 1.50%
Maryland 190 1.05% $34,915,697.00 1.50%
Massachusetts 292 1.61% $53,859,467.00 2.31%
Michigan 623 3.43% $73,773,027.00 3.17%
Minnesota 518 2.85% $56,804,775.00 2.44%

Distribution of 2006 AFG Applications by State (cont.)State Applied % Total Sum Of FedShare % Total
Mississippi 364 2.00% $45,569,781.00 1.96%
Missouri 468 2.58% $51,675,821.00 2.22%
Montana 188 1.03% $22,667,929.00 0.97%
Nebraska 215 1.18% $23,580,943.00 1.01%
Nevada 34 0.19% $5,868,409.00 0.25%
New Hampshire 144 0.79% $17,269,519.00 0.74%
New Jersey 555 3.05% $67,147,827.00 2.88%
New Mexico 109 0.60% $16,180,818.00 0.70%
New York 1190 6.55% $141,676,861.00 6.09%
North Carolina 689 3.79% $87,855,720.00 3.77%
North Dakota 116 0.64% $11,431,133.00 0.49%
Northern Marianas 1 0.01% $171,920.00 0.01%
Ohio 825 4.54% $114,052,095.00 4.90%
Oklahoma 452 2.49% $46,402,349.00 1.99%
Oregon 193 1.06% $29,471,767.00 1.27%
Pennsylvania 1738 9.56% $227,883,904.00 9.79%
Puerto Rico 91 0.50% $8,822,049.00 0.38%
Rhode Island 65 0.36% $8,553,713.00 0.37%
South Carolina 335 1.84% $43,067,790.00 1.85%
South Dakota 163 0.90% $15,038,397.00 0.65%
Tennessee 438 2.41% $47,046,543.00 2.02%
Texas 712 3.92% $99,953,031.00 4.29%
Utah 120 0.66% $11,674,550.00 0.50%
Vermont 124 0.68% $14,170,705.00 0.61%
Virginia 301 1.66% $47,719,827.00 2.05%
Distribution of 2006 AFG Applications by State (cont.)State Applied % Total Sum Of FedShare % Total
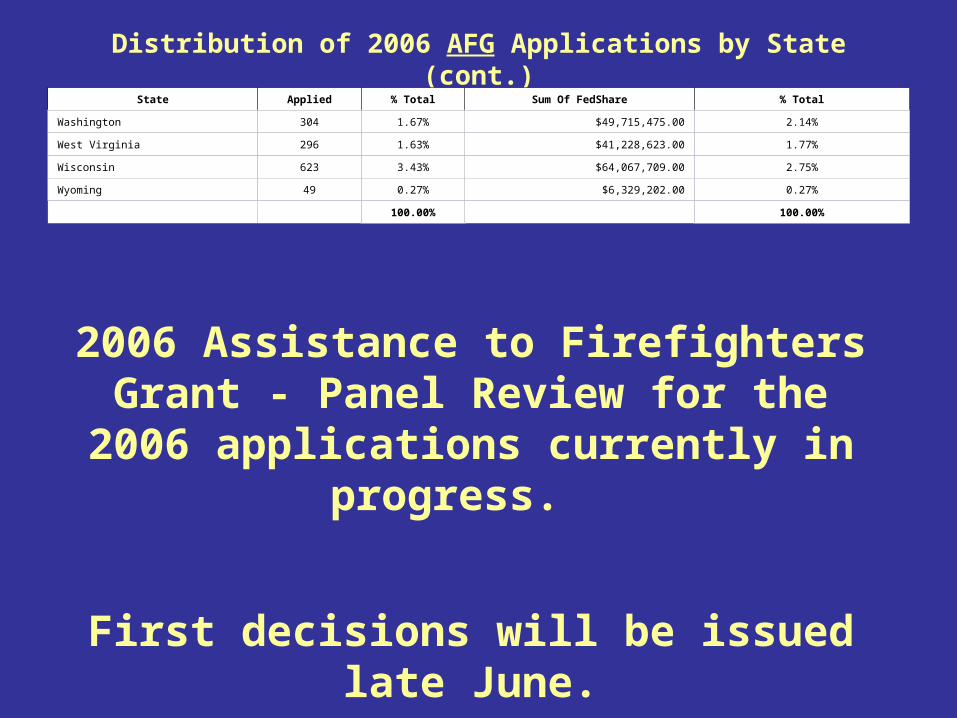
Washington 304 1.67% $49,715,475.00 2.14%
West Virginia 296 1.63% $41,228,623.00 1.77%
Wisconsin 623 3.43% $64,067,709.00 2.75%
Wyoming 49 0.27% $6,329,202.00 0.27%
TOTAL 18172 100.00% $2,327,717,177.00 100.00%
2006 Assistance to Firefighters Grant - Panel Review for the 2006 applications
currently in progress.
First decisions will be issued late June.
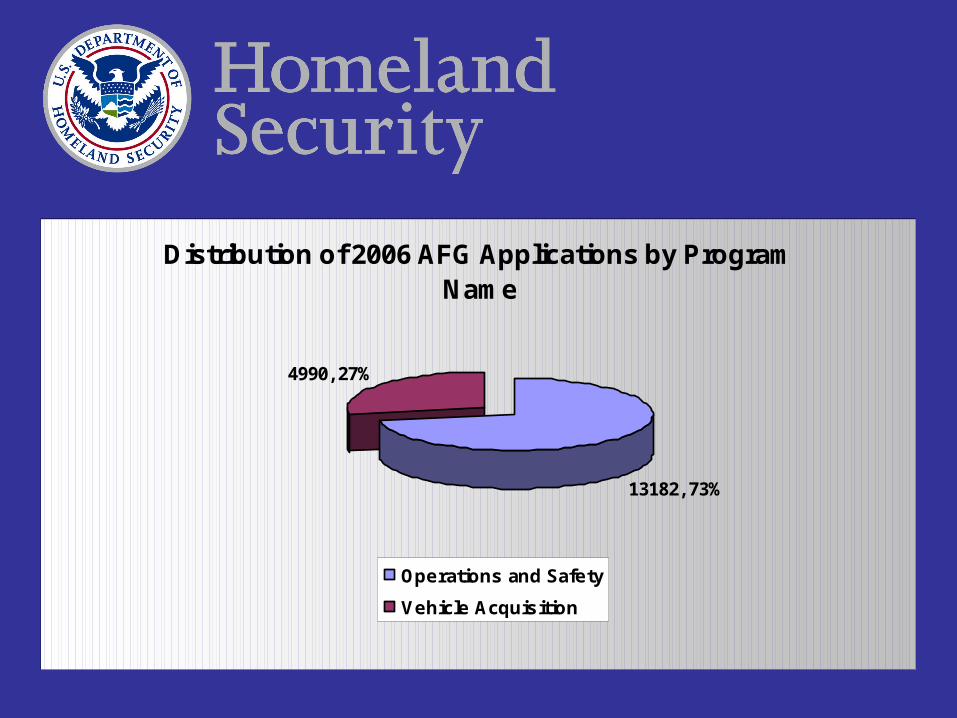
Distribution of 2006 AFG Applications by Program Name
13182, 73%
4990, 27%
Operations and Safety
Vehicle Acquisition

Distribution of 2006 AFG Applications by Service Area
14132, 78%
2984, 16%1055, 6%
1, 0%
N/A
Rural
Suburban
Urban

Distribution of 2006 AFG Applications by Department Type
11146, 61%
3794, 21%
1291, 7% 1941, 11%
All Paid/Career
All volunteer
Combination
Paid On-Call/Stipend
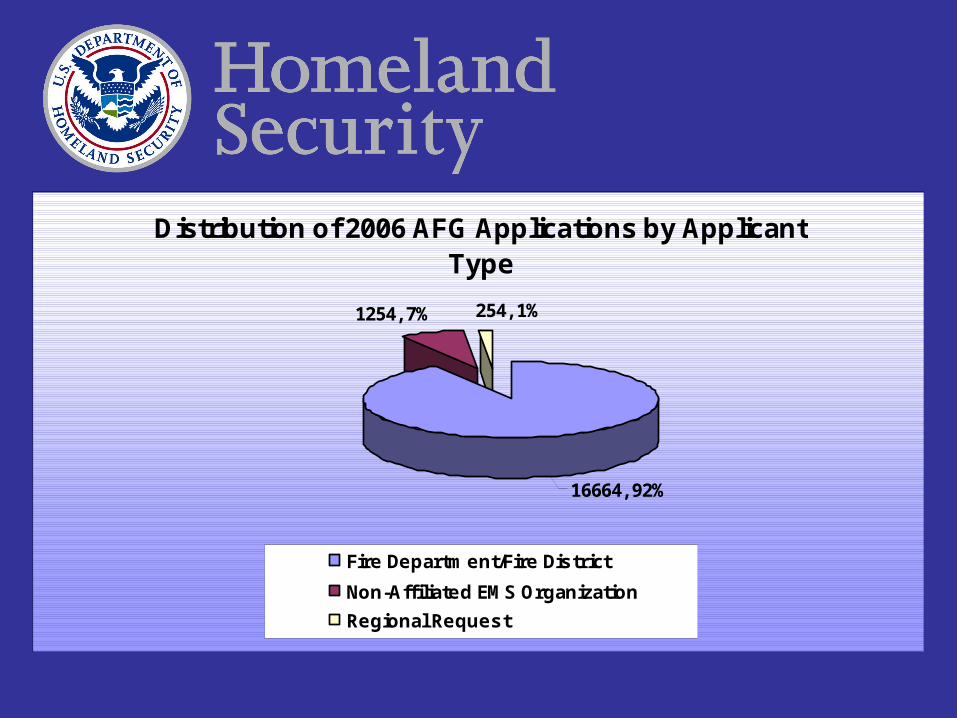
Distribution of 2006 AFG Applications by Applicant Type
1254, 7%
16664, 92%
254, 1%
Fire Department/Fire District
Non-Affiliated EMS Organization
Regional Request

$1,925.19
$2,078.99
$2,303.92
$2,642.76
$2,327.72
0 500 1,000 1,500 2,000 2,500 3,000
Federal Share Requested
(in Millions)
FY2002
FY2003
FY2004
FY2005
FY2006
Yea
r
5 Year History: Federal Share Requested for AFG Fire Grants
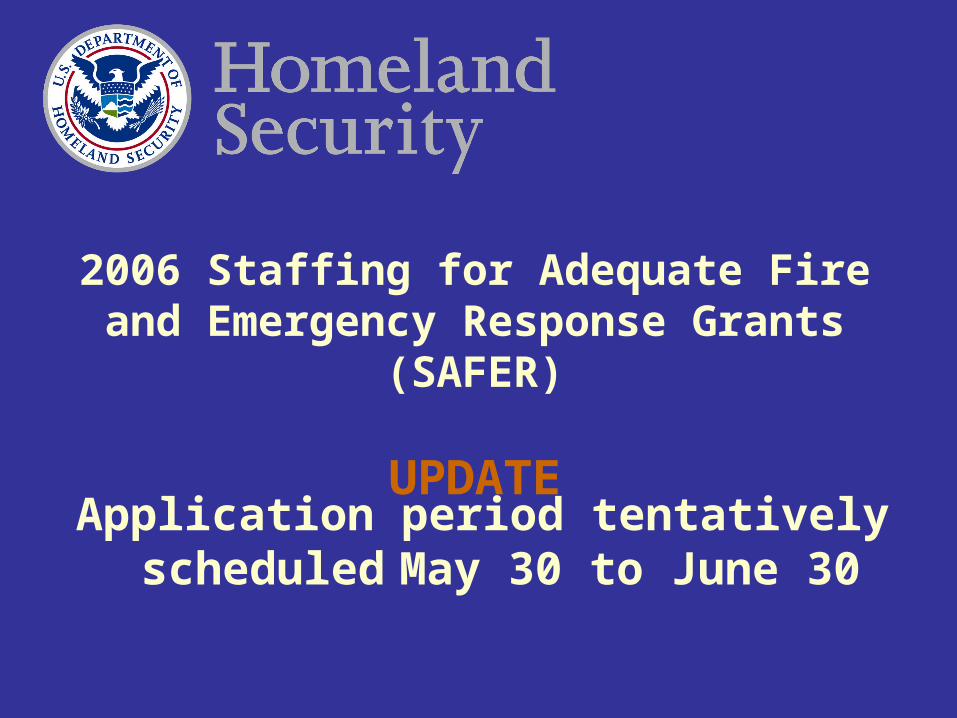
Application period tentatively scheduled
May 30 to June 30
2006 Staffing for Adequate Fire and Emergency Response Grants (SAFER)
UPDATE
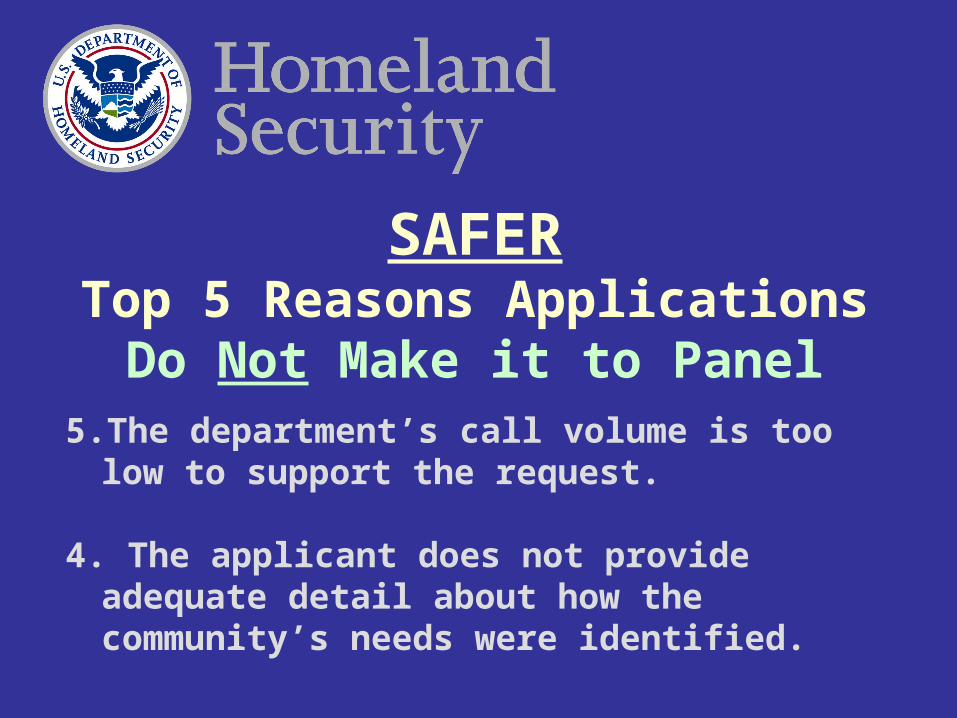
5. The department’s call volume is too low to support the request.
4. The applicant does not provide adequate detail about how the community’s needs were identified.
SAFERTop 5 Reasons Applications
Do Not Make it to Panel

3. The applicant’s request does not match the program priorities.
2. The proposed project doesn’t provide significant improvement to current operations.
SAFERTop 5 Reasons Applications
Do Not Make it to Panel

1. The 05 SAFER program is a highly competitive process. More than $1.1 billion dollars of grant funds were requested, but only $65 million of grant funds were available.
SAFERTop 5 Reasons Applications
Do Not Make it to Panel

5. The application doesn’t provide sufficient detail about the proposed project.
4. The applicant has failed to demonstrate financial need.
SAFERTop 5 Reasons Applications Do Not Score Well at Panels

3. The applicant has failed to adequately explain how the additional firefighters will reduce the risk.
2. The applicant did not provide, or describe, a specific plan for recruiting women and minorities.
SAFERTop 5 Reasons Applications Do Not Score Well at Panels

1. Competition! Even though many departments are deserving of an award, funding is limited.
SAFERTop 5 Reasons Applications Do Not Score Well at Panels
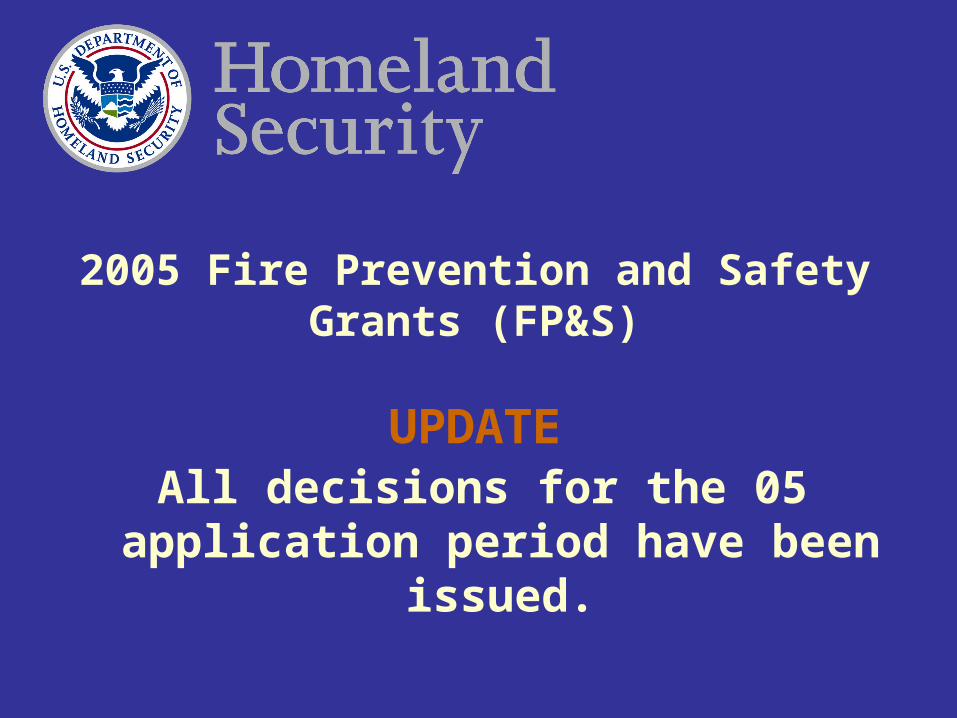
All decisions for the 05 application period have been issued.
2005 Fire Prevention and Safety Grants (FP&S)
UPDATE
Application period tentatively scheduled for September. Program
Guidance should be published in August.
2006 Fire Prevention and Safety Grants (FP&S)

2006 FP&S2006 FP&SExamples of eligible projects
• Public education
• Code enforcement/awareness
• Arson prevention/awareness
• Sprinkler awareness
• Smoke alarm distribution
• Burn prevention

AFG, SAFER or FP&S Questions?AFG, SAFER or FP&S Questions?
www.firegrantsupport.com
and
Help Desk at 866-274-0960
and

To View Success StoriesTo View Success Stories
Go to Fire Grant Website
http://www.firegrantsupport.com
Click on “Success Stories”