ASSET MANAGEMENT PLAN 3.4.01METERING - 21.24 PUBLIC - SAPN... · Asset Management Plan 3.4.01 ......
43
Attachment 21.24 SA Power Networks: Asset Management Plan 3.4.01 Metering 2014 to 2025 August 2014
Transcript of ASSET MANAGEMENT PLAN 3.4.01METERING - 21.24 PUBLIC - SAPN... · Asset Management Plan 3.4.01 ......

Attachment 21.24
SA Power Networks: Asset Management Plan 3.4.01 Metering 2014 to 2025
August 2014
AMP 3.4.01 Metering 2014 to 2025
ASSET MANAGEMENT PLAN 3.4.01 – METERING
Issued – June 2014
This document is not to be copied or issued to anyone outside of SA Power Networks without the express permission of MNSP
SA Power Networks 2014
Internal Use Only Page 1 of 42
SA Power Networks
ASSET MANAGEMENT PLAN 3.4.01 METERING
www.sapowernetworks.com.au
2014 TO 2025 Published: Aug 2014

AMP 3.4.01 Metering 2014 to 2025
ASSET MANAGEMENT PLAN 3.4.01 – METERING 2014 to 2025 Issued – June 2014 This document is not to be copied or issued to anyone outside of SA Power Networks without the express permission of MNSP
SA Power Networks 2014 Internal Use Only Page 2 of 42
OWNERSHIP OF STANDARD
AMP 3.4.01 Metering 2014 to 2025
ASSET MANAGEMENT PLAN 3.4.01 – METERING 2014 to 2025 Issued – June 2014 This document is not to be copied or issued to anyone outside of SA Power Networks without the express permission of MNSP
SA Power Networks 2014 Internal Use Only Page 3 of 42
DOCUMENT REVISION
Date Version Explanation
May 2009 0.1 Original AMP
June 2014 0.2 Updated AMP

AMP 3.4.01 Metering 2014 to 2025
ASSET MANAGEMENT PLAN 3.4.01 – METERING 2014 to 2025 Issued – June 2014 This document is not to be copied or issued to anyone outside of SA Power Networks without the express permission of MNSP
SA Power Networks 2014 Internal Use Only Page 4 of 42
Contents
OWNERSHIP OF STANDARD ................................................................................ 2
DOCUMENT REVISION ......................................................................................... 3
1. EXECUTIVE SUMMARY ................................................................................. 7
1.1 Metering equipment ............................................................................................ 7
1.2 Expenditure ......................................................................................................... 8
1.3 Trends/changes since last AMP ............................................................................ 9
1.4 Proposed Budget ................................................................................................. 9
2. INTRODUCTION ........................................................................................... 9
3. ASSET TYPES & DESCRIPTION .................................................................... 10
3.1 An explantion ..................................................................................................... 10
3.2 Maintenance requirements................................................................................. 10
3.3 Meters................................................................................................................ 11
3.3.1 Controlled Load Metering (off peak) ................................................................ 12
3.3.2 Combination meters ....................................................................................... 12
3.3.3 Electronic Meters ............................................................................................ 12
3.3.4 Import / Export Metering (solar or wind energy output) .................................. 13
3.3.5 ‘Smart ready’ Meters ...................................................................................... 13
3.4 Metering using Transformers .............................................................................. 14
3.5 Time Switches..................................................................................................... 14
3.6 SWD Systems ...................................................................................................... 14
4. DETAILS - Current Condition and Specific Work Plans ................................ 15
4.1 Sub Class 1 – Direct Connected meters ................................................................ 15
4.1.1 Asset Condition ............................................................................................... 15
4.1.2 Known Asset Problems .................................................................................... 15
4.1.3 Strategy .......................................................................................................... 16
4.1.4 New Meters .................................................................................................... 16
4.1.5 Meter Replacement ........................................................................................ 16
4.1.6 Small Family Replacement............................................................................... 16
4.1.7 Large Family Replacement ............................................................................... 17
4.1.8 Operating & Capital Plan - Tasks ...................................................................... 17
4.1.9 Risk ................................................................................................................ 17
4.2 Sub Class 2 – Transformer connected meters ...................................................... 18

AMP 3.4.01 Metering 2014 to 2025
ASSET MANAGEMENT PLAN 3.4.01 – METERING 2014 to 2025 Issued – June 2014 This document is not to be copied or issued to anyone outside of SA Power Networks without the express permission of MNSP
SA Power Networks 2014 Internal Use Only Page 5 of 42
4.2.1 Asset Condition ............................................................................................... 18
4.2.2 Known Asset Problems .................................................................................... 18
4.2.3 Strategy .......................................................................................................... 18
4.2.4 Operating & Capital Plan - Tasks ...................................................................... 18
4.2.5 Risk ................................................................................................................ 18
4.3 Sub Class 3 – Metering Transformers .................................................................. 19
4.3.1 Asset Condition ............................................................................................... 19
4.3.2 Known Asset Problems .................................................................................... 19
4.3.3 Strategy .......................................................................................................... 19
4.3.4 Operating & Capital Plan – Tasks ..................................................................... 19
4.3.5 Risk ................................................................................................................ 19
4.4 Sub Class 4 – Time-switches ................................................................................ 20
4.4.1 Asset Condition ............................................................................................... 20
4.4.2 Known Asset Problems .................................................................................... 20
4.4.3 Strategy .......................................................................................................... 20
4.4.4 Operating & Capital Plan - Tasks ...................................................................... 20
4.4.5 Risk ................................................................................................................ 20
4.5 Sub Class 5 – SWD System ................................................................................... 20
4.5.1 Asset Condition ............................................................................................... 20
4.5.2 Known Asset Problem ..................................................................................... 21
4.5.3 Strategy .......................................................................................................... 21
4.5.4 Operating & Capital Plan - Tasks ...................................................................... 21
4.5.5 Risk ................................................................................................................ 21
5. RISK ........................................................................................................... 21
5.1 Residual Risk ...................................................................................................... 21
6. SUMMARY................................................................................................. 22
6.1 Capital ................................................................................................................ 22
6.2 Planned Opex ..................................................................................................... 23
6.3 Unplanned Operating Expenditure ...................................................................... 23
7. SOURCES OF INFORMATION ...................................................................... 24
8. APPENDICES .............................................................................................. 25
8.1 Appendix 1: Accredited Metering Service Provider .............................................. 25
8.2 Appendix 2: Population Types and Percentages .................................................. 26
8.2.1 Meter Types ................................................................................................... 26
8.2.2 Meter Population Distribution ......................................................................... 26

AMP 3.4.01 Metering 2014 to 2025
ASSET MANAGEMENT PLAN 3.4.01 – METERING 2014 to 2025 Issued – June 2014 This document is not to be copied or issued to anyone outside of SA Power Networks without the express permission of MNSP
SA Power Networks 2014 Internal Use Only Page 6 of 42
8.3 Appendix 3: Meter Population Numbers ............................................................. 27
8.4 Appendix 4: Inspection and Testing of direct connected meters .......................... 32
8.4.1 Preventative Maintenance - Inspection & Testing ............................................ 32
8.4.2 App Testing of Direct Connected Meters .......................................................... 32
8.4.3 Inspection and Testing of Transformer Connected Meters ................................ 34
8.4.4 Inspection and Testing of Metering Transformers ............................................ 35
8.4.5 Testing of Metering Transformers ................................................................... 35
8.5 Appendix 5: Meter Sampling Testing -2013 ......................................................... 37
8.6 Appendix 6: Meter data services, capacity and accuracy requirement ................. 39
8.7 Appendix 7: Definitions ...................................................................................... 42

AMP 3.4.01 Metering 2014 to 2025
ASSET MANAGEMENT PLAN 3.4.01 – METERING 2014 to 2025 Issued – June 2014 This document is not to be copied or issued to anyone outside of SA Power Networks without the express permission of MNSP
SA Power Networks 2014 Internal Use Only Page 7 of 42
1. EXECUTIVE SUMMARYSA Power Networks comprises of 1,115,200 meters supplying 820,400 customers. The main costdriver for the Meter AMP is compliance to regulated inspections. As meters are a revenue basedasset, accuracy requirements are closely scrutinised by the retailer, customer and SA PowerNetworks.
1.1 Metering equipment
The Network population consists of the following types of assets:
Type Sub part Situation Regulation Sub-class
Direct connected (or whole current)
Low amps- mainly residential 1
Transformer type has 2 parts
a. Transformer connectedmeters
High amps - mainly commercial and industrial
2
b. Metering transformers High amps - mainly commercial and industrial
3
Other devices Time switches Controlling off peak loads Not regulated
SWD units Switching controls remotely across power lines
Not regulated
The first photo is of direct connected meters. From basic single element→single element, import/export meter→electronic→ 2 element (J and M tariff).
The second photo is the transformer type. It has 3 coloured bus bars with voltage and current transformers on each, fuses and a combined meter.
Meter data and size reference (see Appendix 6 for more)
Type Data measurement Size
7 No meter Not specific
6 Basic meter- manually read <160 MWh (in SA)
5 Interval meter- manually read < 160 MWh (in SA)
4 Interval meter- remotely read < 750 MWh
3 Interval meter- remotely read 0.75-100 GWh
2 Interval meter- remotely read 100-1000 GWh
1 Interval meter- remotely read >1000 GWh

AMP 3.4.01 Metering 2014 to 2025
ASSET MANAGEMENT PLAN 3.4.01 – METERING 2014 to 2025 Issued – June 2014 This document is not to be copied or issued to anyone outside of SA Power Networks without the express permission of MNSP
SA Power Networks 2014 Internal Use Only Page 8 of 42
1.2 Expenditure
The business expenditure is primarily driven by the inspection and testing of meters.
The testing finds “failures” which are those meters not within the allowable accuracy limits of the National Electricity Rules - Chapter 7 (see Appendix 6) and AS1284 Electricity Metering -part 13 covers In Service Compliance testing (see Appendix 4 for examples). Failures are dealt with by
any individual meters that fails is rectified immediately (this is unplanned expenditure), inaddition to which
if enough meters in a series statistically fail, then the whole series is replaced (this is plannedexpenditure).
The management strategy found to be most reasonable (prudent and efficient) is
replacement for the smaller direct connected meters and
repair for the larger transformer based meters is considered as an option.
The overview of the tasks and subsequent expenditure is as follows (see diagrams below)
Capex is about 2.5 times the average Opex cash flow.
While the opex tasks are dominated by direct connected meters, the cash flow oftransformer based equipment is half the total due to their specialised test requirements.
The capex cash flow is dominated by direct connected meters as most transformer basedequipment is robust and is repaired rather than replaced if there is a problem.
From the Cash flow tables, it can be seen that the planned work dominates the Capex as it isrequired replacements of failed series of meters.

AMP 3.4.01 Metering 2014 to 2025
ASSET MANAGEMENT PLAN 3.4.01 – METERING 2014 to 2025 Issued – June 2014 This document is not to be copied or issued to anyone outside of SA Power Networks without the express permission of MNSP
SA Power Networks 2014 Internal Use Only Page 9 of 42
1.3 Trends/changes since last AMP
2. INTRODUCTION The distribution network that delivers electricity to homes and businesses throughout South Australia is owned and operated by SA Power Networks. Electrical energy is supplied to more than 820,400 customers via revenue quality metering equipment maintained in compliance with National and State regulations.
SA Power Networks is responsible for approximately 1,115,200 meters installed in the distribution network and also has responsibility for reading meters in South Australia on behalf of electricity retailers who subsequently bill customers for the quantity of power consumed.
National and State regulatory authorities require details of SA Power Networks metering management in compliance with:
National Electricity Rules (NER), Chapter 7
National Electricity Market Metrology Procedure
Accreditation by the Australian Energy Market Operator (AEMO) for the role of Metering Provider
Electricity Metering Code (Administered by the Essential Services Commission of South Australia)

AMP 3.4.01 Metering 2014 to 2025
ASSET MANAGEMENT PLAN 3.4.01 – METERING 2014 to 2025 Issued – June 2014 This document is not to be copied or issued to anyone outside of SA Power Networks without the express permission of MNSP
SA Power Networks 2014 Internal Use Only Page 10 of 42
SA Power Networks is registered as a Metering Provider (MP-B) in the National Electricity Market and is accredited for metering service provision in several metering installation categories listed in Appendix 1.
Techniques for metering maintenance management, that are implemented in compliance with appropriate regulations, generally comprise different procedures for inspection and testing of the various metering equipment types.
3. ASSET TYPES & DESCRIPTION The Metering Asset Management Plan incorporates various metering equipment and associated systems installed in the SA Power Networks distribution network.
The two major forms are the ‘direct connected’ and the ‘transformer connected’ meters.
3.1 An explantion
In order to measure power (and sum it to get the energy flow), the instrument needs to measure both the voltage and the current.
When voltages and currents are reatively low, it makes sense to run wires directly through the instrument, hence ‘direct connected’ or ‘whole current’.
If the currents are relatively large, the wires become thick and expensive, and the control panel may be a bit remote. Also, the connections on an instrument won’t handle very high currents. Such high currents can also be quite dangerous because fault currents could cause arc flash injuries. So, a current transformer (CT) is installed on the high current line (typically a toroid or a square donut shape and the high current simply passes through, forming a one-turn primary). The secondary current is much less, often 5 Amps at full scale (which may be 100A on the main conductor)
The same thing is true of voltages, where a 240V may have no problem with clearances, a 1kV wire would cause headaches-thick insulation and danger. To solve this problem a voltage transformer (VT) can be used to step down the voltage to be compatible to the meter instrumentation.
These items are classed as ‘instrument transformers’. The operating principle is generally the same as any other transformer, but they are optimized for the intended application. When inspecting and testing, there is a lot more work required than the direct connected meters.
3.2 Maintenance requirements
Within separate sub classes, are diverse maintenance requirements for meter asset management.
Sub class 1 – Direct connected meters.
Maintenance compliant with National Electricity Rules
Meter sample testing in accordance with AS/NZS 1284.13: Electricity Metering – In-service compliance testing
Transformer based measurement has 2 components, the meter and the transformers. Each of these have different inspection and testing requirements
Sub class 2 – Transformer conn`ected meters.
Meters individually inspected and tested
Inspection conducted at periods required by National Electricity Rules with exception of type 3 meters
Testing of meters conducted at periods required by National Electricity Rules

AMP 3.4.01 Metering 2014 to 2025
ASSET MANAGEMENT PLAN 3.4.01 – METERING 2014 to 2025 Issued – June 2014 This document is not to be copied or issued to anyone outside of SA Power Networks without the express permission of MNSP
SA Power Networks 2014 Internal Use Only Page 11 of 42
Sub class 3 – Metering Transformers.
Metering transformers individually inspected and tested
HV transformers at wholesaler and boundary sites maintained in compliance with national Electricity Rules
Inspection conducted at periods required by National Electricity Rules with exception of type 3 meters
Testing of transformers by an alternative procedure
Meter operating mechanism
Meter Operation
Direct connected meters Electro-mechanical and electronic meters
Transformer connected meters Electro-mechanical and electronic meters
Metering transformers – Low voltage (Current transformers) High voltage (Current and voltage transformers)
Time switches Mechanical and electronic time switches
Sequential Wave Distortion systems Transmitters, subcams and receivers
Metering communication equipment and associated facilities:
Metering Equipment Approximate Quantity
Direct connected meters 1,106,500 Transformer connected meters 8,700 Metering transformers for LV (low voltage) and HV (high voltage)
LV transformers (with CT devices) HV transformers (both CT and VT)
5,700 3,000
Time-switches Exact numbers unknown as they are not a regulated meter, and many have been replaced during solar upgrades
SWD receivers 7,000 SWD transmitters 7
Table 1: Metering Equipment in SA Power Networks
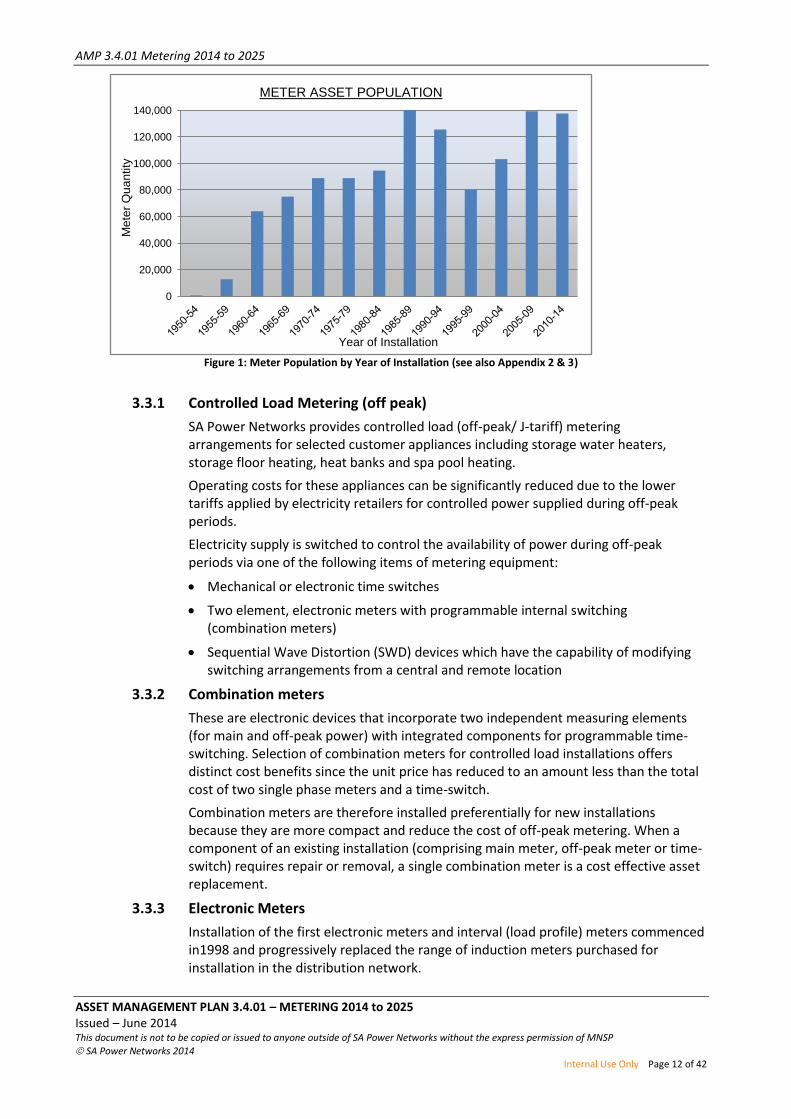
3.3 Meters
The approximate quantities of revenue meters in the network corresponding to periods of installation are indicated in the following graph:
AMP 3.4.01 Metering 2014 to 2025
ASSET MANAGEMENT PLAN 3.4.01 – METERING 2014 to 2025 Issued – June 2014 This document is not to be copied or issued to anyone outside of SA Power Networks without the express permission of MNSP
SA Power Networks 2014 Internal Use Only Page 12 of 42
Figure 1: Meter Population by Year of Installation (see also Appendix 2 & 3)
3.3.1 Controlled Load Metering (off peak)
SA Power Networks provides controlled load (off-peak/ J-tariff) metering arrangements for selected customer appliances including storage water heaters, storage floor heating, heat banks and spa pool heating.
Operating costs for these appliances can be significantly reduced due to the lower tariffs applied by electricity retailers for controlled power supplied during off-peak periods.
Electricity supply is switched to control the availability of power during off-peak periods via one of the following items of metering equipment:
Mechanical or electronic time switches
Two element, electronic meters with programmable internal switching (combination meters)
Sequential Wave Distortion (SWD) devices which have the capability of modifying switching arrangements from a central and remote location
3.3.2 Combination meters
These are electronic devices that incorporate two independent measuring elements (for main and off-peak power) with integrated components for programmable time-switching. Selection of combination meters for controlled load installations offers distinct cost benefits since the unit price has reduced to an amount less than the total cost of two single phase meters and a time-switch.
Combination meters are therefore installed preferentially for new installations because they are more compact and reduce the cost of off-peak metering. When a component of an existing installation (comprising main meter, off-peak meter or time-switch) requires repair or removal, a single combination meter is a cost effective asset replacement.
3.3.3 Electronic Meters
Installation of the first electronic meters and interval (load profile) meters commenced in1998 and progressively replaced the range of induction meters purchased for installation in the distribution network.
0
20,000
40,000
60,000
80,000
100,000
120,000
140,000
Me
ter
Qu
an
tity
Year of Installation
METER ASSET POPULATION
AMP 3.4.01 Metering 2014 to 2025
ASSET MANAGEMENT PLAN 3.4.01 – METERING 2014 to 2025 Issued – June 2014 This document is not to be copied or issued to anyone outside of SA Power Networks without the express permission of MNSP
SA Power Networks 2014 Internal Use Only Page 13 of 42
Since 2006, all new meters purchased and installed by SA Power Networks have been electronic devices with functionality to suit various applications.
Meters at existing two phase installations are replaced with three phase electronic meters which comprise three independent measuring elements so that metering accuracy of each phase is not affected by the number, sequence or load of phase connections.
Electronic meters provide greater versatility compared with induction metering devices and introduce opportunities for a range of beneficial applications including:
Compact meters requiring less space on meter boards
Reduced electricity theft as the meter is more tamper resistant
Improved meter functionality including load profiling
Multi-rate tariffs for customer cost savings
Provision for communication facilities and remote interrogation
Integrated time clocks and circuit switching relays
Meter reading and auto time synchronising via electronic hand held units
3.3.4 Import / Export Metering (solar or wind energy output)
Customers with embedded electricity generation equipment such as solar (photo voltaic) panels may generate in excess of residential/ business requirements and have the capability of exporting surplus electrical energy to the distribution network.
Electronic meters with functionality for measuring import and export electricity (values displayed on separate registers), are provided at these supply points concurrent with installation of the electricity generation equipment.
The South Australian Government requirements for import/ export metering are provided in a document entitled 'Feed-In Mechanism for Residential Small-Scale Solar Photovoltaic Installations'.
In compliance with the document, meters installed by SA Power Networks for three phase supply applications register the export energy (ie export to the grid) as a net recording of all three phases and is therefore a measure of electricity generated by the solar system that is surplus to customer requirements.
3.3.5 ‘Smart ready’ Meters
‘Smart ready’ meters are electronic meters that are designed to be upgradable with the addition of an optional telecommunications module to enable a range of ‘smart meter’ functions. In their manually-read configuration these meters cost only a little more than basic electronic accumulation meters, but provide the additional capability to record peak demand as well as energy consumed, which is required to support new cost-reflective network tariffs.
If the optional telecommunications module is installed, a range of additional functions can be enabled, including:
Remote power quality monitoring
Dynamic load control
Sudden disconnects/ service restoration alerts
Remote disconnect/ reconnect
Remote ping
AMP 3.4.01 Metering 2014 to 2025
ASSET MANAGEMENT PLAN 3.4.01 – METERING 2014 to 2025 Issued – June 2014 This document is not to be copied or issued to anyone outside of SA Power Networks without the express permission of MNSP
SA Power Networks 2014 Internal Use Only Page 14 of 42
Remote reading
A ‘smart ready’ meter will be the preferred meter for all new and replacement installations from July 2015. This is required to enable tariff reform, and also aligns with policy goals to facilitate a transition to the more capable metering required to support new demand-side services at the least possible cost to the community. Customers clearly support a transition to smarter metering, and continuing to install non-upgradable meters would be imprudent and ultimately result in stranded assets and higher cost to the community.
3.4 Metering using Transformers
Low voltage metering transformers installed in the SA Power Networks distribution network may be supplied/ connected/ commissioned by one or more of several contributors including SA Power Networks, switchboard manufacturers and customer electrical service providers.
High voltage metering transformers installed in the distribution network are supplied by SA Power Networks and may be connected/ commissioned by one or more of several contributors including SA Power Networks and customer electrical service providers.
3.5 Time Switches
Time switches are not a regulated item, but are an advantage to the network distributor and the customer. The costs of these can be found in unplanned maintenance (due to being unregulated).
Power interruptions and poor time keeping of mechanical time-switch clocks can cause the power supply for customer appliances to drift outside the intended control period (eg off-peak power supplied to water heaters).
Drift of time-switches does not generally have an adverse effect on the distribution system as it tends to disburse the impact of start-up loads, however an uncontrolled increase of power demand during peak periods can have an adverse effect if the maximum demand causes over-load conditions in sections of the network.
The introduction of electronic time-switch devices has improved the control period switching performance due to superior time keeping accuracy of electronic clocks and more reliable electronic switching components.
Combination meters can be considered time-switch devices. These have been described in the previous section.
3.6 SWD Systems
During the1980s SA Power Networks developed an alternative method for control of off-peak domestic water heating using a power line communication system with low frequency signal known as Sequential Wave Distortion (SWD). The system provides one-way communication between the distribution utility and the customer to perform remote on/ off switching of customer appliances in a manner that can be adjusted to suit off-peak management of network load.
The SWD system essentially comprises a transmitter with transmitter controller located in a SA Power Networks substation. The transmitter injects a control signal, via coupling transformer, along the distribution power line to a SWD receiver at the customer residence. Off-peak power supply (eg for water heating) is switched by the receiver in response to programmed signals from the transmitter controller which SA Power Networks can control remotely by landline telephone for modification of the switching program.
AMP 3.4.01 Metering 2014 to 2025
ASSET MANAGEMENT PLAN 3.4.01 – METERING 2014 to 2025 Issued – June 2014 This document is not to be copied or issued to anyone outside of SA Power Networks without the express permission of MNSP
SA Power Networks 2014 Internal Use Only Page 15 of 42
Eight of the SA Power Networks substations in the Adelaide metropolitan area have SWD systems installed providing off-peak load control totalling approximately 70 MW.
Functional operation of the SWD system has considerable benefit to SA Power Networks as it provides a facility for distribution network management to reduce significant off-peak customer load, especially when sections of the network are exposed to high demand for electricity supply.
4. DETAILS - Current Condition and Specific Work Plans There are a number of sub-classes based on different inspection and testing procedures
Those covered by the National Metering Rules are:
Sub class 1:Direct connected meters
Sub class 2:Transformer connected meters
Sub class 3:Metering transformers
Additional sub-classes are:
Time-switches
SWD system
4.1 Sub Class 1 – Direct Connected meters
4.1.1 Asset Condition
The primary focus is on performance within acceptable accuracy tolerances. See Appendix 6
Meter testing to date has identified that deteriorating performance accuracy is limited to isolated meter groups rather than indicating failure trends of age related or family related meters. These groups when found are replaced. This is the largest cost component.
4.1.2 Known Asset Problems
4.1.2.1 Rationalisation of Meter Types
An examination of meters in the distribution network indicates that the total single phase meter group comprises more than 70 different meter types and 60% of these types comprise quantities less than 1000 meters.
Many of these came from regional authorities in country areas obtaining meters suitable to their needs of the time, but not compatible to the overall network. Also many have insufficient details and are considered unclassified.
While these meters are still operationally suitable and have acceptable accuracy performance, the excessive amount of testing required for such a variety of small meter groups is not an effective use of maintenance resources. The choices are:
Testing –uneconomic
No testing, no replacement- economic but not fully compliant
Replacement without testing- this is the current approach adopted -to remain compliant.
Removal of unclassified meters and small meter groups are considered during planning of capital projects.

AMP 3.4.01 Metering 2014 to 2025
ASSET MANAGEMENT PLAN 3.4.01 – METERING 2014 to 2025 Issued – June 2014 This document is not to be copied or issued to anyone outside of SA Power Networks without the express permission of MNSP
SA Power Networks 2014 Internal Use Only Page 16 of 42
4.1.2.2 4 Dial Meters
4 dial meters are the “old” style 4 disc meters (technically induction dc meters), normally remaining in residential properties for measurement of the J Tariff. As they fail they are replaced with more modern meters.
4.1.2.3 Electronic Meters
There is a group of early model electronic meters, type YS1826, which are showing evidence of early failure. Their life is around 10 years instead of the expected over 15 years. There are approx 15,000 of these to be replaced in the next 5 years.
4.1.2.4
4.1.3 Strategy
SA Power Networks maintenance strategies for metering equipment are structured in consideration of National Electricity Rules, state regulatory codes, manufacturer’s recommendations and experience. See Appendix 4 for inspection and testing details. The smaller meters are replaced rather than repaired as a result of:
inspections when damage found
testing – accuracy failures can lead to batch replacement
faults reported from customers, retailer, meter readers or field personnel
meter family failures
small lot groups
early model electronic meters
4.1.4 New Meters
A representative sample of any new pattern or type of meter is tested prior to installation and in accordance to the above standard.
4.1.5 Meter Replacement
SA Power Networks commits resources for annual meter replacement programs which may include groups of meters that are:
identified as having unacceptable accuracy errors, see Appendix 5 for 2013 results.
are not suitable for continuing service requirements
are considered too small for cost effective meter sample testing
4.1.6 Small Family Replacement
Families of meter types and classes for meter sample testing that comprise quantities less than 150 units, are managed in a cost effective manner by scheduling for ‘replacement without testing’. The meter groups included each year are selected according to assessment of priority for each meter group condition.
AMP 3.4.01 Metering 2014 to 2025
ASSET MANAGEMENT PLAN 3.4.01 – METERING 2014 to 2025 Issued – June 2014 This document is not to be copied or issued to anyone outside of SA Power Networks without the express permission of MNSP
SA Power Networks 2014 Internal Use Only Page 17 of 42
4.1.7 Large Family Replacement
Generally, families that have unacceptable accuracy error are included in the replacement program in the year following the meter sample testing period. However, some large families of direct connected meters may not be able to have the work completed in the following year due to resource availability constraints. In this event SA Power Networks will notify and discuss arrangements for a rectification plan that is acceptable to AEMO.
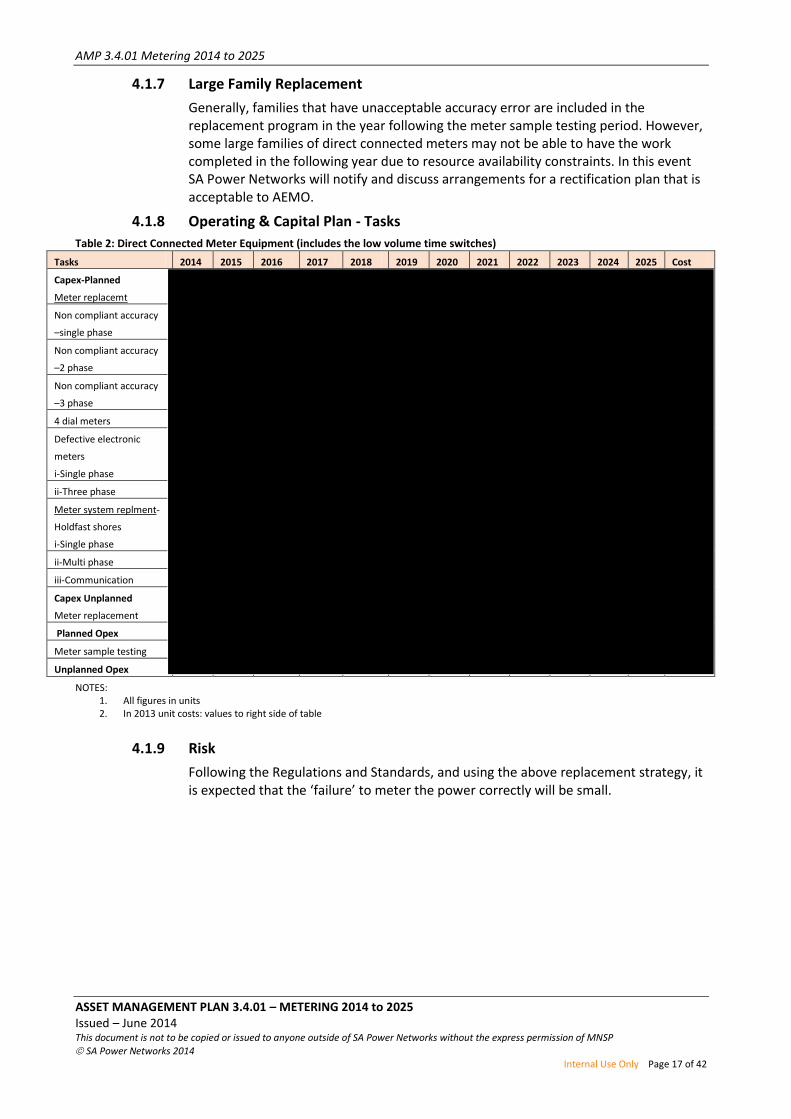
4.1.8 Operating & Capital Plan - Tasks
Table 2: Direct Connected Meter Equipment (includes the low volume time switches)
Tasks 2014 2015 2016 2017 2018 2019 2020 2021 2022 2023 2024 2025 Cost
Capex-Planned
Meter replacemt
Non compliant accuracy
–single phase
Non compliant accuracy
–2 phase
Non compliant accuracy
–3 phase
4 dial meters
Defective electronic
meters
i-Single phase
ii-Three phase
Meter system replment-
Holdfast shores
i-Single phase
ii-Multi phase
iii-Communication
Capex Unplanned
Meter replacement
Planned Opex
Meter sample testing
Unplanned Opex
NOTES: 1. All figures in units 2. In 2013 unit costs: values to right side of table
4.1.9 Risk
Following the Regulations and Standards, and using the above replacement strategy, it is expected that the ‘failure’ to meter the power correctly will be small.

AMP 3.4.01 Metering 2014 to 2025
ASSET MANAGEMENT PLAN 3.4.01 – METERING 2014 to 2025 Issued – June 2014 This document is not to be copied or issued to anyone outside of SA Power Networks without the express permission of MNSP
SA Power Networks 2014 Internal Use Only Page 18 of 42
4.2 Sub Class 2 – Transformer connected meters
4.2.1 Asset Condition
The transformer connected meter population is maintained by SA Power Networks with a primary focus on performance accuracy of individual meters being a dominant priority.
4.2.2 Known Asset Problems
Since metal cased meters are in the final stages of being removed, there are no other major issues in this group
4.2.3 Strategy
To follow regulated Inspection and testing requirements
All transformer connected meters in the SA Power Networks distribution network are individually inspected and tested in accordance with documented metering work procedures. See Appendix 4 for details.
When testing identifies meters that do not comply with class accuracy requirements of the National Electricity Rules, Chapter 7, the individual faulty units are replaced immediately with appropriate new meters.
4.2.4 Operating & Capital Plan - Tasks
Table 3: Transformer Connected Meter Equipment
Tasks 2014 2015 2016 2017 2018 2019 2020 2021 2022 2023 2024 2025 Cost ea
Capex
Type 6CT Meter
replacement
-With type 5CT
-With type 5CT
meter and
comms
Meter
installation/
replacement
Commn modem
replacement
Planned Opex
Type 1-6 CT
Meter Maint.
and investigate
Interval and
comms
NOTES: All figures in units, in 2013 unit costs, amount to right of table
4.2.5 Risk
Based on the SA Power Networks standard criteria, the residual risk of implementing this strategy is considered to be low.
AMP 3.4.01 Metering 2014 to 2025
ASSET MANAGEMENT PLAN 3.4.01 – METERING 2014 to 2025 Issued – June 2014 This document is not to be copied or issued to anyone outside of SA Power Networks without the express permission of MNSP
SA Power Networks 2014 Internal Use Only Page 19 of 42
4.3 Sub Class 3 – Metering Transformers
4.3.1 Asset Condition
Operational experience with metering transformers installed in the SA Power Networks distribution network indicates that the assets perform satisfactorily in service for long periods of time.
Maintenance history provides evidence that metering transformers rarely require replacement due to failure.
4.3.2 Known Asset Problems
Electrical flashover within high voltage metering cubicles has occurred on several occasions during recent years causing unexpected interruption of supply to major customers and incurring expensive replacement of equipment damaged by high energy discharge.
The incidence of surface tracking across cast resin casings of voltage transformers has been identified as the condition that initiates high voltage electrical flashover between transformer terminals. Modification of the voltage transformers installed in metering cubicles has been initiated to improve the electrical insulation between transformer terminals.
Electrical flashover has not been experienced with any of the modified high voltage metering cubicles.
4.3.3 Strategy
The strategy is by inspection and testing to find the condition of the transformers and adjust or repair as required. See Appendix 4 for details
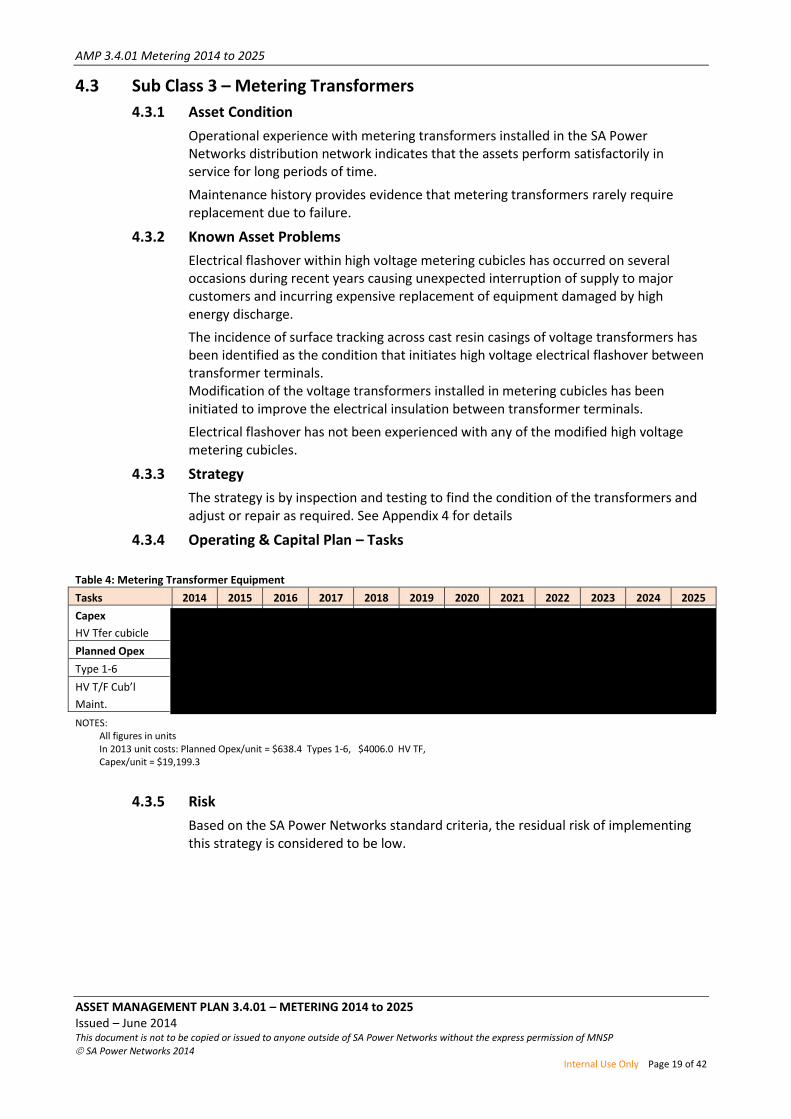
4.3.4 Operating & Capital Plan – Tasks
Table 4: Metering Transformer Equipment
Tasks 2014 2015 2016 2017 2018 2019 2020 2021 2022 2023 2024 2025
Capex
HV Tfer cubicle
Planned Opex
Type 1-6
HV T/F Cub’l
Maint.
NOTES: All figures in units In 2013 unit costs: Planned Opex/unit = $638.4 Types 1-6, $4006.0 HV TF, Capex/unit = $19,199.3
4.3.5 Risk
Based on the SA Power Networks standard criteria, the residual risk of implementing this strategy is considered to be low.
AMP 3.4.01 Metering 2014 to 2025
ASSET MANAGEMENT PLAN 3.4.01 – METERING 2014 to 2025 Issued – June 2014 This document is not to be copied or issued to anyone outside of SA Power Networks without the express permission of MNSP
SA Power Networks 2014 Internal Use Only Page 20 of 42
4.4 Sub Class 4 – Time-switches
4.4.1 Asset Condition
Time-switch assets installed in the SA Power Networks network perform satisfactorily in service for switching required by applications such as controlled load supplies for electric water heating and two rate tariffs for weekend pumping.
4.4.2 Known Asset Problems
Power interruptions and poor time keeping of time-switches clocks can cause the supply of power to drift outside the intended control period ( switched off-peak supplies for electric water heating systems).
Drift of time-switches does not generally have an adverse effect on the distribution network as it tends to disperse the impact of start-up loads, however concentration of power demand during peak periods can have an adverse effect if the maximum demand causes over-load conditions in sections of the network.
4.4.3 Strategy
Regular inspection of time-switches installed with metering equipment is undertaken by meter reading personnel during recording of consumption data.
Details of damage, broken seals, tampering and incorrect time-switch settings are reported which generates notifications for rectification by field maintenance staff.
Investigation of time-switch faults is also performed in response to customer requests which most often arise in relation to water heating problems.
The maintenance strategy for time-switches comprises of:
When sent to check a meter, then repair of defects as detected, otherwise ‘operate to failure’.
When a single meter fails, the meter replacement is with a combination 2 element meter comprising a main meter, controlled load meter and time-switch.
If a series of time switches need replacement, only the time switches are replaced to minimise business costs (not the other load meters)
4.4.4 Operating & Capital Plan - Tasks
The Time switch tasks and costs are included in with Direct Connect meters for Opex, and the unplanned for Capex
4.4.5 Risk
Based on the SA Power Networks standard criteria, the residual risk of implementing this strategy is considered to be low.
4.5 Sub Class 5 – SWD System
4.5.1 Asset Condition SWD system assets installed in the SA Power Networks distribution network are generally operating satisfactorily for switching of controlled load supplies such as electricity for water heating.
The system has the capability of remotely adjusting the period of load control for individual customer receivers or selected groups of receivers with the potential benefit of reducing demand on sections of the network during periods of excessive demand.

AMP 3.4.01 Metering 2014 to 2025
ASSET MANAGEMENT PLAN 3.4.01 – METERING 2014 to 2025 Issued – June 2014 This document is not to be copied or issued to anyone outside of SA Power Networks without the express permission of MNSP
SA Power Networks 2014 Internal Use Only Page 21 of 42
4.5.2 Known Asset Problem
SWD system equipment is starting to exhibit failures. There are no direct replacements available.
Relocation of feeder routes due to network expansion in some areas has severed SWD communication between substation and customer receivers which has effectively stranded those SWD assets.
4.5.3 Strategy
Regular inspection of SWD receivers installed with metering equipment is undertaken by meter reading personnel during attendance for recording of consumption data.
Details of damage, broken seals and tampering are reported which generates notifications for rectification by field maintenance staff.
Investigation of SWD receiver faults is also performed in response to customer requests which most often arise in relation to water heating problems.
Generally, the maintenance strategy for SWD receivers comprises replacement with new units as there are no spares available.
The Metering replacement involves the main meter, controlled load meter and defective SWD receiver being replaced with a two element electronic meter whenever practical.
4.5.4 Operating & Capital Plan - Tasks
Table 5: SWD Equipment
Tasks 2014 2015 2016 2017 2018 2019 2020 2021 2022 2023 2024 2025
Planned Opex
Transmitter and
subcam
--
7 7 7 7 7 7 7 7 7 7 7
Unplanned Opex
Defect maint -- 60 58 56 54 52 50 48 46 44 42 40
NOTES:
All figures in units
In 2013 unit costs: Planned Opex/unit = $837.1, Unplanned Opex/unit = $338.8
4.5.5 Risk
Based on the SA Power Networks standard criteria, the residual risk of implementing this strategy is considered to be low.
5. RISK
5.1 Residual Risk
The testing and inspection methods for large populations and large meters proposed in this plan will result in having meters within the required accuracy (and meet the regulations). The replacement method of small lots in direct connected meters is considered a reasonable approach (prudent and efficient) to meet business needs (avoid costly inspections) and maintain compliance.
Hence the residual risk to the organisation is considered appropriate.

AMP 3.4.01 Metering 2014 to 2025
ASSET MANAGEMENT PLAN 3.4.01 – METERING 2014 to 2025 Issued – June 2014 This document is not to be copied or issued to anyone outside of SA Power Networks without the express permission of MNSP
SA Power Networks 2014 Internal Use Only Page 22 of 42
6. SUMMARY
6.1 Capital Table 6: Capex Summary
($,000s) 2014 2015 2016 2017 2018 2019 2020 2021 2022 2023 2024 2025
Capex Planned
Direct connected
Meter replacemt
Non compliant accuracy
single phase
Non compliant accuracy
2 phase
Non compliant accuracy
3 phase 4 dial meters
Defective electronic
meters
i-Single phase
ii-Three phase
Meter system replment-
Holdfast shores
i-Single phase
ii-Multi phase
iii-Communication
Transformer
connected Type 6CT
Meter replacement
-With type 5CT meter
With type 5CT meter and
comms
meter
installation/replacement
Commn modem
replacement
Metering Transformers
HV Transformer cubicle
Capex Unplanned
Meter repalcements
TOTAL
AMP 3.4.01 Metering 2014 to 2025
ASSET MANAGEMENT PLAN 3.4.01 – METERING 2014 to 2025 Issued – June 2014 This document is not to be copied or issued to anyone outside of SA Power Networks without the express permission of MNSP
SA Power Networks 2014 Internal Use Only Page 23 of 42
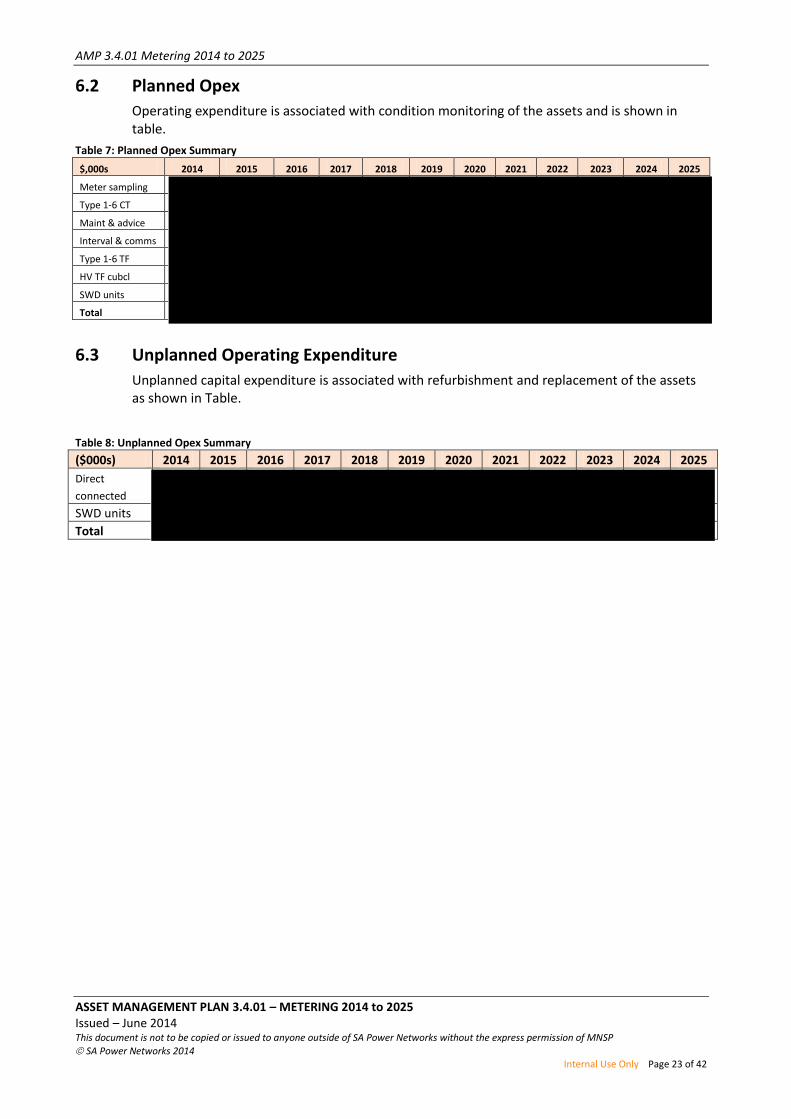
6.2 Planned Opex
Operating expenditure is associated with condition monitoring of the assets and is shown in table.
Table 7: Planned Opex Summary
$,000s 2014 2015 2016 2017 2018 2019 2020 2021 2022 2023 2024 2025
Meter sampling
Type 1-6 CT
Maint & advice
Interval & comms
Type 1-6 TF
HV TF cubcl
SWD units
Total
6.3 Unplanned Operating Expenditure
Unplanned capital expenditure is associated with refurbishment and replacement of the assets as shown in Table.
Table 8: Unplanned Opex Summary
($000s) 2014 2015 2016 2017 2018 2019 2020 2021 2022 2023 2024 2025
Direct
connected
SWD units
Total
AMP 3.4.01 Metering 2014 to 2025
ASSET MANAGEMENT PLAN 3.4.01 – METERING 2014 to 2025 Issued – June 2014 This document is not to be copied or issued to anyone outside of SA Power Networks without the express permission of MNSP
SA Power Networks 2014 Internal Use Only Page 24 of 42
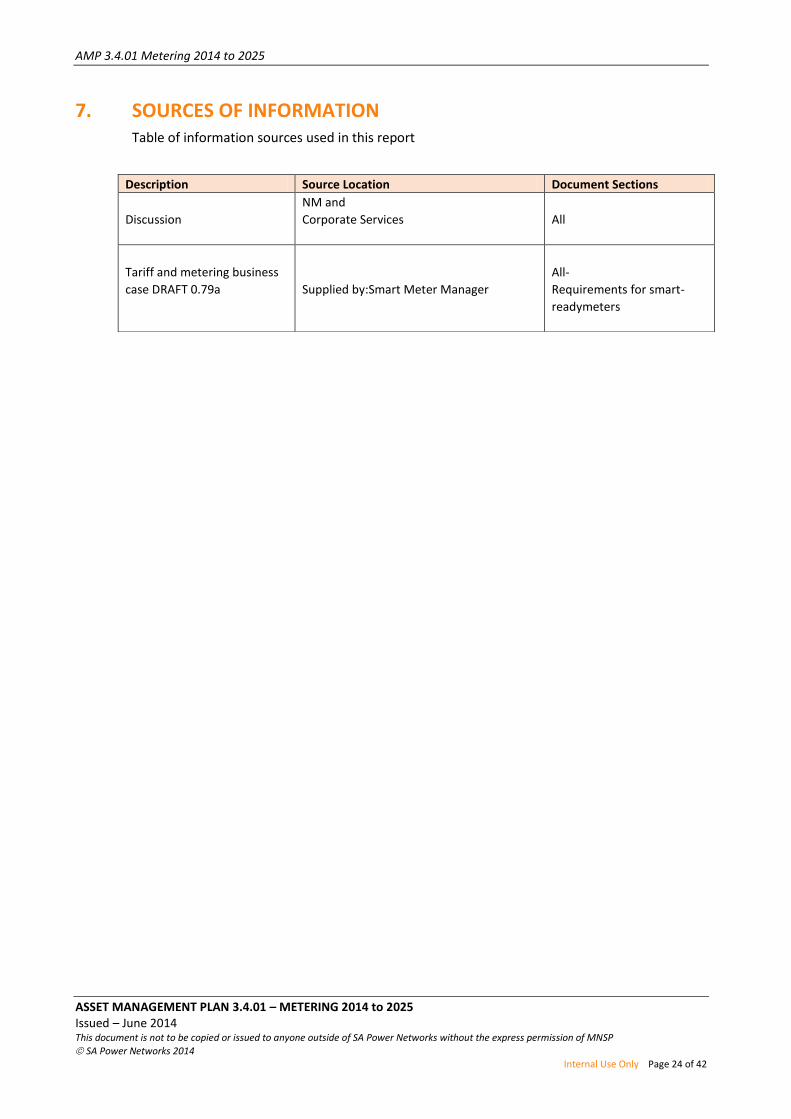
7. SOURCES OF INFORMATION Table of information sources used in this report
Description Source Location Document Sections
Discussion
NM and
Corporate Services
All
Tariff and metering business
case DRAFT 0.79a
Supplied by:Smart Meter Manager
All-
Requirements for smart-
readymeters

AMP 3.4.01 Metering 2014 to 2025
ASSET MANAGEMENT PLAN 3.4.01 – METERING 2014 to 2025 Issued – June 2014 This document is not to be copied or issued to anyone outside of SA Power Networks without the express permission of MNSP
SA Power Networks 2014 Internal Use Only Page 25 of 42
8. APPENDICES
8.1 Appendix 1: Accredited Metering Service Provider
SA Power Networks is registered with the Australian Energy Market Operator (AEMO) as a Metering Provider (MP-B) in the National Electricity Market and is accredited to ‘Provide, Install and Maintain’ metering installations in the following equipment categories:
Category
Competency
1C Class 0.2 CTs
1V Class 0.2 VTs
1M Class 0.2 Wh meters and class 0.5 varh meters
1A Class 0.2 CTs, VTs, Wh meters; class 0.5 varh meters; the total installation to
0.5%
2C Class 0.5 CTs
2V Class 0.5 VTs
2M Class 0.5 Wh meters and class 1.0 varh meters
2A Class 0.5 CTs, VTs, Wh meters; class 1.0 varh meters; the total installation to
1.0%
3M Class 1.0 Wh meters and class 2.0 varh meters
3A Class 0.5 CTs, VTs; class 1.0 Wh meters; class 2.0 varh meters; the total
installation to 1.5%
4M Class 1.0 Wh meters and class 1.5 Wh meters
L Communication links
5 Type 5 interval meters
6 Type 6 basic meters
SA Power Networks provides metering services for installations within the South Australian electricity distribution network at customer supply points categorised as:
First tier – type 2, 3, 4, 5 and 6 installations
Second tier – type 1, 2, 3, 4 and 5 installations.
Meter provision services are not undertaken by SA PowerNetworks in locations outside of the region of South Australia in which the Distribution Licence applies.
AMP 3.4.01 Metering 2014 to 2025
ASSET MANAGEMENT PLAN 3.4.01 – METERING 2014 to 2025 Issued – June 2014 This document is not to be copied or issued to anyone outside of SA Power Networks without the express permission of MNSP
SA Power Networks 2014 Internal Use Only Page 26 of 42
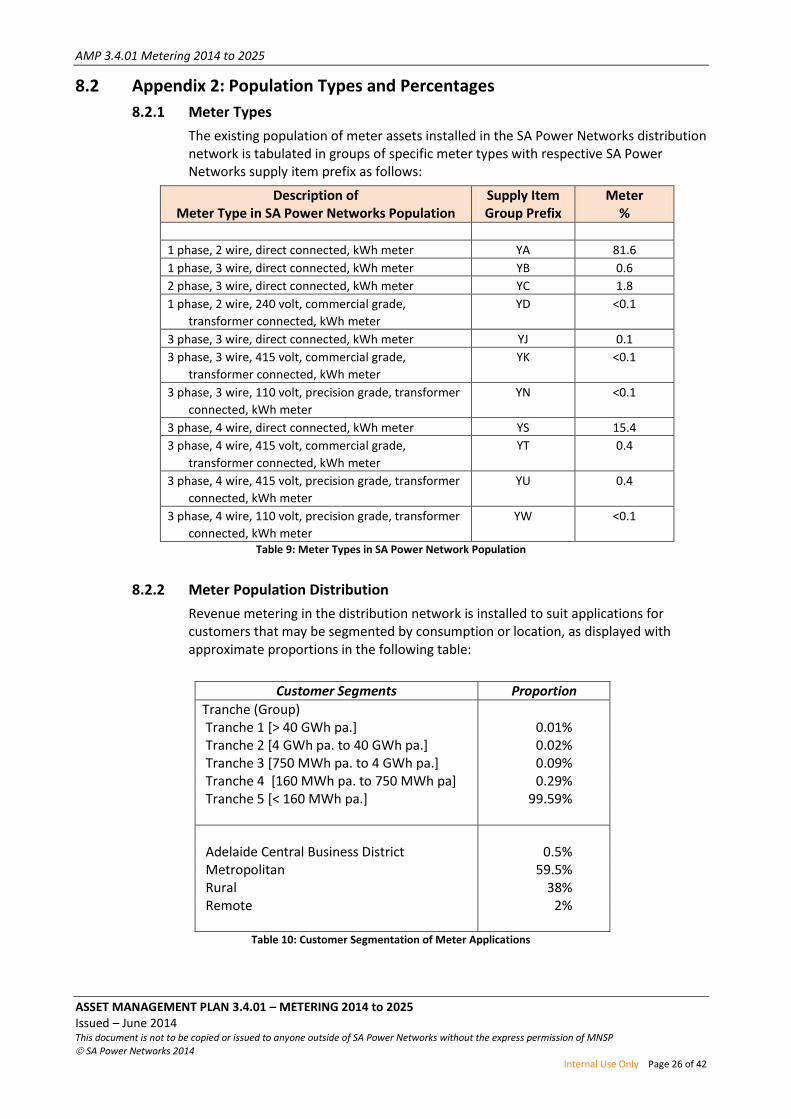
8.2 Appendix 2: Population Types and Percentages
8.2.1 Meter Types
The existing population of meter assets installed in the SA Power Networks distribution network is tabulated in groups of specific meter types with respective SA Power Networks supply item prefix as follows:
Description of Meter Type in SA Power Networks Population
Supply Item Group Prefix
Meter %
1 phase, 2 wire, direct connected, kWh meter YA 81.6
1 phase, 3 wire, direct connected, kWh meter YB 0.6
2 phase, 3 wire, direct connected, kWh meter YC 1.8
1 phase, 2 wire, 240 volt, commercial grade,
transformer connected, kWh meter
YD <0.1
3 phase, 3 wire, direct connected, kWh meter YJ 0.1
3 phase, 3 wire, 415 volt, commercial grade,
transformer connected, kWh meter
YK <0.1
3 phase, 3 wire, 110 volt, precision grade, transformer
connected, kWh meter
YN <0.1
3 phase, 4 wire, direct connected, kWh meter YS 15.4
3 phase, 4 wire, 415 volt, commercial grade,
transformer connected, kWh meter
YT 0.4
3 phase, 4 wire, 415 volt, precision grade, transformer
connected, kWh meter
YU 0.4
3 phase, 4 wire, 110 volt, precision grade, transformer
connected, kWh meter
YW <0.1
Table 9: Meter Types in SA Power Network Population
8.2.2 Meter Population Distribution
Revenue metering in the distribution network is installed to suit applications for customers that may be segmented by consumption or location, as displayed with approximate proportions in the following table:
Customer Segments Proportion
Tranche (Group) Tranche 1 [> 40 GWh pa.] 0.01% Tranche 2 [4 GWh pa. to 40 GWh pa.] 0.02% Tranche 3 [750 MWh pa. to 4 GWh pa.] 0.09% Tranche 4 [160 MWh pa. to 750 MWh pa] 0.29% Tranche 5 [< 160 MWh pa.] 99.59%
Adelaide Central Business District 0.5% Metropolitan 59.5% Rural 38% Remote 2%
Table 10: Customer Segmentation of Meter Applications
AMP 3.4.01 Metering 2014 to 2025
ASSET MANAGEMENT PLAN 3.4.01 – METERING 2014 to 2025 Issued – June 2014 This document is not to be copied or issued to anyone outside of SA Power Networks without the express permission of MNSP
SA Power Networks 2014 Internal Use Only Page 27 of 42
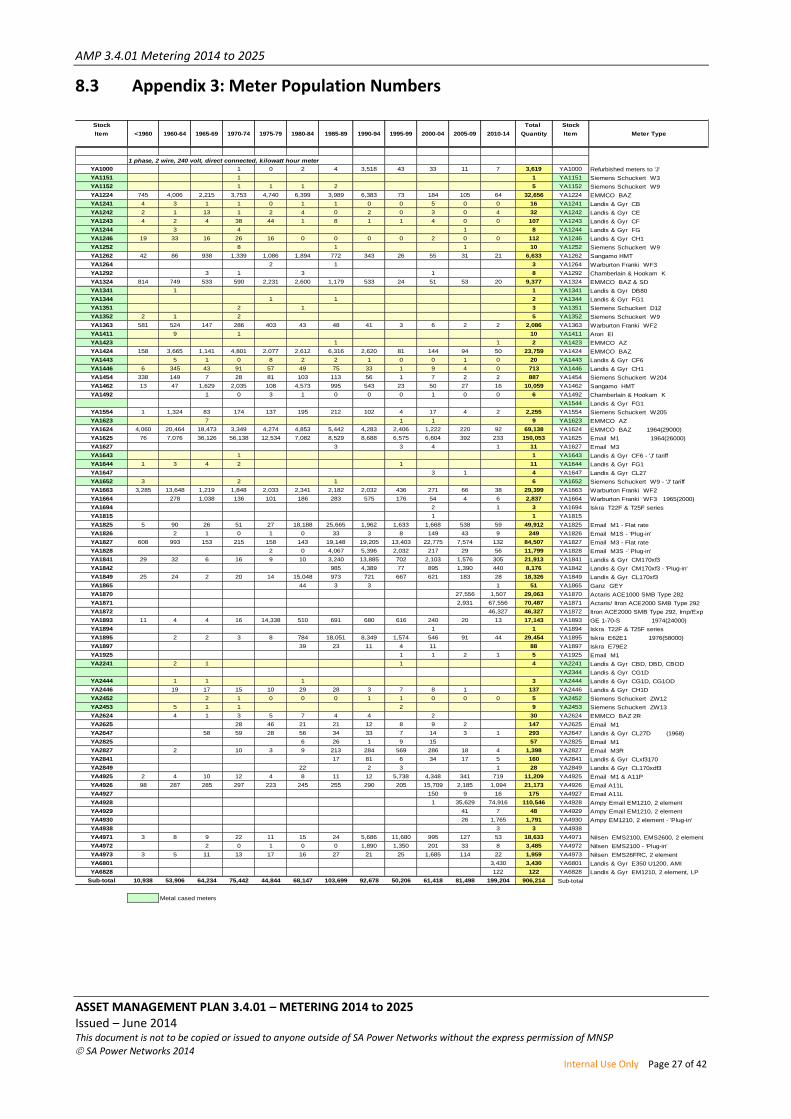
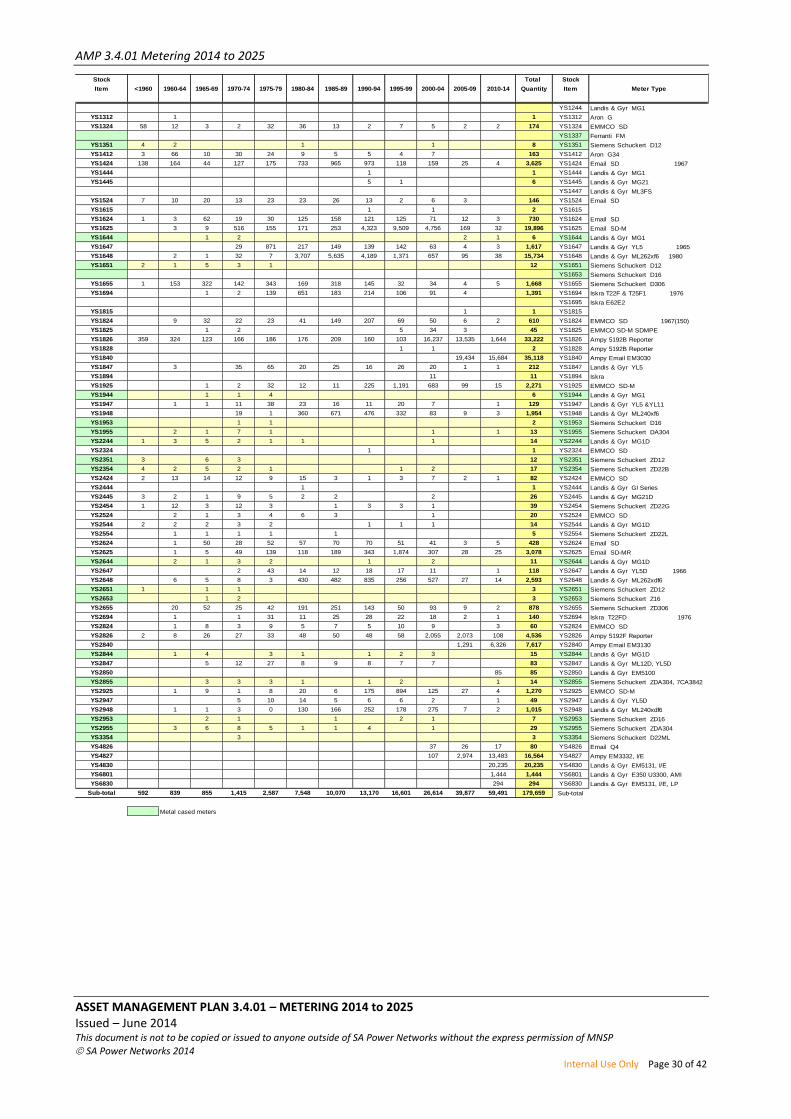
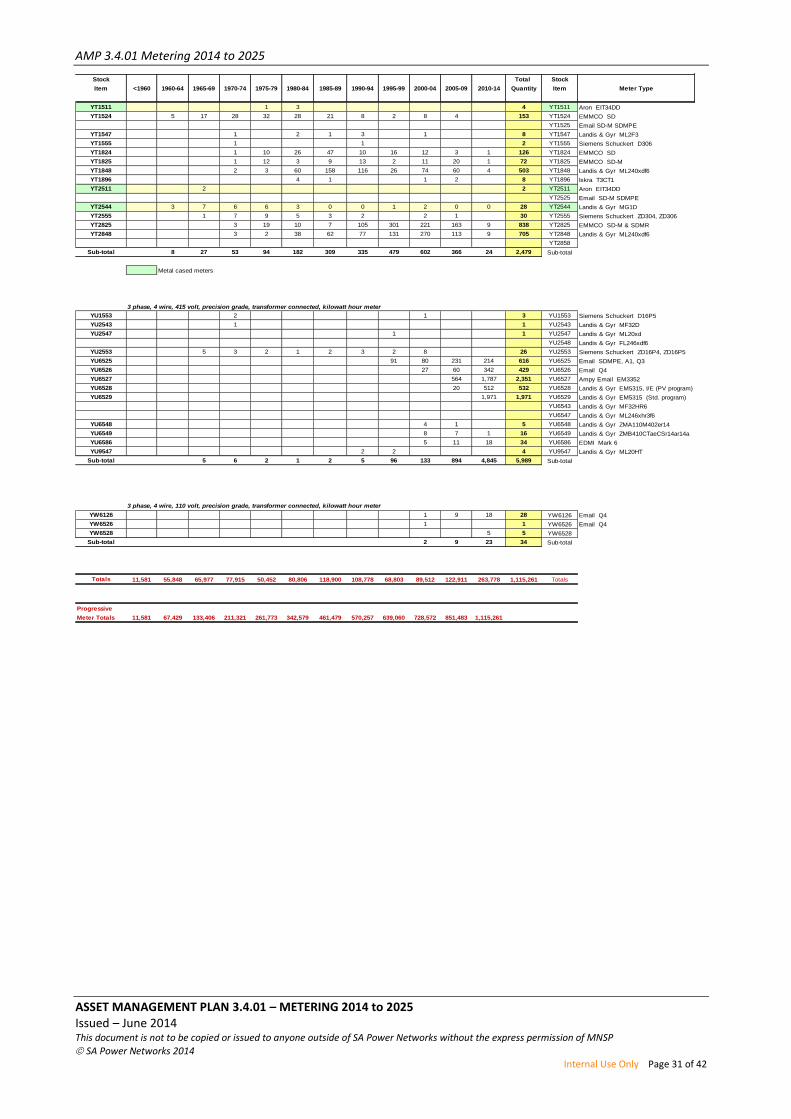
8.3 Appendix 3: Meter Population Numbers
Stock Total Stock
Item <1960 1960-64 1965-69 1970-74 1975-79 1980-84 1985-89 1990-94 1995-99 2000-04 2005-09 2010-14 Quantity Item Meter Type
1 phase, 2 wire, 240 volt, direct connected, kilowatt hour meter
YA1000 1 0 2 4 3,518 43 33 11 7 3,619 YA1000 Refurbished meters to 'J'
YA1151 1 1 YA1151 Siemens Schuckert W3
YA1152 1 1 1 2 5 YA1152 Siemens Schuckert W9
YA1224 745 4,006 2,215 3,753 4,740 6,399 3,989 6,383 73 184 105 64 32,656 YA1224 EMMCO BAZ
YA1241 4 3 1 1 0 1 1 0 0 5 0 0 16 YA1241 Landis & Gyr CB
YA1242 2 1 13 1 2 4 0 2 0 3 0 4 32 YA1242 Landis & Gyr CE
YA1243 4 2 4 38 44 1 8 1 1 4 0 0 107 YA1243 Landis & Gyr CF
YA1244 3 4 1 8 YA1244 Landis & Gyr FG
YA1246 19 33 16 26 16 0 0 0 0 2 0 0 112 YA1246 Landis & Gyr CH1
YA1252 8 1 1 10 YA1252 Siemens Schuckert W9
YA1262 42 86 938 1,339 1,086 1,894 772 343 26 55 31 21 6,633 YA1262 Sangamo HMT
YA1264 2 1 3 YA1264 Warburton Franki WF3
YA1292 3 1 3 1 8 YA1292 Chamberlain & Hookam K
YA1324 814 749 533 590 2,231 2,600 1,179 533 24 51 53 20 9,377 YA1324 EMMCO BAZ & SD
YA1341 1 1 YA1341 Landis & Gyr DB80
YA1344 1 1 2 YA1344 Landis & Gyr FG1
YA1351 2 1 3 YA1351 Siemens Schuckert D12
YA1352 2 1 2 5 YA1352 Siemens Schuckert W9
YA1363 581 524 147 286 403 43 48 41 3 6 2 2 2,086 YA1363 Warburton Franki WF2
YA1411 9 1 10 YA1411 Aron EI
YA1423 1 1 2 YA1423 EMMCO AZ
YA1424 158 3,665 1,141 4,801 2,077 2,612 6,316 2,620 81 144 94 50 23,759 YA1424 EMMCO BAZ
YA1443 5 1 0 8 2 2 1 0 0 1 0 20 YA1443 Landis & Gyr CF6
YA1446 6 345 43 91 57 49 75 33 1 9 4 0 713 YA1446 Landis & Gyr CH1
YA1454 338 149 7 28 81 103 113 56 1 7 2 2 887 YA1454 Siemens Schuckert W204
YA1462 13 47 1,629 2,035 108 4,573 995 543 23 50 27 16 10,059 YA1462 Sangamo HMT
YA1492 1 0 3 1 0 0 0 1 0 0 6 YA1492 Chamberlain & Hookam K
YA1544 Landis & Gyr FG1
YA1554 1 1,324 83 174 137 195 212 102 4 17 4 2 2,255 YA1554 Siemens Schuckert W205
YA1623 7 1 1 9 YA1623 EMMCO AZ
YA1624 4,060 20,464 18,473 3,349 4,274 4,853 5,442 4,283 2,406 1,222 220 92 69,138 YA1624 EMMCO BAZ 1964(29000)
YA1625 76 7,076 36,126 56,138 12,534 7,082 8,529 8,688 6,575 6,604 392 233 150,053 YA1625 Email M1 1964(26000)
YA1627 3 3 4 1 11 YA1627 Email M3
YA1643 1 1 YA1643 Landis & Gyr CF6 - 'J' tariff
YA1644 1 3 4 2 1 11 YA1644 Landis & Gyr FG1
YA1647 3 1 4 YA1647 Landis & Gyr CL27
YA1652 3 2 1 6 YA1652 Siemens Schuckert W9 - 'J' tariff
YA1663 3,285 13,648 1,219 1,848 2,033 2,341 2,182 2,032 436 271 66 38 29,399 YA1663 Warburton Franki WF2
YA1664 278 1,038 136 101 186 283 575 176 54 4 6 2,837 YA1664 Warburton Franki WF3 1965(2000)
YA1694 2 1 3 YA1694 Iskra T22F & T25F series
YA1815 1 1 YA1815
YA1825 5 90 26 51 27 18,188 25,665 1,962 1,633 1,668 538 59 49,912 YA1825 Email M1 - Flat rate
YA1826 2 1 0 1 0 33 3 8 149 43 9 249 YA1826 Email M1S - 'Plug-in'
YA1827 608 993 153 215 158 143 19,148 19,205 13,403 22,775 7,574 132 84,507 YA1827 Email M3 - Flat rate
YA1828 2 0 4,067 5,396 2,032 217 29 56 11,799 YA1828 Email M3S -' Plug-in'
YA1841 29 32 6 16 9 10 3,240 13,885 702 2,103 1,576 305 21,913 YA1841 Landis & Gyr CM170xf3
YA1842 985 4,389 77 895 1,390 440 8,176 YA1842 Landis & Gyr CM170xf3 - 'Plug-in'
YA1849 25 24 2 20 14 15,048 973 721 667 621 183 28 18,326 YA1849 Landis & Gyr CL170xf3
YA1865 44 3 3 1 51 YA1865 Ganz GEY
YA1870 27,556 1,507 29,063 YA1870 Actaris ACE1000 SMB Type 282
YA1871 2,931 67,556 70,487 YA1871 Actaris/ Itron ACE2000 SMB Type 292
YA1872 46,327 46,327 YA1872 Itron ACE2000 SMB Type 292, Imp/Exp
YA1893 11 4 4 16 14,338 510 691 680 616 240 20 13 17,143 YA1893 GE 1-70-S 1974(24000)
YA1894 1 1 YA1894 Iskra T22F & T25F series
YA1895 2 2 3 8 784 18,051 8,349 1,574 546 91 44 29,454 YA1895 Iskra E62E1 1976(58000)
YA1897 39 23 11 4 11 88 YA1897 Iskra E79E2
YA1925 1 1 2 1 5 YA1925 Email M1
YA2241 2 1 1 4 YA2241 Landis & Gyr CBD, DBD, CBOD
YA2344 Landis & Gyr CG1D
YA2444 1 1 1 3 YA2444 Landis & Gyr CG1D, CG1OD
YA2446 19 17 15 10 29 28 3 7 8 1 137 YA2446 Landis & Gyr CH1D
YA2452 2 1 0 0 0 1 1 0 0 0 5 YA2452 Siemens Schuckert ZW12
YA2453 5 1 1 2 9 YA2453 Siemens Schuckert ZW13
YA2624 4 1 3 5 7 4 4 2 30 YA2624 EMMCO BAZ 2R
YA2625 28 46 21 21 12 8 9 2 147 YA2625 Email M1
YA2647 58 59 28 56 34 33 7 14 3 1 293 YA2647 Landis & Gyr CL27D (1968)
YA2825 6 26 1 9 15 57 YA2825 Email M1
YA2827 2 10 3 9 213 284 569 286 18 4 1,398 YA2827 Email M3R
YA2841 17 81 6 34 17 5 160 YA2841 Landis & Gyr CLxf3170
YA2849 22 2 3 1 28 YA2849 Landis & Gyr CL170xdf3
YA4925 2 4 10 12 4 8 11 12 5,738 4,348 341 719 11,209 YA4925 Email M1 & A11P
YA4926 98 287 285 297 223 245 255 290 205 15,709 2,185 1,094 21,173 YA4926 Email A11L
YA4927 150 9 16 175 YA4927 Email A11L
YA4928 1 35,629 74,916 110,546 YA4928 Ampy Email EM1210, 2 element
YA4929 41 7 48 YA4929 Ampy Email EM1210, 2 element
YA4930 26 1,765 1,791 YA4930 Ampy EM1210, 2 element - 'Plug-in'
YA4938 3 3 YA4938
YA4971 3 8 9 22 11 15 24 5,686 11,680 995 127 53 18,633 YA4971 Nilsen EMS2100, EMS2600, 2 element
YA4972 2 0 1 0 0 1,890 1,350 201 33 8 3,485 YA4972 Nilsen EMS2100 - 'Plug-in'
YA4973 3 5 11 13 17 16 27 21 25 1,685 114 22 1,959 YA4973 Nilsen EMS26FRC, 2 element
YA6801 3,430 3,430 YA6801 Landis & Gyr E350 U1200, AMI
YA6828 122 122 YA6828 Landis & Gyr EM1210, 2 element, LP
Sub-total 10,938 53,906 64,234 75,442 44,844 68,147 103,699 92,678 50,206 61,418 81,498 199,204 906,214 Sub-total
Metal cased meters

AMP 3.4.01 Metering 2014 to 2025
ASSET MANAGEMENT PLAN 3.4.01 – METERING 2014 to 2025 Issued – June 2014 This document is not to be copied or issued to anyone outside of SA Power Networks without the express permission of MNSP
SA Power Networks 2014 Internal Use Only Page 28 of 42
Stock Total Stock
Item <1960 1960-64 1965-69 1970-74 1975-79 1980-84 1985-89 1990-94 1995-99 2000-04 2005-09 2010-14 Quantity Item Meter Type
YB5223 2 1 3 YB5223
YB5267 32 2 0 0 0 0 1 0 9 0 0 44 YB5267
YB5268 38 26 6 3 7 3 6 4 52 1 0 146 YB5268
YB5271 8 102 0 0 0 0 0 0 1 0 0 111 YB5271
YB5272 5 5 YB5272
YB5275 7 7 YB5275
YB5276 6 15 1 1 1 3 4 1 32 YB5276
YB5277 8 1 0 0 0 0 0 0 0 1 10 YB5277
YB5279 35 35 YB5279
YB5280 24 1 1 26 YB5280
YB5290 177 1 2 5 2 1 0 0 3 4 1 196 YB5290
YB5291 6 6 YB5291
YB5341 143 71 2 3 2 2 3 0 2 228 YB5341
YB5343 76 0 2 4 3 0 2 0 1 88 YB5343
YB5421 23 23 YB5421
YB5422 152 0 5 0 2 159 YB5422
YB5433 16 0 1 0 2 2 0 21 YB5433
YB5540 93 0 1 1 0 0 1 0 0 0 96 YB5540
YB5600 180 0 1 1 0 0 0 0 3 0 185 YB5600
YB5602 36 0 0 3 2 1 42 YB5602
YB5603 42 1 43 YB5603
YB5633 48 0 1 1 2 1 53 YB5633
YB5640 47 2 0 7 0 1 57 YB5640
YB5641 123 2 1 8 13 1 148 YB5641
YB5642 222 4 3 18 8 2 257 YB5642
YB5652 505 8 7 17 24 2 563 YB5652
YB5655 5 5 YB5655
YB5661 12 12 YB5661
YB5670 33 3 1 2 0 2 41 YB5670
YB5671 25 0 1 1 6 0 33 YB5671
YB5680 96 1 1 2 1 0 101 YB5680
YB5690 402 0 4 6 2 1 415 YB5690
YB5700 2 13 1 16 YB5700
Sub-total 316 442 276 81 32 1,608 188 28 148 69 19 3,207 Sub-total
YC1223 5 6 2 1 1 1 16 YC1223 Email AZ, PAZ
YC1311 2 3 8 1 14 YC1311 Aron E2
YC1312 33 7 14 16 3 1 1 75 YC1312 Aron G23
YC1323 1 1 YC1323 EMMCO PAZ2
YC1324 22 645 306 563 2,723 3,054 1,454 912 158 187 54 32 10,110 YC1324 EMMCO SD
YC1344 1 4 1 1 7 YC1344 Landis & Gyr HGI
YC1354 1 1 2 YC1354 Siemens Schuckert D23 ML
YC1424 1 15 21 3 14 20 14 12 1 101 YC1424 EMMCO SD
YC1442 YC1442 Landis & Gyr E , M
YC1455 13 10 3 6 1 2 2 1 38 YC1455 Siemens Schuckert D314
YC1524 2 5 1 3 1 1 13 YC1524 EMMCO SD
YC1612 6 1 7 YC1612 Aron G
YC1624 1 10 6 17 YC1624 EMMCO SD
YC1625 1 0 2 2 13 18 400 799 177 11 10 1,433 YC1625 EMMCO SD-M
YC1648 3 1 12 6 1,723 1,638 933 267 152 36 13 4,784 YC1648 Landis & Gyr HL262xf6 1980
YC1925 6 11 1 18 YC1925 EMMCO SD-M SDMPE
YC1948 6 6 12 8 1 33 YC1948 Landis & Gyr HL240xf6
YC2324 1 8 12 16 10 15 3 5 3 6 79 YC2324 EMMCO SD
YC2424 1 7 1 1 10 YC2424 EMMCO SD
YC2425 1 1 1 1 4 YC2425 EMMCO SD-M
YC2443 2 2 3 1 8 YC2443 Landis & Gyr DF3D
YC2455 29 6 6 9 2 3 1 2 1 59 YC2455 Siemens Schuckert ZD314
YC2625 31 36 15 13 33 91 14 2 1 236 YC2625 EMMCO SD-M, SDMR
YC2647 18 3 2 2 6 1 1 33 YC2647 Landis & Gyr VL5.5AD
YC2648 2 25 43 59 12 29 3 173 YC2648 Landis & Gyr HL262xdf6
YC2925 9 2 11 YC2925 EMMCO SD-M SDMPE
YC2948 2 6 3 7 1 1 20 YC2948 Landis & Gyr FL, HL, ML
Sub-total 34 744 400 666 2,842 4,892 3,202 2,394 1,384 575 110 59 17,302 Sub-total
Metal cased meters June 2013
YD1524 1 1 YD1524 EMMCO SD
YD1824 1 1 YD1824 EMMCO BAZ & SD
YD1864 1 2 3 YD1864 Warburton Franki WF3
YD2825 1 1 YD2825
YD2841 1 1 YD2841 Landis & Gyr B , M
YD2846 1 1 2 YD2846 Landis & Gyr CH1D
Sub-total 1 0 2 2 3 0 0 1 0 9 Sub-total
Summator, MD duplicating register and recorder
YE3044 1 1 YE3044 Landis & Gyr FEE & EKM series
YE7025 1 1 YE7025 Email-Westinghouse WR32 mag. tape
Sub-total 1 0 1 0 0 2 Sub-total
AMP 3.4.01 Metering 2014 to 2025
ASSET MANAGEMENT PLAN 3.4.01 – METERING 2014 to 2025 Issued – June 2014 This document is not to be copied or issued to anyone outside of SA Power Networks without the express permission of MNSP
SA Power Networks 2014 Internal Use Only Page 29 of 42
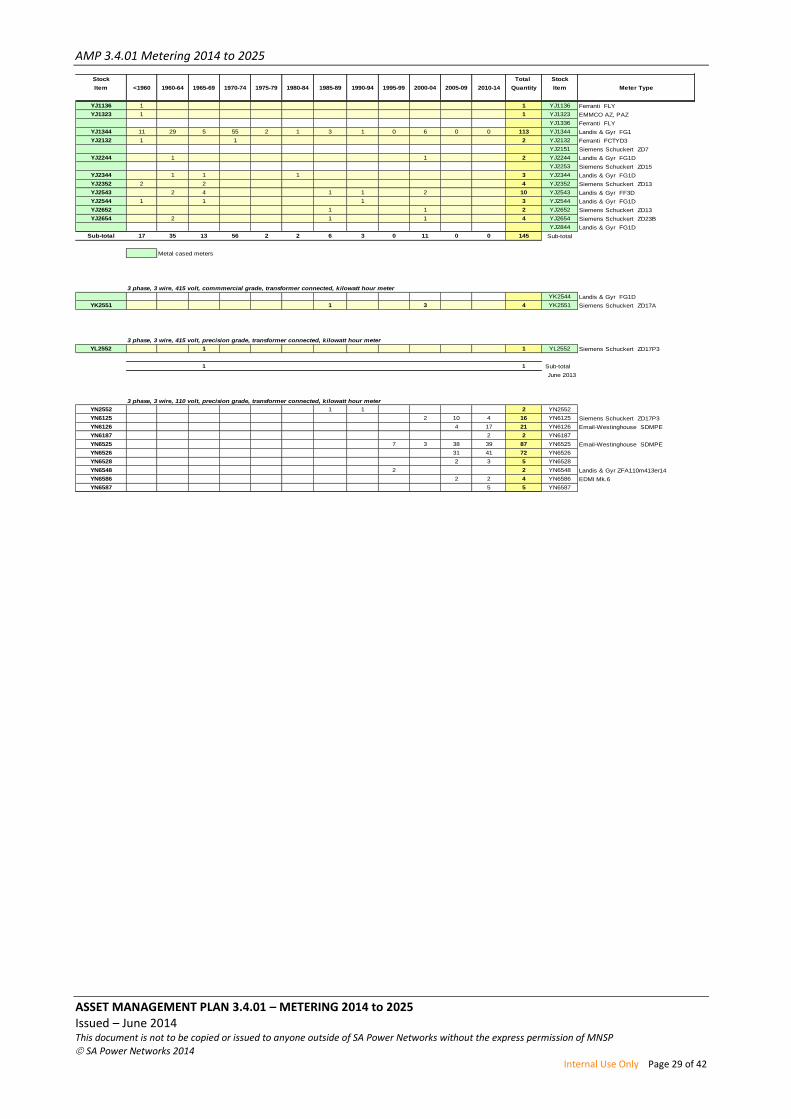
Stock Total Stock
Item <1960 1960-64 1965-69 1970-74 1975-79 1980-84 1985-89 1990-94 1995-99 2000-04 2005-09 2010-14 Quantity Item Meter Type
YJ1136 1 1 YJ1136 Ferranti FLY
YJ1323 1 1 YJ1323 EMMCO AZ, PAZ
YJ1336 Ferranti FLY
YJ1344 11 29 5 55 2 1 3 1 0 6 0 0 113 YJ1344 Landis & Gyr FG1
YJ2132 1 1 2 YJ2132 Ferranti FCTYD3
YJ2151 Siemens Schuckert ZD7
YJ2244 1 1 2 YJ2244 Landis & Gyr FG1D
YJ2253 Siemens Schuckert ZD15
YJ2344 1 1 1 3 YJ2344 Landis & Gyr FG1D
YJ2352 2 2 4 YJ2352 Siemens Schuckert ZD13
YJ2543 2 4 1 1 2 10 YJ2543 Landis & Gyr FF3D
YJ2544 1 1 1 3 YJ2544 Landis & Gyr FG1D
YJ2652 1 1 2 YJ2652 Siemens Schuckert ZD13
YJ2654 2 1 1 4 YJ2654 Siemens Schuckert ZD23B
YJ2844 Landis & Gyr FG1D
Sub-total 17 35 13 56 2 2 6 3 0 11 0 0 145 Sub-total
Metal cased meters
3 phase, 3 wire, 415 volt, commmercial grade, transformer connected, kilowatt hour meter
YK2544 Landis & Gyr FG1D
YK2551 1 3 4 YK2551 Siemens Schuckert ZD17A
3 phase, 3 wire, 415 volt, precision grade, transformer connected, kilowatt hour meter
YL2552 1 1 YL2552 Siemens Schuckert ZD17P3
1 1 Sub-total
June 2013
3 phase, 3 wire, 110 volt, precision grade, transformer connected, kilowatt hour meter
YN2552 1 1 2 YN2552
YN6125 2 10 4 16 YN6125 Siemens Schuckert ZD17P3
YN6126 4 17 21 YN6126 Email-Westinghouse SDMPE
YN6187 2 2 YN6187
YN6525 7 3 38 39 87 YN6525 Email-Westinghouse SDMPE
YN6526 31 41 72 YN6526
YN6528 2 3 5 YN6528
YN6548 2 2 YN6548 Landis & Gyr ZFA110m413er14
YN6586 2 2 4 YN6586 EDMI Mk.6
YN6587 5 5 YN6587
AMP 3.4.01 Metering 2014 to 2025
ASSET MANAGEMENT PLAN 3.4.01 – METERING 2014 to 2025 Issued – June 2014 This document is not to be copied or issued to anyone outside of SA Power Networks without the express permission of MNSP
SA Power Networks 2014 Internal Use Only Page 30 of 42
Stock Total Stock
Item <1960 1960-64 1965-69 1970-74 1975-79 1980-84 1985-89 1990-94 1995-99 2000-04 2005-09 2010-14 Quantity Item Meter Type
YS1244 Landis & Gyr MG1
YS1312 1 1 YS1312 Aron G
YS1324 58 12 3 2 32 36 13 2 7 5 2 2 174 YS1324 EMMCO SD
YS1337 Ferranti FM
YS1351 4 2 1 1 8 YS1351 Siemens Schuckert D12
YS1412 3 66 10 30 24 9 5 5 4 7 163 YS1412 Aron G34
YS1424 138 164 44 127 175 733 965 973 118 159 25 4 3,625 YS1424 Email SD 1967
YS1444 1 1 YS1444 Landis & Gyr MG1
YS1445 5 1 6 YS1445 Landis & Gyr MG21
YS1447 Landis & Gyr ML3FS
YS1524 7 10 20 13 23 23 26 13 2 6 3 146 YS1524 Email SD
YS1615 1 1 2 YS1615
YS1624 1 3 62 19 30 125 158 121 125 71 12 3 730 YS1624 Email SD
YS1625 3 9 516 155 171 253 4,323 9,509 4,756 169 32 19,896 YS1625 Email SD-M
YS1644 1 2 2 1 6 YS1644 Landis & Gyr MG1
YS1647 29 871 217 149 139 142 63 4 3 1,617 YS1647 Landis & Gyr YL5 1965
YS1648 2 1 32 7 3,707 5,635 4,189 1,371 657 95 38 15,734 YS1648 Landis & Gyr ML262xf6 1980
YS1651 2 1 5 3 1 12 YS1651 Siemens Schuckert D12
YS1653 Siemens Schuckert D16
YS1655 1 153 322 142 343 169 318 145 32 34 4 5 1,668 YS1655 Siemens Schuckert D306
YS1694 1 2 139 651 183 214 106 91 4 1,391 YS1694 Iskra T22F & T25F1 1976
YS1695 Iskra E62E2
YS1815 1 1 YS1815
YS1824 9 32 22 23 41 149 207 69 50 6 2 610 YS1824 EMMCO SD 1967(150)
YS1825 1 2 5 34 3 45 YS1825 EMMCO SD-M SDMPE
YS1826 359 324 123 166 186 176 209 160 103 16,237 13,535 1,644 33,222 YS1826 Ampy 5192B Reporter
YS1828 1 1 2 YS1828 Ampy 5192B Reporter
YS1840 19,434 15,684 35,118 YS1840 Ampy Email EM3030
YS1847 3 35 65 20 25 16 26 20 1 1 212 YS1847 Landis & Gyr YL5
YS1894 11 11 YS1894 Iskra
YS1925 1 2 32 12 11 225 1,191 683 99 15 2,271 YS1925 EMMCO SD-M
YS1944 1 1 4 6 YS1944 Landis & Gyr MG1
YS1947 1 1 11 38 23 16 11 20 7 1 129 YS1947 Landis & Gyr YL5 &YL11
YS1948 19 1 360 671 476 332 83 9 3 1,954 YS1948 Landis & Gyr ML240xf6
YS1953 1 1 2 YS1953 Siemens Schuckert D16
YS1955 2 1 7 1 1 1 13 YS1955 Siemens Schuckert DA304
YS2244 1 3 5 2 1 1 1 14 YS2244 Landis & Gyr MG1D
YS2324 1 1 YS2324 EMMCO SD
YS2351 3 6 3 12 YS2351 Siemens Schuckert ZD12
YS2354 4 2 5 2 1 1 2 17 YS2354 Siemens Schuckert ZD22B
YS2424 2 13 14 12 9 15 3 1 3 7 2 1 82 YS2424 EMMCO SD
YS2444 1 1 YS2444 Landis & Gyr GI Series
YS2445 3 2 1 9 5 2 2 2 26 YS2445 Landis & Gyr MG21D
YS2454 1 12 3 12 3 1 3 3 1 39 YS2454 Siemens Schuckert ZD22G
YS2524 2 1 3 4 6 3 1 20 YS2524 EMMCO SD
YS2544 2 2 2 3 2 1 1 1 14 YS2544 Landis & Gyr MG1D
YS2554 1 1 1 1 1 5 YS2554 Siemens Schuckert ZD22L
YS2624 1 50 28 52 57 70 70 51 41 3 5 428 YS2624 Email SD
YS2625 1 5 49 139 118 189 343 1,874 307 28 25 3,078 YS2625 Email SD-MR
YS2644 2 1 3 2 1 2 11 YS2644 Landis & Gyr MG1D
YS2647 2 43 14 12 18 17 11 1 118 YS2647 Landis & Gyr YL5D 1966
YS2648 6 5 8 3 430 482 835 256 527 27 14 2,593 YS2648 Landis & Gyr ML262xdf6
YS2651 1 1 1 3 YS2651 Siemens Schuckert ZD12
YS2653 1 2 3 YS2653 Siemens Schuckert Z16
YS2655 20 52 25 42 191 251 143 50 93 9 2 878 YS2655 Siemens Schuckert ZD306
YS2694 1 1 31 11 25 28 22 18 2 1 140 YS2694 Iskra T22FD 1976
YS2824 1 8 3 9 5 7 5 10 9 3 60 YS2824 EMMCO SD
YS2826 2 8 26 27 33 48 50 48 58 2,055 2,073 108 4,536 YS2826 Ampy 5192F Reporter
YS2840 1,291 6,326 7,617 YS2840 Ampy Email EM3130
YS2844 1 4 3 1 1 2 3 15 YS2844 Landis & Gyr MG1D
YS2847 5 12 27 8 9 8 7 7 83 YS2847 Landis & Gyr ML12D, YL5D
YS2850 85 85 YS2850 Landis & Gyr EM5100
YS2855 3 3 3 1 1 2 1 14 YS2855 Siemens Schuckert ZDA304, 7CA3842
YS2925 1 9 1 8 20 6 175 894 125 27 4 1,270 YS2925 EMMCO SD-M
YS2947 5 10 14 5 6 6 2 1 49 YS2947 Landis & Gyr YL5D
YS2948 1 1 3 0 130 166 252 178 275 7 2 1,015 YS2948 Landis & Gyr ML240xdf6
YS2953 2 1 1 2 1 7 YS2953 Siemens Schuckert ZD16
YS2955 3 6 8 5 1 1 4 1 29 YS2955 Siemens Schuckert ZDA304
YS3354 3 3 YS3354 Siemens Schuckert D22ML
YS4826 37 26 17 80 YS4826 Email Q4
YS4827 107 2,974 13,483 16,564 YS4827 Ampy EM3332, I/E
YS4830 20,235 20,235 YS4830 Landis & Gyr EM5131, I/E
YS6801 1,444 1,444 YS6801 Landis & Gyr E350 U3300, AMI
YS6830 294 294 YS6830 Landis & Gyr EM5131, I/E, LP
Sub-total 592 839 855 1,415 2,587 7,548 10,070 13,170 16,601 26,614 39,877 59,491 179,659 Sub-total
Metal cased meters
AMP 3.4.01 Metering 2014 to 2025
ASSET MANAGEMENT PLAN 3.4.01 – METERING 2014 to 2025 Issued – June 2014 This document is not to be copied or issued to anyone outside of SA Power Networks without the express permission of MNSP
SA Power Networks 2014 Internal Use Only Page 31 of 42
Stock Total Stock
Item <1960 1960-64 1965-69 1970-74 1975-79 1980-84 1985-89 1990-94 1995-99 2000-04 2005-09 2010-14 Quantity Item Meter Type
YT1511 1 3 4 YT1511 Aron EIT34DD
YT1524 5 17 28 32 28 21 8 2 8 4 153 YT1524 EMMCO SD
YT1525 Email SD-M SDMPE
YT1547 1 2 1 3 1 8 YT1547 Landis & Gyr ML2F3
YT1555 1 1 2 YT1555 Siemens Schuckert D306
YT1824 1 10 26 47 10 16 12 3 1 126 YT1824 EMMCO SD
YT1825 1 12 3 9 13 2 11 20 1 72 YT1825 EMMCO SD-M
YT1848 2 3 60 158 116 26 74 60 4 503 YT1848 Landis & Gyr ML240xdf6
YT1896 4 1 1 2 8 YT1896 Iskra T3CT1
YT2511 2 2 YT2511 Aron EIT34DD
YT2525 Email SD-M SDMPE
YT2544 3 7 6 6 3 0 0 1 2 0 0 28 YT2544 Landis & Gyr MG1D
YT2555 1 7 9 5 3 2 2 1 30 YT2555 Siemens Schuckert ZD304, ZD306
YT2825 3 19 10 7 105 301 221 163 9 838 YT2825 EMMCO SD-M & SDMR
YT2848 3 2 38 62 77 131 270 113 9 705 YT2848 Landis & Gyr ML240xdf6
YT2858
Sub-total 8 27 53 94 182 309 335 479 602 366 24 2,479 Sub-total
Metal cased meters
3 phase, 4 wire, 415 volt, precision grade, transformer connected, kilowatt hour meter
YU1553 2 1 3 YU1553 Siemens Schuckert D16P5
YU2543 1 1 YU2543 Landis & Gyr MF32D
YU2547 1 1 YU2547 Landis & Gyr ML20xd
YU2548 Landis & Gyr FL246xdf6
YU2553 5 3 2 1 2 3 2 8 26 YU2553 Siemens Schuckert ZD16P4, ZD16P5
YU6525 91 80 231 214 616 YU6525 Email SDMPE, A1, Q3
YU6526 27 60 342 429 YU6526 Email Q4
YU6527 564 1,787 2,351 YU6527 Ampy Email EM3352
YU6528 20 512 532 YU6528 Landis & Gyr EM5315, I/E (PV program)
YU6529 1,971 1,971 YU6529 Landis & Gyr EM5315 (Std. program)
YU6543 Landis & Gyr MF32HR6
YU6547 Landis & Gyr ML246xhr3f6
YU6548 4 1 5 YU6548 Landis & Gyr ZMA110M402er14
YU6549 8 7 1 16 YU6549 Landis & Gyr ZMB410CTaeCSr14ar14a
YU6586 5 11 18 34 YU6586 EDMI Mark 6
YU9547 2 2 4 YU9547 Landis & Gyr ML20HT
Sub-total 5 6 2 1 2 5 96 133 894 4,845 5,989 Sub-total
3 phase, 4 wire, 110 volt, precision grade, transformer connected, kilowatt hour meter
YW6126 1 9 18 28 YW6126 Email Q4
YW6526 1 1 YW6526 Email Q4
YW6528 5 5 YW6528
Sub-total 2 9 23 34 Sub-total
Totals 11,581 55,848 65,977 77,915 50,452 80,806 118,900 108,778 68,803 89,512 122,911 263,778 1,115,261 Totals
Progressive
Meter Totals 11,581 67,429 133,406 211,321 261,773 342,579 461,479 570,257 639,060 728,572 851,483 1,115,261

AMP 3.4.01 Metering 2014 to 2025
ASSET MANAGEMENT PLAN 3.4.01 – METERING 2014 to 2025 Issued – June 2014 This document is not to be copied or issued to anyone outside of SA Power Networks without the express permission of MNSP
SA Power Networks 2014 Internal Use Only Page 32 of 42
8.4 Appendix 4: Inspection and Testing of direct connected meters
8.4.1 Preventative Maintenance - Inspection & Testing
Inspection and testing of metering installations is required to be carried out in accordance with tables documented in National Electricity Rules, schedule 7.3 or an alternative testing practice approved by AEMO.
The proposed asset management strategy for inspection and testing of SA Power Networks metering installations is summarised in the following table:
Metering Equipment Management Strategy Resource
Meters Direct Connected
Inspection All individually inspected at least once per year. SA Power Networks /
AMRS
Test Meter sample testing in accordance with AS/NZS 1284.13 SA Power Networks
Meters Transformer Connected
Inspection All individually inspected once per year. SA Power Networks
Test Meter sample testing in accordance with AS/NZS 1284.13 SA Power Networks
Current Transformers Low Voltage
Inspection All individually inspected once per year. SA Power Networks
Test Sample testing for type 4, type 5 and type 6 in accordance
with ‘Alternative Testing Minimum Requirements’ for LV
CT metering installations.
Type 1, type 2 and type 3 tested individually at periods in
accordance with NER.
SA Power Networks
Current Transformers High Voltage
SA Power Networks
Inspection All individually inspected once per year.
Test All tested individually at periods in accordance with NER. SA Power Networks
Voltage Transformers
Inspection All individually inspected once per year. SA Power Networks
Test All tested individually at periods in accordance with NER. SA Power Networks
8.4.2 App Testing of Direct Connected Meters
8.4.2.1 Testing Method
To facilitate management of revenue meter assets, the meters are divided into classes identified by the SA Power Network Stock Item Number and the Period of Installation.
Sample quantities of meters are determined in accordance with the sampling criteria for ‘testing by variables’ and then appropriate lists of meters for testing are identified by a process of random selection.
Where test results reveal an average accuracy error greater than +/- 1.5%, the individual meter is replaced immediately by the testing officer as a corrective maintenance action.
Following completion of testing for each meter sample, the accuracy performance is examined for conformance with normal distribution by statistical analysis of the recorded test results.

AMP 3.4.01 Metering 2014 to 2025
ASSET MANAGEMENT PLAN 3.4.01 – METERING 2014 to 2025 Issued – June 2014 This document is not to be copied or issued to anyone outside of SA Power Networks without the express permission of MNSP
SA Power Networks 2014 Internal Use Only Page 33 of 42
If normality of test results for any meter class is not confirmed then the ‘testing by attributes’ technique is adopted. Sample quantities comprising additional meters are required to be tested in accordance with the sampling criteria for ‘testing by attributes’ and then appropriate lists of meters for testing are identified by a process of random selection.
8.4.2.2 Statistical Analysis of Results
Standard AS/NZS 1284.13 provides a process for statistical analysis of test results to identified meter classes that require replacement before the error exceeds an acceptable tolerance of +/- 2% induction +/- 1.5% static.
Analysis of test data for ‘testing by variables’ commences with the calculation of sample mean (x) and standard deviation (s) followed by selection of values for load factors (KL and KF) and error limits (L and U) for each sample.
Inequality calculations of sample values are compared with upper and lower errors for chosen criteria to determine acceptability of the sample test results and consequent pass or failure of the meter class.
8.4.2.3 Second Sample Testing
In the event that tests of the first meter sample do not pass the analysis process, a second sample may be tested, consistent with the same sampling plan, to confirm that the sample selection is representative of the meter class. Meters of the first sample are excluded from the meter class prior to selection of the second sample to ensure that previously sampled meters are not retested.
If the analysis of first meter tests fails for a large quantity of meters in a five year installation period, the class may be divided into smaller classes according to separate years of installation and then the second testing performed with appropriate random samples selected from each smaller class. This process identifies specific years of manufacture for which the performance of a meter type is not acceptable and consequently avoids unnecessary replacement of meter classes that are operating satisfactorily.
If the second sample of meter tests fails analysis, all the meters in the class are included in the meter replacement program during the subsequent year. If the meter test analysis is acceptable, the class is scheduled for sample testing again within the appropriate compliance testing period.
8.4.2.4 Meter Load Point Accuracy
The average accuracy error value may indicate an optimistic state of actual meter errors at the designated load points because of the averaging effect of the error formula. For this reason, it is also prudent to consider the errors at individual load points as well as the average error.
Therefore if the average error of the meter class is acceptable, then individual load point errors should be examined to ensure that the majority of errors are within the prescribed standard limits of +/- 2.0%.
If more than 25% of individual load point errors are not within this tolerance, then all meters in the class are deemed to have unacceptable accuracy and are included in the meter replacement program during the subsequent year.
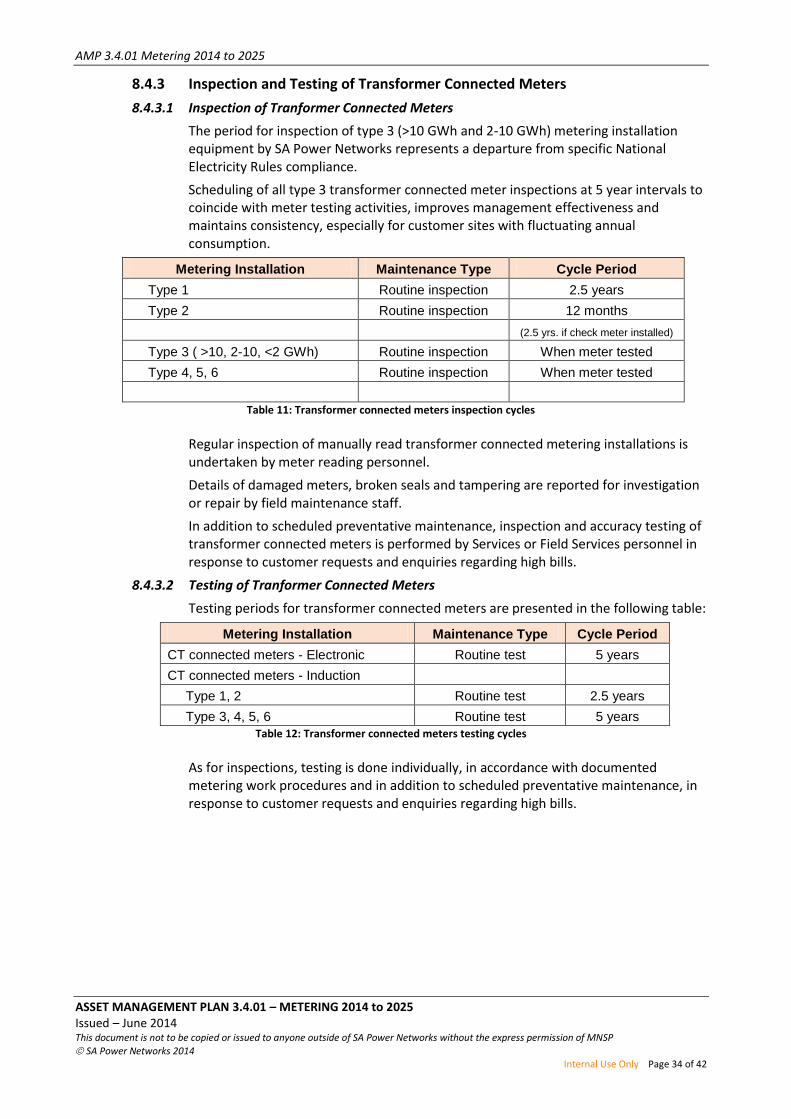
AMP 3.4.01 Metering 2014 to 2025
ASSET MANAGEMENT PLAN 3.4.01 – METERING 2014 to 2025 Issued – June 2014 This document is not to be copied or issued to anyone outside of SA Power Networks without the express permission of MNSP
SA Power Networks 2014 Internal Use Only Page 34 of 42
8.4.3 Inspection and Testing of Transformer Connected Meters
8.4.3.1 Inspection of Tranformer Connected Meters
The period for inspection of type 3 (>10 GWh and 2-10 GWh) metering installation equipment by SA Power Networks represents a departure from specific National Electricity Rules compliance.
Scheduling of all type 3 transformer connected meter inspections at 5 year intervals to coincide with meter testing activities, improves management effectiveness and maintains consistency, especially for customer sites with fluctuating annual consumption.
Metering Installation Maintenance Type Cycle Period
Type 1 Routine inspection 2.5 years
Type 2 Routine inspection 12 months
(2.5 yrs. if check meter installed)
Type 3 ( >10, 2-10, <2 GWh) Routine inspection When meter tested
Type 4, 5, 6 Routine inspection When meter tested
Table 11: Transformer connected meters inspection cycles
Regular inspection of manually read transformer connected metering installations is undertaken by meter reading personnel.
Details of damaged meters, broken seals and tampering are reported for investigation or repair by field maintenance staff.
In addition to scheduled preventative maintenance, inspection and accuracy testing of transformer connected meters is performed by Services or Field Services personnel in response to customer requests and enquiries regarding high bills.
8.4.3.2 Testing of Tranformer Connected Meters
Testing periods for transformer connected meters are presented in the following table:
Metering Installation Maintenance Type Cycle Period
CT connected meters - Electronic Routine test 5 years
CT connected meters - Induction
Type 1, 2 Routine test 2.5 years
Type 3, 4, 5, 6 Routine test 5 years
Table 12: Transformer connected meters testing cycles
As for inspections, testing is done individually, in accordance with documented metering work procedures and in addition to scheduled preventative maintenance, in response to customer requests and enquiries regarding high bills.
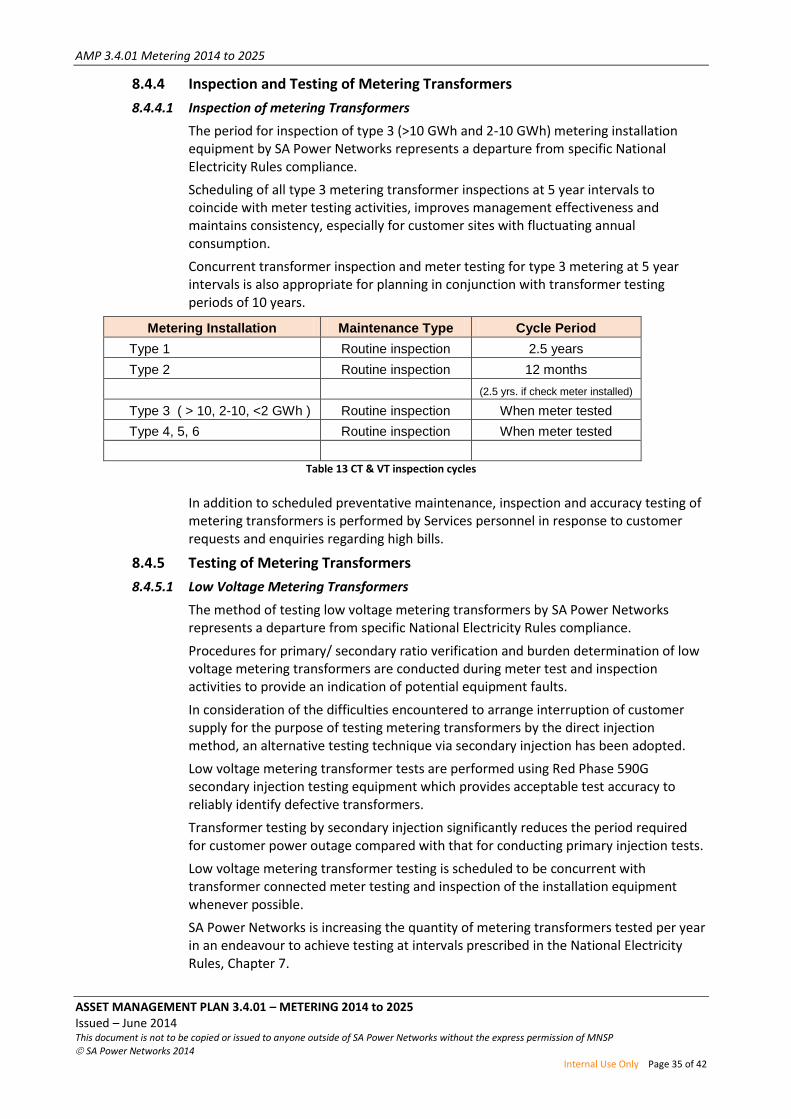
AMP 3.4.01 Metering 2014 to 2025
ASSET MANAGEMENT PLAN 3.4.01 – METERING 2014 to 2025 Issued – June 2014 This document is not to be copied or issued to anyone outside of SA Power Networks without the express permission of MNSP
SA Power Networks 2014 Internal Use Only Page 35 of 42
8.4.4 Inspection and Testing of Metering Transformers
8.4.4.1 Inspection of metering Transformers
The period for inspection of type 3 (>10 GWh and 2-10 GWh) metering installation equipment by SA Power Networks represents a departure from specific National Electricity Rules compliance.
Scheduling of all type 3 metering transformer inspections at 5 year intervals to coincide with meter testing activities, improves management effectiveness and maintains consistency, especially for customer sites with fluctuating annual consumption.
Concurrent transformer inspection and meter testing for type 3 metering at 5 year intervals is also appropriate for planning in conjunction with transformer testing periods of 10 years.
Metering Installation Maintenance Type Cycle Period
Type 1 Routine inspection 2.5 years
Type 2 Routine inspection 12 months
(2.5 yrs. if check meter installed)
Type 3 ( > 10, 2-10, <2 GWh ) Routine inspection When meter tested
Type 4, 5, 6 Routine inspection When meter tested
Table 13 CT & VT inspection cycles
In addition to scheduled preventative maintenance, inspection and accuracy testing of metering transformers is performed by Services personnel in response to customer requests and enquiries regarding high bills.
8.4.5 Testing of Metering Transformers
8.4.5.1 Low Voltage Metering Transformers
The method of testing low voltage metering transformers by SA Power Networks represents a departure from specific National Electricity Rules compliance.
Procedures for primary/ secondary ratio verification and burden determination of low voltage metering transformers are conducted during meter test and inspection activities to provide an indication of potential equipment faults.
In consideration of the difficulties encountered to arrange interruption of customer supply for the purpose of testing metering transformers by the direct injection method, an alternative testing technique via secondary injection has been adopted.
Low voltage metering transformer tests are performed using Red Phase 590G secondary injection testing equipment which provides acceptable test accuracy to reliably identify defective transformers.
Transformer testing by secondary injection significantly reduces the period required for customer power outage compared with that for conducting primary injection tests.
Low voltage metering transformer testing is scheduled to be concurrent with transformer connected meter testing and inspection of the installation equipment whenever possible.
SA Power Networks is increasing the quantity of metering transformers tested per year in an endeavour to achieve testing at intervals prescribed in the National Electricity Rules, Chapter 7.
AMP 3.4.01 Metering 2014 to 2025
ASSET MANAGEMENT PLAN 3.4.01 – METERING 2014 to 2025 Issued – June 2014 This document is not to be copied or issued to anyone outside of SA Power Networks without the express permission of MNSP
SA Power Networks 2014 Internal Use Only Page 36 of 42
8.4.5.2 High Voltage Metering Transformers
High voltage metering transformers located at wholesale and boundary installations are tested by the direct primary injection method in compliance with the National Electricity Rules, Chapter 7.
The method of testing high voltage metering transformers, other than those at wholesale and boundary installations represents a departure from specific National Electricity Rules compliance.
The process for testing the high voltage is performed in the same manner and with the same customer considerations as low voltage.
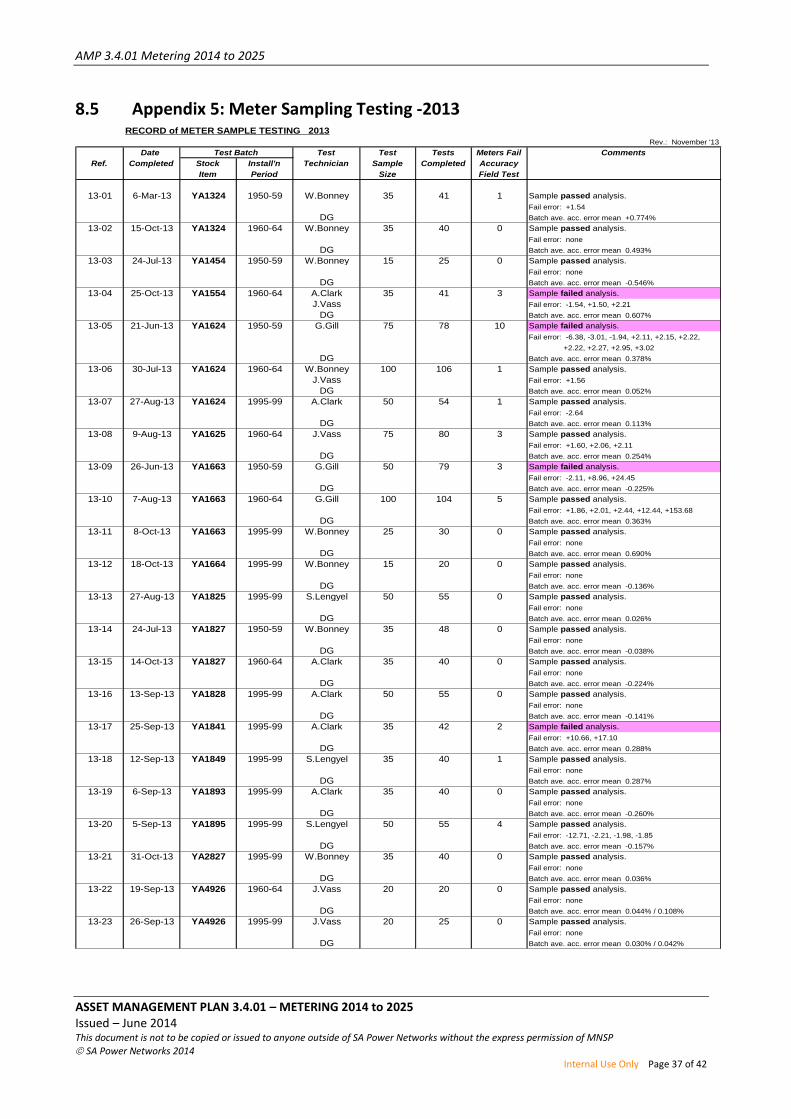
AMP 3.4.01 Metering 2014 to 2025
ASSET MANAGEMENT PLAN 3.4.01 – METERING 2014 to 2025 Issued – June 2014 This document is not to be copied or issued to anyone outside of SA Power Networks without the express permission of MNSP
SA Power Networks 2014 Internal Use Only Page 37 of 42
8.5 Appendix 5: Meter Sampling Testing -2013 RECORD of METER SAMPLE TESTING 2013
Rev.: November '13
Date Test Test Tests Meters Fail Comments
Ref. Completed Stock Install'n Technician Sample Completed Accuracy
Item Period Size Field Test
13-01 6-Mar-13 YA1324 1950-59 W.Bonney 35 41 1 Sample passed analysis.
Fail error: +1.54
DG Batch ave. acc. error mean +0.774%
13-02 15-Oct-13 YA1324 1960-64 W.Bonney 35 40 0 Sample passed analysis.
Fail error: none
DG Batch ave. acc. error mean 0.493%
13-03 24-Jul-13 YA1454 1950-59 W.Bonney 15 25 0 Sample passed analysis.
Fail error: none
DG Batch ave. acc. error mean -0.546%
13-04 25-Oct-13 YA1554 1960-64 A.Clark 35 41 3 Sample failed analysis.
J.Vass Fail error: -1.54, +1.50, +2.21
DG Batch ave. acc. error mean 0.607%
13-05 21-Jun-13 YA1624 1950-59 G.Gill 75 78 10 Sample failed analysis.
Fail error: -6.38, -3.01, -1.94, +2.11, +2.15, +2.22,
+2.22, +2.27, +2.95, +3.02
DG Batch ave. acc. error mean 0.378%
13-06 30-Jul-13 YA1624 1960-64 W.Bonney 100 106 1 Sample passed analysis.
J.Vass Fail error: +1.56
DG Batch ave. acc. error mean 0.052%
13-07 27-Aug-13 YA1624 1995-99 A.Clark 50 54 1 Sample passed analysis.
Fail error: -2.64
DG Batch ave. acc. error mean 0.113%
13-08 9-Aug-13 YA1625 1960-64 J.Vass 75 80 3 Sample passed analysis.
Fail error: +1.60, +2.06, +2.11
DG Batch ave. acc. error mean 0.254%
13-09 26-Jun-13 YA1663 1950-59 G.Gill 50 79 3 Sample failed analysis.
Fail error: -2.11, +8.96, +24.45
DG Batch ave. acc. error mean -0.225%
13-10 7-Aug-13 YA1663 1960-64 G.Gill 100 104 5 Sample passed analysis.
Fail error: +1.86, +2.01, +2.44, +12.44, +153.68
DG Batch ave. acc. error mean 0.363%
13-11 8-Oct-13 YA1663 1995-99 W.Bonney 25 30 0 Sample passed analysis.
Fail error: none
DG Batch ave. acc. error mean 0.690%
13-12 18-Oct-13 YA1664 1995-99 W.Bonney 15 20 0 Sample passed analysis.
Fail error: none
DG Batch ave. acc. error mean -0.136%
13-13 27-Aug-13 YA1825 1995-99 S.Lengyel 50 55 0 Sample passed analysis.
Fail error: none
DG Batch ave. acc. error mean 0.026%
13-14 24-Jul-13 YA1827 1950-59 W.Bonney 35 48 0 Sample passed analysis.
Fail error: none
DG Batch ave. acc. error mean -0.038%
13-15 14-Oct-13 YA1827 1960-64 A.Clark 35 40 0 Sample passed analysis.
Fail error: none
DG Batch ave. acc. error mean -0.224%
13-16 13-Sep-13 YA1828 1995-99 A.Clark 50 55 0 Sample passed analysis.
Fail error: none
DG Batch ave. acc. error mean -0.141%
13-17 25-Sep-13 YA1841 1995-99 A.Clark 35 42 2 Sample failed analysis.
Fail error: +10.66, +17.10
DG Batch ave. acc. error mean 0.288%
13-18 12-Sep-13 YA1849 1995-99 S.Lengyel 35 40 1 Sample passed analysis.
Fail error: none
DG Batch ave. acc. error mean 0.287%
13-19 6-Sep-13 YA1893 1995-99 A.Clark 35 40 0 Sample passed analysis.
Fail error: none
DG Batch ave. acc. error mean -0.260%
13-20 5-Sep-13 YA1895 1995-99 S.Lengyel 50 55 4 Sample passed analysis.
Fail error: -12.71, -2.21, -1.98, -1.85
DG Batch ave. acc. error mean -0.157%
13-21 31-Oct-13 YA2827 1995-99 W.Bonney 35 40 0 Sample passed analysis.
Fail error: none
DG Batch ave. acc. error mean 0.036%
13-22 19-Sep-13 YA4926 1960-64 J.Vass 20 20 0 Sample passed analysis.
Fail error: none
DG Batch ave. acc. error mean 0.044% / 0.108%
13-23 26-Sep-13 YA4926 1995-99 J.Vass 20 25 0 Sample passed analysis.
Fail error: none
DG Batch ave. acc. error mean 0.030% / 0.042%
Test Batch
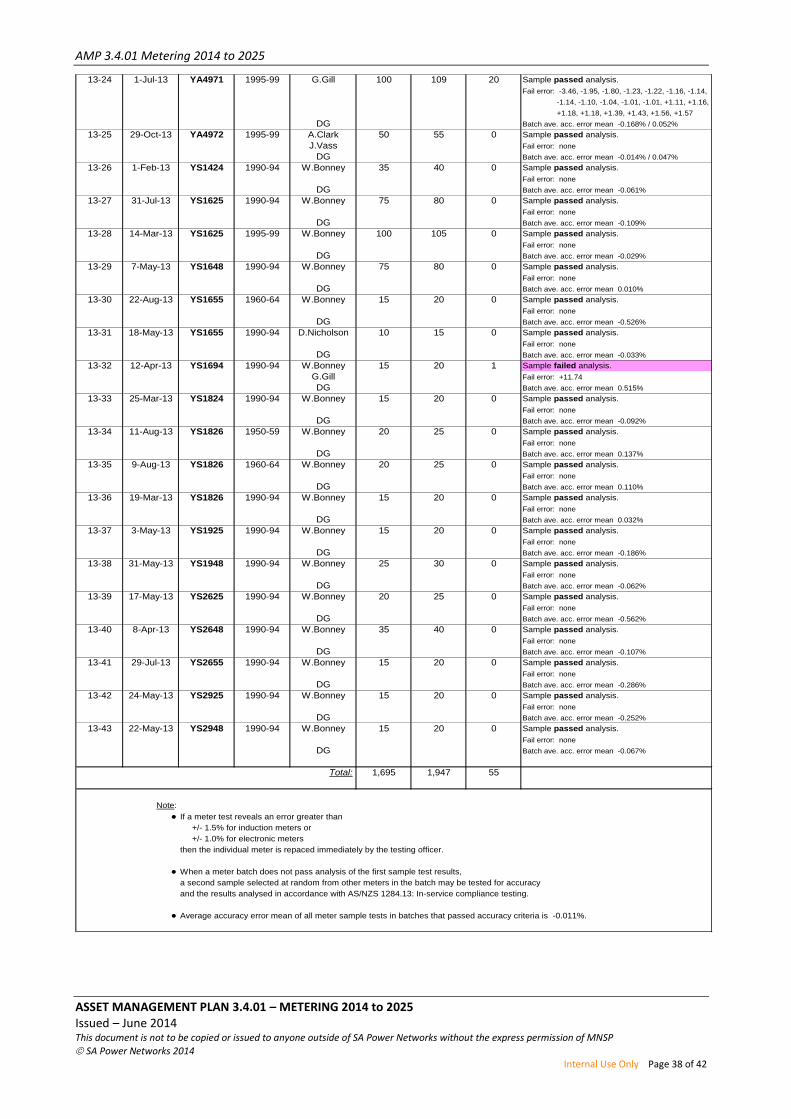
AMP 3.4.01 Metering 2014 to 2025
ASSET MANAGEMENT PLAN 3.4.01 – METERING 2014 to 2025 Issued – June 2014 This document is not to be copied or issued to anyone outside of SA Power Networks without the express permission of MNSP
SA Power Networks 2014 Internal Use Only Page 38 of 42
13-24 1-Jul-13 YA4971 1995-99 G.Gill 100 109 20 Sample passed analysis.
Fail error: -3.46, -1.95, -1.80, -1.23, -1.22, -1.16, -1.14,
-1.14, -1.10, -1.04, -1.01, -1.01, +1.11, +1.16,
+1.18, +1.18, +1.39, +1.43, +1.56, +1.57
DG Batch ave. acc. error mean -0.168% / 0.052%
13-25 29-Oct-13 YA4972 1995-99 A.Clark 50 55 0 Sample passed analysis.
J.Vass Fail error: none
DG Batch ave. acc. error mean -0.014% / 0.047%
13-26 1-Feb-13 YS1424 1990-94 W.Bonney 35 40 0 Sample passed analysis.
Fail error: none
DG Batch ave. acc. error mean -0.061%
13-27 31-Jul-13 YS1625 1990-94 W.Bonney 75 80 0 Sample passed analysis.
Fail error: none
DG Batch ave. acc. error mean -0.109%
13-28 14-Mar-13 YS1625 1995-99 W.Bonney 100 105 0 Sample passed analysis.
Fail error: none
DG Batch ave. acc. error mean -0.029%
13-29 7-May-13 YS1648 1990-94 W.Bonney 75 80 0 Sample passed analysis.
Fail error: none
DG Batch ave. acc. error mean 0.010%
13-30 22-Aug-13 YS1655 1960-64 W.Bonney 15 20 0 Sample passed analysis.
Fail error: none
DG Batch ave. acc. error mean -0.526%
13-31 18-May-13 YS1655 1990-94 D.Nicholson 10 15 0 Sample passed analysis.
Fail error: none
DG Batch ave. acc. error mean -0.033%
13-32 12-Apr-13 YS1694 1990-94 W.Bonney 15 20 1 Sample failed analysis.
G.Gill Fail error: +11.74
DG Batch ave. acc. error mean 0.515%
13-33 25-Mar-13 YS1824 1990-94 W.Bonney 15 20 0 Sample passed analysis.
Fail error: none
DG Batch ave. acc. error mean -0.092%
13-34 11-Aug-13 YS1826 1950-59 W.Bonney 20 25 0 Sample passed analysis.
Fail error: none
DG Batch ave. acc. error mean 0.137%
13-35 9-Aug-13 YS1826 1960-64 W.Bonney 20 25 0 Sample passed analysis.
Fail error: none
DG Batch ave. acc. error mean 0.110%
13-36 19-Mar-13 YS1826 1990-94 W.Bonney 15 20 0 Sample passed analysis.
Fail error: none
DG Batch ave. acc. error mean 0.032%
13-37 3-May-13 YS1925 1990-94 W.Bonney 15 20 0 Sample passed analysis.
Fail error: none
DG Batch ave. acc. error mean -0.186%
13-38 31-May-13 YS1948 1990-94 W.Bonney 25 30 0 Sample passed analysis.
Fail error: none
DG Batch ave. acc. error mean -0.062%
13-39 17-May-13 YS2625 1990-94 W.Bonney 20 25 0 Sample passed analysis.
Fail error: none
DG Batch ave. acc. error mean -0.562%
13-40 8-Apr-13 YS2648 1990-94 W.Bonney 35 40 0 Sample passed analysis.
Fail error: none
DG Batch ave. acc. error mean -0.107%
13-41 29-Jul-13 YS2655 1990-94 W.Bonney 15 20 0 Sample passed analysis.
Fail error: none
DG Batch ave. acc. error mean -0.286%
13-42 24-May-13 YS2925 1990-94 W.Bonney 15 20 0 Sample passed analysis.
Fail error: none
DG Batch ave. acc. error mean -0.252%
13-43 22-May-13 YS2948 1990-94 W.Bonney 15 20 0 Sample passed analysis.
Fail error: none
DG Batch ave. acc. error mean -0.067%
Total: 1,695 1,947 55
Note:
● If a meter test reveals an error greater than
+/- 1.5% for induction meters or
+/- 1.0% for electronic meters
then the individual meter is repaced immediately by the testing officer.
● When a meter batch does not pass analysis of the first sample test results,
a second sample selected at random from other meters in the batch may be tested for accuracy
and the results analysed in accordance with AS/NZS 1284.13: In-service compliance testing.
● Average accuracy error mean of all meter sample tests in batches that passed accuracy criteria is -0.011%.
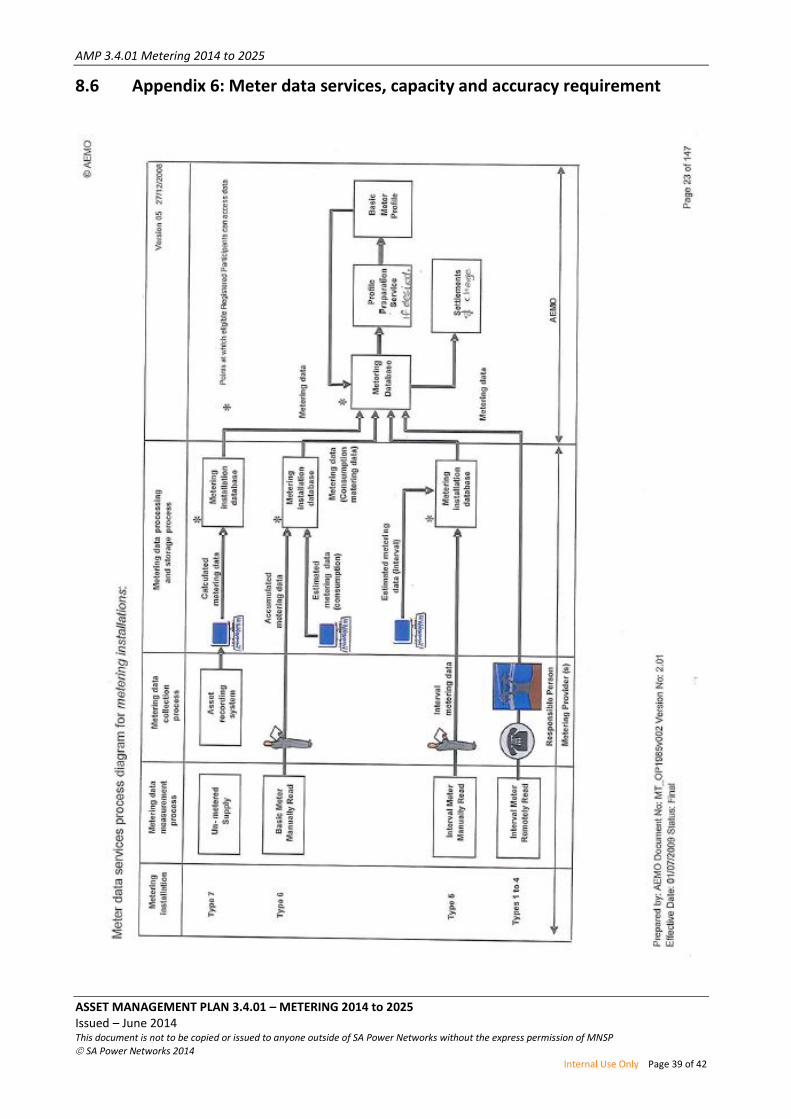
AMP 3.4.01 Metering 2014 to 2025
ASSET MANAGEMENT PLAN 3.4.01 – METERING 2014 to 2025 Issued – June 2014 This document is not to be copied or issued to anyone outside of SA Power Networks without the express permission of MNSP
SA Power Networks 2014 Internal Use Only Page 39 of 42
8.6 Appendix 6: Meter data services, capacity and accuracy requirement

AMP 3.4.01 Metering 2014 to 2025
ASSET MANAGEMENT PLAN 3.4.01 – METERING 2014 to 2025 Issued – June 2014 This document is not to be copied or issued to anyone outside of SA Power Networks without the express permission of MNSP
SA Power Networks 2014 Internal Use Only Page 40 of 42
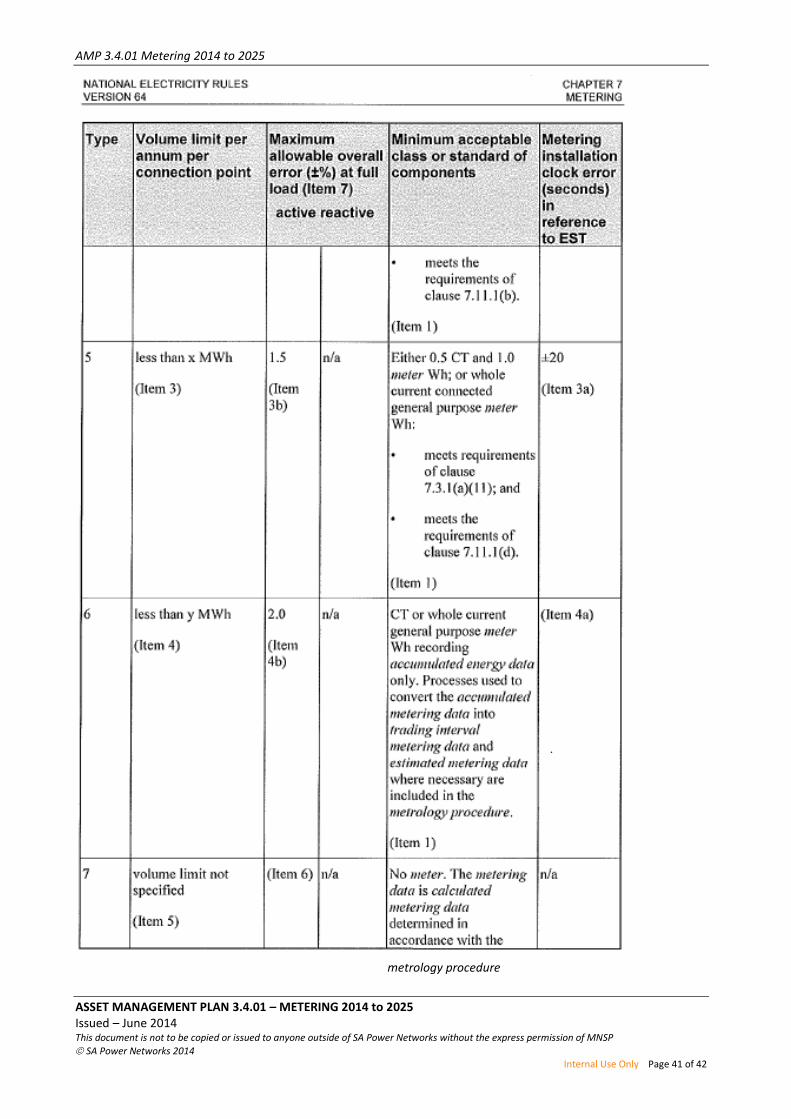
AMP 3.4.01 Metering 2014 to 2025
ASSET MANAGEMENT PLAN 3.4.01 – METERING 2014 to 2025 Issued – June 2014 This document is not to be copied or issued to anyone outside of SA Power Networks without the express permission of MNSP
SA Power Networks 2014 Internal Use Only Page 41 of 42
metrology procedure
AMP 3.4.01 Metering 2014 to 2025
ASSET MANAGEMENT PLAN 3.4.01 – METERING 2014 to 2025 Issued – June 2014 This document is not to be copied or issued to anyone outside of SA Power Networks without the express permission of MNSP
SA Power Networks 2014 Internal Use Only Page 42 of 42
8.7 Appendix 7: Definitions
Term Definition
SWD Sequential Wave Distortion Systems Have the capability of modifying switching arrangements from a central or a remote location.
NECF National Energy Customer Framework.