'Step by Step' Assessment in Music 2016 Catholic Educators ...

EducatorsforGuideAssessment
GED® and GED Testing Service® are registered trademarks of the American Council on Education. Used under license. Copyright © 2016 GED Testing Service LLC. All rights reserved.
June 2016
Mathematical Reasoning

2
Assessment Guide for Educators: Mathematical Reasoning
Table of Contents
Note on the March 2016 Edition ���������������������������������������������3
Chapter 1: Assessment TargetsAssessment Targets for Mathematics ����������������������������������4
Mathematical Practices ���������������������������������������������������������6
Chapter 2: Item Types & LayoutsItem Types in Mathematics ���������������������������������������������������13
Multiple choice (MC) � � � � � � � � � � � � � � � � � � � � � � � � � � � � � � 14
Fill-in-the-blank (FIB) � � � � � � � � � � � � � � � � � � � � � � � � � � � � � � 14
Drop-down � � � � � � � � � � � � � � � � � � � � � � � � � � � � � � � � � � � � � � 14
Hot spot � � � � � � � � � � � � � � � � � � � � � � � � � � � � � � � � � � � � � � � � 14
Drag-and-drop � � � � � � � � � � � � � � � � � � � � � � � � � � � � � � � � � � � 14
Item Layouts in Mathematics �����������������������������������������������16
Multiple Choice Item and a Passage � � � � � � � � � � � � � � � � � � 16
Fill-in-the-blank Item � � � � � � � � � � � � � � � � � � � � � � � � � � � � � � 17
Drop-down Item � � � � � � � � � � � � � � � � � � � � � � � � � � � � � � � � � � 18
Hot Spot Item � � � � � � � � � � � � � � � � � � � � � � � � � � � � � � � � � � � � 19
Drag-and-drop Item � � � � � � � � � � � � � � � � � � � � � � � � � � � � � � � 20
Chapter 3: Performance Level DescriptorsPerformance Level Descriptors �������������������������������������������21
Below Passing Level � � � � � � � � � � � � � � � � � � � � � � � � � � � � � � 22
Pass/High School Equivalency � � � � � � � � � � � � � � � � � � � � � � 26
GED® College Ready � � � � � � � � � � � � � � � � � � � � � � � � � � � � � � 31
GED® College Ready + Credit � � � � � � � � � � � � � � � � � � � � � � � 33
Appendix AThe GED® Test - Mathematical Reasoning: A Content
Comparison Between the 2002 test and the Current test ��������������������������������������������������������������������������������������34
Appendix BReference Codes for Mathematical Reasoning
Assessment Targets ����������������������������������������������������������43
Appendix CMathematical Reasoning Reporting Categories ��������������46
Appendix DGlossary of Key Terms for the Mathematical
Reasoning Test ������������������������������������������������������������������52

3
Assessment Guide for Educators: Mathematical Reasoning
Note on the March 2016 EditionGED Testing Service has published the March 2016 Edition of the Assessment Guide for Educators to include the following:
1. Updated performance level information to reflect the new performance levels: Below Passing, Pass/High School Equivalency, GED® College Ready, and GED® College Ready + Credit
2. Updated information on the Social Studies test to reflect the elimination of the Social Studies Extended Response question
3. Streamlining and simplification of the guide, based on adult educator feedback, to make the guide more user-friendly and to eliminate redundancies

4
Assessment Guide for Educators: Mathematical Reasoning
CHAPTER
1Assessment Targets
Assessment Targets for MathematicsThe GED® test has three main purposes — to provide candidates with
1. A path to a high school credential
2. Evidence of their readiness to enter workforce training programs or postsecondary education
3. Information about their strengths and weaknesses in key academic areas
The philosophy underlying the GED® test is that there is a core of academic skills and content knowledge that must be acquired in order for an adult to be prepared to enter a job, a training program, or an entry-level, credit-bearing postsecondary course. This core of knowledge and skills is reflected in the career- and college-readiness standards now adopted in some form by the majority of states.
Content of the GED® Mathematical Reasoning Test
The GED® Mathematical Reasoning test focuses on two major content areas: quantitative problem solving and algebraic problem solving.
Based on evidence used to inform the development of the career- and college-readiness standards, postsecondary education mathematics instructors value in-depth mastery of fundamental concepts over a shallow understanding of a broad range of topics. National remediation data supports this perspective, suggesting that students with a shallow grasp of a wide range of topics are not as well prepared to succeed in postsecondary education. Those
Chapter 1: Assessment Targets

5
Assessment Guide for Educators: Mathematical Reasoning Chapter 1: Assessment Targets
students are more likely to need remediation in mathematics as compared to those students who have a deeper understanding of more fundamental mathematical topics. As a result, the GED® Mathematical Reasoning test focuses on the fundamentals of mathematics in these two areas, striking a balance of (1) deeper conceptual understanding, (2) procedural skill and fluency, and (3) the ability to apply these fundamentals in realistic situations. A variety of item types are used in the test, including multiple choice, drag-and-drop, hot spot, and fill-in-the-blank.
The career- and college-readiness standards include Standards for Mathematical Practice, which describe the types of practices, or behaviors, in mathematics that are essential to the mastery of mathematical content. These standards form the basis of the GED® Mathematical Practice Standards. These standards assess important mathematical proficiencies, including modeling, constructing and critiquing reasoning, and procedural fluency.
The following specifications guide the GED® Mathematical Reasoning test:
1. Approximately 45 percent of the test focuses on quantitative problem solving and approximately 55 percent emphasizes algebraic problem solving
2. The test includes items that test procedural skill and fluency as well as problem solving
3. Both academic and workforce contexts are used for items that measure problem solving skills
4. Approximately 50 percent of the items are written to a Depth of Knowledge cognitive complexity level of 2
5. Approximately 30 percent of the items are aligned to a Mathematical Practice Standard in addition to a content indicator
6. Candidates are provided with an on-screen scientific calculator (the Texas Instruments TI-30XS Multiview scientific calculator) for use on most of the items on the GED® Mathematical Reasoning test. (For items allow a calculator, test-takers are also allowed the option to provide their own hand-held TI-30XS for use on the operational GED® test).

6
Assessment Guide for Educators: Mathematical Reasoning Chapter 1: Assessment Targets
Mathematical PracticesIn addition to the content-based indicators, the GED® Mathematical Reasoning test also focuses on reasoning skills. These skills are embodied by the GED® Mathematical Practices which are based on two sets of standards:
1. The Standards for Mathematical Practice found in career- and college-readiness standards for mathematics
2. The Process Standards found in the Principles and Standards for School Mathematics, published by the National Council of Teachers of Mathematics
The content indicators and mathematical practices found in the GED® Mathematical Reasoning Assessment Targets, though related, each cover different aspects of item content considerations.
• The content indicators focus on mathematical content, as typically seen in state standards frameworks and, to some extent, the career- and college-readiness standards for mathematics. The indicators describe very specific skills and abilities of which test takers are expected to demonstrate mastery.
• The mathematical practices, in contrast, focus on mathematical reasoning skills and modes of thinking mathematically. Most of these skills are not content-specific, meaning that a mathematical practice indicator could be applied to items that cover a range of content domains (e.g. algebra, data analysis, number sense). The measurement of these skills is very much in keeping with the Standards for Mathematical Practice, which were created in order to “describe varieties of expertise that mathematics educators at all levels should seek to develop in their students”. 1 The mathematical practices provide specifications for assessing real-world problem-solving skills in a mathematical context rather than requiring students only to memorize, recognize and apply a long list of mathematical algorithms.
It is crucial to assess both content and reasoning, but it is unrealistic for each individual test item to address both types of skills. The GED® test does include some items, however, in which
See Appendix B for the reference for each code identified in the “References” column in the Mathematical Reasoning Assessment Targets.
1 Common Core State Standards for Mathematics (2010), p.6

7
Assessment Guide for Educators: Mathematical Reasoning Chapter 1: Assessment Targets
content and practice mesh well together. These items primarily assess the practices, with content serving as the context in which the practices are applied. Items of this type reflect the reasoning and problem-solving skills that are so critical to career and college readiness. Where this type of natural overlap between practice and content is not possible, other items assess the content indicators directly. This ensures that each test form covers the full range of mathematical content.
Common Core State Standards
References2Quantitative Problem Solving Assessment Targets Content
IndicatorsRange of Depth of Knowledge (DOK)3
Q.1 Apply number sense concepts, including ordering rational numbers, absolute value, multiples, factors, and exponents
4.NF.2; 6.NS.6;
6.NS.7
Q.1.a Order fractions and decimals, including on a number line. 1-2
6.NS.4 Q.1.b Apply number properties involving multiples and factors, such as using the least common multiple, greatest common factor, or distributive property to rewrite numeric expressions.
1-2
8.EE.1;
N-RN.2
Q.1.c Apply rules of exponents in numerical expressions with rational exponents to write equivalent expressions with rational exponents.
1-2
6.NS.7; 7.NS.1 Q.1.d Identify absolute value or a rational number as its distance from 0 on the number line and determine the distance between two rational numbers on the number line, including using the absolute value of their difference.
1-2
Q.2 Add, subtract, multiply, divide, and use exponents and roots of rational, fraction and decimal numbers
7.NS.1; 7.NS.2 Q.2.a Perform addition, subtraction, multiplication, and division on rational numbers. 1-2
8.EE.2; N-RN.2 Q.2.b Perform computations and write numerical expressions with squares and square roots of positive, rational numbers.
1-2
8.EE.2; N-RN.2 Q.2.c Perform computations and write numerical expressions with cubes and cube roots of rational numbers.
1-2
7.NS.2 Q.2.d Determine when a numerical expression is undefined. 2
7.NS.3; 7.EE.3;
8.EE.4; N-Q.1
Q.2.e Solve one-step or multi-step arithmetic, real world problems involving the four operations with rational numbers, including those involving scientific notation.
1-2
Q.3 Calculate and use ratios, percents and scale factors
6.RP.3; 7.RP.1; G-MG.2 Q.3.a Compute unit rates. Examples include but are not limited to: unit pricing, constant speed, persons per square mile, BTUs per cubic foot.
1-2
7.G.1 Q.3.b Use scale factors to determine the magnitude of a size change. Convert between actual drawings and scale drawings.
1-2
6.RP.3; 7.RP.1;
7.RP.2; 7.RP.3; N-Q.1
Q.3.c Solve multistep, arithmetic, real-world problems using ratios or proportions including those that require converting units of measure.
2
7.RP.3 Q.3.d Solve two-step, arithmetic, real world problems involving percents. Examples include but are not limited to: simple interest, tax, markups and markdowns, gratuities and commissions, percent increase and decrease.
1-2
Q.4 Calculate dimensions, perimeter, circumference, and area of two-dimensional figures
7.G.6 Q.4.a Compute the area and perimeter of triangles and rectangles. Determine side lengths of triangles and rectangles when given area or perimeter.
1-2

8
Assessment Guide for Educators: Mathematical Reasoning Chapter 1: Assessment Targets
Common Core State Standards
References2Quantitative Problem Solving Assessment Targets Content
IndicatorsRange of Depth of Knowledge (DOK)3
7.G.4 Q.4.b Compute the area and circumference of circles. Determine the radius or diameter when given area or circumference
1-2
6.EE.2; 7.G.6 Q.4.c Compute the perimeter of a polygon. Given a geometric formula, compute the area of a polygon. Determine side lengths of the figure when given the perimeter or area.
1-2
6.EE.2; 7.G.6;
8.G.9
Q.4.d Compute perimeter and area of 2-D composite geometric figures, which could include circles, given geometric formulas as needed.
1-2
8.G.7 Q.4.e Use the Pythagorean theorem to determine unknown side lengths in a right triangle.
1-2
Q.5 Calculate dimensions, surface area, and volume of three-dimensional figures
6.EE.2; 7.G.6;
8.G.9
Q.5.a When given geometric formulas, compute volume and surface area of rectangular prisms. Solve for side lengths or height, when given volume or surface area.
1-2
6.EE.2; 7.G.6;
8.G.9
Q.5.b When given geometric formulas, compute volume and surface area of cylinders. Solve for height, radius, or diameter when given volume or surface area.
1-2
6.EE.2; 7.G.6;
8.G.9
Q.5.c When given geometric formulas, compute volume and surface area of right prisms. Solve for side lengths or height, when given volume or surface area.
1-2
6.EE.2; 7.G.6;
8.G.9
Q.5.d When given geometric formulas, compute volume and surface area of right pyramids and cones. Solve for side lengths, height, radius, or diameter when given volume or surface area.
1-2
6.EE.2; 8.G.9 Q.5.e When given geometric formulas, compute volume and surface area of spheres. Solve for radius or diameter when given the surface area.
1-2
6.EE.2; 8.G.9 Q.5.f Compute surface area and volume of composite 3-D geometric figures, given geometric formulas as needed.
1-2
Q.6 Interpret and create data displays
7.RP.2; 3.MD.3 Q.6.a Represent, display, and interpret categorical data in bar graphs or circle graphs.
1-2
S-ID.1 Q.6.b Represent, display, and interpret data involving one variable plots on the real number line including dot plots, histograms, and box plots.
1-2
8.SP.1 Q.6.c Represent, display, and interpret data involving two variables in tables and the coordinate plane including scatter plots and graphs.
1-2
Q.7 Calculate and use mean, median, mode and weighted average
6.SP.3;
S-MD.2
Q.7.a Calculate the mean, median, mode and range. Calculate a missing data value, given the average and all the missing data values but one, as well as calculating the average, given the frequency counts of all the data values, and calculating a weighted average.
1-2
Q.8 Utilize counting techniques and determine probabilities
S-CP.9 Q.8.a Use counting techniques to solve problems and determine combinations and permutations.
1-2
7.SP.7; 7.SP.8; S-CP.1; S-CP.2
Q.8.b Determine the probability of simple and compound events. 1-2
2 See the Common Core State State Standards for Mathematics at www.corestandards.org for more information on the reference codes listed in the column.
3 The Depth of Knowledge (DOK) levels correspond to Norman Webb’s (University of Wisconsin) Depth of Knowledge model for cognitive complexity

9
Assessment Guide for Educators: Mathematical Reasoning Chapter 1: Assessment Targets
Common Core State Standards
References4Algebraic Problem Solving Assessment Targets Content
IndicatorsRange of Depth of Knowledge (DOK)5
A.1 Write, evaluate, and compute with expressions and polynomials
7.EE.1 A.1.a Add, subtract, factor, multiply and expand linear expressions with rational coefficients.
1-2
6.EE.2 A.1.b Evaluate linear expressions by substituting integers for unknown quantities. 1-2
6.EE.2; 6.EE.6 A.1.c Write linear expressions as part of word-to-symbol translations or to represent common settings.
1-2
A-APR.1 A.1.d Add, subtract, multiply polynomials, including multiplying two binomials, or divide factorable polynomials.
1-2
6.EE.2 A.1.e Evaluate polynomial expressions by substituting integers for unknown quantities.
1-2
A-SSE.2; A-SSE.3;
A-SSE.4
A.1.f Factor polynomial expressions. 1-2
6.EE.2; 6.EE.6 A.1.g Write polynomial expressions as part of word-to-symbol translations or to represent common settings.
1-2
6.EE.3 A.1.h Add, subtract, multiply and divide rational expressions. 1-2
6.EE.2 A.1.i Evaluate rational expressions by substituting integers for unknown quantities. 1-2
6.EE.2; 6.EE.6 A.1.j Write rational expressions as part of word-to-symbol translations or to represent common settings.
1-2
A.2 Write, manipulate, and solve linear equations
7.EE.4; 8.EE.7; A-REI.3 A.2.a Solve one-variable linear equations with rational number coefficients, including equations whose solutions require expanding expressions using the distributive property and collecting like terms or equations with coefficients represented by letters.
1-2
7.EE.4;
A-CED.1; A-CED.2
A.2.b Solve real-world problems involving linear equations. 1-2
6.EE.6;
A-CED.1; A-CED.2
A.2.c Write one-variable and multi-variable linear equations to represent context. 1-2
8.EE.6;
A-REI.6
A.2.d Solve a system of two simultaneous linear equations by graphing, substitution, or linear combination. Solve real-world problems leading to a system of linear equations.
1-2
A.3 Write, manipulate, solve, and graph linear inequalities
A-REI.3 A.3.a Solve linear inequalities in one variable with rational number coefficients. 1-2
6.EE.8; 7.EE.4 A.3.b Identify or graph the solution to a one variable linear inequality on a number line.
1-2
7.EE.4;
A-CED.1; A-CED.2
A.3.c Solve real-world problems involving inequalities. 1-2
6.EE.2;
A-CED.1; A-CED.2
A.3.d Write linear inequalities in one variable to represent context. 1-2
A.4 Write, manipulate, and solve quadratic equations
A-REI.4 A.4.a Solve quadratic equations in one variable with rational coefficients and real solutions, using appropriate methods. (e.g., quadratic formula, completing the square, factoring, inspection)
1-2
A-CED.1 A.4.b Write one-variable quadratic equations to represent context . 1-2

10
Assessment Guide for Educators: Mathematical Reasoning Chapter 1: Assessment Targets
Common Core State Standards
References4Algebraic Problem Solving Assessment Targets Content
IndicatorsRange of Depth of Knowledge (DOK)5
A.5 Connect and interpret graphs and functions
6.NS.6 A.5.a Locate points in the coordinate plane. 1
8.F.4 A.5.b Determine the slope of a line from a graph, equation, or table. 1-2
8.EE.5 A.5.c Interpret unit rate as the slope in a proportional relationship. 2
A-CED.2;
F-IF.7
A.5.d Graph two-variable linear equations. 1-2
8.F.3; 8.F.5; F-IF.5 A.5.e For a function that models a linear or nonlinear relationship between two quantities, interpret key features of graphs and tables in terms of quantities, and sketch graphs showing key features of graphs and tables in terms of quantities, and sketch graphs showing key features given a verbal description of the relationship. Key features include: intercepts; intervals where the function is increasing, decreasing, positive, or negative; relative maximums and minimums; symmetries; end behavior, and periodicity.
1-2
A.6 Connect coordinates, lines, and equations
A-CED.2 A.6.a Write the equation of a line with a given slope through a given point. 1-2
A-CED.2 A.6.b Write the equation of a line passing through two given distinct points. 2
G-GPE.5 A.6.c Use slope to identify parallel and perpendicular lines and to solve geometric problems.
1-2
A.7 Compare, represent, and evaluate functions
8.EE.5 A.7.a Compare two different proportional relationships represented in different ways. Examples include but are not limited to: compare a distance-time graph to a distance-time equation to determine which of two moving objects has a greater speed.
2
8.F.1; F-IF.1 A.7.b Represent or identify a function in a table or graph as having exactly one output (one element in the range) for each input (each element in the domain).
1-2
F-IF.2 A.7.c Evaluate linear and quadratic functions for values in their domain when represented using function notation.
1-2
8.F.2; F-IF.9 A.7.d Compare properties of two linear or quadratic functions each represented in a different way (algebraically, numerically in tables, graphically or by verbal descriptions). Examples include but are not limited to: given a linear function represented by a table of values and
a linear function represented by an algebraic expression, determine which function has the greater rate of change.
2
4 See the Common Core State State Standards for Mathematics at www.corestandards.org for more information on the reference codes listed in the column.”
5 The Depth of Knowledge (DOK) levels correspond to Norman Webb’s (University of Wisconsin) Depth of Knowledge model for cognitive complexity.

11
Assessment Guide for Educators: Mathematical Reasoning Chapter 1: Assessment Targets
References6 Mathematical PracticesRange of Depth of Knowledge (DOK)7
M1, M3, M4, M5
N2, N5, N6, N8
MP.1 Building Solution Pathways and Lines of Reasoning
a. Search for and recognize entry points for solving a problem.
b. Plan a solution pathway or outline a line of reasoning.
c. Select the best solution pathway, according to given criteria.
d. Recognize and identify missing information that is required to solve a problem.
e. Select the appropriate mathematical technique(s) to use in solving a problem or a line of reasoning.
1-2
1-3
2-3
1-2
1-3
M2, M4
N2, N3
MP.2 Abstracting Problems
a. Represent real world problems algebraically.
b. Represent real world problems visually.
c. Recognize the important and salient attributes of a problem.
1-2
1-2
2-3
M3
N7, N9
MP.3 Furthering Lines of Reasoning
a. Build steps of a line of reasoning or solution pathway, based on previous step or givens.
b. Complete the lines of reasoning of others.
c. Improve or correct a flawed line of reasoning.
1-3
1-3
2-3
M2. M4, M6
N1, N2, N9
MP.4 Mathematical Fluency
a. Manipulate and solve arithmetic expressions.
b. Transform and solve algebraic expressions.
c. Display data or algebraic expressions graphically.
1-2
1-2
1-2
M3
N7
MP.5 Evaluating Reasoning and Solution Pathways
a. Recognize flaws in others' reasoning.
b. Recognize and use counterexamples.
c. Identify the information required to evaluate a line of reasoning.
2-3
2-3
2-3
6 The GED Mathematics Practices (MP#) are derived from the Common Core State Standards Math Practices (M#) and National Council of Teachers of Mathematics’ Principles and Standards for School Mathematics (N#).
7 The Depth of Knowledge (DOK) levels correspond to Norman Webb’s (University of Wisconsin) Depth of Knowledge model of cognitive

12
Assessment Guide for Educators: Mathematical Reasoning Chapter 1: Assessment Targets
GED® Test Mathematics Formula Sheet8
GEDtestingservice.com | GED.comGED® and GED Testing Service® are registered trademarks of the American Council on Education. They may not be used or reproduced without the express written permission of ACE or GED Testing Service. The GED® and GED Testing Service® brands are administered by GED Testing Service LLC under license from the American Council on Education.Copyright © 2015 GED Testing Service LLC. All rights reserved.
Mathematics Formulas SheetMathematics Formula Sheet
Area of a: square A = s2
rectangle A = lw parallelogram A = bh triangle A = 1
2 bh
trapezoid A = 12 h(b1 + b2)
circle A = πr2
Perimeter of a: square P = 4s rectangle P = 2l + 2w triangle P = s1 + s2 + s3 Circumference of a circle C = 2πr OR C = πd; π ≈ 3.14
Surface area and volume of a: rectangular prism SA = 2lw + 2lh + 2wh V = lwh
right prism SA = ph + 2B V = Bh
cylinder SA = 2πrh + 2πr2 V = πr2h
pyramid SA = 12 ps + B V = 1
3 Bh
cone SA = πrs + πr2 V = !! πr2h
sphere SA = 4πr2 V = 43 πr3
(p = perimeter of base with area B; π ≈ 3.14) Data mean mean is equal to the total of the values of a data set, divided by
the number of elements in the data set median median is the middle value in an odd number of ordered values
of a data set, or the mean of the two middle values in an even number of ordered values in a data set
Algebra slope of a line m =
y2 – y1x2 – x1
slope-intercept form of the equation of a line
y = mx + b
point-slope form of the equation of a line
y – y1 = m(x – x1)
standard form of a quadratic equation y = ax2 + bx + c
quadratic formula x =
–b ± b2– 4ac2a
Pythagorean theorem a2 + b2 = c2
simple interest I = Prt (I = interest, P = principal, r = rate, t = time)
distance formula d = rt
total cost total cost = (number of units) × (price per unit)
Last updated: 10/29/2014
8 Mathematics test. It will be available to test-takers during the entire Mathematics Test.

13
Assessment Guide for Educators: Mathematical Reasoning
CHAPTER
2Item Types & Layouts
Item Types in MathematicsThe GED® test now uses a variety of item types, made possible through computer-based testing. The computer-based testing platform allows the opportunity to use interactive item types that are not possible on a pencil-and paper test.
Item Types in Mathematical Reasoning
The GED® Mathematical Reasoning test includes:
• Multiple choice items
• Fill-in-the-blank items (Technology-enhanced)
• Drop-down items (Technology-enhanced)
• Hot Spot items (Technology-enhanced)
• Drag-and-drop items (Technology-enhanced)
The items on the Mathematical Reasoning test assess the full depth and breadth of skills outlined in the GED® Mathematics Assessment Targets. Employing a wide variety of item types also allows us to assess the targeted content at a number of Depth of Knowledge (DOK) levels, as they each provide opportunities for test- takers to apply different cognitive strategies to demonstrate proficiency with mathematics content (See Depth of Knowledge Summary in the Introduction to the Assessment Guide for Educators for more information). Each item type on the Mathematical Reasoning test is presented either as a stand-alone item or as part of an item scenario in which two or three items pertain to a single stimulus. Stimulus materials may include brief text, graphs, tables, or other graphic representations of numeric, geometric, statistical, or algebraic concepts.
Technology-Enhanced Items
In Technology-enhanced items, test-takers interact with the content in a more authentic way than is possible in a standard multiple-choice test question. Test-takers may be asked to select blocks of text, select multiple answers from a list, drag an answer to a location, or manipulate symbols or other graphics.
Chapter 2: Item Types & Layouts

14
Assessment Guide for Educators: Mathematical Reasoning Chapter 2: Item Types & Layouts
Multiple choice (MC)
Multiple choice (MC) items consist of a question accompanied by several possible answer choices. This item type is used to assess every indicator listed in the GED® Mathematics Assessment Targets. Multiple choice items continue to be a reliable method for measuring skills and knowledge at a range of cognitive levels in a standardized manner. Each MC item on the GED® test has four answer options.
Fill-in-the-blank (FIB)
Fill-in-the-blank (FIB) items consist of a statement or problem with an empty field for test-taker responses. This allows test-takers the to type in the numerical answer to a problem or to enter an equation using the keyboard and the character selector.
Drop-down
Drop-down items are items with multiple response options embedded directly within a text. Items with drop-down menu functionality will be used to give test-takers opportunities to choose the correct math vocabulary or numerical value to complete statements. An advantage to this item type is that the test-taker is able to see the complete statements on screen in an authentic way. Drop-down items are frequently also used to make comparisons between two quantities.
Hot spot
Hot spot items consist of a graphic image with virtual “sensors” placed strategically within the image. This item type can be used to measure skills with regard to plotting points on coordinate grids, on number lines, or on scatter plots. Test-takers can also select numerical or algebraic expressions that identify parallel equations, parts of scale models, or multiple representations with the same numeric value. Hot spot items create a much more authentic experience for test-takers because they provide opportunities to demonstrate their proficiency with a variety of quantitative, algebraic, and geometric skills.
Drag-and-drop
Drag-and-drop items are interactive tasks that require test-takers to move small images, words, or numerical expressions (sometimes referred to as the “draggers”) to designated places on the computer screen (called “drop targets”). These types

15
Assessment Guide for Educators: Mathematical Reasoning Chapter 2: Item Types & Layouts
of items can be used to create expressions, equations, and inequalities by dragging numbers, operators, and variables into boxes that form an equation. Drag-and-drop items can also be used to demonstrate classifying and sorting skills as they provide an opportunity for test-takers to organize data based on a set of characteristics. The test-taker can also order steps in a process or solution or match items from two sets.

16
Assessment Guide for Educators: Mathematical Reasoning Chapter 2: Item Types & Layouts
Item Layouts in MathematicsItem layouts are shown to highlight the structure of each item type described in the previous section. The content in the item layouts shown in this guide is not representative of the GED® test and is merely included to illustrate test item functionality rather than content.
Multiple Choice Item and a Passage
This layout will appear primarily on the RLA test. However, item scenarios in which two or three items pertain to a single, brief text or graphic stimulus will appear in a similar format on the Mathematical Reasoning test.

17
Assessment Guide for Educators: Mathematical Reasoning Chapter 2: Item Types & Layouts
Fill-in-the-blank Item
This item type (shown below using Social Studies content) requires test-takers to fill in a single blank.

18
Assessment Guide for Educators: Mathematical Reasoning Chapter 2: Item Types & Layouts
Drop-down Item
In this item type, test-takers will choose their answers from a drop-down menu that will appear embedded within text.

19
Assessment Guide for Educators: Mathematical Reasoning Chapter 2: Item Types & Layouts
Hot Spot Item
This item layout shows a brief stimulus placed in a split screen with a number line graphic. The graphic contains one or more “sensor” regions, or hot spots, on which the test-takers can click in order to provide responses to the question. In this example, the green circles represent the test-taker’s answer to this item.

20
Assessment Guide for Educators: Mathematical Reasoning Chapter 2: Item Types & Layouts
Drag-and-drop Item
This example using math content shows six elements of an equation (boxed numbers and boxed letter x), three of which would be selected and dragged to one of the drop targets in the equation boxes next to “y =.”. In items that use this layout, the appearance and number of the drag tokens and the drop targets may vary, but all drag-and-drop items allow test-takers to interact with the material as they move objects around on the screen.

21
Assessment Guide for Educators: Mathematical Reasoning
CHAPTER
3Performance Level Descriptors
Performance Level DescriptorsPerformance Level Descriptors explain the skills a test-taker generally demonstrates in order to score into one of three performance levels on the GED® test and the skills they need to develop to advance their score.
The four performance levels for the GED® test are Below Passing, Pass/High School Equivalency, GED® College Ready, and GED® College Ready + Credit.
Chapter 3: Performance Level Descriptors

22
Assessment Guide for Educators: Mathematical Reasoning Chapter 3: Performance Level Descriptors
Below Passing Level
Test-takers who score at this level typically have a limited but developing proficiency in demonstrating skills in the following categories: number sense and computation, geometric measurement, data analysis and statistics, and algebraic expressions and functions.
Test-takers at the Below Passing level typically demonstrate the following skills:
Quantitative Problem Solving with Rational Numbers
• Apply number properties involving multiples and factors at a limited and inconsistent level
• Solve real-world problems using rational numbers at a limited and inconsistent level
• Compute unit rates at a limited and inconsistent level
Quantitative Problem Solving in Measurement
• Compute the area and perimeter of triangles and rectangles at a limited and inconsistent level
• Determine side lengths of triangles and rectangles when given area or perimeter at a limited and inconsistent level
• Represent, display, and interpret categorical data in circle and bar graphs
• Represent, display, and interpret categorical data in tables and scatter plots
Algebraic Problem Solving with Expressions and Equations
• Evaluate linear expressions
• Write linear expressions to represent context at a limited and inconsistent level
• Evaluate polynomial expressions at a limited and inconsistent level
• Write rational expressions to represent context at a limited and inconsistent level
• Solve real-world problems involving linear equations at a limited and inconsistent level

23
Assessment Guide for Educators: Mathematical Reasoning Chapter 3: Performance Level Descriptors
• Solve algebraic and real-world problems involving systems of equations
Algebraic Problem Solving with Graphs and Functions
• Locate and plot points in the coordinate plane
• Interpret unit rate as the slope in a proportional relationship at a limited and inconsistent level
• For a linear or nonlinear relationship, sketch graphs and interpret key features of graphs and tables in terms of quantities
• Compare two different proportional relationships, each represented in different ways, at a limited and inconsistent level
• Represent or identify a function in a table or graph as having exactly one output for each input at a limited and inconsistent level
• Evaluate linear and quadratic functions at a limited and inconsistent level

24
Assessment Guide for Educators: Mathematical Reasoning Chapter 3: Performance Level Descriptors
In order to progress to the Pass/High School Equivalency level, test-takers need to:
1. continue to strengthen the skills listed in the Below Pass level, including:
– Apply number properties involving multiples and factors
– Solve real-world problems using rational numbers
– Compute unit rates
– Compute the area and perimeter of triangles and rectangles
– Determine side lengths of triangles and rectangles when given area or perimeter
– Write linear expressions to represent context
– Evaluate polynomial expressions
– Write rational expressions to represent context
– Solve real-world problems involving linear equations
– Interpret unit rate as the slope in a proportional relationship
– Compare two different proportional relationships, each represented in different ways
– Represent or identify a function in a table or graph as having exactly one output for each input
– Evaluate linear and quadratic functions
and
2. develop the following additional skills:
– Order fractions and decimals, including on a number line
– Simplify numerical expressions with rational exponents
– Identify absolute value of a rational number as its distance from 0 on the number line and determine the distance between two rational numbers on the number line
– Perform computations with rational numbers
– Compute numerical expressions with squares and square roots of positive, rational numbers
– Compute numerical expressions with cubes and cube roots of positive, rational numbers
– Determine when a numerical expression is undefined
– Use scale factors to determine the magnitude of a size change, and convert between actual drawings and scale drawings
– Solve arithmetic and real-world problems involving ratios and proportions a satisfactory level
– Solve multi-step arithmetic and real-world problems involving percents
– Compute the area and circumference of circles
– Determine the radius and diameter of circles when given area or circumference
– Compute the area and perimeter of polygons
– Determine side lengths of polygons when given area or perimeter
– Compute the area and perimeter of composite figures
– Use the Pythagorean theorem to determine unknown side lengths in a right triangle
– Compute volume and surface area of rectangular prisms

25
Assessment Guide for Educators: Mathematical Reasoning Chapter 3: Performance Level Descriptors
– Determine side lengths and height of rectangular prisms when given volume or surface area
– Compute volume and surface area of cylinders
– Determine radius, diameter, and height of cylinders, when given volume or surface area
– Compute volume and surface area of right prisms
– Determine side lengths and height of right prisms when given volume or surface area
– Determine side lengths and height of right pyramids and cones when given volume or surface area
– Compute volume and surface area of spheres
– Determine radius and diameter of spheres when given volume or surface area
– Compute volume and surface area of composite figures
– Represent, display, and interpret categorical data in dot plots, histograms, and box plots
– Calculate the median, mode, and weighted average, and calculate a missing data value, given the average and all the missing data values but one
– Use counting techniques to solve problems and determine combinations and permutations
– Compute with linear expressions
– Write linear expressions to represent context
– Evaluate linear expressions
– Compute with polynomials
– Factor polynomial expressions
– Write polynomial expressions to represent context
– Evaluate rational expressions
– Solve linear equations in one variable
– Write linear equations to represent context
– Solve linear inequalities in one variable
– Identify or graph the solution to a one variable linear inequality on a number line
– Solve real-world problems involving inequalities
– Write linear equations to represent context
– Solve quadratic equations in one variable
– Write quadratic equations to represent context
– Determine the slope of a line from a graph, equation, or table
– Graph two-variable linear equations
– Write the equation of a line with a given slope through a given point
– Write the equation of a line passing through two given distinct points
– Use slope to identify parallel and perpendicular lines and to solve geometric problems
– Compare two different linear or quadratic functions, each represented in different ways
2. develop the following additional skills (continued):

26
Assessment Guide for Educators: Mathematical Reasoning Chapter 3: Performance Level Descriptors
Pass/High School Equivalency
Test-takers who score at this level typically have a satisfactory proficiency in demonstrating skills in the following categories: number sense and computation, geometric measurement, data analysis and statistics, and algebraic expressions and functions.
Test-takers are generally able to demonstrate knowledge of and ability with the skills identified in the Below Passing level at a satisfactory level as well as the following skills:
Quantitative Problem Solving with Rational Numbers
• Order fractions and decimals, including on a number line
• Apply number properties involving multiples and factors at a satisfactory level
• Simplify numerical expressions with rational exponents at a satisfactory level
• Identify absolute value of a rational number as its distance from 0 on the number line and determine the distance between two rational numbers on the number line, at a satisfactory level
• Perform computations with rational numbers
• Compute numerical expressions with squares and square roots of positive, rational numbers at a satisfactory level
• Compute numerical expressions with cubes and cube roots of positive, rational numbers
• Determine when a numerical expression is undefined at a satisfactory level
• Solve real-world problems using rational numbers at a satisfactory level
• Compute unit rates at a satisfactory level
• Use scale factors to determine the magnitude of a size change, and convert between actual drawings and scale drawings
• Solve arithmetic and real-world problems involving ratios and proportions a satisfactory level
• Solve multi-step arithmetic and real-world problems involving percents

27
Assessment Guide for Educators: Mathematical Reasoning Chapter 3: Performance Level Descriptors
Quantitative Problem Solving in Measurement
• Compute the area and perimeter of triangles and rectangles at a satisfactory level
• Determine side lengths of triangles and rectangles when given area or perimeter at a satisfactory level
• Compute the area and circumference of circles
• Determine the radius and diameter of circles when given area or circumference
• Compute the area and perimeter of polygons
• Determine side lengths of polygons when given area or perimeter
• Compute the area and perimeter of composite figures
• Use the Pythagorean theorem to determine unknown side lengths in a right triangle at a satisfactory level
• Compute volume and surface area of rectangular prisms
• Determine side lengths and height of rectangular prisms when given volume or surface area
• Compute volume and surface area of cylinders at a satisfactory level
• Determine radius, diameter, and height of cylinders, when given volume or surface area, at a satisfactory level
• Compute volume and surface area of right prisms
• Determine side lengths and height of right prisms when given volume or surface area
• Compute volume and surface area of right pyramids and cones
• Determine side lengths, radius, diameter, and height of right pyramids and cones when given volume or surface area
• Compute volume and surface area of spheres
• Determine radius and diameter of spheres when given volume or surface area
• Compute volume and surface area of composite figures at a satisfactory level

28
Assessment Guide for Educators: Mathematical Reasoning Chapter 3: Performance Level Descriptors
• Represent, display, and interpret categorical data in dot plots, histograms, and box plots
• Calculate the median, mode, and weighted average, and calculate a missing data value, given the average and all the missing data values but one
• Use counting techniques to solve problems and determine combinations and permutations at a satisfactory level
Algebraic Problem Solving with Expressions and Equations
• Compute with linear expressions
• Write linear expressions to represent context at a satisfactory level
• Compute with polynomials at a satisfactory level
• Evaluate polynomial expressions at a satisfactory level
• Factor polynomial expressions at a satisfactory level
• Write polynomial expressions to represent context
• Evaluate rational expressions
• Write rational expressions to represent context at a satisfactory level
• Solve linear equations in one variable
• Solve real-world problems involving linear equations at a satisfactory level
• Write linear equations to represent context
• Solve linear inequalities in one variable at a satisfactory level
• Identify or graph the solution to a one variable linear inequality on a number line
• Solve real-world problems involving inequalities at a satisfactory level
• Write linear equations to represent context at a satisfactory level
• Solve quadratic equations in one variable at a satisfactory level
• Write quadratic equations to represent context

29
Assessment Guide for Educators: Mathematical Reasoning Chapter 3: Performance Level Descriptors
Algebraic Problem Solving with Graphs and Functions
• Determine the slope of a line from a graph, equation, or table at a satisfactory level
• Interpret unit rate as the slope in a proportional relationship at a satisfactory level
• Graph two-variable linear equations at a satisfactory level
• Write the equation of a line with a given slope through a given point at a satisfactory level
• Write the equation of a line passing through two given distinct points
• Use slope to identify parallel and perpendicular lines and to solve geometric problems at a satisfactory level
• Compare two different proportional relationships, each represented in different ways, at a satisfactory level
• Represent or identify a function in a table or graph as having exactly one output for each input at a satisfactory level
• Evaluate linear and quadratic functions at a satisfactory level
• Compare two different linear or quadratic functions, each represented in different ways, at a satisfactory level
30
Assessment Guide for Educators: Mathematical Reasoning Chapter 3: Performance Level Descriptors
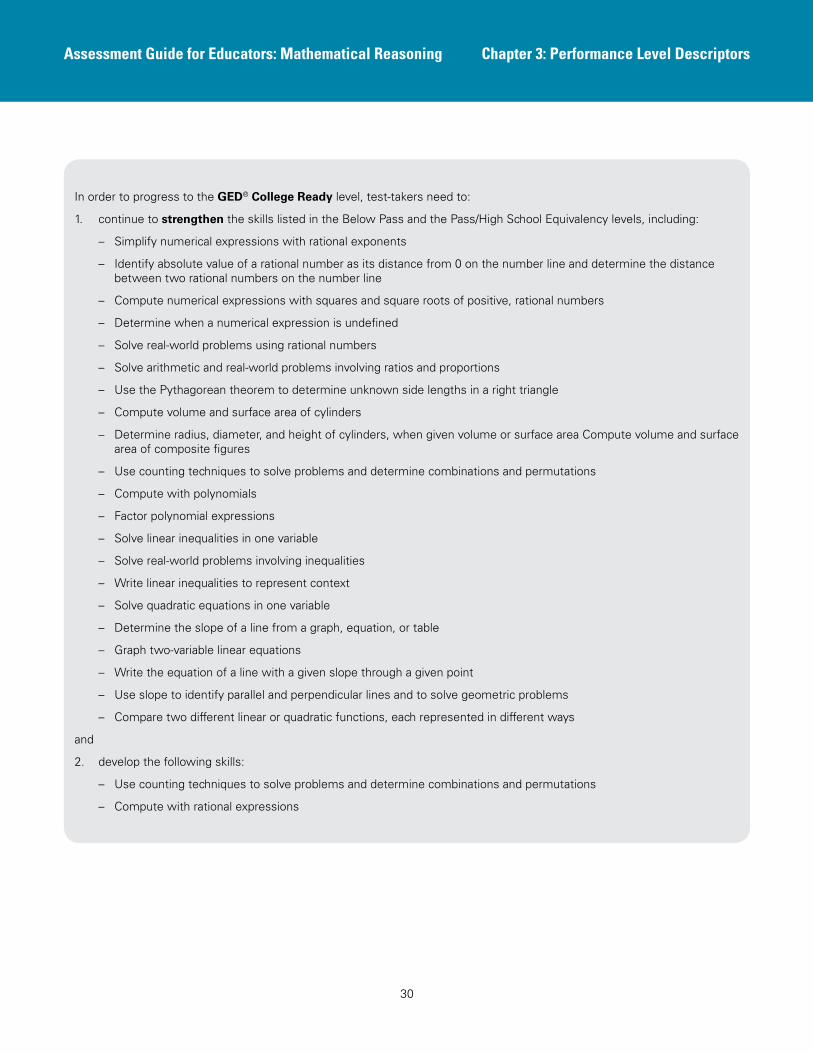
In order to progress to the GED® College Ready level, test-takers need to:
1. continue to strengthen the skills listed in the Below Pass and the Pass/High School Equivalency levels, including:
– Simplify numerical expressions with rational exponents
– Identify absolute value of a rational number as its distance from 0 on the number line and determine the distance between two rational numbers on the number line
– Compute numerical expressions with squares and square roots of positive, rational numbers
– Determine when a numerical expression is undefined
– Solve real-world problems using rational numbers
– Solve arithmetic and real-world problems involving ratios and proportions
– Use the Pythagorean theorem to determine unknown side lengths in a right triangle
– Compute volume and surface area of cylinders
– Determine radius, diameter, and height of cylinders, when given volume or surface area Compute volume and surface area of composite figures
– Use counting techniques to solve problems and determine combinations and permutations
– Compute with polynomials
– Factor polynomial expressions
– Solve linear inequalities in one variable
– Solve real-world problems involving inequalities
– Write linear inequalities to represent context
– Solve quadratic equations in one variable
– Determine the slope of a line from a graph, equation, or table
– Graph two-variable linear equations
– Write the equation of a line with a given slope through a given point
– Use slope to identify parallel and perpendicular lines and to solve geometric problems
– Compare two different linear or quadratic functions, each represented in different ways
and
2. develop the following skills:
– Use counting techniques to solve problems and determine combinations and permutations
– Compute with rational expressions

31
Assessment Guide for Educators: Mathematical Reasoning Chapter 3: Performance Level Descriptors
GED® College Ready
Test-takers who score at this level typically have a strong proficiency in demonstrating skills in the following categories: number sense and computation, geometric measurement, data analysis and statistics, and algebraic expressions and functions.
Test-takers are generally able to demonstrate knowledge of and ability with the skills identified in the Below Passing level and the Pass/High School Equivalency level, as well as the following skills:
Quantitative Problem Solving with Rational Numbers
• Simplify numerical expressions with rational exponents at a strong level
• Identify absolute value of a rational number as its distance from 0 on the number line and determine the distance between two rational numbers on the number line, at a strong level
• Compute numerical expressions with squares and square roots of positive, rational numbers at a strong level
• Determine when a numerical expression is undefined at a strong level
• Solve arithmetic and real-world problems involving ratios and proportions at a strong level
Quantitative Problem Solving in Measurement
• Use the Pythagorean theorem to determine unknown side lengths in a right triangle at a strong level
• Compute volume and surface area of cylinders at a strong level
• Determine radius, diameter, and height of cylinders, when given volume or surface area, at a strong level
• Compute volume and surface area of composite figures at a strong level
• Use counting techniques to solve problems and determine combinations and permutations at a strong level
• Determine the probability of simple and compound events at a strong level

32
Assessment Guide for Educators: Mathematical Reasoning Chapter 3: Performance Level Descriptors
Algebraic Problem Solving with Expressions and Equations
• Compute with polynomials at a strong level
• Factor polynomial expressions at a strong level
• Compute with rational expressions
• Solve linear inequalities in one variable at a strong level
• Solve real-world problems involving inequalities at a strong level
• Write linear inequalities to represent context at a strong level
• Solve quadratic equations in one variable at a strong level
Algebraic Problem Solving with Graphs and Functions
• Determine the slope of a line from a graph, equation, or table at a strong level
• Graph two-variable linear equations at a strong level
• Write the equation of a line with a given slope through a given point at a strong level
• Use slope to identify parallel and perpendicular lines and to solve geometric problems at a strong level
• Compare two different linear or quadratic functions, each represented in different ways, at a strong level
In order to progress to GED® College Ready + Credit level, test-takers need to continue to strengthen the skills listed in the GED® College Ready level, including:
– Compute volume and surface area of composite figures
– Use counting techniques to solve problems and determine combinations and permutations
– Write linear inequalities to represent context
– Solve quadratic equations in one variable
– Graph two-variable linear equations
– Use slope to identify parallel and perpendicular lines and to solve geometric problems
– Compare two different linear or quadratic functions, each represented in different ways

33
Assessment Guide for Educators: Mathematical Reasoning Chapter 3: Performance Level Descriptors
GED® College Ready + Credit
Test-takers who score at this level typically have an outstanding proficiency in demonstrating skills in the following categories: number sense and computation, geometric measurement, data analysis and statistics, and algebraic expressions and functions.
Test-takers are generally able to demonstrate knowledge of and ability with the skills identified in the previous levels as well as the following skills:
Quantitative Problem Solving in Measurement
• Compute volume and surface area of composite figures at an outstanding level
• Use counting techniques to solve problems and determine combinations and permutations at an outstanding level
• Determine the probability of simple and compound events at an outstanding level
Algebraic Problem Solving with Expressions and Equations
• Write linear inequalities to represent context at an outstanding level
• Solve quadratic equations in one variable at an outstanding level
Algebraic Problem Solving with Graphs and Functions
• Graph two-variable linear equations at an outstanding level
• Use slope to identify parallel and perpendicular lines and to solve geometric problems at an outstanding level
• Compare two different linear or quadratic functions, each represented in different ways, at an outstanding level

34
Assessment Guide for Educators: Mathematical Reasoning
AAppendix
The GED® Test - Mathematical Reasoning: A Content Comparison Between the 2002 test and the Current test Note: Codes in the Current Test column refer to the Current GED® Assessment Targets and Indicators as outlined in Chapter 1. The codes may not appear in numerical order, as the goal of the table below is to show areas of correspondence between the 2002 content and the current test content.
Appendix A

35
Assessment Guide for Educators: Mathematical Reasoning Appendix A
Mathematical Reasoning: Content Specifications2002 Current Test
Represent and use numbers in a variety of equivalent forms (integer, fraction, decimal, percent, exponential, and scientific) in real-world and mathematical problem situations.
Q.1.a Order fractions and decimals, including on a number line.
Q.1.c Apply rules of exponents in numerical expressions with rational exponents to write equivalent expressions with rational exponents.
Q.3.d Solve two-step, arithmetic, real world problems involving percents. Examples include but are not limited to: simple interest, tax, markups and markdowns, gratuities and commissions, percent increase and decrease.
Represent, analyze, and apply whole numbers, decimals, fractions, percents, ratios, proportions, exponents, roots, and scientific notation in a wide variety of situations.
Q.1.a Order fractions and decimals, including on a number line.
Q.1.b Apply number properties involving multiples and factors, such as using the least common multiple, greatest common factor, or distributive property to rewrite numeric expressions.
Q.2.a Perform addition, subtraction, multiplication, and division on rational numbers.
Q.2.b Perform computations and write numerical expressions with squares and square roots of positive, rational numbers.
Q.2.c Perform computations and write numerical expressions with cubes and cube roots of positive, rational numbers.
Q.2.e Solve one-step or multi-step arithmetic, real world problems involving the four operations with rational numbers, including those involving scientific notation.
Q.3.c Solve multistep, arithmetic, real-world problems using ratios or proportions including those that require converting units of measure.
Q.3.d Solve two-step, arithmetic, real world problems involving percents. Examples include but are not limited to: simple interest, tax, markups and markdowns, gratuities and commissions, percent increase and decrease.
Recognize equivalencies and order relations for whole numbers, fractions, decimals, integers, and rational numbers.
Q.1.a Order fractions and decimals, including on a number line.
Select the appropriate operations to solve problems
(for example, When should I divide?).
[Not assessed on the current test]
Relate basic arithmetic operations to one another. [Not assessed on the current test]
Calculate mentally, with pencil and paper, and with a scientific calculator using whole numbers, fractions, decimals, and integers.
Q.2.a Perform addition, subtraction, multiplication, and division on rational numbers.
Use estimation to solve problems and assess the reasonableness of an answer.
[Not assessed on the current test]
Model and solve problems using the concepts of perpendicularity, parallelism, congruence, and similarity of geometric figures.
[Not assessed on the Current test]
Use spatial visualization skills to describe and analyze geometric figures and translations/rotations/dilations of geometric figures.
[Not assessed on the Current test]
Use the Pythagorean theorem to model and solve problems. Q.4.e Use the Pythagorean theorem to determine unknown side lengths in a right triangle.

36
Assessment Guide for Educators: Mathematical Reasoning Appendix A
Mathematical Reasoning: Content Specifications2002 Current Test
Find, use, and interpret the slope of a line, the y-intercept of a line, and the intersection of two lines.
A.5.b Determine the slope of a line from a graph, equation, or table.
A.5.c Interpret unit rate as the slope in a proportional relationship. A.5.d Graph two-variable linear equations.
A.5.e For a function that models a linear or nonlinear relationship between two quantities, interpret key features of graphs and tables in terms of quantities, and sketch graphs showing key features of graphs and tables in terms of quantities, and sketch graphs showing key features given a verbal description of the relationship. Key features include: intercepts; intervals where the function is increasing, decreasing, positive, or negative; relative maximums and minimums; symmetries; end behavior, and periodicity.
Find, use, and interpret the slope of a line, the y-intercept of a line, and the intersection of two lines (continued from previous page).
A.6.a Write the equation of a line with a given slope through a given point.
A.6.c Use slope to identify parallel and perpendicular lines and to solve geometric problems.
Use coordinates to design and describe geometric figures. A.5.a Locate points in the coordinate plane.
Identify and select appropriate units of metric and customary measures.
[Not assessed on the current test]
Convert and estimate units of metric and customary measure (all conversions within systems).
Q.3.c Solve multistep, arithmetic, real-world problems using ratios or proportions including those that require converting units of measure.
Q.4.a Compute the area and perimeter of triangles and rectangles. Determine side lengths of triangles and rectangles when given area or perimeter.
Q.4.b Compute the area and circumference of circles. Determine the radius or diameter when given area or circumference.
Q.4.c Compute the perimeter of a polygon. Given a geometric formula, compute the area of a polygon. Determine side lengths of the figure when given the perimeter or area.
Q.4.d Compute perimeter and area of 2-D composite geometric figures, which could include circles, given geometric formulas as needed.
Q.5.a When given geometric formulas, compute volume and surface area of rectangular prisms. Solve for side lengths or height, when given volume or surface area.
Q.5.b When given geometric formulas, compute volume and surface area of cylinders. Solve for height, radius, or diameter when given volume or surface area.
Q.5.c When given geometric formulas, compute volume and surface area of right prisms. Solve for side lengths or height, when given volume or surface area.
Q.5.d When given geometric formulas, compute volume and surface area of right pyramids and cones. Solve for side lengths, height, radius, or diameter when given volume or surface area.
Q.5.e When given geometric formulas, compute volume and surface area of spheres. Solve for radius or diameter when given the surface area.

37
Assessment Guide for Educators: Mathematical Reasoning Appendix A
Mathematical Reasoning: Content Specifications2002 Current Test
Solve and estimate solutions to problems involving length, perimeter, area, surface area, volume, angle measurement, capacity, weight, and mass.
Q.5.f Compute surface area and volume of composite 3-D geometric figures, given geometric formulas as needed.
Use uniform rates (e.g., miles per hour, bushels per acre) in problem situations.
Q.2.e Solve one-step or multi-step arithmetic, real world problems involving the four operations with rational numbers, including those involving scientific notation.
Q.3.a Compute unit rates. Examples include but are not limited to: unit pricing, constant speed, persons per square mile, BTUs per cubic foot.
Q.3.b Use scale factors to determine the magnitude of a size change. Convert between actual drawings and scale drawings.
Q.3.c Solve multistep, arithmetic, real-world problems using ratios or proportions including those that require converting units of measure.
Read and interpret scales, meters, and gauges [Not assessed on the current test]
Predict the impact of changes in linear dimension on the perimeter, area, and volume of figures.
[Not assessed on the current test]
Construct, interpret, and draw inferences from tables, charts, and graphs.
Make inferences and convincing arguments based on data analysis.
Represent data graphically in ways that make sense and are appropriate to the context.
Use an informal line of best fit to make predictions from data.
Q.6.a Represent, display, and interpret categorical data in bar graphs or circle graphs.
Q.6.b Represent, display, and interpret data involving one variable plots on the real number line including dot plots, histograms, and box plots.
Q.6.c Represent, display, and interpret data involving two variables in tables and the coordinate plane including scatter plots and graphs.
Evaluate arguments based on data analysis, including distinguishing between correlation and causation.
[Not assessed on the current test]
Apply measures of central tendency (mean, median, mode) and analyze the effect of changes in data on these measures.
Q.7.a Calculate the mean, median, mode and range. Calculate a missing data value, given the average and all the missing data values but one, as well as calculating the average, given the frequency counts of all the data values, and calculating a weighted average.
Apply and recognize sampling and bias in statistical claims. [Not assessed on the current test]
Make predictions based on experimental or theoretical probabilities, including listing possible outcomes.
Q.8.a Use counting techniques to solve problems and determine combinations and permutations.
Q.8.b Determine the probability of simple and compound events.
Compare and contrast different sets of data on the basis of measures of central tendency and dispersion (range, standard deviation).
[Not assessed on the current test]

38
Assessment Guide for Educators: Mathematical Reasoning Appendix A
Mathematical Reasoning: Content Specifications2002 Current Test
Analyze and represent situations involving variable quantities with tables, graphs, verbal descriptions, and equations.
A.2.b Solve real-world problems involving linear equations.
A.5.d Graph two-variable linear equations.
A.5.e For a function that models a linear or nonlinear relationship between two quantities, interpret key features of graphs and tables in terms of quantities, and sketch graphs showing key features of graphs and tables in terms of quantities, and sketch graphs showing key features given a verbal description of the relationship. Key features include: intercepts; intervals where the function is increasing, decreasing, positive, or negative; relative maximums and minimums; symmetries; end behavior, and periodicity.
A.7.a Compare two different proportional relationships represented in different ways. Examples include but are not limited to: compare a distance-time graph to a distance- time equation to determine which of two moving objects has a greater speed.
A.7.d Compare properties of two linear or quadratic functions each represented in a different way (algebraically, numerically in tables, graphically or by verbal descriptions). Examples include but are not limited to: given a linear function represented by a table of values and a linear function represented by an algebraic expression, determine which function has the greater rate of change.
Recognize that a variety of problem situations may be modeled by the same function or type of function (e.g., y = mx + b, y = ax2, y = ax, y = 1/x).
A.2.c Write one-variable and multi-variable linear equations to represent context.
A.4.b Write one-variable quadratic equations to represent context.
Convert between different representations, such as tables, graphs, verbal descriptions, and equations.
A.2.c Write one-variable and multi-variable linear equations to represent context.
A.4.b Write one-variable quadratic equations to represent context.
A.5.d Graph two-variable linear equations.

39
Assessment Guide for Educators: Mathematical Reasoning Appendix A
Mathematical Reasoning: Content Specifications2002 Current Test
Create and use algebraic expressions and equations to model situations and solve problems.
A.1.a Add, subtract, factor, multiply and expand linear expressions with rational coefficients.
A.1.c Write linear expressions as part of word-to-symbol translations or to represent common settings.
A.1.d Add, subtract, multiply polynomials, including multiplying two binomials, or divide factorable polynomials.
A.1.g Write polynomial expressions as part of word-to-symbol translations or to represent common settings.
A.1.h Add, subtract, multiply and divide rational expressions.
A.1.j Write rational expressions as part of word-to-symbol translations or to represent common settings.
A.2.b Solve real-world problems involving linear equations.
A.2.c Write one-variable and multi-variable linear equations to represent context.
A.2.d Solve a system of two simultaneous linear equations by graphing, substitution, or linear combination. Solve real-world problems leading to a system of linear equations.
A.4.a Solve quadratic equations in one variable with rational coefficients and real solutions, using appropriate methods. (e.g., quadratic formula, completing the square, factoring, inspection).
A.4.b Write one-variable quadratic equations to represent context.
Convert between different representations, such as tables, graphs, verbal descriptions, and equations.
A.2.c Write one-variable and multi-variable linear equations to represent context.
A.4.b Write one-variable quadratic equations to represent context.
A.5.d Graph two-variable linear equations.
Evaluate formulas. A.1.b Evaluate linear expressions by substituting integers for unknown quantities.
A.1.e Evaluate polynomial expressions by substituting integers for unknown quantities.
A.1.i Evaluate rational expressions by substituting integers for unknown quantities.
A.7.c Evaluate linear and quadratic functions for values in their domain when represented using function notation.

40
Assessment Guide for Educators: Mathematical Reasoning Appendix A
What’s different on the Mathematical Reasoning Test?
As shown in the tables above, one of the major differences between the content of the 2002 Series Mathematics Test and the Current Mathematical Reasoning Test is the clarity with which each skill is articulated. Breaking each of these skills down into greater detail than the 2002 Series content framework provided is intended to give greater guidance and specificity to test developers, instructional materials developers, and educators.
Note that there are some skills tested on the 2002 Series GED® Test that will not appear on the current test. The elimination of certain skills is generally NOT due to the fact that those skills are no longer important, but, rather, it is sometimes because those skills are foundational to other skills that are being assessed on the current test. In other instances, because of the current test’s focus on deep mastery of core foundational skills, some more advanced mathematics have been moved out of the scope of the test. In addition, in the particular case of many statistics-based skills, those skills appear on the current test in the Science and Social Studies tests, as opposed to the Mathematical Reasoning test.
Mathematical Reasoning: Content Specifications2002 Current Test
Solve equations, including first degree, quadratic, power, and systems of linear equations.
A.2.a Solve one-variable linear equations with rational number coefficients, including equations whose solutions require expanding expressions using the distributive property and collecting like terms or equations with coefficients represented by letters.
A.2.b Solve real-world problems involving linear equations.
A.2.d Solve a system of two simultaneous linear equations by graphing, substitution, or linear combination. Solve real-world problems leading to a system of linear equations.
A.4.a Solve quadratic equations in one variable with rational coefficients and real solutions, using appropriate methods. (e.g., quadratic formula, completing the square, factoring, inspection).
A.4.b Write one-variable quadratic equations to represent context.
Recognize and use direct and indirect variation. [Not assessed on the current test]
Analyze tables and graphs to identify and generalize patterns and relationships.
A.2.b Solve real-world problems involving linear equations.
A.5.d Graph two-variable linear equations.
Analyze and use functional relationships to explain how a change in one quantity results in a change in another quantity, including linear, quadratic, and exponential functions.
[Not assessed on the current test]

41
Assessment Guide for Educators: Mathematical Reasoning Appendix A
In addition to all the skills that align with what has been previously measured, the current test includes items that test the following skills:
• Q.1.d Identify absolute value of a rational number as its distance from 0 on the number line and determine the distance between two rational numbers on the number line, including using the absolute value of their difference
• Q.2.d Determine when a numerical expression is undefined
• A.1.f Factor polynomial expressions
• A.3.a Solve linear inequalities in one variable with rational number coefficients
• A.3.b Identify or graph the solution to a one variable linear inequality on a number line
• A.3.c Solve real-world problems involving inequalities
• A.3.d Write linear inequalities in one variable to represent context
• A.7.b Represent or identify a function in a table or graph as having exactly one output (one element in the range) for each input (each element in the domain)
This more granular approach to describing the mathematical content is not the only improvement upon the 2002 Series test. In addition, the current test includes items that measure the Mathematical Practices. These practices are skills that are drawn both from career- and college-readiness standards for Mathematical Practice and from the Principles and Standards for School Mathematics developed by the National Council of Teachers of Mathematics.
The content indicators and Mathematical Practices found in the GED® Mathematical Reasoning Assessment Targets, though related, cover different aspects of item content considerations. The content indicators focus on mathematical content and they describe very specific knowledge and skills. In contrast, the mathematical practices focus more on mathematical reasoning skills and modes of thinking mathematically. Most of the Mathematical Practices are not specific to any one particular area of mathematics content, meaning that a mathematical practice indicator could be applied to

42
Assessment Guide for Educators: Mathematical Reasoning Appendix A
test items that cover a variety of content domains (e.g., algebra, data analysis, number sense).
The Mathematical Practices provide specifications for assessing real-world problem-solving skills in a mathematical context rather than requiring students only to memorize, recognize and apply a long list of mathematical algorithms. Each practice falls into one of the five following categories.
• MP.1 Building Solution Pathways and Lines of Reasoning
• MP.2 Abstracting Problems
• MP.3 Furthering Lines of Reasoning
• MP.4 Mathematical Fluency
• MP.5 Evaluating Reasoning and Solution Pathways
For more information on the mathematical practices, see the Mathematical Reasoning Assessment Targets in Chapter 1.

43
Assessment Guide for Educators: Mathematical Reasoning
BAppendix
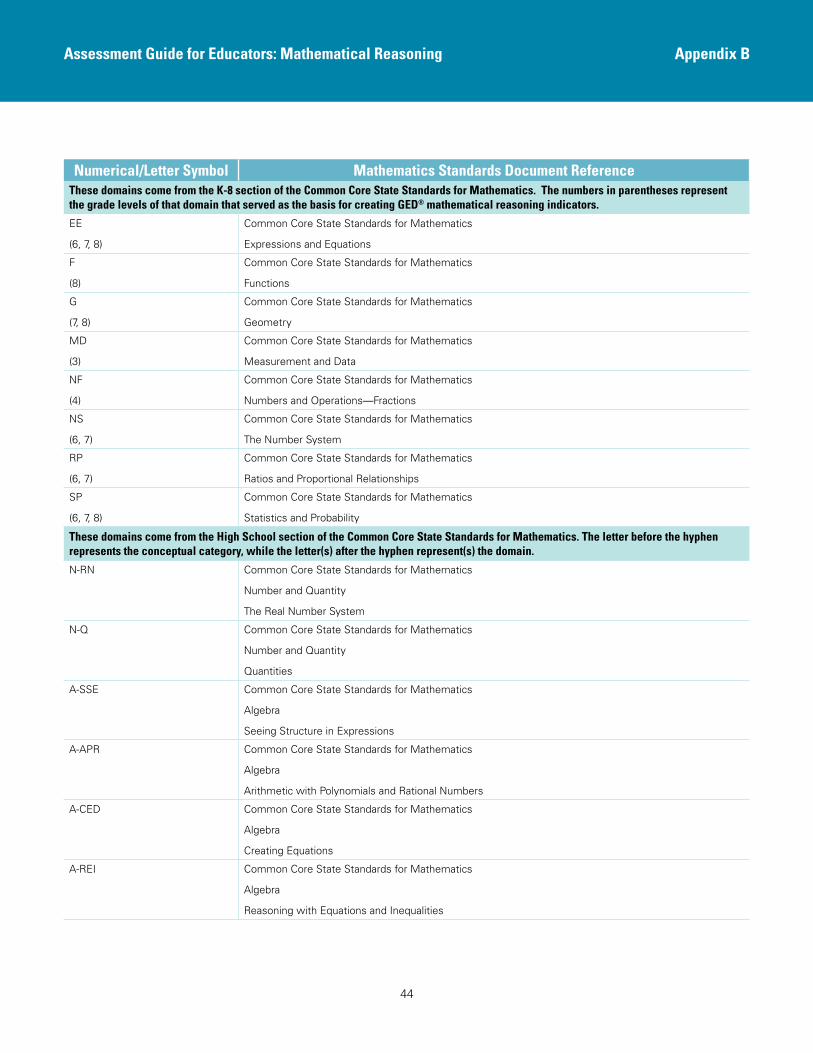
Reference Codes for Mathematical Reasoning Assessment TargetsAppendix B gives the reference for each code identified in the “References” column in the Mathematical Reasoning Assessment Targets.
Appendix B
44
Assessment Guide for Educators: Mathematical Reasoning Appendix B
Numerical/Letter Symbol Mathematics Standards Document ReferenceThese domains come from the K-8 section of the Common Core State Standards for Mathematics� The numbers in parentheses represent the grade levels of that domain that served as the basis for creating GED® mathematical reasoning indicators�
EE
(6, 7, 8)
Common Core State Standards for Mathematics
Expressions and Equations
F
(8)
Common Core State Standards for Mathematics
Functions
G
(7, 8)
Common Core State Standards for Mathematics
Geometry
MD
(3)
Common Core State Standards for Mathematics
Measurement and Data
NF
(4)
Common Core State Standards for Mathematics
Numbers and Operations—Fractions
NS
(6, 7)
Common Core State Standards for Mathematics
The Number System
RP
(6, 7)
Common Core State Standards for Mathematics
Ratios and Proportional Relationships
SP
(6, 7, 8)
Common Core State Standards for Mathematics
Statistics and Probability
These domains come from the High School section of the Common Core State Standards for Mathematics� The letter before the hyphen represents the conceptual category, while the letter(s) after the hyphen represent(s) the domain�
N-RN Common Core State Standards for Mathematics
Number and Quantity
The Real Number System
N-Q Common Core State Standards for Mathematics
Number and Quantity
Quantities
A-SSE Common Core State Standards for Mathematics
Algebra
Seeing Structure in Expressions
A-APR Common Core State Standards for Mathematics
Algebra
Arithmetic with Polynomials and Rational Numbers
A-CED Common Core State Standards for Mathematics
Algebra
Creating Equations
A-REI Common Core State Standards for Mathematics
Algebra
Reasoning with Equations and Inequalities

45
Assessment Guide for Educators: Mathematical Reasoning Appendix B
Numerical/Letter Symbol Mathematics Standards Document ReferenceF-IF Common Core State Standards for Mathematics
Functions
Interpreting Functions
G-GPE Common Core State Standards for Mathematics
Geometry
Expressing Geometric Properties with Equations
G-MG Common Core State Standards for Mathematics
Geometry
Modeling with Geometry
S-ID Common Core State Standards for Mathematics
Statistics and Probability
Interpreting Categorical and Quantitative Data
S-CP Common Core State Standards for Mathematics
Statistics and Probability
Conditional Probability and the Rules of Probability
S-MD Common Core State Standards for Mathematics
Statistics and Probability
Using Probability to Make Decisions
The GED® mathematical practices are based on two publications: the Standards for Mathematical Practice found in the Common Core State Standards for Mathematics, and the Principles and Standards for School Mathematics published by the National Council of Teachers of Mathematics
M1, M2, M3, M4, M5, M6 Common Core State Standards for Mathematics
Standards for Mathematical Practice
N1, N2, N3, N5, N6, N7, N8, N9 Principles and Standards for School Mathematics

46
Assessment Guide for Educators: Mathematical Reasoning
C Appendix
Mathematical Reasoning Reporting CategoriesReporting Category 1: Quantitative problems in rational numbers
Examples of skills measured Mathematics Reporting
Category 1:
• Demonstrating fluency with operations using rational numbers
• Using rational numbers to formulate solutions to problems set within real-world contexts
• Solving problems with rational numbers that involve proportionality
Reporting Category 2: Quantitative problems in measurement
Examples of skills measured in Mathematics Reporting
Category 2:
• Engaging with geometric figures in a variety of graphic presentations
• Engaging with descriptive statistics in a variety of graphic presentations
• Using formulas or decomposition to calculate perimeter, area, surface area, and volume of figures
• Using descriptive statistics to summarize and compare data sets and understand concepts relating to basic theoretical probability
Appendix C

47
Assessment Guide for Educators: Mathematical Reasoning Appendix C
Reporting Category 3: Linear equations and expressions
Examples of skills measured in Mathematics Reporting
Category 3:
• Writing linear mathematical expressions and equations that correspond to given situations
• Evaluating the expressions for specific values of the variable
• Solving linear equations, inequalities, and systems of linear equations and find the equation of a line with varying criteria
• Interpreting slope of a line as rate of change or unit rate
Reporting Category 4: Function concepts and nonlinear expressions and equations
Examples of skills measured in Mathematics Reporting
Category 4:
• Understanding and applying the concept of a function
• Using function notation
• Translating a variety of representations of a function, including tables and equations
• Solving quadratic equations
• Interpreting key features of both linear and nonlinear functions
Important note regarding the Mathematical Reasoning reporting categories:
Although the Mathematical Practices are an important aspect of what is assessed on the Mathematical Reasoning test module, you may note that the practices are not directly reflected in the reporting categories as described above. This is due to the fact that the Mathematical Practices are integrated only into some, but not all, items on the Mathematical Reasoning test. Test-takers, however, will be receiving much more detailed information both on the skills they possess and on those they need to develop than ever before. With this additional information, adult educators will be in a position to focus their work with test-takers on critical skill development needs.
The reporting information provided by the GED® test is one of the most important elements of the new assessment system. Gaining

48
Assessment Guide for Educators: Mathematical Reasoning Appendix C
a firm understanding of the reporting categories on the GED® test will help adult educators in planning how they can best help adult learners to gain the skills they will need to be successful both on the test and in the future pathway they ultimately pursue.
Reporting Category 1 - Quantitative problem solving with rational numbers 25%Q.1 .a Order fractions and decimals, including on a number line.
Q.1.b Apply number properties involving multiples and factors, such as using the least common multiple, greatest common factor, or distributive property to rewrite numeric expressions.
Q.1.c Apply rules of exponents in numerical expressions with rational exponents to write equivalent expressions with rational exponents.
Q.1.d Identify absolute value or a rational number as its distance from 0 on the number line and determine the distance between two rational numbers on the number line, including using the absolute value of their difference.
Q.2 .a Perform addition, subtraction, multiplication, and division on rational numbers.
Q.2.b Perform computations and write numerical expressions with squares and square roots of positive, rational numbers.
Q.2.c Perform computations and write numerical expressions with cubes and cube roots of rational numbers.
Q.2.d Determine when a numerical expression is undefined.
Q.2 .e Solve one-step or multi-step arithmetic, real world problems involving the four operations with rational numbers, including those involving scientific notation.
Q.3 .a Compute unit rates. Examples include but are not limited to: unit pricing, constant speed, and persons per square mile, BTUs per cubic foot.
Q.3.b Use scale factors to determine the magnitude of a size change. Convert between actual drawings and scale drawings.
Q.3.c Solve multistep, arithmetic, real-world problems using ratios or proportions including those that require converting units of measure.
Q.3.d Solve two-step, arithmetic, real world problems involving percents. Examples include but are not limited to:
simple interest, tax, markups and markdowns, gratuities and commissions, percent increase and decrease.

49
Assessment Guide for Educators: Mathematical Reasoning Appendix C
Reporting Category 2 - Quantitative problem solving in measurement 20%Q.4 .a Compute the area and perimeter of triangles and rectangles. Determine side lengths of triangles and
rectangles when given area or perimeter.
Q.4.b Compute the area and circumference of circles. Determine the radius or diameter when given area or circumference
Q.4.c Compute the perimeter of a polygon. Given a geometric formula, compute the area of a polygon. Determine side lengths of the figure when given the perimeter or area.
Q.4.d Compute perimeter and area of 2-D composite geometric figures, which could include circles, given geometric formulas as needed.
Q.4.e Use the Pythagorean theorem to determine unknown side lengths in a right triangle.
Q.5 .a When given geometric formulas, compute volume and surface area of rectangular prisms. Solve for side lengths or height, when given volume or surface area.
Q.5.b When given geometric formulas, compute volume and surface area of cylinders. Solve for height, radius, or diameter when given volume or surface area.
Q.5.c When given geometric formulas, compute volume and surface area of right prisms. Solve for side lengths or height, when given volume or surface area.
Q.5.d When given geometric formulas, compute volume and surface area of right pyramids and cones. Solve for side lengths, height, radius, or diameter when given volume or surface area.
Q.5.e When given geometric formulas, compute volume and surface area of spheres. Solve for radius or diameter when given the surface area.
Q.5.f Compute surface area and volume of composite 3-D geometric figures, given geometric formulas as needed.
Q.6 .a Represent, display, and interpret categorical data in bar graphs or circle graphs.
Q.6.b Represent, display, and interpret data involving one variable plots on the real number line including dot plots, histograms, and box plots.
Q.6.c Represent, display, and interpret data involving two variables in tables and the coordinate plane including scatter plots and graphs.
Q.7 .a Calculate the mean, median, mode and range. Calculate a missing data value, given the average and all the missing data values but one, as well as calculating the average, given the frequency counts of all the data values, and calculating a weighted average.
Q.8 .a Use counting techniques to solve problems and determine combinations and permutations.
Q.8.b Determine the probability of simple and compound events.

50
Assessment Guide for Educators: Mathematical Reasoning Appendix C
Reporting Category 3 - Algebraic problem solving with expressions and equations 30%A.1 .a Add, subtract, factor, multiply and expand linear expressions with rational coefficients.
A.1.b Evaluate linear expressions by substituting integers for unknown quantities.
A.1.c Write linear expressions as part of word-to-symbol translations or to represent common settings.
A.1.d Add, subtract, multiply polynomials, including multiplying two binomials, or divide factorable polynomials.
A.1.e Evaluate polynomial expressions by substituting integers for unknown quantities.
A.1.f Factor polynomial expressions.
A.1.g Write polynomial expressions as part of word-to-symbol translations or to represent common settings.
A.1.h Add, subtract, multiply and divide rational expressions.
A.1.i Evaluate rational expressions by substituting integers for unknown quantities.
A.1.j Write rational expressions as part of word-to-symbol translations or to represent common settings.
A.2 .a Solve one-variable linear equations with rational number coefficients, including equations whose solutions require expanding expressions using the distributive property and collecting like terms or equations with coefficients represented by letters.
A.2.b Solve real-world problems involving linear equations.
A.2.c Write one-variable and multi-variable linear equations to represent context.
A.2.d Solve a system of two simultaneous linear equations by graphing, substitution, or linear combination. Solve real-world problems leading to a system of linear equations.
A.3 .a Solve linear inequalities in one variable with rational number coefficients.
A.3.b Identify or graph the solution to a one variable linear inequality on a number line.
A.3.c Solve real-world problems involving inequalities.
A.3.d Write linear inequalities in one variable to represent context.
A.4 .a Solve quadratic equations in one variable with rational coefficients and real solutions, using appropriate methods. (e.g., quadratic formula, completing the square, factoring, inspection)
A.4.b Write one-variable quadratic equations to represent context.

51
Assessment Guide for Educators: Mathematical Reasoning Appendix C
Reporting Category 4 - Algebraic problem solving with graphs and functions 25%A.5 .a Locate points in the coordinate plane.
A.5.b Determine the slope of a line from a graph, equation, or table.
A.5.c Interpret unit rate as the slope in a proportional relationship.
A.5.d Graph two-variable linear equations.
A.5.e For a function that models a linear or nonlinear relationship between two quantities, interpret key features of graphs and tables in terms of quantities, and sketch graphs showing key features of graphs and tables in terms of quantities, and sketch graphs showing key features given a verbal description of the relationship. Key features include: intercepts; intervals where the function is increasing, decreasing, positive, or negative; relative maximums and minimums; symmetries; end behavior, and periodicity.
A.6 .a Write the equation of a line with a given slope through a given point.
A.6.b Write the equation of a line passing through two given distinct points.
A.6.c Use slope to identify parallel and perpendicular lines and to solve geometric problems.
A.7 .a Compare two different proportional relationships represented in different ways. Examples include but are
not limited to: compare a distance-time graph to a distance-time equation to determine which of two moving objects has a greater speed.
A.7.b Represent or identify a function in a table or graph as having exactly one output (one element in the range) for each input (each element in the domain).
A.7.c Evaluate linear and quadratic functions for values in their domain when represented using function notation.
A.7.d Compare properties of two linear or quadratic functions each represented in a different way (algebraically, numerically in tables, graphically or by verbal descriptions). Examples include but are not limited to: given a linear function represented by a table of values and a linear function represented by an algebraic expression, determine which function has the greater rate of change.

52
Assessment Guide for Educators: Mathematical Reasoning
DAppendix
Glossary of Key Terms for the Mathematical Reasoning TestAbsolute value: the distance between a number and zero on a number line; always represented as a positive number or zero
Analysis/analyze (do not substitute infer, summarize): to examine critically in order to determine meaning and to understand the essential elements of [a text or other stimulus]
Application/apply (do not substitute interpret, infer, summarize, conclude, calculate, solve, predict): to use or employ an already established skill or piece of information in a new situation
Argument (do not substitute claim, stance, argumentation): a process or line of reasoning. For our purposes, arguments can be made either persuasively (i.e., to convince an audience of something) or rhetorically (i.e., to lay out a logical progression of ideas in support of a central stance)
Argumentation (do not substitute argument, claim, stance, point of view): the presentation of a line (or lines) of reasoning (i.e., the way in which something is argued, not the line of reasoning itself)
Assumption (do not substitute premise, conclusion): something taken for granted; a supposition
Circumference (do not substitute polygon): the distance around a circle (See perimeter—these concepts are closely related)
Claim (do not substitute stance, argument author’s purpose, author’s point of view, hypothesis, position, perspective): an assertion of something as fact
Appendix D

53
Assessment Guide for Educators: Mathematical Reasoning Appendix D
Combination (do not substitute permutation): an arrangement of objects in which order does not matter
Compute/computation/calculate/calculation: to determine by mathematical methods (for our purposes, arithmetically or algebraically)
Create (do not substitute apply, analyze, synthesize): to originate or invent (e.g., an original line of reasoning)
Data (do not substitute information): individual facts, statistics, or pieces of information (can be qualitative or quantitative). See information for disambiguation.
Detail (do not substitute idea): a small part than can be considered individually
Evaluate: to substitute one or more numerical values into an algebraic expression
Evidence (do not substitute detail, reasoning): that which tends to prove or disprove something; grounds for belief
Expression: (do not substitute function, polynomial, linear equation, quadratic equation): some combination of constants and/or variables; may be a solitary number or variable, or may be comprised of multiple numbers and/or variables (See polynomial—these concepts are closely related)
Finding (do not substitute conclusion, evidence, assumption): that which is discovered through research or study (See conclusion for disambiguation—these concepts are closely related)
Format (do not substitute genre): general appearance, style, arrangement (e.g., of a text)
Function (do not substitute expression, polynomial, linear equation, quadratic equation): a mathematical rule that assigns an output value to each unique input value
Generalization (do not substitute summary, conclusion, hypothesis): a principle, theory, or idea that can be applied in many instances
Histogram: a display that expresses frequencies of data in numerical intervals or ranges; similar to a bar graph
Hypotenuse: the longest side of a right triangle, located opposite the right angle

54
Assessment Guide for Educators: Mathematical Reasoning Appendix D
Hypothesis (do not substitute generalization, conclusion, claim, stance, position, assumption, inference): a proposition or set of propositions set forth as an explanation for a group of facts or phenomena; conjecture that is a guide for investigation
Idea (do not substitute theme, detail): any conception resulting from mental understanding, awareness, or activity
Inference/infer (do not substitute interpret, summarize, analyze, hypothesize): to conclude by reasoning from evidence that which is not explicitly stated
Information (do not substitute data): knowledge gained through experience or study. More abstract and general than “data.”
Interpret (do not substitute infer, summarize, analyze): to provide the meaning of, or explain, that which is explicitly stated or displayed graphically or symbolically
Justify (do not substitute support): to show a claim or statement to be writing, especially using evidence
Linear equation (do not substitute expression, function, quadratic equation): an equation containing one or two variables of the first degree (that is, no exponents); when graphed on the coordinate plane, a linear equation presents as a straight line
Modeling: the process of using mathematical concepts, language, symbols, and/or diagrams to represent situations in mathematical terms
Perimeter (do not substitute circumference): the distance around a two-dimensional figure, such as a rectangle or other polygon (See circumference—these concepts are closely related)
Permutation (do not substitute combination): a uniquely ordered arrangement of objects
Polynomial (do not substitute expression, function): some combination of constants and/or variables, comprised of multiple terms (See expression—these concepts are closely related)
Premise (do not substitute conclusion, assumption, hypothesis): a basis, stated or assumed, on which reasoning proceeds
Prediction (do not substitute conclusion, assumption, reasoning, premise, hypothesis): A statement of something in advance of occurrence, especially on a reasoned or evidentiary basis

55
Assessment Guide for Educators: Mathematical Reasoning Appendix D
Proportion/proportional (do not substitute ratio): the relationship of two equivalent ratios or a description of the relationship between two mathematically-related categories
Pythagorean theorem: a mathematical formula that describes the relationship between the sides of a right triangle, a2 + b2 = c2, where a and b represent the sides adjacent to the right angle, and c represents the hypotenuse (See hypotenuse)
Quadratic equation (do not substitute expression, function, linear equation): an equation of the form ax2 + bx + c = 0; when graphed on the coordinate plane, a quadratic equation presents as a parabola (U-shape)
Ratio (do not substitute proportion, rational): the relationship between two categories expressed mathematically; ratios may use numbers and/or variables
Rational number: any number that can be represented as a fraction where the numerator and denominator are both integers (denominator may not be zero)
Reasoning (do not substitute evidence, meaning, conclusion): the process of forming conclusions, judgments, or inferences from evidence
Scientific notation: a method for expressing very large or very small numbers, consisting of a number (often a decimal) between 1 and 10, which is then multiplied by a power of 10
Slope: a representation of the direction and steepness of a straight line graphed on the coordinate plane, expressed as a positive or negative number, or zero
Solution/solve (do not substitute calculation, computation): the process of determining the answer to a mathematical problem (more general than calculation and computation, which refer to a specific technique)
Stance (do not substitute claim, argument, argumentation): the position on which an author bases an argument (e.g., pro or con)
Support (do not substitute justify): to establish by providing appropriate facts and evidence (either quantitative or textual).
Synthesis/synthesize (do not substitute apply, summarize, analyze): to combine elements or ideas from multiple materials into a unified, if complex, whole

56
Assessment Guide for Educators: Mathematical Reasoning Appendix D
Theory (do not substitute scientific presentation, scientific model) A set of principles that explain or predict phenomena