Assessment report - European Medicines Agency · eC-SSRS Electronic Columbia-Suicide Severity...
135
30 Churchill Place ● Canary Wharf ● London E14 5EU ● United Kingdom An agency of the European Union Telephone +44 (0)20 3660 6000 Facsimile +44 (0)20 3660 5555 Send a question via our website www.ema.europa.eu/contact © European Medicines Agency, 2017. Reproduction is authorised provided the source is acknowledged. 18 May 2017 EMA/381484/2017 Committee for Medicinal Products for Human Use (CHMP) Assessment report Kyntheum International non-proprietary name: brodalumab Procedure No. EMEA/H/C/003959/0000 Note Assessment report as adopted by the CHMP with all information of a commercially confidential nature deleted.
Transcript of Assessment report - European Medicines Agency · eC-SSRS Electronic Columbia-Suicide Severity...

30 Churchill Place ● Canary Wharf ● London E14 5EU ● United Kingdom
An agency of the European Union
Telephone +44 (0)20 3660 6000 Facsimile +44 (0)20 3660 5555
Send a question via our website www.ema.europa.eu/contact
© European Medicines Agency, 2017. Reproduction is authorised provided the source is acknowledged.
18 May 2017 EMA/381484/2017 Committee for Medicinal Products for Human Use (CHMP)
Assessment report
Kyntheum
International non-proprietary name: brodalumab
Procedure No. EMEA/H/C/003959/0000
Note
Assessment report as adopted by the CHMP with all information of a commercially confidential nature deleted.

Assessment report
EMA/381484/2017 Page 2/135
Table of contents
1. Background information on the procedure .............................................. 6
1.1. Submission of the dossier ...................................................................................... 6
1.2. Steps taken for the assessment of the product ......................................................... 7
2. Scientific discussion ................................................................................ 8
2.1. Problem statement ............................................................................................... 8
2.1.1. Disease or condition ........................................................................................... 8
2.1.2. Epidemiology .................................................................................................... 8
2.1.3. Aetiology and pathogenesis ................................................................................ 8
2.1.4. Clinical presentation ........................................................................................... 9
2.1.5. Management ..................................................................................................... 9
2.2. Quality aspects .................................................................................................. 10
2.2.1. Introduction .................................................................................................... 10
2.2.2. Active Substance ............................................................................................. 10
2.2.3. Finished Medicinal Product ................................................................................ 13
2.2.4. Discussion on chemical, pharmaceutical and biological aspects .............................. 14
2.2.5. Conclusions on the chemical, pharmaceutical and biological aspects ...................... 16
2.2.6. Recommendation for future quality development ................................................. 17
2.3. Non-clinical aspects ............................................................................................ 17
2.3.1. Introduction .................................................................................................... 17
2.3.2. Pharmacology ................................................................................................. 17
2.3.3. Pharmacokinetics............................................................................................. 19
2.3.4. Toxicology ...................................................................................................... 20
2.3.5. Ecotoxicity/environmental risk assessment ......................................................... 24
2.3.6. Discussion on non-clinical aspects...................................................................... 24
2.3.7. Conclusion on the non-clinical aspects ................................................................ 25
2.4. Clinical aspects .................................................................................................. 25
2.4.1. Introduction .................................................................................................... 25
2.4.2. Pharmacokinetics............................................................................................. 29
2.4.3. Pharmacodynamics .......................................................................................... 34
2.4.4. Discussion on clinical pharmacology ................................................................... 36
2.4.5. Conclusions on clinical pharmacology ................................................................. 37
2.5. Clinical efficacy .................................................................................................. 37
2.5.1. Dose response study ........................................................................................ 37
2.5.2. Main studies ................................................................................................... 40
2.5.3. Discussion on clinical efficacy ............................................................................ 93
2.5.4. Conclusions on the clinical efficacy ..................................................................... 96
2.6. Clinical safety .................................................................................................... 96
2.6.1. Discussion on clinical safety ............................................................................ 113
2.6.2. Conclusions on the clinical safety ..................................................................... 121
2.7. Risk Management Plan ...................................................................................... 121
2.8. Pharmacovigilance ............................................................................................ 125
2.9. New Active Substance ....................................................................................... 125
2.10. Product information ........................................................................................ 125

Assessment report
EMA/381484/2017 Page 3/135
2.10.1. User consultation ......................................................................................... 125
2.10.2. Additional monitoring ................................................................................... 126
3. Benefit-Risk Balance............................................................................ 126
3.1. Therapeutic Context ......................................................................................... 126
3.1.1. Disease or condition ....................................................................................... 126
3.1.2. Available therapies and unmet medical need ..................................................... 126
3.1.3. Main clinical studies ....................................................................................... 126
3.2. Favourable effects ............................................................................................ 127
3.3. Uncertainties and limitations about favourable effects ........................................... 128
3.4. Unfavourable effects ......................................................................................... 128
3.5. Uncertainties and limitations about unfavourable effects ....................................... 129
3.6. Effects Table .................................................................................................... 131
3.7. Benefit-risk assessment and discussion ............................................................... 133
3.7.1. Importance of favourable and unfavourable effects ............................................ 133
3.7.2. Balance of benefits and risks ........................................................................... 134
3.7.3. Additional considerations on the benefit-risk balance ......................................... 134
3.8. Conclusions ..................................................................................................... 134
4. Recommendations ............................................................................... 135

Assessment report
EMA/381484/2017 Page 4/135
List of abbreviations
ADA Anti-drug antibodies ADCC Antibody dependent cell-mediated cytotoxicity ADR Adverse drug reaction AE Adverse event AI auto injector/pen
AMG 827 brodalumab AMQ Amgen-defined medical queries ANC Absolute neutrophil count ANOVA analysis of variance
AR accumulation ratio
AUC Area under the curve AUCinf area under the concentration-time curve from time 0 to infinity AUClast, AUC0-t Area under the drug concentration-time curve from time zero to time of last
quantifiable concentration AUCtau, AUC0-τ area under the concentration-time curve from time 0 to tau (τ , dosing interval)
BMI body mass index BQL Below the lower quantification limit BSA Body surface area C-CASA Columbia Classification Algorithm of Suicide Assessment CEC Cardiovascular Events Committee CFA Complete Freund’s Adjuvant CHMP Committee for Medicinal Products for Human Use
CI confidence interval CIA Collagen-induced arthritis CL clearance Cmax maximum observed concentration Cmin, Ctrough minimum (trough) concentration CNS Central nervous system CSF Cerebrospinal fluid CV Cardiovascular / coefficient of variation
DLQI Dermatology Life Quality Index DME drug metabolizing enzyme
EC50 half maximal effective concentration ECG Electrocardiogram eC-SSRS Electronic Columbia-Suicide Severity Rating Scale ELISA Enzyme-linked immunosorbent assay
F absolute bioavailability of subcutaneous dose
FDA Food and Drug Administration GCP Good Clinical Practice G-CSF Granulocyte colony-stimulating factor GD Gestation day GROα growth-regulated oncogene alpha
HADS Hospital Anxiety and Depression Scale HFF Human foreskin fibroblasts IC50 50% inhibitory concentration ICH International Conference on Harmonisation IL-17 Interleukine 17 IL-17RA Interleukine 17 receptor A IL-17RC Interleukin-17 receptor C
IL-17RF Interleukin-17 receptor F
Imax maximum inhibition IV Intravenous
ka first-order absorption rate constant
Kdeg first-order removal rate constant
kgf kilogram forces KHK Kiowa Hakko Kirin KLH Keyhole Limpet Hemocyanin
LLOQ lower limit of quantification

Assessment report
EMA/381484/2017 Page 5/135
M750, M751 Surrogate antibodies against mouse IL-17RA MACE Major adverse cardiovascular event
NOAEL No observed adverse effect level NOEL No observed effect level NRI Non-responder imputation PASI Psoriasis Area and Severity Index
PASI 75 75% improvement in the Psoriasis Area and Severity Index PASI 90 90% improvement in the Psoriasis Area and Severity Index PASI 100 100% improvement in the Psoriasis Area and Severity Index PD pharmacodynamics PFS pre-filled syringe PK Pharmacokinetics PRO patient-reported outcome PSI Psoriasis Symptom Inventory
Q2W every 2 weeks Q4W every 4 weeks Q8W Every 8 weeks QOL Quality of life RR Risk ratio
SAE Serious adverse event SC Subcutaneous SD, STD standard deviation
SE standard error SEER Surveillance, Epidemiology, and End Results SIR Standardized incidence ratio SMQ Standardized MedDRA Queries SOC System Organ Class sPGA static Physician Global Assessment of Psoriasis Th17 T-helper 17 cells TK Toxicokinetics
tmax time at which the maximum observed serum concentration was observed TNFα Tumornecrosefactor alpha ULN upper limit of normal US United States Vz/F Volume of distribution
WBS whole blood stimulation

Assessment report
EMA/381484/2017 Page 6/135
1. Background information on the procedure
1.1. Submission of the dossier
The applicant AstraZeneca UK Limited submitted on 13 November 2015 an application for marketing
authorisation to the European Medicines Agency (EMA) for Kyntheum, through the centralised procedure
falling within the Article 3(1) and point 1 of Annex of Regulation (EC) No 726/2004.
On 10 October 2016, the applicant changed from AstraZeneca UK Limited to LEO Pharma A/S.
The applicant applied for the following indication:
Treatment of moderate to severe plaque psoriasis in adult patients who are candidates for systemic
therapy.
The legal basis for this application refers to:
Article 8.3 of Directive 2001/83/EC - complete and independent application. The applicant indicated that
brodalumab was considered to be a new active substance.
The application submitted is composed of administrative information, complete quality data, non-clinical
and clinical data based on applicants’ own tests and studies and/or bibliographic literature
substituting/supporting certain test(s) or study(ies).
Information on Paediatric requirements
Pursuant to Article 7 of Regulation (EC) No 1901/2006, the application included an EMA Decision
P/0235/2014 on the agreement of a paediatric investigation plan (PIP).
At the time of submission of the application, the PIP P/0235/2014 was not yet completed as some
measures were deferred.
Information relating to orphan market exclusivity
Similarity
Pursuant to Article 8 of Regulation (EC) No. 141/2000 and Article 3 of Commission Regulation (EC) No
847/2000, the applicant did not submit a critical report addressing the possible similarity with authorised
orphan medicinal products because there is no authorised orphan medicinal product for a condition
related to the proposed indication.
Applicant’s request for consideration
New active Substance status
The applicant requested the active substance brodalumab contained in the above medicinal product to be
considered as a new active substance, as the applicant claims that it is not a constituent of a medicinal
product previously authorised within the European Union.

Assessment report
EMA/381484/2017 Page 7/135
Scientific Advice
The applicant received Scientific Advice from the CHMP on 22 September 2011 and 25 July 2013. The
Scientific Advice pertained to quality aspects of the dossier and clinical development in other indication.
1.2. Steps taken for the assessment of the product
The Rapporteur and Co-Rapporteur appointed by the CHMP were:
Rapporteur: Johann Lodewijk Hillege Co-Rapporteur: Jan Mueller-Berghaus
• The application was received by the EMA on 13 November 2015.
• The procedure started on 4 December 2015.
• The Rapporteur's first Assessment Report was circulated to all CHMP members on 19 February 2016.
The Co-Rapporteur's first Assessment Report was circulated to all CHMP members on 18 February
2016. The PRAC Rapporteur's first Assessment Report was circulated to all PRAC members on 04
March 2016.
• During the meeting on 1 April 2016, the CHMP agreed on the consolidated List of Questions to be
sent to the applicant. The final consolidated List of Questions was sent to the applicant on 1 April
2016.
• The applicant submitted the responses to the CHMP consolidated List of Questions on 14 July 2016.
• The Rapporteurs circulated the Joint Assessment Report on the applicant’s responses to the List of
Questions to all CHMP members on 22 August 2016.
• During the PRAC meeting on 02 September 2016, the PRAC agreed on the PRAC Assessment
Overview and Advice to CHMP.
• During the CHMP meeting on 15 September 2016, the CHMP agreed on a list of outstanding issues
to be addressed in writing by the applicant.
• The applicant submitted the responses to the CHMP List of Outstanding Issues on 10 October 2016.
• The Rapporteurs circulated the Joint Assessment Report on the applicant’s responses to the List of
Outstanding Issues to all CHMP members on 21 October 2016.
• During the PRAC meeting on 27 October 2016, the PRAC agreed on the PRAC Assessment Overview
and Advice to CHMP.
• During the CHMP meeting on 10 November 2016, the CHMP agreed on a list of outstanding issues to
be addressed in writing by the applicant.
• The applicant submitted the responses to the CHMP List of Outstanding Issues on 22 December
2016.
• The Rapporteurs circulated the Joint Assessment Report on the applicant’s responses to the List of
Outstanding Issues to all CHMP members on 13 January 2017.
• During the CHMP meeting on 24 January 2017, outstanding issues were addressed by the applicant
during an oral explanation before the CHMP.
• During the meeting on 26 January 2017, the CHMP, in the light of the overall data submitted and the
scientific discussion within the Committee, agreed on a list of outstanding issues to be addressed in
writing by the applicant.
Assessment report
EMA/381484/2017 Page 8/135
• During the PRAC meeting on 9 March 2017, the PRAC provided an advice on questions raised by the
CHMP.
• The applicant submitted the responses to the CHMP List of Outstanding Issues on 22 March 2017.
• The Rapporteurs circulated the Joint Assessment Report on the applicant’s responses to the List of
Outstanding Issues to all CHMP members on 31 March 2017.
• During the PRAC meeting on 6 April 2017, the PRAC agreed on the PRAC Assessment Overview and
Advice to CHMP.
• During the CHMP meeting on 18 April 2017, the CHMP agreed on a list of outstanding issues to be
addressed in writing by the applicant.
• The applicant submitted the responses to the CHMP List of Outstanding Issues on 26 April 2017.
• The Rapporteurs circulated the Joint Assessment Report on the applicant’s responses to the List of
Outstanding Issues to all CHMP members on 4 May 2017.
• During the meeting on 18 May 2017, the CHMP, in the light of the overall data submitted and the
scientific discussion within the Committee, issued a positive opinion for granting a marketing
authorisation to Kyntheum on 18 May 2017.
2. Scientific discussion
2.1. Problem statement
2.1.1. Disease or condition
Kyntheum is indicated for the treatment of moderate to severe plaque psoriasis in adult patients who are
candidates for systemic therapy.
2.1.2. Epidemiology
Psoriasis is one of the most common human skin diseases affecting 2 to 3% of the general population with
significant variation by geographic location and age. The prevalence of psoriasis varies in the EU from
0.6% to 8.5%.
2.1.3. Aetiology and pathogenesis
The interleukin-17 (IL-17) cytokine family consists of 6 cytokines (IL-17A to 17F) and 5 receptor subunits
(IL-17RA to IL-17RE). IL-17RA is required for mediating the biological activities of multiple IL-17 cytokine
family members, including IL-17A, IL-17F, IL-17A/F heterodimer, IL-17C, and IL-25 (also known as
IL-17E) (Johansen et al 2009).
Interleukin-17A, IL-17F, and IL-17A/F are hallmark proinflammatory cytokines produced by T-helper
cells producing IL-17 (Th17) cells and innate immune cells that have been shown to contribute to an
inflammatory response in models of autoimmune disorders. Interleukin-17A, IL-17F, and IL-17A/F have
pleiotropic activities, including the induction of proinflammatory mediators from epithelial cells,
endothelial cells and fibroblasts that promote tissue inflammation and destruction; the proliferation,
maturation, and chemotaxis of neutrophils; and the maturation of dendritic cells.

Assessment report
EMA/381484/2017 Page 9/135
The IL-17 receptor plays a central role in the pathogenesis of psoriasis. Blocking the IL-17 receptor on
keratinocytes and immune cell types has emerged as a critical target for the treatment of psoriasis.
IL-17R blocking has been shown to reduce inflammation, hyperproliferation, and skin thickening in a
number of experimental models1. Pharmacodynamically, inhibition of IL-17 signalling is associated with
improvements in lesional skin mRNA levels for a number of IL-17-modulated factors and other
inflammatory pathway mediators, resulting in successful treatment with reduction of inflammation2.
2.1.4. Clinical presentation
Psoriasis is a chronic, immune-mediated inflammatory skin disease associated with serious comorbidities
and substantial impairment of physical and psychological quality of life. The uncontrolled inflammation of
psoriasis may contribute to commonly associated comorbidities, including cardiovascular (CV) disease
(including hypertension and increased risk for myocardial infarction, stroke, and CV death), obesity, type
2 diabetes, arthritis, and chronic renal disease. Psoriasis is also associated with serious psychiatric
comorbidities, including depression, anxiety, and suicidality, as well as substance abuse.
2.1.5. Management
The current therapeutic options for moderate to severe plaque psoriasis include phototherapy, topical
agents (e.g., corticosteroids), conventional systemic therapy (e.g., cyclosporine, methotrexate, and oral
retinoids), and biologic therapy including TNF-α antagonists (adalimumab, etanercept, infliximab) and
anti-IL12/IL23 (ustekinumab and most recently, secukinumab). The conventional therapies are
associated with dose- and treatment-limiting options. The most common reasons for discontinuation of
these therapies are lack of efficacy, adverse events (AEs), and treatment inconvenience. The biologic
agents have been associated with higher objective response rates in clinical trials. Since its approval in
2009, ustekinumab has been shown to be the most effective biologic agent available. However, even with
these newer agents, most patients do not achieve optimal efficacy, such as total skin clearance. Although
newer treatment options provide improved outcomes compared with traditional systemic therapies, there
remains a significant unmet patient need for novel agents and mechanisms that can provide a rapid onset
of effect, improved and sustained skin clearance, and minimization of drug-specific safety concerns (e.g.
serious infections including opportunistic infections and tuberculosis, malignancies including lymphoma,
immunogenicity and demyelinating neurologic events).
About the product
Brodalumab (AMG 827) is a recombinant fully human monoclonal immunoglobulin G2 (IgG2) antibody,
that binds with high affinity to human interleukin-17 receptor A (IL-17RA) and blocks the biological
activities of the pro-inflammatory cytokines IL-17A, IL-17F, IL-17A/F heterodimer, and IL-25, resulting in
inhibition of the inflammation and clinical symptoms associated with psoriasis.
IL-17RA is a protein expressed on the cell surface and is a required component of receptor complexes
utilized by multiple IL-17 family cytokines. IL-17 family cytokine concentrations have been reported to be
increased in psoriasis. IL-17A, IL-17F and IL-17A/F heterodimer have pleiotropic activities including the
induction of pro-inflammatory mediators such as IL-6, GROα, and G-CSF from epithelial cells, endothelial
cells and fibroblasts that promote tissue inflammation. Blocking IL-17RA inhibits IL-17 cytokine-induced
responses resulting in normalization of inflammation in the skin.
1 Martin DA, Towne JE, Kricorian G, et al. The emerging role of IL-17 in the pathogenesis of psoriasis: preclinical and clinical findings. J Invest Dermatol 2013;133(1):17-26. 2 Russell CB, Rand H, Bigler J, Kerkof K, Timour M, et al. Gene expression profiles normalized in psoriatic skin by treatment with brodalumab, a human anti-IL-17 receptor monoclonal antibody. J Immunol 2014;192(8):3828-3836

Assessment report
EMA/381484/2017 Page 10/135
The proposed and approved indication is:
Kyntheum is indicated for the treatment of moderate to severe plaque psoriasis in adult patients who are
candidates for systemic therapy.
The recommended dose is 210 mg administered by subcutaneous injection at weeks 0, 1, and 2 followed
by 210 mg every 2 weeks.
Consideration should be given to discontinuing treatment in patients who have shown no response after
12-16 weeks of treatment. Some patients with initial partial response may subsequently improve with
continued treatment beyond 16 weeks.
Type of Application and aspects on development
This application concerns a centralised procedure (according to Regulation (EC) No 726/2004),
mandatory scope (Article 3(1)), Annex (1) Biotech medicinal product. The application has been submitted
in accordance with Article 8.3 in Directive 2001/83/EC (i.e. dossier with administrative, quality,
non-clinical and clinical data), as new active substance.
Scientific Advice from EMA was requested for brodalumab (by Amgen) with regards to quality issues
(EMEA/H/SA/2172/1/2011/I, 22 September 2011) and clinical development in other indication (psoriatic
arthritis, EMEA/H/SA/2172/2/2013/II, 25 July 2013). The Applicant did not request CHMP Scientific
Advice on clinical development in psoriasis for this product.
Pursuant to Article 7 of Regulation (EC) No 1901/2006, the application included an EMA Decision
P/0235/2014 on the agreement of a paediatric investigation plan (PIP) for the treatment of chronic severe
plaque psoriasis. The PIP and request for a waiver for brodalumab was submitted in 2013
(EMEA-001089-PIP02013). The PDCO opinion (P/0235/2014) granted a waiver with respect to the
population from birth to less than 4 years old and a deferral for studies in population from 4 to 18 years
of age for completion of studies by January 2026. At the time of submission of the application, the PIP
P/0235/2014 was not yet completed as some measures were deferred.
2.2. Quality aspects
2.2.1. Introduction
Brodalumab is a recombinant fully human IgG2 monoclonal antibody directed against human
interleukin-17 receptor A (IL-17RA). Brodalumab is produced in Chinese Hamster Ovary (CHO) cells.
Kyntheum is presented as a solution for subcutaneous injection in a single-use Type I glass pre-filled
syringe (PFS) with stainless steel 27G x ½” needle (covered with an elastomeric needle cap). Each PFS
contains 210 mg of brodalumab formulated with proline, glutamate, polysorbate 20 and water for
injections in a 1.5 mL solution. Each pack of Kyntheum contains two PFS.
2.2.2. Active Substance
General Information
Brodalumab is a human monoclonal IgG2 immunoglobulin that specifically binds with high affinity to the
human interleukin-17 receptor A (IL-17RA) and blocks the biological activities of IL-17A, IL-17F, IL-17A/F

Assessment report
EMA/381484/2017 Page 11/135
heterodimer, and IL-25. It contains 18 disulfide bonds and a N-linked glycosylation site at Asn292 on each
heavy chain. The molecular mass is 146.8 kDa (143.8 kDa deglycosylated).
Manufacture, characterisation and process controls
Process description
The brodalumab active substance is manufactured at Immunex Rhode Island, 40 Technology Way, West
Greenwich, RI 02817, USA.
The brodalumab active substance manufacturing comprises typical production steps, i.e. cell culture
expansion starting from a Working Cell Bank (WCB) vial of brodalumab in a bioreactor, harvesting,
purification and formulation.
The brodalumab active substance container closure system is a container sealed with a screw cap closure.
Control of materials & intermediates
No raw materials derived from animal origin are used during the active substance manufacture. The
Applicant uses a tiered quality strategy for raw materials, consisting of supplier qualification, routine
testing, and auditing to ensure reliable performance against requirements. Qualification consists of
auditing the supplier, testing raw materials and establishing Quality Agreements.
The development of fully human monoclonal antibodies directed against human IL-17A receptor was
undertaken.
A two-tiered cell banking system of MCB and working cell bank (WCB) was generated in accordance with
cGMP. The MCB and WCB vials are maintained in controlled conditions.
Testing and characterisation of the MCB and WCB were performed according to the ICH Q5D guideline.
The MCB and WCB are sterile and free of detectable mycoplasma and viruses
Any new WCB will be created from a MCB vial following established manufacturing procedures as
described and will be qualified to ensure comparability to the existing WCB with respect to safety, genetic
stability, cell viability after thaw, cell growth, protein production and product quality.
Control of critical steps & intermediates
The brodalumab integrated control strategy incorporates operational controls as well as in-process,
specification, and periodic testing controls. The integrated control strategy reflects knowledge of product
attributes and their potential to impact patient safety and product efficacy, as well as an understanding of
the means by which these attributes are controlled through integrated control elements during active
substance manufacturing. As part of the lifecycle management of the commercial process, these
assessments are reviewed periodically and updated as needed to ensure that the most current knowledge
of the product and process are incorporated into the integrated control strategy.
The control strategy includes:
- Input controls (e.g. raw materials);
- Procedural controls (e.g. process design and operational controls);
- Testing controls, which include controls applied to all lots (e.g., in-process controls (IPCs), active
substance (and finished product) specification testing), and periodic controls (e.g., process validation,
product comparability, and stability testing).
Assessment report
EMA/381484/2017 Page 12/135
IPCs are performance indicators (outputs) used to evaluate in-process performance. Limits for IPCs are
categorised as performance indicator, rejection limit, action limit, control limit and in-process controls.
The IPCs are part of a comprehensive analytical control strategy. IPCs which impact critical quality
attributes are designated as critical.
Product quality IPCs include product- and process-related impurities, product-related substances and
general quality attributes. The justification for selection of product quality IPCs and limits are presented.
These process-related impurity IPCs and their associated limits have been selected for testing in routine
production based on process understanding and product quality considerations.
Results from extensive characterisation and challenge studies performed during brodalumab
development demonstrate that process-related impurity levels are consistently reduced to low levels.
Process validation
The process validation lifecycle of the brodalumab active substance process started with the process
design stage (Process Evaluation) where development of product and process understanding led to design
of the manufacturing process, evaluation at pilot scale and establishment of the commercial control
strategy. The completion of the process design stage led to the start of the qualification stage (Process
Verification) of the process which is followed by continued process verification (Ongoing Process
Verification) to provide ongoing assurance during commercial manufacturing that the process remains in
a state of control.
Characterisation studies demonstrated control of product quality and process consistency when the
process is operated within defined ranges. The integrated product and process knowledge was used to
establish the various elements of the control strategy, including identification of process parameters and
performance indicators and their associated ranges.
The brodalumab commercial manufacturing process was validated. Acceptance criteria for performance
indicators were established. Main process validation for brodalumab included cell culture, harvest and
purification.
Brodalumab active substance is transported without impact to product. All shipping containers were
qualified to demonstrate that temperature is controlled for a predefined temperature range and duration.
Manufacturing process development
Analytical data are provided supporting comparability of the active substance during development. The
overall strategy for demonstration of comparability throughout development was based on considerations
outlined in the ICH Q5E.
Characterisation
Brodalumab was characterised using biochemical, biophysical, biological and forced degradation studies
to provide a comprehensive understanding of its structural and functional properties and to support an
assessment of the criticality of product quality attributes.
Specification
The specifications include control of identity, purity, potency and other general tests.
Batch data
Batch analyses data, for all brodalumab active substance lots used during clinical development and for
product manufactured at the commercial manufacturing facility have been provided. The batch analyses
data demonstrate that brodalumab active substance can be manufactured reproducibly to a high level of

Assessment report
EMA/381484/2017 Page 13/135
purity, with very low levels of impurities and consistent levels of minor product variants throughout
development.
Reference standards of materials
Brodalumab reference standards have been produced and the history of the reference standards has been
provided. The specified primary reference standard will be used to qualify future primary and working
reference standards which will be created, as needed, to ensure sufficient supply for release and stability
testing. The reference standard stability data has also been provided. In addition, the lot that will be used
to test commercial active substance and finished product lots upon its implementation has been specified.
Stability
The stability studies were performed in accordance to ICH Q5C. Stability studies were conducted to
support the proposed shelf-life.
2.2.3. Finished Medicinal Product
Description of the product and Pharmaceutical Development
The finished product is supplied as a sterile, single-use, preservative-free solution for subcutaneous
injection in a pre-filled syringe (PFS). The presentation contains 140 mg/mL brodalumab in glutamate,
proline, and polysorbate 20, filled to deliver a volume of 1.5 mL to provide 210 mg of brodalumab.
The main changes during the development of the 140 mg/mL PFS are the manufacturing site, the primary
container (different syringes) and the manufacturing scale.
Results of lot release and stability testing and additional characterisation studies were comparable for the
commercial product.
The container closure system complies with Ph. Eur. requirements. Integrity from microbial
contamination has been demonstrated. Compatibility studies include extractables, leachables and
sorption. The results give no reason for concern.
Manufacture of the product and process controls
Process description
The process includes active substance thaw, formulation (active substance pooling and mixing),
bioburden reduction filtration, filtered formulated finished product hold, sterile filtration, aseptic filling
and plunger-stopper placement, inspection and storage.
Process validation
Process validation consisted of process design and characterisation studies. All IPCs and relevant process
parameters were met, batch homogeneity was confirmed, and the validation batches passed the
commercial release specifications, demonstrating consistency of the manufacturing process.
Product specification
The finished product test methods and acceptance criteria include control of identity, purity, potency and
other general tests.

Assessment report
EMA/381484/2017 Page 14/135
The same reference standards are used for both brodalumab active substance and finished product
testing.
Stability of the product
Stability data for finished product filled in the 1.5 mL prefilled syringe (PFS) are available.
Stability data up to 48 months were provided for the PFS to further support the proposed shelf life of 48
months at 5°C.
On the basis of the data provided, the acceptable shelf life is 4 years stored at 2°C-8°C.
Kyntheum may be stored at room temperature (up to 25°C) once, in the outer carton, for a maximum
single period of 14 days. Once Kyntheum has been removed from the refrigerator and has reached room
temperature (up to 25°C) it must either be used within 14 days or discarded.
Adventitious agents
The information provided on non-viral adventitious agents is sufficient. No material of animal origin is
used in the manufacturing process of brodalumab.
Virus safety evaluation of the cell banks was performed in accordance with ICH Q5A.
Virus clearance studies were performed using appropriate model viruses (xenotropic murine leukemia
virus (XMuLV), pseudorabies virus (PRV), reovirus type 3 (Reo-3), and/or minute virus of mice (MMV)).
The results of the virus clearance studies show acceptable reduction of the model virus studied.
2.2.4. Discussion on chemical, pharmaceutical and biological aspects
Active substance
Manufacture
The active substance production process steps are standard for monoclonal manufacture and have been
appropriately described. Holding times for product intermediates provided were supported by small-scale
characterisation studies to evaluate the chemical stability. The Applicant’s approach as regards the pool
holds which are controlled within the validated hold times but may be extended within the characterised
acceptable hold times through additional validation studies, is considered acceptable. As per request, the
maximal holding time for the low pH pool was reduced.
Control of materials
The presence of the heavy chain variant is one of the main observations of the brodalumab dossier. Its
presence has been the subject of EMA Scientific advice (EMEA/H/SA/2172/1/2011/1). The CHMP
concluded that the variant could be considered as a product-related substance provided the variant was
qualified. Upon request, a rejection limit is set for the heavy chain variant.
Control of critical steps & intermediates
Rejection limits are set for safety-related cIPC. Action limits were set for critical IPCs (cIPCs). Upon
request, these were changed to rejection limits for those cIPCs for which no active substance specification

Assessment report
EMA/381484/2017 Page 15/135
is proposed. In addition, detailed description for the analytical procedures controlling these quality
attributes and their validation is provided, demonstrating suitability for their intended use.
Process validation
Results from the process validation studies indicate that the process consistently delivers product that
meets the acceptance criteria. The requested information on the process demonstrates that mid-range
target settings have been used (as is appropriate for the PPQ runs).
Manufacturing process development
Extensive information is provided on the process characterisation which has resulted in good process
understanding of both upstream (cell culture and harvest) and downstream processes (purification).
Upon request, further detailed information and clarification is provided on the various QbD elements used
in the process characterisation studies. In general, the additional information gives no reason for concern.
Characterisation
The information on product characterisation gave rise to a number of other concerns that have been
satisfactorily addressed by the Applicant. The additional information provided supports the applicant’s
position that brodalumab has no complement-dependent cytotoxicity (CDC) and antibody-dependent
cellular cytotoxicity (ADCC) activity. As per request, the Applicant provided an additional study
investigating the effect of partial reduction of brodalumab on its potency. Taken together, the answer is
considered acceptable.
Control of active substance
The provided analytical method descriptions and validation reports are sufficient.
The Applicant explained the integrated control strategy employed for brodalumab active substance in
detail. Severity, occurrence and detection scores have been defined and assigned. The overall approach
that is used to determine risk levels is considered reasonable.
As indicated in ICH guideline Q6B, the setting of specifications for active substance and finished product
is part of an overall control strategy which includes control of raw materials and excipients, in-process
testing, process evaluation or validation, adherence to Good Manufacturing Practices, stability testing,
and testing for consistency of lots. When combined, all these elements provide assurance that the
appropriate quality of the product will be maintained.
Initially, the Applicant proposed to apply limited active substance routine release testing However,
because also limited IPCs are envisaged, assurance of product quality would rely largely on the control of
manufacturing process conditions (i.e. by control of process parameters) during commercial production.
This strategy was not accepted; a Major Objection and several related Other Concerns were raised
because the proposed control strategy was considered too limited. In response, the Applicant revised its
testing strategy. All quality attributes that are tested as critical IPCs and other tests have been added to
the active substance release specification testing with their respective rejection limit(s). In general, the
revision of the control strategy sufficiently addresses the concerns raised and the Major Objection was
considered solved.
Stability
Updated stability data from ongoing real-time studies provided during the review further support the
proposed shelf life.

Assessment report
EMA/381484/2017 Page 16/135
Finished product
Manufacturing process and development
The finished product (140 mg/mL brodalumab in pre-filled syringe (PFS); fill volume 1.5 mL)
manufacturing process and development are sufficiently described. No critical process parameters have
been identified in the manufacturing process. This is acceptable as process conditions can be well
controlled and monitored.
Process validation
The finished product manufacturing process is appropriately validated. Validation of hold-times, filters,
aseptic process, and transport were included. All IPCs and relevant process parameters were met, batch
homogeneity was confirmed, and the validation batches passed the commercial release specifications,
demonstrating consistency of the manufacturing process.
Finished product control
The initially proposed finished product specification was considered too limited to ensure consistent
product quality at release and during shelf life as no criteria were defined for finished product potency,
and important tests, for example to control product-related impurities and ensure process consistency,
were missing. This issue was raised as a Major Objection. In their response, the Applicant extended the
finished product specifications with additional tests. This is considered to solve the Major Objection.
Upon request, the acceptance criteria for endotoxin, HMW-species, and clarity were justified or revised.
Stability
The proposed finished product shelf life is based on 48 months stability data from ‘primary’ lots that are
not fully representative of the commercial finished product. Data from representative lots were limited to
3 months stability, but were updated with additional stability data during the procedure. The results are
in line with the results from the primary lots mentioned above. The available stability data are considered
sufficient to support the proposed shelf life of 48 months at 5°C.
Adventitious agents
The adventitious agents safety evaluation gives no reason for concern.
2.2.5. Conclusions on the chemical, pharmaceutical and biological aspects
Overall, the quality of Kyntheum is considered to be in line with the quality of other approved monoclonal
antibodies. The different aspects of the chemical, pharmaceutical and biological documentation comply
with existing guidelines. The fermentation and purification of the active substance are adequately
described, controlled and validated. The active substance is well characterised with regard to its
physicochemical and biological characteristics, using state-of-the-art methods, and appropriate
specifications are set. The manufacturing process of the finished product has been satisfactorily described
and validated. The quality of the finished product is controlled by adequate test methods and
specifications.
Viral safety and the safety concerning other adventitious agents including TSE have been sufficiently
assured.
The overall quality of Kyntheum is considered acceptable when used in accordance with the conditions
defined in the SmPC.

Assessment report
EMA/381484/2017 Page 17/135
2.2.6. Recommendation for future quality development
In the context of the obligation of the MAHs to take due account of technical and scientific progress, the
CHMP recommended a point for investigation.
2.3. Non-clinical aspects
2.3.1. Introduction
The pivotal toxicology and toxicokinetic studies were performed in accordance with GLP. No scientific
advice was obtained from the CHMP regarding non-clinical matters.
2.3.2. Pharmacology
Primary pharmacodynamic studies
Brodalumab is a human monoclonal IgG2 antibody indicated for the treatment of psoriasis, expressed in
a Chinese hamster ovary (CHO) cell line. Brodalumab binds with high affinity to human interleukin-17
receptor A (IL-17RA) and blocks the biological activities of multiple IL-17 family cytokines including
IL-17A, IL-17A/F, IL-17F, and IL-25. Brodalumab partially inhibits the biologic activity of IL-17C at a high
dose. Brodalumab did not bind to (recombinant) human IL-17RB or IL-17RC expressed in mouse
fibroblasts.
Brodalumab inhibited IL-6 mRNA production induced by IL-17A plus TNFα in human whole blood in a
dose-dependent manner. Brodalumab inhibited growth-regulated oncogene alpha (GROα) production
induced by IL-17A, IL-17F or heterodimeric IL-17A/F in human foreskin fibroblasts, human lung
fibroblasts and human dermal fibroblasts in a dose-dependent manner (IC50 mostly 21 – 96 pM, in one
experiment in lung fibroblasts 660 pM). Brodalumab inhibited IL-5 production induced by IL-25 plus IL-2
in human peripheral blood mononuclear cells in a dose-dependent manner. IL-17C was only partially
inhibited by brodalumab in human epidermal keratinocytes (inhibition of 40% of IL-17C- plus
TNFα-induced production of beta-defensin 2 gene at 1 µM).
Brodalumab was found to bind to lymphocytes, macrophages, histiocytes, and dendritic cells, to
myocytes (smooth myocytes and striated skeletal myocytes) and myofibroblasts and to epithelial cells.
Brodalumab binding was largely comparable in human, monkey and rabbit tissues. The binding pattern
largely corresponds to reported expression of IL-17RA, although IL-17RA expression has also been
reported on osteoblasts and endothelial cells.
Brodalumab showed cross-reactivity with IL-17RA from cynomolgus monkeys; IL-6 production, induced
by IL-17A or IL-17F, was inhibited in monkey dermal fibroblasts with comparable potency as in human
dermal fibroblasts (IC50 human 33-143 ng/ml and monkey 33-383 ng/ml if induced by IL-17A and IC50
human 0.29-2.46 ng/ml and monkey 0.83-54 ng/ml if induced by IL-17F). Brodalumab also inhibited IL-6
production from rabbit dermal fibroblasts, but with considerably less potency (IC50 2670 ng/ml). No
cross-reactivity was found with rat or mouse IL-17RA. Due to consistently high background staining, it
was not possible to determine brodalumab binding to dog IL-17RA.
In order to demonstrate the proof of concept, in vivo activity was investigated using surrogate antibodies
against mouse IL-17RA. Surrogate antibodies that were used were M750, a rat anti-mouse IL-17RA
monoclonal antibody IgG2b, and M751, a chimeric rat anti-mouse IL-17RA monoclonal antibody with a
mouse IgG1. In a mouse model of skin inflammation induced by 12-O-tetradecanoylphorbol-13-acetate
Assessment report
EMA/381484/2017 Page 18/135
(TPA), prophylactic treatment with M751 at 500 µg IP (application of TPA twice with M751 treatment one
day earlier) diminished epidermal hyperplasia and inflammatory cells in the dermis and prevented
parakeratotic scaling and the formation of intra-epidermal pustules. Also the upregulation of a number of
inflammation-related chemokines and cytokines was inhibited by M751. The activity of M750 and M751
was also investigated in mouse models of arthritis and asthma. These studies confirmed the ability of
M750 / M751 to inhibit IL-17RA-mediated effects in inflammatory diseases in vivo.
Secondary pharmacodynamic studies
IL-17 cytokines play a role in a range of homeostatic and pathogenic processes. Consequently, blockade
of IL-17RA may have unintended consequences. To address this concern, the applicant has performed a
review of published literature on IL-17RA, IL-17A and Th17 cells.
Non-clinical data are conflicting regarding the role of IL-17 signalling in murine models of inflammatory
bowel disease. In some murine models of chemically-induced colitis, the absence of IL-17A, IL-17F, or
IL-17RA appears to be protective, while in others no effect was found or the use of IL-17A or IL-17RA
neutralizing antibody or knockout mice resulted in worsening of the disease.
Non-clinical data revealed no clear evidence of neutropenia in the toxicology studies in cynomolgus
monkeys, except at the highest administered dose, in the 1-month study.
Data from the literature from mouse models of infection and the mechanism of action of brodalumab
suggest a potential for an increased risk of infections. In mouse models of infection of multiple origins,
genetic deletion of IL-17RA, IL-17A/IL-17F, or pharmacologic neutralization of IL-17A resulted in
aggravation of the infection. In the 6-month study with brodalumab performed in cynomolgus monkeys,
there was also some evidence of infections: treatment-related skin lesions were observed which were
sometimes associated with yeast or bacteria and minimal to slight glossitis was sometimes associated
with the presence of yeast.
Repeated dose studies regarding safety pharmacology and histopathology do not indicate a significant
risk of cardiovascular events. Studies with cynomolgus monkeys revealed no histopathological effects on
the CNS or overtly abnormal behavioural effects. It is not known whether brodalumab is distributed to the
brain, but IgG antibodies can reach the brain, though in low amounts.
A hypothetical effect, based on the mechanism of action, is a reduction of vaccination effectiveness.
However, data with brodalumab in monkeys do not indicate a clear risk of a reduction of vaccination
effectiveness (no effects were observed on organs/tissues of the immune system and no clear effect on
the T-cell dependent antibody response).
Safety pharmacology programme
Safety pharmacology evaluations were incorporated in the repeat dose toxicology studies in cynomolgus
monkeys. No effects were observed on heart rate, ECG, blood pressure and respiration. A functional test
of the central nervous system was not performed, as a functional observational battery in rodents was not
possible because brodalumab is not pharmacologically active in rodents. However, clinical observation of
monkeys in the toxicology studies and macroscopic and microscopic evaluation of the brain and spinal
cord did not reveal indications for neurobehavioral effects.
Pharmacodynamic drug interactions
No specific nonclinical drug interaction studies were conducted as no drug-drug interactions were
expected based on the putative mechanism of brodalumab.

Assessment report
EMA/381484/2017 Page 19/135
2.3.3. Pharmacokinetics
The pharmacokinetics of brodalumab has been investigated upon a single dose intravenous and
subcutaneous administration in monkeys. Multiple dose toxicokinetics was examined mainly upon weekly
SC administration, which is the intended clinical route, in monkeys and pregnant monkeys and pregnant
rabbit. IV multiple dose toxicokinetics was examined in monkey 1-month toxicology study.
Unbound serum brodalumab concentrations in rabbit and cynomolgus monkey serum and milk were
determined using a validated ELISA method with a lower limit of quantification of 50 ng/mL. Binding
anti-brodalumab antibodies in serum of monkey and rabbit were detected using a validated
electrochemiluminescent bridging immunoassay. Anti-brodalumab positive samples from monkeys were
further analysed for neutralizing antibodies in a validated cell-based bioassay.
In general, administration of brodalumab to cynomolgus monkey resulted in a more or less
dose-proportional increase in Cmax over a dose range 0.5 mg/kg to 200 mg/kg and a greater than
dose-proportional increase in AUC over a dose range 0.5 mg/kg to 5 mg/kg and a dose-proportional
increase in AUC over a dose range of 5 to 350 mg/kg.
Based on AUC after SC administration compared to AUC after IV administration, SC bioavailability in
monkeys was 44 – 74% after single dose administration of 0.5 – 200 mg/kg and 31 – 52% after repeated
dose administration of 350 mg/kg/week.
After repeated dose subcutaneous administration for up to 6 months, no gender differences and no
unanticipated accumulation were found. Upon subcutaneous administration to monkey absorption was
relatively slow, having Tmax at 48 – 72 hrs after administration on the first day and 24 – 48 hrs upon
multiple dosing.
Formal tissue distribution studies with brodalumab were not conducted, which was agreed by CHMP
considering that IgG antibodies have limited diffusional distribution from serum to tissue due to their
molecular size.
Placental transfer and excretion in milk was evaluated in a cynomolgus monkey maternal, embryo-fetal,
and neonatal toxicity study.
The low volume of distribution in cynomolgus monkeys ranging between 15 and 224 ml/kg suggests a
distribution to the plasma and the extravascular fluid as it is within 2 to 5 times that of plasma volume (45
mL/kg). This is consistent with the known biodistribution of monoclonal antibodies.
Evidence of placental transfer of brodalumab was provided by neonatal exposure in some infants at 25
and 90 mg/kg on birth days 14 (both doses) and 28 (90 mg/kg only) and levels were comparable to or
slightly higher than maternal serum levels. Brodalumab was present in maternal milk at 90 mg/kg on
postpartum day 14 only, at very low levels as compared to maternal serum levels (0.1%). However no
milk sample was analysed immediately after parturition. As an IgG, brodalumab would be expected to be
present in the first milk. Information on distribution into milk has been included in section 4.6 of the
SmPC.
No metabolism studies with brodalumab were conducted in animals. The absence of metabolism studies
is in accordance with ICH S6(R1).
As brodalumab is a monoclonal antibody, no renal excretion is anticipated due to its molecular size
therefore, no specific studies to measure excretion of brodalumab were conducted. The absence of
excretion studies is in accordance with ICH S6(R1).
Drug-drug interaction at the PK level is highly unlikely for this type of product since biotechnology-derived
substances do not metabolize via CYP P450 enzymes.

Assessment report
EMA/381484/2017 Page 20/135
2.3.4. Toxicology
Single dose toxicity
In line with ICH S6 (R1) single dose toxicity studies have not been conducted.
Repeat dose toxicity
Repeat-dose toxicity studies were performed in cynomolgus monkeys, because comparable potency was
shown for brodalumab for the inhibition of monkey IL-17RA compared to human IL-17RA, whereas
brodalumab does not cross-react with rodent IL-17RA and assessment of binding to dog IL-17RA was
inconclusive.
Table 1: Repeat-dose toxicity studies with brodalumab
Study ID
Species/Sex/ Number/Group
Dose/Route mg/kg/week
Duration NOAEL (mg/kg)
Major findings
107059 Monkey 5/sex/group including 2/sex/group recovery
SC: 0, 25, 90, 350 IV: 350
4 weeks + 13 weeks recovery
350
• no brodalumab-related adverse effects
• at 350 mg/kg, small areas of broken, crusted skin; these areas were partly associated with ulcers or inflammation; findings were reversible
107713 Monkey 6/sex/group including 2/sex/group recovery
SC: 0, 25, 90, 350
3 months + 17 weeks recovery
90
• at 350 mg/kg, brodalumab-related adverse effects at injection sites: - increased incidence of discoloration, thickening, and/or crusting; - slight to marked, subacute to chronic histiocytic inflammation - abscess at injection site in 1 F
• at 90 mg/kg: macroscopic and microscopic injection site findings less-severe, non-adverse
• evidence for reversibility of inflammation at injection sites

Assessment report
EMA/381484/2017 Page 21/135
Study ID
Species/Sex/ Number/Group
Dose/Route mg/kg/week
Duration NOAEL (mg/kg)
Major findings
107714
Monkey 4/sex/group + 2/sex/group recovery control + high dose group
SC: 0, 10, 25, 90 6 months + 6 months recovery
10
• no brodalumab-related adverse effects
• increased incidence of red and/or dry skin or erythema at 25 and 90 mg/kg correlating with increased incidence/severity of acanthosis/hyperkeratosis; sometimes with increased numbers of commensal yeast/bacteria minimal to slight superficial lymphocytic dermatitis evidence for reversibilty
• slight increase in incidence of submucosal glossitis; occasionally associated with presence of intracorneal fungal hyphae
•increased incidence and/or severity of inflammation at injection sites at ≥ 25 mg/kg; reversible
• findings considered 2° to inflammation: - increased severity of myeloid hypercellularity in sternal bone marrow - increase in absolute neutrophil count at end of treatment)
SC=subcutaneous; IV=intravenous; neut=neutrophils
The exposure in the repeated dose studies was sufficiently high compared to the human exposure and
compared to the IC50 of brodalumab in the in vitro pharmacology tests.
Mild, focal skin effects (crusts, acanthosis / hyperkeratosis, minimal inflammation) were found
consistently in all studies. With longer duration, these effects occurred at lower doses. In the 6-month
study, minimal to slight glossitis was found, sometimes associated with the presence of yeast. Also in the
6-month study, the skin findings described above were sometimes associated with increased numbers of
yeast and/or bacteria.
Literature data from mouse infection models with genetic deletion or pharmacologic neutralization of
IL-17RA, IL-17A or IL-17F suggest a potential to increase the incidence of infections.
Apart from the skin, the tongue and the injection site, no target organs for toxicity were found and no
clear effect on the T-cell dependent antibody response in a KLH test.
Table 2: Toxicokinetics of brodalumab in cynomolgus monkeys (AUC based on antibody-free animals) as well as antibody formation in the repeated dose studies
Study ID
Dose (mg/kg/week)
Study day
Animal AUC0-168h (µg.h/ml)
Antibody formation (incidence*)
Animal:Human Exposure Multiple**
♂ ♀ Antibodies Neutralising ♂ ♀
107059 25 SC 1 22
21300 31800
20100 32000
6/10 4/10 3.7 5.5
3.4 5.5
107059 90 SC 1 22
70000 106000
70400 98700
5/10 3/10 12 18
12 17

Assessment report
EMA/381484/2017 Page 22/135
107059 350 SC 1 22
213000 311000
212000 338000
4/10 2/10 37 53
36 58
107059 350 IV 1 22
677000 917000
462000 647000
3/10 0/10 116 157
79 111
107713 25 SC 1 78
21700 39800
23800 53200
6/12 4/12 3.7 6.8
4.1 9.1
107713 90 SC 1 78
88600 175000
74500 143000
4/12 0/12 15 30
13 25
107713 350 SC 1 78
316000 518000
303000 506000
4/12 1/12 54 89
52 87
107714 10 SC 1 92 176
7520 18000 23300
5250 14900 20600
4/8 3/8 1.3 3.1 4.0
0.9 2.6 3.5
107714 25 SC 1 92 176
20900 45400 51600
21900 32900 29200
2/8 1/8 3.6 7.8 8.8
3.8 5.6 5.0
107714 90 SC 1 92 176
60900 117000 175000
58100 119000 145000
6/12 5/12 10 20 30
10 20 25
* No. of animals with antibodies / total no. of animals in group
** Based on human AUC of 5832 µg.h/ml, based on steady state pharmacokinetics following dose of 210 mg SC every
2 weeks to psoriasis patients
Genotoxicity
Brodalumab is a monoclonal antibody composed entirely of naturally-occurring amino acids and contains
no inorganic or synthetic organic linkers or other nonprotein portions. Thus, it is highly unlikely that
brodalumab would react directly with DNA or other chromosomal material. In accordance with
ICHS6(R1), no genotoxicity studies were conducted.
Carcinogenicity
In line with ICH S6 (R1), a weight-of-evidence approach was applied to evaluate the carcinogenic
potential of brodalumab.
A risk assessment was provided based on published literature and data from the repeated dose studies
with evaluation of generalized immune suppression. In the literature, both pro-tumorigenic and
anti-tumorigenic effects of the IL-17 pathway have been described. Overall, there does not seem to be an
indication for a dominant anti-tumorigenic effect of IL-17. Also, the absence of effects on the organs of
the immune system and the absence of a significant effect on the T-cell dependent antibody response to
KLH indicate that brodalumab is not a general immunosuppressant.
Reproduction Toxicity
Fertility-related endpoints were included in the 6-month repeat dose toxicity study in sexually mature
cynomolgus monkeys, where there were no brodalumab-related effects on sperm motility, density, or
morphology or on organ weights and microscopic evaluation of reproductive organs. Reproductive and
developmental toxicity studies included a dose range-finding study in rabbits and an enhanced pre- and
postnatal developmental toxicity study in cynomolgus monkeys. The rabbit study was limited by
immunogenicity and the rabbit was not further used for evaluation of reproductive and developmental
toxicity.
Table 3: Reproductive toxicity studies with brodalumab
Study type/ Study ID /
Species; Number
Route & dose
Dosing period Major findings NOAEL (mg/kg

Assessment report
EMA/381484/2017 Page 23/135
GLP Female/ group
(mg/kg) &AUC)
Embryo-fœtal development (dose-range)/ 106489/ GLP
Rabbit 7F/group
SC: 0, 25, 90, 350
GD 7 and 14 sacrifice GD 29
≥25: F0: abortion; immune complex deposits in kidney; F1: fetal bw
≥90: F0: bw loss post-dose; food cons. post-dose;
kidney glomerular damage due to immune complex deposits 350: F0: mortality(1 F)
F0: <25 F1: <25
Enhanced peri & postnatal/ 107716/ GLP
Cynomolgus monkey 16-19 F/group
SC: 0, 25, 90
weekly GD20 – parturition (approx. GD160); natural delivery; 6 month follow-up females and infants; sacrifice infants BD 180
90: F1: one case of neonatal death due to septicaemia likely of umbilical origin may be brodalumab-related
F0: 90 F1: 25
F=female; SC=subcutaneous; GD=gestation day; bw=body weight; BD=day after birth
In accordance with ICH S6(R1) no fertility studies were conducted. In the repeated dose studies, no
effects were observed on the reproductive organs or on sperm motility, count and morphology
Serum concentrations in monkey infants and in foetal rabbits indicate considerable passage of
brodalumab from the mother to the foetus at the end of pregnancy.
No adverse effects were found on the embryo-foetal development of cynomolgus monkeys.
No significant effects were found on pre- and postnatal development of cynomolgus monkeys.
Only a very small amount of brodalumab was found in milk of high dose animals on post-natal day 14. No
milk sample was analysed immediately after parturition.
Table 4: Toxicokinetics in the rabbit reproductive toxicity study as well as antibody formation (AUC and serum concentrations based on all animals) Study ID
Dose (mg/kg/
week)
Study day Animal AUC0-168
h (µg.h/ml)
Serum concentration maternal and
foetus/infant (µg/ml)
Antibody formation (incidence*)
Maternal Fœtus Antibodies Neutralising
106489 25 SC GD7 GD14 GD29
30900 13100
<0.05
<0.05
7/7 $
106489 90 SC GD7 GD14 GD29
120000 124000
<0.05 – 12.9
46 (<0.05 – 118)
7/7
106489 350 SC GD7 GD14 GD29
451000 615000
25 (<0.05 – 135)
202 (17.4 – 547)
5/6
GD=gestation day; SC=subcutaneous
* No. of animals with antibodies / total no. of animals in group
$ Neutralising antibodies were not analysed in the rabbit study
Table 5: Toxicokinetics in the monkey reproductive toxicity study as well as antibody formation (AUC and serum concentrations based on all animals)

Assessment report
EMA/381484/2017 Page 24/135
Study ID
Dose (mg/kg/
week)
Study day Animal AUC0-168
h (µg.h/ml)
Serum concentration maternal and
foetus/infant (µg/ml)
Antibody formation (incidence*)
Maternal Infant Antibodies Neutralising
107716 25 SC GD20-22 GD139-141 PPD14 PPD28, 91, 180
25300 19000
6.7 (<0.05 – 31) <0.05
14(<0.05 – 144) <0.05
Mothers 13/19 Infants 4/11
Mothers 5/13 Infants 2/4
107716 90 SC GD20-22 GD139-141 PPD14 PPD28 PPD91, 180
84600 77500
95 (<0.05 – 247) 12 (<0.05 – 52) <0.05
108 (15 – 169) 31 (<0.05 – 108) <0.05
Mothers 11/16 Infants 2/10
Mothers 2/11 Infants 0/2
GD=gestation day; PPD=post-partum day; SC=subcutaneous
* No. of animals with antibodies / total no. of animals
Local Tolerance
Subcutaneous administration of the formulation containing 140 mg/ml brodalumab caused very slight to
well-defined erythema and moderate to severe edema in rabbits, whereas no erythema or edema were
observed after administration of two formulations containing 70 mg/ml. Microscopically there were
however no differences between the formulations. In the repeated dose studies, dose concentrations
administered SC to monkeys were all up to approximately 70 mg/ml. Treatment-related reactions such as
inflammation and scabs at the injection site were observed in the 3-month and 6-month studies.
Other toxicity studies
Immunotoxicity was investigated in cynomolgus monkeys by means of standard endpoints in repeated
dose toxicity studies as well as immunophenotyping and T-cell dependent antibody response assays (KLH
test) in adult and in juvenile monkeys. No significant effects were observed. There was however a
tendency for a decreased IgG response in infants exposed to brodalumab in utero. Literature data suggest
an increased risk of infections and evidence for infection was also found in the 6-month repeated dose
study and possibly also in the case of a monkey infant that died from septicaemia likely of umbilical origin.
2.3.5. Ecotoxicity/environmental risk assessment
Brodalumab is an antibody; brodalumab is considered to be a non-hazardous, biodegradable product. As
such, the environmental risk in terms of use and disposal is considered to be negligible, and in accordance
with the Guideline on the Environmental Risk Assessment of Medicinal Products for Human Use
(EMEA/CHMP/SWP/4447/00 corr 2, 1 June 2006), ERA studies are not required.
2.3.6. Discussion on non-clinical aspects
The proof of concept for brodalumab was demonstrated in a mouse model of skin inflammation by the use
of surrogate antibodies against mouse IL-17RA. The inhibition of IL-17RA in this disease model resulted
in inhibitory effects which are relevant for the indication.
Data from the literature suggest an increased risk of infections, which was confirmed by some
observations in the 6-month monkey study. On the other hand, no effect was observed on organs/tissues

Assessment report
EMA/381484/2017 Page 25/135
of the immune system and on the T-cell dependent antibody response in adult monkeys. The risk of
infections may therefore not be particularly high in adults. Because T-cell immunity is decreased during
pregnancy, the risk of infections may be higher in neonates than in adults.
It is not possible to draw a conclusion regarding a potential effect of brodalumab on suicidal behaviour
based on non-clinical data. Literature data are diverse and its interpretation is hampered by the fact that
it often concerns IL-17 inhibition, while brodalumab inhibits the receptor, and not the ligand. Because
literature suggests that IgG antibodies can reach the brain, though in low amounts, and that the
Th17/IL-17 axis can play a role in depression, it can only be concluded that some influence of brodalumab
on behavioural processes cannot be completely excluded.
Effects on skin were found in the monkey studies which were not limited to the sites of injection. In a local
tolerance study in rabbits, moderate to severe oedema was observed at the clinical concentration of 140
mg/ml brodalumab. Considering the indication for brodalumab, which is psoriasis, these findings could
potentially be considered adverse. However, the events were of mild character and there was absence of
effect on the wellbeing of the animals. Also, these were not observed in humans and in clinical studies,
worsening of psoriasis due to brodalumab treatment was not observed. As such, this was not considered
to be a major safety concern.
Otherwise, brodalumab was tolerated well in the repeated dose studies.
Carcinogenicity studies with brodalumab have not been conducted. However, there were no proliferative
changes in cynomolgus monkeys administered weekly subcutaneous doses of brodalumab at 90 mg/kg
for 6 months (AUC exposure 47-fold higher than in human patients receiving Kyntheum 210 mg every 2
weeks). The mutagenic potential of brodalumab was not evaluated; however, monoclonal antibodies are
not expected to alter DNA or chromosomes.
It is unknown whether brodalumab passes the placenta. For an antibody it seems unlikely that it will pass
the placenta during the first trimester, but exceptions are possible, such as trastuzumab which appears to
cross the placenta of cynomolgus monkeys also in early pregnancy. It is unknown whether this is the case
for brodalumab, but significant placental passage occurred at the end of pregnancy in rabbits and
monkeys. Therefore, a recommendation was added to the SmPC that women of childbearing potential
should use an effective method of contraception during treatment and for at least 12 weeks after
treatment.
Only a very small amount of brodalumab was found in milk. However, as an IgG, brodalumab would be
expected to be present in the first milk. As such, appropriate recommendations have been included in
section 4.6 of the SmPC.
2.3.7. Conclusion on the non-clinical aspects
The non-clinical data is considered acceptable to support this marketing authorisation.
2.4. Clinical aspects
2.4.1. Introduction
GCP
The Clinical trials were performed in accordance with GCP as claimed by the applicant

Assessment report
EMA/381484/2017 Page 26/135
The applicant has provided a statement to the effect that clinical trials conducted outside the community
were carried out in accordance with the ethical standards of Directive 2001/20/EC.
Tabular overview of clinical studies
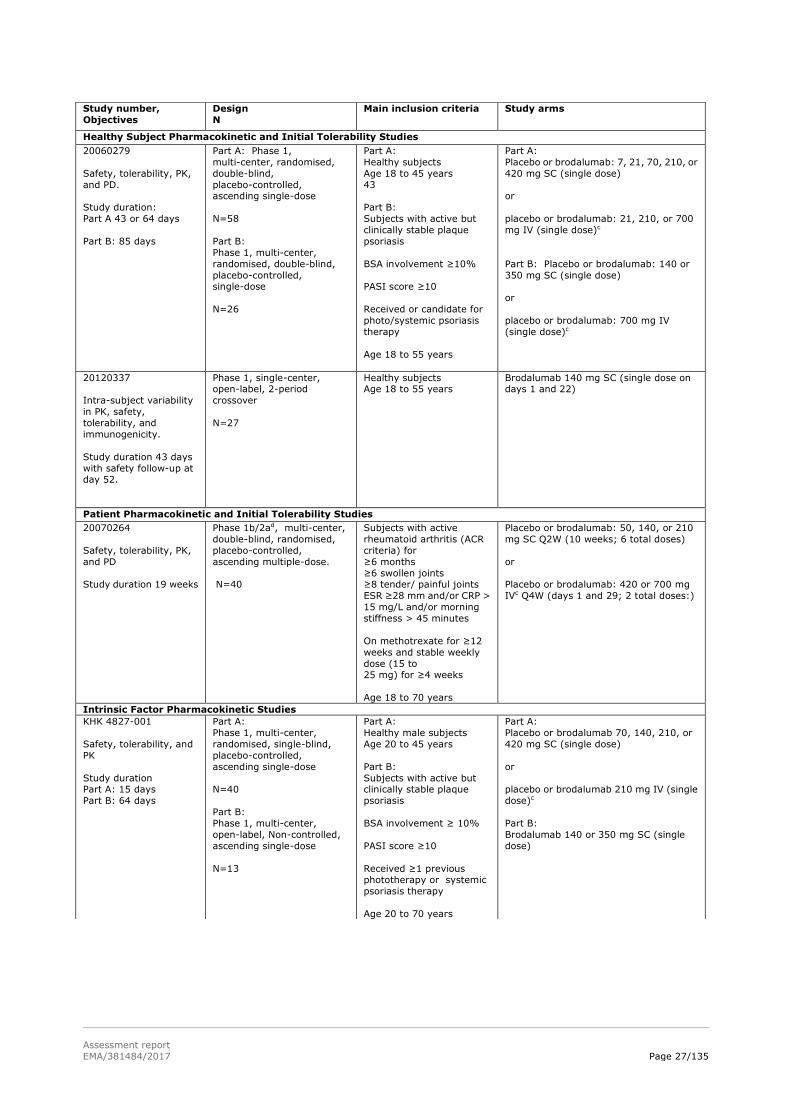
A summary of all brodalumab clinical studies is provided in Figure 1 below. Studies with KHK number were
performed in Japan. Table 6 presents the brodalumab pharmacology studies and Table 7 the psoriasis
efficacy and safety studies.
Figure 1: Overview of brodalumab psoriasis clinical program.
Table 6: Overview of brodalumab pharmacology program
Study number,
Objectives
Design
N
Main inclusion criteria
Study arms
Comparative Bioavailability and Bioequivalence Studies
20090480,
PK, bioequivalence,
safety, tolerability, and immunogenicity
(bridging between
PFS and AI/Pen
Study duration 59 daysa
Phase 1, multi-center,
open-label, randomised,
2-period crossover.
N=141
Healthy subjects
BMI 18 to 30 kg/m2
Age 18 to 55 years
Brodalumab 210 mg SC single dose on
day 1 or day 29 AIb pen
Brodalumab 210 mg SC single dose on
day 1 or day 29 PFSb
20130307,
PK, bioequivalence,
safety, tolerability, and
immunogenicity (bridging between
PFS and AI/Pen
Study duration 59 days
Phase 1, multi-center,
open-label, randomised,
2-period crossover.
N=145
Healthy subjects
BMI 18 to 30 kg/m2
Age 18 to 55 years
Brodalumab 210 mg SC single dose on
day 1 or day 29 AIb pen
Brodalumab 210 mg SC single dose on
day 1 or day 29 PFSb
20110106
Delivery performance,
tolerability, safety, and
PK
Study duration 36 days.
Phase 1, single-center,
open-label, randomised,
crossover.
N=80
Healthy subjects
Age 18 to 45 years
Brodalumab 140 mg SC [1.0 mL AIb, 3.1
kgf] + brodalumab 140 mg SC [1.0 mL
AIb, 4.2 kgf] + positive control buffer SC
(1.0 mL PFS) + negative control buffer SC
(1.0 mL PFS) (4 doses were administered on 1 day, 1
hour apart)
Assessment report
EMA/381484/2017 Page 27/135
Study number,
Objectives
Design
N
Main inclusion criteria
Study arms
Healthy Subject Pharmacokinetic and Initial Tolerability Studies
20060279
Safety, tolerability, PK,
and PD.
Study duration:
Part A 43 or 64 days
Part B: 85 days
Part A: Phase 1,
multi-center, randomised,
double-blind,
placebo-controlled, ascending single-dose
N=58
Part B:
Phase 1, multi-center,
randomised, double-blind,
placebo-controlled, single-dose
N=26
Part A:
Healthy subjects
Age 18 to 45 years
43
Part B:
Subjects with active but
clinically stable plaque
psoriasis
BSA involvement ≥10%
PASI score ≥10
Received or candidate for
photo/systemic psoriasis
therapy
Age 18 to 55 years
Part A:
Placebo or brodalumab: 7, 21, 70, 210, or
420 mg SC (single dose)
or
placebo or brodalumab: 21, 210, or 700
mg IV (single dose)c
Part B: Placebo or brodalumab: 140 or
350 mg SC (single dose)
or
placebo or brodalumab: 700 mg IV
(single dose)c
20120337
Intra-subject variability
in PK, safety,
tolerability, and
immunogenicity.
Study duration 43 days
with safety follow-up at day 52.
Phase 1, single-center, open-label, 2-period
crossover
N=27
Healthy subjects Age 18 to 55 years
Brodalumab 140 mg SC (single dose on days 1 and 22)
Patient Pharmacokinetic and Initial Tolerability Studies
20070264
Safety, tolerability, PK,
and PD
Study duration 19 weeks
Phase 1b/2ad, multi-center,
double-blind, randomised,
placebo-controlled,
ascending multiple-dose.
N=40
Subjects with active
rheumatoid arthritis (ACR
criteria) for
≥6 months
≥6 swollen joints ≥8 tender/ painful joints
ESR ≥28 mm and/or CRP >
15 mg/L and/or morning
stiffness > 45 minutes
On methotrexate for ≥12
weeks and stable weekly
dose (15 to 25 mg) for ≥4 weeks
Age 18 to 70 years
Placebo or brodalumab: 50, 140, or 210
mg SC Q2W (10 weeks; 6 total doses)
or
Placebo or brodalumab: 420 or 700 mg
IVc Q4W (days 1 and 29; 2 total doses:)
Intrinsic Factor Pharmacokinetic Studies
KHK 4827-001
Safety, tolerability, and
PK
Study duration Part A: 15 days
Part B: 64 days
Part A:
Phase 1, multi-center,
randomised, single-blind,
placebo-controlled,
ascending single-dose
N=40
Part B:
Phase 1, multi-center,
open-label, Non-controlled,
ascending single-dose
N=13
Part A:
Healthy male subjects
Age 20 to 45 years
Part B:
Subjects with active but clinically stable plaque
psoriasis
BSA involvement ≥ 10%
PASI score ≥10
Received ≥1 previous phototherapy or systemic
psoriasis therapy
Age 20 to 70 years
Part A:
Placebo or brodalumab 70, 140, 210, or
420 mg SC (single dose)
or
placebo or brodalumab 210 mg IV (single
dose)c
Part B:
Brodalumab 140 or 350 mg SC (single
dose)

Assessment report
EMA/381484/2017 Page 28/135
Table 7: Overview of brodalumab psoriasis efficacy and safety studies Controlled Clinical Studies Pertinent to the Claimed Indication (Moderate to Severe Plaque Psoriasis) 20090062
Efficacy, safety, and PK
Study duration 22 weeks
Phase 2, multi-center,
randomised, double-blind, placebo-controlled,
multiple-dose
N=198
Subjects with stable moderate
to severe plaque psoriasis for ≥6 months
BSA involvement ≥10%
PASI score ≥12
Received or candidate for
photo/systemic psoriasis therapy
Age 18 to 70 years
Brodalumab 70, 140, or 210
mg SC Q2W + week 1 (day 1 to week 10)
or
brodalumab 280 mg SC Q4W
(day 1 and weeks 4 and 8) +
placebo (weeks 1, 2, 6, and
10)
or
placebo Q2W + week 1 (day 1
to week 10) 20120102
Efficacy, safety, and
PK
Study duration 266 weeks
Phase 3, multi-centre,
double-blind, randomised,
placebo-controlled study with
12-week induction phase, 40-week withdrawal and
re-treatment phase and
open-label extension phase.
Induction
N=661
Withdrawal
N=628 Re-treatment
N=149
Rescue
N=36
OLE
N=649
Stable moderate to
severe plaque psoriasis for
≥6 months
Biologic therapy candidate
BSA involvement ≥ 10%
PASI score ≥12
sPGA ≥3
Age 18 to 75 years
Induction: placebo or
brodalumab 140 or 210 mg SC
Q2W + week 1 (day 1 to week
10)
Withdrawale: assigned to
brodalumab 210 mg SC Q2W
(weeks 12 to 266)
or
re-randomised to placebo or
brodalumab 140 mg or 210 mg
SC Q2W + week 13 (weeks 12 to 266 or inadequate response)
Retreatmentf: 3 doses QW of
brodalumab 140 or 210 mg
(day 1 to week 2 of
retreatment) or brodalumab
140 or 210 mg (day 1 and week
2 of retreatment) + placebo + brodalumab 140 or 210 mg
Q2W thereafter (through week
266 or inadequate response)
Rescue (through week 52)g:
brodalumab 210 mg SC Q2W
OLE: Brodalumab 140 or 210
mg SC Q2W (weeks 52 to 266 or inadequate response)
Study number,
Objectives
Design
N
Main inclusion criteria
Study arms
Extrinsic Factor Pharmacokinetic Studies
20110184
DDI, PK, safety,
tolerability, and
immunogenicity
Study duration:
Cohort 1: 30 days with safety follow-up at day
62
Cohort 2: 22 day with
safety follow-up at day
61
Phase 1, multi-center,
open-label, single-dose.
Cohort 1: N=21
Cohort 2: N=10
Subjects with stable
moderate to severe plaque
psoriasis for
≥6 months
BSA involvement ≥10%
PASI score ≥12
sPGA ≥3
Age 18 to 75 years
Cohort 1: Midazolam 2 mg PO (days 1 and
9) + brodalumab 210 mg SC (single dose:
day 2)
Cohort 2: Brodalumab 140 mg SC (single
dose day 1)

Assessment report
EMA/381484/2017 Page 29/135
2.4.2. Pharmacokinetics
Six studies were primarily designed as clinical pharmacology studies subcategorized as healthy subject
pharmacokinetics and initial tolerability, patient pharmacokinetics and initial tolerability, intrinsic, and
extrinsic factor pharmacokinetics. Eight clinical studies in other study categories provided supportive data
for the safety (including immunogenicity), pharmacokinetic, and pharmacodynamic properties of
brodalumab. These studies included three biopharmaceutics studies and five efficacy and safety studies
(see Figure 1 and Table 6 and Table 7 above).
Pharmacokinetics of brodalumab has been studied in healthy volunteers and patients with psoriasis.
Non-compartmental PK analysis was conducted in the studies with intensive PK data and some with
sparser PK data. A population pharmacokinetic model was developed to evaluate covariate factors and to
evaluate concentration-effect relationships. This population PK model was essential to the program as
brodalumab appeared to display non-linear elimination characteristics.
Analytical assays
A validated ELISA has been used to quantify unbound brodalumab in serum. The assay was validated
according to current standards. Validation experiments investigated verification of assay range, inter-
and intra-assay accuracy and precision, selectivity (matrix effect), specificity, stability, dilutional
linearity, incurred sample re-analysis and robustness (e.g. incubation time, equipment and analyst) for all
labs showed adequate performance and met the criteria of the relevant guidance. Accuracy and precision
data for the bioanalytical assays that supported serum brodalumab concentration determinations showed
that for the QC samples accuracy (%bias) was within the ranges of -12% to +5% and precision (%CV)
was within the ranges of 3% to 19% for all clinical studies (all < 20%).
Controlled Clinical Studies Pertinent to the Claimed Indication (Moderate to Severe Plaque Psoriasis)
20120103
Efficacy, safety, and
PK
Study duration 266
weeks
Phase 3, multi-centre, double-blind, randomised,
active comparator- and
placebo- controlled with
12-week induction phase,
40-week maintenance phase
and open-label extension.
Induction N=1831
Maintenance
N=1760
Rescue
N=833
OLE
N=1601
Stable moderate to severe plaque psoriasis for
≥6 months
Biologic therapy candidate
BSA involvement ≥ 10%
PASI score ≥12 sPGA ≥3
Age 18 to 75 years
Inductionh: placebo or brodalumab 140 or 210 mg SC Q2W + week 1 (day 1 to week
10)
or
ustekinumab 45 or 90 mg SC (day 1 and
week 4)
Maintenancei: Brodalumab 140 mg SC
Q2W, Q4W, or Q8W or brodalumab 210 mg SC Q2W
(weeks 12 to 52 or inadequate response)
or
ustekinumab 45 or 90 mg SC Q12W
(weeks 16 to 40 or inadequate response
at week 16)
Rescuej: Brodalumab 210 mg SC Q2W Or
ustekinumab 45 or 90 mg SC Q12W
OLE: Brodalumab 140 mg SC Q2W, Q4W,
or Q8W or brodalumab 210 mg SC Q2W
(weeks 52 to 266 or inadequate
response)
20120104
Efficacy, safety, and
PK
Study duration 266
weeks
As in study 20120103.
Induction
N=1881
Maintenance
N=1799
Rescue
N=827
OLE
N=1656
As in study 20120103. As in study 20120103
Uncontrolled Clinical Studies
20090403
Efficacy, safety, PK
Study duration 360
weeks (planned) interim
analysis 192 weeks
Phase 2, multi-center,
open-label extension of
Study
20090062
N=181
Completion of week 16 visit
of Study 20090062 without
any treatment-related
serious adverse events
Brodalumab 210 mg SC Q2W + week 1
(weeks 0 to 358; per protocol
amendment 2, subjects
≤100 kg had doses decreased to 140 mg; per protocol amendment 3, rescue with
210 mg was permitted based on
inadequate response)

Assessment report
EMA/381484/2017 Page 30/135
Development of antibodies against brodalumab was tested via a two-tiered strategy including a
screening, confirmatory and neutralization assay in agreement with the Guideline on immunogenicity
assessment of monoclonal antibodies intended for in vivo clinical use (EMA/CHMP/BMWP/86289/2010).
The method was validated and cross-validated for the use at different laboratories. Drug tolerance of the
anti-brodalumab assay was 100 μg/mL brodalumab and no interference of the immunoassay by SC
brodalumab is to be expected. The bioassay for neutralising antibodies could tolerate 0.75 or 1.25 μg/mL
of brodalumab in order to detect 2.5 μg/mL of antibodies. Mean brodalumab trough concentration for 210
mg SC Q2W was 9-11 µg/ml in the phase 3 efficacy studies. Therefore, drug levels in the test samples will
interfere with the detection of neutralising antibodies. Only samples with high concentration of
neutralising antibodies can be detected and the presence of neutralising antibodies may be
underestimated.
Absorption
Brodalumab absolute bioavailability was estimated to be approximately 54.7%. The estimate for ka in a
typical individual was 0.33 day-1. The predicted median time to maximum brodalumab concentration was
approximately 3 days, which is consistent with results from non-compartmental analyses. Absolute
bioavailability was estimated using population PK modeling in the absence of SC and intravenous (IV)
data using the same dose available from the same group of subjects.
Bioequivalence/formulations
Bioequivalence has been demonstrated between the PFS product used in Phase 3 for SC dosing of 210 mg
with two injections (1.0 mL and 0.5 mL of 140 mg/ml brodalumab ) and the PFS product to be marketed
with one (1.5 mL of 140 mg/ml) PFS injection. The reported analysis resulted in a treatment ratio [90%
CI] of 0.89 [0.82-0.98], thus the single injection leads to less exposure as the average difference between
both treatments of 11% was statistically significant (although this is usually not considered clinically
relevant).
Drug product manufacturing process (process 1 ATO versus process 2 ATO) was formally tested in the
population PK modeling on drug bioavailability, drug clearance and absorption rate. No statistically
significant effect was detected on any of these PK parameters at α = 0.01, and the maximum change in
each of these model parameters was < 5%.
Site of injection
Site of SC injection has not been specifically investigated in the clinical program. In the method of
administration, SC injection into the abdomen, thigh or upper arm is recommended. This is acceptable as
the majority of brodalumab injections in the Phase 2 and Phase 3 clinical studies with brodalumab were
into the upper limb (around 50%) or abdomen (around 30%), although there was a small proportion of
injections into the lower limb (around 10%). Site of injection was into the abdomen for most of the
healthy volunteer studies.
Distribution
Plasma protein binding studies are not relevant for monoclonal antibodies since these are not known to
bind non-specifically to plasma proteins. Based on population PK modeling, the estimated mean
steady-state volume of distribution of brodalumab was approximately 7.24 L.
Monoclonal antibodies are eliminated by a combination of catabolic processes, which have been found to
act similarly across all monoclonal antibodies. Additionally, monoclonal antibodies may undergo

Assessment report
EMA/381484/2017 Page 31/135
target-mediated elimination, in which the drug-target complex is cleared (by internalization in the case of
a receptor target) in proportion to target turnover rate and/or prevalence.
Elimination
Model-based simulations were used to predict the time after last steady state dose for brodalumab
concentrations to drop below the quantification limit (BQL). The time for 50% of subjects to get to BQL is
13 days and 26 days for the 140 and 210 mg doses. The time for 95% of subjects to get to BQL is 32 days
and 63 days for the 140 and 210 mg doses. The estimated half-life of brodalumab was 10.9 days at
steady-state after every other week subcutaneous dose of 210 mg.
Dose proportionality and time dependencies
Non-linear pharmacokinetics
Following intravenous administration, the PK profiles showed bi-phasic disposition of brodalumab.
Additionally, these profiles showed a clear dose-dependent change in the shape of the terminal phase,
where higher doses resulted in slower brodalumab elimination. This is indicative of the presence of a
saturable (or non-linear) component to brodalumab elimination. Upon subcutaneous administration in
subjects within the same study and across studies, the bi-phasic disposition pattern seems to be masked
by the prolonged absorption phase, but the dose-dependent change in the shape of the terminal phase
was still apparent. As a consequence, brodalumab exposures increased in a more than dose-proportional
manner.
The non-linear portion of elimination was especially profound at lower doses, which has been described
for numerous monoclonal antibodies and is assumed to be due to target binding (target-mediated
disposition). Given the finite pool of the target IL-17 receptor, this elimination pathway becomes
saturable, where the rate of uptake and elimination is a function of dose and the expression level of the
target. These findings suggest the non-linear nature of brodalumab PK.
Special populations
Sex, age, race, and disease category (healthy vs. patient) did not affect exposure to brodalumab.
Exposure to brodalumab decreases with increasing body weight and with increasing baseline PASI score.
Renal impairment is not anticipated to impact the pharmacokinetic exposure to brodalumab. No renal
excretion is anticipated due to the molecular size of brodalumab, and therefore no specific studies to
measure excretion of brodalumab were conducted (Keizer et al, 2010). The relationship between renal
function category (Lalonde et al, 2009; Guidance for Industry, 2010) and week 12 trough serum
concentrations of brodalumab after steady-state administration of 140 and 210 mg Q2W week from
studies 20120102, 20120103, and 20120104 for the different renal function categories was examined. At
each dose level, there were no apparent differences in the median and distribution of brodalumab
concentrations for the different renal function categories.
As a monoclonal antibody, hepatic impairment is not expected to impact the pharmacokinetic exposure to
brodalumab. The normal catabolic degradation of brodalumab to small peptides and individual amino
acids is not expected to be impacted by hepatic impairment.
The majority of subjects in the population PK data pool (approximately 90% of the analysis population)
were white. Nevertheless, the relationship between different race groups and week 12 trough serum
concentration of brodalumab after steady-state administration of 140 and 210 mg Q2W from Studies

Assessment report
EMA/381484/2017 Page 32/135
20120102, 20120103, and 20120104 was examined. At both dose levels, there was no apparent
difference between trough brodalumab concentrations and white and other race groups. Furthermore,
single dose pharmacokinetics was similar between white subjects (Study 20060279) and Japanese
subjects (Study KHK-4827-001) for both healthy subjects and subjects with psoriasis as assessed by
non-compartmental analysis.
Body weight
Body weight was a significant predictor of brodalumab clearance and volume parameters. Steady-state
exposures appeared to be > 1.5-fold higher for lighter subjects (60 kg) or < 50% for heavier subjects
(130 kg) as compared to exposures in a typical individual (weighing 80 kg). A boxplot presentation for
various weight classes showed that for the 210 mg SC dose for the lowest weight class (39-72 kg) the
box, containing the middle 50% of observations, is completely above the box for the highest weight group
(107-234 kg) and the median exposure is a factor 5 higher, despite the overlap in the individual
concentration range. The estimated clearance-BW exponent of 0.9 indicates (Wang et al., 2009, Fixed
Dosing Versus Body Size–Based Dosing of Monoclonal Antibodies in Adult Clinical Trials) that body weight
adjusted dosing would have been more appropriate for brodalumab in order to ensure comparable
exposure in all weight groups.
Population PK modeling
For population PK modeling data from 7 studies have been used. The data set mainly consisted of white
men in a wide age (18-76 yrs) and weight range (39-234 kg) and a mean psoriasis baseline PASI score of
17. No PK data were available for subjects < 18 yrs and < 39 kg BW. Brodalumab pharmacokinetics, after
single and/or multiple administrations through IV or SC routes in subjects with psoriasis (with and without
psoriatic arthritis), was adequately described by a 2-compartmental pharmacokinetic model with linear
and saturable elimination processes from the central compartment. All model parameters were estimated
with acceptable precision. Study 20120103 was used for external validation. The absorption and
disposition parameter estimates were consistent with findings from previous analyses of brodalumab
pharmacokinetics and other monoclonal antibodies.
The following intrinsic and extrinsic factors/covariates were considered for the population PK analyses:
baseline demographic factors (sex, baseline age, race, and body weight), disease category indicators
(healthy versus psoriasis versus psoriatic arthritis), disease severity (baseline PASI scores), and drug
product manufacturing process (Process 1 ATO versus Process 2 ATO). Because anti-brodalumab
antibody incidence was < 3% of the subject population, anti-brodalumab antibody status was not
included as a covariate on the population pharmacokinetic model. No trends were observed to suggest
reduction in pharmacokinetics due to the presence of binding anti-brodalumab antibodies.
Variability
Estimates of inter-individual variability (CV %) for (linear) clearance (CL), volume of distribution for
central compartment (V1) and volume of distribution for peripheral compartment (V2) were 49.1%,
13.3%, and 135%, respectively. Intra- and inter-subject variability in brodalumab exposure after SC
administration appears to be high. Inter-subject variability after IV administration was notably less, thus
the SC administration contributes to the variability.
Throughout the studies there was a fraction of subjects with very low exposure as compared to group
means, sometimes a factor 10, 50 or 200 lower, and there were also subjects with all concentration
values below LLOQ. This did not only occur in the three pivotal phase 3 studies included in the popPK
modeling, but also in smaller, more controlled phase 1 studies like 20130307, 20090480, KHK4827-001
and 20110184 (only the last study [cohort 2]) was included in the popPK modeling dataset). According to
the applicant, a combination of factors including high body weight, high baseline disease burden (PASI)

Assessment report
EMA/381484/2017 Page 33/135
and occasional missed doses, along with large unexplained variability in PK, may have combined to
produce the observed low PK subjects.
From a modelling perspective, the unexplained interindividual variability (IIV) of PK parameters as
observed after accounting for all covariate effects (esp. weight) in the final model was very high. The
prediction-corrected VPC plots for the first and the steady-state dosing in the population PK report
showed that the 5th percentile line of observed concentrations was clearly below the lower predicted area
of corresponding simulation-based percentiles, which means that there is a large fraction of unexpected
low exposures, which may not have been completely captured by the model. Therefore, there remain
some uncertainties with the population PK model and the model should be used with caution.
Based on study 20120337, inter- and intra-subject variability on AUC were 108.9% and 56.3%,
respectively, after repeated administration of two SC doses of brodalumab 140 mg in two periods.
Overall, all PK studies showed high inter-subject variability on brodalumab exposure with CV values
ranging from 50 to 100%, in line with the observed variability in the individual PK profiles.
Antibodies
Development of antibodies against brodalumab was measured throughout the clinical program. No signs
of antibody formation were detected upon reviewing the pharmacokinetic data in general. No evidence of
altered pharmacokinetic or safety profiles has been observed in subjects who tested positive for binding
antibodies in phase 3 studies.
Overall, < 2.6% of brodalumab-treated subjects with psoriasis in the efficacy and safety studies was
positive for the development of binding anti-brodalumab antibodies. Of the ≥ 6300 subjects who received
at least one dose of brodalumab in all the clinical studies, 2 subjects with neutralizing antibodies were
detected. The probability to detect neutralizing antibodies (Nab) after a positive screening result was very
low: ADA detection by the screening assay in the first step was very sensitive, but qualification as
“neutralising“ ADA was less sensitive due to the much lower drug tolerance of the assay for measuring
neutralizing capacity of anti-brodalumab antibodies. At the time of immunogenicity measurement (end of
dose interval) about 2/3 of all Ctrough values at week 12 were > 2.5 µg/mL and thus higher than the drug
tolerance of the Nab assay of 1.25 µg/ml. This means that only very strong Nab signals would have been
detectable.
As stated the risk of ADA formation is low 2.3% (107/4461). Moreover ADA formation seldom was
persistent 0.45% (20/4461). However, this could not be related to a loss of efficacy or to hypersensitivity
reactions. In several subjects a positive titre resulted in a dip in response on the PASI in other patients
with a positive titre there was no effect on PASI score.
Age 65-74 (Older subjects number /total number)
Age 75-84 (Older subjects number /total number)
Age 85+ (Older subjects number /total number)
All PK Trials
2/149
0/149
0/149
Pharmacokinetic interaction studies
The formation of CYP450 enzymes can be altered by increased levels of certain cytokines (e.g. IL-1, IL-6,
IL-10, TNFα, IFN) during chronic inflammation. Although a role for IL-17A and IL-17RA in the regulation
of CYP450 enzymes has not been reported, the effect of brodalumab on CYP3A4/3A5 activity was
evaluated in a disease-drug-drug interaction study. This study showed that in patients with moderate to
severe plaque psoriasis, a single subcutaneous dose of 210 mg brodalumab increased the exposure to the

Assessment report
EMA/381484/2017 Page 34/135
CYP3A4/3A5 substrate midazolam by 24% (which means that midazolam clearance was decreased by
24%).
Pharmacokinetics using human biomaterials
Because brodalumab is a monoclonal antibody, no in vitro permeability, in vitro metabolism, or in vitro
metabolic drug-drug interaction studies that used human biomaterials were performed.
2.4.3. Pharmacodynamics
Pharmacodynamics relevant to this application was assessed in six studies across the brodalumab clinical
program. The key elements of the pharmacodynamic biomarker program included measures of
biochemical coverage in early phase 1 studies and analyses of molecular and cellular markers related to
psoriasis or activity of brodalumab in subjects with psoriasis.
Mechanism of action
IL-17RA receptor occupancy was examined in studies 20060279 (psoriasis patients), 20070264 (patients
with rheumatoid arthritis), and KHK 4827-001 (psoriasis patients). Receptor occupancy on circulating
granulocytes, lymphocytes, and monocytes was consistently >80% across the studies, and increased in
a dose-dependent manner. The results from the ex vivo whole blood stimulation (WBS) assay on
EC50-shift after brodalumab administration support the dose-dependent inhibition of IL-17 receptor. This
observation supports the hypothesis that brodalumab acts as a competitive inhibitor of IL-17 signaling.
From the relationship between in vivo receptor occupancy versus (free) brodalumab plasma
concentrations no value for Ki of brodalumab can be derived due to fact that occupancy < 80% occurs at
concentrations which could not be detected in the PK assay. It can only be deduced that “Ki in vivo” is <
0.05 µg/mL (LLOQ of the PK assay). However, this is well in line with the dissociation constant KD of
brodalumab determined in vitro (0.24 nM ≈ 0.04 µg/mL).
Competitive antagonism modeling of the WBS data estimated a range of WBS concentrations that
produced 90% inhibition (IC90) from 2.75 to 15.4 μg/mL for brodalumab.
Primary and Secondary pharmacology
Effects on skin biomarkers
Effects of brodalumab on skin biomarkers were examined in studies 20060279, 20090062 and 20120102.
Molecular and histological analyses of skin biopsies in studies of subjects with psoriasis were conducted in
Studies 20060279, Study 20090062, and molecular analyses were conducted in Study 20120102.
In study 20060279, significant reductions (p < 0.05) in epidermal thickness and KRT16 mRNA were
observed at Day 15 across all dose groups (140 or 350 mg SC, or 700 mg IV). Significant reductions in
Ki67 expressing cell counts were observed in the highest dose groups. Among subjects who received
higher doses of AMG 827 (700 mg IV and 350 mg SC), 15 of 16 subjects had decreases in each of the
biomarker measurements. In the 140 mg SC group, only 1 of 4 subjects had notable reductions in skin
biomarker measurements.
In study 20090062, significant reductions (p < 0.05) in all epidermal thickness, CD3 expressing dermal
cell count, and keratin-16 (KRT 16 were observed in the 140 and 210 mg Q2WK treatment groups at 12
weeks. The reductions in biomarkers were dose-dependent, apart from the CD3 count.

Assessment report
EMA/381484/2017 Page 35/135
In the biopsy substudy of phase 3 study 20120102, the quantities of 5 inflammatory cytokine mRNAs in
lesional biopsies were measured IL-17A, IL-17, IL-17F, IL-12B and IL-23A at baseline and week 12, 16,
24 and 52. The quantity of IL17A, IL17C, and IL17F mRNA was each significantly decreased in lesional
skin from subjects who received brodalumab 140 mg or 210 mg Q2W at week12 compared with lesional
skin from placebo subjects (p ≤ 0.001 for all comparisons). Also the quantity of IL12B and IL23A mRNA
was significantly decreased in lesional skin from brodalumab 140 mg (p = 0.002) or brodalumab 210 mg
(p ≤ 0.001) at week12 compared to lesional skin from placebo subjects.
Across the three pivotal studies, circulating c-reactive protein levels were reduced with brodalumab
treatment.
Brodalumab population PK/PD modelling
A semi-mechanistic PK/PD model describing the relationship between serum brodalumab concentrations
and PASI and sPGA response over time was developed. The time course of PASI and sPGA response was
best modelled by a signalling compartment followed by modulation of psoriatic plaque turnover through
inhibition of plaque formation rate modelled via an indirect response model, which is suitable and
appropriate for this type of data. Modelling indicated a clear exposure-response relationship.
Total body weight was found to be a statistically significant covariate on the psoriatic plaque removal rate
constant (Kdeg) and on the concentration of half-maximal inhibition IC50. Thus, subjects with higher body
weight had decreased Kdeg and increased IC50 – acting both to reduce predicted response and prolong
time to steady-state response for heavier subjects (independent of dose selection).
Modelling and simulation indicated superiority of response for 210 mg vs 140 mg for all weight groups by
week 52. For subjects induced on 210 mg and then continuing on 210 mg vs. switching to 140 mg at week
12 there is clear separation of doses for all weight groups, with increasing benefit for continued 210 mg
treatment as weight increased.
A clear positive relationship between brodalumab exposure (week 12 Ctrough) and efficacy outcome (sPGA
0 and 0/1) was observed. Further analysis confirmed that, due to the BW-effect on exposure, also efficacy
was clearly dependent on body weight continuously decreasing from light to heavy body weight.
Simulations with the population PK/PD model showed that only 40% of the heavy patients (107-234 kg
BW) are predicted to achieve sPGA 0 at week 52 of treatment with 210 mg SC (induction and
maintenance), in comparison to 80% of the light patients (39-72 kg).
A dose adjustment by weight ensuring that all patients reach an effective exposure leading to a similar
response as in the < 83 kg body weight category was considered. Dose simulations were provided
showing several different dosing regimens, with the 210 mg dose are predicted to give an exposure
comparable to, or higher, than the predicted AUC for the weight categories below 83 kg with the tested
regimen of 210 mg Q2W brodalumab. For patients above 120 kg, the likelihood of an adequate treatment
response is decreased. However, the applicant predicted the exposure after different dosing scenarios for
the two BW quintiles (93-107 kg) and (107-234 kg) and concluded that from an exposure and a patient
compliance point of view, 210 mg three times per month might be the most appropriate dose for the
group of high weight patients not meeting the response criteria of PASI 75.
Based on an explorative, descriptive analysis, no relationship was observed between exposure and
incidence of serious infections and infestations, candida infections, viral infections, and suicidal ideation
and behaviour events.
No formal studies of pharmacodynamic interactions have been conducted.

Assessment report
EMA/381484/2017 Page 36/135
2.4.4. Discussion on clinical pharmacology
Pharmacokinetics of brodalumab has been studied in healthy volunteers and patients with psoriasis.
The absorption and disposition parameter estimates are consistent with findings from other monoclonal
antibodies. Bioequivalence has been demonstrated between the PFS product presentation used in Phase
3 trials and the marketed prefilled autoinjector/pen. Drug product manufacturing process (process 1 ATO
versus process 2 ATO) was formally tested in the population PK and it is concluded that there are no major
differences in exposures between the SC drug product coming from ATO processes 1 and 2.
Plasma protein binding studies are considered to be not relevant for mAbs. Results obtained from the
population PK modelling indicate that brodlaumab suffers limited tissue penetration and distribution
mainly in serum.
Sex, age, race, and disease category (healthy vs. patient) did not affect exposure to brodalumab. This
means that pharmacokinetics of brodalumab in healthy subjects and psoriasis patients are shown to be
similar.
Renal impairment is not anticipated to impact the pharmacokinetic exposure to brodalumab. No renal
excretion is anticipated due to the molecular size of brodalumab, and therefore no specific studies to
measure excretion of brodalumab were conducted which is considered acceptable by CHMP.
As a monoclonal antibody, hepatic impairment is not expected to impact the pharmacokinetic exposure to
brodalumab. The normal catabolic degradation of brodalumab to small peptides and individual amino
acids is not expected to be impacted by hepatic impairment.
Exposure to brodalumab decreases with increasing body weight and with increasing baseline PASI score.
There is a concern that subjects in the higher body weight class may be under dosed. However, the CHMP
decided that for the time being no dose adjustment is warranted in patients with higher body weight. In
order to explore if a higher efficacy can be achieved with a higher dose and to establish the safety of a
higher dose in the high-weight population a post-authorisation study will be conducted. The applicant will
perform a post-authorisation clinical study to establish the optimal dose/dosing regimen in the high
weight group of patients ensuring that all patients reach an effective exposure leading to the same
response as in the < 83 kg body weight category.
The risk of ADA formation is low and ADA formation seldom was persistent. ADA formation could not be
directly related to loss of efficacy or to hypersensitivity reactions. In several subjects a positive titre
resulted in a dip in response on the PASI and, in other patients with a positive titre there was no effect on
PASI score. No firm conclusions can be drawn whether antibody formation, if occurring, does affect
efficacy and safety. This information is appropriately reflected in the SmPC.
The effect of brodalumab on CYP3A4/3A5 was evaluated in a drug-drug interaction study. Based on the
magnitude of the change in exposure of midazolam (24% increase with a single subcutaneous dose of 210
mg brodalumab), no dose adjustment of CYP3A4/3A5 substrates is necessary when administered
concomitantly with brodalumab. This information is appropriately reflected in section 4.5 of the SmPC.
The chosen skin biomarkers are established biomarkers in examining pharmacodynamics of drugs for the
treatment of psoriasis. Although the analysed numbers are low, statistically significant effects of
brodalumab on skin biomarkers were observed. A clear dose-response relationship was observed for
epidermal thickness, Ki67 cell counts and keratin-16 expression. This applies also to the reductions in
inflammatory cytokine expression. For CD3 cell counts, dose-response relationship was not shown.
The PK/PD model is considered adequately developed and validated. Total body weight was found to be a
statistically significant covariate on the psoriatic plaque removal rate constant (Kdeg) and on the

Assessment report
EMA/381484/2017 Page 37/135
concentration of half-maximal inhibition IC50. In addition, modelling and simulation indicated superiority
of response for 210 mg vs 140 mg for all weight groups by week 52. These observations were later
confirmed in the pivotal efficacy studies.
With some caution, due to the earlier mentioned remaining uncertainties around the population PK model,
the model could be useful for the purpose of simulation of alternative doses and regimens. For instance,
the model could be used for simulating scenarios of fixed dosing versus dosing on body weight.
No formal studies of pharmacodynamic interactions have been conducted which was considered
acceptable by the CHMP.
2.4.5. Conclusions on clinical pharmacology
The pharmacological characterisation of brodalumab is considered adequate by the CHMP. The developed
PK/PD model is considered useful for the purpose of simulation of alternative doses and regimens.
2.5. Clinical efficacy
The efficacy of brodalumab in moderate to severe plaque psoriasis has been investigated in one phase 2
study (study 20090062) and three pivotal studies (studies 20120102, 20120103, 20120104). Data on
maintenance of efficacy is also available from the open-label extensions of the three pivotal studies.
2.5.1. Dose response study
Study 20090062 was a 22-week randomised, double-blind, placebo-controlled, multiple-dose study to
evaluate the safety, tolerability, and efficacy of brodalumab in subjects with moderate to severe psoriasis.
Study population
Eligible subjects were men and women between 18 and 70 years of age who had moderate to severe
plaque psoriasis (BSA ≥ 10% and PASI ≥ 12) at screening and baseline. Subjects were to have had stable
disease for ≥ 6 months and to have either received ≥ 1 photo/systemic therapy or been a candidate to
receive phototherapy or systemic psoriasis therapy in the opinion of the investigator.
Treatments
Placebo
Brodalumab 70 mg SC day 1 and wks 1, 2, 4, 6, 8, and 10
Brodalumab 140 mg SC day 1 and wks 1, 2, 4, 6, 8, and 10
Brodalumab 210 mg SC day 1 and wks 1, 2, 4, 6, 8, and 10
Brodalumab 280 mg SC day 1 and wks 4 and 8
The selection of doses for the study was based a) safety, b) pharmacokinetic modelling, and c)
pharmacodynamic data from the single-dose first-in-human study in healthy volunteers (20060279).
Study 20060279 explored the result of 3 levels of brodalumab serum concentrations:
1. Repeated but transient full engagement of IL-17RA (i.e. receptor occupancy [RO] approximately
90%), with expected transient return to negligible drug levels between doses;
2. Sustained exposure with predicted mean trough concentrations targeting the whole blood stimulation
(WBS) IC90 level as determined in an ex vivo functional assay using a competitive antagonism model;
3. Sustained exposure well above the IC90 level for the duration of the study. A fourth arm, which
provided coverage over the 90% receptor occupancy (RO) level for the majority of an every 4-week

Assessment report
EMA/381484/2017 Page 38/135
(Q4WK) dosing interval, explored whether less frequent dosing with expected transient return to
negligible drug levels could maintain clinical effect in the setting of psoriasis.
To maximize the likelihood of rapid skin clearing, a week 1 dose was added to quickly attain steady state
concentrations for these doses.
The no-observed-adverse-effect level (NOAEL) observed in the 3-month cynomolgus monkey toxicology
study (90 mg/kg weekly SC) provided significant exposure multiples over the anticipated human
exposures, and the preclinical toxicology data supported the proposed clinical study plan.
Objectives
The primary objective was to establish a dose-response efficacy profile of brodalumab to identify an
appropriate dose regimen for phase 3 studies.
The secondary objectives were to evaluate the efficacy of brodalumab with regard to PASI, sPGA and BSA
involvement; safety and PK of brodalumab.
Outcomes/endpoints
Primary:
Percent improvement from baseline in PASI at week 12
Secondary Endpoints:
PASI 75 at week 12
PASI 50, 90, and 100 at week 12
sPGA of clear or almost clear at week 12
sPGA of clear at week 12
BSA involvement at week 12
PK Endpoints:
AMG 827 PK parameters such as Cmax, Tmax, AUC0-t for week 8 to 10
Safety Endpoints:
Adverse events and infectious adverse events
Serious adverse events and serious infectious events
Severity of injection site reactions
Significant changes in laboratory values, and vital signs
Results
Patients
198 subjects were enrolled. Of those randomised, 158 subjects received brodalumab and 37 subjects
received placebo. 184 subjects (152 brodalumab/32 placebo) completed the study.
Baseline demographics are presented in Table 8.

Assessment report
EMA/381484/2017 Page 39/135
Table 8: Baseline demographics of patients in study 20090062 Placebo Brodalumab
Gender, % women 42.1% 34.4%
Age, mean (SD) 41.8 (14.4) 42.6 (11.7)
Weight, mean kg (SD) 86.9 (20.6) 90.8 (22.1)
PASI, mean (SD) 18.9 (5.9) 19.2 (6.8)
BSA involvement 23.5 (12.8) 23.8 (14.1)
Disease duration, mean (SD) 18.3 (11.5) 19.1 (11.0)
Previous systemic treatment, % 71.7 77.5
Efficacy Main results are presented in Table 9.
Table 9: Main efficacy results of study 20090062 Brodalumab
Placebo
(N=38)
70 mg
Q2W (N=39)
140 mg Q2W
(N=39)
210 mg Q2W
(N=40)
280 mg
Q4W
(N=42)
PASI improvement, mean % (SD) 16.0 (27.0) 45.0 (41.7) 85.9 (22.5) 86.3 (27.6) 76.0 (32.7)
PASI 75 responders % 0 33.3 76.9 82.5 66.7
PASI 90 responders % 0 17.9 71.8 75.0 57.1
PASI 100 responders % 0 10.3 38.5 62.5 28.6
sPGA responders (clear/almost clear)
%
2.6 25.6 84.6 80.0 69.0
With respect to PASI improvement, all adjusted p-values for brodalumab treatment compared with
placebo were < 0.0001. Higher doses showed statistically significant higher percent improvement in PASI
scores than the brodalumab 70 mg Q2WK group (p < 0.0001). The comparisons among brodalumab 280
mg Q4WK, 140 and 210 mg Q2WK did not show statistically significant differences between these dose
groups (p > 0.05).
The PASI 50, 75, 90 and 100 responses at week 12 demonstrated statistically significant difference in
comparison to placebo for each brodalumab treatment arm (p < 0.05; all p-values in the non-primary
analyses are nominal and not adjusted for multiplicity.
The p-values comparing each brodalumab treatment arm with placebo for a sPGA response of clear or
almost clear (0 or 1) were all < 0.004.
A subgroup analysis based of body weight was performed. Although the results should be interpreted with
caution as subgroups were relative low in number of subjects, the overall trend was that response with
respect to PASI and sPGA decreased with increasing body weight. The results in weight subgroups in
percent PASI reduction, PASI 75, PASI 100 and sPGA success (0/1) are presented in Table 10.

Assessment report
EMA/381484/2017 Page 40/135
Table 10: Summary of main efficacy result according to baseline weight groups in study 20090062. Brodalumab
Placebo
(N=38)
70 mg
Q2W (N=39)
140 mg Q2W
(N=39)
210 mg Q2W
(N=40)
280 mg
Q4W
(N=42)
Percent PASI improvement % (SD)
Baseline weight ≤75 kg
Baseline weight >75 - 90 kg
Baseline weight >90 - 100 kg
Baseline weight >100 kg
25.2% (34.0)
16.1% (25.9)
7.2% (22.6)
10% (20.2)
84.7 (18.9)
39.7 (32.8)
49.4 (19.9)
7.0 (33.0)
99.9 (0.4)
95.0 (10.6)
96.7 (3.4)
65.9 (26.9)
98.8 (2.7)
76.7 (39.6)
99.1 (2.0)
78.9 (28.4)
86.5 (32.6)
85.4 (26.5)
78.7 (31.6)
53.3 (33.5)
PASI 75 responders %
Baseline weight ≤75 kg
Baseline weight >75 - 90 kg
Baseline weight >90 - 100 kg
Baseline weight >100 kg
0
0
0
0
76.9%
12.5%
20.0%
7.7%
100%
87.5%
100%
42.9%
100%
72.7%
100%
69.2%
88.9%
78.6%
75.0%
27.3%
PASI 100 responders %
Baseline weight ≤75 kg
Baseline weight >75 - 90 kg
Baseline weight >90 - 100 kg
Baseline weight >100 kg
0
0
0
0
30.8%
0
0
0
87.5%
50.0%
44.4%
0
81.8%
54.5%
80.0%
46.2%
44.4%
35.7%
37.5%
0
sPGA responders (0/1) %
Baseline weight ≤75 kg
Baseline weight >75 - 90 kg
Baseline weight >90 - 100 kg
Baseline weight >100 kg
9.1%
0
0
0
61.5%
25.0%
0
0
100%
87.5%
100.0%
64.3%
100%
63.6%
100%
69.2%
88.9%
92.9%
62.5%
27.3%
2.5.2. Main studies
A Phase 3 Study to Evaluate the Efficacy, Safety, and Effect of Withdrawal and Retreatment
with Brodalumab in Subjects with Moderate to Severe Plaque Psoriasis: AMAGINE-1 (Study
20120102)
Methods
Study Participants
Key inclusion criteria
Subject is ≥ 18 and ≤ 75 years of age at time of screening.
Subject has had stable moderate to severe plaque psoriasis for at least 6 months before first dose of
investigational product (IP) (e.g. no morphology changes or significant flares of disease activity in the
opinion of the investigator).
Subject must be considered, in the opinion of the investigator, to be a suitable candidate for
treatment with a biologic per regional labelling.
Subject has involved body surface area (BSA) ≥ 10%, PASI ≥ 12, and sPGA ≥ 3 at screening and at
baseline.

Assessment report
EMA/381484/2017 Page 41/135
Key exclusion criteria
Skin disease related
Subject diagnosed with erythrodermic psoriasis, pustular psoriasis, guttate psoriasis,
medication-induced psoriasis, or other skin conditions at the time of the screening visit (e.g., eczema)
that would interfere with evaluations of the effect of IP on psoriasis.
Other medical conditions
Subject has an active infection or history of infections as follows:
o any active infection for which systemic anti-infectives were used within 28 days prior to first
dose of IP
o a serious infection, defined as requiring hospitalization or intravenous anti-infectives within 8
weeks prior to the first dose of IP
o recurrent or chronic infections or other active infection that, in the opinion of the investigator,
might cause this study to be detrimental to the subject.
Subject has any systemic disease (e.g., renal failure, heart failure, hypertension, liver disease,
diabetes, anemia) considered by the investigator to be clinically significant and uncontrolled.
Subject has known history of Crohn’s disease.
Subject has known history of hepatitis B, hepatitis C, or human immunodeficiency virus.
Subject had myocardial infarction or unstable angina pectoris within the past 12 months prior to the
first dose of IP.
Subject has any active malignancy, including evidence of cutaneous basal or squamous cell
carcinoma or melanoma.
Subject has history of malignancy within 5 years EXCEPT treated and considered cured cutaneous
squamous or basal cell carcinoma, in situ cervical cancer, or in situ breast ductal carcinoma.
Washouts and non-permitted drugs
Subject has used topical therapy as follows:
a. Super-potent or potent topical steroids or topical anthralin/dithranol within 28 days before
first dose of IP
b. Any other formulation or potency of topical therapy within 14 days before first dose of IP
(exception: upper mid-strength or lower potency topical steroids permitted on the face,
axillae, and groin; bland emollients [without urea or alpha or beta hydroxy acids]; shampoo
without steroids).
Subject has used the following within 28 days of first dose of IP: ultraviolet A light therapy (with or
without psoralen); ultraviolet B light therapy; excimer laser; oral retinoids; methotrexate;
cyclosporine; systemically administered calcineurin inhibitors; azathioprine; thioguanine;
hydroxyurea; fumarates; or oral or parenteral corticosteroids including intramuscular or intraarticular
administration (exception: otic, nasal, ophthalmic, or inhaled corticosteroids within recommended
doses is permitted); other non-biologic systemic therapy for psoriasis; live vaccines.
Subject has used anti-IL-17 biologic therapy ever, or other experimental or commercially available
biologic immune modulator(s) within 12 weeks prior to the first IP dose.
Treatments
Investigational product: Brodalumab 140 mg/mL in single-use pre-filled syringes 1.0 mL and 0.5 mL.
Control treatment: Placebo matching brodalumab 140 mg/mL in identical pre-filled syringes.

Assessment report
EMA/381484/2017 Page 42/135
Induction (12 weeks)
Patients were assigned in a ratio of 1:1:1 to one of the following 3 treatment arms:
Brodalumab 140 mg SC (one 1 mL pre-filled syringe brodalumab + one 0.5 mL placebo)
Brodalumab 210 mg SC (one 1 mL + one 0.5 mL pre-filled syringe brodalumab)
Placebo (one 1 mL + 0.5 mL pre-filled syringe placebo)
All treatments were administered on day 1 and weeks 1, 2, 4, 6, 8 and 10.
Withdrawal and re-treatment
At week 12, patients with success on sPGA originally randomised to either one of the brodalumab arms
were re-randomised to either continue on their brodalumab dose or placebo. All subjects originally
randomised to placebo and patients not meeting the re-randomization criteria received 210 mg
brodalumab. All patients received injections (1.0 mL + 0.5 mL syringe) at week 12, 13, 14 and then every
other week.
Return of disease (defined as an sPGA ≥ 3) at or after week 16 and through week 52 triggered
retreatment. Retreatment started with the subject receiving 3 weekly doses of IP (2 injections each; one
1.0 mL and one 0.5 mL):
1. For a subject re-randomised to continued brodalumab, these 3 weekly doses were brodalumab at
the subject’s induction dose (week 1 and 3) and placebo (week 2).
2. For a subject re-randomised to placebo, all 3 of the weekly doses were brodalumab at his or her
induction dose.
3. For a subject who was originally randomised to placebo, these 3 weekly doses were 210 mg
brodalumab (week 1 and 3) and placebo (week 2).
After this, a subject received brodalumab at his or her originally randomised (induction) dose every other
week (or 210 mg Q2W for subjects originally randomised to placebo).
Rescue treatment
Subjects could receive rescue treatment with 210 mg Q2W brodalumab according to the following rules:
Through week 52, rescue treatment was available for a subject who had return of disease,
subsequent retreatment with at least 12 weeks at his or her induction dose, and still has an
inadequate response (persistent sPGAs of 2 over at least a 4-week period or a single sPGA ≥ 3).
after week 52, rescue treatment was available for a subject who had return of disease or an
inadequate response (persistent sPGAs of 2 over at least a 4-week period or a single sPGA ≥ 3).
Objectives
The primary study objective was to evaluate the efficacy of brodalumab (210 mg Q2W and 140 mg Q2W)
in subjects with moderate to severe plaque psoriasis, as compared to placebo; measured by the
proportion of subjects who achieved success (clear [0] or almost clear [1]) on the static physician’s global
assessment (sPGA) at week 12 and by the proportion of subjects who achieved 75% improvement in
Psoriasis Area and Severity Index (PASI;PASI 75) at week 12.
Secondary objectives included evaluation of efficacy of the brodalumab treatment arms as compared to
placebo in clearing psoriasis (sPGA, PASI 100); maintenance of efficacy with continued brodalumab
treatment, effect of brodalumab on patient-reported symptoms; the short- and long-term safety of
brodalumab

Assessment report
EMA/381484/2017 Page 43/135
Outcomes/endpoints
Co-primary endpoint: PASI 75 and sPGA success (0/1 i.e. clear/almost clear) at week 12.
Key secondary endpoints: PASI 100 at week 12, sPGA of 0 at week 12, sPGA success at week 52 (in
re-randomised subjects), and PSI responder definition (total score ≤ 8, with no item score > 1) at week
12.
Other efficacy endpoints included NAPSI, Psoriasis Scalp Severity Index (PSSI), Scalp Surface Area (SSA)
involvement, DLQI, EQ-5D and SF-36.
Sample size
This study had co-primary endpoints (PASI 75 and sPGA success between brodalumab 210 mg and
placebo, and between brodalumab 140 mg and placebo); therefore, the sample size estimation was based
on all 4 comparisons. The study needed to achieve success on all co-primary endpoints at alpha = 0.05
(2-sided level). No multiplicity adjustment was made for the co-primary endpoints. PASI 75 success rates
at week 12 of 77% for the brodalumab 140 mg group, 82.5% for the brodalumab 210 mg group and 10%
for the placebo group were assumed. For sPGA success, rates of 72% for the brodalumab 140 mg group,
77% for the brodalumab 210 mg group and 10% for the placebo group were assumed. Using a
Cochran-Mantel-Haenszel model stratified by total body weight group, 200 subjects per arm (N = 600
total subjects) would provide > 90% power to detect a difference between either dose of brodalumab
(210 mg or 140 mg) and the placebo treatment arms for both the sPGA and PASI 75 success rates.
For the randomised withdrawal phase, it was assumed that 72% and 77% of subjects initially randomised
to the 140 mg dose and the 210 mg dose of brodalumab were to be re-randomised at week 12. The sPGA
success rate at week 52 for both of the brodalumab groups was assumed to be 65%, and 35% for the
withdrawal group. Under these assumptions, the power to detect a difference between the proportion of
responders at week 52 would be more than 90% for both doses of brodalumab, at alpha = 0.05 2-sided
level.
Randomisation
Subjects were randomised at baseline to receive 210 mg brodalumab, 140 mg brodalumab, or placebo in
a 1:1:1 ratio stratified by baseline total body weight (≤ 100 kg; > 100 kg), by prior biologic use (subjects
with prior biologic use were capped at 50% of the study population), and by geographic region (defined
by country for non-US countries and by geographic region in the US [US-West, US-Midwest,
US-Northeast, US-South]). Subjects who were originally randomised to either of the brodalumab arms
and who had an sPGA = 0 or 1 at the week-12 visit were re-randomised via IVRS at the week-12 visit to
receive brodalumab at their originally randomised dose or placebo in a 1:1 ratio.
Blinding (masking)
The original randomization and the second randomization for the withdrawal phase remained blinded to
all subjects, investigators, and the Amgen clinical study team until data through week 52 were finalized,
at which time an unblinded analysis of all data through week 52 (including the co-primary endpoints) was
performed. Throughout the study, subjects received placebo as needed to maintain the blind until it was
broken. Placebo was presented in identical containers and was stored/packaged the same as brodalumab
during the blinded portion of the study.

Assessment report
EMA/381484/2017 Page 44/135
Statistical methods
The efficacy analysis through week 52 was based on the randomised treatment assignment regardless of
the actual treatment received during the study. All primary, secondary, and exploratory efficacy
endpoints up to week 12 were evaluated using the full analysis set. For endpoints evaluated after the
re-randomization, the efficacy evaluable subset for the withdrawal phase (re-randomised subjects)
analysis set was used. Subjects were analysed according to their re-randomised treatment arm.
Based on results of simulations of previous datasets, which showed that multiple imputation performed
better than LOCF and the mixed effects model, the company has chosen to use multiple imputation was
used as the primary analysis method for handling missing continuous data. Last observation carried
forward was performed as sensitivity analysis for the primary and key secondary endpoints. In multiple
imputation, all post-baseline missing values for continuous efficacy endpoints were imputed separately
resulting in 3 complete sets by Markov chain Monte Carlo (MCMC) method for each endpoint. The
imputations were conducted based on all visits, simultaneously. Then the missing percent improvement
of PASI score, the missing improvement of BSA, NAPSI score and Psoriasis Symptom Inventory total
score were derived accordingly. The imputation models were stratified by the induction treatment group.
For withdrawal phase endpoints through week 52, missing categorical variables were imputed as
non-responders for binary endpoints and worst-cases for ordinal endpoints. Missing continuous variables
were imputed by last observation carried forward (LOCF). Observed analysis was be used as sensitivity
analysis.
The analysis methods were dependent on whether the variable for the efficacy endpoint was continuous,
dichotomous, or ordinal. The analysis methods and corresponding covariates included in the analysis
model are summarized in Table 11.

Assessment report
EMA/381484/2017 Page 45/135
Table 11: Summary of analysis methods and corresponding covariates in study 20120062.
Adjustment for multiple comparisons:
In order to maintain the family-wise type-1 error rate at 5% 2-sided, a sequential testing approach will be
followed. The co-primary endpoints, sPGA success and PASI 75, for the comparisons between brodalumab
210 mg Q2W group and placebo will be tested simultaneously each at alpha = 0.05 level. If the null
hypothesis for both of the co-primary endpoints is rejected, the hypotheses for the co-primary endpoints
for the comparisons between brodalumab 140 mg Q2W group and placebo will be tested simultaneously.
If either hypothesis is not rejected, all the subsequent hypotheses for key secondary endpoints will not be
tested. If the hypotheses for co-primary endpoints are rejected, the hypotheses corresponding to the key
secondary endpoints will be tested sequentially in the order listed above (see Figure 2 below).

Assessment report
EMA/381484/2017 Page 46/135
The p-values for the analyses of other secondary and exploratory endpoints were nominal without
adjusting for multiplicity.
Figure 2: Summary of the sequential testing procedure for the co-primary and key secondary
endpoints in study 20120012.
The adjusted p-values, constructed according to the sequential testing procedure will be provided so that
the statistical significance of a test can be obtained by comparing the adjusted p-value with a nominal
significance level 0.05. The definitions of the adjusted p-values for co-primary and key secondary
endpoints are summarized in the Table 12 below.
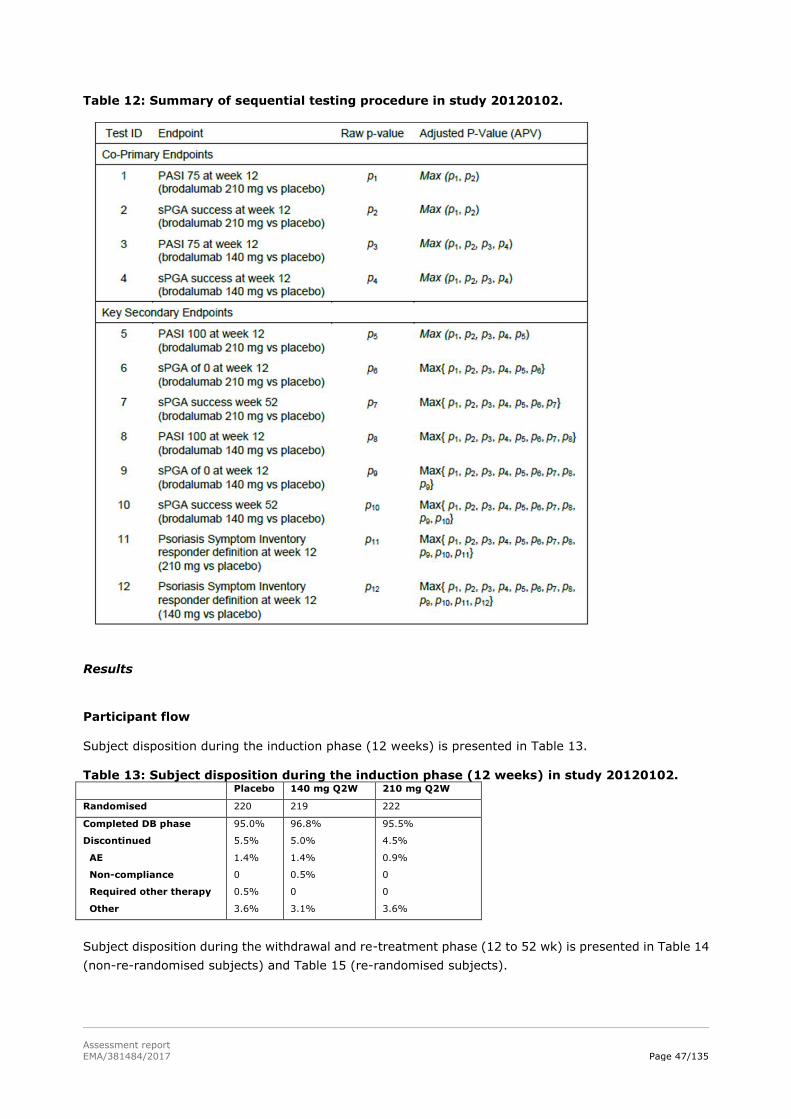
Assessment report
EMA/381484/2017 Page 47/135
Table 12: Summary of sequential testing procedure in study 20120102.
Results
Participant flow
Subject disposition during the induction phase (12 weeks) is presented in Table 13. Table 13: Subject disposition during the induction phase (12 weeks) in study 20120102. Placebo 140 mg Q2W 210 mg Q2W
Randomised 220 219 222
Completed DB phase
Discontinued
AE
Non-compliance
Required other therapy
Other
95.0%
5.5%
1.4%
0
0.5%
3.6%
96.8%
5.0%
1.4%
0.5%
0
3.1%
95.5%
4.5%
0.9%
0
0
3.6%
Subject disposition during the withdrawal and re-treatment phase (12 to 52 wk) is presented in Table 14
(non-re-randomised subjects) and Table 15 (re-randomised subjects).

Assessment report
EMA/381484/2017 Page 48/135
Table 14: Subject disposition for non-re-randomised subjects during the withdrawal phase in study 20120102 Placebo/
210 mg Q2W
140 mg Q2W/
210 mg Q2W
210 mg Q2W/
210 mg Q2W
N 208 92 45
Completed phase
Discontinued
AE
Required other therapy
Other
89.9%
9.6%
1.9%
2.4%
5.3%
76.1%
22.8%
1.1%
8.7%
13%
68.9%
31.1%
4.4%
6.7%
20%
Table 15: Subject disposition for re-randomised subjects during the withdrawal phase in study 20120102
140 mg Q2W 210 Q2W
Placebo 140 mg Q2W Placebo 210 mg Q2W
Randomised 59 57 84 83
Completed phase
Entered re-treatment
Discontinued
AE
Other
10.2%
89.8%
0
78.9%
21.1%
0
2.4%
94.0%
3.6%
0
3.6%
89.2%
6.0%
4.8%
2.4%
2.4%
Recruitment
This study was conducted at 73 centres in Europe (France, Germany, Poland, and Switzerland), Canada,
and the United States (US). The study was initiated 29th of August 2012. Primary analysis data cut-off was
12th of March 2014.
Conduct of the study
The original protocol for the study was approved on 20 February 2012 and was amended three times till
the data cut-off point. Most important amendment was the implementation of the Columbia-Suicide
Severity Rating Scale, and Patient Health Questionnaire-8 depression scale assessments in March 2014
after reports of suicidal behaviour and ideation occurred.
Two changes in statistical analysis occurred. First amendment concerned exclusion of a patient from the
per protocol analysis set. This was originally to be done if a patient missed >2 consecutive doses of active
IP. However in the analysis the definition was 2 or more. The second amendment concerned a change in
study visit window on study week 52 and 53.
Baseline data
Baseline patient demographics and disease specific characteristics are presented in Table 16.

Assessment report
EMA/381484/2017 Page 49/135
Table 16: Baseline patient demographics and disease specific characteristics in study 20120102. Placebo
(N=220)
140 mg Q2W
(N=219)
210 mg Q2W
(N=222)
Age, mean 46.9 45.8 46.3
Female, % 26.8% 26.0% 27.5%
Weight, mean kg 90.4 90.6 91.4
Disease duration, mean yrs 20.7 19.4 20.4
PASI mean (SD) 19.7 (7.7) 20.0 (7.4) 19.4 (6.6)
sPGA
3
4
5
51.8%
41.4%
6.8%
58.9%
36.5%
4.6%
54.5%
39.2%
6.3%
PSI, mean 19.0 19.7 18.9
Treatment naïve % 6.8% 6.4% 7.2%
Prior systemic therapy % 74.5% 65.3% 69.8%
The most common prior non-biologic systemic therapy was methotrexate, followed by ciclosporin and oral
retinoids.
46.1% of the patients had received prior biologic therapy and 18.5% patients had previously experienced
a prior failure of a biologic treatment for psoriasis. The most common prior systemic biologic therapies
were etanercept (25.7%), ustekinumab (17.4%), and adalimumab (16.3%).
Numbers analysed
The total numbers of subjects included in each analysis subset is summarized in Table 17.
Table 17: Analysis subsets in study 20120102.
N
Full analysis set 661
Withdrawal phase
Non-re-randomised
Re-randomised
628
346
283
Safety analysis set 661

Assessment report
EMA/381484/2017 Page 50/135
Outcomes and estimation
Summary of main efficacy results of study 20120102 is presented in Table 18.
Table 18: Summary of main efficacy results of study 20120102. Placebo 140 mg Q2W 210 mg Q2W
nrandomised 220 219 222
PASI75
(95% CI)
RD vs pbo
(95% CI)
p value vs. pbo
2.7%
(1.0 – 5.8)
.
60.3%
(53.5 – 66.8)
0.58
(0.51 – 0.64)
<0.001
83.3%
(77.8 – 88.0)
0.81
(0.75 – 0.87)
<0.001
sPGA success
(95% CI)
RD vs pbo
(95% CI)
p value vs. pbo
1.4%
(0.3 – 3.9)
53.9%
(47.0 – 60.6)
0.53
(0.46 – 0.59)
<0.001
75.7%
(69.5 – 81.2)
0.74
(0.69 – 0.80)
<0.001
PASI 100
(95% CI)
RD vs pbo
(95% CI)
p value vs. pbo
0.5
(0.0 – 2.5)
23.3%
(17.9 – 29.5)
0.23
(0.17 – 0.29)
<0.001
41.9%
(35.3 – 48.7)
0.41
(0.35 – 0.48)
<0.001
PSI (95% CI)
RD vs pbo
(95% CI)
p value vs. pbo
4.1
(1.9 – 7.6)
53.0%
(46.1 – 59.7)
0.49
(0.42 – 0.56)
<0.001
60.8%
(54.1 – 67.3)
0.57
(0.40 – 0.50)
<0.001
Co-primary endpoint (adjusted p-values presented)
Brodalumab 210 mg and 140 mg Q2W demonstrated superior efficacy (p<0.001) to placebo in PASI 75
responders, sPGA success at week 12.
The results in the per-protocol group analysis were consistent with the full analysis set, and sensitivity
analyses (as observed i.e. no imputation and LOCF) were consistent with the primary analysis (NR
imputation).
Key secondary endpoints
Brodalumab 140 mg QW2 and 210 mg Q2W demonstrated superior efficacy (p<0.001) to placebo in
complete clearance of lesions as measure by PASI 100 responders and sPGA 0 responders at week 12.
Both brodalumab strengths were also superior to placebo with respect to the patient reported outcome
scale PSI responders (p<0.001).
The results in the per-protocol group analysis were consistent with the full analysis set, and sensitivity
analyses (as observed i.e. no imputation and LOCF) were consistent with the primary analysis (NR
imputation).

Assessment report
EMA/381484/2017 Page 51/135
Other secondary endpoints
Both brodalumab doses demonstrated superiority to placebo in NAPSI score at week 12 (nominal p
<0.001). The same applies to improvement at week 12 in PSSI score and SSA score, as well as the
percentage of subjects who had a ≥ 5 point improvement at week 12 in DLQI score.
Maintenance of effect
Maintenance of effect was measured by the proportion of subjects with sPGA success at week 52 2. As the
analysis of the withdrawal endpoint of sPGA success at week 52 was limited to subjects who achieved
success at week 12, estimates of the maintenance effect with continued brodalumab treatment should be
interpreted within the context of a subject having already responded to treatment with brodalumab.
Among subjects originally randomised to 210 mg Q2W in the induction phase, no subject re-randomised
to placebo and withdrawn from brodalumab treatment maintained sPGA success at week 52, while 83.1%
of subjects re-randomised to continued treatment with 210 mg Q2W maintained sPGA success at week
52. Among subjects who were originally randomised to 140 mg Q2W in the induction phase and
re-randomised to placebo, 5.1% maintained sPGA success at week 52. In contrast, 70.2% of subjects
who were re-randomised to continued treatment with 140 mg Q2W in the withdrawal phase maintained
sPGA success at week 52.
Patients who were re-treated after inadequate response during the withdrawal phase started responding
to treatment within 2 weeks. The Kaplan Meier estimates of median time to sPGA success in subjects
re-randomised to placebo and re-treated with brodalumab were 6.14 days (95% CI 5.71 – 6.43) in the
140 mg Q2W group and 4.29 days (95% CI 2.29 – 4.14) in the 210 mg Q2W group.
The Kaplan Meier estimates of median time to PASI 75 response in subjects re-randomised to placebo and
re-treated with brodalumab were 3.7 days (95% CI 2.14 – 4.14) in the 140 mg Q2W group and 4.14 days
(95% CI 4.14 – 6.14) in the 210 mg Q2W group.
Figure 3 presents the Kaplan-Meyer estimates of time to first loss of sPGA ≤2 response. Two weeks after
re-randomization to placebo, 69.5% and 88.1% remained sPGA success responders in the initial
brodalumab 140 mg Q2W group and 210 mg Q2W group, respectively.
Two weeks after the re-randomization to placebo, 79.6% and 94.0% were PASI 75 responders in the
initial brodalumab 140 mg Q2W group and 210 mg Q2W group, respectively.
Figure 3: Kaplan Meier estimates of time to first loss of sPGA ≤2 response (As Observed) by treatment group during the withdrawal phase.
N = Number of subjects in the analysis set. KM = Kaplan-Meier. CI=Confidence Interval. NE=not estimable
Subjects are considered at risk if they have not experienced loss of sPGA ≤ 2 response or been censored prior to the specified week 52
Treatment groups are defined as planned treatment for the induction / withdrawal phases
Assessment report
EMA/381484/2017 Page 52/135
Ancillary analyses
657 patients were tested for anti-Brodalumab antibodies. Out of 645 treated patients 4 (0.6%) were
tested positive for pre-existing binding antibodies. 14 Patients (2.2%) developed binding
anti-Brodalumab antibodies following Brodalumab administration. Neutralizing anti-Brodalumab
antibodies were not detected in any subject in the study.
A Phase 3 Study to Evaluate the Efficacy and Safety of Induction and Maintenance Regimens
of Brodalumab Compared With Placebo and Ustekinumab in Subjects with Moderate to Severe
Plaque Psoriasis: AMAGINE-2 (Study 20120103)
Methods
Study Participants
The eligibility criteria were mainly the same as for study 20090062:
Eligible subjects were men and women who were ≥ 18 and ≤ 75 years of age at the time of screening with
stable, moderate to severe plaque psoriasis diagnosed ≥ 6 months before first dose of investigational
product, involved body surface area (BSA) ≥ 10%, PASI ≥ 12, and sPGA ≥ 3 at screening and at
baseline. Subjects must have completed appropriate washout periods for drugs and must have been free
of infections requiring systemic anti-infectives and of significant concurrent medical conditions. If
applicable, women must have been willing to use highly effective birth control.
But there were some additions:
- Subject has used topical therapy as follows:
Super-potent or potent topical steroids or topical anthralin/Dithranol within 28 days
before first dose of IP
Any other formulation or potency of topical therapy within 14 days before first dose of IP
(exception: upper mid-strength or lower potency topical steroids permitted on the face,
axillae, and groin; bland emollients [without urea or alpha or beta hydroxy acids];
shampoo without steroids).
- Subject has received live vaccine(s) within 28 days of the first dose of IP (or longer, according to
local requirements for ustekinumab [e.g., 1 year in the United States for BCG vaccination]).
- Subject has used ustekinumab and/or anti-IL-17 biologic therapy ever or other experimental or
commercially available biologic immune modulator(s) within 12 weeks prior to the first IP dose.
- For women (except if surgically sterile or at least 2 years postmenopausal, with postmenopausal
status confirmed by FSH in the postmenopausal range): not willing to use highly effective
methods of birth control during treatment and for 15 weeks after the last dose (if discontinuing
before week 52) or for 8 weeks after the last dose (if discontinuing at or after week 52).
- For women: pregnant or breast feeding, or planning to become pregnant while enrolled in the
study and for 15 weeks after the last dose (if discontinuing before week 52) or for 8 weeks after
the last dose (if discontinuing at or after week 52).

Assessment report
EMA/381484/2017 Page 53/135
Treatments
Amgen investigational product:
Brodalumab and/or matching placebo were administered as 2 blinded subcutaneous (SC) injections (one
1.0-mL [140 mg] and one 0.5-mL [70 mg]) Q2W starting on day 1, with additional doses at week 1 and
week 13. In addition, to maintain the blind to rescue treatment, Amgen investigational product
(Brodalumab and/or placebo) was also administered at week 17. Amgen investigational product was
administered as a SC injection to the abdomen, thigh, or upper arm.
Non-Amgen investigational product:
Ustekinumab or matching placebo were administered as 1 or 2 blinded SC injections (0.5 mL [45 mg]) at
day 1 and weeks 4, 16, 28, and 40, depending on subject weight at the baseline visit (1 injection if ≤100
kg and 2 injections if > 100 kg). For subjects who received 2 injections of non-Amgen IP per dose, the 2
injections were to be administered in different body regions (upper arms, gluteal regions, thighs, or
abdomen).
Induction
After the screening period, subjects entered a 12-week, double-blind, active comparator and
placebo-controlled induction phase where they were randomised in a 2:2:1:1 ratio to 1 of the following
treatment groups: Brodalumab 210 mg Q2W, Brodalumab 140 mg Q2W, ustekinumab (45 mg if ≤ 100 kg
at the baseline visit, 90 mg if > 100 kg at the baseline visit) or placebo. Randomization was stratified by
baseline total body weight (≤ 100 kg; > 100 kg), by prior biologic use, and by geographic region.
All subjects received 2 injections of Amgen IP at day 1 and weeks 1, 2, 4, 6, 8, and 10. These injections
were Brodalumab and/or placebo for Brodalumab, depending upon randomised arm.
All subjects also received non-Amgen IP at day 1 and week 4. These injections were ustekinumab or
placebo for ustekinumab, depending upon randomised arm. Subjects ≤ 100 kg at the baseline visit
received one 0.5 ml injection of non-Amgen IP at day 1 and week 4 while subjects > 100 kg at the
baseline visit received two 0.5 ml injections of non-Amgen IP at day 1 and week 4.
At week 12 visit subjects originally randomised to either Brodalumab groups were rerandomised
(2:2:2:1) into the maintenance phase to receive Brodalumab 210 mg Q2W, 140 mg Q2W, 140 mg every
4 weeks (Q4W), or 140 mg every 8 weeks (Q8W).
Rerandomization was stratified by total body weight, original induction regimen and week-12 response
(sPGA 0 vs sPGA ≥1).
Subjects originally randomised to ustekinumab continued to receive ustekinumab while subjects who
received placebo were switched to Brodalumab 210 mg Q2W.
Maintenance
All subjects continued to receive Amgen and non-Amgen IP (2 injections of Amgen IP at weeks 12, 13, 14,
16, 17, 18 and every 2 weeks, non-Amgen IP [1 injection for subjects ≤ 100 kg at the baseline visit, 2
injections for subjects > 100 kg at the baseline visit] at weeks 16, 28, and 40.
Subjects with inadequate response (defined as a single sPGA of ≥ 3 or persistent sPGA values of 2 over ≥
a 4-week period) may have qualified for rescue treatment at or after week 16.
Rescue treatment was with Brodalumab 210 mg for all subjects, including those on ustekinumab at week
16. After week 16 and through week 52, subjects on Brodalumab rescued with Brodalumab 210 mg Q2W
and subjects on ustekinumab rescued with ustekinumab. Rescue treatment was blinded. At week 52,

Assessment report
EMA/381484/2017 Page 54/135
subjects who were on Brodalumab continued to receive Brodalumab at their maintenance or rescue phase
dose; subjects who were originally randomised to ustekinumab received Brodalumab 210 mg Q2W.
Long-term Extension
• All subjects received Amgen IP (Amgen IP at weeks 52, 53, 54, and every 2 weeks). Until the
blind was broken, these were 2 injections. After the blind was broken, subjects received 1
injection if receiving 140 mg or 2 injections if receiving 210 mg.
Objectives
Primary
Compared with placebo:
to evaluate the efficacy of Brodalumab (210 mg every 2 weeks [Q2W]; and 140 mg Q2W) in
subjects with moderate to severe plaque psoriasis, as measured by the proportion of subjects
achieving 75% improvement in Psoriasis Area and Severity Index (PASI; PASI 75) at week 12 and
the proportion of subjects achieving success (clear [0] or almost clear[1]) on the static
Physician´s Global assessment (sPGA) at week 12.
Compared with ustekinumab:
to evaluate the efficacy of Brodalumab (210 mg Q2W; and 140 mg Q2W for subjects ≤ 100 kg
and 210 mg Q2W for subjects > 100 kg) in clearing psoriasis in subjects with moderate to severe
plaque psoriasis, as measured by the proportion of subjects achieving PASI 100 at week 12.
Key Secondary
Compared with Placebo:
to evaluate the efficacy of Brodalumab (210 mg Q2W; and 140 mg Q2W) in clearing psoriasis, as
measured by the proportion of subjects achieving PASI 100 at week 12
to evaluate the efficacy of Brodalumab (210 mg Q2W; and 140 mg Q2W) in clearing psoriasis, as
measured by the proportion of subjects achieving sPGA of 0 at week 12
to evaluate the effect of Brodalumab (210 mg Q2W; and 140 mg Q2W) on patient-reported
symptoms of psoriasis, as measured by the proportion of subjects who meet the responder definition
for the Psoriasis Symptom Inventory (PSI; total score ≤ 8, with no item scores > 1) at week 12
Compared with Ustekinumab:
to evaluate the efficacy of Brodalumab (140 mg Q2W) in clearing psoriasis, as measured by the
proportion of subjects achieving PASI 100 at week 12
to evaluate the efficacy of Brodalumab (210 mg Q2W; and 140 mg Q2W for subjects ≤ 100 kg
with 210 mg Q2W for subjects > 100 kg), as measured by the proportion of subjects achieving
PASI 75 at week 12
Other secondary endpoints were to compare the efficacy of Brodalumab maintenance regimens, as
measured by the proportion of subjects achieving success on the sPGA at week 52, to evaluate whether
there is a weight threshold for the higher dose of Brodalumab, to evaluate the onset of response of
Brodalumab, the short-(12weeks) and long-term (5years) safety profile of Brodalumab

Assessment report
EMA/381484/2017 Page 55/135
Outcomes/endpoints
Co-primary (Brodalumab vs Placebo):
PASI 75 at week 12
sPGA success at week 12
Primary (Brodalumab vs Ustekinumab):
PASI 100 at week 12
o Brodalumab 210 mg Q2W
o Brodalumab 140 mg Q2W for subjects ≤ 100 kg with 210 mg dosage for
subjects > 100 kg
Key Secondary (Brodalumab vs Placebo):
PASI 100 at week 12
sPGA of 0 at week 12
PSI responder definition at week 12
Key Secondary (Brodalumab vs Ustekinumab):
PASI 100 at week 12
o 140 mg Q2W
PASI 75 at week 12
o 210 mg Q2W
o 140 mg Q2W for subjects ≤ 100 kg with 210 mg dosage for subjects > 100
kg
Other Secondary
sPGA success at week 52
Safety: Adverse events, events of interest, presence of binding and/or neutralizing anti-Brodalumab
antibodies, and electrocardiograms.
Other endpoints included sPGA success (at other time points), time to sPGA success, PASI 75, PASI 90,
and PASI 100 (at other time points), time to PASI response, percentage improvement in PASI,
patient-reported outcome (PRO) measures, and pharmacokinetics.
Sample size
Sample size calculations for studies 2012103 and 2012104 (see below) were identical. Both studies had
two families of null hypotheses (Brodalumab vs placebo and Brodalumab vs ustekinumab). The two
families of null hypotheses were to be tested in parallel at alpha = 0.01 (2-sided) and 0.04 (2-sided) for
the Brodalumab vs placebo and the Brodalumab vs ustekinumab families, respectively.
The following assumptions regarding success- / response rates were made for sample size calculation:
Brodalumab
Endpoint (at week 12) Placebo Ustekinumab 140 mg 210 mg Weight adjusted
PASI75 10% 72.5% 77% 82.5% 82.5%
sPGA(0,1) 10% - 72% 77% -
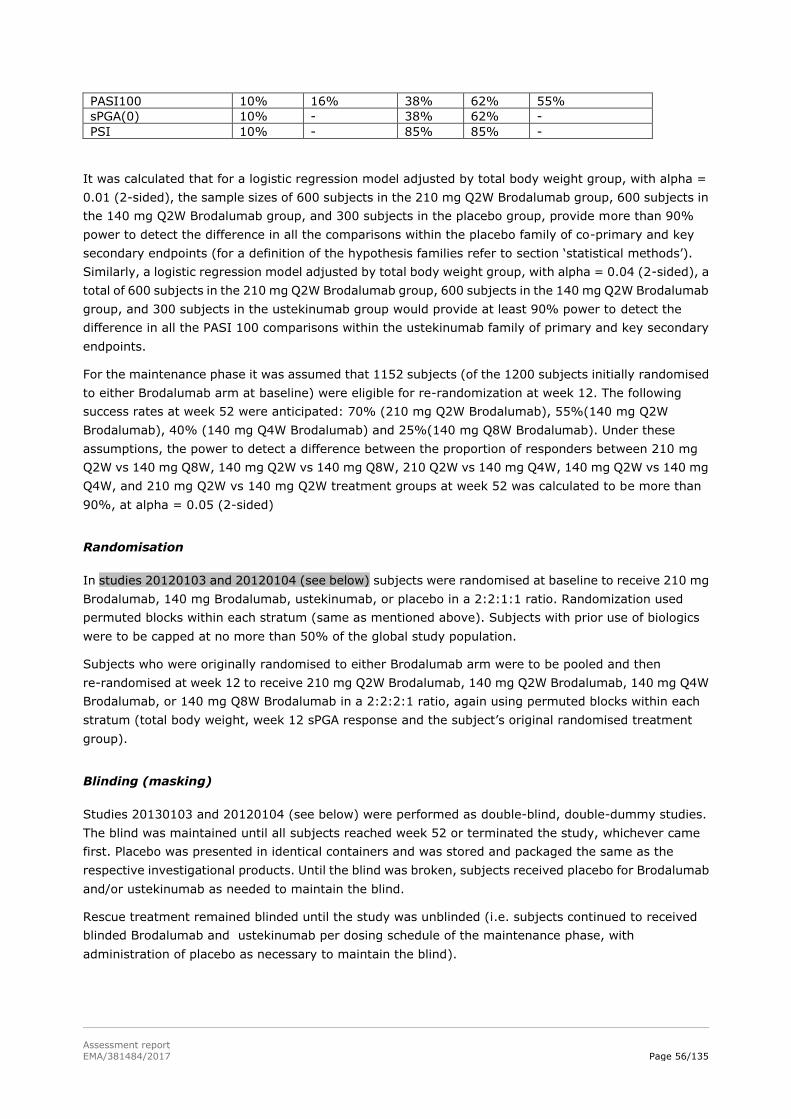
Assessment report
EMA/381484/2017 Page 56/135
PASI100 10% 16% 38% 62% 55%
sPGA(0) 10% - 38% 62% -
PSI 10% - 85% 85% -
It was calculated that for a logistic regression model adjusted by total body weight group, with alpha =
0.01 (2-sided), the sample sizes of 600 subjects in the 210 mg Q2W Brodalumab group, 600 subjects in
the 140 mg Q2W Brodalumab group, and 300 subjects in the placebo group, provide more than 90%
power to detect the difference in all the comparisons within the placebo family of co-primary and key
secondary endpoints (for a definition of the hypothesis families refer to section ‘statistical methods’).
Similarly, a logistic regression model adjusted by total body weight group, with alpha = 0.04 (2-sided), a
total of 600 subjects in the 210 mg Q2W Brodalumab group, 600 subjects in the 140 mg Q2W Brodalumab
group, and 300 subjects in the ustekinumab group would provide at least 90% power to detect the
difference in all the PASI 100 comparisons within the ustekinumab family of primary and key secondary
endpoints.
For the maintenance phase it was assumed that 1152 subjects (of the 1200 subjects initially randomised
to either Brodalumab arm at baseline) were eligible for re-randomization at week 12. The following
success rates at week 52 were anticipated: 70% (210 mg Q2W Brodalumab), 55%(140 mg Q2W
Brodalumab), 40% (140 mg Q4W Brodalumab) and 25%(140 mg Q8W Brodalumab). Under these
assumptions, the power to detect a difference between the proportion of responders between 210 mg
Q2W vs 140 mg Q8W, 140 mg Q2W vs 140 mg Q8W, 210 Q2W vs 140 mg Q4W, 140 mg Q2W vs 140 mg
Q4W, and 210 mg Q2W vs 140 mg Q2W treatment groups at week 52 was calculated to be more than
90%, at alpha = 0.05 (2-sided)
Randomisation
In studies 20120103 and 20120104 (see below) subjects were randomised at baseline to receive 210 mg
Brodalumab, 140 mg Brodalumab, ustekinumab, or placebo in a 2:2:1:1 ratio. Randomization used
permuted blocks within each stratum (same as mentioned above). Subjects with prior use of biologics
were to be capped at no more than 50% of the global study population.
Subjects who were originally randomised to either Brodalumab arm were to be pooled and then
re-randomised at week 12 to receive 210 mg Q2W Brodalumab, 140 mg Q2W Brodalumab, 140 mg Q4W
Brodalumab, or 140 mg Q8W Brodalumab in a 2:2:2:1 ratio, again using permuted blocks within each
stratum (total body weight, week 12 sPGA response and the subject’s original randomised treatment
group).
Blinding (masking)
Studies 20130103 and 20120104 (see below) were performed as double-blind, double-dummy studies.
The blind was maintained until all subjects reached week 52 or terminated the study, whichever came
first. Placebo was presented in identical containers and was stored and packaged the same as the
respective investigational products. Until the blind was broken, subjects received placebo for Brodalumab
and/or ustekinumab as needed to maintain the blind.
Rescue treatment remained blinded until the study was unblinded (i.e. subjects continued to received
blinded Brodalumab and ustekinumab per dosing schedule of the maintenance phase, with
administration of placebo as necessary to maintain the blind).

Assessment report
EMA/381484/2017 Page 57/135
Statistical methods
In studies 20120103 and 20120104 (see below) treatment comparisons for binary endpoints were done
by means of Cochran-Mantel-Haenszel (CMH) tests. The analyses were generally stratified by baseline
total body weight (≤ 100 kg, > 100 kg), prior biologic use, and geographic region. For PASI 75 response,
baseline PASI (≤ median, > median) was an additional stratification factor. Baseline sPGA (3, 4, 5) was
an additional stratification factor for sPGA. Continuous data were analysed by means of ANCOVA models
applying the above mentioned stratification factors and – where appropriate - including baseline as a
covariate. For all analyses through week 12, missing data for dichotomous endpoints were imputed as
non-responders while missing continuous data were imputed by multiple imputation. Sensitivity analyses
included as-observed and last observation carried forward (LOCF) imputation.
In all studies the primary efficacy analysis as well as the secondary analyses regarding the induction
phase were done on the FAS (including all randomised patients and patients treated as randomised).
In studies 2012103 and 2012104 there were two families of primary hypotheses . The first set of primary
hypotheses (placebo family) was that Brodalumab at 210 mg Q2W and 140 mg Q2W would demonstrate
superior efficacy over placebo with regard to sPGA success and PASI 75 response at week 12. The second
set of primary hypotheses (ustekinumab family) was that Brodalumab (at the 210 mg dosage and at the
140 mg dosage for subjects ≤ 100 kg with 210 mg dosage for subjects > 100 kg) would demonstrate
superior ability to clear psoriasis compared with ustekinumab regarding PASI 100 response at week 12.
To control the type 1 error alpha was split between both families: alpha = 0.01 (2-sided) was allocated
to the placebo family and alpha = 0.04 (2-sided) was allocated to the ustekinumab family.
To maintain the type I error of 0.01 for the placebo family a sequential testing strategy was applied (the
procedure had to stop in case of a p-value > 0.01): In step 1 the superiority of Brodalumab 210 mg over
placebo with regard to PASI 75 response and sPGA success (both at week 12) had to be shown. Only if this
condition was fulfilled the superiority of Brodalumab 140 mg over placebo for PASI 75 response and for
sPGA success (both at week 12) was tested. Only in case of a significant result for both primary endpoints
the key secondary endpoints were to be tested in hierarchical order: PASI100 at week 12 (210 mg vs.
placebo), sPGA of 0 at week 12 (210 mg vs. placebo), PASI100 at week 12 (140 mg vs. placebo), sPGA
of 0 at week 12 (140 mg vs. placebo), PSI response at week 12 (210 mg v. placebo) and PSI response at
week 12 (140 mg v. placebo).
To maintain the type I error for the ustekinumab family a sequential testing procedure was applied (the
procedure had to stop in case of a p-value > 0.04): in step 1 for PASI 75 response as well as for sPGA
success (both at week 12) superiority of Brodalumab 210 mg over placebo had to be shown. In step 2
superiority of weight adjusted Brodalumab over placebo with regard to both endpoints had to be shown.
The key secondary endpoints were then to be tested in the following order: PASI100 at week 12 (140 mg
vs. ustekinumab), PASI75 at week 12 (210 mg vs. ustekinumab) and PASI75 at week 12 (weight adjusted
Brodalumab vs. ustekinumab).
For maintenance treatment it was hypothesized that subjects who continued to receive Brodalumab 210
mg Q2W or 140 mg Q2W would demonstrate superior sPGA success at week 52 compared to those
randomised to receive Brodalumab at lower frequencies in the maintenance phase (140 mg Q4W and 140
mg Q8W). After re-randomization at week 12, the maintenance phase endpoint was tested at full alpha =
0.05.

Assessment report
EMA/381484/2017 Page 58/135
Results
Participant flow
A total of 1831 patients were randomised into the study:
o Induction Phase:
o Maintenance Phase:

Assessment report
EMA/381484/2017 Page 59/135
Recruitment
The first subject was enrolled on 22 August 2012.
Primary analysis data cut-off date was the 22 September 2014.
The total duration of treatment including the induction, maintenance and long-term extension was
planned to be 266 weeks
Conduct of the study
Changes in Statistical Methods:
The SAR was amended to provide details of statistical analysis outlined in Protocol Amendments 2 and 3.
Analyses were performed as described in the final SAR approved 07 October 2014.
Protocol Deviations:
Important protocol deviations were reported for 122 of 1831 subjects (6.7%) during the induction phase.
Important protocol deviations were reported at similar rates across treatment groups (range of 5.6% to
6.5%), with the exception of the ustekinumab group (9.7%). Overall, “efficacy assessments conducted
by non-certified assessors” was the most commonly reported important protocol deviation during this
phase (2.3%).
Between weeks 12 and 52, important protocol deviations were reported for 145 of 1760 subjects (8.2%).
Deviations were more common in the Brodalumab 140 mg Q8W group (14.3%) compared with the other
treatment groups (range of 6.1% to 9.3%). Differences were primarily driven by a higher incidence of the
following deviations, which each occurred in 3.6% of subjects in this treatment group: “subject dosed
with compromised investigational product,” “treatment received is different from assigned,” and “rescue
sPGA incorrect.”
An IVRS programming error was identified that affected treatment assignments at week 17 for 33
ustekinumab subjects who rescued at week 16 with Brodalumab 210 mg. Because of the error, these

Assessment report
EMA/381484/2017 Page 60/135
subjects received a placebo loading dose at week 17 instead of Brodalumab 210 mg as specified in the
protocol.
No subject data were excluded from the Full Analysis Set because of protocol deviations.
Baseline data
A total of 1831 subjects were enrolled in the study, of which 1258(68.7%) were men and the mean age
was 44.6 (18to 76) years. 1652 were White (90.2%), 68 were Asian (3.7%), 53 were Black (2.9%) and
58 others (3.1%).

Assessment report
EMA/381484/2017 Page 61/135

Assessment report
EMA/381484/2017 Page 62/135
Numbers analysed
The number of patients in each analysis is presented below.

Assessment report
EMA/381484/2017 Page 63/135
Outcomes and estimation
Induction Endpoints at Week 12
Co-primary Endpoints- Compared with placebo:
PASI 75 at week 12
The differences in response rates from the placebo group for both the 210 mg Q2W and 140 mg Q2W
groups were statistically significant based on the adjusted p-values (p < 0.001). The percentage of PASI
75 responders at week 12 was 86.3% in the 210 mg Q2W group, 66.6% in the 140 mg Q2W group, and
8.1% in the placebo group. The results at week 12 in the Per-protocol Analysis Set were consistent with
those observed using the Full Analysis Set.
sPGA Success 8= or 1) at week 12
The differences in response rates from the placebo group for both the 210 mg Q2W and 140 mg Q2W
groups were statistically significant based on the adjusted p-values (p < 0.001). The percentage of
subjects who achieved sPGA success at week 12 was 78.6% in the 210 mg Q2W group, 58.0% in the 140
mg Q2W group, and 3.9% in the placebo group. The results at week 12 in the Per-protocol Analysis Set
were consistent with those observed using the Full Analysis Set.
Analysis results of the co-primary and key secondary endpoints at week 12 are summarized below.
Key secondary endpoints- compared to placebo
PASI 100 at week 12
The differences in response rates from the placebo group for the 210 mg Q2W and 140 mg Q2W groups
were statistically significant based on the adjusted p-values (p < 0.001). The percentage of PASI 100
responders at week 12 was 44.4% in the 210 mg Q2W group, 25.7% in the 140 mg Q2W group, and 0.6%
in the placebo group.
sPGA 0 (Clear) at week 12
The differences in response rates from the placebo group for the 210 mg Q2W and 140 mg Q2W groups
were statistically significant based on the adjusted p-values (p < 0.001). The percentage of sPGA 0
responders at week 12 was 44.8% in the 210 mg Q2W group, 25.7% in the 140 mg Q2W group, and 0.6%
in the placebo group.
PSI Responder at week 12
The percentage of PSI responders at week 12 was 67.6% in the 210 mg Q2W group, 51.5% in the 140 mg
Q2W group, and 6.8% in the placebo group. These differences were statistically significant based on the
adjusted p-value (p<0.001).

Assessment report
EMA/381484/2017 Page 64/135
Table 19: Analysis results of the co-primary and key secondary endpoints at week 12
Comparisons with placebo yielded statistically significant results in favour of Brodalumab 210 mg Q2W
and 140 mg Q2W for both co-primary endpoints and the key secondary endpoints (adjusted p < 0.001).
Primary Endpoints- Compared with ustekinumab:
The difference in response rate from the ustekinumab group for the 210 mg Q2W group was statistically
significant based on the adjusted p-value (p < 0.001). The percentage of PASI 100 responders at week 12
was 44.4% in the 210 mg Q2W group and 21.7% in the ustekinumab group.
The difference in response rate from the ustekinumab group for the weight-based Brodalumab subgroup
(140 mg Q2W for subjects ≤ 100 kg and 210 mg Q2W for subjects > 100 kg) was statistically significant
based on the adjusted p-value (p < 0.001). The percentage of PASI 100 responders at week 12 was
33.6% in the weight-based Brodalumab group and 21.7% in the ustekinumab group.
Comparisons with ustekinumab yielded statistically significant results in favour of Brodalumab 210 mg
Q2W and the weight-based group for the primary endpoint.
Results of the first key secondary endpoint, PASI 100 at week 12 (140 mg Q2W vs ustekinumab; p =
0.078), were not statistically significant, and therefore subsequent endpoints were not formally tested as
a consequence of the sequential testing procedure.
Therefore, statistical significance was not demonstrated for differences in PASI 75 at week 12 for the
Brodalumab 210 mg Q2W and Brodalumab weight-based groups compared with ustekinumab, though the
response rates for PASI 75 in the Brodalumab 210 mg Q2W and Brodalumab weight-based groups were
both nominally significantly greater compared with ustekinumab.
Results of the co-primary and key secondary endpoints at week 12 are presented below.
Key Secondary Endpoints – Compared to ustekinumab
PASI 100 at Week 12 (Brodalumab 140 mg Q2W vs Ustekinumab)
The percentage of PASI 100 responders at week 12 was 25.7% in the 140 mg Q2W group and 21.7% in
the ustekinumab group. This difference in response was not statistically significant based on the adjusted
p-value (p=0.078).

Assessment report
EMA/381484/2017 Page 65/135
PASI 75 at Week 12 in (Brodalumab 210 mg Q2W and Weight-based vs Ustekinumab)
Based on the sequential testing procedure, all subsequent endpoints were not rejected regardless of their
nominal significance, for the reason the previously tested endpoint did not reach statistical significance.
The nominal p-value for the difference in response rate from the ustekinumab group for the 210 mg Q2W
was <0.001, but was not statistically significant based on the adjusted p-value (p = 0.078). The
percentage of PASI 75 responders at week 12 was 86.3% in the 210 mg Q2W group and 70.0% in the
ustekinumab group.
Similarly, the difference in response rate from the ustekinumab group for the weight-based Brodalumab
group was not statistically
significant.
Maintenance Endpoint at Week 52:
sPGA Success (0 or 1) at Week 52
The maintenance of effect was measured by the proportion of subjects with sPGA success at week 52
among subjects rerandomised to 1 of 4 maintenance arms of Brodalumab at week 12. Subjects with an
inadequate response who qualified for rescue on or after week 16 were imputed as non-responders at the
time of inadequate response. This non-responder imputation applied to all rerandomised subjects.
62.6% in subjects rerandomised to Brodalumab 210 mg Q2W, 42.7% in subjects rerandomised to 140 mg
Q2W, 9.0% in subjects rerandomised to 140 mg Q4W, and 4.8% in subjects rerandomised to 140 mg
Q8W achieved sPGA success at week 52.
All planned comparisons between the Brodalumab groups yielded statistically significant results in favour
of the higher dose and more frequent dosing regimen (adjusted p-values of < 0.001) with the 210 mg
Q2W group achieving the highest rates of sPGA success at week 52.

Assessment report
EMA/381484/2017 Page 66/135
For subjects who received Brodalumab 210 mg Q2W in the induction phase, sPGA success (0/1) was
achieved by 64.9% in subjects who continued 210 mg Q2W, 47.3% in subjects rerandomised to 140 mg
Q2W, 8.9% in subjects rerandomised to 140 mg Q4W, and 1.2% in subjects rerandomised to 140 mg
Q8W.
The percentage of subjects from the 140 mg Q2W group in the induction phase who achieved sPGA
success at week 52 were 60.2% in subjects rerandomised to 210 mg Q2W, 38.1% in subjects who
continued to receive 140 mg Q2W, 9.0% in subjects rerandomised to 140 mg Q4W, and 8.4% in subjects
rerandomised to 140 mg Q8W.
Using Non-Responder Imputation after a protocol-specified treatment change after experiencing an
inadequate response, the percentage of subject who achieved sPGA success (0 or 1) at week 52 was
74.4% for subjects who received Brodalumab 210 mg Q2W during induction and maintenance and 74.7%
for subjects who received Brodalumab 140 mg Q2W during induction and 210 mg Q2W during
maintenance.
For subjects who received placebo in the induction phase and were switched to Brodalumab 210 mg Q2W,
215 of 248 (86.7%) still on study at week 52 achieved sPGA success (0/1).
Among subjects who remained on ustekinumab during induction and maintenance, 50.9% achieved sPGA
success at week 52.
Onset of response:
Summary of PASI 75 during the induction phase shows that Brodalumab has a rapid onset of efficacy. At
week 4 PASI 75 was achieved by 61.4% in the 210 mg and 47.3% in the 140 mg Brodalumab group and
19% in the ustekinumab group.

Assessment report
EMA/381484/2017 Page 67/135
For PASI 90 the response rates at week 4 were 29.7% (Brodalumab 210mg Q2W), 23.1% (Brodalumab
140 mg Q2W), 4.7% (ustekinumab) and 0.3% (placebo). At week 8 the response rates were 61.8% (210
mg), 44.1% (140 mg), 31.0% (ustekinumab) and 1.9% (placebo).
For PASI 100 the response rate at week 4 was 9.2% for 210 mg Brodalumab Q2W, 9.9% for 140 mg
Brodalumab Q2W and 0.8% for ustekinumab. At week 8 the rates were already 35.4% for 210 mg
Brodalumab Q2W, 23.1% for 140 mg Brodalumab Q2W and 11.4 % for ustekinumab.
Figure 4: Summary of PASI 75 (NRI) During Induction Phase (Full Analysis Set):
Figure 5: Summary of PASI 90 (NRI) During Induction Phase (Full Analysis Set):

Assessment report
EMA/381484/2017 Page 68/135
Figure 6: Summary of PASI 100 (NRI) During Induction Phase (Full Analysis Set):
Key findings from other endpoints:
DLQI
Among subjects with a DLQI ≥ 5 at baseline, the percentage of subjects who had a ≥ 5 point
improvement at week 12 was 88.4% for the 210 mg Q2W group, 77.1% for the 140 mg Q2W group,
82.8% for the ustekinumab group, and 29.5% for the placebo group. For the weight-based Brodalumab
group, 83.5% had a ≥ 5 point improvement at week 12. At week 12, the percentage of subjects who
achieved a DLQI score of 0 or 1 was 60.8% for the Brodalumab 210 mg Q2W group, 46.6% for the
Brodalumab 140 mg Q2W group, 44.3% for the ustekinumab group, and 4.5% for the placebo group.
NAPSI
At week 12, among subjects with nail involvement at baseline, the mean improvement from baseline in
NAPSI score at week 12 was 4.4 in the Brodalumab 210 mg Q2W group, 3.3 in the 140 mg Q2W, and 1.3
in the placebo group. At week 52, among subjects with nail involvement at baseline, the mean
improvement from baseline in NAPSI score at week 52 in rerandomised subjects was 7.8 for the
Brodalumab 210 mg Q2W group, 8.8 for the 140 mg Q2W group, 6.7 for the 140 mg Q4W group, and 4.7
for the 140 mg Q8W group.
Subgroup Efficacy Analysis
Response rates in Brodalumab subjects for sPGA (0 or 1), PASI 75, and PASI 100 at week 12 were similar
across subgroups of subjects who did or did not have systemic agent failures or contraindications.
Response rates in Brodalumab subjects for sPGA (0 or 1), PASI 75, and PASI 100 at week 12 were lower
in subgroups of subjects who had a baseline body weight of > 100 kg. For the 210 mg Brodalumab Q2W
group sPGA (0 or 1) response rates were 66.8% for subjects >100kg and 83.6% for subjects <100kg
while for PASI 75 response rates in the Brodalumab 210 mg Q2W group were 76.6% for subjects > 100
kg and 90.4% for subjects ≤ 100 kg. For subjects in the Brodalumab 140 mg Q2W group, response rates
measured by sPGA (0 or1) were 31.0% (> 100 kg) and 69.7% (≤ 100 kg), measured by PASI 75 were
41.8% (> 100 kg) and 77.2% (≤ 100 kg). For PASI 100 the response rates were 33.7% (210mg Q2W;
>100kg), 49.1% (210mg Q2W; ≤100kg), 7.6% (140 mg Q2W; >100kg) and 33.6% (140 mg Q2W; ≤100
kg).
For subjects who did or did not have prior use of biologic psoriasis therapies the response rates in
Brodalumab for or sPGA (0 or 1), PASI 75, and PASI 100 at week 12 were similar across subgroups.
For subjects ≥ 65 years of age, comparisons vs ustekinumab were nominally significant for the 210 mg
Q2W group (p = 0.010), but not the weight-based group (p = 0.088). Of note, only 27 subjects ≥ 65

Assessment report
EMA/381484/2017 Page 69/135
years of age were included in the 210 mg Q2W, and 35 subjects were included in the weight-based
subgroup.
Ancillary analyses
Samples from 34 Brodalumab subjects (2.0%) tested positive for binding anti-Brodalumab antibodies
after Brodalumab administration through the data cut-off. Neutralizing anti Brodalumab antibodies were
not detected in samples from any subjects. No impact of anti-Brodalumab antibodies on subject safety
was observed.
A Phase 3 Study to Evaluate the Efficacy and Safety of Induction and Maintenance Regimens
of Brodalumab Compared With Placebo and Ustekinumab in Subjects with Moderate to Severe
Plaque Psoriasis: AMAGINE-3 (Study 20120104)
Methods
Study Participants
The eligibility criteria were the same as for study 20120103 (see Study 20120103).
Eligible subjects were men and women who were ≥ 18 and ≤75 years of age at time of screening with
stable, moderate to severe plaque psoriasis for at least 6 months before the first dose of the
investigational product, with involved body surface area (BSA) ≥ 10%, PASI ≥12, and sPGA ≥ 3 at
screening and at baseline.
Treatments
Brodalumab (Amgen Investigational Product)
Brodalumab was supplied as a 140 mg/mL injectable solution (process 2 Amgen Thousand Oaks drug
substance). During the blinded portion of the study, Amgen investigational product was administered as
2 blinded SC injections (1 x 1.0 mL [140 mg] and 1 x 0.5 mL [70 mg]) of Brodalumab and/or matching
placebo Q2W starting on day 1. Rescue treatment remained blinded until the study was unblinded.
Brodalumab was administered to the abdomen, thigh, or upper arm.
Ustekinumab (Non-Amgen Investigational Product)
Ustekinumab was manufactured by Janssen Biotech and was packaged and distributed by Amgen. During
the induction phase all subjects received ustekinumab and/or placebo SC at day 1 and week 4. Subjects
received ustekinumab (one 0.5-mL injection [45 mg] if ≤ 100 kg at the baseline visit and two 0.5-mL
injections (90 mg) if > 100 kg at the baseline visit) or placebo, depending upon randomised arm.
During the maintenance phase of the study all subjects received ustekinumab and/or placebo at weeks
16, 28, and 40. Subjects received ustekinumab or placebo, depending upon randomised arm, with 1
injection for subjects ≤ 100 kg and 2 injections for those > 100 kg.
For subjects who received 2 injections of ustekinumab per dose, the 2 injections were to be administered
in different body regions (upper arms, gluteal regions, thighs, or abdomen).
Induction Phase
In the induction phase, subjects were randomised in a 2:2:1:1 ratio to receive subcutaneous (SC)
injections of 210 mg Q2W Brodalumab, 140 mg Q2W Brodalumab, ustekinumab (45 mg if ≤ 100 kg at the

Assessment report
EMA/381484/2017 Page 70/135
baseline visit, 90 mg if > 100 kg at the baseline visit), or matching placebo (randomization was stratified
by baseline total body weight, by prior biologic use, and by geographic region.
Subjects with prior biologic use were limited to 50% of the study population.
At the week- 12 visit:
Subjects originally randomised to either Brodalumab arm were re-randomised (2:2:2:1) into the
maintenance phase to receive Brodalumab at 210 mg Q2W, 140 mg Q2W, 140 mg every 4 weeks (Q4W),
or 140 mg every 8 weeks (Q8W). Rerandomization was stratified by week 12 total body weight (≤ 100 kg;
> 100 kg), original induction regimen, and week 12 response (sPGA 0 versus sPGA ≥ 1).
Subjects originally randomised to ustekinumab continued to receive ustekinumab while subjects
originally randomised to receive placebo began receiving 210 mg Q2W Brodalumab.
Through week 52, all subjects received Amgen investigational product (Brodalumab and/or placebo) Q2W
with an additional loading dose at week 13 and non-Amgen investigational product (ustekinumab or
placebo) at weeks 16, 28, and 40. In addition, to maintain the blind to rescue treatment, Amgen IP was
also administered at week 17.
Subjects with an inadequate response (defined as a single sPGA of ≥ 3 or persistent sPGA values of 2 over
at least a 4-week period) may have qualified for rescue treatment at or after week 16 with an inadequate
response. At week 16 rescue treatment was with Brodalumab for all subjects, including those on
ustekinumab. After week 16 subjects on ustekinumab remained on ustekinumab even after qualifying for
rescue.
At week 52, subjects who were on Brodalumab continued to receive Brodalumab at their maintenance or
rescue phase dose; subjects who were originally randomised to ustekinumab received Brodalumab 210
mg Q2W.
Table 20: Treatments Administered through Week 10 (Blinded Phase)

Assessment report
EMA/381484/2017 Page 71/135
Table 21: Treatments Administered From Week 12 Through Week 52 (Blinded Phase)
Objectives
Primary
Compared with placebo:
to evaluate the efficacy of Brodalumab (210 mg every 2 weeks [Q2W]; and 140 mg Q2W) in
subjects with moderate to severe plaque psoriasis, as measured by the proportion of subjects
achieving 75% improvement in Psoriasis Area and Severity Index (PASI; PASI 75) at week 12
to evaluate the efficacy of Brodalumab (210 mg Q2W; and 140 mg Q2W) in subjects with
moderate to severe plaque psoriasis, as measured by the proportion of subjects achieving
success (clear [0] or almost clear [1]) on the static physician’s global assessment (sPGA) at week
12.
Compared with Ustekinumab
to evaluate the efficacy of Brodalumab (210 mg Q2W; and 140 mg Q2W for subjects ≤ 100 kg
with 210 mg dosage for subjects > 100 kg) in clearing psoriasis in subjects with moderate to
severe plaque psoriasis, as measured by the proportion of subjects achieving PASI 100 at week
12.
Key Secondary
Compared with placebo:
to evaluate the efficacy of Brodalumab (210 mg Q2W; and 140 mg Q2W) in clearing psoriasis, as
measured by the proportion of subjects achieving PASI 100 at week 12
to evaluate the efficacy of Brodalumab (210 mg Q2W; and 140 mg Q2W) in clearing psoriasis, as
measured by the proportion of subjects achieving sPGA of 0 at week 12

Assessment report
EMA/381484/2017 Page 72/135
to evaluate the effect of Brodalumab (210 mg Q2W; and 140 mg Q2W) on patient-reported
symptoms of psoriasis, as measured by the proportion of subjects who meet the responder
definition for the Psoriasis Symptom Inventory(PSI) (total score ≤ 8, with no item scores > 1) at
week 12
Compared with Ustekinumab:
to evaluate the efficacy of Brodalumab (140 mg Q2W) in clearing psoriasis, as measured by the
proportion of subjects achieving PASI 100 at week 12
to evaluate the efficacy of Brodalumab (210 mg Q2W; and 140 mg Q2W for subjects ≤ 100 kg
with 210 mg dosage for subjects > 100 kg), as measured by the proportion of subjects achieving
PASI 75 at week 12
Maintenance Objective:
To compare the efficacy of Brodalumab maintenance regimens, as measured by the proportion of
subjects achieving success on the sPGA at week 52
Other secondary endpoints
To evaluate if there is a weight threshold, the onset of response, the effect on nail disease, the
maintenance of response with each maintenance regimen, the effect on patient-reported outcome, to
compare the efficacy of Brodalumab and ustekinumab at different time points and to characterize PK of
Brodalumab after short- and long-term treatment.
Safety:
to evaluate the short- (12 week) and long-term (5 year) safety profile of Brodalumab, including
an assessment of anti-Brodalumab antibodies, in subjects with moderate to severe plaque
psoriasis.
Exploratory:
These endpoints are to explore Brodalumab population PK, Brodalumab exposure/response relationship,
the effect of treatment on laboratory parameters of interest and to evaluate self-administration of
Brodalumab
Outcomes/endpoints
Co-primary (Brodalumab Arms versus Placebo):
PASI 75 at week 12
sPGA success at week 12
Primary (Brodalumab versus Ustekinumab):
PASI 100 at week 12
- 210 mg Q2W
- 140 mg Q2W for subjects ≤ 100 kg with 210 mg dosage for subjects > 100 kg
Key secondary (Brodalumab arms versus Placebo)
PASI 100 at week 12
sPGA of 0 at week 12

Assessment report
EMA/381484/2017 Page 73/135
PSI responder definition at week 12
Key secondary (Brodalumab versus Ustekinumab)
PASI 100 at week 12
- 140 mg Q2W
PASI 75 at week 12
- 210 mg Q2W
- 140 mg Q2W for subjects ≤ 100 kg with 210 mg dosage for subjects > 100 kg
Maintenance (After Rerandomization at week 12):
sPGA success at week 52
Other:
Other endpoints included sPGA success (at other timepoints), time to sPGA success, PASI 75, PASI 90,
and PASI 100 (at other timepoints), time to PASI response, percentage improvement in PASI, proportion
of subjects achieving the responder definition of PSI, patient-reported outcome measures and
pharmacokinetics.
Safety Endpoints:
Adverse events, events of interest, anti-Brodalumab antibodies, and electrocardiograms
Sample size
See study 20120103 above.
Randomisation
See study 20120103 above.
Blinding (masking)
See study 20120103 above.
Statistical methods
See study 20120103 above.
Results
Participant flow
o Induction Phase

Assessment report
EMA/381484/2017 Page 74/135
o Maintenance Phase
Assessment report
EMA/381484/2017 Page 75/135
Recruitment
Study Initiation Date: The first patient enrolled on 11 September 2012.
Primary Analysis Data Cut-off Date: 30 August 2014.
Conduct of the study
Amendments:
Amendment 1 (31 May 2012):
In compliance with a requirement contained in the current version of the European Union
Clinical Trial Directive, the safety reporting language in Protocol Section 9.2.2 “Reporting
Procedures for Serious Adverse Events” was updated.
Language regarding topical therapy was clarified to specify that topical therapy containing
urea was not permitted through week 64.
Amendment 2 (17 October 2013):
The protocol was amended to provide clarity regarding safety follow-up in Protocol Section 7
and the hepatotoxicity criteria denoted in Protocol Appendix B.
A safety follow-up visit/end of study visit was added to ensure the investigational sites
captured information regarding any ongoing or new adverse events that occurred 30 days
from the last dose of investigational product for each subject. As a result of this addition, the
study duration was updated throughout the protocol to reflect this change.
Amendment 3 (26 March 2014):
Based on identification of suicidal behaviour and suicidal ideation as a potential risk and after
discussion with regulatory agencies, the Columbia Suicide Severity Rating Score and the
Patient Health Questionnaire-8 were added as instruments to monitor subject safety (i.e.,
stopping rules) as a protocol amendment.
As a result of this addition, the post primary interim analysis was revised to reflect the current
analysis plan.
Protocol Deviations
Important protocol deviations were reported for 135 of 1881 subjects (7.2%) during the induction phase
and the percentage of subjects with important deviations was similar across the groups. Efficacy
assessments conducted by non-certified assessors was the most commonly reported deviation during this
phase (52 subjects, 2.8%), which occurred more frequently in the Brodalumab and placebo groups
compared to the ustekinumab group.
Between weeks 12 and 52, important protocol deviations were reported for 121 subjects (6.7). Receiving
excluded systemic/biologic/phototherapy was the most commonly reported deviation across most of the
groups (total of 29 subjects, 1.6%).
During the conduct of the study, an IVRS programming error was identified that affected treatment
assignments at week 17 for 49 ustekinumab subjects who rescued at week 16 with Brodalumab 210 mg.
Because of the error, these subjects received a placebo loading dose at week 17 instead of Brodalumab
210 mg as specified in the protocol.

Assessment report
EMA/381484/2017 Page 76/135
No subject data were excluded from the full analysis set because of protocol deviations.
Baseline data
Table 22: Baseline Demographics Study 20120104 Full Analysis Set

Assessment report
EMA/381484/2017 Page 77/135
Numbers analysed
Outcomes and estimation
Analysis results of the co-primary and the key secondary endpoints are presented below.

Assessment report
EMA/381484/2017 Page 78/135
Table 23: Analysis results of the co-primary and key secondary endpoints
Primary Efficacy Endpoints compared to placebo
PASI 75 at week 12
The percentage of PASI 75 responders at week 12 was 85.1% in the 210 mg Q2W group, 69.2% in the
140 mg Q2W group, and 6.0% in the placebo group. The differences were statistically significant based on
the adjusted p-values (p < 0.001).
sPGA Success (0 or 1) at Week 12
The percentage of subjects who achieved sPGA success at week 12 was 79.6% in the 210 mg Q2W group,
59.9% in the 140 mg Q2W group, and 4.1% in the placebo group. The differences in response rates were
statistically significant based on the adjusted p-values (p < 0.001).
Brodalumab at both doses was statistically significant (p<0.001) superior to placebo with respect to PASI
75 and sPGA success at week 12, with higher response rates for the 210 mg Q2W dose.
Key Secondary Endpoints compared to placebo
PASI 100 at Week 12
The percentage of PASI 100 responders at week 12 was 36.7% in the 210 mg Q2W group, 27.0% in the
140 mg Q2W group, and 0.3% in the placebo group. These differences were statistically significant (p <
0.001).
sPGA 0 (Clear) at Week 12
36.7% in the 210 mg Q2W group, 27.0% in the 140 mg Q2W group were sPGA responders and 0.3% in
the placebo group. (p < 0.001)
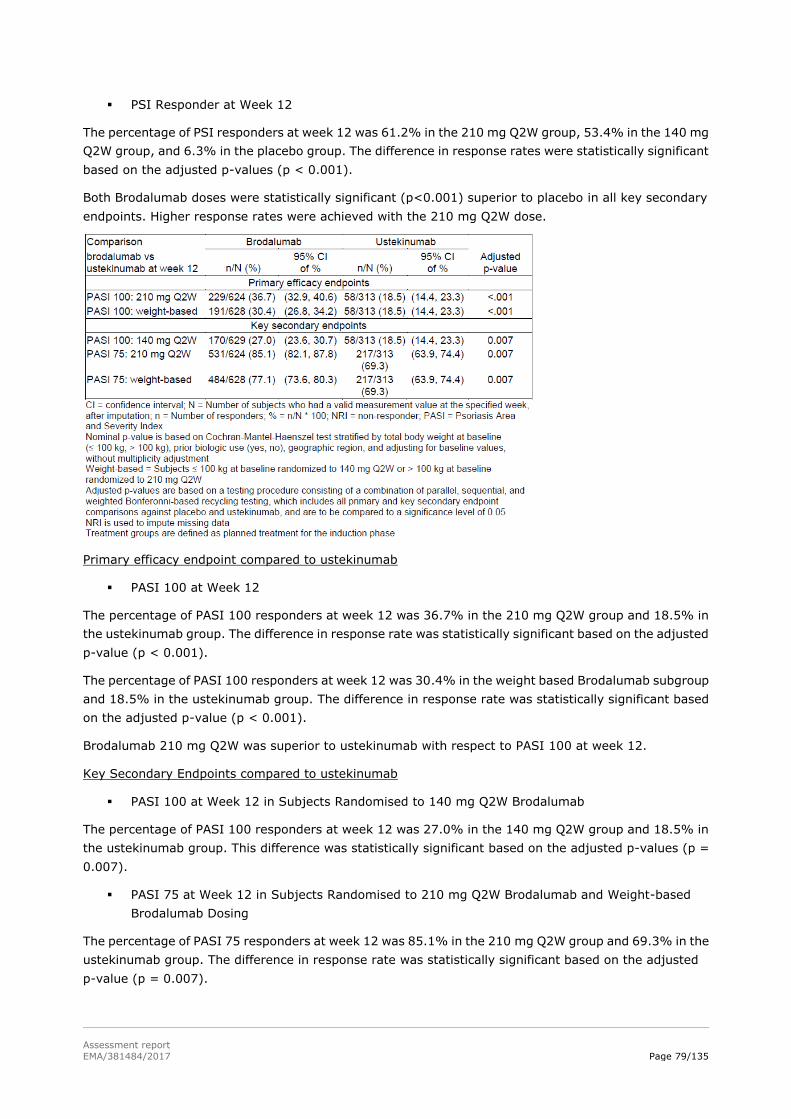
Assessment report
EMA/381484/2017 Page 79/135
PSI Responder at Week 12
The percentage of PSI responders at week 12 was 61.2% in the 210 mg Q2W group, 53.4% in the 140 mg
Q2W group, and 6.3% in the placebo group. The difference in response rates were statistically significant
based on the adjusted p-values (p < 0.001).
Both Brodalumab doses were statistically significant (p<0.001) superior to placebo in all key secondary
endpoints. Higher response rates were achieved with the 210 mg Q2W dose.
Primary efficacy endpoint compared to ustekinumab
PASI 100 at Week 12
The percentage of PASI 100 responders at week 12 was 36.7% in the 210 mg Q2W group and 18.5% in
the ustekinumab group. The difference in response rate was statistically significant based on the adjusted
p-value (p < 0.001).
The percentage of PASI 100 responders at week 12 was 30.4% in the weight based Brodalumab subgroup
and 18.5% in the ustekinumab group. The difference in response rate was statistically significant based
on the adjusted p-value (p < 0.001).
Brodalumab 210 mg Q2W was superior to ustekinumab with respect to PASI 100 at week 12.
Key Secondary Endpoints compared to ustekinumab
PASI 100 at Week 12 in Subjects Randomised to 140 mg Q2W Brodalumab
The percentage of PASI 100 responders at week 12 was 27.0% in the 140 mg Q2W group and 18.5% in
the ustekinumab group. This difference was statistically significant based on the adjusted p-values (p =
0.007).
PASI 75 at Week 12 in Subjects Randomised to 210 mg Q2W Brodalumab and Weight-based
Brodalumab Dosing
The percentage of PASI 75 responders at week 12 was 85.1% in the 210 mg Q2W group and 69.3% in the
ustekinumab group. The difference in response rate was statistically significant based on the adjusted
p-value (p = 0.007).

Assessment report
EMA/381484/2017 Page 80/135
For the weight-based Brodalumab group the percentage of PASI 75 responders at week 12 was 77.1%
and 69.3% in the ustekinumab group. This was statically significant (p = 0.007).
Maintenance Endpoint sPGA Success (0 or 1) at week52:
The percentage of subjects who achieved sPGA success at week 52 was 60.8% for subjects rerandomised
to 210 mg Q2W, 44.9% for subjects rerandomised to 140 mg Q2W, 15.5% for subjects rerandomised to
140 mg Q4W, and 5.7% for subjects rerandomised to 140 mg Q8W.
All comparisons for the maintenance endpoint were statistically significant based on the adjusted
p-values (p < 0.001) with the 210 mg Q2W group achieving the highest rates of sPGA success at week 52.
The percentage of subjects who received Brodalumab 210 mg Q2W during the induction phase achieving
sPGA success (0 or 1) at week 52 was 64.9% in subjects who continued to receive 210 mg Q2W, 49.5%
in subjects rerandomised to 140 mg Q2W, 11.8% in subjects rerandomised to 140 mg Q4W, and 4.5% in
subjects rerandomised to 140 mg Q8W.
For subjects who received 140 mg Q2W during the induction phase, the percentage who achieved sPGA
success (0 or 1) at week 52 was 56.7% in subjects rerandomised to 210 mg Q2W, 40.4% in subjects who
continued to receive 140 mg Q2W, 19.3% in subjects rerandomised to 140 mg Q4W, and 7.0% in
subjects rerandomised to 140 mg Q8W.
Among subjects who remained on ustekinumab during induction and maintenance, 54.5% achieved sPGA
success at week 52. Using Non-Responder Imputation after a protocol-specified treatment change after
having an inadequate response, the percentage of subject who achieved sPGA success (0 or 1) at week 52
was 76.0% for subjects who received 210 mg Q2W during induction and maintenance and 49.4% for
subjects who received 140 mg Q2W during induction and 210 mg Q2W during maintenance.
231 of 257 subjects (89.9%) still on study at week 52 received placebo during the induction phase and
Brodalumab 210 mg Q2W during the maintenance phase achieved sPGA success (0 or 1) at week 52.
Other efficacy endpoints
Onset of Response During the Induction Phase
Figure 7: Summary of PASI 75 (NRI) During Induction Phase (Full Analysis Set)
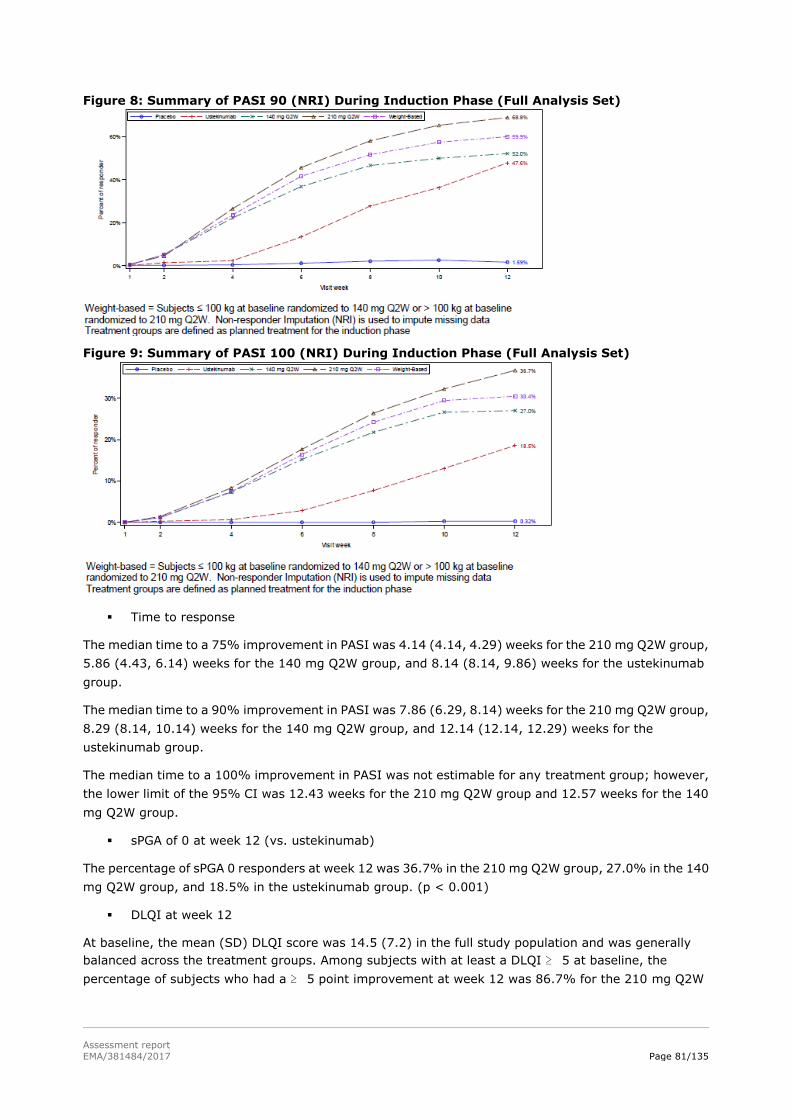
Assessment report
EMA/381484/2017 Page 81/135
Figure 8: Summary of PASI 90 (NRI) During Induction Phase (Full Analysis Set)
Figure 9: Summary of PASI 100 (NRI) During Induction Phase (Full Analysis Set)
Time to response
The median time to a 75% improvement in PASI was 4.14 (4.14, 4.29) weeks for the 210 mg Q2W group,
5.86 (4.43, 6.14) weeks for the 140 mg Q2W group, and 8.14 (8.14, 9.86) weeks for the ustekinumab
group.
The median time to a 90% improvement in PASI was 7.86 (6.29, 8.14) weeks for the 210 mg Q2W group,
8.29 (8.14, 10.14) weeks for the 140 mg Q2W group, and 12.14 (12.14, 12.29) weeks for the
ustekinumab group.
The median time to a 100% improvement in PASI was not estimable for any treatment group; however,
the lower limit of the 95% CI was 12.43 weeks for the 210 mg Q2W group and 12.57 weeks for the 140
mg Q2W group.
sPGA of 0 at week 12 (vs. ustekinumab)
The percentage of sPGA 0 responders at week 12 was 36.7% in the 210 mg Q2W group, 27.0% in the 140
mg Q2W group, and 18.5% in the ustekinumab group. (p < 0.001)
DLQI at week 12
At baseline, the mean (SD) DLQI score was 14.5 (7.2) in the full study population and was generally
balanced across the treatment groups. Among subjects with at least a DLQI ≥ 5 at baseline, the
percentage of subjects who had a ≥ 5 point improvement at week 12 was 86.7% for the 210 mg Q2W

Assessment report
EMA/381484/2017 Page 82/135
group, 75.8% for the 140 mg Q2W group, 84.6% for the ustekinumab group, and 31.2% for the placebo
group. (p < 0.001)
DLQI score of 0 or 1
At week 12, 59.0% for the Brodalumab 210 mg Q2W group, 43.4% for the Brodalumab 140 mg Q2W
group, 43.8% for the ustekinumab group, and 7.0% for the placebo group achieved DLQI of 0 or 1.
(Nominal p-value < 0.001)
Prior use of biologic psoriasis therapies
For the co-primary endpoints of PASI 75 at week 12 and sPGA success at week 12, response after
treatment with 210 mg Q2W or 140 mg Q2W demonstrated similar results for both the biologic naïve and
biologic experienced subgroups, with lower efficacy for subjects who had previous biologic use. The
nominal p-values were < 0.001 for the response rates for both doses compared with placebo in both
subgroups for PASI 75 at week 12 and sPGA success at week 12.
Ancillary analyses
A total of 1830 of 1881 subjects were tested for anti-Brodalumab antibodies. Of the 1684 subjects
exposed to Brodalumab, 5 subjects (0.3%) tested positive for pre-existing binding antibodies, defined as
at least 1 positive binding antibody before the first dose of Brodalumab. Thirty-eight subjects (2.3%)
developed binding anti-Brodalumab antibodies after Brodalumab administration through the data cut-off
(30/08/2014). Sixteen subjects (1.0%) who tested positive for anti-Brodalumab antibodies during the
study were negative for anti-Brodalumab antibodies at the last time point tested within the study period.
Of the 243 subjects exposed to ustekinumab at 52 weeks, 2 subjects (0.8%) tested positive for
anti-Brodalumab binding antibodies, before the first dose of Brodalumab. These antibodies may be cross
reactive antibodies generated due exposure to ustekinumab. Neutralizing anti-Brodalumab antibodies
were not detected in any subjects in the study.
Summary of main studies
The following tables summarise the efficacy results from the main studies supporting the present
application. These summaries should be read in conjunction with the discussion on clinical efficacy as well
as the benefit risk assessment (see later sections).
Table 24: Summary of efficacy for trial 20090062.
Title: A phase 2, 22-week randomised, double-blind, placebo-controlled, multiple-dose study to evaluate the safety, tolerability, and efficacy of brodalumab in subjects with moderate to severe psoriasis
Study identifier 20090062
Design Randomised, double-blind, placebo-controlled, multiple-dose study
Duration of main phase: 22 weeks
Duration of Run-in phase: not applicable
Duration of Extension phase: not applicable
Hypothesis Superiority vs. placebo
Treatment groups
Placebo SC, wk 0, 1, 2, Q2W (N=38)
Brodalumab 70 mg SC, wk 0, 1, 2, Q2W (N=39)
Brodalumab 140 mg SC, wk 0, 1, 2, Q2W (N=39)
Brodalumab 210 mg SC, wk 0, 1, 2, Q2W (N=40)
Brodalumab 280 mg SC, wk 0, 4, 8 (N=42)

Assessment report
EMA/381484/2017 Page 83/135
Endpoints and definitions
Primary endpoint
% improvement
in PASI wk 12
Percent improvement in PASI score from baseline to 12 weeks
Secondary endpoint PASI 75 wk 12 Proportion of patients achieving 75% reduction in PASI score at week 12.
Secondary endpoint PASI 100 wk 12
Proportion of patients achieving 100% reduction in PASI score at week 12.
Secondary endpoint sPGA score 0/1 wk 12
Proportion of patients with an sPGA score of 0 (clear) at week 12
Database lock
Results and Analysis
Analysis
description
Primary Analysis
Analysis population and time point description
Intent to treat 12 weeks
Treatment group
Placebo
Brodalumab 70 mg Q2W
Brodalumab 140 mg Q2W
Brodalumab 210 mg Q2W
Brodalumab 280 mg Q4W
Number of subjects
38 39 39 40 42
% PASI improvement
(SD) p vs placebo
16.0 (27.0)
45.0 (41.7)
<0.0001
85.9 (22.5)
<0.0001
86.3 (27.6)
<0.0001
76.0 (32.7)
<0.0001
PASI 75 p vs placebo
0 33.3
0.0469
76.9
<0.0001
82.5
<0.0001
66.7
<0.0001
sPGA success
p vs placebo
2.6 25.6
0.0243
84.6
<0.0001
80.0
<0.0001
69.0
0.0013
PASI 100 p vs placebo
0 10.3
0.0861
38.5
0.0049
62.5
<0.0001
28.6
0.09
Table 25: Summary of efficacy for trial 20120103
Title: A Phase 3 Study to Evaluate the Efficacy and Safety of Induction and Maintenance Regimens of Brodalumab Compared With Placebo and Ustekinumab in Subjects With Moderate to Severe Plaque Psoriasis: AMAGINE-2
Study identifier 20120103
Design Multicentre, double-blind, randomised, active comparator- and placebo-
controlled
Duration of main phase: Induction 12 weeks, maintenance 40 weeks
Duration of Run-in phase: not applicable
Duration of Extension phase: up to 5 years
Hypothesis Superiority vs. placebo
Superiority vs. ustakinumab
Treatment groups, induction phase 12 wk
Placebo
SC, wk 0, 1, 2, Q2W (N=309)

Assessment report
EMA/381484/2017 Page 84/135
Brodalumab 140 mg SC, wk 0, 1, 2, Q2W (N=610)
Brodalumab 210 mg SC, wk 0, 1, 2, Q2W (N=612)
Ustekinumab 45/90 mg SC, wk 0, 4, Q4W (N=300)
Endpoints and definitions
Co-Primary endpoint
PASI 75
Proportion of patients achieving 75% reduction on PASI score at week 12
Co-Primary endpoint
sPGA
success (0/1)
Proportion of patients achieving sPGA
success (score 0/1 i.e. clear/almost clear) at week 12
Co-Primary endpoint PASI100 Proportion of patients achieving PASI100 at week 12 vs. ustekinumab
Secondary endpoint PASI 100
Proportion of patients achieving 100% reduction in PASI score at week 12.
Secondary endpoint sPGA score 0
Proportion of patients with an sPGA score of 0 (clear) at week 12
Secondary endpoint PSI responder
Proportion or PSI responders (total score ≤ 8, with no item scores > 1) at week 12.
Database lock 22 September 2014
Results and Analysis
Analysis description Primary Analysis
Analysis population and time point description
Intent to treat 12 weeks
Descriptive statistics and estimate variability (non-response imputation)
Treatment group
Placebo
Brodalumab 140 mg Q2W
Brodalumab 210 mg Q2W
Ustekinumab 45/90 mg Q4W
Number of subjects
309 610 612 300
PASI 75 (95% CI)
8.1% (5.3 - 11.7)
66.6% (62.7 - 70.3)
86.3% (83.3 - 88.9)
70.0%
(64.5 - 75.1)
sPGA success (95% CI)
3.9% (2.0 – 6.7)
58.0% (54.0 – 62.0)
78.6% (75.1 – 81.8)
n.a.
PASI 100 (95% CI)
0.6% (0.1 – 2.3)
25.7% (22.3 – 29.4)
44.4% (40.5 – 48.5)
21.7% (17.1 – 26.8)
sPGA of 0
(95% CI)
0.6%
(0.1 – 2.3)
25.7%
(22.3 – 29.4)
44.8%
(40.8 – 48.8)
n.a.
PSI responder (95% CI)
6.8% (4.3 – 10.2)
51.5% (47.4 – 55.5)
67.6% (63.8 – 71.3)
n.a.
Effect estimate per comparison (as observed)
Co-primary: PASI 75 at week 12
Comparison groups Brodalumab 140 mg Q2W vs. placebo
Stratified odds ratio (95% CI)
29.7 (18.8 – 46.9)
P-value < 0.001
Comparison groups Brodalumab 210 mg Q2W vs. placebo
Stratified odds ratio (95% CI)
112.2 (68.3 – 184.1)
P-value < 0.001

Assessment report
EMA/381484/2017 Page 85/135
Co-primary: sPGA success at week
12
Comparison groups Brodalumab 140 mg Q2W vs. placebo
Stratified odds ratio (95% CI)
46.7 (25.3 – 86.2)
P-value < 0.001
Comparison groups Brodalumab 210 mg Q2W vs. placebo
Stratified odds ratio (95% CI)
157.1 (83.2 – 296.4)
P-value < 0.001
Co-primary: PASI 100
Comparison groups Brodalumab 140 mg Q2W vs. ustekinumab
Stratified odds ratio (95% CI)
1.3 (0.9 – 1.8)
P-value 0.15
Comparison groups Brodalumab 210 mg Q2W
vs. ustekinumab
Stratified odds ratio
(95% CI)
3.2
(2.3 – 4.4)
P-value < 0.001
Secondary: PSI at week 12
Comparison groups Brodalumab 140 mg Q2W vs. placebo
Stratified odds ratio (95% CI)
44.3
(8.9 – 221.3)
P-value < 0.001
Comparison groups Brodalumab 210 mg Q2W vs. placebo
Stratified odds ratio (95% CI)
71.8
(14.4 – 357.4)
P-value < 0.001
Table 26: Summary of efficacy for trial 20120104
Title: Phase 3 Study to Evaluate the Efficacy and Safety of Induction and Maintenance Regimens of Brodalumab Compared With Placebo and Ustekinumab in Subjects With Moderate to Severe Plaque Psoriasis: AMAGINE-3
Study identifier 20120104
Design Multicentre, double-blind, randomised, active comparator- and placebo- controlled
Duration of main phase: Induction 12 weeks, maintenance 40 weeks
Duration of Run-in phase: not applicable
Duration of Extension phase: up to 5 years
Hypothesis Superiority vs. placebo Superiority vs. ustakinumab
Treatment groups, induction
phase 12 wk
Placebo
SC, wk 0, 1, 2, Q2W (N=315)
Brodalumab 140 mg SC, wk 0, 1, 2, Q2W (N=629)
Brodalumab 210 mg SC, wk 0, 1, 2, Q2W (N=624)
Ustekinumab 45/90 mg SC, wk 0, 4, Q4W (N=313)
Endpoints and definitions
Co-Primary endpoint
PASI 75
Proportion of patients achieving 75% reduction on PASI score at week 12

Assessment report
EMA/381484/2017 Page 86/135
Co-Primary endpoint
sPGA success (0/1)
Proportion of patients achieving sPGA success (score 0/1 i.e. clear/almost clear)
at week 12
Co-Primary endpoint
PASI100 Proportion of patients achieving PASI100 at week 12 vs. ustekinumab
Secondary endpoint
PASI 100
Proportion of patients achieving 100% reduction in PASI score at week 12.
Secondary endpoint
sPGA score 0 Proportion of patients with an sPGA score of 0 (clear) at week 12
Secondary endpoint
PSI responder Proportion or PSI responders (total score ≤ 8, with no item scores > 1) at week 12.
Database lock 30 August 2014
Results and Analysis
Analysis description Primary Analysis
Analysis population and
time point description
Intent to treat
12 weeks
Descriptive statistics and estimate variability
(non-response imputation)
Treatment group
Placebo
Brodalumab 140 mg Q2W
Brodalumab 210 mg Q2W
Ustekinumab 45/90 mg
Q4W
Number of subjects
315 629 624 313
PASI 75 (95% CI)
6.0% (3.7 – 9.3)
69.2% (65.4 – 72.7)
85.1% (82.1 - 87.8)
69.3%
(63.9 - 74.4)
sPGA success (95% CI)
4.1% (2.2 – 7.0)
59.90% (56.0 – 63.8)
79.6% (76.3 – 82.7)
n.a.
PASI 100
(95% CI)
0.3%
(0.0 – 1.8)
27.0%
(23.6 – 30.7)
36.7%
(32.9 – 40.6)
18.5%
(14.4 – 23.3)
sPGA of 0
(95% CI)
0.3%
(0.0 – 1.8)
27.0%
(23.6 – 30.7)
36.7%
(32.9 – 40.6)
n.a.
PSI responder (95% CI)
6.3% (3.9 – 9.6)
53.4% (49.4 – 57.4)
61.2% (57.3 – 65.1)
n.a.
Effect estimate per comparison (as observed)
Co-primary: PASI 75 at week 12
Comparison groups Brodalumab 140 mg Q2W vs. placebo

Assessment report
EMA/381484/2017 Page 87/135
Stratified odds ratio (95% CI)
48.8 (29.0 – 80.8)
P-value < 0.001
Comparison groups Brodalumab 210 mg Q2W vs.
placebo
Stratified odds ratio (95% CI)
137.5 (79.6 – 237.4)
P-value < 0.001
Co-primary:
sPGA success at week 12
Comparison groups Brodalumab 140 mg Q2W vs.
placebo
Stratified odds ratio (95% CI)
44.9 (24.9 – 80.9)
P-value < 0.001
Comparison groups Brodalumab 210 mg Q2W vs. placebo
Stratified odds ratio (95% CI)
139.5 (75.7 – 257.1)
P-value < 0.001
Co-primary: PASI 100
Comparison groups Brodalumab 140 mg Q2W vs. ustekinumab
Stratified odds ratio (95% CI)
1.6 (1.2 – 2.3)
P-value 0.006
Comparison groups Brodalumab 210 mg Q2W vs. ustekinumab
Stratified odds ratio
(95% CI)
2.6
(1.9 – 3.7)
P-value < 0.001
Secondary: PSI at week 12
Comparison groups Brodalumab 140 mg Q2W vs. placebo
Stratified odds ratio (95% CI)
37.4 (7.5 – 186.5)
P-value < 0.001
Comparison groups Brodalumab 210 mg Q2W vs. placebo
Stratified odds ratio (95% CI)
54.0
(10.9 – 269.0)
P-value < 0.001
Table 27: Table xxx - Summary of efficacy for trial 20120102
Title: A Phase 3 Study to Evaluate the Efficacy, Safety, and Effect of Withdrawal and Retreatment With Brodalumab in Subjects With Moderate to Severe Plaque Psoriasis: AMAGINE-1
Study identifier 20120102
Design Multicentre, double-blind, randomised, placebo-controlled, randomised-withdrawal
Duration of main phase: Induction 12 weeks, randomised withdrawal
40 weeks
Duration of Run-in phase: not applicable
Duration of Extension phase: up to 5 years
Hypothesis Superiority vs placebo
Treatment groups, induction phase 12 wk
Placebo
SC, wk 0, 1, 2, Q2W (N=220)
Brodalumab 140 mg SC, wk 0, 1, 2, Q2W (N=219)

Assessment report
EMA/381484/2017 Page 88/135
Brodalumab 210 mg SC, wk 0, 1, 2, Q2W (N=222)
Treatment groups, withdrawal and retreatment phase, 40 wk
Placebo SC wk 13, Q2W (N=143)
Brodalumab 140 mg SC wk 13, Q2W (N=57)
Brodalumab 210 mg re-randomised
SC wk 13, Q2W (N=83)
Brodalumab 210 mg
non-re-randomised
SC Q2W (N=344)
Endpoints and definitions
Co-Primary endpoint
PASI 75
Proportion of patients achieving 75% reduction on PASI score at week 12
Co-Primary endpoint
sPGA success (0/1)
Proportion of patients achieving sPGA success (score 0/1 i.e. clear/almost clear)
at week 12
Secondary endpoint
PASI 100
Proportion of patients achieving 100% reduction in PASI score at week 12.
Secondary endpoint
sPGA score 0 Proportion of patients with an sPGA score of 0 (clear) at week 12
Secondary endpoint
PSI responder Proportion or PSI responders (total score ≤ 8, with no item scores > 1) at week 12.
Database lock 12 March 2014
Results and Analysis
Analysis description Primary Analysis
Analysis population and time point description
Intent to treat 12 weeks
Descriptive statistics and estimate variability
Treatment group
Placebo
Brodalumab 140 mg Q2W
Brodalumab 210 mg Q2W
Number of subjects
220 219 222
PASI 75 (95% CI)
2.7% (1.0 – 5.8)
60.3% (53.5 – 66.8)
83.3% (77.8 – 88.0)
sPGA success (95% CI)
1.4% (0.3 – 3.9)
53.9% (47.0 – 60.6)
75.7% (69.5 – 81.2)
PASI 100 (95% CI)
0.5% (0.0 – 2.5)
23.3% (17.9 – 29.5)
41.9% (35.3 – 48.7)
sPGA of 0
(95% CI)
0.5%
(0.0 – 2.5)
23.3%
(17.9 – 29.5)
41.9%
(35.3 – 48.7)
PSI responder (95% CI)
4.1% (1.9 – 7.6)
53.0% (46.1 – 59.7)
60.8% (54.1 – 67.3)
Effect estimate per
comparison (NRI)
Co-primary:
PASI 75 at week 12
Comparison
groups
Brodalumab 140 mg Q2W vs. placebo
Rate difference (95% CI)
0.58 (0.51 – 0.64)
P-value <0.001
Comparison groups
Brodalumab 210 mg Q2W vs. placebo
Rate difference (95% CI)
0.81 (0.75 – 0.87)
P-value <0.001

Assessment report
EMA/381484/2017 Page 89/135
Co-primary: sPGA success at
week 12
Comparison groups
Brodalumab 140 mg Q2W vs. placebo
Rate difference
(95% CI)
0.53 (0.46 – 0.59)
P-value <0.001
Comparison groups
Brodalumab 210 mg Q2W vs. placebo
Rate difference (95% CI)
0.74 (0.69 – 0.80)
P-value <0.001
Secondary: PASI 100
Comparison groups
Brodalumab 140 mg Q2W vs. placebo
Rate difference (95% CI)
0.23 (0.17 – 0.29)
P-value <0.001
Comparison groups
Brodalumab 210 mg Q2W vs. placebo
Rate difference (95% CI)
0.41 (0.35 – 0.48)
P-value <0.001
Secondary: PSI
at week 12
Comparison
groups
Brodalumab 140 mg Q2W vs. placebo
Rate difference (95% CI)
0.49 (0.42 – 0.56)
P-value <0.001
Comparison groups
Brodalumab 210 mg Q2W vs. placebo
Rate difference (95% CI)
0.57 (0.40 – 0.50)
P-value <0.001
Analysis performed across trials (pooled analyses and meta-analysis)
The pooled efficacy analyses are based on a Full Analysis Set (FAS) consisting of 4373 patients with
moderate to severe plaque psoriasis included in the three pivotal studies 20120102, 20120103,
20120104. Pooled analysis has been performed to examine the primary efficacy across studies and in
efficacy in subpopulations. Regarding maintenance of effect, studies 20120103 and 20120104 have been
pooled as their design was identical.
Figure 10 presents the results of a meta-analysis across the studies with respect to PASI 75 and Figure 11
with respect to sPGA success.

Assessment report
EMA/381484/2017 Page 90/135
Figure 10: Forest plot of PASI 75 (NRI) at week 12 by study and by fixed-effect meta-analysis – Studies 20120102, 20120103, and 20120104, placebo comparison.
Figure 11: Forest plot of sPGA success (0/1) at week 12 by study and by fixed-effect meta-analysis – Studies 20120102, 20120103, and 20120104, placebo comparison
Results of pooled analysis with respect to maintenance of effect as measured by the proportion of patients
who were sPGA success responders at week 52 are presented in Table 28. This pooled analysis included
2964 patients from studies 20120103 and 20120104.
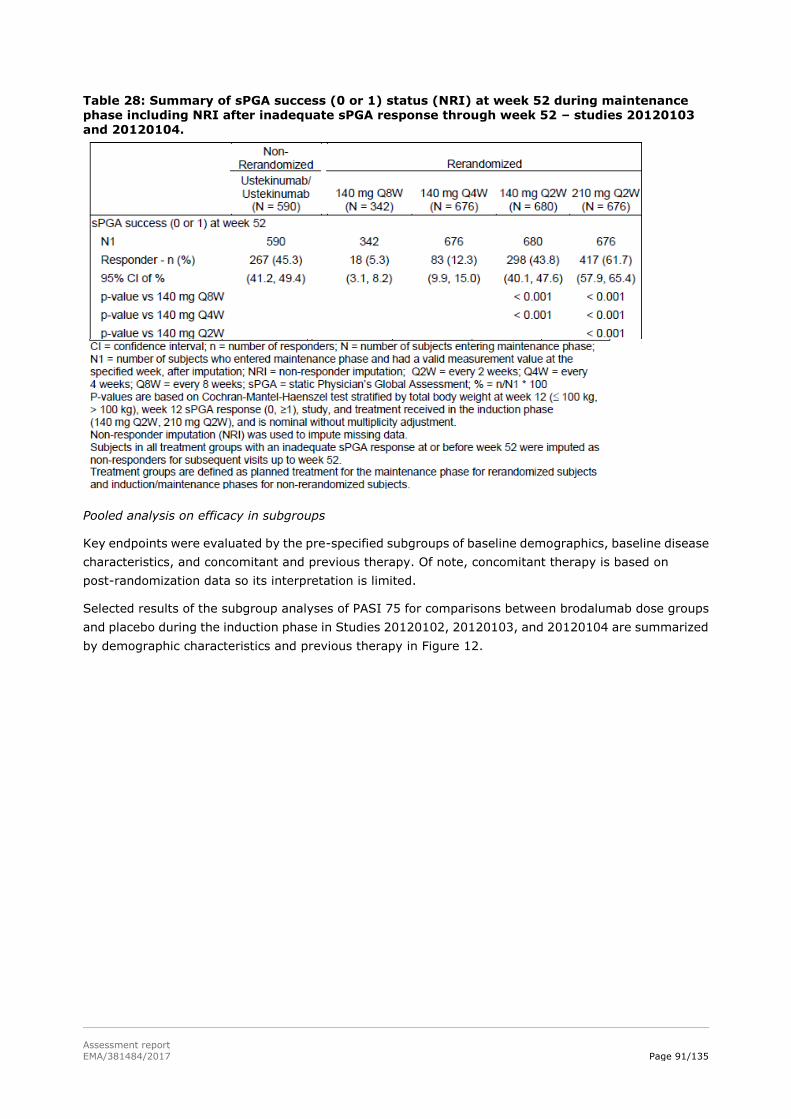
Assessment report
EMA/381484/2017 Page 91/135
Table 28: Summary of sPGA success (0 or 1) status (NRI) at week 52 during maintenance phase including NRI after inadequate sPGA response through week 52 – studies 20120103
and 20120104.
Pooled analysis on efficacy in subgroups
Key endpoints were evaluated by the pre-specified subgroups of baseline demographics, baseline disease
characteristics, and concomitant and previous therapy. Of note, concomitant therapy is based on
post-randomization data so its interpretation is limited.
Selected results of the subgroup analyses of PASI 75 for comparisons between brodalumab dose groups
and placebo during the induction phase in Studies 20120102, 20120103, and 20120104 are summarized
by demographic characteristics and previous therapy in Figure 12.

Assessment report
EMA/381484/2017 Page 92/135
Figure 12: Subgroup forest plots of PASI 75 (NRI) at week 12 by treatment group - Studies 20120102, 20120103 and 20120104 (induction phase, placebo comparison analysis set)
Clinical studies in special populations
No analyses were made regarding hepatic or renal impairment. Children were excluded in the pivotal
trials. A weight-based subgroup analysis was performed but the results demonstrate a higher efficacy and
similar safety profile for the 210 mg Q2W in both weight groups.
The eligibility criteria of the 3 pivotal phase III studies only allowed study participants between 18 and 75
years of age. The percentage of subjects older than 65 was 8.2% in study 20120102, 5.3% in study
20120103 and 6.5% in study 20120104.
Supportive studies
Study KHK 4827-002 was a Phase II randomised, double-blind, placebo-controlled Comparative Study in
Subjects with moderate to severe plaque psoriasis (psoriasis vulgaris, psoriatic arthritis). The efficacy and

Assessment report
EMA/381484/2017 Page 93/135
safety of KHK4827 were assessed in 151 subjects. The Week-12 PASI score improvement rate, the
primary endpoint, was significantly (p < 0.001) higher across all KHK4827 groups than in the placebo
group, and the improvement rate increased in a dose-dependent manner. With respect to all secondary
endpoints, the response was greater in a dose-dependent manner across all KHK 4827 groups than in the
placebo group. The incidences of AEs and treatment related adverse events were higher in the KHK4827
groups than in the placebo group, but none of the events occurred at a markedly higher incidence.
Study KHK 4827-003 was a phase III long-term extension study of study KHK Study 4827-002. Efficacy
evaluations based on PASI score improvements, PASI 50/ PASI 75/ PASI 90/ PASI 100, sPGA of 0 or 0/1,
and change in BSA involvement all increased over time and remained high through week 52 in both
Brodalumab groups, regardless of treatment in the controlled study. A comparison between the 2
Brodalumab groups demonstrated higher improvement rates in subjects treated with Brodalumab 210
mg.
2.5.3. Discussion on clinical efficacy
Design and conduct of clinical studies
The clinical development plan consists of a standard clinical package for a new product for the treatment
of plaque psoriasis and is in line with the Guideline on clinical investigation of medicinal products indicated
for the treatment of psoriasis (CHMP/EWP/2454/02 corr).
The pivotal studies are randomised double-blind placebo- and active-controlled and study duration and
clinical endpoints are standard for studies in psoriasis. In addition to the conventional clinical endpoints,
the applicant has developed a patient reported outcome instrument, psoriasis symptom inventory (PSI),
which is appreciated. The development and validation of the instrument is agreed, as well as the chosen
PSI responder definition, which indicates complete absence of signs and symptoms or only mild in terms
of severity – a desired treatment success outcome.
The included patient population corresponds to the definition of moderate to mild plaque psoriasis.
Patients with a variable treatment history were included i.e. varying from completely treatment naïve to
prior failure to other biologics for the treatment of psoriasis. Thus the included patient population is
consistent with the target population. The active comparator i.e. ustekinumab is an appropriate
comparator as the target population of ustekinumab in psoriasis is similar. Moreover it also targets the
IL-pathway.
Different dosing intervals have been evaluated in the maintenance phase of studies 20120103 and
20120104. The decision not to explore less frequent doses with the 210 mg strength was made based on
the dose-response study 20090062 which indicated similar efficacy of 140 mg Q2W and 210 mg Q2W. Not
exploring longer administration intervals with the 210 mg is considered a limitation in light of the results
of the pivotal studies which clearly demonstrate a larger response rate to the 210 mg strength in all
clinical endpoints, see further below.
The randomised withdrawal and re-treatment phase in study 20120102 allows examining the duration of
response, rebound and time to relapse.
Standard statistical methods were applied.
Efficacy data and additional analyses
A dose response relationship was demonstrated in study 20090062, although with respect to percent
PASI improvement there seemed to be a plateau at 140 mg Q2W and 210 mg Q2W. However the pivotal

Assessment report
EMA/381484/2017 Page 94/135
trials do demonstrate a relevant benefit of 210 mg Q2W over 140 mg Q2W. The study results also suggest
that response is reduced in heavier subjects; this is particularly clear in patients weighing over 100 kg.
In the pivotal studies 20120103 and 20120104, the vast majority of patients completed the double-blind
phase. Drop-out due to adverse events or need of other therapy was low across all active treatment arms.
There was no difference in drop-out or reasons for drop-out between the study arms. There were no
notable differences between the treatment arms in demographic or disease specific characteristics.
Discontinuation rates during the maintenance phase were low, however many patients required rescue
treatment due to an inadequate response (defined as a single sPGA of ≥ 3 or persistent sPGA values of 2
over at least a 4-week period). The percentage of patients entering the rescue phase was in particular
high in brodalumab 140 mg every 4 weeks and every 8 weeks groups as compared to brodalumab 140 mg
every two weeks, brodalumab 210 mg every two weeks and monthly ustekinumab. This clearly shows
that with longer dosing intervals with the 140 mg dose; the exposure is not maintained on an effective
level.
In studies 20120103 and 20120104, both brodalumab doses demonstrated superior efficacy to placebo
with respect to PASI 75 and sPGA responders. In study 20120103, the percentage of PASI 75 responders
was 8.1% (95%CI 5.3 - 11.7) in the placebo arm as compared to 66.6% (95%CI 62.7 - 70.3) and 86.3%
(95%CI 83.3 - 88.9) in the brodalumab 140 mg Q2W and 210 mg Q2W arm, respectively. In study
20120104, the percentage of PASI 75 responders was 6.0% (95%CI 3.7 – 9.3) in the placebo arm, as
compared to 69.2% (95%CI 65.4 – 72.7) and 85.1% (95%CI 82.1 - 87.8) in the brodalumab 140 mg
Q2W and 210 mg Q2W arm, respectively. In study 20120103, the percentage of sPGA responders was
3.9% (95%CI (2.0 – 6.7) in the placebo arm as compared to 58.0% (95%CI 54.0 – 62.0) and 78.6%
(95%CI 75.1 – 81.8) in the brodalumab 140 mg Q2W and 210 mg Q2W arm, respectively.. In study
20120104, the percentage of sPGA responders was 4.1% (95%CI 2.2 – 7.0) in the placebo arm, as
compared to 59.9% (95%CI 56.0 – 63.8) and 79.6% (95%CI 76.3 – 82.7) in the brodalumab 140 mg
Q2W and 210 mg Q2W arm, respectively.
Further, brodalumab 210 mg Q2W demonstrated superior efficacy to ustekinumab with respect to PASI
100. In the pooled analysis of studies 20120103 and 20120104, the percentage of PASI 100 responders
was 20.1% (95%CI 17.0 – 23.5) in the ustekinumab arm, 26.4.7% (95%CI 24.0 – 28.9) in the
brodalumab 140 mg Q2W arm and 40.5% (95%CI 37.8 – 43.3) in the brodalumab 210 mg Q2W arm. In
addition, the median time to PASI 75 response was shorter with brodalumab as compared to
ustekinumab: 12.1, 8.4 and 6.4 for ustekinumab, brodalumab 140 mg Q2W and brodalumab 210 mg
Q2W, respectively.
The results of the key secondary endpoints support the primary efficacy analysis. The results of the
patient reported outcome scale PSI support the other clinical endpoints demonstrating significant
improvement in signs and symptoms of psoriasis. The 210 mg Q2W dose is consistently more effective
than the 140 mg Q2W dose for all clinical endpoints. The applicant has chosen to present odds ratios for
treatment effect. Rate differences are presented for the pooled analysis above also for the individual
studies. In general a rate ratio is preferred over OR as the OR may overestimate the magnitude of effect.
However in this case the incidence under placebo is small and the OR and RR are almost identical.
However rate differences are preferred over ratios as this concerns curative treatment and the absolute
changes are preserved with rate difference. In the response to the questions the rate differences and
corresponding confidence intervals for the individual studies were presented for both the primary and
secondary endpoints. Overall consistency of effect was shown for the primary and secondary endpoints.
Maintenance of effect is considered demonstrated. In studies 20120103/4 maintenance of response was
clearly superior for the 210 mg Q2W dose regime as compared to the 140 mg Q2W, 140 mg Q4W and 140
mg Q8W dose regime. Response rates at 52 weeks were 65%, 48%, 10.3% and 2.9% respectively.
However for the 280 mg dose only the Q2W dose interval was studied. It remains uncertain whether for

Assessment report
EMA/381484/2017 Page 95/135
the 280 mg dose larger dose intervals are possible. Based on PK/PD modelling a clear relationship was
observed between brodalumab exposures (week 12 Cthrough and efficacy outcome (sPGA 0/1). Further
PK/PD modelling showed that longer dose intervals for the 210 mg e.g. Q3W resulted in a substantial
decrease of Css,ave and Cmin. This probably would be of clinical relevance; hence large dose intervals are
not considered an option. In study 20120102 which included a randomised withdrawal and re-treatment
phase, the vast majority of patients completed the double-blind phase, and there were no differences
between the treatment groups in discontinuation rate or reasons for discontinuation. There were also no
notable differences between the treatment arms in demographic or disease specific characteristics.
In study 20120102 both brodalumab doses demonstrated superior efficacy to placebo with respect to
PASI 75 and sPGA responders at 12 weeks. The percentage of PASI 75 responders was 2.7% (95%CI 1.0
– 5.8) in the placebo arm as compared to 60.3% (95%CI 53.5 – 66.8) and 83.3% (95%CI 77.8 – 88.0)
in the brodalumab 140 mg Q2W and 210 mg Q2W arm, respectively. The percentage of sPGA responders
was 1.4% (95%CI 0.3 – 3.9) in the placebo arm, as compared to 53.9% (95%CI 47.0 – 60.6) and 75.7%
(95%CI 69.5 – 81.2) in the brodalumab 140 mg Q2W and 210 mg Q2W arm, respectively.
The results of the key secondary endpoints i.e. PASI 100, sPGA 0 and PSI are in line with the primary
efficacy analysis, demonstrating superiority of both brodalumab arms to placebo. In overall, the response
with the 210 mg Q2W dosing regimen was larger as compared to the 140 mg Q2W dosing regimen.
After re-randomization to placebo at week 12, the responder rate declined slowly. Two weeks after
re-randomization, the majority of patients were still sPGA and PASI 75 responders.. The data show also
that re-treatment after inadequate response was effective and patients started responding within a few
days.
Approximately 90% of the sPGA responders who were re-randomised to receive placebo at week 12
required re-treatment during the withdrawal/re-treatment phase while only 6% of patients continuing on
brodalumab 210 mg Q2W required re-treatment. Additional data were presented regarding the duration
of remission and the effectiveness of re-treatment after recurrence in this study. The median time to
inadequate response in subjects switched to placebo after receiving 210 mg Q2W was 8.1 weeks (range
3.9 - 36.0 weeks). The median time to achieve a sPGA <2 following retreatment was 4 weeks. This
suggests that an on- demand treatment regime is not a realistic option.
A recommendation has been included in section 4.2 of the SmPC that consideration should be given to
discontinuing treatment in patients who have shown no response after 12-16 weeks of treatment.
The pooled analysis across studies support the results of the individual studies i.e. a clear superiority of
both brodalumab strengths over placebo across studies is demonstrated. Also a larger benefit of the 210
mg Q2W strength as compared to 140 mg Q2W is demonstrated in all studies. The 210 mg Q2W
brodalumab strength is also clearly superior to ustekinumab at week 12 with respect to PASI 75
responders.
The subgroup analyses demonstrate that there is little effect modification on PASI 75 responders by
baseline demographics, baseline disease characteristics, and previous therapy, except with respect to
weight. The effect modification by weight is even more pronounced in sPGA 0/1 responders, PASI 100
responders and sPGA 0 responders, also in the 210 mg Q2W group. The sPGA responder rate is 84.2% in
patients weighing ≤100 kg as compared to 64.7% in patients weighing >100 kg. The PASI 100 responder
rate is 46.0% in patients weighing ≤100 kg as compared to 27.6% in patients weighing >100 kg. The
sPGA 0 responder rate is 46.2% in patients weighing ≤100 kg as compared to 27.6% in patients weighing
>100 kg. While it is acknowledged that efficacy in heavier patients is established, these patients may
benefit from a higher dose as there is a clear exposure-response relationship as well as a
clear relationship between response and body weight. In their response company did insufficiently justify
the 210 mg Q2W dosing recommendation being independently from body weight. As the prevalence of

Assessment report
EMA/381484/2017 Page 96/135
obesity is increased in psoriasis patients as compared to the general population, and as there is
correlation between obesity and severity of psoriasis, dosing in heavier subjects is considered highly
relevant. The applicant will perform a post-authorization clinical study to establish the optimal
dose/dosing regimen in patients with a very high weight.
2.5.4. Conclusions on the clinical efficacy
The clinical development plan consists of a standard clinical package for a new product for the treatment
of plaque psoriasis and is in line with the Guideline on clinical investigation of medicinal products indicated
for the treatment of psoriasis (CHMP/EWP/2454/02 corr). The pivotal clinical studies are standard
randomised controlled trials. The studies are agreed with respect to study design, duration, patient
population and clinical endpoints.
Short-term efficacy of brodalumab 140 mg Q2W and 210 mg Q2W was demonstrated. The response to
the 210 mg Q2W dosing regimen was larger as compared to the 140 mg Q2W dosing regimen across all
endpoints. Brodalumab 210 mg Q2W was also more efficacious than ustekinumab and the time to
response was shorter. Maintenance of the effect is considered established. An on-demand dose regime
and increased dose interval has been discussed but was not considered realistic.
There is an underexposure in the highest weight categories which correlates with reduced response rates.
While it is acknowledged that efficacy also in heavier patients is established with the current posology,
these patients might benefit more from a higher dose and the applicant will perform a post-authorization
clinical study to establish the optimal dose/dosing regimen in the high weight group of patients.
2.6. Clinical safety
Patient exposure
The Integrated Safety Analysis Set in psoriasis (ISAS Psoriasis subset) includes all subjects who received
≥1 dose of investigational product in any of the Phase 2 and 3 psoriasis studies. Up to data cut-off, a total
of 4461 patients with moderate to severe psoriasis had received brodalumab, representing a total of
5448.8 subject-years exposed. At least 1 year of follow-up time is available for 3141 patients.
Three data pools were generated based on the study treatment period and study design to characterize
the safety profile of brodalumab. These are presented in Figure 13.

Assessment report
EMA/381484/2017 Page 97/135
Figure 13: Psoriasis safety sets
Analyses at week 12 (Pool A) are considered “as randomised.” Due to the small number of subjects in the
70 mg Q2W and 280 mg Q4W dose groups, these groups are not displayed in the in-text tables of this
report. However, the data from these treatment groups are included in the all-brodalumab group.
Because the study designs included re-randomization at week 12 and protocol-defined rescue treatment
for eligible subjects, the week 52 analysis (Pool B) is based on the baseline treatment allocation and
subsequent re-randomization and rescue treatment. These treatment groups are not “as-randomised.”
They are the planned treatment groups based on study design, and due to the re-treatment or rescue
paradigms built into the study designs, the balance of randomization was no longer maintained.
Treatment group definitions for pool B are presented in Table 29.
Table 29: Treatment group definitions in pool B Treatment group Definition
Constant brodalumab dose groups
210 mg Q2W Subjects who within each period, with (by study design) no planned interruptions in treatment, were randomised (and re-randomised, if applicable) to a constant dose of 210 mg Q2W or who based on their planned sequence of treatments by study design were assigned to receive a constant dose of 210 mg Q2W.
140 mg Q2W Subjects who within each period, with (by study design) no planned interruptions in treatment, were randomised (and re-randomised, if applicable) to a constant dose of 140 mg Q2W.

Assessment report
EMA/381484/2017 Page 98/135
Variable brodalumab dose groups
140 mg Q2W/ 210 mg Q2W
Mixed-dose
210 mg Q2W after ustekinumab
ustekinumab
Subjects with (by study design) no planned interruptions in treatment were randomised and re-randomised to both 140 mg Q2W and 210 mg Q2W, or who based on their planned sequence of treatments by study design were assigned to both 140 mg Q2W and 210 mg Q2W. Subjects who were randomised and re-randomised to receive different brodalumab dosages over the course of exposure (e.g. 140 mg Q4W, 140 mg Q8W) or subjects who had treatment interruptions that occurred while on study (i.e. periods of placebo treatment during the withdrawal periods [based on study design], gaps between controlled study and open-label extension). Subjects initially randomised to ustekinumab who qualified at week 16 to receive brodalumab 210 mg Q2W. Ustekinumab subjects are initially represented in the “ustekinumab” treatment group up until the time they received their first dose of brodalumab as a rescue therapy at week 16. All subjects originally randomised to ustekinumab. Subjects originally randomised to ustekinumab and subsequently qualified for rescue to brodalumab at week 16 are included in the ustekinumab dosing group until their first dose of brodalumab after rescue, and then included in the ‘210 mg Q2W after ustekinumab dosing group’.
In pool C, the treatment grouping is based on longitudinal exposure of subjects to brodalumab rather than
on the original randomised (or re-randomised) treatment groups. Subjects in Pool C were assigned to 1
of 4 brodalumab treatment groups as presented in Table 30. These are defined based on the proportion
of doses that were either 140 mg or 210 mg among all planned doses after the first dose of brodalumab.
Table 30: Treatment group definitions in pool C
Treatment group Definition
For subjects who had brodalumab exposure only
Overall 210 mg Q2W Subjects who received ≥75% of doses of 210 mg starting from
their first 210 mg dose and never received a brodalumab dose of
140 mg, 70 mg, or 280 mg. AEs within this treatment group
include those that occurred after the subject first received 210 mg
brodalumab.
Overall 140 mg Q2W Subjects who received ≥75% of doses of 140 mg starting from
their first 140 mg dose and never received a brodalumab dose of
210 mg, 70mg, or 280 mg. AEs within this treatment group
include those that occurred after the subject first received 140 mg
brodalumab.
Overall variable dose Subjects who did not qualify for either of the treatment groups
defined above but received at least 1 dose of brodalumab. AEs
within this treatment group include those that occurred after the
subject first received a dose of brodalumab.

Assessment report
EMA/381484/2017 Page 99/135
For subjects who previously received ustekinumab
210 mg Q2W after ustekinumab
Subjects initially randomised to ustekinumab who later received a
dose ustekinumab of brodalumab 210 mg Q2W. AEs within this
treatment group include those that occurred after the subject first
received brodalumab 210 mg Q2W.
Adverse events
An overall summary of the incidence of AEs and rates of exposure-adjusted AEs for Pool A (up to 12
weeks) are displayed in Table 31. Severity of AEs was determined using the National Cancer Institute
(NCI) CTCAE version 4.0 or 4.03 (i.e. 1=mild, 2=moderate, 3-severe, 4=life threatening).
Table 31: Overall summary of adverse events during initial double-blind period (Pool A)
Abbreviations: N subjects in Studies 20090062, 20120102, 20120103, 20120104 with ≥1 dose of investigational product; n1 number
of subjects reporting ≥1 occurrence of an adverse event through week 12; n2 number of adverse events; Q2W Every 2 weeks; Q4W Every 4 weeks; Subj-yr Total subject years of exposure through week 12; r exposure-adjusted event rate per 100 subject-years
(n2/subj-yr*100); %=n1/N*100.
Note: For exposure-adjusted events, multiple occurrences of the same event for a subject are counted as multiple events. Treatment
groups are defined as planned (randomised) treatment. Data for the brodalumab 70 mg Q2W group and the brodalumab 280 mg Q4W
group are not shown, on the basis of the very small n’s for these groups, but are represented within the all-brodalumab group. Events
are coded with CTCAE v. 4.0 or 4.03 (depending on study) and MedDRA v. 17.1.
Adverse events occurring in ≥2% of subjects in the all-brodalumab treatment group during the initial
double-blind treatment period are shown by treatment group in table 37.
The percentage of subjects with any AE was generally similar between all-brodalumab-treated subjects
and ustekinumab-treated subjects, although lower incidences for arthralgia (2.4% vs 4.8%),
oropharyngeal pain (1.3% vs 2.1%) and diarrhoea (0.8% vs 2.0%) were reported for ustekinumab
compared to all-brodalumab; both treatments had a slightly higher incidence of AEs than that reported for
subjects who received placebo.

Assessment report
EMA/381484/2017 Page 100/135
Infections and Infestations was the most commonly reported SOC across all treatment groups (27.5%
brodalumab 210 mg Q2W, 22.8% brodalumab 140 mg Q2W, 25.4% ustekinumab, and 23.4% placebo).
Table 32: Subject incidence of adverse events occurring at ≥2% in the all-brodalumab group during initial double-blind period.
A summary of the incidence of AEs and rates of exposure-adjusted AEs for Pool B (up to 52 weeks) are
displayed in Table 33.
Table 33: Overall summary of exposure-adjusted event rates of adverse events through Week 52.
Abbreviations: N subjects in Studies 20090062/20090403, 20120102, 20120103, and 20120104 with ≥1 dose of active investigational
product; n number of adverse events; Q2W Every 2 weeks; Q4W Every 4 weeks; r exposure-adjusted event rate per 100 subject-years
(n/subj-yr*100); Subj-yr Total subject years of exposure through week 52.
Multiple occurrences of the same event for a subject are counted as multiple events. Events are coded with CTCAE v. 4.0 or 4.03

Assessment report
EMA/381484/2017 Page 101/135
(depending on study) and MedDRA v. 17.1. Treatment groups are as planned treatment; 140/210 = 140 mg Q2W and 210 mg Q2W;
Mixed Dosing = 140 mg Q4W or Q8W, planned placebo treatment in study, or dosing gaps between studies; Ustekinumab subjects
rescued at week 16, are in "Ustekinumab" until first dose of brodalumab, then in "210 mg Q2W After Ustekinumab"
Adverse events with exposure-adjusted rates >5 per 100 subject-years in the all-brodalumab group in
Pool B are shown in Table 34.
Consistent with the results in Pool A, the events of nasopharyngitis, upper respiratory tract infection,
arthralgia, and headache had the highest exposure-adjusted rates in Pool B. Upper respiratory tract
infection events had a lower exposure-adjusted rate in the all-brodalumab group (19.2 per 100
subject-years) when compared with the ustekinumab group (25.3 per 100 subject-years). Arthralgia and
headache events had slightly higher rates in the all-brodalumab group (14.0 and 12.4 per 100
subject-years, respectively) when compared with the ustekinumab group (11.5 and 10.9 per 100
subject-years, respectively).
Table 34: Adverse events with exposure-adjusted rates >5 per 100 subject-years in the
all-brodalumab group in Pool B.
Abbreviations: N subjects in Studies 20090062/20090403, 20120102, 20120103, and 20120104 with ≥1 dose of active investigational
product; n number of adverse events; r exposure-adjusted event rate per 100 subject-years (n/subj-yr*100); Subj-yr Total
subject-years of exposure through week 52. Treatment groups are as planned treatment; 140/210=140 mg Q2W and 210 mg Q2W;
Mixed Dosing=140 mg Q4W or Q8W, planned placebo treatment in study, or dosing gaps between studies; Ustekinumab subjects
rescued at week 16, are in "Ustekinumab" until first dose of brodalumab, then in "210 mg Q2W After Ustekinumab"
Multiple occurrences of the same event for a subject are counted as multiple events. Events are coded with MedDRA v. 17.1
Through the data cut-off (Pool C), the exposure-adjusted event rate of AEs (per 100 subject-years) was
346.5 for the all-brodalumab group. The exposure-adjusted event rates of serious AEs (7.5
all-brodalumab), AEs leading to investigational product discontinuation (3.2 all-brodalumab), and AEs
leading to discontinuation from study (1.9 all-brodalumab) were low across the brodalumab groups.
The events of nasopharyngitis, upper respiratory tract infection, arthralgia, and headache occurred with
the highest exposure-adjusted event rates in the all-brodalumab group in Pool C, consistent with the
results observed in Pools A and B for the all-brodalumab group

Assessment report
EMA/381484/2017 Page 102/135
Serious adverse event/deaths/other significant events
Deaths
As of the data cut-off, a total of 18 fatal events were reported across the psoriasis program; however, 1
of these events was not a fatal outcome in a study participant (a spontaneous abortion in the partner of
a male study participant was reported by an investigator). 16 of the fatal events occurred in the
brodalumab arms and two in the ustekinumab arm. The follow-up time-adjusted event rate was 0.3 per
100 patient years in the all-brodalumab group and 0.4 in the ustekinumab group. Comorbidity or
additional risk factors could explain all of these deaths and the relationship to brodalumab is unlikely.
Summary of fatal events is presented in Table 35.
Table 35: Summary of deaths in the brodalumab psoriasis program Treatment
at time of
event
Preferred term
(cause of death)
Start of event
(days)/study
period
Last
active
dose
(days)
Risk factors Study
drug
related
210 mg Q2W Intentional
overdose
98/ randomised
withdrawal
14 depression and
substance abuse
Not
suspected
210 mg Q2W oesophageal
varices
haemorrhage
258/ randomised
withdrawal
4 (NASH induced) liver
cirrhosis; alcohol
abuse
Not
suspected
210 mg Q2W Completed suicide 330/randomised
withdrawal
58 financial stress Not
suspected
210 mg Q2W cerebrovascular
accident
267/randomised
withdrawal
14 hypertension and
arrhythmia, sleep
apnoea,
hypothyroidism
Not
suspected
210 mg Q2W Sudden death 197/randomised
withdrawal
0 coronary bypass
surgery, obesity,
hypercholesterolemia,
hypertension,
diabetes.
Not
suspected
210 mg Q2W Cerebral infarction 88/induction 20 upper gastrointestinal
haemorrhage, alcohol
abuse
Not
suspected
210 mg Q2W Abortion missed 256 - subject’s partner
missed abortion
-
210 mg Q2W traumatic lung
injury
591/long-term
extension
(rescued)
87 vehicle accident Not
suspected
210 mg Q2W Death (adjudicated
as sudden death)
126/maintenance 14 cause of death
undetermined
Not
suspected
210 mg Q2W Completed suicide 141/maintenance 27 Legal problems Not
suspected
ustekinumab Death (adjudicated
as sudden death)
140/maintenance 13 Myocardial infarction,
congestive heart
failure, and
hypercholesterolemia
Not
suspected
ustekinumab Pancreatic
carcinoma
186/maintenance 59 - Suspected
210 mg Q2W Cardiopulmonary
failure
474/long-term
extension
39 hypertension and
hypercholesterolemia
Not
suspected

Assessment report
EMA/381484/2017 Page 103/135
(rescued)
210 mg Q2W Histiocytosis
hematophagic
249/maintenance
(rescued)
41 preceding infection Not
suspected
210 mg Q2W cardiac arrest 275/maintenance 7 DM type II, kidney
stones, smoking
Not
suspected
210 mg Q2W cardiomyopathy 298/maintenance
(rescued)
87 morbid obesity, DM
type II, smoker
hyperlipidemia, atrial
fibrillation,
hypertension
Not
suspected
140 mg 2QW accidental death 123/maintenance 10 motor vehicular
accident
Not
suspected
210 mg Q2W aortic aneurysm
rupture
54 11 DM type II Not
suspected
NASH nonalcoholic steatohepatitis; Q2W every 2 weeks; Q4W every 4 week
Serious adverse events
Subject incidence rates of serious AEs were low (1.0% to 1.9%) and were generally similar between
treatment groups during the double-blind period (pool A). Serious AEs with the highest subject incidence
rates were from the Infections and Infestations SOC (0.5% brodalumab 210 mg Q2W, 0.5% brodalumab
140 mg Q2W, 0.3% ustekinumab, and 0.2% placebo) and the Gastrointestinal Disorders SOC (0.1%
brodalumab 210 mg Q2W, 0.3% brodalumab 140 mg Q2W, 0.0% ustekinumab, and 0.1% placebo). The
most common SAE was cellulitis. Through week 12, there was 1 subject (210 mg Q2W) who had 2 suicide
attempts reported as SAEs.
The exposure-adjusted rate of serious AEs up to week 52 was 8.3 in the all-brodalumab group and 8.5 in
the ustekinumab group. The incidence was slightly higher in the constant brodalumab groups as
compared to others: 9.8 per 100 subject years in the constant 140 mg Q2W group and 9.6 per 100
subject years in the constant 210 mg Q2W group, as compared to 5.3 – 8.5 in the other groups. The SOCs
with the highest exposure-adjusted event rates (per 100 subject years) of serious AEs were Infections
and Infestations (1.3 all-brodalumab group, 1.0 ustekinumab); Injury, Poisoning, and Procedural
Complications (1.0 all-brodalumab group, 1.2 ustekinumab); and Cardiac Disorders (1.1 all-brodalumab
group, 0.6 ustekinumab). The most common serious AEs were myocardial infarction (0.3 in the
all-brodalumab group, 0.2 ustekinumab) and cellulitis (0.2 in the all-brodalumab group, 0.2
ustekinumab).
Through the data cut-off, the exposure-adjusted incidence of serious AEs was 7.5 in the all-brodalumab
group. The SOCs with the highest exposure-adjusted serious AE rates (per 100 subject years) were
Infections and Infestations (1.2); Cardiac Disorders (1.0); and Injury, Poisoning and Procedural
Complications (0.9) consistent with results observed in Pool B for the all-brodalumab group.
Adverse events of interest
Crohn’s disease
A new onset of Crohn’s disease occurred in one patient during the psoriasis studies.

Assessment report
EMA/381484/2017 Page 104/135
Infections and infestations
The Th17/IL-17 axis plays an important role in host defence against infectious pathogens, in particular
extracellular bacteria and fungi. Therefore infections and infestations were identified as an AE of interest
for brodalumab.
During the induction phase, subject incidence rates through week 12 for AEs in the Infections and
Infestations SOC were higher in the brodalumab 210 mg Q2W group (27.5%) compared with brodalumab
140 mg Q2W (22.8%), ustekinumab (25.4%), and placebo (23.4%). The most frequent infections (≥1%
of all-brodalumab subjects) were nasopharyngitis, upper respiratory tract infection, pharyngitis, urinary
tract infections, bronchitis, and influenza.
Through week 52, the exposure-adjusted event rates (per 100 subject-years) of AEs in the Infections and
Infestations SOC were 114.6 for the all-brodalumab group and 118.1 for the ustekinumab group. The
most frequent events (≥4.0 events per 100 subject-years) in the all-brodalumab group were
nasopharyngitis, upper respiratory tract infection, urinary tract infections, sinusitis, and bronchitis. All
grade 4 adverse events occurred in patients treated with brodalumab.
Serious infections occurred in 0.5% in the brodalumab 210 mg Q2W group as well as 140 mg Q2W group,
as compared to 0.2% and 0.3% in the placebo group and ustekinumab group, respectively. The
exposure-adjusted event rates (per 100 subject-years) of serious AEs in the Infections and Infestations
SOC were 1.3 in all-brodalumab group and 1.0 in ustekinumab group. As in the induction phase, the most
common serious infectious AE in the all-brodalumab group was cellulitis.
Two subjects reported a serious opportunistic infection: coccidioidomycosis (grade 2) and meningitis
cryptococcal (grade 3), both in patients treated with brodalumab 210 mg Q2W.
Amongst fungal infections, candida infections were the most frequently reported. Subject incidence rates
of AEs mapping to the candidiasis high-level term (HLT) through week 12 increased with increasing
brodalumab dose (0.9% brodalumab 210 mg Q2W, 0.6% brodalumab 140 mg Q2W) compared with
ustekinumab (0.0%) and placebo (0.2%). The incidence of fungal infections, including candida, remained
stable in the brodalumab treated patients through the treatment period up to data cut-off.
Neutropenia
Interleukin-17A, IL-17F, and IL-17A/F play a role in the proliferation, maturation, and chemotaxis of
neutrophils. Therefore neutropenia has been recognized as an identified risk in association with
administration of brodalumab.
Subject incidence rates through week 12 for AEs mapping to neutropenia were highest in the brodalumab
210 mg Q2W dose group (1.0%) compared with the brodalumab 140 mg Q2W (0.7%), ustekinumab
(0.8%), and placebo (0.5%) groups. Through week 52, the exposure-adjusted event rates (per 100
subject-years) of AEs mapping to neutropenia were similar for the all-brodalumab (2.3) and the
ustekinumab (2.4) groups. Please see also section Laboratory findings.
Suicidal ideation and behaviour
Suicidal ideation and behaviour (SIB) was identified as an important potential risk in the brodalumab
program in early 2014 based on reports of SIB events in ongoing psoriasis Phase 3 studies. The electronic
Columbia-Suicide Severity Rating Scale (eC-SSRS) and the Patient Health Questionnaire-8 (PHQ-8) were
implemented across the program in May 2014.
A retrospective analysis of potential SIB events was performed to events reported prior to
implementation of the eC-SSRS. The SIB events were adjudicated based on the Columbia-Classification
Algorithm for Suicide Assessment (C-CASA) by a blinded committee which received all available
information on any potential event.

Assessment report
EMA/381484/2017 Page 105/135
Overall subject incidence rate of SIB in the brodalumab program (all indications)
The overall subject incidence rates of SIB in brodalumab exposed subjects up to data cut-off of March
2015 is presented in Table 36. In total, six completed suicides have occurred in the entire brodalumab
clinical program up to data cut-off (N=5208, 8519.0 subject-years).
Table 36: Follow-up observation time-adjusted subject incidence rates of SIB events from first brodalumab dose (subjects who received brodalumab in unblinded Phase 2/3 Sponsor studies)
SIB in brodalumab psoriasis program
During the initial 12-week treatment period of the psoriasis studies, there was 1 subject with 2 suicide
attempts (0.07%) in the brodalumab 210 mg Q2W group, compared with none in the other groups. The
overall subject incidence of SIB was 0.03% (1 subject) in the all-brodalumab group. (The subject with 2
suicide attempts was counted once).
Follow-up observation time-adjusted subject incidence rates of SIB events through week 52 are
presented in Table 37. Looking at the incidence of SIB events up to 52 weeks, the follow-up
observation-time adjusted rates are lower in the all-brodalumab than in the ustekinumab groups.
There seems to be an increase of SIB events over the time course. However this observation is
confounded by the fact that the eC-SSRS questionnaire was implemented after 52 weeks.

Assessment report
EMA/381484/2017 Page 106/135
Table 37: Follow-up observation time-adjusted subject incidence rates of SIB events through Week 52 (Pool B).
MedDRA v. 17.1; N = subjects in Studies 20090062/20090403, 20120102, 20120103 & 20120104 with ≥ 1 dose of active
investigational product.
Treatment groups are as planned treatment; 140/210 = 140 mg Q2W and 210 mg Q2W; Mixed Dosing = 140 mg Q4W or Q8W, planned placebo treatment in study, or dosing gaps between studies; Ustekinumab subjects rescued at week 16, are in "Ustekinumab" until first
dose of brodalumab, then in "210 mg Q2W after ustekinumab". Brodalumab 210 mg Q2W constant dose group includes subjects who
received 210 mg Q2W at induction and maintenance and subjects who received placebo at induction and brodalumab 210 mg Q2W at
maintenance.
Subj-yr Total subject-years of follow-up through min(subjects first suicidal ideation and behavior event, week 52); n Number of
subjects with adverse events; r Follow-up observation time adjusted subject incidence rate per 100 subject-years (n/subj-yr*100).
Multiple occurrences of the same events for subject are counted once. Total subjectyears are truncated at subjects first suicidal ideation
and behavior event. a The category “Completed Suicide” includes all fatal events from the Suicidal Behavior events of interest category
b Fatal event reported as suicide, later adjudicated as “indeterminate”
Follow-up observation time-adjusted subject incidence rates of SIB events from first dose of brodalumab
- March 2015 data cut-off was 0.33 in the all-brodalumab group.
Time to SIB event
Review of the individual SIB cases did not reveal any notable trends: the time to onset of events from first
dose of brodalumab ranged from 23 days to more than 800 days; the time to onset from last dose ranged
from <14 days to 58 days. Based on evaluation of the timing of suicides relative to brodalumab dosing
interval in the psoriasis studies, there was no clear pattern of timing relative to the withdrawal of dosing.
Assessment of SIB by prior history
In the brodalumab psoriasis studies, there were no specific exclusion criteria based on the presence or
history of psychiatric disorders or substance abuse, and psychiatric medical history was initially based on
subject self-report.
The follow-up time-adjusted incidence rates of SIB in subjects with and without a prior history of
depression and suicidality is presented in Table 38.

Assessment report
EMA/381484/2017 Page 107/135
Table 38: Follow-up observation time-adjusted subject incidence rates of SIB events by prior depression history (Yes, No), and suicidality history (Yes, No, and Unknown) from first dose
of brodalumab - March 2015 Data Cut-off
MedDRA v. 17.1; N= subjects in subgroup from Studies 20120102, 20120103, and 20120104 with ≥1 dose of brodalumab
Subj-yr=Total subject-years of follow-up through min(subject's first suicidal ideation and behavior event, data cutoff); n=number of
subjects with AEs; r=follow-up observation time-adjusted subject incidence rate per 100 subject-years (n/subj-yr*100). Multiple
occurrences of the same events for a subject are counted once. Total subject-years are truncated at subjects' first suicidal ideation and
behavior event.
a Includes completed suicide and all other suicidal behaviors. b An eC-SSRS is administered at the start of a study to collect information on prior suicidality history, known as a “lifetime response”.
At subsequent visits, information collected is known as the “since last contact response”. Given that the eC-SSRS was implemented
midway through the psoriasis program, an additional questionnaire was administered to determine “since study start response”. Based
on the responses provided, subjects were categorized as either having a prior history of suicidality or no prior history of suicidality. For
a subset of subjects who had both lifetime and since study- start responses, lifetime history was categorized as “unknown”.
In the brodalumab psoriasis development program, completed suicides were reported for 4 subjects; 2 of
these subjects had a history of depression, and 2 did not report any psychiatric risk factors but reported
psychosocial triggers (financial trouble, legal problems).
Neuropsychiatric AEs of anxiety and depression in the controlled treatment periods in the psoriasis
studies
An increased frequency of neuropsychiatric AEs, including depression and/or anxiety, was not observed
with brodalumab use in the psoriasis program.
Through week 52, the exposure-adjusted event rates (per 100 subject-years) of adverse events in the
Psychiatric Disorders SOC were 7.5 for the all-brodalumab group and 8.9 for the ustekinumab group. The
most frequent events (≥1.0 events per 100 subject-years) in the all-brodalumab group were depression,
anxiety, and insomnia.
Exposure-adjusted rates for serious adverse events were 0.3 for the all-brodalumab group and 1.0 for the
ustekinumab group.
Epidemiological data and comparison with externally-derived rates from other clinical trials or registries
for psoriasis
To better understand the context of the SIB incidence rates observed in the brodalumab program, the
applicant has gathered data from literature concerning epidemiology of SIB in the general population,
psoriasis, other indications in which brodalumab is studied, as well as information from clinical trials and
registries on specific AEs of interest in adults with psoriasis or psoriatic arthritis treated with biological
agents or other recently approved agents.
Based on an analysis performed in the US adult population by Centers for Disease Control and Prevention,
in the past year, 3.7% of adults reported suicidal thoughts, 1.0% reported having made suicide plans,
and 0.5% reported making a suicide attempt. The overall suicide rate in US adults in 2013 was 0.013 per
100 patient-years.

Assessment report
EMA/381484/2017 Page 108/135
A recent multi-national cross-sectional study (Dahlgard et al 2015) found an overall prevalence of
reported suicidal ideation of 17.3% among patients with psoriasis; among those reporting suicidal
ideation, 67.6% attributed it to their psoriasis. Compared to controls without any skin conditions, patients
with psoriasis were more likely to report suicidal ideation, adjusted Odds Ratio (OR) 1.94, (95% CI: 1.33,
2.82), and of all of the skin conditions studied, only psoriasis was found to be statistically significantly
associated with suicidal ideation.
The pooled estimate of rates of SIB events per 100 subject-years in patients with psoriasis participating
in clinical trials irrespective of treatment was 0.109 (95% CI: 0.023 to 0.320) for suicidal ideation or
behaviour, 0.040 (95% CI: 0.011 to 0.101) for suicide attempts, and 0.028 (95% CI: 0.012 to 0.055) for
completed suicide. The comparison of these numbers and the incidence of SIB is complicated by the fact
that the external rate includes a variety of studies with different populations and other study
characteristics. It should also be noted that in some studies, patients with pre-existing psychological
comorbidity were excluded.
Biological plausibility of a brodalumab effect on SIB
IL-17RA – target of brodalumab - is widely expressed at low levels across many regions of the human
brain. Highest mRNA expression of IL-17RA in the brain occurs in the caudate, putamen and nucleus
accumbens regions of the brain. Compared to human neutrophils, these levels are low.
The levels of IL-17 and IL-17R appear to be very low in the healthy brain, while the expression is
increased under inflammation or injury. It is not known whether IL-17 and IL-17R have any physiological
role in healthy brain.
Studies examining the possible correlation of IL-17 and other cytokines with psychiatric conditions have
not shown a causal relationship between the changes in serum levels of pro-inflammatory cytokines and
suicidal behaviour or suicidal ideation (Chen et al 2011, Serafini et al 2013, Haroon et al 2012, Lindqvist
et al 2009, Liu et al 2012).
Based on the current knowledge biological plausibility of causal relationship between brodalumab and SIB
cannot be concluded. However it also cannot be excluded, as too little is known over the effects of IL-17
in CNS.
Major adverse cardiac events (MACE)
During the induction phase, a total of 3 subjects (0.1%) had cardiovascular events committee
(CEC)-adjudicated MACE (2 myocardial infarctions and 1 stroke). All 3 events occurred in the brodalumab
140 mg Q2W group. The low incidence of MACE during the induction period does not indicate a
predisposition to serious cardiovascular events.
Up to week 52, an additional 19 MACE were reported. Two events occurred in patients treated with
ustekinumab, the rest in the all-brodalumab group, leading to a total of 20 events in the all-brodalumab
group as compared to two in the ustekinumab group. Myocardial infarction was the most common MACE.
Altogether up to 52 weeks (thus including the events in the induction phase), the incidence of MACE was
0.6 per 100 subject-years for all-brodalumab group and 0.4 per 100 subjects years in the ustekinumab
group.
There were 4 additional MACE reported in the week-52 period that occurred beyond the exposure window
(as defined by the dosing regimen) for the brodalumab treatment group. These events included a CV
death (87 days after last investigational product exposure), 2 events of myocardial infarction (18 and 19
days, respectively, after last investigational product exposure), and an event of stroke (24 days after
investigational product exposure). No dose-response relationship in the brodalumab treated subjects was
observed.

Assessment report
EMA/381484/2017 Page 109/135
All subjects for whom a MACE was reported had ≥1 major CV risk factor and additional confounding
comorbidities, with most with ≥3 risk factors.
Hypersensitivity
During the induction phase, subject incidence rates for AEs mapping to Hypersensitivity (and occurring
within 1 day of investigational product exposure) were 1.7% in the brodalumab 210 mg Q2W group, 2.6%
in the brodalumab 140 mg Q2W group, 1.3% in the ustekinumab group, and 3.1% in the placebo group.
The most common event was pruritus. None of the events was serious.
Through week 52, the exposure-adjusted event rates of hypersensitivity events (per 100 subject-years)
were 6.4 for the all-brodalumab group and 2.2 for the ustekinumab group. Pruritus remained the most
common hypersensitivity event.
Injection site reactions
During the induction phase, subject incidence rates through week 12 for AEs mapping to injection site
reaction were highest in the ustekinumab group (2.0%) compared with the brodalumab 210 mg Q2W
(1.5%), brodalumab 140 mg Q2W (1.7%) and placebo (1.3%) groups. The most frequent injection site
reaction events (≥0.3% events) for the all-brodalumab group were injection site pain, injection site
erythema, and injection site bruising.
Through week 52, the exposure-adjusted event rates of injection site reactions (per 100 subject-years)
were 6.8 for the all-brodalumab group and 5.5 for the ustekinumab group. The most frequent injection
site reaction events (≥0.4% events) for the all-brodalumab group were injection site pain, injection site
erythema, injection site reaction, injection site bruising and injection site pruritus.
Malignancies
Up to 52 weeks, exposure-adjusted rates of AEs (per 100 subject-years) in the Neoplasms Benign,
Malignant and Unspecified (Incl Cysts and Polyps) SOC were 3.9 in the all-brodalumab group and 4.6 in
the ustekinumab group. The preferred term with the highest exposure-adjusted event rate (per 100
subject-years) in this SOC was skin papilloma (0.7 all-brodalumab, 0.8 ustekinumab).
The applicant calculated the standardised incidence risk (SIR) to compare the rates of all SEER
malignancies combined in brodalumab-treated subjects with rates in the general population while
adjusting for the sex and age distributions. For brodalumab-treated subjects, the SIRs with 95% CIs for
SEER-adjudicated events based on worldwide, Europe, and US incidences were <1, suggesting that there
is no evidence of increased risk of malignancy for brodalumab treated subjects compared to the general
population.
The applicant has also compared malignancy rate for other psoriasis therapies (obtained via s systemic
review) and brodalumab. The estimated malignancy rate for the category of all psoriasis agents’
treatments (n=36465.5 subject-years) was 1.429 per 100 subject-years (95% CI: 1.309, 1.557). The
follow up observation time-adjusted rate of malignancies in the brodalumab program through the data
cut-off was 0.9 per 100 subject-years (95% CI: 0.68, 1.20).
Laboratory findings
Across the studies, haematology and clinical chemistry parameters were assessed by shifts from baseline
by CTCAE grade. The majority of patients remained at baseline values through week 12. In approximately
30% of patients, glucose increased with 1 grade but this occurred across all study arms. There were very
limited cases of grade 3 or 4 increases. No discontinuations due to laboratory abnormalities were
reported.
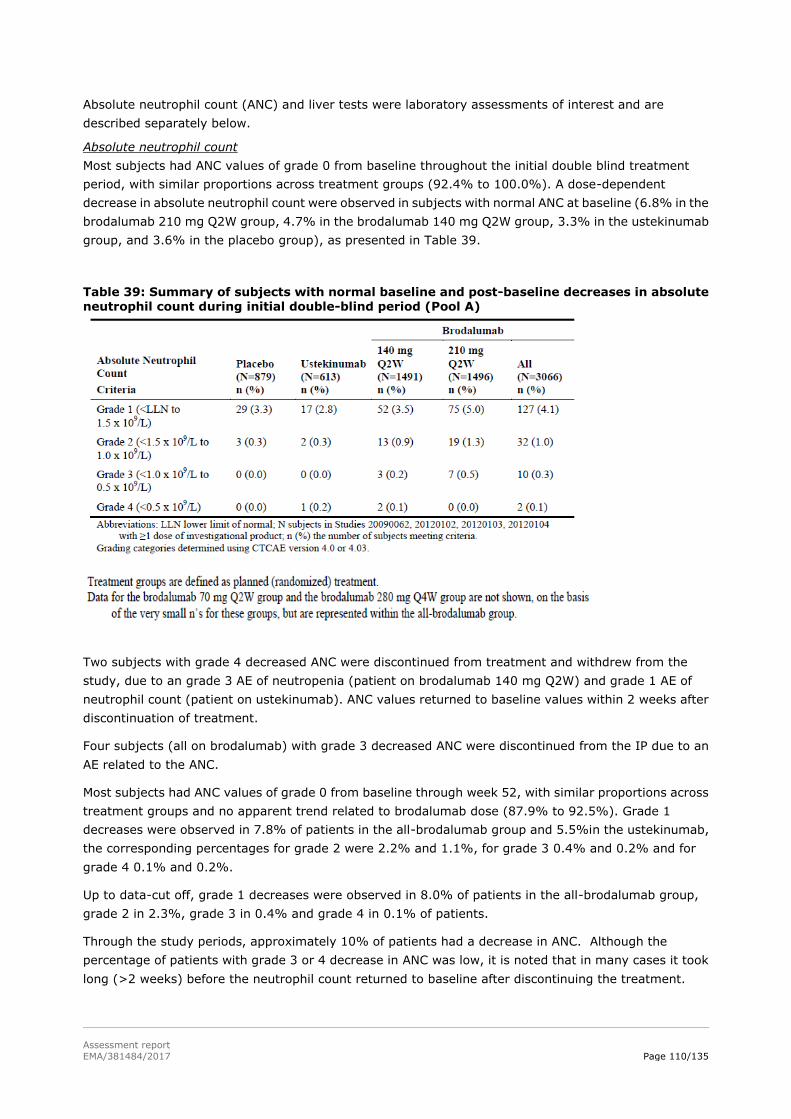
Assessment report
EMA/381484/2017 Page 110/135
Absolute neutrophil count (ANC) and liver tests were laboratory assessments of interest and are
described separately below.
Absolute neutrophil count
Most subjects had ANC values of grade 0 from baseline throughout the initial double blind treatment
period, with similar proportions across treatment groups (92.4% to 100.0%). A dose-dependent
decrease in absolute neutrophil count were observed in subjects with normal ANC at baseline (6.8% in the
brodalumab 210 mg Q2W group, 4.7% in the brodalumab 140 mg Q2W group, 3.3% in the ustekinumab
group, and 3.6% in the placebo group), as presented in Table 39.
Table 39: Summary of subjects with normal baseline and post-baseline decreases in absolute neutrophil count during initial double-blind period (Pool A)
Two subjects with grade 4 decreased ANC were discontinued from treatment and withdrew from the
study, due to an grade 3 AE of neutropenia (patient on brodalumab 140 mg Q2W) and grade 1 AE of
neutrophil count (patient on ustekinumab). ANC values returned to baseline values within 2 weeks after
discontinuation of treatment.
Four subjects (all on brodalumab) with grade 3 decreased ANC were discontinued from the IP due to an
AE related to the ANC.
Most subjects had ANC values of grade 0 from baseline through week 52, with similar proportions across
treatment groups and no apparent trend related to brodalumab dose (87.9% to 92.5%). Grade 1
decreases were observed in 7.8% of patients in the all-brodalumab group and 5.5%in the ustekinumab,
the corresponding percentages for grade 2 were 2.2% and 1.1%, for grade 3 0.4% and 0.2% and for
grade 4 0.1% and 0.2%.
Up to data-cut off, grade 1 decreases were observed in 8.0% of patients in the all-brodalumab group,
grade 2 in 2.3%, grade 3 in 0.4% and grade 4 in 0.1% of patients.
Through the study periods, approximately 10% of patients had a decrease in ANC. Although the
percentage of patients with grade 3 or 4 decrease in ANC was low, it is noted that in many cases it took
long (>2 weeks) before the neutrophil count returned to baseline after discontinuing the treatment.

Assessment report
EMA/381484/2017 Page 111/135
Elevations in liver tests
The descriptions of cases with grade 3 or 4 elevations on liver enzymes do not raise a signal of liver
toxicity. The elevated levels returned to baseline in most cases without changes in study drug
administration.
Comorbidities may have contributed to the observed increases in liver enzyme levels.
Safety in special populations
The integrated psoriasis studies contained no paediatric subjects (<18 years of age), 4268 subjects
(93.6%) who were <65 years old, and 290 subjects (6.4%) who were ≥65 years old. There was no
differential trend of adverse events between elderly and patients <65 years old.
The integrated psoriasis studies contained 3267 subjects (71.7%) who weighed ≤100 kg, and 1291
subjects (28.3%) who weighed >100 kg at baseline. No differential safety profile was observed between
patients weighing ≤100 kg and >100 kg. The safety profiles of 210 mg Q2W and 140 mg Q2W were
similar in patients weighing ≤70 kg as compared to heavier subjects.
The integrated Phase 3 psoriasis studies included 1584 subjects (36.3%) who had prior failure of a
systemic agent or contraindication and 2779 subjects (63.7%) who had not had failure of a systemic
agent or contraindication. The subject incidence rate for Brodalumab subjects who had ≥ 1 treatment
emergent AE or AE of interest was similar regardless of status of prior failure of a systemic agent or
contraindication. Treatment-emergent AEs were reported for 61.7% of Brodalumab subjects who had a
prior failure of a systemic agent or contraindication compared with 54.3% of subjects without a prior
failure. The subject incidence rate of treatment-emergent AEs in those with prior failure was also higher
for ustekinumab subjects. No notable differences in safety were observed for subjects based on prior
failure of a systemic agent or contraindication. Similar findings were observed when the subject incidence
rate of treatment-emergent AEs, serious AEs, and AEs of interest were analysed by prior failure of a
systemic agent or contraindication for Pool B. 3377 subjects (74.1%) who had prior use of systemic or
photo therapies. Treatment-emergent AEs were reported for 59.1% of Brodalumab subjects who had
prior use of systemic or photo therapies compared with 53.0% of subjects without a prior use. Similar
findings were observed when the subject incidence rate of treatment-emergent AEs, serious AEs, and AEs
of interest were analysed by prior use of systemic or phototherapies for Pools B and C.
No studies have been conducted in patients with hepatic or renal impairment. No studies of Brodalumab
have been conducted in pregnant women. Also, no studies have been conducted to determine whether
Brodalumab is present in human breast milk or to assess the effects of Brodalumab in breast fed infants.
Analyses of treatment-emergent AEs, serious AEs, and AEs of interest were performed by the subgroup
for region (Europe, North America, and rest of world) and did not reveal significant differences across
treatment groups for any of the subgroups.

Assessment report
EMA/381484/2017 Page 112/135
Table 40: Overall summary of treatment-emergent adverse events during the initial double-blind treatment group for all-brodalumab subjects by age – Psoriasis subset
Immunological events
The incidence of anti-brodalumab antibody development across clinical studies was low.
In phase 1 biopharmaceutical and clinical pharmacology studies mainly in healthy volunteers,
development of anti-brodalumab binding antibodies was 2.8% (12 out of 433) across all studies and
neutralizing antibodies were not found in any subject.

Assessment report
EMA/381484/2017 Page 113/135
In the phase 1, 2 and 3 biopharmaceutical, clinical pharmacology and efficacy studies in psoriasis,
development of anti-brodalumab binding antibodies was 2.7% (120 out of 4447) across all studies and
neutralizing antibodies were not found in any subject.
The incidence rate of positive anti-brodalumab antibodies was similar across dosing groups.
No serious adverse events were temporally associated with a positive antibody result. Based on a review
of adverse events for the subjects with positive binding antibodies, there were no adverse events (i.e.
hypersensitivity) determined to be due to the presence of a binding antibody
Anti-brodalumab binding antibodies were found in similar rates (2%) across the studies performed so far
in different indications. Two subjects in 210 mg dose developed neutralizing antibodies (in rheumatoid
arthritis study). Both subjects reverted to a seronegative ADA at a subsequent time point when
brodalumab levels were undetectable.
Binding antibodies in the baseline sample were detected in 0.3% (19 out of 6539) of subjects in all clinical
studies. Neutralizing antibodies were not detected in any subject. Positive results from these baseline
samples may be due to the presence of pre-existing antibodies capable of binding to brodalumab. These
cross-reacting antibodies may have previously developed against another antigen which contains a
region of homology with brodalumab.
Safety related to drug-drug interactions and other interactions
No in vitro or non-clinical drug-drug interaction studies were performed.
One Phase 1 study (Study 20110184) in subjects with moderate to severe plaque psoriasis was conducted
to evaluate the effect of a single SC dose of brodalumab 210 mg on the pharmacokinetics of midazolam.
Based on the degree of midazolam pharmacokinetics exposure change (<25% increase) after
co-administration of brodalumab, the presence of a drug-drug interaction in patients with moderate to
severe psoriasis is plausible but unlikely to be of clinical significance.
In patients with concomitant topical treatment (any or psoriasis therapy), no difference in
treatment-emergent AEs were observed as compared to patients without concomitant treatment.
Discontinuation due to adverse events
Discontinuation of the investigational product and/or from the study due to an AE are discussed above.
Post marketing experience
At the time of the submission of this application brodalumab was not marketed in any country.
2.6.1. Discussion on clinical safety
Patient exposure
The generated safety database is substantial. Up to the data cut-off, 4461 patients (5448.8 subject years)
with psoriasis were exposed to at least one dose of brodalumab and over 3000 patients had a cumulative
exposure of at least 1 year.
The safety data was presented in three pools i.e. up to 12 weeks (pool A), up to 52 weeks (pool B) and up
to the data cut-off (pool C). Pools A and B are the most relevant as these data allow comparison to
placebo and/or ustekinumab. Pool C allows an estimation of development of adverse events of
brodalumab in long-term in comparison to the short term controlled phase. Due to the study designs

Assessment report
EMA/381484/2017 Page 114/135
(re-randomization, rescue treatment), the treatment groups in week 52 and up to data cut-off analysis
are not ‘as-randomised’ but based on subjects’ entire dosing trajectory. The applicant’s definitions on
treatment groups and the rationale behind them are accepted. The most relevant data with respect to
safety effects of brodalumab treatment in pools B and C comes from treatment groups ‘constant
brodalumab dose groups’ and ‘overall 210 mg Q2W/140 Q2W’. Results from other brodalumab treatment
groups are difficult to interpret as patients shifted to other treatment arms throughout the study course.
Adverse events
The overall incidence of adverse events up to week 12 was comparable between the treatment arms:
58.2 % in the brodalumab 210 mg Q2W arm, 56.7%in the brodalumab 140 mg Q2W arm, 56.3% in the
ustekinumab arm and 51.3% in the placebo arm. Most common adverse events were nasopharyngitis,
upper respiratory tract infection, headache, arthralgia, fatigue, pruritus, oropharyngeal pain,
hypertension and diarrhoea.
The exposure-adjusted event rate up to week 52 was comparable between the ustekinumab and
all-brodalumab arm: 394.6 versus 401.3, respectively. There were no major differences between
brodalumab exposed treatment groups. Most common adverse events were as in pool A, plus back pain
and cough.
The exposure-adjusted event rate up to data cut-off was 346.5 in the all-brodalumab arm. There were no
major differences between brodalumab exposed treatment groups. Most common adverse events were
nasopharyngitis, upper respiratory tract infection, arthralgia, headache and back pain.
Mild, focal skin effects (crusts, acanthosis / hyperkeratosis, minimal inflammation) were found
consistently in all non-clinical repeated-dose studies. These observations were not confirmed in human
data. Pruritus was the only skin-related adverse event reported in ≥2% subjects. Across studies,
drop-out due to lack of efficacy was very low, also indicating that worsening of psoriasis is not a concern
with brodalumab treatment.
Deaths and serious adverse events
Up to the data cut-off, 18 deaths were reported. However one of these was not a fatal outcome in a study
subject. Causality to brodalumab is not suspected, as patient’s comorbidity or additional risk factors could
explain all cases. Deaths were primarily from cardiovascular causes, which is not unexpected in a patient
population with high frequency of type II diabetes, obesity, hypertension and hyperlipidemia.
The incidence of serious adverse events was below 2% across the treatment groups during the induction
phase with no imbalance between the study arms. Throughout the entire reporting period, the SOC with
the highest exposure-adjusted event rates of serious AEs was Infections and Infestations. The incidence
of serious adverse events was slightly higher in the constant brodalumab group and overall 210 mg Q2W
group as compared to other brodalumab groups.
Adverse events of interest
Adverse events of special interest, based on previous experience with biologicals (targeting the
IL-pathway) were infections, neutropenia, hypersensitivity, injection site reactions and malignancies.
Major adverse cardiac events were an adverse event of interest due to the high background risk in
psoriasis patient population. In addition, due to signals from brodalumab studies, Crohn’s disease and
suicidality became AEs of special interest.
Crohn’s disease
One case of new onset of Crohn’s disease was reported. It is unclear whether the observed case of Crohn’s
disease is related to brodalumab or whether it is representative of expected comorbidity. However as
observed worsening of symptoms in subjects with a history or active Crohn’s disease (in >22% of

Assessment report
EMA/381484/2017 Page 115/135
patients) in two studies of subjects with Crohn’s disease, Crohn’s disease in patients with active Crohn’s
disease is specified as an important identified risk and active Crohn’s disease is a contra-indication in the
SmPC. Also, in the brodalumab psoriasis program, patients with a known history of Crohn’s disease were
excluded. A warning has been included in section 4.4 of the SmPC for patients with a history of Crohn’s
disease and an advice to discontinue brodalumab if Crohn’s disease develops.
Infections and infestations
The overall incidence of infections and infestations was comparable between brodalumab and
ustekinumab, also with respect to serious infections. However, all grade 4 serious infections occurred in
patients treated with brodalumab. Nevertheless, all but one patient continued to receive brodalumab and
recovered without further events. The incidence of infections remained stable in the brodalumab treated
patients through the treatment period up to data cut-off.
Candida infections were the most commonly occurring fungal infections with brodalumab treatment, and
occurred clearly more in the brodalumab group as compared to ustekinumab. Only one case led to
discontinuation of treatment.
Opportunistic infections were reported in two subjects, i.e. coccidioidomycosis and meningitis
cryptococcal, which was of concern. The 2 cases were reviewed in detail. Whereas these 2 cases provide
inconclusive evidence for a causal association between brodalumab and serious fungal infections this also
cannot be excluded either. In the coccidioidomycosis case it cannot be excluded that brodalumab
triggered a flare of a pre-existing lung infection. For the Cryptococcus case brodalumab use remains a
possible explanation. These data do not trigger the need for additional risk management measures. The
current SmPC warnings with respect to cautious use in subjects with (a history of) chronic infections, to
seek medical advice if an infection occur and to stop treatment in case of a serious infection, are
considered sufficient. Also, Kyntheum is contra-indicated in patients with clinically important active
infections e.g. active tuberculosis (see SmPC section 4.3).
Neutropenia
There seems to be a slight dose-response relationship with respect to neutropenia, which was also
observed in laboratory findings in absolute neutrophil count. A decrease in absolute neutrophil count was
observed in approximately 10% of patients up to data cut-off. No serious infections were associated with
neutropenia. Although the percentage of patients with grade 3 or 4 decrease in ANC was low, it is noted
that in many cases it took more than 2 weeks before the neutrophil count returned to baseline after
discontinuing the treatment.
The need for leucocytes monitoring during brodalumab treatment was discussed and considered to be not
necessary. The incidence of grade 3 and 4 neutropenia is low (n=25) and did not lead to serious clinical
outcomes. . Moreover generally, subjects recovered and were able to continue on treatment. However,
the incidence of neutropenia was dose related and occurred in excess of ustekinumab and therefore
neutropenia is an identified risk for brodalumab.
Information on grade 3 /4 neutropenia has been included in the SmPC in section 4.8.
Suicidal ideation and behaviour
Due to reported suicidal ideation and behaviour events during the brodalumab studies (all indications),
suicidal ideation and behaviour (SIB) was identified as an important potential risk in the brodalumab
program early in 2014. Up to data cut-off in March 2015, 26 SIB events were reported in psoriasis
patients exposed to brodalumab, including four completed suicides. The follow-up observation
time-adjusted subject incidence rates (per 100 subjects years) of SIB events were 0.33 for total SIB
events, 0.14 for suicidal behaviour, 0.23 for suicidal ideation and 0.05 for completed suicide. Looking at
the incidence of SIB events up to 52 weeks, the follow-up observation-time adjusted rates are lower in the

Assessment report
EMA/381484/2017 Page 116/135
all-brodalumab group (0.20) than in the ustekinumab (0.4) group. Assessing possible differences in the
event rate between treatment groups in the long-term extension phase is difficult, as at this point patients
had gone through a variety of dosing patterns and the majority had received brodalumab 210 mg Q2W.
It is noted that the highest incidence of SIB occurred in patients with constant 210 mg Q2W dose in pool
B (up to 52 weeks) and patients in ‘overall 210 mg Q2W treatment group’ in pool C. However the data are
too limited to draw conclusions on any dose-response relationship.
All patients but one with SIB discontinued treatment; apparently none re-started treatment with
brodalumab. The applicant has made an effort to identify any explanations for the SIB events. Based on
the current knowledge biological plausibility of causal relationship between brodalumab and SIB cannot
be concluded. However it also cannot be excluded, as too little is known over the effects of IL-17 presence
of IL-17RA receptors in the CNS.
All subjects with SIB events may be considered to have had comorbidities or risk factors contributing to
developing SIB. The current SmPC includes a warning and a recommendation to carefully weigh the risk
and benefit of treatment with brodalumab for patients with a history of depression and/or suicidal ideation
or behaviour, or patients who develop such symptoms while on brodalumab. It was discussed whether
this is sufficient or additional measures are needed to control the risk of SIB in patients with history of
depression and/or SIB.
There was no imbalance between the treatment groups in psychiatric AEs during the studies. However
depression and anxiety were not assessed systematically with a rating scale except in study 20120102,
and most likely not all changes in mood and anxiety were captured by AE reporting. However in study
20120102 patients seemed to improve in depression and anxiety, as measured by the HADS.
Background risk of depression and suicidality in patients with psoriasis has been established in several
studies. The comparison to other psoriasis agents on the market suggests that the incidence of SIB is
higher with brodalumab than with other agents: the pooled estimate of SIB events per 100 subject-years
in patients with psoriasis participating in clinical trials irrespective of treatment was 0.109 (95% CI: 0.023
to 0.320) (0.33 in brodalumab program). However this is an indirect comparison, and in some studies
included in the analysis, patients with psychiatric comorbidities were excluded.
An additional factor on developing SIB could be patient’s disappointment in treatment i.e. patient’s
expectations on the treatment effect were not met. However, based on the individual subject data
presented, a relationship of SIB events and treatment failure is unlikely, as there is no temporal
relationship between the SIB event and PASI score before the event. Disappointment about early
termination of the study and/or worsening of psoriasis following discontinuation after study termination
may have played a role in the occurrence of serious depression in some subjects.
SIB events in other indications
Up to data cut-off, two cases of SIB occurred in the phase 2 psoriatic arthritis (PsA) study (one completed
suicide and one suicidal ideation) and two in the phase 2 rheumatoid arthritis study (one completed
suicide and one suicide attempt). In addition, one case of suicidal ideation occurred in the ongoing Phase
3 PsA study, the study treatment was still under blind at the time of the data cut-off. In addition, in the
ongoing study in asthma, two cases of suicidal ideation, one in the brodalumab 210 mg Q2W arms and
one in the placebo arm) were included in the safety database. Majority of patients with SIB events had
a history of psychiatric illness or psychosocial triggers. Overall, based on the data submitted, a causal
relationship between brodalumab and SIB cannot be established or excluded.
An updated analysis of SIB and depression events including data from all studies (psoriasis, Asthma.
Crohn, Psoriatic arthritis Rheumatoid arthritis) that was ongoing at the time of the MAA data cut-off was
submitted. The updated analysis provides an additional 1325.7 subject-years of exposure and 1270.8
subject-years of follow-up compared with the March 2015 data cut-off used for the updated SIB analyses.

Assessment report
EMA/381484/2017 Page 117/135
SIB
Across all brodalumab studies the follow-up observation time-adjusted subject incidence rate of SIB was
0.37 per 100 subject-years (39 out of 6243 subjects; 10438 subject-years). The incidence rate is similar
to that observed in the initial MAA i.e. 0.35 per 100 subject-years (30 out of 5208 subjects; 8519
subject-years.
There have been 8 new brodalumab-treated subjects in the psoriasis subset with SIB events reported
since this initial MAA. In the psoriasis studies the event rate was 0.37 per 100 subject years (34 out of
4464 subjects; 9161.8 subject years). For Ustekinumab the incidence rate of SIB was 0.40 per 100
subject-years (2 of 613 subjects; 503.6 subject-years).
There was no suggestion of a clustering of these events at the beginning of treatment. There was also no
suggestion of an increased risk of SIB with increasing subject-years of exposure to brodalumab.
A comparison of SIB events across recently approved products for moderate to severe psoriasis was
submitted during the MAA. See table below. Based on the ex- and inclusion criteria it cannot be concluded
that the populations included in the different psoriasis development programmes differ with respect to
neuropsychiatric comorbidity. This with the exception of ixekizumab, where suicide risk was an explicit
exclusion criterion. Moreover, incidences of depression and anxiety with brodalumab treatment do not
appear to be different relative to other recent psoriasis products.
Table 41: - SIB events in recent approvals in moderate to severe psoriasis.
Product
Suicidal ideation
Per 100 Pt-yrs
[95% CI]
Suicide attempt
Per 100 Pt-yrs
[95% CI]
Completed suicide
Per 100 Pt-yrs
z[95% CI]
Suicidal behaviour
(completed or
attempted suicide)
Per 100 Pt-yrs
Meta-analysis of 30 PsO
studies
(Delzell & Chang 2015)
NA 0.040
[0.011, 0.101]
4 cases in PsO
N=10,125Pt-yrs
0.028 [0.012, 0.055]
8 cases in PsO
N=28,420 Pt-yrs
NA
Apremilasta
N=920; 260.8 Pt-yrs
0
(1 case PsA Ph3)
0.4 [0.010, 2.136]
1 case in PsO
(1 case PsA Ph3)
0
0 case PsO
0.4 [0.010, 2.136]
Placebo – aprimilast
studya
N=506; 140.3 Pt-yrs
0
(1 case in PsA)
0
(1 case in PsA)
0.7 [0.018, 3.974]
1 case in PsO
0.7 [0.018, 3.974]
Secukinumabb
N=3430; 2725 Pt-yrs
≥52 weeks
0
0.037
[0.001, 0.204]
1 case during 12
weeks induction
0
(1 case in screening)
0.037 [0.001, 0.204]
Ixekizumabc
N=2275; 6479.8 Pt-yrs
0 0.14 [0.064, 0.264]
9 cases
0 0.14 [0.064, 0.264]
Placebo –
ixekizumab study
0 0.55f [0.014, 3.064]
1 case
0 0.55f [0.014, 3.064]

Assessment report
EMA/381484/2017 Page 118/135
Table 41: - SIB events in recent approvals in moderate to severe psoriasis.
Product
Suicidal ideation
Per 100 Pt-yrs
[95% CI]
Suicide attempt
Per 100 Pt-yrs
[95% CI]
Completed suicide
Per 100 Pt-yrs
z[95% CI]
Suicidal behaviour
(completed or
attempted suicide)
Per 100 Pt-yrs
Ustekinumabd
N=1212; 1812 Pt-yrs
0 0 0.055 [0.001, 0.307]
1 case
0.055 [0.001, 0.307]
Ustekinumab –
brodalumab study
503.6 Pt-yrs (52 weeks)
0.20 [0.005, 1.106]
1 case
0.20 [0.005, 1.106]
1 case
0 0.20 [0.005, 1.106]
Brodalumab
PsO programme
N= 3066; 707.5 Pt-yrs
(double-blind 12 weeks)
0 0.14 [0.004, 0.788]
1 case
0 0.14 [0.004, 0.788]
Brodalumab
PsO programme
N=4464; 9161.8 Pt-yrs
(>52 weeks)
0.24 [0.150, 0.363]
22 cases
(C-SSRS
implemented)
0.11 [0.052, 0.201]
10 cases
(C-SSRS
implemented)
0.044 [0.012, 0.112]
4 cases
0.15 [0.084; 0.256]
All-brodalumab
programme
N=6243; 10438.3 Pt-yrs
(>52 weeks)
0.23 [0.147, 0.342]
24 cases
0.11 [0.053,0.189]
11 cases
0.057 [0.021, 0.125]
6 cases
0.16 [0.095; 0.261]
a Apremilast FDA reviews. There are some difference in the reported events in the Medical Review, Psoriatic arthritis 2013
and Psoriasis 2014. PsO data from 2014 Medical review Table 3 p.120
b Secukinumab Advisory Committee Briefing Book, 2014, Table 5-14 (Pool B, through ≥52w) was used to estimate the
exposure, and section 5.5.6 indicated 1 suicide in the psoriasis program.
c Ixekizumab – FDA Medical review p. 170
d Ustekinumab. FDA Medical review p. 28 and p. 38
e Delzell & Chang 2015 – Meta-analysis performed for the applicant by Exponent®. Data for all agents i.e. 30 studies.
f Patient-year not provided instead back-calculated from the rate and the number of attempts.
There were a total 17 reports of suicidal behaviour in the brodalumab programme i.e. 11 suicide attempt
and 6 completed suicides. Overall the incidence rate of suicidal behaviour was 0.16 per 100
subject-years. This was 0.068 per 100 person years in the meta-analysis. In the brodalumab psoriasis
trials there were 4 completed suicides (incidence rate 0.04/100 subject years) and 1 completed suicide
each in the Psoriatic arthritis and Rheumatoid arthritis programme (incidence rates 0.1 and 0.63 per 100
subject years respectively).
There have been no new completed suicides reported since the 29 March 2015 SIB data cut-off presented
in the MAA.
Depression
Follow-up observation time-adjusted event rate of depression was 2.4 per 100 subject-years in the
all-brodalumab psoriasis subset (221 out of 4464 subjects; 9173.9 subject years). For ustekinumab, the
incidence rate of depression was 4.2 per 100 subject-years (21 of 613 subjects; 504 subject-years).
There was no unique risk factors pattern beyond that of prior history of suicidality and depression that
predict the occurrence of SIB events or depression in subjects treated with brodalumab.

Assessment report
EMA/381484/2017 Page 119/135
A causal association between brodalumab and SIB / depression cannot be assumed. On the one hand the
observed data could be also compatible with the view that the observed events reflect the background
comorbidity of the psoriasis population. On the other hand suicidal ideation and behaviour has been
identified as an important potential risk in the brodalumab program as early in 2014. It is agreed that
current analyses of the data could not confirm this.
As stated, a causal association between brodalumab and SIB cannot be assumed. However, the issue is
more whether these data are sufficient to fully excluded suicide risk due to brodalumab. Whereas positive
data would be conclusive, the absence of positive data does not allow the opposite answer.
A warning has been included in section 4.4 of the SmPC in order to reflect these uncertainties:
Suicidal ideation and behaviour, including completed suicide, have been reported in patients treated with
Kyntheum. The majority of patients with suicidal behaviour had a history of depression and/or suicidal
ideation or behaviour. A causal association between treatment with Kyntheum and increased risk of
suicidal ideation and behaviour has not been established.
The risk and benefit of treatment with Kyntheum should be carefully weighed for patients with a history
of depression and/or suicidal ideation or behaviour, or for patients who develop such symptoms. Patients,
caregivers, and families should be advised of the need to be alert for the emergence or worsening of
depression, suicidal ideation, anxiety, or other mood changes, and they should contact their healthcare
provider if such events occur. If a patient suffers from new or worsening symptoms of depression and/or
suicidal ideation or behaviour is identified, it is recommended to discontinue treatment with Kyntheum.
Other post-approval measurements to further evaluate the risk of suicidal behaviour/ideation under
brodalumab use were discussed. The use of available psoriasis registries was evaluated and it was
concluded that these are not well-fitted to address the evaluation of the safety of brodalumab versus
alternative treatment, especially with respect suicide behaviour. Instead an observational PASS will be
conducted.
The currently proposed PASS study includes a case-time-control and a parallel cohort analysis. The
case-time-control study and parallel cohort study aim to address different questions in relation to suicidal
behaviour. The case-time-control analysis will assess the risk while exposed to brodalumab relative to the
risk while not being exposed to brodalumab in the population treated with brodalumab at some point in
time. The parallel cohort analysis will assess the risk of suicidal behaviour for brodalumab relative to other
treatments, both in the full population and a population restricted by excluding patients with previous
psychiatric disorders including prior suicide attempts.
The PRAC provided advice on the proposal for the PASS design during the evaluation phase and concluded
that it would be unlikely that the study would deliver any interpretable results. This is due to the fact that
the case-time-control study is designed to evaluate transitory exposures with an immediate effect;
however, patients taking brodalumab are likely to continue treatment on a chronic basis. Furthermore,
subjects who completed suicide while receiving the product during clinical trials did not commit suicide
immediately after receiving the product for the first time, but months or years after the first intake.
In addition, concerns were expressed on the validity of the database(s) used and the collection of
information on the event of SIB, its severity, the PASI score, previous psychiatric history or past
treatments.
The PRAC considered that the limitations above were unlikely to be addressed and that, as a
consequence, the proposal for the case-time-control study might not be the most suitable.

Assessment report
EMA/381484/2017 Page 120/135
The CHMP valued the advice from the PRAC but considered that the case-time-control study, although
with some limitations, could still provide some valuable information.
Major cardiac events (MACE)
During the induction phase, MACE occurred in three subjects, all in the brodalumab 140 mg Q2W group.
The low incidence in the initial treatment period does not indicate predisposition to serious cardiovascular
events with brodalumab use. The follow-up observation time-adjusted MACE rate was 0.7 in the
all-brodalumab group up to data cut-off as compared to 0.4 in the ustekinumab group. The observed
event rate for brodalumab seems to be somewhat higher that what is observed for other psoriasis
treatments. However based on indirect comparison no firm conclusion can be made. All the patients with
MACE events had risk factors and confounding comorbidities. Several studies have found an increased
risk of myocardial infarction and stroke in the psoriasis population. For example, a prospective
population-based cohort study in the UK including >130 000 psoriasis patients and >550 000 controls
reported an MI incidence (per 1000 patient years) of 3.58 (95% CI 3.52-3.65) for control patients, 4.04
(95% CI 3.88-4.21) for patients with mild psoriasis (defined as not requiring systemic therapy), and 5.13
(95% CI 4.22-6.17) for patients with severe psoriasis (defined as requiring systemic therapy) (Gelfand et
al).
Whether brodalumab increases the risk of CV events in psoriasis patients with cardiovascular comorbidity
is unclear based on the current data. However, the low incidence of MACE during the induction period is
reassuring. MACE is included in the RMP as an important potential risk, which is considered appropriate
and sufficient at the present time. Furthermore MACE is included in the PASS study which will provide
additional data to be analysed within the parallel cohort analysis.
Hypersensitivity and injection site reactions
Hypersensitivity rates were higher in the 210 mg Q2W group 6.0% compared to ustekinumab with 2.2%.
The highest rates of hypersensitivity were seen in the group that switched from ustekinumab to 210 mg
Q2W (15.7%). However, with regard to hypersensitivity and injection site reactions, there was no signal
that would warrant special warnings in the SmPC or additional pharmacovigilance activities at the present
time.
Malignancies
Through data cut-off, exposure-adjusted rate (per 100 subject years) of AEs in the Neoplasms Benign,
Malignant and Unspecified (Incl Cysts and Polyps) SOC in the all-brodalumab group was 3.5. There was
no signal that the risk of malignancies is increased with brodalumab treatment. However, due to the
mechanism of action of brodalumab and as long-term data is missing, malignancies is included in the
safety specification as an important potential risk and the PASS will provide further data to be analysed
within the parallel cohort analysis.
Immunogenicity
The risk of immunogenicity with brodalumab is considered low: binding ADAs were detected in 2.7% of
patients in the psoriasis studies. No neutralizing antibodies were detected in the psoriasis clinical
program, two cases were observed in a study in another indication, but returned to seronegative ADA on
later time-point. No dose-response effect in ADA development was observed.
The risk of ADA formation was low 2.3%, seldom was persistent 0.45% and if so could not be related to
a loss of efficacy or to increase in hypersensitivity reactions. This information is reflected in the SmPC.
Safety in patient subgroups
No differential safety profile was observed in elderly as compared to younger patients or patients
weighing over 100 kg as compared to lighter patients.

Assessment report
EMA/381484/2017 Page 121/135
2.6.2. Conclusions on the clinical safety
The overall safety profile of brodalumab is in line with other biological medicinal products targeting the
IL-pathway for the treatment of psoriasis, with the most common adverse events and serious events
falling under the infections and infestations SOC.
No causality between brodalumab and SIB could be established based on the current data. However, SIB
events remain a potential risk. This potential risk is considered balanced with implemented information
for the prescriber and the patient in the product information and will be followed up upon by means of a
post authorisation safety study.
2.7. Risk Management Plan
Table 42: Summary of the Safety Concerns
Summary of safety concerns
Important identified risks Infections
Worsening of Crohn’s disease in subjects with active Crohn’s disease
Neutropenia
Important potential risks Suicidal ideation and behavior
MACE
Malignancy
Hypersensitivity
Missing information Risks during pregnancy and lactation
Use in pediatric patients
Use in geriatric patients
Use in patients with renal impairment
Use in patients with hepatic impairment
Use in patients of different racial and/or ethnic origin
Use in patients after recent vaccination

Assessment report
EMA/381484/2017 Page 122/135
Pharmacovigilance plan
Table 43: On-going and planned additional PV studies/activities in the Pharmacovigilance Plan
Study/activity Type, title and category (3)
Objectives Safety concerns addressed
Planned timing Date for submission reports
Phase 4
Observational study
The study will investigate
the risk of suicidal behaviour, serious infections, MACE and malignancy.
Suicidal behaviour and
serious infections will be analysed in a case-time-control analysis,
as well as in a parallel cohort analysis.
MACE and malignancy will
be analysed in a parallel cohort analysis.
For the parallel cohort
analysis two classes of comparators will be used. These will be inhibitors of IL-12/IL-23, IL-17 and Inhibitors of TNF-alpha.
Risk of suicidal behaviour,
serious infections, MACE and malignancy
Protocol submission for
review and endorsement by the PRAC
Data accumulation
follows launch plan with first
launch expected in Q3 2017
Within 3 months
from the European Commission decision
Interim report
On suicidal behaviour and serious
infections. Expected Q4 2023.
Final report
On suicidal
behaviour, serious
infections, MACE and malignancy.
Expected Q3 2030
Meta-analysis
The Columbia
Suicide Severity Rating Scale (C-SSRS)
questionnaire will be included in future randomised controlled clinical trials to collect
information on SIB.
A meta-analysis
of future randomised
controlled clinical trials data, for which information regarding SIB has been collected with the C-SSRS questionnaires.
Risk of suicidal behaviour
The
meta-analysis
will be made when sufficient data is available to provide a meaningful
overall estimate based on the evidence from individual trials, i.e. when at least two sufficiently
comparable clinical trials have been finalised.
Depending on
timing of future trials

Assessment report
EMA/381484/2017 Page 123/135
Risk minimisation measures
Safety concern Routine risk minimization measures
Additional risk minimization measures
Important identified risks
Infections Relevant text is provided in the following sections of the SmPC:
•Section 4.4, Special warnings and precautions for use
•Section 4.8, Undesirable effects
•Section 5.2, Pharmacokinetic properties
Relevant text is provided in the following sections of the PIL:
•Section 2, What you need to know before you use brodalumab
•Section 4, Possible side effects
None
Worsening of Crohn’s Disease in
subjects with active Crohn’s Disease
Relevant text is provided in the following section of the SmPC:
•Section 4.3, Contraindications
•Section 4.4, Special warnings and precautions for use
Relevant text is provided in the following sections of the PIL:
•Section 2, What you need to know before you use brodalumab
None
Neutropenia Relevant text is provided in the following sections of the SmPC:
•Section 4.4 Special warnings and precautions for use
•Section 4.8, Undesirable effects
Relevant text is provided in the following sections of the PIL:
•Section 4, Possible side effects
None
Important potential risks
Suicidal ideation and behaviour Relevant text is provided in the following sections of the SmPC:
•Section 4.4, Special warnings and precautions for use
•Section 5.2, Pharmacokinetic properties
Relevant text is provided in the following sections of the PIL:
•Section 2, What you need to
know before you use brodalumab
None
MACE No specific measures are
required for patients receiving brodalumab; standard of care is adequate.
None
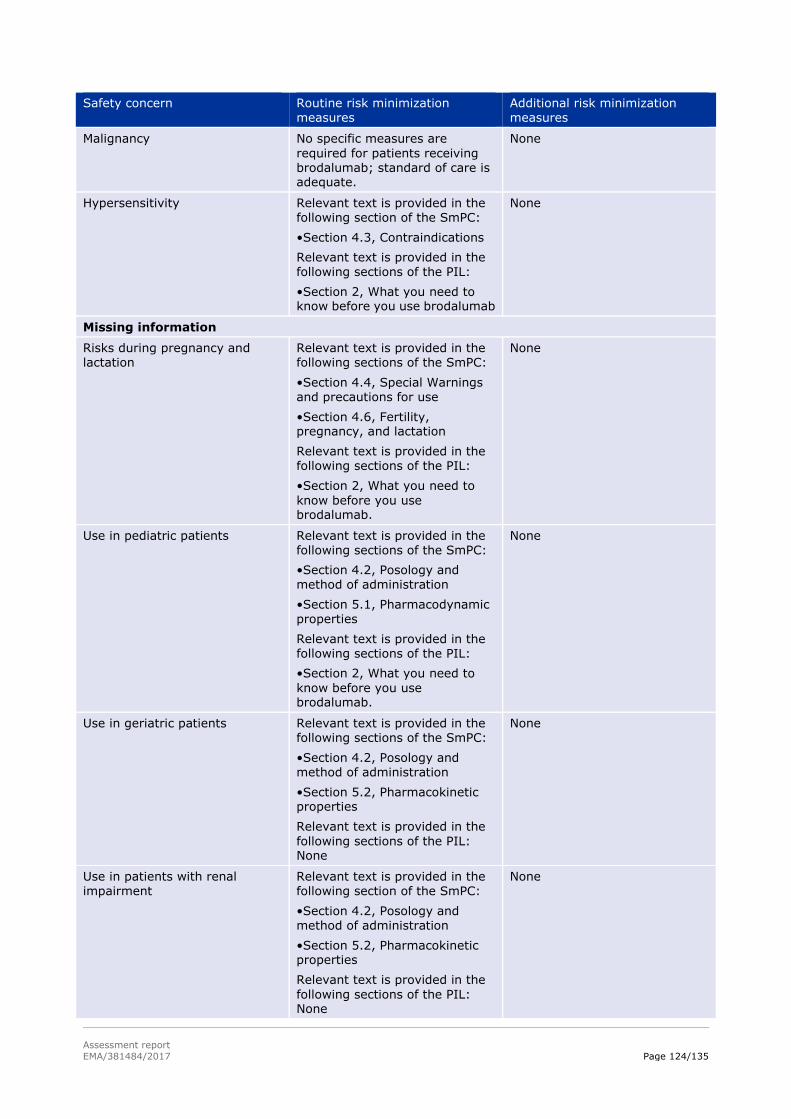
Assessment report
EMA/381484/2017 Page 124/135
Safety concern Routine risk minimization measures
Additional risk minimization measures
Malignancy No specific measures are
required for patients receiving brodalumab; standard of care is adequate.
None
Hypersensitivity Relevant text is provided in the following section of the SmPC:
•Section 4.3, Contraindications
Relevant text is provided in the following sections of the PIL:
•Section 2, What you need to know before you use brodalumab
None
Missing information
Risks during pregnancy and lactation
Relevant text is provided in the following sections of the SmPC:
•Section 4.4, Special Warnings and precautions for use
•Section 4.6, Fertility, pregnancy, and lactation
Relevant text is provided in the following sections of the PIL:
•Section 2, What you need to
know before you use brodalumab.
None
Use in pediatric patients Relevant text is provided in the following sections of the SmPC:
•Section 4.2, Posology and method of administration
•Section 5.1, Pharmacodynamic properties
Relevant text is provided in the following sections of the PIL:
•Section 2, What you need to
know before you use brodalumab.
None
Use in geriatric patients Relevant text is provided in the following sections of the SmPC:
•Section 4.2, Posology and method of administration
•Section 5.2, Pharmacokinetic properties
Relevant text is provided in the
following sections of the PIL: None
None
Use in patients with renal
impairment
Relevant text is provided in the
following section of the SmPC:
•Section 4.2, Posology and method of administration
•Section 5.2, Pharmacokinetic properties
Relevant text is provided in the
following sections of the PIL: None
None

Assessment report
EMA/381484/2017 Page 125/135
Safety concern Routine risk minimization measures
Additional risk minimization measures
Use in patients with hepatic impairment
Relevant text is provided in the following section of the SmPC:
•Section 4.2, Posology and method of administration
•Section 5.2, Pharmacokinetic properties
Relevant text is provided in the following sections of the PIL: None
None
Use in patients of different racial and/or ethnic origin
None None
Use in patients after recent vaccination
Relevant text is provided in the following section of the SmPC:
•Section 4.4, Special warnings
and precautions for use
•Section 4.5, Interaction with
other medicinal products and other forms of interaction
Relevant text is provided in the following sections of the PIL:
•Section 2, What you need to know before you use brodalumab
None
Conclusion
The CHMP and PRAC considered that the risk management plan version 1 is acceptable.
2.8. Pharmacovigilance
Pharmacovigilance system
The CHMP considered that the pharmacovigilance system summary submitted by the applicant fulfils the
requirements of Article 8(3) of Directive 2001/83/EC.
2.9. New Active Substance
The applicant declared that brodalumab has not been previously authorised in a medicinal product in the
European Union.
The CHMP, based on the available data, considers brodalumab to be a new active substance as it is not a
constituent of a medicinal product previously authorised within the Union.
2.10. Product information
2.10.1. User consultation
The results of the user consultation with target patient groups on the package leaflet submitted by the
applicant show that the package leaflet meets the criteria for readability as set out in the Guideline on the

Assessment report
EMA/381484/2017 Page 126/135
readability of the label and package leaflet of medicinal products for human use.
2.10.2. Additional monitoring
Pursuant to Article 23(1) of Regulation No (EU) 726/2004, Kyntheum (brodalumab) is included in the
additional monitoring list as it contains a new active substance which, on 1 January 2011, was not
contained in any medicinal product authorised in the EU.
Therefore the summary of product characteristics and the package leaflet includes a statement that this
medicinal product is subject to additional monitoring and that this will allow quick identification of new
safety information. The statement is preceded by an inverted equilateral black triangle.
3. Benefit-Risk Balance
3.1. Therapeutic Context
3.1.1. Disease or condition
Kyntheum is indicated for the treatment of moderate to severe plaque psoriasis in adult patients who are
candidates for systemic therapy.
3.1.2. Available therapies and unmet medical need
Current therapeutic options for moderate to severe plaque psoriasis include phototherapy, topical agents
(e.g., corticosteroids), conventional systemic therapy (e.g., cyclosporine, methotrexate, and oral
retinoids), and biologic therapy including TNF-α antagonists (adalimumab, etanercept, infliximab) and
anti-IL12/IL23 (ustekinumab and most recently, secukinumab).
The conventional therapies are associated with dose- and treatment-limiting options. The most common
reasons for discontinuation of these therapies are lack of efficacy, adverse events (AEs), and treatment
inconvenience. The biologic agents have been associated with higher response rates in clinical trials.
Since its approval in 2009, ustekinumab has been shown to be the most effective biologic agent available.
Although newer treatment options provide improved outcomes compared with traditional systemic
therapies, there remains a significant unmet patient need for novel agents and mechanisms that can
provide a rapid onset of effect, improved and sustained skin clearance, and minimization of drug-specific
safety concerns (e.g. serious infections including opportunistic infections and tuberculosis, malignancies
including lymphoma, immunogenicity and demyelinating neurologic events).
3.1.3. Main clinical studies
The efficacy and safety of Kyntheum was assessed in 4373 adult plaque psoriasis patients across three
multinational, randomised, double-blind, phase 3, placebo-controlled clinical trials (studies 20120102,
20120103, 20120104). 20120103 and 20120104 were also active comparator (ustekinumab)-controlled.
All three trials included a 12-week placebo-controlled induction phase, a double-blind duration of 52
weeks, and an open-label long-term extension.

Assessment report
EMA/381484/2017 Page 127/135
3.2. Favourable effects
Dose response was demonstrated in study 20090062, although with respect to percent PASI
improvement there seemed to be a plateau at 140 mg Q2W and 210 mg Q2W. Percent PASI improvement
(SD) was 16.0% (27.0) in the placebo group, 45.0% (41.7) in the brodalumab 70 mg Q2W group, 85.9%
(22.5) in the brodalumab 140 Q2W group, 86.3% (27.6) in the brodalumab 210 mg Q2W group and
76.0% (32.7) in the brodalumab 280 mg Q4W group. P values against placebo were all <0.0001.
In pooled analysis across pivotal studies both brodalumab doses demonstrated superior efficacy to
placebo with respect to PASI 75 and sPGA responders. The response rates for PASI 75 were 5.9% (95%
CI 4.4 – 7.7) in the placebo arm as compared to 66.7% (95% CI 64.3 – 69.2), 85.3% (95% CI 83.4 –
87.1) and 69.70% (95% CI 65.8 – 73.3) in the brodalumab 140 mg Q2W, 210 mg Q2W and ustekinumab
arm, respectively. The response rates for sPGA success were 3.3% (95% CI 2.2 – 4.8), 58.2% (95% CI
55.7 – 60.8), 78.6% (95% CI 76.4 – 80.7) and 69.1% (95% CI 55.0 – 63.0) for the placebo, brodalumab
140 mg Q2W, 210 mg Q2W arm and ustekinumab arm, respectively. All p values were <0.001.
Further, brodalumab 210 mg Q2W demonstrated superior efficacy to ustekinumab with respect to PASI
100. In the pooled analysis across studies 20120103 and 20120104, the response rates for PASI 100
were 20.1% (95% CI 17.0 – 23.5), 26.4% (95% CI 24.0 – 28.9) and 40.5% (95% CI 38.7 – 43.3) in the
ustekinumab, brodalumab 140 mg Q2W and 210 mg Q2W arm, respectively. All p values (210 mg Q2W
vs. ustekinumab) were <0.001. Time to effect was shorter with brodalumab as compared to
ustekinumab. In the pooled analysis of studies 20120103 and 20120104, median time to PASI 75
response in days was 12.1, 8.4 and 6.4 for ustekinumab, brodalumab 140 mg Q2W and brodalumab 210
mg Q2W, respectively.
The results of the key secondary endpoints, including PSI, were in line with the primary efficacy analysis.
Maintenance of effect was shown. A higher proportion of patients re-randomised into the 210 mg Q2W
group were responders at week 52 as compared to the other brodalumab arms or ustekinumab. All
comparisons for the maintenance endpoint were statistically significant (p< 0.001).
The maintenance of effect was shown in study 20120102. During the randomised withdrawal phase of
study 20120102, among subjects originally randomised to 210 mg Q2W in the induction phase, no
subject re-randomised to placebo and withdrawn from brodalumab treatment maintained sPGA success
at week 52, while 83.1% of subjects re-randomised to continued treatment with 210 mg Q2W maintained
sPGA success at week 52. Among subjects who were originally randomised to 140 mg Q2W in the
induction phase and re-randomised to placebo, 5.1% maintained sPGA success at week 52. In contrast,
70.2% of subjects who were re-randomised to continued treatment with 140 mg Q2W in the withdrawal
phase maintained sPGA success at week 52.
Re-treatment with brodalumab after return of disease was effective. Patients who were re-treated after
inadequate response during the withdrawal phase started responding to treatment within 2 weeks. The
Kaplan Meier estimates of median time to sPGA success in subjects re-randomised to placebo and
re-treated with brodalumab were 6.14 days (95% CI 5.71 – 6.43) in the 140 mg Q2W group and 4.29
days (95% CI 2.29 – 4.14) in the 210 mg Q2W group.
The applicant has opted for the 210 mg Q2W dose over 140 mg Q2W dose. This is supported by efficacy
data as response to the 210 mg Q2W dosing regimen was larger as compared to the 140 mg Q2W dosing
regimen across all endpoints. The pharmacodynamics studies also support the dose selection, as
dose-response relationship was observed in receptor occupancy and established skin biomarkers.
The subgroup analyses demonstrate that there is little effect modification on PASI 75 responders by
baseline demographics, baseline disease characteristics, including severity, and previous therapy.

Assessment report
EMA/381484/2017 Page 128/135
3.3. Uncertainties and limitations about favourable effects
Uncertainties with respect to efficacy were related to dosing strategy in long-term and dosing in heavier
subjects.
Brodalumab 210 mg Q2W is considered the most optimal dose regime. However, for the 210 mg dose
intervals longer than 2 weeks were not evaluated.
The design of the randomised withdrawal and re-treatment phase of study 20120102 allowed examining
duration of remission and effectiveness of re-treatment. Little attention has been given to these aspects,
which are relevant for establishing the best dosing strategy for long-term treatment with brodalumab. In
study 20120102, after re-randomization to placebo at week 12, the responder rate declined slowly. The
Kaplan Meier estimates of time to first loss of sPGA response show that eight weeks after switching to
placebo, in approximately 50% of patients efficacy was still maintained (as measured by sPGA response).
These data suggest that a less frequent dose or treatment by demand rather than continuous
administration every two weeks may be an option. The data show that re-treatment after inadequate
response was effective and patients started responding within a few days. Additional data were presented
regarding the duration of remission and the effectiveness of re-treatment after recurrence in this study.
The median time to inadequate response in subjects switched to placebo after receiving 210 mg Q2W was
8.1 weeks (range 3.9 - 36.0 weeks). The median time to achieve a sPGA <2 following retreatment was 4
weeks. This suggests that an ON- demand treatment regime is not a realistic option. In addition, further
PK/PD modelling showed that longer dose intervals than Q2W resulted in a substantial decrease of Css,
ave and Cmin. Hence longer dose intervals also appear not a valuable option.
As it remains uncertain for how long treatment should continue a stopping algorithm was included in the
SmPC advising the treating physician to reconsider continuing treatment in case of an insufficient
response after 12-16 weeks of treatment.
The subgroup analyses demonstrate effect modification on PASI 75 responders by weight. The effect
modification by weight is even more pronounced in sPGA 0/1 responders, PASI 100 responders and sPGA
0 responders, also in the 210 mg Q2W group. While efficacy in heavier patients is sufficiently
demonstrated with the current dose regimen, these patients may benefit more from a higher dose. First
there appears to be a relevant linear relationship between weight and response. Second there was a linear
relationship between doses weight and exposure. Combining these two observations, a weight based
dose regime was discussed. As the prevalence of obesity is increased in psoriasis patients as compared
to the general population, and as there is correlation between obesity and severity of psoriasis, optimal
dosing in heavier subjects is considered relevant. The applicant will perform a post-authorization clinical
study aiming to investigate whether higher efficacy can be achieved with a higher dose and to establish
the safety of a higher dose in the high-weight population.
3.4. Unfavourable effects
The overall safety profile of brodalumab is in line with other biologicals targeting the IL-pathway for the
treatment of psoriasis, with the most common adverse events and serious events falling under the
infections and infestations SOC. The incidence of adverse events and the most common adverse events
were similar between brodalumab and the active comparator ustekinumab.
No such differences between the 140 mg Q2W and 210 mg Q2W doses were observed that would clearly
point towards favouring one dose regime above the other, neither in incidence of adverse events nor in
type of adverse events.
The overall incidence of infections and infestations was comparable between brodalumab and
ustekinumab. All grade 4 serious infections (appendicitis, sepsis, cholecystitis, furuncle, septic shock)

Assessment report
EMA/381484/2017 Page 129/135
occurred in patients treated with brodalumab. Nevertheless, all but one patient of these continued to
receive brodalumab and recovered without further events. The incidence of infections remained stable in
the brodalumab treated patients through the treatment period up to data cut-off.
Candida infections were the most commonly occurring fungal infections with brodalumab treatment, and
occurred clearly more in the brodalumab group as compared to ustekinumab. Only one case led to
discontinuation of treatment. The incidence of fungal infections, including candida, remained stable in the
brodalumab treated patients through the treatment period up to data cut-off. Opportunistic infections
were reported in two subjects, i.e. coccidioidomycosis and meningitis cryptococcal. The risk of infections
is adequately addressed in various chapters of the SmPC.
There seems to be a slight dose-response relationship with respect to neutropenia, which was also
observed in laboratory findings in absolute neutrophil count. Decrease in absolute neutrophil count was
observed in approximately 10% of patients up to data cut-off. The risk of neutropenia is addressed within
the SmPC.
34 major cardiac events occurred up to the data cut-off, two in the ustekinumab group and 32 in the
all-brodalumab group. The majority of events were myocardial infarctions (53%). The observed event
rate for brodalumab seems to be somewhat higher that what is observed for other psoriasis treatments,
however based on indirect comparison no firm conclusion can be made. All the patients with MACE events
had risk factors and confounding comorbidities. Whether brodalumab increases the risk of CV events in
these patients with cardiovascular comorbidity is unclear based on the current data. However, the low
incidence of MACE during the induction period (3 events) is reassuring. MACE is included in the RMP as an
important potential risk.
Through data cut-off, exposure-adjusted rate (per 100 subject years) of AEs in the Neoplasms Benign,
Malignant and Unspecified (Incl Cysts and Polyps) SOC in the all-brodalumab group was 3.5. There was
no signal that the risk of malignancies is increased with brodalumab treatment.
The risk of ADA formation is low i.e. 2.3%, seldom was persistent 0.45% and if so could not be related to
a loss of efficacy or to increase in hypersensitivity reactions.
3.5. Uncertainties and limitations about unfavourable effects
Uncertainties in the safety profile of brodalumab concern the risk of infections, neutropenia and the
difficulties in interpreting the suicidality data. In addition, worsening of Crohn´s disease is reported for
brodalumab and the product is contraindicated in active Crohn’s disease, but it is unclear whether similar
effects on Colitis Ulcerosa can be expected and there are no data available.
Opportunistic fungal infections were reported in two subjects, which is unfavourable, in particular since
the reported infections, coccidioidomycosis and meningitis cryptococcal, are serious. The underlying risk
factors for developing these infections apart from brodalumab use are not fully elucidated. Further data
on cases of serious infections will be granted post authorisation in an observational study as described in
the RMP.
Up to data cut-off in March 2015, 26 suicidal ideation and behaviour events were reported in psoriasis
patients exposed to brodalumab, including four completed suicides. The follow-up observation
time-adjusted subject incidence rates (per 100 subjects years) of SIB events were 0.33 for total SIB
events, 0.14 for suicidal behaviour, 0.23 for suicidal ideation and 0.05 for completed suicide. Looking at
the incidence of SIB events up to 52 weeks, the follow-up observation-time adjusted rates are lower in the
all-brodalumab group (0.20) than in the ustekinumab (0.40) group. An updated analysis of SIB events
including data from all studies, the follow-up observation time-adjusted subject incidence rate of SIB was
0.37 per 100 subject-years (39 out of 6243 subjects; 10438 subject-years). In total 17 cases of suicidal

Assessment report
EMA/381484/2017 Page 130/135
behaviour i.e. 11 suicide attempts and 6 completed suicides were reported. There have been no new
completed suicides reported since the 29 March 2015 SIB data cut-off presented in the initial MAA. Overall
the incidence rate of suicidal behaviour was 0.16 per 100 subject-years. There was no clustering of these
events at the beginning of treatment or an increased risk of SIB with increasing subject-years of exposure
to brodalumab.
It is noted that the highest incidence of SIB occurred in patients with constant 210 mg Q2W dose in pool
B (up to 52 weeks) and patients in ‘overall 210 mg Q2W treatment group’ in pool C. However, the data are
too limited to draw conclusions on any dose-response relationship.
All patients but one with SIB discontinued treatment; apparently, none re-started treatment with
brodalumab. There are no follow-up data with respect to recovery of SIB/depression.
All subjects with SIB events may be considered to have had co-morbidity or risk factors contributing to
developing SIB. There was no unique risk factors pattern beyond that of prior history of suicidality and
depression that predicted the occurrence of SIB events/ or depression. As a temporal relationship
between the SIB event and PASI score was absent it is considered unlikely that not meeting treatment
expectations contributed to the SIB events.
Based on the current knowledge biological plausibility of causal relationship between brodalumab and SIB
cannot be concluded. However, it also cannot be excluded, as too little is known over the effects of IL-17
in CNS. The IL-17 receptor is expressed in CNS-resident cells which suggests direct physiological role of
IL-17 in the CNS, although this role is largely unknown due to the lack specific studies. Moreover, receptor
blockade inhibits signalling of multiple IL-17 family members in contrast to monoclonal anti-IL-17A
antibodies.
The SmPC includes warning statements and advises to carefully weigh the risk and benefit of treatment
with brodalumab for patients with a history of depression and/or suicidal ideation or behaviour, or
patients who develop such symptoms while on brodalumab.
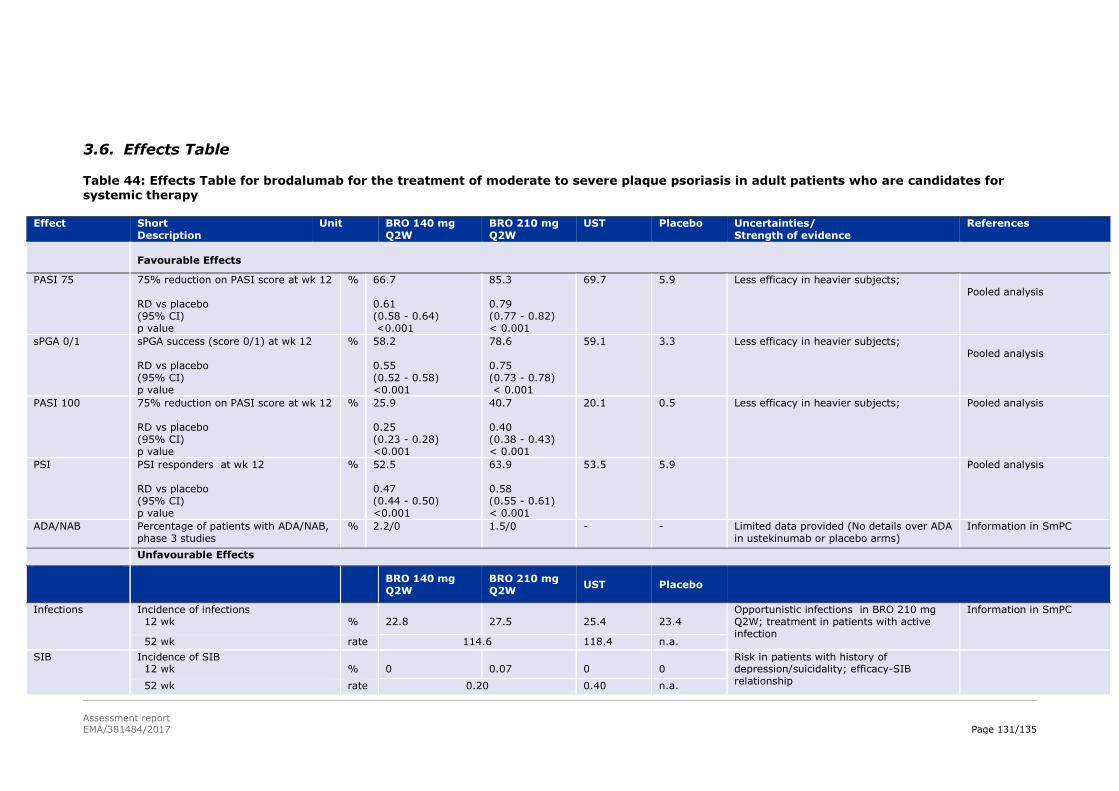
Assessment report
EMA/381484/2017 Page 131/135
3.6. Effects Table
Table 44: Effects Table for brodalumab for the treatment of moderate to severe plaque psoriasis in adult patients who are candidates for systemic therapy
Effect Short Description
Unit BRO 140 mg Q2W
BRO 210 mg Q2W
UST Placebo Uncertainties/ Strength of evidence
References
Favourable Effects
PASI 75 75% reduction on PASI score at wk 12 RD vs placebo (95% CI) p value
% 66.7 0.61 (0.58 - 0.64) <0.001
85.3 0.79 (0.77 - 0.82) < 0.001
69.7 5.9 Less efficacy in heavier subjects; Pooled analysis
sPGA 0/1 sPGA success (score 0/1) at wk 12 RD vs placebo (95% CI) p value
% 58.2 0.55 (0.52 - 0.58) <0.001
78.6 0.75 (0.73 - 0.78) < 0.001
59.1 3.3 Less efficacy in heavier subjects; Pooled analysis
PASI 100 75% reduction on PASI score at wk 12 RD vs placebo (95% CI) p value
% 25.9 0.25 (0.23 - 0.28) <0.001
40.7 0.40 (0.38 - 0.43) < 0.001
20.1 0.5 Less efficacy in heavier subjects; Pooled analysis
PSI PSI responders at wk 12 RD vs placebo (95% CI) p value
% 52.5 0.47 (0.44 - 0.50) <0.001
63.9 0.58 (0.55 - 0.61) < 0.001
53.5 5.9 Pooled analysis
ADA/NAB Percentage of patients with ADA/NAB, phase 3 studies
% 2.2/0 1.5/0 - - Limited data provided (No details over ADA in ustekinumab or placebo arms)
Information in SmPC
Unfavourable Effects
BRO 140 mg Q2W
BRO 210 mg Q2W
UST Placebo
Infections Incidence of infections 12 wk
%
22.8
27.5
25.4
23.4
Opportunistic infections in BRO 210 mg Q2W; treatment in patients with active infection
Information in SmPC
52 wk rate 114.6 118.4 n.a.
SIB Incidence of SIB 12 wk
%
0
0.07
0
0
Risk in patients with history of depression/suicidality; efficacy-SIB relationship
52 wk rate 0.20 0.40 n.a.
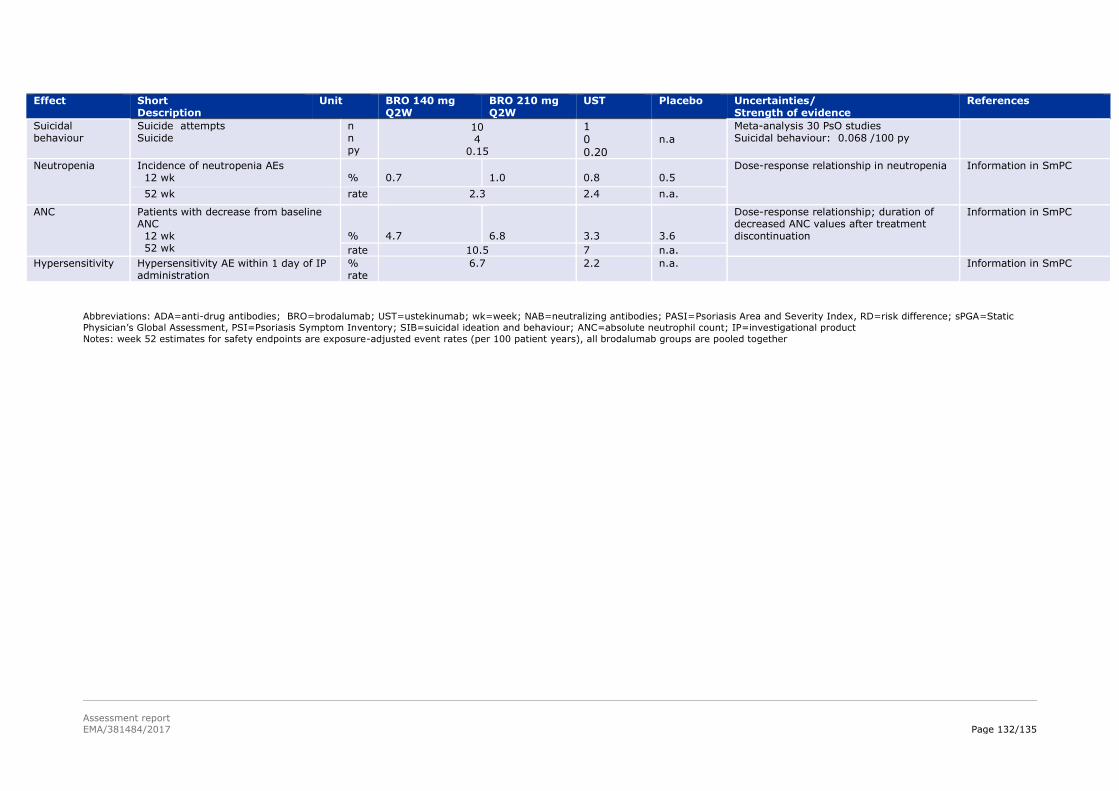
Assessment report
EMA/381484/2017 Page 132/135
Effect Short Description
Unit BRO 140 mg Q2W
BRO 210 mg Q2W
UST Placebo Uncertainties/ Strength of evidence
References
Suicidal behaviour
Suicide attempts Suicide
n n py
10 4
0.15
1 0 0.20
n.a
Meta-analysis 30 PsO studies Suicidal behaviour: 0.068 /100 py
Neutropenia Incidence of neutropenia AEs 12 wk
%
0.7
1.0
0.8
0.5
Dose-response relationship in neutropenia Information in SmPC
52 wk rate 2.3 2.4 n.a.
ANC Patients with decrease from baseline ANC 12 wk 52 wk
%
4.7
6.8
3.3
3.6
Dose-response relationship; duration of decreased ANC values after treatment discontinuation
Information in SmPC
rate 10.5 7 n.a.
Hypersensitivity Hypersensitivity AE within 1 day of IP administration
% rate
6.7 2.2 n.a. Information in SmPC
Abbreviations: ADA=anti-drug antibodies; BRO=brodalumab; UST=ustekinumab; wk=week; NAB=neutralizing antibodies; PASI=Psoriasis Area and Severity Index, RD=risk difference; sPGA=Static
Physician’s Global Assessment, PSI=Psoriasis Symptom Inventory; SIB=suicidal ideation and behaviour; ANC=absolute neutrophil count; IP=investigational product
Notes: week 52 estimates for safety endpoints are exposure-adjusted event rates (per 100 patient years), all brodalumab groups are pooled together

Assessment report
EMA/381484/2017 Page 133/135
3.7. Benefit-risk assessment and discussion
3.7.1. Importance of favourable and unfavourable effects
Brodalumab selectively targets the human IL-17RA receptor which represents a novel mechanism to
inhibit the inflammation and clinical symptoms associated with psoriasis.
Efficacy of brodalumab in the treatment of moderate to severe plaque psoriasis was demonstrated in a
clinical program with adequately designed studies with respect to treatment duration, patient population
and clinical endpoints. The effect size was large, in terms of PASI 75 and sPGA responders. The effect size
of complete clearance – the desired treatment outcome - as measured by PASI 100 and sPGA-0
responders was also large. Superiority of the 210 mg Q2W brodalumab dosing regimen over ustekinumab
in complete clearance was demonstrated and time to effect was shorter for brodalumab as compared to
ustekinumab. Secondary endpoints, including patient reported outcomes, were consistent with the
primary endpoints.
Maintenance of effect was demonstrated. The vast majority of patients with continuous brodalumab
treatment were sPGA responders at week 52.
There were no notable differences in efficacy between systemic treatment naïve patients and patients
previously treated with systemic treatment, including other biologicals and/or failure to respond to these.
The magnitude of effect was larger for the 210 mg Q2W dose as compared to the 140 mg Q2W dose
across endpoints. This is supported by pharmacodynamics data which established dose-response
relationship in receptor occupancy and skin biomarkers. No such differences in incidence of adverse
events or type of adverse events were observed that would prevent selecting the 210 mg Q2W dose
regimen above 140 mg Q2W. Moreover, the magnitude of effect of brodalumab 210 mg Q2W was larger
than of ustekinumab consistently in both studies in which ustekinumab was included as an active control.
Even though the risk of opportunistic infections is appropriately managed by routine risk minimisation
measures they are important in the benefit risk evaluation, in particular since reported infections, i.e.
coccidioidomycosis and meningitis cryptococcal, were serious.
The potential risk of suicidal ideation and especially suicidal behaviour (combination of suicidal attempts
and suicides) was made potential risk in the risk management plan as, based on the data it can neither be
concluded nor excluded that SIB is drug-related.
Restricting the indication to a patient population that benefits the most clearly would reduce exposure to
brodalumab and the potential risk of SIB if it is drug related. However, this will have the implicit
assumption that the potential risk of SIB can already be categorised as an identified risk. Following this
line of reasoning to the end one may argue that if the potential risk of suicides is perceived as serious
enough to restrict the indication it could be questioned to licence the drug at all, considering that there are
sufficient alternative treatment options. A counter argument against this is that in the controlled studies
brodalumab was clearly superior to ustekinumab.
In their response the Applicant argued that a restriction of the indication to a subpopulation is not
appropriate as a subpopulation that benefits the most could not be defined.
In light of the available data and knowledge, a potential causal association of suicidality with brodalumab
cannot be excluded or confirmed. If a causal relationship would be true, a restriction to a population that
may artificially increase the incidence of suicidal ideation and suicidal behaviour would not be adequate
because this restricted population most likely has a higher risk of depression and anxiety as compared to

Assessment report
EMA/381484/2017 Page 134/135
the unrestricted population. If a causal relationship is not true a broad indication would incorrectly be
denied.
As such, the CHMP is currently of the opinion that the uncertainty with respect to the risk of suicidal
behaviour under use of brodalumab does not warrant a restriction of the indication to a population with an
insufficient response to other biologicals. This provided that any potential risk will be correctly addressed
with information available in the SmPC and that this risk will be further evaluated in a PASS study.
Suicidal behaviour and serious infection will be further evaluated by means of a case-time-control study
post authorisation as described in the RMP. This study will also sample data on MACE and Malignancies.
In addition, careful proactive follow-up via routine pharmacovigilance activities will be performed by
means of a thorough assessment on SIB in each PSUR, including an analysis on reporting rate by country
on SIB cases with a comparison to the background incidence expected in this population. Follow-up
questionnaires will be used to retrieve additional information on spontaneous reports of suicidal ideation
and behaviour to have most complete case reports available to allow proper assessment.
No established biomarkers exist that are predictive for suicidal ideation or suicide. The Applicant proposed
to include the C-SSRS in all future randomised controlled clinical trials with brodalumab. The inclusion of
potential biomarkers, clinical risk assessments that may discriminate between low and high suicidal
ideation / suicide might be considered and would be welcomed (AB Niculescu 2015, F Levey 2016). In
addition, it has been proposed by the PRAC that a DHPC should be distributed at the launch of the product
to properly communicate the potential risks of suicidal ideation and behaviour to prescribers. This was not
adopted by the CHMP since a DHPC at the time of launching might create over-reporting of SIB for
brodalumab. This could create an imbalance on the reported post-marketing events for brodalumab that
might not reflect a true difference between various products and the risk of the SIB. Any information
considered relevant to properly inform the prescribers has been reflected throughout the SmPC.
CHMP considered that warning statements in SmPC and package leaflet concerning the potential
increased risk of suicidality with brodalumab and a recommendation to discontinue therapy in
non-responders allied to the PASS are sufficient for the time being to balance the potential risk of SIB.
3.7.2. Balance of benefits and risks
Efficacy of brodalumab in the treatment of moderate to severe psoriasis was demonstrated, both in
systemic treatment naïve patients and patients previously treated with systemic agents, including
biologicals. The effect size was large, also with respect to complete clearance. Secondary endpoints
including patient reported outcomes were in line with the primary analysis. Maintenance of effect was also
demonstrated. The demonstrated high efficacy is considered to outweigh the typical identified
unfavourable effects i.e. serious infection and potential malignancies. In particular the uncertainties with
respect to suicidal behaviour (suicide attempt/suicide) will be further evaluated in a case-time control
study and the parallel cohort study.
3.7.3. Additional considerations on the benefit-risk balance
Not applicable.
3.8. Conclusions
The overall B/R of Kyntheum is positive.

Assessment report
EMA/381484/2017 Page 135/135
4. Recommendations
Outcome
Based on the CHMP review of data on quality, safety and efficacy, the CHMP considers by consensus that
the risk-benefit balance of Kyntheum is favourable in the following indication:
Treatment of moderate to severe plaque psoriasis in adult patients who are candidates for systemic
therapy.
The CHMP therefore recommends the granting of the marketing authorisation subject to the following
conditions:
Conditions or restrictions regarding supply and use
Medicinal product subject to restricted medical prescription (see Annex I: Summary of Product
Characteristics, section 4.2).
Other conditions and requirements of the marketing authorisation
Periodic Safety Update Reports
The requirements for submission of periodic safety update reports for this medicinal product are set out
in the list of Union reference dates (EURD list) provided for under Article 107c(7) of Directive 2001/83/EC
and any subsequent updates published on the European medicines web-portal.
The marketing authorisation holder shall submit the first periodic safety update report for this product
within 6 months following authorisation.
Conditions or restrictions with regard to the safe and effective use of the medicinal product
Risk Management Plan (RMP)
The MAH shall perform the required pharmacovigilance activities and interventions detailed in the agreed
RMP presented in Module 1.8.2 of the marketing authorisation and any agreed subsequent updates of the
RMP.
An updated RMP should be submitted:
At the request of the European Medicines Agency;
Whenever the risk management system is modified, especially as the result of new information
being received that may lead to a significant change to the benefit/risk profile or as the result of
an important (pharmacovigilance or risk minimisation) milestone being reached.
New Active Substance Status
Based on the CHMP review of the available data, the CHMP considers that brodalumab is considered to be
a new active substance as it is not a constituent of a medicinal product previously authorised within the
European Union.