Ethiopia. Map of Ethiopia Ethiopia’s Flag Ngussie lives in Ethiopia Winnie the World’s Newsletter.
1
Tadesse Dessalegn1,, Tesfaye Solomon1, Tesfaye Gebrekiristos2, Abiy Solomon3, Shure Seboka4, Yazie Chane5, Fetien Abay6, Rizana Mahroof7, Kamala A. Roberts8, and Bhadriraju Subramanyam8,* 1Kulumsa Agricultural Research Center, Ethiopian Institute of Agricultural Research, Kulumsa, Ethiopia 2Mekelle Agricultural Research Center, Ethiopian Institute of Agricultural Research, Mekelle, Ethiopia 3Melkassa Agricultural Research Center, Ethiopian Institute of Agricultural Research, Melkassa, Ethiopia 4Sinana Agricultural research Center, Ethiopian Institute of Agricultural Research, Ethiopia 5Adet Agricultural Research Center, Ethiopian Institute of Agricultural Research, Bahir Dar, Ethiopia 6Department of Crop and Horticultural Sciences, Mekelle University, Main Campus, Mekelle, Ethiopia. 7Department of Biological Sciences, South Carolina State University, Orangeburg, South Carolina, USA 8Department of Grain Science and Industry, Kansas State University, Manhattan, Kansas, USA
______________________ Current address: Innovation for Agricultural Productivity–Arsi, Green Innovation Center, Ethiopia (assisted by the German government via The German Society for International Cooperation (GIZ) GmbH, Addis Ababa / Ethiopia) *Corresponding author: Bh. Subramanyam ([email protected]).
Assessment of Wheat Post-Harvest Losses in Ethiopia
2
Executive summary Wheat is a major cereal and a staple crop in Africa, with increasing demand in Sub-Saharan Africa
because of income growth, urbanization, and capacity for dietary diversity. Ethiopia is Sub-Saharan Africa’s largest grower of wheat, with an estimated area 1.7 million ha cultivated in 2013, producing 4.04 million tons of wheat. Despite this productivity, Ethiopia imports more than 1 million tonnes of wheat for domestic consumption, an equivalent amount of wheat to that lost post-harvest.
Wheat post-harvest loss can occur at any point from harvest to market, but the diverse agro-ecosystems of the wheat growing regions makes a “one-size-fits-all” approach difficult. This study takes a broad picture of wheat post-harvest losses, looking at the makeup of farming households, assessing the extent of losses, and explores measures to increase food security. Minimizing post-harvest losses is vital to increasing Ethiopia’s food security.
The study focused on four major wheat zones and regions: Oromia, Amhara, Southern Nations Nationalities & Peoples (SNNP), and Tigray. It looked at socioeconomic makeup of wheat growing households, crop production, preferred methods for receiving information, farmer training, grain storage, grain marketing and pricing, causes and control measures for post-harvest losses in wheat, economics of post-harvest losses, household consumption, and gender roles. Primary data was gathered from the study areas using a questionnaire, the results of which were used to select 200 wheat farming households for in depth analysis. The findings were analyzed using Descriptive Statistics for socioeconomic characteristics and SPSS for post-harvest losses.
Some of the main findings of the extensive questionnaire are as follows:
The average age of household heads was 43 years, household size was 6.7, average distance to market was 7 km and average size of wheat farm 1.42 ha. Overall characteristics of the wheat growing households were: most of their income was allocated to food, followed by savings, holidays, and clothing respectively; the foods consumed were mostly injera, bread, roasted gran (Kolo) and porridge, with children and pregnant women adding fruit and animal protein to the basic diet; the majority of households were led by males (92 %); over 60 % of farmers were educated to primary education and above.
Collectively the farmers produced 3.65.3 tons of bread wheat in 2013/14, followed by 115 tons maize, 22.7 tons potatoes, 16.8 tons pepper, and 15.4 tons teff. The main criteria for choosing a particular variety of wheat were cost of seed and yield per hectare, followed closely by growing period, resistance to insect attack, drought tolerance, and resistance to water logging.
Most wheat farmers (70%) used agro-chemicals such as pesticides, herbicides, and growth regulators. Safe use of such chemicals is a major health and environmental concern and needs immediate attention. Improvements in education, training, and availability of safety equipment is needed minimize these hazards.
The best modes of information dissemination were found to be through large meetings, fellow farmers, radio programs, one-on-one delivery, and demonstration trials. Farmer’s trainings were mostly on seed production but farmer’s interest was high to be trained on harvesting, moisture measurement and drying, insect identification and control, rodents’ control, use of pesticides, safe use and handling of pesticides, proper storage and marketing.
The main source of wheat harvest loss at farm level was due to harvesting and threshing methods, which varied among regions, but resulted in significant damage to grains. Farmers in Oromia (80%) used combine harvesters, while most other farmers used traditional harvesting methods. Sun drying and fumigation with were the main methods farmers used to control storage loss
Recycled fertilizer bags were used most for storage followed by traditional storage (gotera) and is an area of intervention for improved storage. Few farmers used ware houses.
3
Farmers expressed their interest of monitoring moisture control at storage using moisture meter and dryer if the price of moisture meter was not a limiting factor. Farmers can improve their income if farmers adjust their marketing period when the grain price is stable and high which depend also on availability of proper and safe storage. The most important causes of post-harvest loss in storage were due to insects and rodents, and moisture content of the grain.
Farmers preference to select a given control method depended mainly on traditional practices, ease of use, locally availability of the material, control effectiveness and affordability of the price of the method. The monetary estimate of post-harvest loss is significant and holistic approaches should be taken to avoid harvest and post-harvest losses to overcome food insecurity.
Weather conditions and harvesting method, and post-harvest handling of the grain were found to have the greatest influence over post-harvest losses. The grain produced must be utilized efficiently since it has received the required investment and helps for food security of wheat growers and consumers.
The most important causes of PHL in storage were due to insects and rodents, and moisture
content of the grain. A good harvest and good storage conditions equate to a better income for the farmers than rain at harvest and poor storage of grains, especially for storage of 3-12 months. The monetary estimate of PHL is significant and holistic approaches should be taken to avoid harvest and PHL losses to overcome food insecurity.

4
Table of contents
Executive summary ........................................................................................................................................ 2
I. Introduction...................................................................................................................................... 6
II. Methodology..................................................................................................................................... 8
2.1 Study locations ....................................................................................................................................... 8
2.2 Sampling procedures .............................................................................................................................. 8
2.3 Method of data analysis .......................................................................................................................... 8
III. Result and discussion ....................................................................................................................... 9
3.1 Socioeconomic factors ........................................................................................................................... 9
3.2 Gender roles, responsibilities, and education ........................................................................................ 12
3.3 Information flow and farmers organizations ......................................................................................... 14
3.4 Training of harvest and post-harvest practices ...................................................................................... 15
3.5 Crop production, storage, and usage..................................................................................................... 16
3.6 Post-harvest losses in wheat ................................................................................................................. 20
3.6.1 Causes and Severity of wheat post-harvest loss ................................................................................. 20
3.6.2 Control methods in storage .............................................................................................................. 22
3.6.3 Estimation of wheat post- harvest loss ............................................................................................. 23
3.7 Impact of post-harvest loss .................................................................................................................. 26
IV. Conclusion and Recommendations ................................................................................................. 26
V. References ...................................................................................................................................... 28

5
List of Figures
Figure 1: Area and production of wheat in Ethiopia (2008-2013) (Source: FAOSTAT, retrieved Feb, 2015) .......... 6
Figure 2: Annual household budget allocations (ETB) ($1 USD = 22 ETB) ......................................................... 10
Figure 3: Education level achieved by respondents (%) ........................................................................................ 13
Figure 4: Types of chemical applied before harvest (percentage)........................................................................... 17
Figure 5: Crop production of surveyed farmers 2013/2014 (tons) ........................................................................ 18
Figure 6: Methods for storing grain (percentage) .................................................................................................. 19
Figure 7: Two gotera, traditional storage units ...................................................................................................... 21
List of Tables
Table 1: Area, production and productivity of wheat in selected countries in Sub-Saharan Africa Source:
FAOSTAT, retrieved Feb, 2015) ............................................................................................................................ 7
Table 2: Socioeconomic characteristics of sampled wheat farmers .......................................................................... 9
Table 3: Socioeconomic characteristics of sampled wheat farmers ........................................................................ 12
Table 4: Preferred methods for receiving information (N = 200) .......................................................................... 14
Table 5: Topics covered by training, as noted by farmers ...................................................................................... 15
Table 6: Criteria used to select varieties of wheat .................................................................................................. 16
Table 7: Main wheat varieties by region ................................................................................................................ 16
Table 8: Different causes of wheat post-harvest losses by region .......................................................................... 20
Table 9: Perceived severity of grain loss ............................................................................................................... 22
Table 10: Methods used to control storage losses ................................................................................................. 22
Table 11: Factors affecting selection of control methods ...................................................................................... 23
Table 12: Estimated wheat post-harvest losses (PHL) at different stages .............................................................. 23
Table 13: Post-harvest loss estimates (kg ha-1) in different zones in surveyed regions ........................................... 25
Table 14: Post-harvest loss estimates for wheat in Ethiopian Birr (ETB) at harvest in the absence (NR) and
presence (WR) of rain for the four regions in 2014 ($1 USD = 22 ETB) .............................................................. 26

6
I. Introduction Wheat is one of the major cereals and a staple crop in Africa. Demand for wheat is increasing in
Sub-Saharan Africa because of income growth, urbanization and dietary diversification (Jayne et al. 2010a, Negassa et al. 2013). However, Sub-Saharan countries, and Africa as a whole, produce only about 30% and 40% of their domestic requirements respectively (Negassa et al. 2013), causing heavy dependence on imports and making the region highly vulnerable to global market and supply shocks.
In Ethiopia, the estimated area of wheat cultivation was 1.7 million ha in 2013, producing 4.04 million tons (Figure 1) (FAOSTAT 2015), the largest area coverage and total production in sub-Saharan Africa (Table 1) (FAOSTAT 2015). Wheat is produced by more than 4.7 million small scale farmers in Ethiopia; wheat is the 3rd in total production after teff and maize, and fourth in area coverage surpassed by teff, maize and sorghum (CSA 2013). Wheat production is steady increasing despite serious constraints such as recurrent epidemics of diseases, namely rusts and septoria (Singh et al. 2008, Teferi and Gebreslassie 2015).
Figure 1: Area and production of wheat in Ethiopia (2008-2013) (Source: FAOSTAT, retrieved Feb, 2015)
0
0.5
1
1.5
2
2.5
3
3.5
4
4.5
2008 2009 2010 211 2012 2013
Area harvested (Million ha)
Production (Million tonnes)

7
Table 1: Area, production and productivity of wheat in selected countries in Sub-Saharan Africa Source: FAOSTAT, retrieved Feb, 2015)
2011
2012
2013 Countries Area1 Production2 Area Production Area Production Rank
Angola 3650 4000 3400 4000 3420 3958 Burundi 11500 9787 9434 4196 8828 6423 Ethiopia 1437485 2916334 1627647 3434706 1706324 4039113 1
Kenya 131509 268482 148703 441754 160000 485846 3
Malawi 1216 1850 1295 1956 1269 1784 Mali 9844 33842 10349 40071 6900 27430 Nigeria 99000 165000 90000 100000 80000 80000 South Africa 604700 2005000 511000 1915000 500000 1760000 2
Uganda 13000 23000 14000 20000 14200 20000 Republic of Tanzania 108287 112658 109816 108887 107189 103973 Zambia 37631 237332 37209 253522 41810 273584 Zimbabwe 12000 23000 11000 20000 10000 25000
1Area in million ha; 2production in tonnes
Ethiopia’s wheat farmers are the greatest producer of wheat in Sub-Saharan Africa (Table 1), yet Ethiopia is not self-sufficient in its wheat production and imports an average >1 million tons per annum for the years 2006-2015 (Index Mundi 2016). Once a net exporter of wheat, Ethiopia is now a net importer of wheat due to many factors including war and crop failures (Hailu 1991), and population growth out pacing increases in production (Reuben et al. 2005). Increasing yield is frequently cited as an important issue for increasing food security (Bekele et al. 2009, Adugna et al. 1991, Hailu 1991, Jayne et al. 2010b, van Keulen and Hengsdijk 2005). The potential of increasing production and productivity is high through possibilities of both horizontal and vertical expansion.
Other interventions for increasing food security include: expanding wheat production profitability; developing wheat varieties optimized for different agro-ecosystems; exploiting irrigated agriculture; and improvement of post-harvest practices (Negassa et al 2012, Missing Food 2011). Understanding where improvements can be made, and how best to make them, will optimize efforts in these areas, but there are gaps in available data (Affognon et al. 2015), which need to be filled if a program to improve food security is to be as successful as a recent program in Uganda (Costa 2015). Increasing domestic production to meet demand is all that is required to make Ethiopia self-sufficient in wheat production is not enough.
Apart from self-sufficiency that could come from different strategies and efforts, different reports estimate that the post-harvest loses can be very high depending on the season, agro-ecosystems, and management practices (Missing Food 2011). Wheat is grown across a diverse range of agro-ecosystems and it is necessary to reduce post-harvest loss considering such variability. The causes can occur during harvesting, threshing, cleaning, transportation to storage, at storage, packaging, transportation to market and during marketing.
Improvements in post-harvest management practices will help to maintain the quality of the grain for end-uses and avoid quantity losses. Hence, it is necessary to develop effective strategies for post-harvest chain functioning (field to market) that avoid deterioration of wheat grain in quantity and quality, satisfy the market demands, and finally improve the income of wheat growers. It also helps to offsets the demand for foreign currency required to import wheat. The objective of the current study was to discover the overall circumstances of wheat growers, assess the extent of post-harvest loss of wheat grains at different stages across post-harvest chain, factors affecting post-harvest losses farm to market levels and design appropriate measures to reduce post-harvest losses.

8
II. Methodology 2.1 Study locations
The study was conducted in four regions of Ethiopia namely Oromia, Amhara, and Tigray regions and the Southern Nations Nationalities & Peoples Region (SNNPR). The regions unique agro-ecosystems, with variations in altitude, soil type, rainfall, and temperature. Ethiopian wheat is predominantly grown in the mid- to highlands, at elevations of 1900-2700 m; soil types across Ethiopia include clay rich Vertisols, less clay rich Nitisols, black soils, red soils and brown soils; and annual temperatures of the wheat growing regions range from 6 – 23 ˚C (Asnakew et al. 1991, Hailu 1991, White et al. 2001). Ethiopian wheat growers utilize the long rainy season (meher) as most wheat is rainfed, the main growing season which starts in June and starts decreasing in rainfall events in October, with the wheat harvest starting in December (Hailu 1991, White et al. 2001).
2.2 Sampling procedures
A multi-stage purposive and simple random sampling method was used. A household questionnaire was used to collect primary data from wheat farmers in the study areas in November, 2014. The first and second stages involved a purposive selection of zones and districts that are representative of wheat based farming systems. Fourteen villages were considered for the study. Properly trained and carefully selected enumerators pre-tested the questionnaire and later collected data on input use, outputs, post-harvest losses and socioeconomic and farm characteristics.
At final stage, a probability proportional to sample size technique employed for selecting 200 wheat farm households across the four regions. The interviews were conducted using structured and semi-structured interview schedules. If a respondent did not answer a question, the lack of a response was omitted from the analysis and not as a “0” or similar.
Wheat samples were collected from interviewed farmers and analyzed for moisture content and mycotoxins. This results are not included in this report.
2.3 Method of data analysis
Descriptive Statistics was used to analyze the socio economic characteristics and SPSS software (SPSS 2009) was used to analysis post-harvest losses. A multiple regression model was used to identify the determinants of post-harvest losses. The estimation of the post-harvest loss at each operation also was carried out with the help of the post-harvest loss online calculator developed by African Post Harvest Losses Information System (APHLIS) (Hodges et al. 2011, Hodges et al. 2014).

9
III. Result and discussion 3.1 Socioeconomic factors
Age of household head, family size and wheat farm size showed variation across the regions studied. The average age of the surveyed wheat farmers was 43 years and ranged from 20 to 87 years (Table 2). The average farm household had a total of 6 members.
Farmers had an average of 1.42 ha of wheat farm size in 2014-15, with high variability between farms (F = 23, P value = 0.01). The minimum and the maximum land owned for wheat by the sampled households were 0.13 ha (in Amhara) and 8 ha (in Oromia). Farmers in Oromia allotted more land to wheat on average (2.17 ha) compared to farmers in SNNP (1.1 ha), Amhara (1 ha), and Tigray (0.56 ha). The respondents were from highland (21 %), midland (75 %), and lowlands (6 %).
The average distance from home to the nearest market center was 7 km, with a minimum of 0 km across all regions and the maximum distance 45 km in Amhara. Generally, the wheat farmers in SNNP region travel shorter distance to market than the other regions.
Table 2: Socioeconomic characteristics of sampled wheat farmers
Region Variables Mean N Minimum Maximum
Tigray Age of the household head 44.2 30 28 68
Family size 6.8 30 2 10
Proximity to the nearest market (Km) 7.7 23 0 30 Wheat farm size (ha) 0.56 30 0.25 2.9
Amhara Age of the household head 47.2 66 24 78
Family size 6 66 2 13 Proximity to the nearest market (Km) 7.1 63 0 45
Wheat farm size (ha) 1 66 0.13 3
Oromia Age of the household head 40.7 80 20 87
Family size 7.2 79 1 21
Proximity to the nearest market (Km) 7.0 73 0 20
Wheat farm size (ha) 2.17 79 0.25 8
SNNP Age of the household head 34.7 15 25 58
Family size 7.6 15 5 11
Proximity to the nearest market (Km) 5.7 13 0 15
Wheat farm size (ha) 1.1 15 0.5 2
Total Age of the household head 43 191 20 87
Family size 6.7 190 1 21
Proximity to the nearest market (Km) 7.0 172 0 45
Wheat farm size (ha) 1.42 190 0.13 8
10
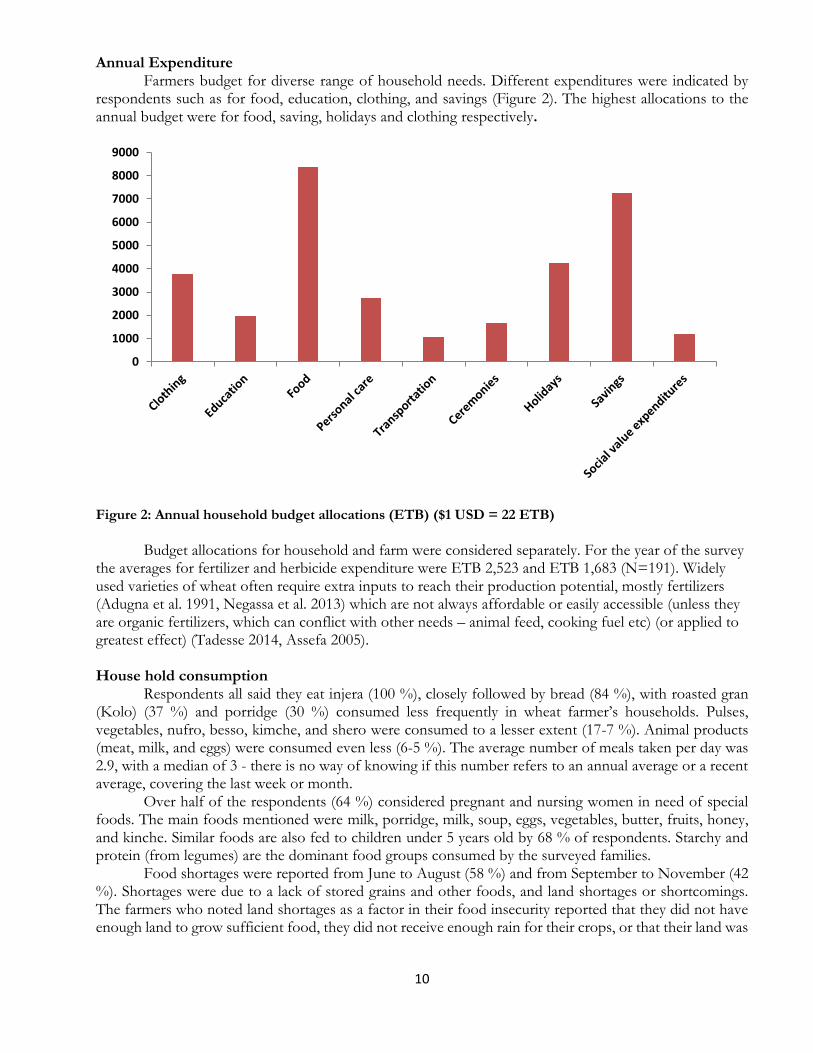
Annual Expenditure Farmers budget for diverse range of household needs. Different expenditures were indicated by
respondents such as for food, education, clothing, and savings (Figure 2). The highest allocations to the annual budget were for food, saving, holidays and clothing respectively.
Figure 2: Annual household budget allocations (ETB) ($1 USD = 22 ETB)
Budget allocations for household and farm were considered separately. For the year of the survey
the averages for fertilizer and herbicide expenditure were ETB 2,523 and ETB 1,683 (N=191). Widely used varieties of wheat often require extra inputs to reach their production potential, mostly fertilizers (Adugna et al. 1991, Negassa et al. 2013) which are not always affordable or easily accessible (unless they are organic fertilizers, which can conflict with other needs – animal feed, cooking fuel etc) (or applied to greatest effect) (Tadesse 2014, Assefa 2005).
House hold consumption
Respondents all said they eat injera (100 %), closely followed by bread (84 %), with roasted gran (Kolo) (37 %) and porridge (30 %) consumed less frequently in wheat farmer’s households. Pulses, vegetables, nufro, besso, kimche, and shero were consumed to a lesser extent (17-7 %). Animal products (meat, milk, and eggs) were consumed even less (6-5 %). The average number of meals taken per day was 2.9, with a median of 3 - there is no way of knowing if this number refers to an annual average or a recent average, covering the last week or month.
Over half of the respondents (64 %) considered pregnant and nursing women in need of special foods. The main foods mentioned were milk, porridge, milk, soup, eggs, vegetables, butter, fruits, honey, and kinche. Similar foods are also fed to children under 5 years old by 68 % of respondents. Starchy and protein (from legumes) are the dominant food groups consumed by the surveyed families.
Food shortages were reported from June to August (58 %) and from September to November (42 %). Shortages were due to a lack of stored grains and other foods, and land shortages or shortcomings. The farmers who noted land shortages as a factor in their food insecurity reported that they did not have enough land to grow sufficient food, they did not receive enough rain for their crops, or that their land was
0
1000
2000
3000
4000
5000
6000
7000
8000
9000
11
not arable or lying fallow. Land shortage is not unique to Ethiopia, and does impact on food security across sub-Saharan Africa (Jayne et al. 2010a, Christiaensen et al 2011).
A small percentage of farmers (13 %) received food aid, with wheat flour and oil the main donations to recipients (88 % and 63 % respectively). This may account for the drop in reported food shortages during September to November. This time period also coincides with the first half of the main harvesting period, which extends from September to February (FDRE CSA 2015), when food security is considered to be highest (Maxwell et al. 2014), and the drop food insecurity may have more to do with early harvests than food aid. Food security was considered to be highest during the second half of the main harvesting period, December to February, when only 3 % of respondents claimed to experience food shortages.
Access to drinking water was considered a problem by 45 % of respondents due to distance from the source, absences of tap and ground water, and poor water infrastructure. Recent analysis of rainfall patterns indicate that annual rainfall amounts have not changed over the last few decades, but the timing and quantity per rainfall event have changed, resulting in fewer but heavier events (Coe and Stern 2011, Kassie et al. 2013). The change in rainfall events create issues of sustainability and water quality.

12
3.2 Gender roles, responsibilities, and education
Among the total sample household heads in all regions, 92% were male and 8% were female (Table 3). The female-headed households were highest in number in Tigray (4 out of 26) and Oromia (10 out of 70) (Table 3). Previous reports have found female headed households to be more resource poor than male headed households (Abebe and Bekele 2003, Pender and Gebremedhin 2006, Gebremedhin and Hoekstra 2007) and are more likely to sell their wheat shortly after harvest because of their need for cash and limited cash-generating options (Abebe and Bekele, 2003).
Table 3: Socioeconomic characteristics of sampled wheat farmers
Variable Category Regions Total
Tigray Amhara Oromia SNNP
Sex of household head Male N 26 66 70 14 176 % 87 100 88 93 92
Female N 4 0 10 1 15 % 13 0 12 7 7.9
Education No N 5 12 10 0 27
% 17 18 13 0 14
Yes N 25 54 70 15 164
% 83 82 88 100 86
Primary source of income Crop production N 29 66 80 15 190
% 97 100 100 100 99
Secondary source of income Livestock production N 18 62 65 10 155
% 60 94 81 67 81
Petty business N 6 1 5 2 14
% 20 2 6 13 7
Training or other information on harvest and post-harvest loss prevention
No N 19 35 46 7 107
% 63 55 60 47 58
Yes N 11 29 31 8 79
% 37 45 40 53 42
Males, females, and children were involved in different operations covering everything from
harvesting through marketing to planning and financial management decisions. Family members provided most of the farm labor. Roles of male household members (most probably the house head) were higher at all operations such as selling grain, market negotiation, and managing income, followed by female household members, who shared many responsibilities but were solely responsible for planning family meals. The involvement of both genders in post-harvest activities balanced out and both played active roles in most operations. Any changes in farming and post-harvest technologies need to take into account the effects on both genders to maintain this balance (Beuchelt and Badstue 2013, Danielsen et al. 2014, Swiss Agency for Development and Cooperation SDC 2015)
Crop production was the main source of income in the surveyed areas, with most of farmers (82 %) using livestock as their secondary source of income and some (10 %) had petty businesses (Table 3). Farmers who own livestock not only have an extra source of income during lean times, but they also have a greater capacity for crop production (Pender and Gebremedhin 2006). Those capitalizing on their capacity for increased production are more likely to need good storage on farm or through sell crops shortly after harvest.
Most of the respondents (86 %) had a basic level of education and could read and write. Less than half of respondents had completed primary school (45 %) and few were educated to diploma level

13
(4 %) (Fig. 3). None of the respondents were educated beyond diploma level at time of survey (Fig. 3). On average households spent ETB 2091 per year on education for adults and children, or ETB 423 per child (N =179).
Figure 3: Education level achieved by respondents (%)
0%
5%
10%
15%
20%
25%
30%
35%
40%
45%
50%
No education Informal Primary school Secondaryschool
Diploma Degree

14
3.3 Information flow and farmers organizations
Almost all wheat farmers were engaged or involved in one or more forms of farmers’ organizations, i.e. general cooperatives, unions, development associations, research or crop producing groups, saving association, woman and youth associations. The different organizations have different purposes and services for the community and are helpful social formations.
Farmers believed that the most trusted crop production and stored grain management information was received from development agents. Other organizations such as offices of agriculture at different levels, research centers, projects such as EAAPP, neighboring farmers, farmers training centers, seed enterprises, and farmers unions were perceived as reliable sources of information about crop production. Ethiopia’s long history of government run extension programs (Adugna et al. 1991), places government researchers and extension officers, and farmers in good stead for further capacity building in post-harvest loss preventions, an area in need of improvement across sub-Saharan Africa (World Bank 2011).
Table 4: Preferred methods for receiving information (N = 200)
# %
Cell phones 68 34
Demonstration trials 124 62
Fellow farmers 136 68
Input suppliers 89 44.5
Internet 52 26
Large meetings 176 88
One-on-one delivery 126 63
Printed materials 81 40.5
Radio programs 127 63.5
Religious leaders 73 36.5
Television programs 79 39.5
The five most preferred and used methods of receiving new information by farmers were large
meetings, fellow farmers, radio programs, one-on-one delivery, and demonstration trials (Table 4). Grain traders also rely on radio programs for supply and demand information, national policy changes and external market grain prices (Gabre-Madhin and Amha 2005). Some educated farmers had used internet sources to gain information, a trend more recent surveys have not collected information on (see: Gebremedhin and Hoekstra 2007, Bekele et al. 2009, World Bank 2011). Tedesse and Bahiigwa (2015) observed that farmer age and education level were correlated with cell phone ownership and use, indicating that as younger, more educated farmers take over family farms, extension organizations might consider distributing some information via cell phones.

15
3.4 Training of harvest and post-harvest practices
Training was given to wheat farmers during the growing season mainly on the topics related to harvesting and threshing. Topics covered included harvesting techniques (method), maturity timing for required moisture or drying before harvest, keeping grain free from soil and straw during threshing (purity) and cleaning (when and safe storage), packing material, proper and careful transport, storage, and marketing. Training on avoiding varietal mixtures during crop production and management in the field were also provided early in the season. Generally, the trainings can be summarized from general to specific types of topics across regions (Table 5).
Table 5: Topics covered by training, as noted by farmers
Topics # of mentions
All agricultural operations 15
Farm operations 7
Grain storage techniques 11
Harvesting 5
Importance of dryness of various processes 10
Marketing 3
Mentioned providers of trainings 2
Protection of crop in field 2
Timing of harvest 5
Respondents were unsatisfied with trainings given on weather conditions during harvest, moisture measurement, piling and safe storage, safety awareness, value adding to the grain, using pesticides at storage, safe use of pesticides, market strategy and orientation.
Farmers’ training topics of interest
Farmers expressed their eagerness to receive training in the future most on harvesting, moisture measurement and drying, insect identification and control, rodent control, use of pesticides, safe use and handling of pesticides, proper storage and marketing.
More than half of the respondents (58 %) did not receive training or other information on harvest and postharvest loss prevention. This indicates that the awareness of the factors attributing to post-harvest loss was low among respondents, limiting their ability to take measures to reduce losses. Increasing farmer training through large meetings or farmer field schools can increase participants food security (Larsen and Lilleør, 2014), especially if the farmers topics of interest are covered.
16
3.5 Crop production, storage, and usage
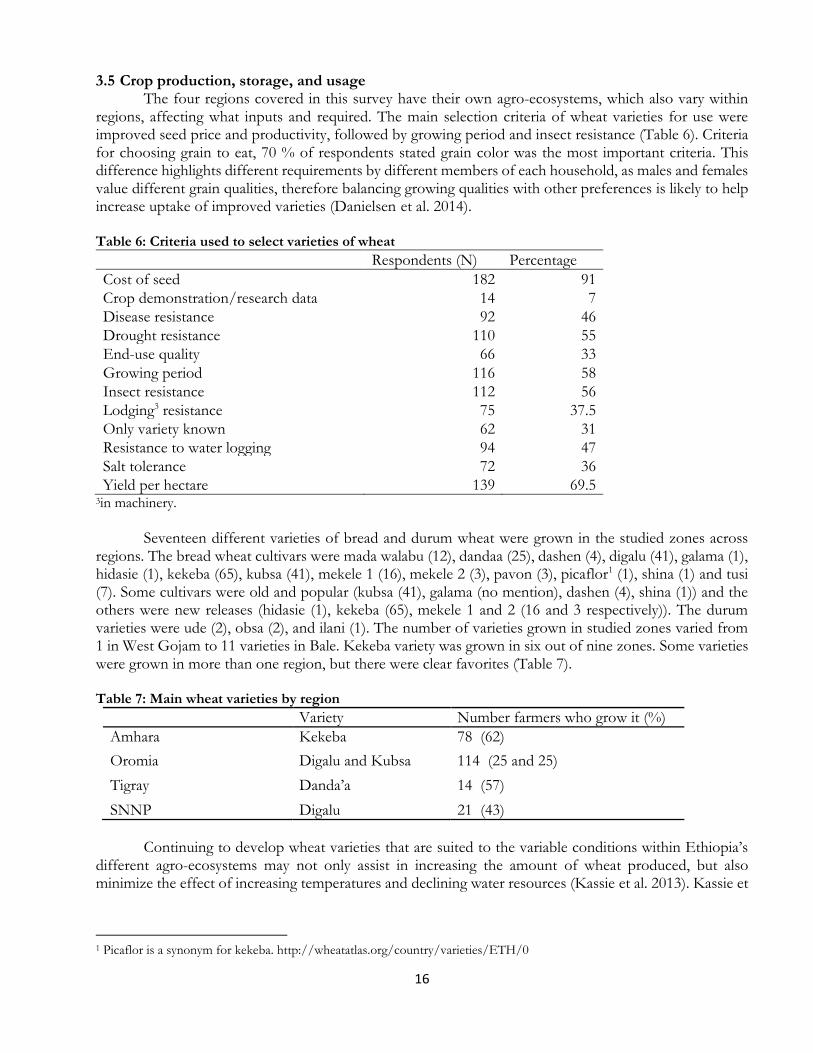
The four regions covered in this survey have their own agro-ecosystems, which also vary within regions, affecting what inputs and required. The main selection criteria of wheat varieties for use were improved seed price and productivity, followed by growing period and insect resistance (Table 6). Criteria for choosing grain to eat, 70 % of respondents stated grain color was the most important criteria. This difference highlights different requirements by different members of each household, as males and females value different grain qualities, therefore balancing growing qualities with other preferences is likely to help increase uptake of improved varieties (Danielsen et al. 2014).
Table 6: Criteria used to select varieties of wheat
Respondents (N) Percentage
Cost of seed 182 91
Crop demonstration/research data 14 7
Disease resistance 92 46
Drought resistance 110 55
End-use quality 66 33
Growing period 116 58
Insect resistance 112 56
Lodging3 resistance 75 37.5
Only variety known 62 31
Resistance to water logging 94 47
Salt tolerance 72 36
Yield per hectare 139 69.5 3in machinery.
Seventeen different varieties of bread and durum wheat were grown in the studied zones across
regions. The bread wheat cultivars were mada walabu (12), dandaa (25), dashen (4), digalu (41), galama (1), hidasie (1), kekeba (65), kubsa (41), mekele 1 (16), mekele 2 (3), pavon (3), picaflor1 (1), shina (1) and tusi (7). Some cultivars were old and popular (kubsa (41), galama (no mention), dashen (4), shina (1)) and the others were new releases (hidasie (1), kekeba (65), mekele 1 and 2 (16 and 3 respectively)). The durum varieties were ude (2), obsa (2), and ilani (1). The number of varieties grown in studied zones varied from 1 in West Gojam to 11 varieties in Bale. Kekeba variety was grown in six out of nine zones. Some varieties were grown in more than one region, but there were clear favorites (Table 7).
Table 7: Main wheat varieties by region
Variety Number farmers who grow it (%)
Amhara Kekeba 78 (62)
Oromia Digalu and Kubsa 114 (25 and 25)
Tigray Danda’a 14 (57)
SNNP Digalu 21 (43)
Continuing to develop wheat varieties that are suited to the variable conditions within Ethiopia’s
different agro-ecosystems may not only assist in increasing the amount of wheat produced, but also minimize the effect of increasing temperatures and declining water resources (Kassie et al. 2013). Kassie et
1 Picaflor is a synonym for kekeba. http://wheatatlas.org/country/varieties/ETH/0

17
al. (2013) noted that cost of adaptations is a limiting factor for farms – results here show that cost of seed is a major influence over what type of seed is grown.
Chemical Application
Agro-chemicals are used by well-informed farmers at different stages of crop production and post-harvest operations to boost production and reduce losses caused by different agents. Most sampled farmers (69 %) used agro-chemicals during the growing season or before harvest. The chemicals could be herbicides, pesticides, growth regulators, and chemicals that could be used post-harvest.
Farmers reported different rates of pesticide measured in liters, in packet, grams and measuring spoons depending on the type of agrochemical use. Over 90 % of respondents used herbicides, with 2.4D, Topic and Pallas most commonly used (Fig. 4). Different rates per unit area were used but not justified, with some farmers determining their own preferred rates, a common practice which can result in unnecessary costs (too frequent spraying), pest resistance, and human health issues (excessive pesticide use) (Williamson et al. 2008). One farmer reported using a spray without the knowledge of rate to be applied.
Figure 4: Types of chemical applied before harvest (percentage)
The majority of respondents do not use the appropriate protective clothing during pesticide application (74 %), which is very dangerous to their health. Of the 26 % who do use some protective clothing, most mentioned using their own clothing to cover their mouths for the purpose of pesticide application. Others mentioned using complete protection while others used one to three items of the required clothing i.e., masks, gloves, shoes, eyeglass, or goggles. One of the respondents mentioned using a gas mask.
Urgent and comprehensive measures are required for proper use of agro-chemicals in the wheat farming community. Education on the proper disposal of pesticide packages and containers is also need only 38 % of the respondents bury containers underground. Grain unfit for human consumption was
0%
10%
20%
30%
40%
50%
60%
70%
80%
90%
100%
18
mostly fed to animals, some farmers sell it and others bury it. Some farmers cannot afford to waste any grain and have eaten damaged grain themselves (Blum and Bekele 2001).
Harvest
Timing harvest so that the threshed wheat can dry was found to be very important in terms of reducing post-harvest loss. Knowing when rains are likely to start would help farmers Respondents to a survey by Kassie et al. (2013) received most of their weather forecast information from village meetings and found the process unreliable.
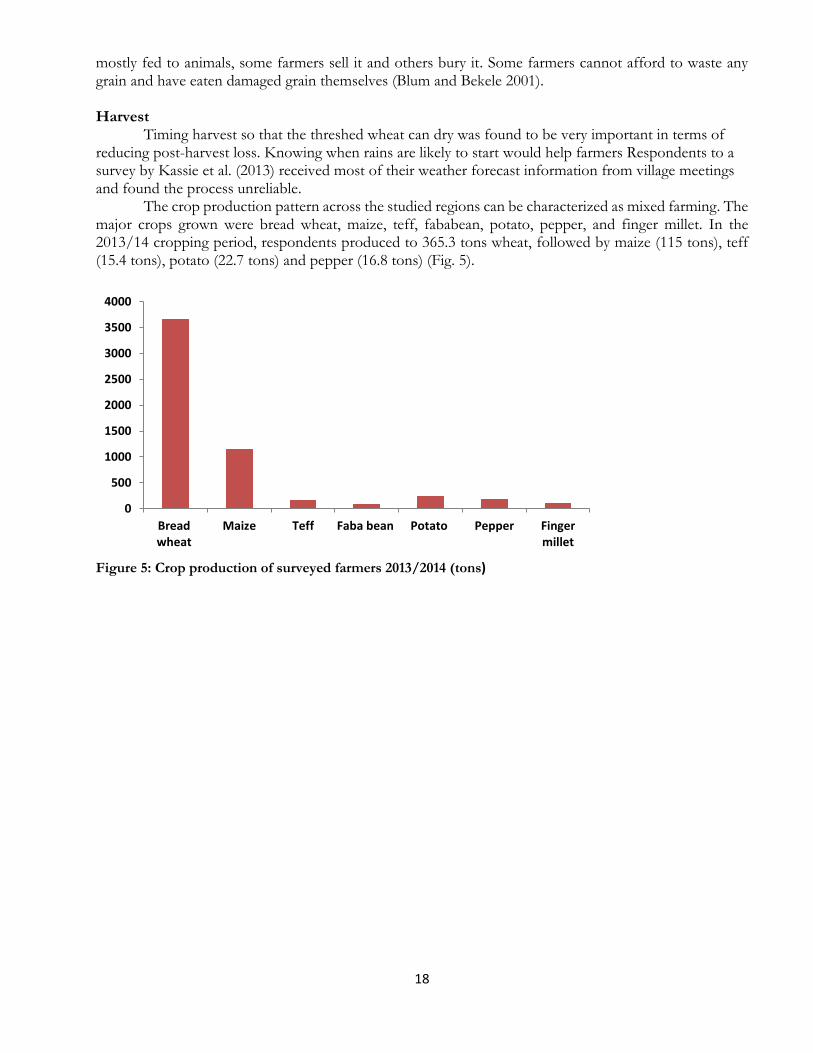
The crop production pattern across the studied regions can be characterized as mixed farming. The major crops grown were bread wheat, maize, teff, fababean, potato, pepper, and finger millet. In the 2013/14 cropping period, respondents produced to 365.3 tons wheat, followed by maize (115 tons), teff (15.4 tons), potato (22.7 tons) and pepper (16.8 tons) (Fig. 5).
Figure 5: Crop production of surveyed farmers 2013/2014 (tons)
0
500
1000
1500
2000
2500
3000
3500
4000
Breadwheat
Maize Teff Faba bean Potato Pepper Fingermillet
19
Storage of wheat grain
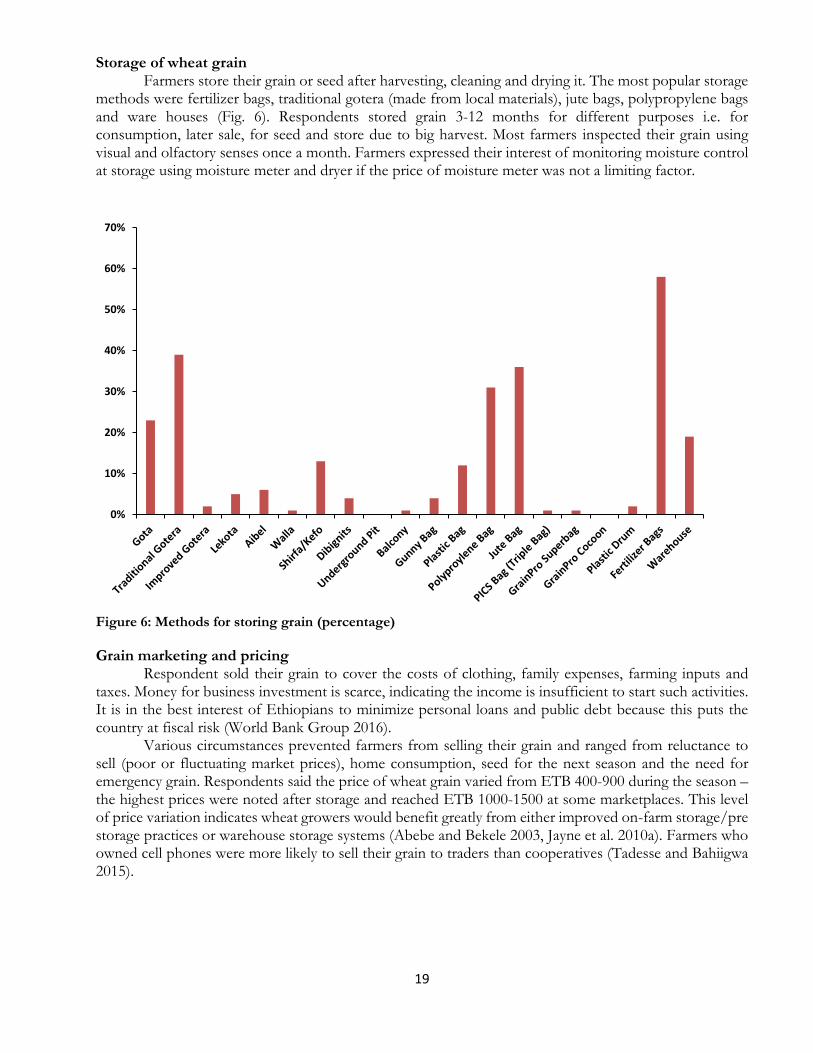
Farmers store their grain or seed after harvesting, cleaning and drying it. The most popular storage methods were fertilizer bags, traditional gotera (made from local materials), jute bags, polypropylene bags and ware houses (Fig. 6). Respondents stored grain 3-12 months for different purposes i.e. for consumption, later sale, for seed and store due to big harvest. Most farmers inspected their grain using visual and olfactory senses once a month. Farmers expressed their interest of monitoring moisture control at storage using moisture meter and dryer if the price of moisture meter was not a limiting factor.
Figure 6: Methods for storing grain (percentage)
Grain marketing and pricing
Respondent sold their grain to cover the costs of clothing, family expenses, farming inputs and taxes. Money for business investment is scarce, indicating the income is insufficient to start such activities. It is in the best interest of Ethiopians to minimize personal loans and public debt because this puts the country at fiscal risk (World Bank Group 2016).
Various circumstances prevented farmers from selling their grain and ranged from reluctance to sell (poor or fluctuating market prices), home consumption, seed for the next season and the need for emergency grain. Respondents said the price of wheat grain varied from ETB 400-900 during the season – the highest prices were noted after storage and reached ETB 1000-1500 at some marketplaces. This level of price variation indicates wheat growers would benefit greatly from either improved on-farm storage/pre storage practices or warehouse storage systems (Abebe and Bekele 2003, Jayne et al. 2010a). Farmers who owned cell phones were more likely to sell their grain to traders than cooperatives (Tadesse and Bahiigwa 2015).
0%
10%
20%
30%
40%
50%
60%
70%
20
3.6 Post-harvest losses in wheat
Post-harvest loss can occur at any stage along the post-harvest chain affecting crop quality and food security efforts. Understanding the circumstances around harvest and post-harvest of a given crop may help reduce post-harvest losses and improve income of farm households.
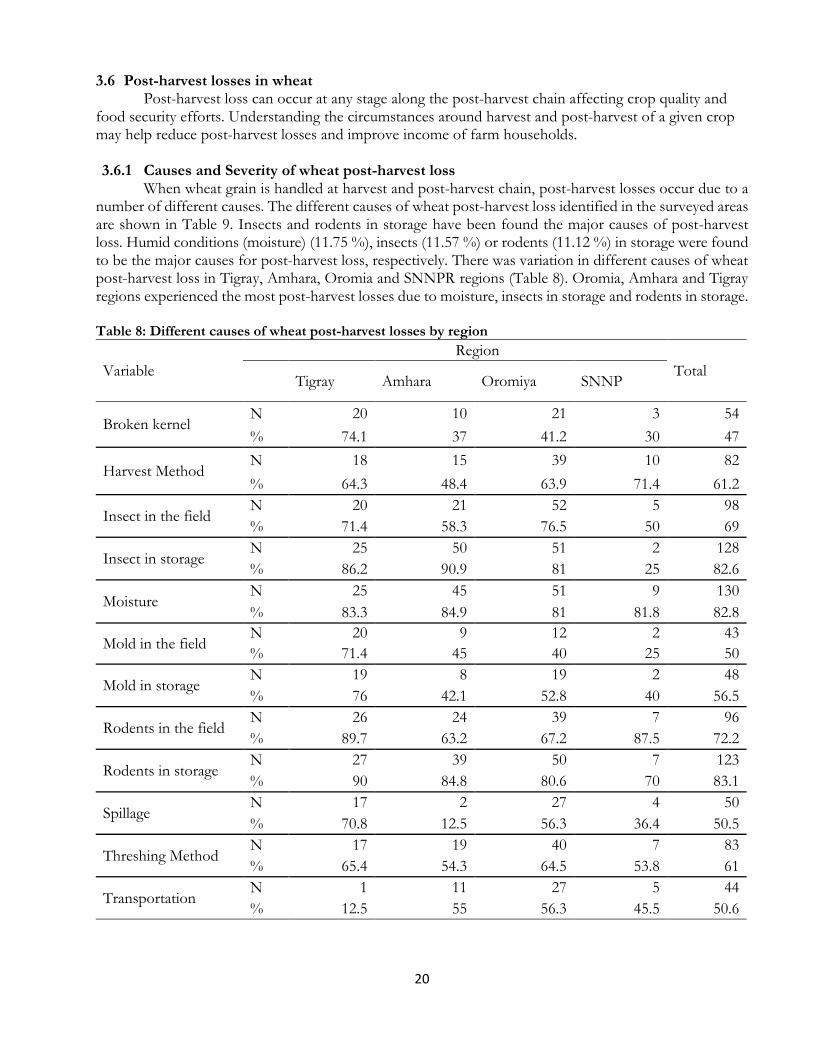
3.6.1 Causes and Severity of wheat post-harvest loss
When wheat grain is handled at harvest and post-harvest chain, post-harvest losses occur due to a number of different causes. The different causes of wheat post-harvest loss identified in the surveyed areas are shown in Table 9. Insects and rodents in storage have been found the major causes of post-harvest loss. Humid conditions (moisture) (11.75 %), insects (11.57 %) or rodents (11.12 %) in storage were found to be the major causes for post-harvest loss, respectively. There was variation in different causes of wheat post-harvest loss in Tigray, Amhara, Oromia and SNNPR regions (Table 8). Oromia, Amhara and Tigray regions experienced the most post-harvest losses due to moisture, insects in storage and rodents in storage.
Table 8: Different causes of wheat post-harvest losses by region
Variable
Region
Total Tigray Amhara Oromiya SNNP
Broken kernel N 20 10 21 3 54
% 74.1 37 41.2 30 47
Harvest Method N 18 15 39 10 82
% 64.3 48.4 63.9 71.4 61.2
Insect in the field N 20 21 52 5 98
% 71.4 58.3 76.5 50 69
Insect in storage N 25 50 51 2 128
% 86.2 90.9 81 25 82.6
Moisture N 25 45 51 9 130
% 83.3 84.9 81 81.8 82.8
Mold in the field N 20 9 12 2 43
% 71.4 45 40 25 50
Mold in storage N 19 8 19 2 48
% 76 42.1 52.8 40 56.5
Rodents in the field N 26 24 39 7 96
% 89.7 63.2 67.2 87.5 72.2
Rodents in storage N 27 39 50 7 123
% 90 84.8 80.6 70 83.1
Spillage N 17 2 27 4 50
% 70.8 12.5 56.3 36.4 50.5
Threshing Method N 17 19 40 7 83
% 65.4 54.3 64.5 53.8 61
Transportation N 1 11 27 5 44
% 12.5 55 56.3 45.5 50.6

21
Losses due to storage were estimated to be 3% of the total wheat post-harvest loss. These were mainly due to use of traditional storage methods by the farmers (Fig. 7). Farmers usually store 3-12 months at their premises and the losses occur during this period.
Figure 7: Two gotera, traditional storage units
Insects play major role in deterioration of stored wheat grains and caused 11.57 % total post-harvest losses (Table 8). Farmers were able to identify insects important or mostly observed in their wheat stores along the grain from color picture plates provided to them. Rice moth (Corcyra cephalonica), flat grain beetle (Cryptolestes pusillus), hide beetle (Dermestes maculatus) and weevils were the most easily identified by the farmers. Control measures for these pests need to be devised to minimize post-harvest losses.
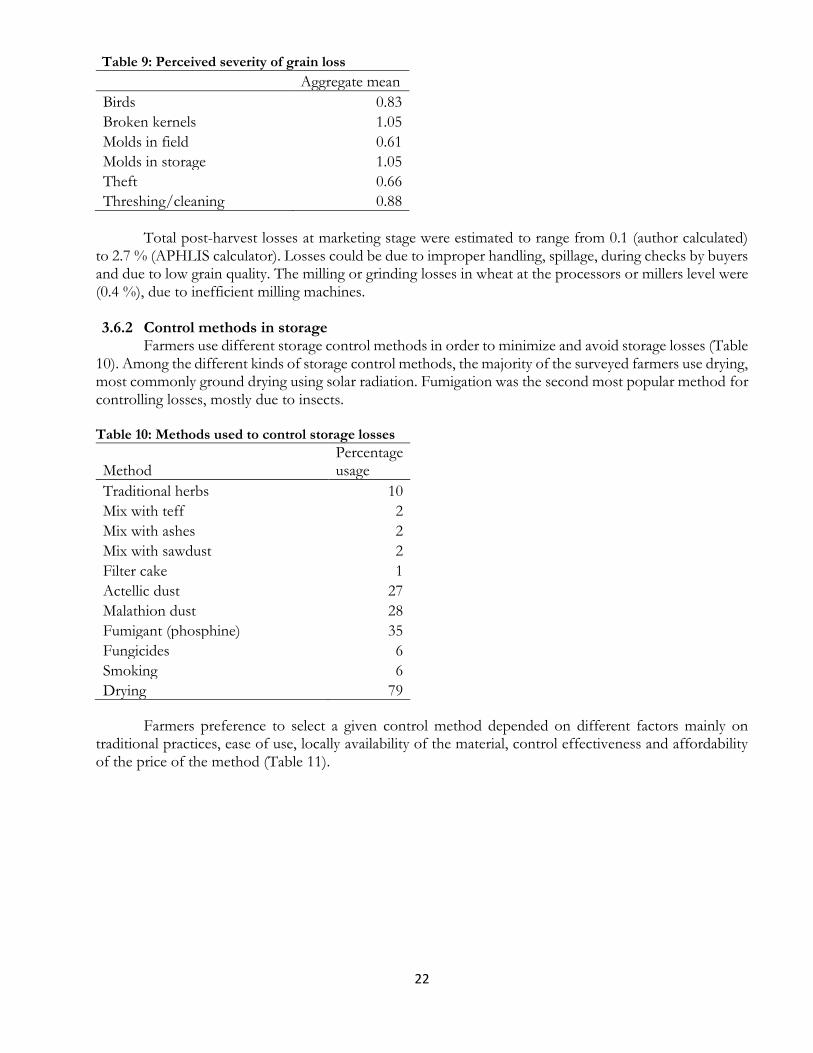
The extent of severity of grain loss varied across different causes (Table 9). Farmers ranked severity of wheat grain loss on a scale of 0 to 2 (0=Not severe, 1=Moderately severe, 2=Severe). Before calculating the aggregate mean values of the severity of wheat grain loss, a reliability test was conducted using SPSS software program. The reliability statistic was found to be 0.92 Cronbach’s Alpha which was greater than the threshold value, 0.7 Cronbach’s Alpha. This indicates that 92 % of the variance of the aggregate score to rank severity of wheat grain loss is consistent internally. Finally, the aggregate mean values of the severity of wheat grain loss were evaluated and ranked accordingly. Accordingly, the major causes of severity of wheat grain loss were molds in storage, broken kernels, threshing and cleaning.
22
Table 9: Perceived severity of grain loss
Aggregate mean
Birds 0.83
Broken kernels 1.05
Molds in field 0.61
Molds in storage 1.05
Theft 0.66
Threshing/cleaning 0.88
Total post-harvest losses at marketing stage were estimated to range from 0.1 (author calculated)
to 2.7 % (APHLIS calculator). Losses could be due to improper handling, spillage, during checks by buyers and due to low grain quality. The milling or grinding losses in wheat at the processors or millers level were (0.4 %), due to inefficient milling machines. 3.6.2 Control methods in storage
Farmers use different storage control methods in order to minimize and avoid storage losses (Table 10). Among the different kinds of storage control methods, the majority of the surveyed farmers use drying, most commonly ground drying using solar radiation. Fumigation was the second most popular method for controlling losses, mostly due to insects.
Table 10: Methods used to control storage losses
Method Percentage usage
Traditional herbs 10
Mix with teff 2
Mix with ashes 2
Mix with sawdust 2
Filter cake 1
Actellic dust 27
Malathion dust 28
Fumigant (phosphine) 35
Fungicides 6
Smoking 6
Drying 79
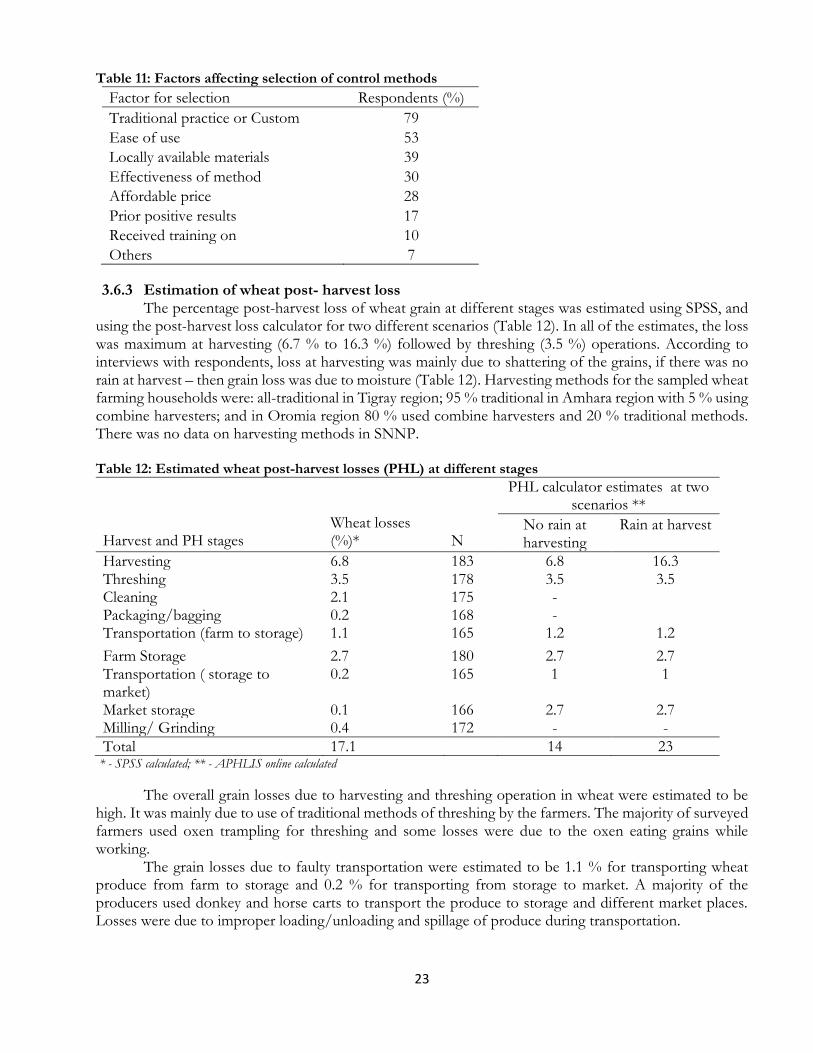
Farmers preference to select a given control method depended on different factors mainly on traditional practices, ease of use, locally availability of the material, control effectiveness and affordability of the price of the method (Table 11).
23
Table 11: Factors affecting selection of control methods
Factor for selection Respondents (%)
Traditional practice or Custom 79
Ease of use 53
Locally available materials 39
Effectiveness of method 30
Affordable price 28
Prior positive results 17
Received training on 10
Others 7
3.6.3 Estimation of wheat post- harvest loss The percentage post-harvest loss of wheat grain at different stages was estimated using SPSS, and
using the post-harvest loss calculator for two different scenarios (Table 12). In all of the estimates, the loss was maximum at harvesting (6.7 % to 16.3 %) followed by threshing (3.5 %) operations. According to interviews with respondents, loss at harvesting was mainly due to shattering of the grains, if there was no rain at harvest – then grain loss was due to moisture (Table 12). Harvesting methods for the sampled wheat farming households were: all-traditional in Tigray region; 95 % traditional in Amhara region with 5 % using combine harvesters; and in Oromia region 80 % used combine harvesters and 20 % traditional methods. There was no data on harvesting methods in SNNP.
Table 12: Estimated wheat post-harvest losses (PHL) at different stages
Harvest and PH stages
Wheat losses (%)*
N
PHL calculator estimates at two scenarios **
No rain at harvesting
Rain at harvest
Harvesting 6.8 183 6.8 16.3 Threshing 3.5 178 3.5 3.5 Cleaning 2.1 175 -
Packaging/bagging 0.2 168 -
Transportation (farm to storage) 1.1 165 1.2 1.2
Farm Storage 2.7 180 2.7 2.7 Transportation ( storage to market)
0.2 165 1 1
Market storage 0.1 166 2.7 2.7 Milling/ Grinding 0.4 172 - -
Total 17.1 14 23 * - SPSS calculated; ** - APHLIS online calculated
The overall grain losses due to harvesting and threshing operation in wheat were estimated to be high. It was mainly due to use of traditional methods of threshing by the farmers. The majority of surveyed farmers used oxen trampling for threshing and some losses were due to the oxen eating grains while working.
The grain losses due to faulty transportation were estimated to be 1.1 % for transporting wheat produce from farm to storage and 0.2 % for transporting from storage to market. A majority of the producers used donkey and horse carts to transport the produce to storage and different market places. Losses were due to improper loading/unloading and spillage of produce during transportation.
24
Losses during cleaning were estimated to be 2 % of the total wheat produced. The sampled farmers cleaned their grain by winnowing on the wind using lyda and fork. Strong winds caused grain loss during winnowing, blowing grains away. Packing related post-harvest losses were estimated to be low.
Mean productivity of the different zones was highest at Arsi (4.1 ton ha-1) followed by Hadia (3.9 ton ha-1) and Semen Shewa (3.8 ton ha-1). The lowest productivity was recorded at western Arsi (2.3 ton ha-1) and eastern Tigray (2.1 ton ha-1). The losses (kg ha-1) were estimated across studied wheat zones in different regions (Table 13) based on the overall yield potential. Similarly, the mean losses across zones and regions were highest at harvesting (221 kg ha-1), threshing (114 kg ha-1) and during farm storage (87.2 kg ha-1).

25
Table 13: Post-harvest loss estimates (kg ha-1) in different zones in surveyed regions
PH stages
Tigray Amhara Oromia SNNPR
SE Tigray
Eastern Tigray
West Gojam
East Gojam
Semen Shewa Arsi
West Arsi Bale Hadiya
Mean
Harvesting 230.2 142.2 237.0 203.1 257.3 277.6 155.7 223.4 264.0 221.2
Threshing 119.0 73.5 122.5 105.0 133.0 143.5 80.5 115.5 136.5 114.3
Cleaning 72.1 44.5 74.2 63.6 80.6 86.9 48.8 70.0 82.7 69.3
Packaging/bagging 5.4 3.4 5.6 4.8 6.1 6.6 3.7 5.3 6.2 5.2
Transportation (farm to storage) 38.1 23.5 39.2 33.6 42.6 45.9 25.8 37.0 43.7 36.6
Farm storage 90.8 56.1 93.5 80.1 101.5 109.5 61.4 88.1 104.1 87.2
Transportation (storage to market) 6.8 4.2 7.0 6.0 7.6 8.2 4.6 6.6 7.8 6.5
Market storage 3.4 2.1 3.5 3.0 3.8 4.1 2.3 3.3 3.9 3.3
Milling/Crushing/Grinding 14.6 9.0 15.1 12.9 16.3 17.6 9.9 14.2 16.8 14.0
Total 579.7 358.1 596.8 511.5 647.9 699.1 392.2 562.7 665.0 557.0
26
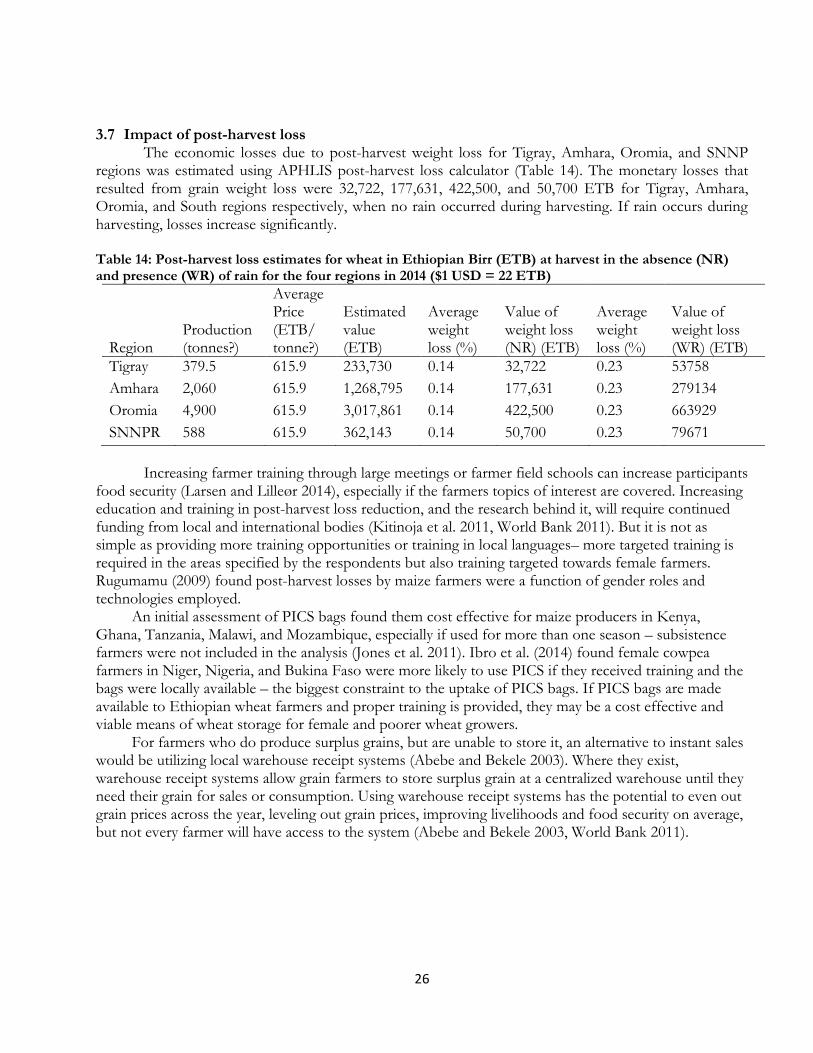
3.7 Impact of post-harvest loss
The economic losses due to post-harvest weight loss for Tigray, Amhara, Oromia, and SNNP regions was estimated using APHLIS post-harvest loss calculator (Table 14). The monetary losses that resulted from grain weight loss were 32,722, 177,631, 422,500, and 50,700 ETB for Tigray, Amhara, Oromia, and South regions respectively, when no rain occurred during harvesting. If rain occurs during harvesting, losses increase significantly. Table 14: Post-harvest loss estimates for wheat in Ethiopian Birr (ETB) at harvest in the absence (NR) and presence (WR) of rain for the four regions in 2014 ($1 USD = 22 ETB)
Region Production (tonnes?)
Average Price (ETB/ tonne?)
Estimated value (ETB)
Average weight loss (%)
Value of weight loss (NR) (ETB)
Average weight loss (%)
Value of weight loss (WR) (ETB)
Tigray 379.5 615.9 233,730 0.14 32,722 0.23 53758
Amhara 2,060 615.9 1,268,795 0.14 177,631 0.23 279134
Oromia 4,900 615.9 3,017,861 0.14 422,500 0.23 663929
SNNPR 588 615.9 362,143 0.14 50,700 0.23 79671
Increasing farmer training through large meetings or farmer field schools can increase participants food security (Larsen and Lilleør 2014), especially if the farmers topics of interest are covered. Increasing education and training in post-harvest loss reduction, and the research behind it, will require continued funding from local and international bodies (Kitinoja et al. 2011, World Bank 2011). But it is not as simple as providing more training opportunities or training in local languages– more targeted training is required in the areas specified by the respondents but also training targeted towards female farmers. Rugumamu (2009) found post-harvest losses by maize farmers were a function of gender roles and technologies employed.
An initial assessment of PICS bags found them cost effective for maize producers in Kenya, Ghana, Tanzania, Malawi, and Mozambique, especially if used for more than one season – subsistence farmers were not included in the analysis (Jones et al. 2011). Ibro et al. (2014) found female cowpea farmers in Niger, Nigeria, and Bukina Faso were more likely to use PICS if they received training and the bags were locally available – the biggest constraint to the uptake of PICS bags. If PICS bags are made available to Ethiopian wheat farmers and proper training is provided, they may be a cost effective and viable means of wheat storage for female and poorer wheat growers.
For farmers who do produce surplus grains, but are unable to store it, an alternative to instant sales would be utilizing local warehouse receipt systems (Abebe and Bekele 2003). Where they exist, warehouse receipt systems allow grain farmers to store surplus grain at a centralized warehouse until they need their grain for sales or consumption. Using warehouse receipt systems has the potential to even out grain prices across the year, leveling out grain prices, improving livelihoods and food security on average, but not every farmer will have access to the system (Abebe and Bekele 2003, World Bank 2011).
27
IV. Conclusion and Recommendations The survey of 200 wheat farms in the regions of Amhara, Oromia, Southern Nations, Nationals
Peoples (SNNP), and Tigray covered household makeup and requirements, education and training, farm management and grain storage practices, and income. The focus of the survey was to identity the overall circumstances of wheat growers were established and factors affecting post-harvest losses were identified.
Wheat harvesting and post-harvest handling of the grain are the most important operations. The grain produced must be utilized efficiently since it has received the required investment and helps for food security of wheat growers and consumers. Wheat harvest loss at farm level was during harvesting (shattering) and threshing method, which varied among regions. Farmers in Oromia (80%) used combine harvesters.
More than 60% of the studied farmers were educated (primary education and above) helpful for easing the extension education. Improved availability of seeds and price were major determinants of selection of a specific variety. Most wheat farmers (70%) used agrochemicals or pesticides. However, safe use of such chemicals is a major concern and immediate measures are needed, which will have health and environmental hazards. New information of technologies or other vital information reached farmers through large meetings, fellow farmers, radio programs, one-on-one delivery, and demonstration trials.
Farmers trainings were mostly on seed production but farmers interest was high to be trained on harvesting, moisture measurement and drying, insect identification and control, rodents’ control, use of pesticides, safe use and handling of pesticides, proper storage and marketing. Recycled fertilizer bags were used most for storage followed by traditional storage (gotera) and is an area of intervention for improved storage. Few farmers used ware houses and the standard might be questionable. Farmers expressed their interest of monitoring moisture control at storage using moisture meter and dryer if the price of moisture meter was not a limiting factor. Farmers can improve their income if farmers adjust their marketing period when the grain price is stable and high which depend also on availability of proper and safe storage.
The most important causes of PHL in storage were due to insects and rodents, and moisture content of the grain. Sun drying and fumigation were the major storage loss control methods used by farmers. Generally, the overall grain losses were high during harvesting and threshing operation in wheat. Farmers preference to select a given control method depended mainly on traditional practices, ease of use, locally availability of the material, control effectiveness and affordability of the price of the method.
Saying that post-harvest losses need to be reduced is easy enough, actually reducing the losses and improving food security is proving to be challenge. It is not impossible, but there is also no “one size fits all” solution. Improved and accessible means of storing wheat for a year or more, targeted training, gender sensitive consultation and innovations, and continued capacity building in post-harvest research and development are the way forward to reducing Ethiopia’s wheat post-harvest losses.
28
V. References Abebe, H. G., H. Bekele. 2003. Farmers’ post-harvest grain management choices under liquidity
constraints and impending risks: Implication for achieving food security objectives in Ethiopia. http://www.eap.gov.et/?q=node/923 Accessed February 29, 2016.
Adugna, H., N. Workneh, R. Bisrat. 1991. Technology transfer for wheat production in Ethiopia. In: Gebre-Mariam, H., D.G. Tanner, M. Hulluka. (eds). Wheat research in Ethiopia: a historical perspective. Addis Abba: IAR/CIMMYT, pp: 277-299.
Affognon, H., C. Mutungi, P. Sanginga, C. Borgemeister. 2015. Unpacking postharvest losses in sub-
Saharan Africa: A meta-analysis. World Development, 66: 49-68. Asnakew, W., M. Tekaligne, B. Mengesha, A. Tefera. 1991. Soil fertility management studies on wheat in
Ethiopia. In: Hailu, G-M., D.G. Tanner, and H. Mengistu (eds), ‘Wheat research in Ethiopia: a historical perspective’, IAR/CIMMYT, Addis Ababa, Ethiopia, pp.137-172.
Assefa, A. 2005. Soil nutrient flows and integrated nutrient management in the northern Ethiopian
Highlands. In: Pender, J., R. Ruben, M. Jabbar, E. Gabre-Madhin (eds). EDRI-ESSP Policy Working Paper No. 1: Policies for improved land management and agricultural market development in the Ethiopian Highlands. Workshop summary paper. Ethiopian Development Research Institute, August 2005.
Bekele, A., M.F. Viljoen, G. Ayele, S. Ali. 2009. Effect of farm size on efficiency of wheat production in
Moretna-Jirru District in Central Ethiopia. Indian Journal of Agricultural Economics, 64(1): 133-134.
Beuchelt, T.D., L. Badstue. 2013. Gender, nutrition- and climate-smart food production: opportunities
and trade-offs. Food Security, 5: 709-721. Blum, A., A. Bekele. 2001. Ethiopian farmers’ practices of on-farm grain storage. Tropical Science, 41:
23-30. Central Statistical Agency (CSA) 2014. Area and production of major crops private peasant holdings,
meher season. May, 2014. Addis Ababa, Ethiopia. Christiaensen, L., L. Demery, J. Kuhl. 2011. The (evolving) role of agriculture in poverty reduction – an
empirical perspective. Journal of Development Economics, 96: 239-254. Coe, R., R.D. Stern. 2011. Assessing and addressing climate-induced risk in sub-Saharan rainfed
agriculture: Lessons learned. Experimental Agriculture, 47(2): 395-410. Costa, S.J. 2015. Taking it to scale: Post-harvest loss eradication in Uganda 2014-2015. UN World Food
Programme, Kampala, Uganda. Danielsen, K., F. Wong, C. Hunter, E. Kamminga, M. Mukhopadhyay, N.N. Mudege, L. Badstue. 2014.
Wheat gender audit 2013: Summary report. CRP Wheat. FAOSTAT. 2015. Area and Production of wheat
http://faostat.fao.org/site/567/DesktopDefault.aspx?PageID=567#ancor. Updated: 04 August 2014.

29
FDRE CSA. 2015. Large and medium scale commercial farms sample survey 2014/15 (2007 EC): Results at country and regional level. Volume VIII. Statistical report on area and production of crops, and farm management practices. Addis Ababa, August 2015. http://www.csa.gov.et/images/general/news/report_final_commercial_2007 Accessed March 29, 2016.
Gabre-Madhin, E., W. Amha. 2005. Characterizing grain traders. In: Pender, J., R. Ruben, M. Jabbar, E.
Gabre-Madhin (eds). EDRI-ESSP Policy Working Paper No. 1: Policies for improved land management and agricultural market development in the Ethiopian Highlands. Workshop summary paper. Ethiopian Development Research Institute, August 2005.
Hailu, G-M. 1991. Wheat production and research in Ethiopia. In: Hailu, G-M., D.G. Tanner, H.
Mengistu (eds), ‘Wheat research in Ethiopia: a historical perspective’, IAR/CIMMYT, Addis Ababa, Ethiopia, pp: 1-15.
Hodges, R.J, J.C. Buzby, B. Bennett. 2011. Postharvest losses and waste in developed and less developed
countries: opportunities to improve resource use. Journal of Agricultural Science, 149: 37-45. Hodges, R.J., M. Bernard, F. Rembold. 2014. APHLIS – Postharvest cereal losses in sub-Saharan Africa,
their estimation, assessment and reduction. Joint Research Centre, European Union, Luxembourg. Ibro, G., M.C. Sorgho, A.A. Idris, B. Moussa, D. Baributsa, J. Loweberg-DeBoer. 2014. Adoption of
cowpea hermetic storage by women. Journal of Stored Products Research, 58, 87-96. Index Mundi, 2016. Ethiopia Wheat Imports by Year.
http://www.indexmundi.com/agriculture/?country=et&commodity=wheat&graph=imports. Accessed February, 2016.
Jayne, T.S., N. Mason, R. Myers, J. Ferris, D. Mather, M. Beaver, N. Lenski, A. Chapoto and D.
Boughton. 2010(a). Patterns and Trends in Food Staples Markets in Eastern and Southern Africa: Toward the Identification of Priority Investments and Strategies for Developing Markets and Promoting Smallholder Productivity Growth. MSU International Development Working Paper No. 104. Department of Agricultural, Food and Resource Economics, Department of Economics. East Lansing: Michigan State University.
Jayne, T.S., D. Mather, E. Mghenyi. 2010(b). Principle challenges confronting smallholder agriculture in
sub-Saharan Africa. World Development, 38: 1384-1398. Jones, M., C. Alexander, J. Lowenberg-DeBoer. 2011. An initial investigation of the potential for
hermetic Purdue improved crop storage (PICS) bags to improve incomes for maize producers in sub-Saharan Africa. Working Paper #11-3, Department of Agricultural Economics, Purdue University, West Lafayette, Indiana.
Kassie, B.T., H. Hengsdijk, R. Rötter, H. Kahiluoto, S. Asseng, M. van Ittersum. 2013. Adapting to
climate variability and change: Experiences from cereal-based farming in the Central Rift and Kobo Valleys, Ethiopia. Environmental Management, 52: 1115-1131.
Kitinoja, L., S. Saran, S.K. Roy, A.A. Kader. 2011. Postharvest technology for developing countries:
challenges and opportunities in research, outreach and advocacy. Journal of the Science of Food and Agriculture, 91, 597-603.

30
Larsen, A.F., H.B. Lilleør. 2014. Beyond the field: The impact of farmer field schools on food security
and poverty alleviation. World Development, 64: 843-859. Maxwell, D., B. Vaitla, J. Coates. 2014. How do indicators of household food insecurity measure up? An
empirical comparison from Ethiopia. Food Policy, 47: 107-116. Missing Food: The Case of Postharvest Grain Losses in Sub-Saharan Africa. 2011. The International
Bank for Reconstruction and Development /The World Bank. Report No. 60371-AFR. World Bank.
Negassa, A., B. Shiferaw, Jawoo Koo, K. Sonder, M. Smale, H.J. Braun, S. Gbegbelegbe, Zhe Guo, D.
Hodson, S. Wood, T. Payne, and B. Abeyo. 2013. The Potential for Wheat Production in Africa: Analysis of Biophysical Suitability and Economic Profitability. Mexico, D.F.: CIMMYT.
Pender, J., B. Gebremedhin. 2006. Land management, crop production, and household income in the
highlands of Tigray, Northern Ethiopia: An econometric analysis. In: Strategies for sustainable land management in the East African highlands. Pp. 107-139.
Reuben, R., G. Kruseman, G. Tesfay. 2005. Policies and technologies for sustainable land management in
the Ethiopian Highlands. In: Pender, J., R. Ruben, M. Jabbar, E. Gabre-Madhin (eds). EDRI-ESSP Policy Working Paper No. 1: Policies for improved land management and agricultural market development in the Ethiopian Highlands. Workshop summary paper. Ethiopian Development Research Institute, August 2005.
Rugumamu, C.P. 2009. Assessment of post-harvest technologies and gender relations in maize loss
reduction in Pangawe village Eastern Tanzania. Tanzania Journal of Science, 35, 67-75. Singh, R.P., D.P. Hodson, J. Huerta-Espino, Y. Jin, P. Njau, R. Wanyera, S.A. Herrera-Foessel, R.W.
Ward. 2008. Will stem rust destroy the world’s wheat crop? Advances in Agronomy, 98: 271-309. Swiss Agency for Development and Cooperation SDC. 2015. Draft gender strategy for grain post-harvest
management in African smallholder farming systems. Tadesse, M. 2014. Fertilizer adoption, credit access, and safety nets in rural Ethiopia. Agricultural Finance
Review, 74(3): 290-310. Tadesse, G., G. Bahiigwa. 2015. Mobile phones and farmers’ marketing decisions in Ethiopia. World
Development, 68: 296-307. Teferi, T.A., Z.S. Gebreslassie. 2015. Occurrence and intensity of wheat Septoria tritici blotch and host
response in Tigray, Ethiopia. Crop Protection, 68: 67-71. van Keulen, H., H. Hengsdijk. 2005. Agroecological analyses: Production potential for Tigray Region. In:
Pender, J., R. Ruben, M. Jabbar, E. Gabre-Madhin (eds). EDRI-ESSP Policy Working Paper No. 1: Policies for improved land management and agricultural market development in the Ethiopian Highlands. Workshop summary paper. Ethiopian Development Research Institute, August 2005.
White, J., D.G. Tanner, J.D. Corbett. 2001. An agro-climatological characterization of bread wheat
production areas in Ethiopia. NRG-GIS Series 1. Mexico, D.F.: CIMMYT.

31
Williamson, S., A. Ball, J. Pretty. 2008. Trends in pesticide use and drivers for safer pest management in
four African countries. Crop Protection, 27: 1327-1334. World Bank Group. 2016. Global Economic Prospects, January 2016: Spillovers amid Weak Growth.
Washington, DC: World Bank. Washington, DC: World Bank.