
ASSESSMENT OF WATER QUALITY...ASSESSMENT OF WATER QUALITY Pooja. D. Somani 1, Siddharath Ray 2,...
4
ASSESSMENT OF WATER QUALITY Pooja. D. Somani 1 , Siddharath Ray 2 , Sanjay Singh 3 Assistant Professor, Department of Civil Engineering, Saraswati College of Engineering, Kharghar, Navi Mumbai 1 [email protected] , 2 [email protected] , 3 [email protected] Abstract: Potable water when passes through the distribution system deteriorates in its microbial quality. Further the quality of water deteriorates as it is stored in sump tanks, overhead tanks and loft tanks. Since the tanks are not regularly cleaned the quality of water is affected as it reaches the end user. Due to irregular and improper cleaning of the tanks there is an accumulation of organic matter in the tanks due to which the different microorganisms grow in water which leads to spread of various diseases. In this study different sampling sites from Navi Mumbai have been selected which are tested for free residual chlorine and microbial contamination. Study indicates that there is successive increase in the microbial contamination as water passes from sump tank to overhead tank. Maximum contamination is observed in case of water stored in loft tanks. Disinfection of tank can prove to be one of the measures to check the increase in MPN values in water. Keywords: Water quality, MPN, Free Residual Chlorine (FRC), Disinfection, Superchlorination INTRODUCTION Water plays an indispensable role in sustenance of life and it is a key pillar of health determinant, since 80% of diseases in developing countries are due to lack of good quality water. Poor water quality continues to pose a major threat to human health. Diarrhoeal disease alone amounts to an estimated 4.1 % of the total Disability-Adjusted Life Years (DALY) global burden of disease and is responsible for the deaths of 1.8 million people every year [1]. Consequently, water borne diseases such as cholera and typhoid often have their outbreak especially during dry season. High prevalence of diarrhea among children and infants can be due to the use of unsafe water and unhygienic practice. Thus, many infectious diseases are transmitted by water through fecal oral contamination. Diseases due to drinking of contaminated water leads to the death of five million children annually and make 1/6 of the world population sick [2]. Water which is treated by different Municipal bodies, meets all drinking water quality standards at treatment plant and at the point where the water enters the distribution system. Water quality deteriorates in distribution networks and during collection, storage so it becomes obligatory to monitor water quality at each stage. Apart from all monitoring and surveillance, drinking water at tap may not be potable. By the time water reaches the consumer, its quality might be very different from what it was when it left the plant. The management of distribution systems has become one of the most difficult challenges to providing safe drinking water as pipes are buried and not subject to the direct control of water utilities. Microbial contamination in distribution systems is a potential threat to public health. Pathways for the entry of contaminants into distribution systems include: organisms that survive the treatment process; contaminated ground-water that flows in from outside when pressure in a pipe drops; contamination during the installation or repair of water mains; and backflow from non-potable systems connected to potable water system. Whereas the chemical contamination can occur in the distribution system as a result of corrosion reactions, the accumulation of contaminated sediments, and the intrusion of chemical compounds into the pipes. Intentional contamination is also a potential threat. The water through the treatment plant is supplied to the consumer through Continuous water supply system or Intermittent water supply. The water passes through sump tanks and overhead tanks before reaching the consumer tap. In some cases due to irregular or insufficient supply of water, additional storage of water is done in loft tanks in individual household. Cleaning of these tanks is often neglected. Since the tanks are not regularly or properly cleaned, there is an accumulation of organic matter in the tanks due to which the different microorganisms grow in water which leads to spread of various diseases. The water quality doesn’t change much in other chemical and physical characteristics, but there may be variance in the microbial quality of water coming out of distribution system and finally that of consumer tap. The objective of the study is to assess the bacterial quality of water which actually reached the people through their taps. This study also aims to analyze the degree of deterioration in the bacterial International Journal of Scientific & Engineering Research, Volume 5, Issue 12, December-2014 ISSN 2229-5518 67 IJSER © 2014 http://www.ijser.org IJSER
Transcript of ASSESSMENT OF WATER QUALITY...ASSESSMENT OF WATER QUALITY Pooja. D. Somani 1, Siddharath Ray 2,...

ASSESSMENT OF WATER QUALITY
Pooja. D. Somani1, Siddharath Ray
2, Sanjay Singh
3
Assistant Professor, Department of Civil Engineering,
Saraswati College of Engineering, Kharghar, Navi Mumbai [email protected],
Abstract: Potable water when passes through the
distribution system deteriorates in its microbial quality.
Further the quality of water deteriorates as it is stored in
sump tanks, overhead tanks and loft tanks. Since the tanks
are not regularly cleaned the quality of water is affected as
it reaches the end user. Due to irregular and improper
cleaning of the tanks there is an accumulation of organic
matter in the tanks due to which the different
microorganisms grow in water which leads to spread of
various diseases. In this study different sampling sites from
Navi Mumbai have been selected which are tested for free
residual chlorine and microbial contamination. Study
indicates that there is successive increase in the microbial
contamination as water passes from sump tank to overhead
tank. Maximum contamination is observed in case of water
stored in loft tanks. Disinfection of tank can prove to be one
of the measures to check the increase in MPN values in
water.
Keywords: Water quality, MPN, Free Residual Chlorine
(FRC), Disinfection, Superchlorination
INTRODUCTION
Water plays an indispensable role in
sustenance of life and it is a key pillar of health
determinant, since 80% of diseases in developing
countries are due to lack of good quality water. Poor
water quality continues to pose a major threat to
human health. Diarrhoeal disease alone amounts to an
estimated 4.1 % of the total Disability-Adjusted Life
Years (DALY) global burden of disease and is
responsible for the deaths of 1.8 million people every
year [1]. Consequently, water borne diseases such as
cholera and typhoid often have their outbreak
especially during dry season. High prevalence of
diarrhea among children and infants can be due to the
use of unsafe water and unhygienic practice. Thus,
many infectious diseases are transmitted by water
through fecal oral contamination. Diseases due to
drinking of contaminated water leads to the death of
five million children annually and make 1/6 of the
world population sick [2].
Water which is treated by different
Municipal bodies, meets all drinking water quality
standards at treatment plant and at the point where the
water enters the distribution system. Water quality
deteriorates in distribution networks and during
collection, storage so it becomes obligatory to
monitor water quality at each stage. Apart from all
monitoring and surveillance, drinking water at tap
may not be potable. By the time water reaches the
consumer, its quality might be very different from
what it was when it left the plant. The management of
distribution systems has become one of the most
difficult challenges to providing safe drinking water
as pipes are buried and not subject to the direct
control of water utilities.
Microbial contamination in distribution
systems is a potential threat to public health.
Pathways for the entry of contaminants into
distribution systems include: organisms that survive
the treatment process; contaminated ground-water
that flows in from outside when pressure in a pipe
drops; contamination during the installation or repair
of water mains; and backflow from non-potable
systems connected to potable water system. Whereas
the chemical contamination can occur in the
distribution system as a result of corrosion reactions,
the accumulation of contaminated sediments, and the
intrusion of chemical compounds into the pipes.
Intentional contamination is also a potential threat.
The water through the treatment plant is
supplied to the consumer through Continuous water
supply system or Intermittent water supply. The water
passes through sump tanks and overhead tanks before
reaching the consumer tap. In some cases due to
irregular or insufficient supply of water, additional
storage of water is done in loft tanks in individual household. Cleaning of these tanks is often neglected.
Since the tanks are not regularly or properly cleaned,
there is an accumulation of organic matter in the
tanks due to which the different microorganisms grow
in water which leads to spread of various diseases.
The water quality doesn’t change much in other
chemical and physical characteristics, but there may
be variance in the microbial quality of water coming
out of distribution system and finally that of
consumer tap. The objective of the study is to assess
the bacterial quality of water which actually reached
the people through their taps. This study also aims to
analyze the degree of deterioration in the bacterial
International Journal of Scientific & Engineering Research, Volume 5, Issue 12, December-2014 ISSN 2229-5518
67
IJSER © 2014 http://www.ijser.org
IJSER
0 2 4 6 8
10 12 14 16
MP
N p
er 1
00
ml
Month of Sampling
Direct Supply Overhead Tank Loft Tank
0
0.05
0.1
0.15
0.2
0.25
FR
C m
g/l
Month of Sampling
Direct Supply Overhead Tank
Loft Tank Min. Required
quality of water due to its storage in sump tank,
overhead tank and loft tank. Further the purpose of
this study also extends to get the seasonal variation in
quality of water which is passing through distribution
system, sump tanks and overhead tanks before
reaching the consumer.
MATERIALS AND METHODS
Sampling Locations
Study was carried out by collecting samples
from selected locations of Navi Mumbai. From each
location three samples are collected. One is from the
direct supply (before entering the sump tank), second
from the tap connected to the overhead tank and the
third is from the tap connected to the loft tank. These
samples are collected once a month from the period
of August to March.
Questionnaire Survey
Detail information regarding the supply
hours of the water is collected. Information regarding
the cleaning of tanks, cleaning schedules and cleaning
method is collected.
Sampling
Samples are collected from the selected sites
in plastic bottles. 500 ml of samples are collected
from each location. Samples have been collected
from the taps allowing water to run waste for two to
three minutes or to sufficient time permit the cleaning
of service line. While collecting the sample from
direct supply care is taken that sample is collected
before entering the sump tank. Care is taken to avoid
splashing of water during filling of sampling water
from the tap. The sampling bottles were not filled up
to the brim and two to three centimeter space was left
for allowing shaking of bottle before analysis.
Chemical and Bacteriological Analysis
All the samples collected are analyzed for
Free available chlorine (FRC) by Orthotoluidine
Arsenite test (OTA) as described in the Manual on
Water Supply and Treatment (CPHEEO).
Bacteriological characteristics of the water
samples were determined using multiple tube
fermentation method (most probable number) for
enumeration of total coliform count. Lauryl Tryptose
Broth (LTB) along with fermentation tubes (Durham
tubes) was used. A serial dilution of the water sample
to be tested was made and inoculated into LTB
growth media. Samples were then incubated at 35 ± 2
°C for 24 h. The analysis was conducted as procedure
given in Standard Method for the Examination of
water and Wastewater.
Disinfection of loft tanks
Superchlorination is done in the loft tanks at
location 2 and location 3. Solution of bleaching
powder is added to the loft tank such as to provide
the chlorine dose of 8 mg/l. Samples from loft tank
are analyzed after 24 hrs and then after every 10 days.
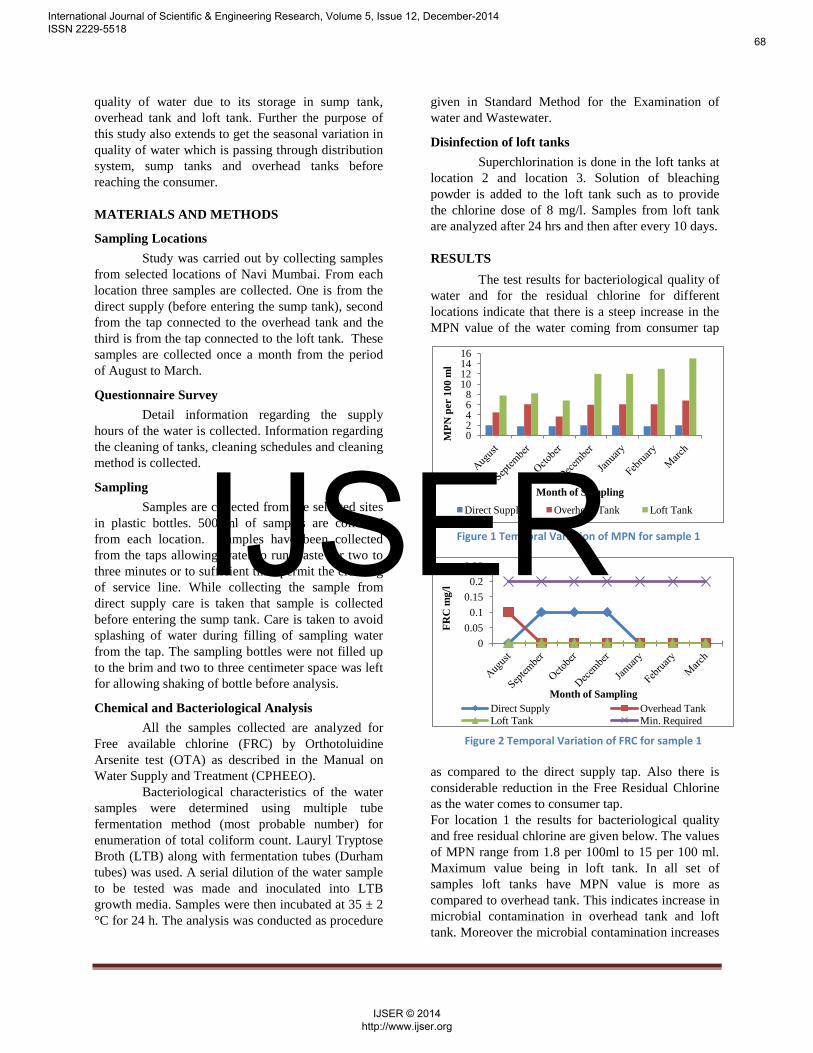
RESULTS
The test results for bacteriological quality of
water and for the residual chlorine for different
locations indicate that there is a steep increase in the
MPN value of the water coming from consumer tap
as compared to the direct supply tap. Also there is
considerable reduction in the Free Residual Chlorine
as the water comes to consumer tap.
For location 1 the results for bacteriological quality
and free residual chlorine are given below. The values
of MPN range from 1.8 per 100ml to 15 per 100 ml.
Maximum value being in loft tank. In all set of
samples loft tanks have MPN value is more as
compared to overhead tank. This indicates increase in
microbial contamination in overhead tank and loft
tank. Moreover the microbial contamination increases
Figure 1 Temporal Variation of MPN for sample 1
Figure 2 Temporal Variation of FRC for sample 1
International Journal of Scientific & Engineering Research, Volume 5, Issue 12, December-2014 ISSN 2229-5518
68
IJSER © 2014 http://www.ijser.org
IJSER

0 2 4 6 8
10 12 14 16
MP
N p
er 1
00
ml
Period of Sampling
Direct Supply Overhead Tank Supply Tank
0
0.5
1
1.5
2
2.5
3
FR
C m
g/l
Month of Sampling
Direct Supply Overhead Tank
Loft Tank Min. Required
0 0.2 0.4 0.6 0.8
1 1.2 1.4 1.6 1.8
FR
C m
g/l
Month of Sampling
Direct Supply Overhead Tank
Loft Tank Min. Required
0
5
10
15
20
25
30
MP
N p
er1
00
ml
Period of Sampling
Municipal Supply Overhead Tank Loft Tank
successively from august to march in the overhead
tank and loft tank.
For location 2 the MPN value ranges from 0
to 14 per 100 ml. The maximum value of free residual
chlorine in direct supply water is found to be 0.3 mg/l
in the month of august and for this period the MPN
value is zero. Disinfection of loft tank is done by
doing superchlorination by providing a chlorine dose
of 8 mg/l in loft tank. It could be observed that the
MPN value in the loft tank after addition of chlorine
has come down to zero.
For location 3 the MPN value ranges
from 1.8 to 24 per 100ml.
Maximum value of MPN is observed in
loft tank in the month of January.
Disinfection of loft tank is done in the
month of February by doing superchlorination
by providing a chlorine dose of 8 mg/l in the loft
tank. It could be observed that the MPN value in
the loft tank after addition of chlorine has
reduced to zero. But after a period of
approximately 2 months microbial
contamination started to increase again. In case
of direct supply water in none of the water
sample the free residual chlorine is more than 0.2
mg/l which the minimum amount of chlorine
required as per CPHEEO standards.
DISCUSSIONS AND CONCLUSIONS
The study of MPN values at different
locations for different period of time indicates
that the microbial contamination increases as the
water moves from sump tank and overhead tank.
And further there is significant rise in MPN
values in the water from loft tank.
From the questionnaire survey carried
out at above locations it is noticed that the
cleaning of storage tanks (sump tanks, overhead
tanks and loft tanks) is often neglected.
Generally the cleaning of the tanks is done once
a year which is not sufficient and may lead to
accumulation of organic matter in the tanks. This
may finally cause rise in microbial
contamination in the storage tanks. Loft tanks
which are placed in the household to combat the
irregular supply of water are rarely cleaned after
their installation. Thus cleaning of storage tanks
Figure 3 Temporal Variation of MPN for sample 2
Figure 5 Temporal variation of FRC for sample 3
Figure 4 Temporal Variation of MPN for sample 2
Figure 6 Temporal Variation of FRC for sample 3
International Journal of Scientific & Engineering Research, Volume 5, Issue 12, December-2014 ISSN 2229-5518
69
IJSER © 2014 http://www.ijser.org
IJSER

is of utmost importance and should be done
regularly and with proper care.
Results indicate that when the free
residual chlorine in the direct supply water is at
least 0.2 mg/l the MPN value is zero. But of all
the samples taken only one sample has the free
residual chlorine of 0.2 mg/l. Therefore care
must be taken by municipal bodies that the free
residual chlorine at the farthest consumer end
must be 0.2 mg/l. If the MPN value at entry level
is less or more precisely zero than its further
increase can be vetoed.
When super chlorination is done for the
loft tank, the free residual chlorine content of the
water was as high as 2.8mg/l and thus the MPN
value has reduced to zero. The zero MPN value
of water in loft tank after superchlorination
continued for the period of one and half month to
two months. But as, when the free residual
chlorine content of water again felled below 0.2
mg/l there started rise in the MPN value. Thus
the loft tanks which are not usually cleaned
should be disinfected by providing
superchlorination using bleaching powder at a
interval of 2 months. But in no case the water
from loft tank should be used for drinking.
Thus it could be concluded that the
minimum free residual chlorine dose of 0.2 mg/l
must be provided at consumer end. Also regular
and proper cleaning of storage tanks along with
disinfection is very much important for
safeguarding water from increasing microbial
contamination.
References
[1] WHO, Guidelines for Drinking-Water
Quality. Recommendation, 3 ed., vol. 1,
Geneva, 2006.
[2] A. I. Mustafa, A. A. Ibrahim, Y. I. Haruna
and S. Abubakakar, "Physicochemical and
bacteriological analyses of drinking water
fromwash boreholes in Maiduguri
Metropolis, Borno State, Nigeria," African
Journal of Food Science, vol. 7, no. 1, pp. 9-
13, 2013.
[3] A. P. H. Association, Standard Methods for
examination of water and waste water, 20
ed., Washington, 2003.
[4] CPHEEO, Manual on Water Supply and
Treatment.
[5] B. O. I. Standards, "Specification for
Drinking Water IS 10500," New Delhi.
International Journal of Scientific & Engineering Research, Volume 5, Issue 12, December-2014 ISSN 2229-5518
70
IJSER © 2014 http://www.ijser.org
IJSER