Assessment of users' responses to air change rates in · PDF fileAssessment of users'...
11
RESEARCH ARTICLE Assessment of users' responses to air change rates in free running office buildings Bode Abiodun Orola * , Kolawole Ajibola, Oyeyemi Oluwaseun Arowolo, and Ayomide Abiodun Omolola Department of Architecture, Obafemi Awolowo University, Ile-Ife, Nigeria Received: 10 June 2016 / Accepted: 26 November 2016 Abstract. Often, building assessments do not account for users' social concerns in relation to buildings' physical characteristics. This study, therefore, assessed the responses of free running office building users to the objective measurements of air change rates in the spaces they occupy. This was done with a view to define a suitable quantitative expression for the social concerns of the users in building assessments, as well as with a view to examine the relationships between the users' responses and the physical characteristics of free running buildings. Measurements were taken in eight low-rise office buildings regarding indoor/outdoor air parameters to capture the air change rates in the buildings. These were done in 50 different spaces within the buildings at different floor levels and different fenestration orientations. The air change rates were correlated along social and physical dimensions with the responses of the occupants captured through questionnaire. Some relationships were observed among the social characteristics of the users and their rating of air change rates in the spaces, but none were statistically significant. Linear regression analysis, however, shows that one of the buildings' physical characteristics has a strong relationship with the users' responses to air change rates. Keywords: air change rate / natural ventilation / free running buildings / warm humid climate 1 Introduction The importance of free running buildings to the built environment cannot be over-emphasized. This is because out of all sectors of human endeavour; studies have shown that the built environment contributes the greatest percentage to the total global energy use [1–5]. This has resulted in contemporaneous concerns over global warming and escalating fossil fuel prices. This suggests that free running buildings have the greatest potential to mitigate global warming and its attendant negative effects on the sustainability of the built environment. In view of the foregoing, building designers have been exploring the possibility of using purely natural forces to ventilate buildings in all climates. The built environment is replete with such outstanding free running buildings expected to add desirable value to its sustainability. For example, in a study in Singapore, Liping and Hien [6] stated that 86% of residential buildings there were designed to be naturally ventilated. Similarly, Tuohy and Murphy [7] highlighted sustainable design features in some notable buildings like the Environmental Office Building in Garston, England and the Great Glen House in Scotland. In addition, Olaniyan (1983) [8] featured many office buildings on the campus of Obafemi Awolowo University, Nigeria, whose designs were premised on the use of natural ventilation. The real value being added to both these buildings and the built environment in general is, however, being called to question. It has been observed that there may be an undesirable disconnect between the intended as well as the actual performance and use of these free running buildings. Tuohy and Murphy [7] observed that advanced buildings do not achieve their intended performance especially in relation to ventilation systems. Liping and Hien [6] corroborated this by reporting an increase in the use of mechanical ventilation systems in Singapore, which is a country where most of the building were designed to be naturally ventilated. This shows that despite the enormous time and other resources that are invested into making such buildings free running, users of the buildings may be adopting ventilation systems different from the designers' intent. This is presenting an undesirable paradoxical situation, which has not yet been fully addressed empirically. Foruzanmehr and Vellinga [9] studied the rationale behind this situation and remarked that, all around the world, vernacular traditions (which include passive cooling strategies offered by natural ventilation) are been associated with an outdated past and poverty. The study, however, faulted Bourgeois [10] and Heyman [11], * e-mail: [email protected] Sust. Build. 2, 1 (2017) © B.A. Orola et al., published by EDP Sciences, 2017 DOI: 10.1051/sbuild/2016007 Available online at: www.sustainable-buildings-journal.org This is an Open Access article distributed under the terms of the Creative Commons Attribution License (http://creativecommons.org/licenses/by/4.0), which permits unrestricted use, distribution, and reproduction in any medium, provided the original work is properly cited.
Transcript of Assessment of users' responses to air change rates in · PDF fileAssessment of users'...
Sust. Build. 2, 1 (2017)© B.A. Orola et al., published by EDP Sciences, 2017DOI: 10.1051/sbuild/2016007
Available online at:www.sustainable-buildings-journal.org
RESEARCH ARTICLE
Assessment of users' responses to air change rates in free runningoffice buildingsBode Abiodun Orola*, Kolawole Ajibola, Oyeyemi Oluwaseun Arowolo, and Ayomide Abiodun Omolola
Department of Architecture, Obafemi Awolowo University, Ile-Ife, Nigeria
* e-mail: o
This is an O
Received: 10 June 2016 / Accepted: 26 November 2016
Abstract.Often, building assessments do not account for users' social concerns in relation to buildings' physicalcharacteristics. This study, therefore, assessed the responses of free running office building users to the objectivemeasurements of air change rates in the spaces they occupy. This was done with a view to define a suitablequantitative expression for the social concerns of the users in building assessments, as well as with a view toexamine the relationships between the users' responses and the physical characteristics of free running buildings.Measurements were taken in eight low-rise office buildings regarding indoor/outdoor air parameters to capturethe air change rates in the buildings. These were done in 50 different spaces within the buildings at different floorlevels and different fenestration orientations. The air change rates were correlated along social and physicaldimensions with the responses of the occupants captured through questionnaire. Some relationships wereobserved among the social characteristics of the users and their rating of air change rates in the spaces, but nonewere statistically significant. Linear regression analysis, however, shows that one of the buildings' physicalcharacteristics has a strong relationship with the users' responses to air change rates.
Keywords: air change rate / natural ventilation / free running buildings / warm humid climate
1 Introduction
The importance of free running buildings to the builtenvironment cannot be over-emphasized. This is becauseout of all sectors of human endeavour; studies have shownthat the built environment contributes the greatestpercentage to the total global energy use [1–5]. This hasresulted in contemporaneous concerns over global warmingand escalating fossil fuel prices. This suggests that freerunning buildings have the greatest potential to mitigateglobal warming and its attendant negative effects on thesustainability of the built environment.
In view of the foregoing, building designers have beenexploring the possibility of using purely natural forces toventilate buildings in all climates. The built environmentis replete with such outstanding free running buildingsexpected to add desirable value to its sustainability. Forexample, in a study in Singapore, Liping andHien [6] statedthat 86% of residential buildings there were designed to benaturally ventilated. Similarly, Tuohy and Murphy [7]highlighted sustainable design features in some notablebuildings like the Environmental Office Building inGarston, England and the Great Glen House in Scotland.In addition, Olaniyan (1983) [8] featured many office
pen Access article distributed under the terms of the Creative Comwhich permits unrestricted use, distribution, and reproduction
buildings on the campus of Obafemi Awolowo University,Nigeria, whose designs were premised on the use of naturalventilation.
The real value being added to both these buildings andthe built environment in general is, however, being calledto question. It has been observed that there may be anundesirable disconnect between the intended as well asthe actual performance and use of these free runningbuildings. Tuohy and Murphy [7] observed that advancedbuildings do not achieve their intended performanceespecially in relation to ventilation systems. Liping andHien [6] corroborated this by reporting an increase in theuse of mechanical ventilation systems in Singapore, whichis a country where most of the building were designed tobe naturally ventilated. This shows that despite theenormous time and other resources that are invested intomaking such buildings free running, users of the buildingsmay be adopting ventilation systems different from thedesigners' intent. This is presenting an undesirableparadoxical situation, which has not yet been fullyaddressed empirically.
Foruzanmehr and Vellinga [9] studied the rationalebehind this situation and remarked that, all around theworld, vernacular traditions (which include passivecooling strategies offered by natural ventilation) arebeen associated with an outdated past and poverty. Thestudy, however, faulted Bourgeois [10] and Heyman [11],
mons Attribution License (http://creativecommons.org/licenses/by/4.0),in any medium, provided the original work is properly cited.

2 B.A. Orola et al.: Sust. Build. 2, 1 (2017)
whose argument suggested that passive cooling strategieslike the wind-catchers of the Middle East being replacedwith electro-mechanical cooling systems by their owners,just because they are not perceived to present a con-temporary and progressive outlook to life. Foruzanmehrand Vellinga [9] noted that this explanation onlyintuitively seems to make sense but is not based onactual research.
Furthermore, while rationalizing the often largedeviations between theoretically calculated and measuredcomfort in buildings, Roetzel et al. [12] stated that onemain reason is the fact that the theoretical calculationprocedures do not account for users' behaviour in relationto the characteristics of the local climate or the specificbuilding. This suggests that assessment of comfortventilation of building occupants should extend beyondbio-climatic issues.
In the same vein, in a study on social and environmentaldimension in tropical sustainable architecture, Bay andOng [13] observed that the challenge to define a moderncharacteristics style for tropical architecture is not just aclimatic issue but also one that is related to the problem ofadapting to the modern lifestyle, of the transformation oflocal cultures to the modern city. The study further statedthat while it is possible to retain enough of the vernacularfor residential designs to be naturally ventilated, otherbuilding typologies like offices and shopping centres havenot been so lucky.
After assessing environmental issues in buildingswithin the context of Olygays' [14] bio-climatic approachand Fanger's [15] concept of thermal comfort, which wasbased purely on physiological studies, Bay and Ong [13]concluded that physiological standards of comfort only donot translate readily to design. The study emphasized theinfluence of social and cultural dimensions in theapplication of building studies into architectural design,and observed that social–cultural concerns are yet to finda suitable quantitative expression in building assessments.It, therefore, recommended deeper reflections and moreresearch into the issues of tropical sustainable architec-ture that engages both the environmental and socialdimensions.
Similarly, Foruzanmehr and Vellinga [9] remarked thatonly a thorough examination of a variety of cultural andenvironmental variables and the way in which theydialectically interrelate in a particular local context hasthe potential to reveal the motivations behind the choicespeople make in relation to the continuation or abandon-ment of specific traditions. The study came up with anumber of both environmental and cultural factors thatinfluence the choices made by users of indoor spaceregarding comfort. It further stated that it is difficult toidentify the degree to which specific factors play a moredeterministic part than others because of the dynamic,complex and context-dependent way in which all thesefactors interrelate. The study concluded by calling for in-depth research on the dynamic and complex way in whichall the environmental, technical, social, cultural andeconomic dimensions are intricately related regardingcomfort of users in indoor spaces.
The foregoing, therefore, suggests that an assessment ofuse of ventilation systems that engages both environmentaland social dimensions in such free running buildings couldpresent an enhanced appreciation of the likely differencebetween intended against actual performance and use ofsuch buildings. The significance of such a study wasemphasized by Deuble and De dear [16], who studied theresponses of green occupants towards two green officebuildings in Sydney, Australia. The study highlighted theincreasing awareness to the psychological dimensions ofoccupant adaptation, such as attitudes, expectation andcontrol.
Since the primary requirement of ventilation systems isto meet specified airflow rates [17], this study, therefore,aimed at assessing the responses of free running officebuildings users to the objective measurements of air changerates in the spaces they occupy. This was done with a viewto define a suitable quantitative expression for the socialconcerns of the users in building assessments, as well aswith a view to examine the relationships between the users'responses and the physical characteristics of the freerunning buildings they occupy.
Different studies have used different approaches andmodels tostudyventilationrates inbuildings.Amongothers,Bastideetal. [18],MahdaviandProglhof [19] andAjibola [20]adopted the empirical models. Khoukhi et al. [21], Maatouk[22] and Sohn et al. [23] used themulti-zone networkmodels;some other studies were premised on computational fluiddynamics (CFD) models, whereas Livermore and Woods[24], Tapsoba et al. [25], Kang and Lee [26], Hummelgaardet al. [27] andStathopoulou et al. [28] employed either small-scale or full-scale experimental approaches. Each of thesemodels, however, has its own setbacks.
The empirical models are based on simple assumptions,one of which is that the same airflow rate and air velocitypermeate the entire building. This may be misleadingunder real situations. The multi-zone network modelsassume still air and uniform air temperature in a zone; thiscould cause significant errors in some cases. The longcalculation time for accurate prediction or evaluation maymake the study of practical cases using CFD models notfeasible (Santamouris andAllard [29]). According to Cheng[30], full-scale experimental approach has been givingrealistic predictions and evaluations of ventilation perfor-mance for buildings. It is however very expensive and timeconsuming.
In view of the above, this study, therefore, evaluatedthe air change rates within some spaces in the free runningbuildings within a university campus using the full-scaleexperimental approach with in-situ measurements,assessed the users' responses to the air change rates withinthe spaces in the buildings, and analysed the relationshipsbetween the air change rates and the users' responses in thespaces within the buildings.
2 The study areaThe study was carried out in the academic area ofObafemi Awolowo University, Nigeria. The universitycommunity is located within Ile-Ife, which is a small city

Fig. 1. Faculty of Administration building.
Fig. 2. University Hall Extension building.
B.A. Orola et al.: Sust. Build. 2, 1 (2017) 3
in South-Western Nigeria. It is located between latitude7°280 N and 7°340 N and longitudes 4°270 E and 4°350 Ewith an elevation of about 275m above sea level. Theclimatic data for the city showed that the climatic contextcombined high temperature (meanmax of 31.4 °C), highhumidity (meanmax of 83.3%) and low air velocity (meanmaxof 1.55m/s) with high precipitation (1691.1mm annual).The maximum temperatures are above 30 °C for all monthswith the exception of August and September. This showsthat the free runningofficebuildingsbeing studiedarewithinthe rain forest vegetation belt and a tropical thermalenvironment in a warm humid climatic zone.
Generally, all the buildings on the campus are orientatedlinearly from east to west, with main elevations havingoperable windows facing north and south to protect themfrom the sun, heat and glare and to ensure cross-ventilationby the prevailing breezes. All the eight buildings used for thestudy are within the central core of the university; theyare of either three or four floors each but different grossfloor areas. The buildings are all of the same fabric.Thewallsare of sandcrete unfilled cavity block with an overallcoefficient of heat transmission (U-value) of 1.0Wm�2K,
and the operable windows are of transparent glass with acoefficient of heat transmission of 5.8Wm�2K. As shown inFigures 1–4, sustainable design features meant to enhancetheir free running status are apparent in the buildings. Theseinclude large operable windows that are fully shaded fromdirect solar radiation, open ground floor to enhance airflow,and soft landscape elements lavishly employed to envelopeeach building. The facade of some of these free runningbuildings are, however, dotted with window unit air condi-tioners. This is suggesting that some of the users may beadoptingventilation systems thatare inoutrightdiscordancewith the designer's concept, resulting in unsightly buildingsand consequently an unpleasant cityscape.
The buildings are majorly occupied by academic andnon-academic staff of the university as well as students.The greater percentage of the occupants is of the black racelargely from the Yoruba socio-cultural group known fortraditional building styles quite different from that of thebuildings being studied. Hence the issue of the transfor-mation of local cultures to the modern city highlighted byBay and Ong [13] may have had strong influence on theirresponses.

Fig. 4. Faculty of Social Sciences building.
Fig. 3. Faculty of Education building.
4 B.A. Orola et al.: Sust. Build. 2, 1 (2017)
3 Methodology
The study used primary data majorly. The primary datawas obtained from three sources. First, the indoor andoutdoor air properties were captured using somemeasuringinstruments. The air velocity was measured with theLM-81AM compact vane anemometers along with Testo405-pocket-sized thermal anemometers particularly precisein the range between 0 and 2ms�1. The temperatureand relative humidity were measured by wireless colourweather stations with outdoor sensors by La CrosseTechnology. Its indoor temperature and relative humidityranges are 0–50 °C and 19% to 99% (RH), respectively. Itsoutdoor temperature and relative humidity ranges are�40 °C to 60 °C and 19% to 97% (RH), respectively. Theweather stations were used along with TIM 10 desktopCO2, Temperature meters and Relative humidity meters,which also measured CO2 concentrations. This has ameasuring range of 0–10,000 ppm for CO2, �10 °C to 60 °Cfor temperature, and 0.1% to 99.9% for relative humidity.It also has an accuracy of±40 ppm,±3% of reading for CO2,±0.6 °C for temperature and 5% for relative humidity. Its
response time is less than 2min for both CO2 andtemperature, whereas for relative humidity it is less than10min.
The data were all taken at about 1m from theworkstations and at the work plane of each indoor spacetaken to be 1.2m from the floor level. The data were alsotaken at 10min interval during the typical working hours ofthe space users which is between 8 am and 4 pm. These datawere taken with the help of hired field assistants during themonths of January to March 2015 being the most criticalperiod for natural ventilation as evident in the climaticdata of the study area.
Second, physical characteristics of the buildings wereobtained through physical measurement to obtain theexternal wall area, operable windows area, window to wallratio, window to floor ratio, distance to adjacent buildingsand occupancy ratio of the selected spaces.
Third, the subjective responses of the users of thebuildings in relation to the air change rates by the naturalventilation systems in the buildings were elicited through awell-structured, multiple-choice questionnaire which wasadministered with the help of hired field assistants.

Table 3.1. Main spaces and number of users of each building.
Offices Readingroom/library
Laboratory Classroom/lecture room
Seminarroom
Canteen Numberof users
Faculty of Arts (Humanities 1, 2 and 3) 121 2 2 8 2 – 1224Faculty of Law 49 – – 10 1 1 1040Faculty of Administration 71 2 – 3 1 1 484Faculty of Education 95 3 4 5 3 1 1112Faculty of Social Sciences 111 4 7 2 2 1 715University Hall Extension 164 – – – – – 492Total 611 11 13 28 9 4 5067
B.A. Orola et al.: Sust. Build. 2, 1 (2017) 5
There are a total of 676 relevant indoor spaces withinthe eight low-rise office buildings at main core of theuniversity campus (Elais and Owolabi [31]). Table 3.1shows a breakdown of the spaces and their users. Outof these, 7.5% of them were selected for the studycomprising offices, reading rooms, laboratories, class-room/lecture theatres and canteen. Stratified randomsampling technique was adopted to select 7.5% of the usersgiving a sample size of 375 respondents. A total of 375questionnaires were distributed with 319 being returned.The stratification for the respondents was based on statusof the space users, i.e. academic staff, non-academic staffand students. Stratification for the spaces was based onfenestration orientation and floor levels.
At the end of the data collection the air change rates inthe spaces for different times of the day were calculatedusing two methods. The first method was based on asimplified empirical model presented by British Standard[32] as described by Santamouris and Allard (page 64) [29].It is premised on the assumption that the airflow throughthe spaces is a two-directional flow. The model also ignoresall internal partitions. It shows that the air change per hour(N) in a space is estimated with the empirical models statedbelow:
N ¼ 3600Q=v; ð3:1Þwhere N is the air changes per hour; Q is the fresh airflowthrough the space (m3/s); and v is the volume of the space(m3).
The fresh airflow Q was calculated using both themeasured buildings physical characteristics and themeasured indoor/outdoor air properties. These includedthe surface area of the inlet and outlet openings, thepressure coefficient, the discharge coefficient stronglyrelated to the dimension of the openings, and the airvelocity. The second method calculated the air changerates based on carbon dioxide (CO2) measurements(Haverinen-Shaughnessy et al. [33]). According to Santa-mouris and Allard [29] this technique is efficient to estimatethe air change rates in buildings where the number ofoccupants, physical characteristics as well as the activitylevel of the occupants in the spaces are known. These areconditions satisfied by the spaces studied. Measured CO2
concentrations were then analysed using the equationbelow (Santamouris and Allard [29]).
V dC=dt ¼ QðCe � CÞ þ F ; ð3:2Þwhere V is the effective volume of the enclosure (m3), Q isthe specific airflow rate through the enclosure (m3 s�1), Ceis the external concentration (m3m�3), C is the internalconcentration (m3m�3), and F is the production of CO2 bythe occupants (m3m�1).
The results showed significant correlations between thetwo methods. The calculated air change rates were thencorrelated with the responses of the occupants of thebuilding spaces captured through questionnaire.
4 Results and discussion
4.1 Airflow rates in the selected spaces
The study found that about 52% of the spaces are havingair change rate that is less than 4 h�1. For spaces in thebuildings studied the acceptable air change rate per hour isbetween 4 and 6 h�1 (Szokolay [34]). Table 4.1 shows thedifferent categories of the air change rates in the selectedspaces and revealed that 48% of the selected spacesmet thisstandard whereas 52% fell below the standard during thestudy period.
A chi square test analysis revealed that the air changerates in the selected spaces are strongly related to theorientation of the external operable windows. Table 4.2shows that the entire cross ventilated spaces have their airchange rates falling either within the recommended rangeof 4–6 and beyond. Among single-sided ventilated spaceshowever, only 36% of them have air change rates within therecommended range.
This disagrees with the studies of Gratia et al. [35],which showed that single-sided ventilation is more efficientthan cross-ventilation. This disparity may be expectedbecause that study was carried out in the Belgian climatewhere outdoor air temperature is lower than indoors, atboth day and night, except for a few hours a year. This isdifferent from the warm humid climate in which this studywas carried out where outdoor air temperature is almostalways higher than indoors.
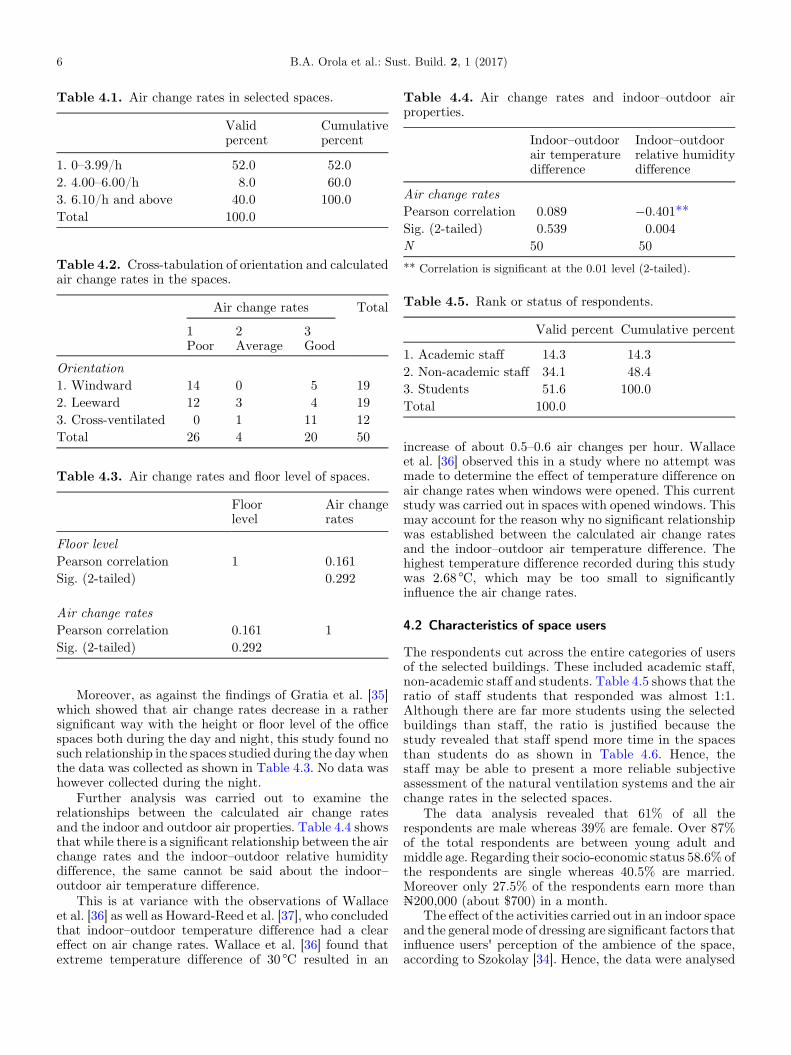
Table 4.1. Air change rates in selected spaces.
Validpercent
Cumulativepercent
1. 0–3.99/h 52.0 52.02. 4.00–6.00/h 8.0 60.03. 6.10/h and above 40.0 100.0Total 100.0
Table 4.2. Cross-tabulation of orientation and calculatedair change rates in the spaces.
Air change rates Total
1Poor
2Average
3Good
Orientation1. Windward 14 0 5 192. Leeward 12 3 4 193. Cross-ventilated 0 1 11 12Total 26 4 20 50
Table 4.3. Air change rates and floor level of spaces.
Floorlevel
Air changerates
Floor levelPearson correlation 1 0.161Sig. (2-tailed) 0.292
Air change ratesPearson correlation 0.161 1Sig. (2-tailed) 0.292
Table 4.4. Air change rates and indoor–outdoor airproperties.
Indoor–outdoorair temperaturedifference
Indoor–outdoorrelative humiditydifference
Air change ratesPearson correlation 0.089 �0.401**Sig. (2-tailed) 0.539 0.004N 50 50
** Correlation is significant at the 0.01 level (2-tailed).
Table 4.5. Rank or status of respondents.
Valid percent Cumulative percent
1. Academic staff 14.3 14.32. Non-academic staff 34.1 48.43. Students 51.6 100.0Total 100.0
6 B.A. Orola et al.: Sust. Build. 2, 1 (2017)
Moreover, as against the findings of Gratia et al. [35]which showed that air change rates decrease in a rathersignificant way with the height or floor level of the officespaces both during the day and night, this study found nosuch relationship in the spaces studied during the day whenthe data was collected as shown in Table 4.3. No data washowever collected during the night.
Further analysis was carried out to examine therelationships between the calculated air change ratesand the indoor and outdoor air properties. Table 4.4 showsthat while there is a significant relationship between the airchange rates and the indoor–outdoor relative humiditydifference, the same cannot be said about the indoor–outdoor air temperature difference.
This is at variance with the observations of Wallaceet al. [36] as well as Howard-Reed et al. [37], who concludedthat indoor–outdoor temperature difference had a cleareffect on air change rates. Wallace et al. [36] found thatextreme temperature difference of 30 °C resulted in an
increase of about 0.5–0.6 air changes per hour. Wallaceet al. [36] observed this in a study where no attempt wasmade to determine the effect of temperature difference onair change rates when windows were opened. This currentstudy was carried out in spaces with opened windows. Thismay account for the reason why no significant relationshipwas established between the calculated air change ratesand the indoor–outdoor air temperature difference. Thehighest temperature difference recorded during this studywas 2.68 °C, which may be too small to significantlyinfluence the air change rates.
4.2 Characteristics of space users
The respondents cut across the entire categories of usersof the selected buildings. These included academic staff,non-academic staff and students. Table 4.5 shows that theratio of staff students that responded was almost 1:1.Although there are far more students using the selectedbuildings than staff, the ratio is justified because thestudy revealed that staff spend more time in the spacesthan students do as shown in Table 4.6. Hence, thestaff may be able to present a more reliable subjectiveassessment of the natural ventilation systems and the airchange rates in the selected spaces.
The data analysis revealed that 61% of all therespondents are male whereas 39% are female. Over 87%of the total respondents are between young adult andmiddle age. Regarding their socio-economic status 58.6% ofthe respondents are single whereas 40.5% are married.Moreover only 27.5% of the respondents earn more than₦200,000 (about $700) in a month.
The effect of the activities carried out in an indoor spaceand the general mode of dressing are significant factors thatinfluence users' perception of the ambience of the space,according to Szokolay [34]. Hence, the data were analysed

Table 4.6. Average hours spent in space per day according to rank of respondents.
1–3 h 3–6 h 6–9 h 9–12 h Above 12 h Total
1. Academic staff 6 6 18 12 3 452. Non-academic staff 6 3 81 15 2 1073. Students 90 57 15 0 0 162Total 102 66 114 27 5 314
Table 4.7. Activities in selected spaces.
Valid percent Cumulative percent
Reading and writing 56.1 56.1Listening to lectures 29.2 85.4Others 14.6 100.0Total 100.0
B.A. Orola et al.: Sust. Build. 2, 1 (2017) 7
along these dimensions. Regarding the activities carriedout in the selected spaces the analysis showed that themajor ones are reading and writing as well as listening tolectures as shown in Table 4.7. These are sedentaryactivities that require minimal level of airflow for the spaceusers to be satisfied with the ambience.
Regarding the mode of dressing of users in the selectedspaces, 57.5% responded that they dress formally mosttimes they use their space. Out of these, 71% are staffswhereas 29% are students. Furthermore 42% of the usersresponded that they dress casually most times they usetheir space. Out of these, 84% are students whereas only16% are staff. It was earlier established that staff spendmore time in the selected spaces than students. This furthershows that it is this same category of respondents thatdresses formally most times in the space. The combinationof these factors may influence their subjective assessmentof the air change rates in the selected spaces.
Analysis further shows that 64% of the respondentspreferred a combination of both natural and mechanicalventilation systems in their spaces. This is followed bythose who preferred only natural ventilation systems with23%. It is significant to note that the least percentage ofrespondents, which is 12%, preferred only mechanicalventilation systems in their space. Table 4.8 shows theserelationships. This suggests that a significant percentage ofthe users ordinarily desired to maintain the free runningstatus of the buildings.
This is in line with the findings of Hummelgaard et al.[27] in a study of occupants' satisfaction in five mechani-cally and four naturally ventilated open-plan officebuildings. The study reported that 70% of the occupantsin naturally ventilated offices were generally satisfied withthe indoor environment as compared with 59% inmechanically ventilated offices. Among others studies,Seppänen and Fisk [38], Wargocki et al. [39] and Deubleand de Dear [16] gave similar indication. Most of thesestudies were not specific regarding a statistically significantjustification for this trend. This study is neither claiming to
be able to provide such justification. This study, however,observed that the low preference for only mechanicalventilation system by the respondents does not harmonizewith their attitude towards operable windows in the spaces.The possible explanations for this are discussed below.
Table 4.8 further revealed that the strong preference formechanical ventilation system was noticeable more amongrespondents who are academic staff. The preference was,however, not strong among non-academic staff andstudents. Table 4.8 shows that the percentage of thosewho preferred natural ventilation systems only in theirspace is the least among the academic staff, which is 16%.This is expected because a significant percentage amongacademic staff dress formally in the space as earlierconfirmed. This suggests that the specified air change rateof 4 h�1 for office buildings needs to be re-examined ifformal dressings are to be made desirable in free runningoffice buildings.
Regarding the user's attitude toward windows opening,the study observed that users were not opening the windows100% of the time of occupation as shown inTable 4.9. This isespecially sowith those along the corridors in both the singleand double banked buildings. The predominant reasonsgiven by the space users for this include operable windowsbeing at various stages of disrepair as well as avoidingdistractions, not from the activities at the street level butfrom the corridors. This identifies with the observation ofLongo et al. [40], who concluded that when the internalwindows are facing an indoor corridor in institutionalbuildings the natural ventilation of the spaces withinthe building is undermined. The measured drawings of thebuildings showed that the windows are below the eye level;this explainswhysomerespondentsgavedistractionand lackof privacy as reasons behind their reluctance to open them.Window opening has been identified in the literature as asignificant variable that could produce the greatest increasein air change rates in spaces (Wallace et al. [36]); Howard-Reed et al. [37]. Hence, the disparity between the occupants'desire tomaintainthefree runningstatusof thebuildingsandtheir attitude toward operablewindows in the spaces need tobe further explored.
4.3 Users' responses to the natural airflowrates within the selected spaces
The data collected from the field made respondents torate the air movement through the selected spaces whenonly natural ventilation system was in use in the spaces.Table 4.1 shows that only 40.6% of the respondents ratedthe air change rates in the spaces as good.
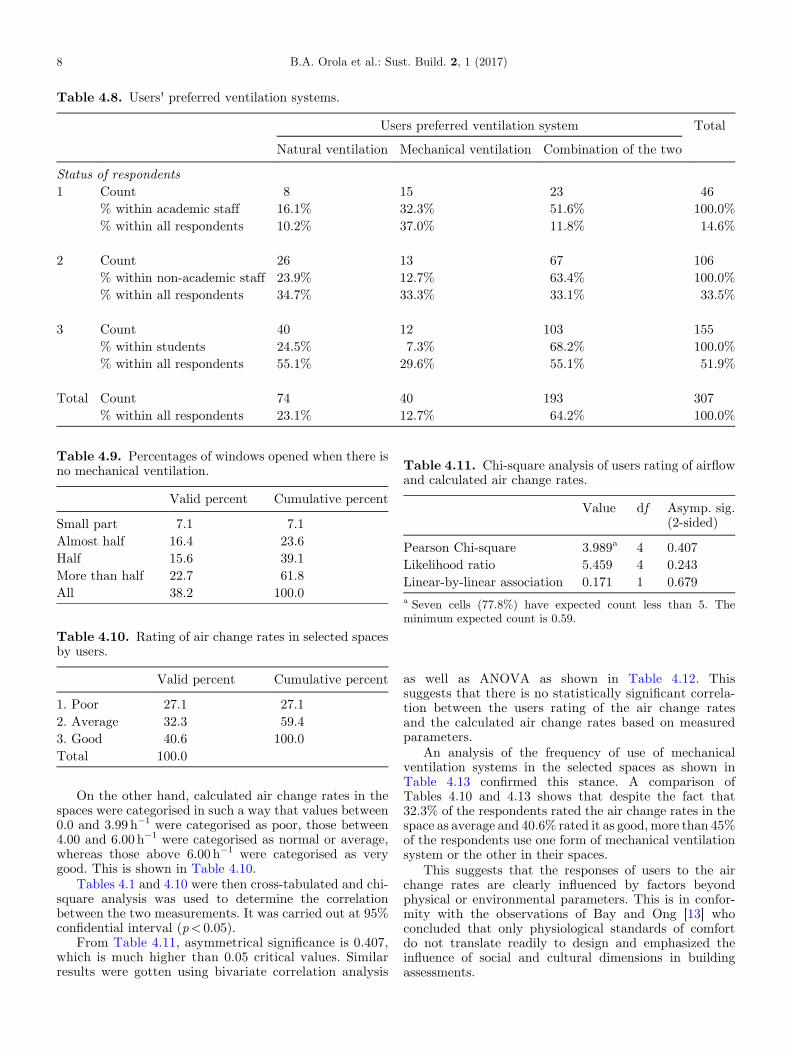
Table 4.8. Users' preferred ventilation systems.
Users preferred ventilation system Total
Natural ventilation Mechanical ventilation Combination of the two
Status of respondents1 Count 8 15 23 46
% within academic staff 16.1% 32.3% 51.6% 100.0%% within all respondents 10.2% 37.0% 11.8% 14.6%
2 Count 26 13 67 106% within non-academic staff 23.9% 12.7% 63.4% 100.0%% within all respondents 34.7% 33.3% 33.1% 33.5%
3 Count 40 12 103 155% within students 24.5% 7.3% 68.2% 100.0%% within all respondents 55.1% 29.6% 55.1% 51.9%
Total Count 74 40 193 307% within all respondents 23.1% 12.7% 64.2% 100.0%
Table 4.9. Percentages of windows opened when there isno mechanical ventilation.
Valid percent Cumulative percent
Small part 7.1 7.1Almost half 16.4 23.6Half 15.6 39.1More than half 22.7 61.8All 38.2 100.0
Table 4.10. Rating of air change rates in selected spacesby users.
Valid percent Cumulative percent
1. Poor 27.1 27.12. Average 32.3 59.43. Good 40.6 100.0Total 100.0
Table 4.11. Chi-square analysis of users rating of airflowand calculated air change rates.
Value df Asymp. sig.(2-sided)
Pearson Chi-square 3.989a 4 0.407Likelihood ratio 5.459 4 0.243Linear-by-linear association 0.171 1 0.679a Seven cells (77.8%) have expected count less than 5. Theminimum expected count is 0.59.
8 B.A. Orola et al.: Sust. Build. 2, 1 (2017)
On the other hand, calculated air change rates in thespaces were categorised in such a way that values between0.0 and 3.99 h�1 were categorised as poor, those between4.00 and 6.00 h�1 were categorised as normal or average,whereas those above 6.00 h�1 were categorised as verygood. This is shown in Table 4.10.
Tables 4.1 and 4.10 were then cross-tabulated and chi-square analysis was used to determine the correlationbetween the two measurements. It was carried out at 95%confidential interval (p< 0.05).
From Table 4.11, asymmetrical significance is 0.407,which is much higher than 0.05 critical values. Similarresults were gotten using bivariate correlation analysis
as well as ANOVA as shown in Table 4.12. Thissuggests that there is no statistically significant correla-tion between the users rating of the air change ratesand the calculated air change rates based on measuredparameters.
An analysis of the frequency of use of mechanicalventilation systems in the selected spaces as shown inTable 4.13 confirmed this stance. A comparison ofTables 4.10 and 4.13 shows that despite the fact that32.3% of the respondents rated the air change rates in thespace as average and 40.6% rated it as good, more than 45%of the respondents use one form of mechanical ventilationsystem or the other in their spaces.
This suggests that the responses of users to the airchange rates are clearly influenced by factors beyondphysical or environmental parameters. This is in confor-mity with the observations of Bay and Ong [13] whoconcluded that only physiological standards of comfortdo not translate readily to design and emphasized theinfluence of social and cultural dimensions in buildingassessments.

Table 4.12. Relationships between user's responses andcalculated air change rates.
Rating of air changerates in the spaces
Air change ratesPearson correlation �0.201Sig. (1-tailed) 0.093
Table 4.13. Use of mechanical ventilation systems inselected spaces.
Validpercent
Cumulativepercent
None 8.7 8.7Standing or table fan 4.8 13.5Ceiling fan 40.6 54.1Window unit air conditioner 24.0 78.2Split unit air conditioner 20.5 98.7Package unit air conditioner 1.3 100.0
Table 4.14. Relationships among user's responses, cal-culated airflow rates and the buildings' physical char-acteristics.
Users rating of naturalair movement in space
AirflowPearson correlation �0.201Sig. (1-tailed) 0.093
External window to external wall ratioPearson correlation �0.390**Sig. (1-tailed) 0.004
Window to floor ratioPearson correlation �0.355**Sig. (1-tailed) 0.008
** Correlation is significant at the 0.01 level (1-tailed).
B.A. Orola et al.: Sust. Build. 2, 1 (2017) 9
4.4 Relationships among air change rates, thebuildings' physical characteristics, and the users'responses.
Two measured parameters were used to examine thebuildings' physical characteristics in relation to thecalculated air change rates and the responses of the users.These are the window area to floor area ratio and theexternal window area to external wall area ratio ofthe spaces. Table 4.14 shows the result of a bivariatecorrelation analysis of these variables. The table shows
that the respondents' rating of the natural airflow inthe selected spaces is having an inverse significantrelationship with both parameters used to measure thebuildings physical characteristics at 0.01 level ofconfidence. When the rating of respondents is correlatedwith the measured air change rates, however, nostatistically significant relationship was observed evenat p< 0.05.
Furthermore, a linear regression analysis was carriedout with the users rating of the airflow in the spaces as thedependent variable, whereas the independent variables arethe measured air change rates, the window to floor ratio,and the window to wall ratio of the spaces. The regressionanalysis was done using stepwise method. The analysisshowed that two of the independent variables, namelymeasured airflow and the window to floor ratio of thespaces, have no significant relationship with the respond-ents rating of the airflow in the spaces, as are shown inTable 4.15.
It shows that their relationships with the respondentsrating of the airflow in the spaces is not significant at 95%confidence level because their levels of significance are 0.54and 0.18, respectively, whereas their t values are 0.619 and1.356, respectively.
Further analysis showed that none of the socialparameters of the users that were captured in the studyhave any significant relationship with the rating of airflowin the spaces by the respondents. Table 4.16 shows thestatistical value of some of these social variables. The linearregression analysis however shows that the window area towall area ratio has a strong relationship with therespondents rating of airflow in the spaces as shown inTable 4.17.
The social characteristics of the users captured in thisstudy were however not exhaustive. There might be someother users' social and psychological concerns, as highlight-ed by Deuble and De dear [16], having significant influenceon their responses to air change rates in such spaces. Theseneed to be further explored.
5 Conclusions
The study captured air change rates in some free runningoffice buildings and analysed its relationships with theresponses of their users both from physical and socialperspectives. It found that air change rates in the buildingsspaces were satisfactory, and hence a significant percentageof the users preferred either only natural ventilation or acombination of both natural and mechanical ventilationsystems in the spaces they occupy. A linear regressionanalysis shows that the window area to wall area ratio ofthe buildings' spaces has a strong relationship with theusers' responses to air change rates.
The study found that a couple of their social character-istics influenced their responses. First is their rank andstatus, which influenced their mode of dressing andconsequently their responses. Second is their need forprivacy and concentration in the spaces, which influencedthe extent to which the operable windows were beingutilised and consequently the air change rates in the spaces.
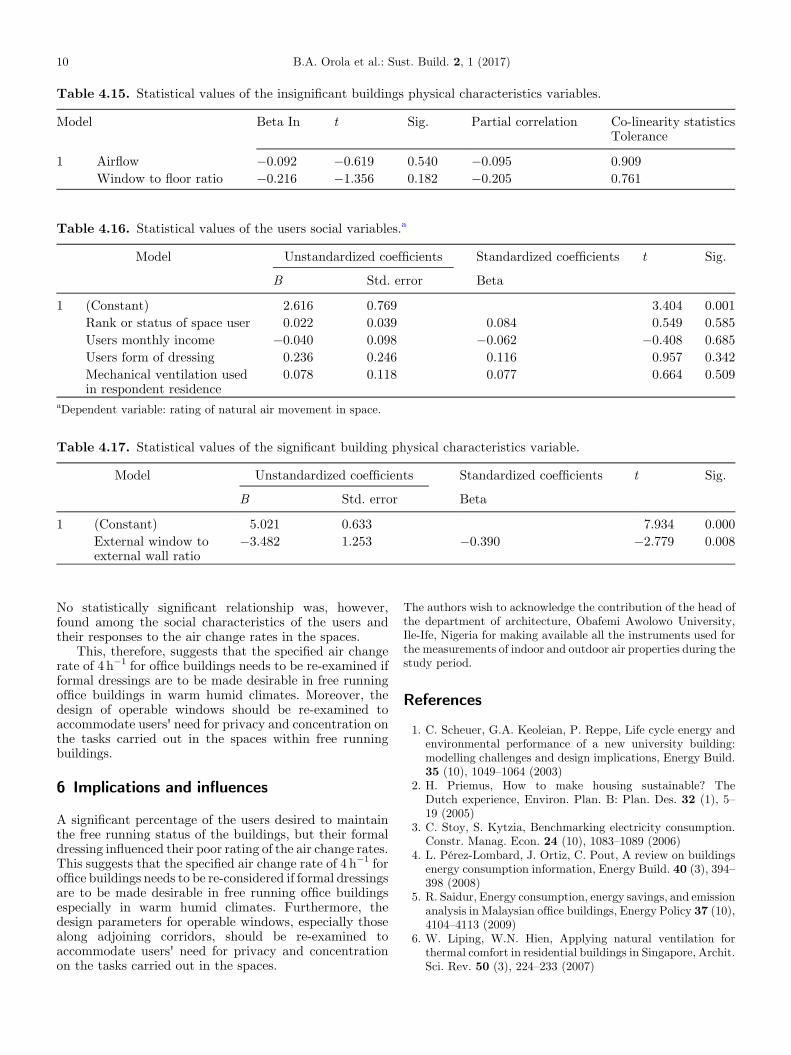
Table 4.15. Statistical values of the insignificant buildings physical characteristics variables.
Model Beta In t Sig. Partial correlation Co-linearity statisticsTolerance
1 Airflow �0.092 �0.619 0.540 �0.095 0.909Window to floor ratio �0.216 �1.356 0.182 �0.205 0.761
Table 4.16. Statistical values of the users social variables.a
Model Unstandardized coefficients Standardized coefficients t Sig.
B Std. error Beta
1 (Constant) 2.616 0.769 3.404 0.001Rank or status of space user 0.022 0.039 0.084 0.549 0.585Users monthly income �0.040 0.098 �0.062 �0.408 0.685Users form of dressing 0.236 0.246 0.116 0.957 0.342Mechanical ventilation usedin respondent residence
0.078 0.118 0.077 0.664 0.509
aDependent variable: rating of natural air movement in space.
Table 4.17. Statistical values of the significant building physical characteristics variable.
Model Unstandardized coefficients Standardized coefficients t Sig.
B Std. error Beta
1 (Constant) 5.021 0.633 7.934 0.000External window toexternal wall ratio
�3.482 1.253 �0.390 �2.779 0.008
10 B.A. Orola et al.: Sust. Build. 2, 1 (2017)
No statistically significant relationship was, however,found among the social characteristics of the users andtheir responses to the air change rates in the spaces.
This, therefore, suggests that the specified air changerate of 4 h�1 for office buildings needs to be re-examined ifformal dressings are to be made desirable in free runningoffice buildings in warm humid climates. Moreover, thedesign of operable windows should be re-examined toaccommodate users' need for privacy and concentration onthe tasks carried out in the spaces within free runningbuildings.
6 Implications and influences
A significant percentage of the users desired to maintainthe free running status of the buildings, but their formaldressing influenced their poor rating of the air change rates.This suggests that the specified air change rate of 4 h�1 foroffice buildings needs to be re-considered if formal dressingsare to be made desirable in free running office buildingsespecially in warm humid climates. Furthermore, thedesign parameters for operable windows, especially thosealong adjoining corridors, should be re-examined toaccommodate users' need for privacy and concentrationon the tasks carried out in the spaces.
The authors wish to acknowledge the contribution of the head ofthe department of architecture, Obafemi Awolowo University,Ile-Ife, Nigeria for making available all the instruments used forthe measurements of indoor and outdoor air properties during thestudy period.
References
1. C. Scheuer, G.A. Keoleian, P. Reppe, Life cycle energy andenvironmental performance of a new university building:modelling challenges and design implications, Energy Build.35 (10), 1049–1064 (2003)
2. H. Priemus, How to make housing sustainable? TheDutch experience, Environ. Plan. B: Plan. Des. 32 (1), 5–19 (2005)
3. C. Stoy, S. Kytzia, Benchmarking electricity consumption.Constr. Manag. Econ. 24 (10), 1083–1089 (2006)
4. L. Pérez-Lombard, J. Ortiz, C. Pout, A review on buildingsenergy consumption information, Energy Build. 40 (3), 394–398 (2008)
5. R. Saidur, Energy consumption, energy savings, and emissionanalysis in Malaysian office buildings, Energy Policy 37 (10),4104–4113 (2009)
6. W. Liping, W.N. Hien, Applying natural ventilation forthermal comfort in residential buildings in Singapore, Archit.Sci. Rev. 50 (3), 224–233 (2007)

B.A. Orola et al.: Sust. Build. 2, 1 (2017) 11
7. P.G. Tuohy, G.B. Murphy, Why advanced buildings don'twork? in 7th Windsor Conference: the Changing Context ofComfort in an Unpredictable World (2012)
8. R.A. Olaniyan, Ife University in colour: a panorama ofAfrica's most beautiful campus (KNP Group, 1983)
9. A. Foruzanmehr, M. Vellinga, Vernacular architecture:questions of comfort and practicability, Build. Res. Inf. 39(3), 274–285 (2011)
10. J.L. Bourgeois, Spectacular vernacular: the adobe tradition(Aperture Foundation, New York, NY, 1989)
11. J.M.C. Heyman, Changes in house construction materials inBorder Mexico: four research propositions about commoditi-zation, Hum. Organ. 53 (2), 132–142 (1994)
12. A. Roetzel, A. Tsangrassoulis, U. Dietrich, S. Busching, Areview of occupant control on natural ventilation, Renew.Sustain. Energy Rev. 14 (3), 1001–1013 (2010)
13. J.H. Bay, B.L. Ong (eds.), Tropical sustainable architecture(Routledge, 2007)
14. A. Olygay, V. Olygay, Design with climate, bioclimaticapproach to architectural regionalism (Princeton UniversityPress, Princeton, 1963)
15. P.O. Fanger, Thermal comfort. Analysis and applications inenvironmental engineering. Thermal comfort. Analysis andapplications in environmental engineering (Danish TechnicalPress, Copenhagen, 1970)
16. M.P. Deuble, R.J. de Dear, Green occupants for greenbuildings: the missing link? Build. Environ. 56, 21–27 (2012)
17. P. Wouters, N. Heijmans, C. Delmotte, L. Vandaele,Classification of hybrid ventilation concepts, IEA Annex35, 2 (1999)
18. A. Bastide, F. Allard, H. Boyer, Natural ventilation – a newmethod based on the Walton model applied to cross-ventilated buildings having two large external openings,Int. J. Vent. 6 (3), 195–206 (2007)
19. A. Mahdavi, C. Pröglhöf, Amodel-based approach to naturalventilation, Build. Environ. 43 (4), 620–627 (2008)
20. K.Ajibola,Ventilationofspaces inawarm,humidclimate –casestudyofsomehousingtypes,Renew.Energy10(1),61–70(1997)
21. M. Khoukhi, H. Yoshino, J. Liu, The effect of the wind speedvelocity on the stack pressure in medium-rise buildings incold region of China, Build. Environ. 42 (3), 1081 (2007)
22. K. Maatouk, A simplified procedure to investigate airflowpatterns inside tall buildings using COMIS, Arch. Sci. Rev.50 (4), 365–369 (2007)
23. M.D. Sohn, M.G. Apte, R.G. Sextro, A.C.K. Lai, Predictingsize-resolved particle behaviour in multi-zone buildings,Atmos. Environ. 41 (7), 1473–1482 (2007)
24. S.R. Livermore, A.W. Woods, Natural ventilation of abuilding with heating at multiple levels, Build. Environ. 42(3), 1417–1430 (2007)
25. M. Tapsoba, J. Moureh, D. Flick, Airflow patterns in a slot-ventilated enclosure partially loaded with empty slottedboxes, Int. J. Heat Fluid Flow 28 (5), 963–977 (2007)
26. J.H. Kang, S.J. Lee, Improvement of natural ventilation in alarge factory building using a louver ventilator, Build.Environ. 43 (12), 2132–2141 (2008)
27. J. Hummelgaard, P. Juhl, K.O. Sæbjörnsson, G. Clausen,J. Toftum, G. Langkilde, Indoor air quality and occupantsatisfaction in five mechanically and four naturallyventilated open-plan office buildings, Build. Environ. 42(12), 4051–4058 (2007)
28. O.I. Stathopoulou, V.D. Assimakopoulos, H.A. Flocas, C.G.Helmis, An experimental study of air quality inside largeathletic halls, Build. Environ. 43 (5), 834–848 (2008)
29. M. Santamouris, F. Allard (eds.), Natural ventilation inbuildings: a design handbook (Earthscan, 1998)
30. Q. Chen, Ventilation performance prediction for buildings: amethod overview and recent applications, Build. Environ. 44(4), 848–858 (2009)
31. P.O. Elias, A.A. Owolabi, The inventory of academic landuses and central administration areas in the ObafemiAwolowo University, Ile-Ife (Physical Planning and Devel-opment Unit, O.A.U., Ile-Ife, 2013)
32. British Standards Institution, Code of practice forventilation principles and designing for natural ventilation(BSI, 1991)
33. U. Haverinen-Shaughnessy, M. Turunen, J. Metsämuuronen,J. Palonen, T. Putus, J. Kurnitski, R. Shaughnessy, Healthand academic performance of sixth grade students and indoorenvironmental quality in Finnish elementary schools, Br. J.Educ. Res. 2 (1), 42–58 (2012)
34. S.V. Szokolay, Introduction to architectural science: the basisof sustainable design (Routledge, 2014)
35. E. Gratia, I. Bruyere, A. De Herde, How to use naturalventilation to cool narrow office buildings, Build. Environ. 39(10), 1157–1170 (2004)
36. L.A. Wallace, S.J. Emmerich, C. Howard-Reed, Continuousmeasurements of air change rates in an occupied house for1 year: the effect of temperature, wind, fans, and windows,J. Expo. Anal. Environ. Epidemiol. 12 (4), 296–306(2002)
37. C. Howard-Reed, L.A. Wallace, W.R. Ott, The effect ofopening windows on air change rates in two homes, J. AirWaste Manag. Assoc. 52 (2), 147–159 (2002)
38. O.A. Seppänen, W.J. Fisk, Summary of human responses toventilation, Indoor Air 14 (s7), 102–118 (2004)
39. P. Wargocki, J. Sundell, W. Bischof, G. Brundrett, P.O.Fanger, F. Gyntelberg, P.Wouters, Ventilation and health innon-industrial indoor environments: report from a EuropeanMultidisciplinary Scientific Consensus Meeting (EURO-VEN), Indoor Air 12 (2), 113–128 (2002)
40. T.A. Longo, A.P. Melo, E. Ghisi, Thermal comfort analysisof a naturally ventilated building, in Proceedings of BuildingSimulation 12th Conference of International BuildingPerformance Simulation Association, Sydney (2011),pp. 2004–2010
Cite this article as: B.A. Orola, K. Ajibola, O.O. Arowolo and A.A. Omolola: Assessment of users' responses to air change rates infree running office buildings. Sust. Build. 2, 1 (2017).