Alternative metrics of journal impact based on usage data: The bX project.
Graduate Theses and Dissertations Iowa State University Capstones, Theses andDissertations
2013
Assessment of usage of hydrogen as alternative fuelinto NETPLANLizbeth del Carmen Gonzalez MarciagaIowa State University
Follow this and additional works at: https://lib.dr.iastate.edu/etd
Part of the Computer Engineering Commons, Economics Commons, Electrical and ElectronicsCommons, and the Natural Resource Economics Commons
This Thesis is brought to you for free and open access by the Iowa State University Capstones, Theses and Dissertations at Iowa State University DigitalRepository. It has been accepted for inclusion in Graduate Theses and Dissertations by an authorized administrator of Iowa State University DigitalRepository. For more information, please contact [email protected].
Recommended CitationGonzalez Marciaga, Lizbeth del Carmen, "Assessment of usage of hydrogen as alternative fuel into NETPLAN" (2013). GraduateTheses and Dissertations. 12996.https://lib.dr.iastate.edu/etd/12996
Assessment of usage of hydrogen as alternative fuel into NETPLAN
by
Lizbeth Del Carmen Gonzalez Marciaga
A thesis submitted to the graduate faculty
In partial fulfillment of the requirements for the degree of
MASTER OF SCIENCE
Major: Electrical Engineering
Program of Study Committee: James D. McCalley, Major Professor
Dionysios C. Aliprantis Iver E. Anderson
Iowa State University
Ames, Iowa
2013
Copyright © Lizbeth Del Carmen Gonzalez Marciaga, 2013. All rights reserved

ii
TABLE OF CONTENTS
LIST OF FIGURES ..................................................................................................... vi
LIST OF TABLES ........................................................................................................ x
ACKNOWLEDGEMENTS ........................................................................................ xii
CHAPTER 1. INTRODUCTION ................................................................................ 1
1.1 Motivation ........................................................................................................... 1
1.2 Objectives ........................................................................................................... 6
1.3 Thesis Organization .............................................................................................6
CHAPTER 2. CURRENT USE AND HYDROGEN POTENTIAL RESOURCE
IN USA ......................................................................................................................... 7
2.1 Overview ............................................................................................................. 7
2.2 Hydrogen Current and Future Markets ............................................................... 8
2.3 Hydrogen Potential in USA .............................................................................. 12
2.3.1 Natural Gas Potential ................................................................................. 15
2.3.2 Coal Potential ............................................................................................. 18
2.3.3 Nuclear Potential ........................................................................................ 20
2.3.4 Wind Potential ........................................................................................... 23
2.3.5 Solar Potential ............................................................................................ 26
2.3.5.1 Photovoltaic Systems .......................................................................... 28
2.3.5.2 Concentrated Solar Thermal Energy ................................................... 28
2.3.5.3 Photolytic Process ............................................................................... 32
2.3.6 Biomass Potential....................................................................................... 34

iii
CHAPTER 3. HYDROGEN ECONOMY .................................................................. 37
3.1 Overview ........................................................................................................... 37
3.2 Hydrogen as a transportation fuel ..................................................................... 37
3.3 Hydrogen Production ........................................................................................ 40
3.3.1 Steam Reforming Process .......................................................................... 41
3.3.2 Partial Oxidation Process ........................................................................... 43
3.3.3 Auto thermal Reforming Process (ATR) ................................................... 44
3.3.4 Electrolysis Process ................................................................................... 44
3.3.4.1 Alkaline Electrolyte ............................................................................ 45
3.3.4.2 Polymer Electrolyte Membrane (PEM) Electrolyzer .......................... 48
3.3.5 Thermochemical and Other Advance Processes ........................................ 48
3.3.5.1Thermo-chemical Process: ................................................................... 51
3.3.5.2 Electromechanical Processes .............................................................. 54
3.3.6 Biomass to Hydrogen ................................................................................. 59
3.3.6.1 Thermo-chemical Processes................................................................ 60
3.3.6.2 Biological Hydrogen Production (BioH2) ........................................... 62
3.4 Hydrogen Production Technology Overview ................................................... 64
CHAPTER 4. HYDROGEN DELIVERY, STORAGE AND FUELING
INFRASTRUCTURE ................................................................................................. 68
4.1 Overview ........................................................................................................... 68
4.2 Hydrogen Delivery Systems ............................................................................. 68
4.2.1 Delivery of Compressed Hydrogen ........................................................... 70
iv
4.2.2 Delivery of Liquid Hydrogen..................................................................... 72
4.2.3 Gaseous Hydrogen by Pipeline .................................................................. 74
4.2.4 Hydrogen Delivery by Rail ........................................................................ 76
4.3 Hydrogen Fueling Stations ............................................................................... 77
4.4 Hydrogen Storage ............................................................................................. 82
4.4.1 Compressed Hydrogen ............................................................................... 83
4.4.2 Liquid Hydrogen ........................................................................................ 83
4.4.3 Metal Hydrides........................................................................................... 83
CHAPTER 5. END USE TECHNOLOGIES ............................................................ 85
5.1 Introduction ....................................................................................................... 85
5.2 Hydrogen Fuel Cell ........................................................................................... 85
5.2.1 Fuel Cell Operation .................................................................................... 87
5.2.2 Types of Fuel Cells .................................................................................... 89
5.2.3 Fuel-Cell Vehicle Applications.................................................................. 92
5.2.4 Onboard Storage Systems .......................................................................... 96
CHAPTER 6. STUDY OF HYDROGEN FUEL INTO NETPLAN ........................ 101
6.1 Introduction ..................................................................................................... 101
6.2 NETPLAN ...................................................................................................... 104
6.2.1 Modeling framework in NETPLAN ........................................................ 106
6.2.2 Energy Modeling ..................................................................................... 107
6.2.3 Transportation Modeling ......................................................................... 110
6.2.4 Summary of the systems .......................................................................... 111
v
6.2.5 General cost minimization formulation ................................................... 113
6.3 Description of Data ......................................................................................... 113
6.3.1 Cost of the Fuel Cell Vehicles ............................................................................................ 122
6.4 Hydrogen Modeling Approach within NETPLAN ......................................... 124
6.5 Hydrogen Assumptions Analysis and Results into NETPLAN ....................... 128
6.5.1 Results ...................................................................................................... 130
CHAPTER 7. CONCLUSION AND FUTURE WORK .......................................... 150
7.1 Conclusions ..................................................................................................... 150
7.2 Future Work .................................................................................................... 151
BIBLIOGRAPHY ..................................................................................................... 152
vi
LIST OF FIGURES
Figure 1: Primary Energy Consumption by Source and Sector ............................................... 1
Figure 2: Transition to the Hydrogen Economy ....................................................................... 4
Figure 3: Hydrogen Markets as Part of the Overall Energy System ........................................ 5
Figure 4: Industrial Hydrogen Facilities in the U.S. ................................................................. 9
Figure 5: Oil Refining and Production of Ammonia and Methanol ....................................... 10
Figure 6 : Hydrogen Potential from Renewable Energy Resource ......................................... 14
Figure 7: Hydrogen Potential from Natural Gas ..................................................................... 17
Figure 8: Hydrogen Potential from Coal ............................................................................... 19
Figure 9: Hydrogen Potential from Nuclear Power ............................................................... 22
Figure 10: Hydrogen Potential from Wind ............................................................................. 24
Figure 11 : Hydrogen Potential from Solar............................................................................. 27
Figure 12: Thermochemical Routes of Hydrogen Production using CSP .............................. 29
Figure 13: Solar Cracking Schematic Diagram ..................................................................... 30
Figure 14 : Solar Reforming/Gasification Schematic Diagram .............................................. 32
Figure 15: Total Primary Energy Consumption in 2009 in the U.S. ..................................... 35
Figure 16: Hydrogen Potential from Biomass ...................................................................... 36
Figure 17: Overview of Potential Hydrogen Production ....................................................... 41
Figure 18: Steam Reforming Plan Diagrams ......................................................................... 42
Figure 19: Partial Oxidation Process ..................................................................................... 43
Figure 20: Alkaline Water Electrolyzer .................................................................................. 46
Figure 21: Unipolar Electrolysis Unit .................................................................................... 47
Figure 22: Bipolar Electrolysis Units .................................................................................... 47
vii
Figure 23: Hydrogen and Nuclear Technologies ................................................................... 49
Figure 24: Sulfur Iodine Cycle ............................................................................................... 53
Figure 25: Nuclear Hydrogen Plant Using High Temperature Electrolysis ........................... 55
Figure 26: Energy vs. Temperature in a High Temperature Electrolysis Process ................. 56
Figure 27: Pathways from Biomass to Hydrogen .................................................................. 59
Figure 28: Centralized Hydrogen Production from Biomass Gasification ............................. 61
Figure 29: Timeframe to Market Distributed and Central Production Plants ......................... 67
Figure 30: Compressed Hydrogen Delivery Pathways ........................................................... 71
Figure 31: Liquid Hydrogen Delivery Pathways .................................................................... 73
Figure 32: Pipeline Delivery Options ..................................................................................... 75
Figure 33: Hydrogen Rail Delivery Pathways ........................................................................ 77
Figure 34: Proposed Hydrogen Fueling Stations in the U.S. .................................................. 81
Figure 35: Hydrogen Energy Application Areas ................................................................... 86
Figure 36: Fuel Cell Operation ............................................................................................... 88
Figure 37: Principal Components of Fuel Cell Vehicles ........................................................ 93
Figure 38: Well to Wheels Greenhouse Gas Emissions ......................................................... 95
Figure 39: Well-to-Wheels Petroleum Energy Use ............................................................... 96
Figure 40: Onboard Hydrogen Storage Systems for Light-duty Vehicles .............................. 98
Figure 41: Current Vehicular Storage Systems for Light-duty Vehicles ................................ 99
Figure 42: Conceptual representation of the energy and transportation systems ................ 105
Figure 43: Proposed model that integrates the energy and transportation systems at
two levels ............................................................................................................. 107
viii
Figure 44: Energy commodity flows from source to sink for energy modeling in
NETPLAN ........................................................................................................... 108
Figure 45: Decomposition of transportation arc into infrastructure and fleet ...................... 111
Figure 46: Central plants for production, delivery and dispensing hydrogen into FCV ....... 116
Figure 47: Investment cost (millions $/kg/hr) of the pathways analyzed ............................. 117
Figure 48: Shows the CO2 Emissions to Atmosphere for Central Stations ......................... 119
Figure 49: Cost of a fuel cell through the years ................................................................... 122
Figure 50: Hydrogen Network analyzed into NETPLAN .................................................... 124
Figure 51: Hydrogen Supply Region into NETPLAN .......................................................... 126
Figure 52: Investment of Fuel Cell Vehicles
(Millions Vehicles vs. Millions $/ Thousands of Vehicles) ................................. 131
Figure 53: Deployment of gasoline vehicles by zone into NETPLAN ................................ 132
Figure 54: Hydrogen Infrastructure Capacity needed for NETPLAN. ................................. 133
Figure 55: FCV Investment due to different FCV prices ..................................................... 134
Figure 56: Gasoline Vehicles Invesment during the years due to differents FCV prices. .... 134
Figure 57: CO2 Emissions from the Electric Power Plants due to different investment
cost of FCV ........................................................................................................... 136
Figure 58: CO2 emissions from all light-duty vehicles (LDV) due to different
investment cost of FCV ....................................................................................... 136
Figure 59: CO2 Emissions from Electric Power and Passenger Vehicles due to different
investment cost for FCV ...................................................................................... 137
Figure 60: Investment of Fuel Cell Vehicles due to different price of gasoline ................... 138
Figure 61: CO2 Emissions from Electric Power Plant due to different gasoline price ........ 139
ix
Figure 62: CO2 Emissions from Ligh-duty vehicles due to different gasoline price ........... 139
Figure 63: FCV investment due to different price of gasoline at 0$/metric ton ................... 141
Figure 64: FCV investment due to different price of gasoline at 30$/metric ton ................. 141
Figure 65: FCV investment due to different price of gasoline at 100$/metric ton ............... 142
Figure 66: CO2 Emissions from Electric Power Plants due to different
gasoline price at 0$/metric ton ............................................................................. 143
Figure 67: CO2 Emissions from Ligh-duty vehicles and Electric Power Plants due to
different gasoline price at 0$/metric ton ............................................................... 144
Figure 68: CO2 Emissions from Electric Power Plants due to different gasoline
price at 30$/metric ton .......................................................................................... 145
Figure 69: CO2 Emissions from Ligh-duty vehicles and Electric Power Plants due to
different gasoline price at 30$/metric ton ............................................................. 145
Figure 70: CO2 Emissions from Electric Power Plants due to different
gasoline price at 100$/metric ton ......................................................................... 146
Figure 71: CO2 Emissions from Ligh-duty vehicles and Electric Power Plants
due to different gasoline price at 100$/metric ton ............................................... 147
Figure 72: FCV investment at 0$/metric ton ........................................................................ 147
Figure 73: FCV investment at 30$/metric ton ...................................................................... 148
Figure 74: FCV investment at 100$/metric ton .................................................................... 148
Figure 75: PHEV investment at 30$/metric ton .................................................................... 149

x
LIST OF TABLES
Table 1: Estimate Hydrogen Production by Business Sector ................................................... 8
Table 2: Estimated U.S. Hydrogen Production Capacity ....................................................... 11
Table 3: Hydrogen Demand Scenarios for Transportation ..................................................... 12
Table 4: Hydrogen Potential in the U.S. ................................................................................. 15
Table 5: Advantages and Disadvantages of Nuclear Energy ................................................. 23
Table 6: Solar Hydrogen Production Technologies ............................................................... 34
Table 7: Physical Properties of Hydrogen ............................................................................. 38
Table 8: Properties of Hydrogen and Other Fuels ................................................................. 40
Table 9: Nuclear-derived Energy Carriers for Transportation ............................................... 50
Table 10: Nuclear Hydrogen Production Process .................................................................. 58
Table 11: Shows the advantages and disadvantages of the two main
categories shows above ............................................................................................ 60
Table 12: Challenges and Advantages of Biological Hydrogen Production Processes ......... 63
Table 13: Principal Technologies for Hydrogen Production .................................................. 65
Table 14: Compressed Gas Truck Delivery System Characteristics ..................................... 72
Table 15: Liquid Hydrogen Delivery System Characteristics ................................................ 74
Table 16: Pipelines Cost Equations for Hydrogen .................................................................. 76
Table 17: Hydrogen Fueling Stations Overview .................................................................... 79
Table 18: Standard Stations Configurations and Costs........................................................... 82
Table 19: Main Characteristics of Fuel Cells ......................................................................... 90
Table 20: PEM Fuel Cells Present and Future Target ............................................................ 91
Table 21: Light-duty Vehicle Parameters ............................................................................... 94
xi
Table 22: Onboard Storage Hydrogen System Challenges................................................... 100
Table 23: Network structure applied to the energy system in NETPLAN ........................... 109
Table 24: Summary of modeled systems .............................................................................. 112
Table 25: Hydrogen Pathways Analyzed .............................................................................. 114
Table 26: Hydrogen Pathways Economics Parameters for Central Stations ....................... 120
Table 27: Hydrogen Pathways Economics Parameters for Delivery and Dispensing Units 121
Table 28: Regional Representation for Hydrogen Economy into NETPLAN. .................... 125
Table 29: Node and Arcs by subsystems ............................................................................. 127
Table 30: Shows the assumption taking into account in NETPLAN.................................... 129
xii
ACKNOWLEDGEMENTS
First and foremost I want to thank my advisor Dr. James McCalley for his help,
guidance, and encouragement during my research. I am deeply indebted to him.
I would like to thank my committee members for their efforts and contributions: Dr.
Dionysios Aliprantis and Dr. Iver E. Anderson.
I gratefully acknowledge the funding sources that made my thesis work possible: The
National Bureau of Science, Technology and Innovation (SENACYT), the National
Government of Panama and National Science Foundation under Grant No. 0835989, “21st
Century National Energy and Transportation Infrastructures: Balancing Sustainability, Costs,
& Resiliency (NETSCORE21)”.
I would like to thank my sisters Lerisbeth and Hypatia, my mother Eneida, my
family and my friends for all their love and encouragement.
Last but not least, I would like to dedicate this thesis to my father Antonio.I would
like to thanks to my father for all his love and advice. Thanks for teach me that the education
is the best legacy that a parent can give to a child.
1
CHAPTER 1. INTRODUCTION
1.1 Motivation
The electric power and the transportation sectors, two interdependent infrastructures,
are the largest energy consuming sectors and the greatest contributors to carbon emissions in
the U.S.
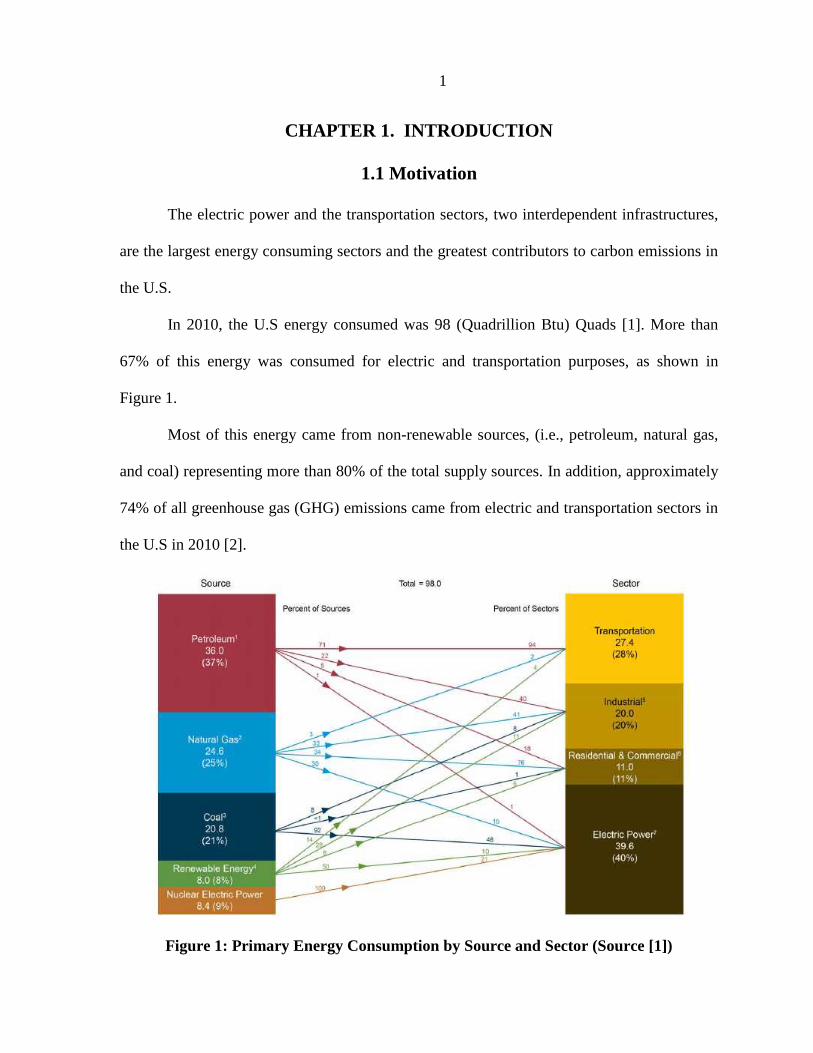
In 2010, the U.S energy consumed was 98 (Quadrillion Btu) Quads [1]. More than
67% of this energy was consumed for electric and transportation purposes, as shown in
Figure 1.
Most of this energy came from non-renewable sources, (i.e., petroleum, natural gas,
and coal) representing more than 80% of the total supply sources. In addition, approximately
74% of all greenhouse gas (GHG) emissions came from electric and transportation sectors in
the U.S in 2010 [2].
Figure 1: Primary Energy Consumption by Source and Sector (Source [1])
2
As seen in Figure 1, the transportation sector relies almost entirely on refined
petroleum products, accounting for over two-thirds of the oil used in the US. The U.S. light-
duty transportation fleet (with over 225 million vehicles) requires over eight million barrels
of oil each day [3]. Unfortunately, most of the petroleum consumed in the U.S. is imported
and is expected to rise gradually for the near future.
The issues mentioned above motivates interest to replace current energy-related
technologies with cleaner ones that support sustainable global economic growth including
reduction of the impacts on air quality and potential effects of greenhouse gas emissions for
the near, mid and long term future [4].
One of the solutions proposed is the use of hydrogen (H2) as an energy carrier.
Hydrogen is being considered for its use as an energy carrier for stationary power and
transportation markets. It can be used with a very high efficiency and near-zero emissions at
the point of use [5].
Currently, the potential application of hydrogen as energy carrier is focused on the
transportation sector through the use of hydrogen powered fuel cell vehicles (FCV). The
advantage of using FCVs instead of internal combustion engines (ICEs) powered with
gasoline is that when hydrogen is combusted only water vapor is emitted, unlike ICE that
emits CO2.
The term hydrogen economy received a dramatic boost when U.S. president George
W. Bush proposed a major initiative in his State of the Union address in January 2003. The
amount of $1.2 billion was proposed by President Bush to invest in the hydrogen initiative in
order to reverse America dependence on foreign oil and reduce greenhouse gas emissions [3].
President Bush stated in [3]:
3
“With a new national commitment, our scientists and engineers will overcome
obstacles…so that the first car driven by a child born today could be powered by hydrogen,
and pollution-free. Join me in this important innovation to make our air significantly cleaner,
and our country much less dependent on foreign sources of energy”
Hydrogen, similar to electricity, is a secondary energy carrier that can be derived
from a variety of primary sources, including fossil fuels, renewable, and nuclear power.
Currently, hydrogen is used mainly for producing ammonia (used in fertilizer) and to
lower the sulfur content for the petrochemical sectors. Unfortunately, most of the hydrogen
that is produced comes from non-renewable energy.
The widespread use of hydrogen as a major energy carrier will require considerable
breakthroughs in several aspects of the U.S. energy system from production through end-use.
The design and implementation of new hydrogen infrastructure is needed since there is no
hydrogen infrastructure system today, unlike systems such as electricity, natural gas or
gasoline, for example. In addition, the consumer is reluctant to purchase a vehicle if the
infrastructure is not already in place. The famous “chicken and egg” (demand/supply)
problem needs to be overcome in order that hydrogen can become an attractive alternative
fuel for the future.
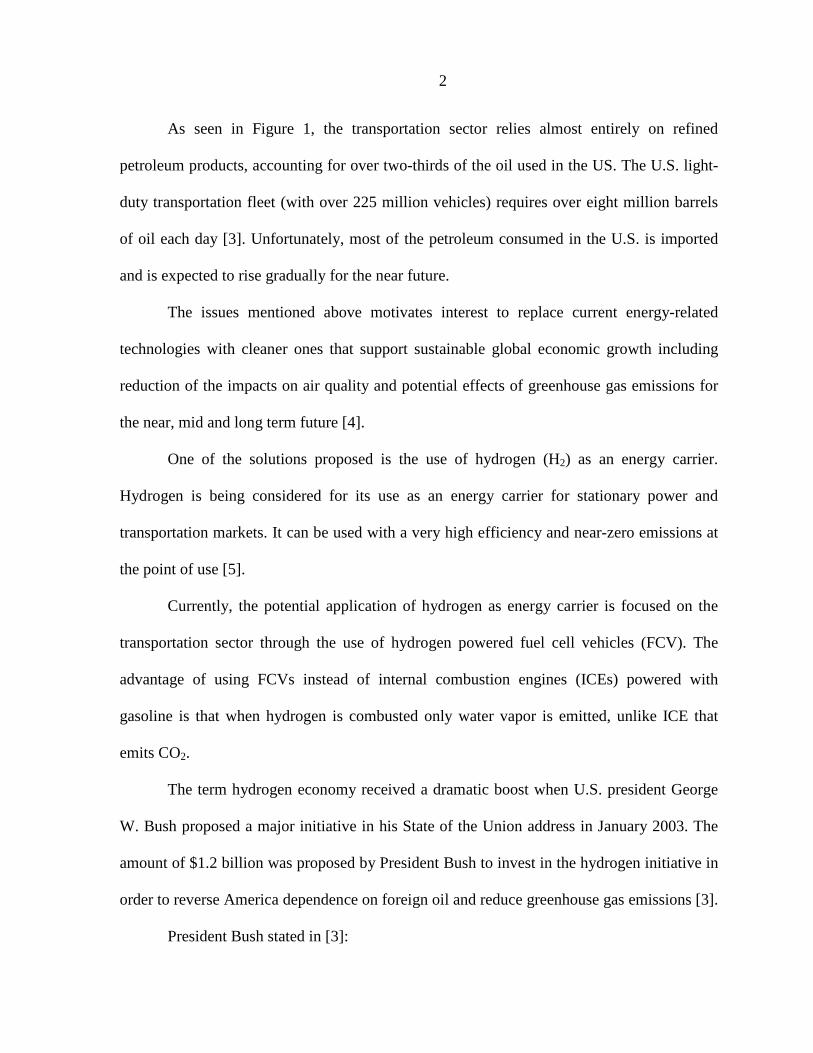
Extensive researches are being conducting for the implementation of hydrogen as an
alternative fuel, as represented by [4], [6], [7] and [8]. The implementation of hydrogen as a
fuel will not happen overnight; one way in which this transition might occur is presented in
Figure 2, which illustrates that is will likely take decades in order to be integrated into the
energy mix.
4
Figure 2: Transition to the Hydrogen Economy (Source [4])
According to [6] there are considerable aspects that need to be considered when
assessing future commercial hydrogen as a viable long-term alternative solution. For
example: cost, operability, environmental impacts, safety and social implications are some
attributes that need to be assessed. Also, there are important questions regarding when, where
and how these technological options, some of which exist and some of which are still in
development, will be implemented. Use of hydrogen cannot be analyzed in isolation.
Operation of hydrogen infrastructure is done only in interaction with the overall energy
system, as a shown in Figure 3.

5
Figure 3: Hydrogen Markets as Part of the Overall Energy System (Source [9])
Following this line of thought, the 21st Century National Energy and Transportation
Infrastructures–Balancing Sustainability, Costs, and Resiliency project (NETSCORE 21 for
short), funded by the National Science Foundation, was developed in order to respond to the
lack of tools, knowledge, and perspective in designing a national system that integrates
energy and transportation, considering the interdependencies between them as well as new
energy supply technologies, sustainability and resiliency for a long term investment [10].
The goal of the NETSCORE 21 project is to identify optimal infrastructure designs in
terms of future power generation technologies, energy transport and storage, and hybrid-
electric transportation systems to achieve desirable balance between sustainability, costs, and
resiliency. As a result, the project has been able to develop a tool called NETPLAN that is
able to model and analyze long-term investment strategies for the transportation and energy
systems [11] that account for interdependencies between them.
6
This thesis reports on work done to assess the use of hydrogen as an alternative fuel.
The program NETPLAN is used to make this assessment.
1.2 Objectives
The objectives of this work are summarized as follow:
1. Identify the production, delivery, storage and application technologies for
hydrogen as alternatives fuel;
2. Identify the potential resources available for hydrogen production in the U.S;
3. Develop a long term investment for assessing hydrogen fuel;
4. Evaluate different scenarios for the implementation of fuel cell vehicles.
1.3 Thesis Organization
The following thesis is organized in 7 chapters. The first chapter describes the
motivation for this work as well as the goal of the NETSCORE 21 project, and the
objectives. The second chapter presents information concerning the current use and potential
resource of hydrogen in the U.S. The third chapter introduces hydrogen as a transportation
fuel, and described its production processes. The fourth chapter presents the infrastructure
required for the hydrogen economy. The fifth chapter explains the end-use technologies for
the applications of the hydrogen as a fuel. The sixth chapter describes the NETPLAN tools,
how they are used, and results for the long-term investment assessment for the hydrogen
systems. Finally, the seventh chapter concludes and provides recommendations for future
work.
7
CHAPTER 2. CURRENT USE AND HYDROGEN POTENTIAL
RESOURCE IN USA
2.1 Overview
Hydrogen is being considered as an alternative clean fuel for a sustainable future.
Similar to electricity, hydrogen is a secondary energy carrier that can be produced from any
primary energy source such as coal, natural gas, oil, biomass, solar, wind, hydro, and nuclear
power. Its introduction in the energy mix will result in profound environmental benefits,
such as reduction on air pollution, greenhouse emissions, and energy supply security;
especially in the transportation sector.
Hydrogen is a large and emergent industry. Based on [12] worldwide, 50 million tons
of hydrogen, equivalent to about 170 million tons of petroleum, was produced in 2004, and
the production is increasing by about 10% every year. Worldwide hydrogen production is
mainly used in the following areas: approximately 60% to produce ammonia for use in
fertilizer manufacturing and 40% in chemical, refinery and petrochemical sectors [12].
According to [13] around 11 million metric tons of hydrogen is produced in the U.S each
year. This is sufficient to power 20-30 million cars or about 5-8 million homes.
This chapter describes the current hydrogen market and the hydrogen potential in the
U.S based on primary energy resource available.
8
2.2 Hydrogen Current and Future Markets
Worldwide, hydrogen is consumed in the following sectors: 61% for ammonia
production, 23% oil refining and 9 % to methanol. The U.S consumes about 20% of the total
global hydrogen production [12].
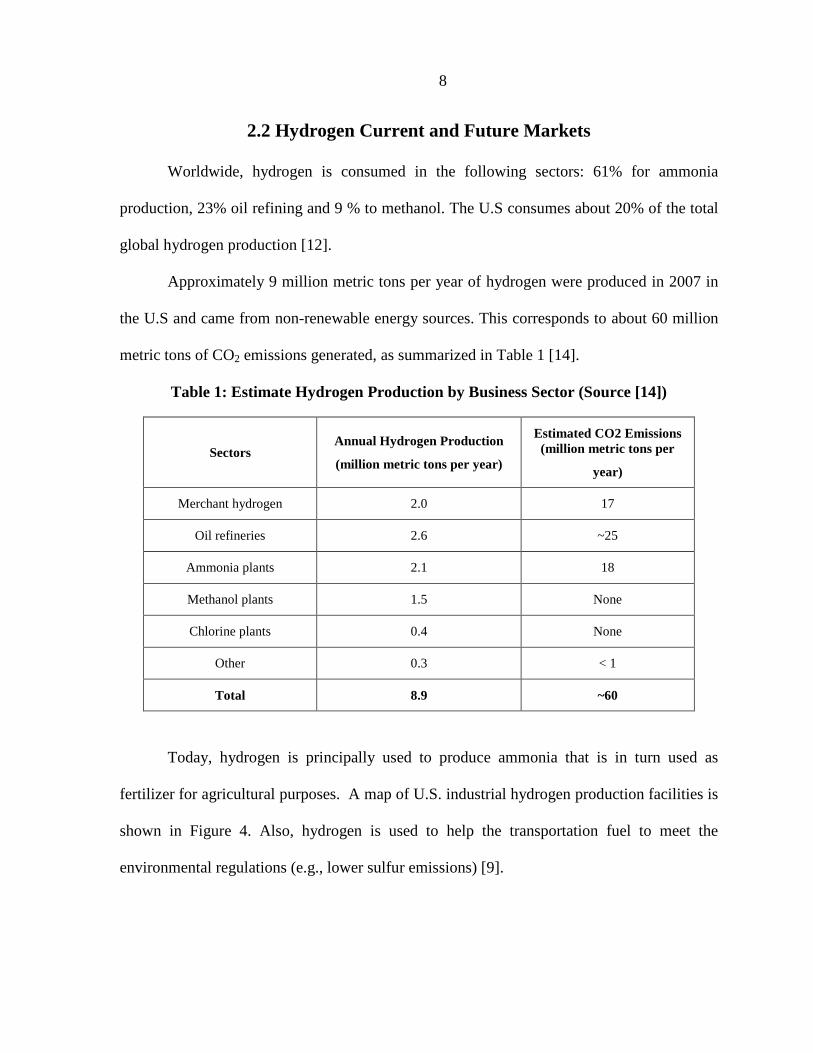
Approximately 9 million metric tons per year of hydrogen were produced in 2007 in
the U.S and came from non-renewable energy sources. This corresponds to about 60 million
metric tons of CO2 emissions generated, as summarized in Table 1 [14].
Table 1: Estimate Hydrogen Production by Business Sector (Source [14])
Sectors Annual Hydrogen Production
(million metric tons per year)
Estimated CO2 Emissions (million metric tons per
year)
Merchant hydrogen 2.0 17
Oil refineries 2.6 ~25
Ammonia plants 2.1 18
Methanol plants 1.5 None
Chlorine plants 0.4 None
Other 0.3 < 1
Total 8.9 ~60
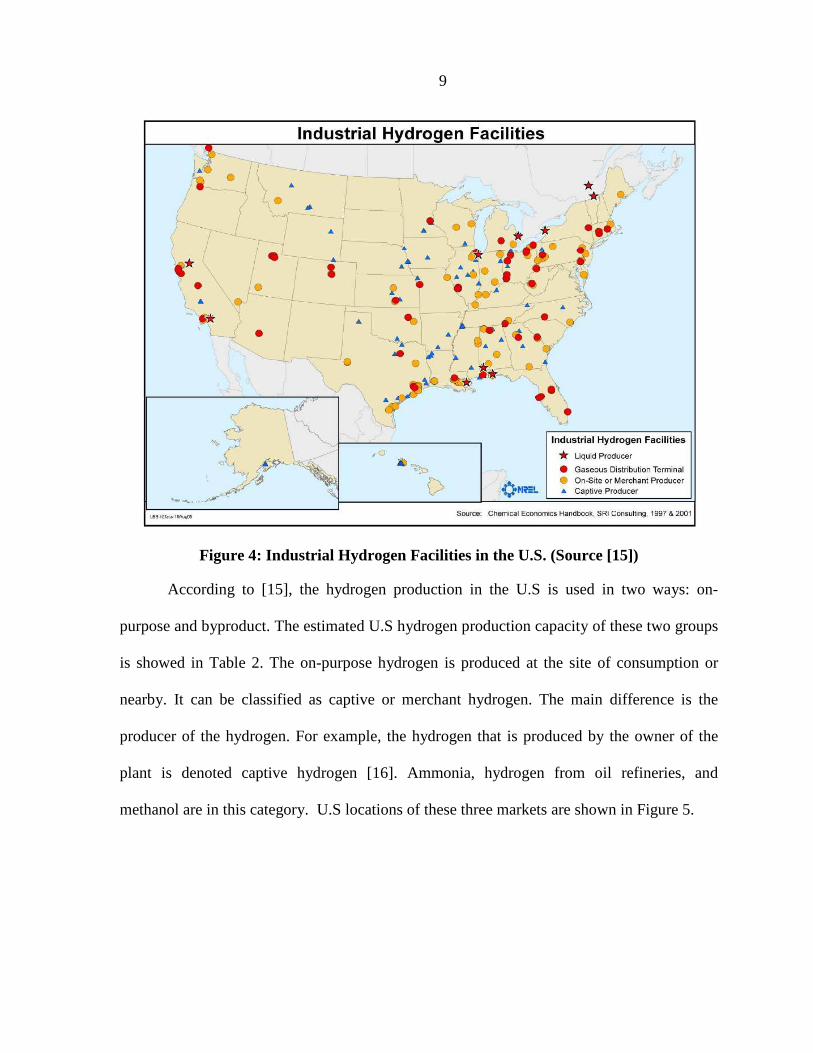
Today, hydrogen is principally used to produce ammonia that is in turn used as
fertilizer for agricultural purposes. A map of U.S. industrial hydrogen production facilities is
shown in Figure 4. Also, hydrogen is used to help the transportation fuel to meet the
environmental regulations (e.g., lower sulfur emissions) [9].
9
Figure 4: Industrial Hydrogen Facilities in the U.S. (Source [15])
According to [15], the hydrogen production in the U.S is used in two ways: on-
purpose and byproduct. The estimated U.S hydrogen production capacity of these two groups
is showed in Table 2. The on-purpose hydrogen is produced at the site of consumption or
nearby. It can be classified as captive or merchant hydrogen. The main difference is the
producer of the hydrogen. For example, the hydrogen that is produced by the owner of the
plant is denoted captive hydrogen [16]. Ammonia, hydrogen from oil refineries, and
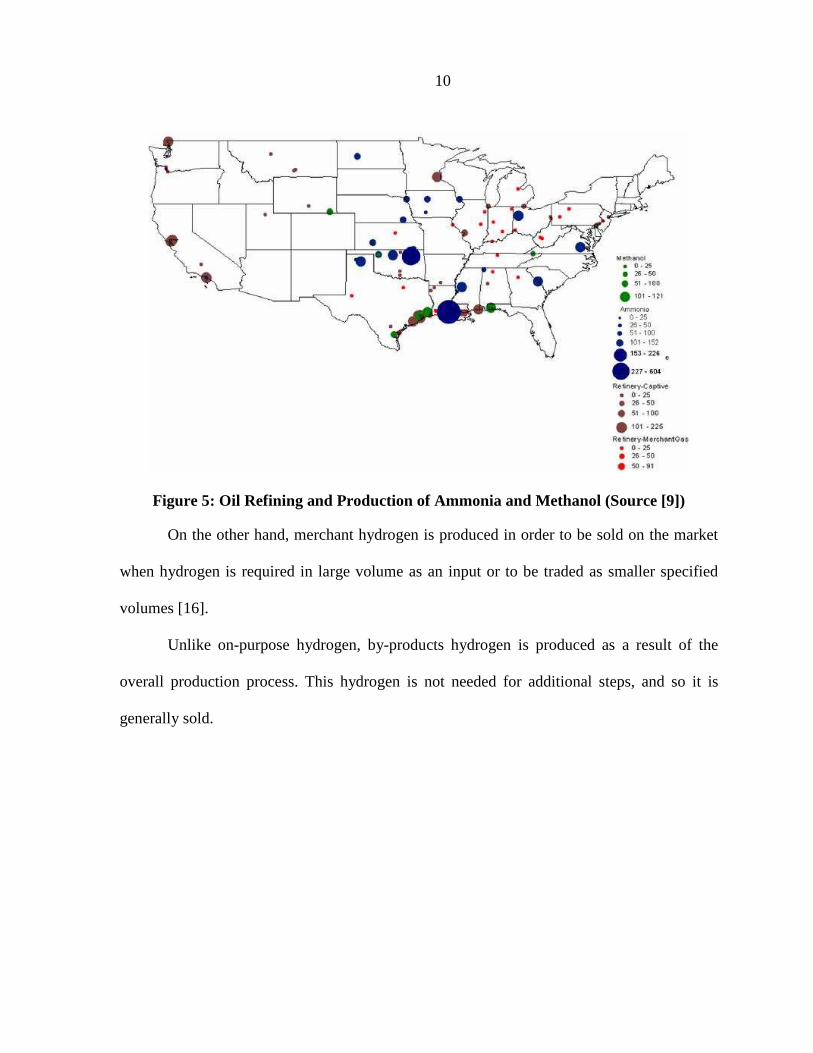
methanol are in this category. U.S locations of these three markets are shown in Figure 5.
10
Figure 5: Oil Refining and Production of Ammonia and Methanol (Source [9])
On the other hand, merchant hydrogen is produced in order to be sold on the market
when hydrogen is required in large volume as an input or to be traded as smaller specified
volumes [16].
Unlike on-purpose hydrogen, by-products hydrogen is produced as a result of the
overall production process. This hydrogen is not needed for additional steps, and so it is
generally sold.
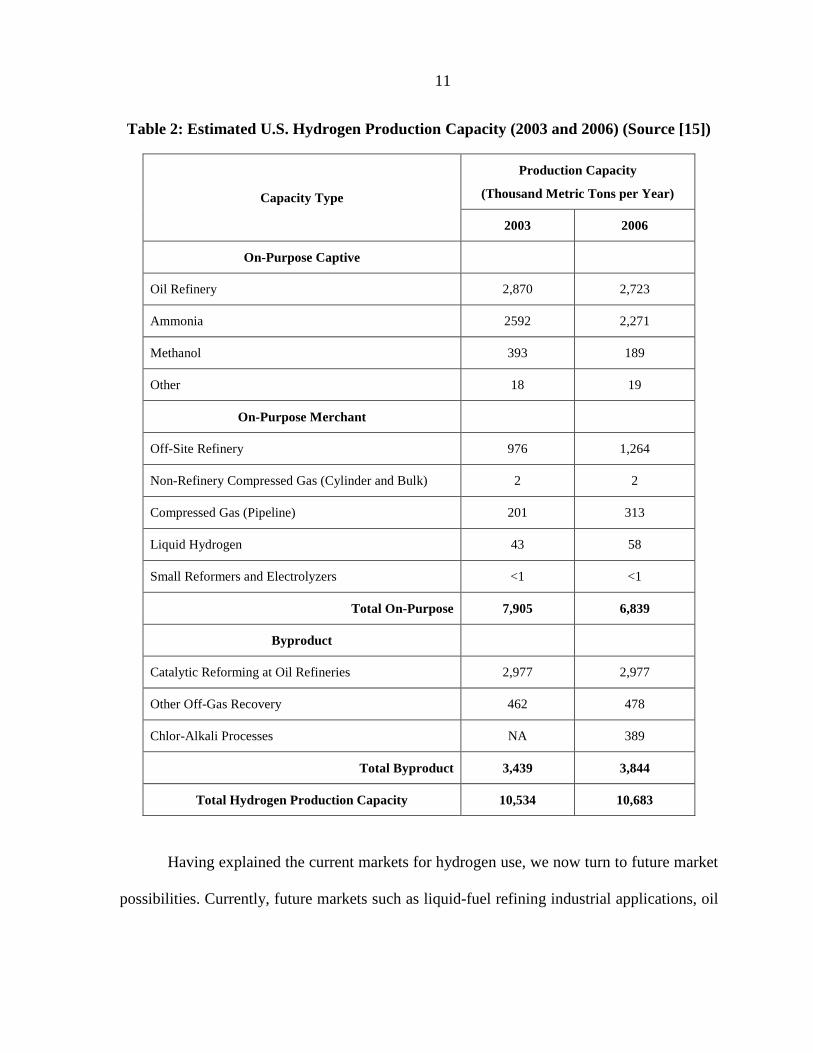
11
Table 2: Estimated U.S. Hydrogen Production Capacity (2003 and 2006) (Source [15])
Capacity Type
Production Capacity
(Thousand Metric Tons per Year)
2003 2006
On-Purpose Captive
Oil Refinery 2,870 2,723
Ammonia 2592 2,271
Methanol 393 189
Other 18 19
On-Purpose Merchant
Off-Site Refinery 976 1,264
Non-Refinery Compressed Gas (Cylinder and Bulk) 2 2
Compressed Gas (Pipeline) 201 313
Liquid Hydrogen 43 58
Small Reformers and Electrolyzers <1 <1
Total On-Purpose 7,905 6,839
Byproduct
Catalytic Reforming at Oil Refineries 2,977 2,977
Other Off-Gas Recovery 462 478
Chlor-Alkali Processes NA 389
Total Byproduct 3,439 3,844
Total Hydrogen Production Capacity 10,534 10,683
Having explained the current markets for hydrogen use, we now turn to future market
possibilities. Currently, future markets such as liquid-fuel refining industrial applications, oil
12
and tar sand processing, mobile fuel cells applications, and others are being considered for a
medium to long-term hydrogen production.
For instance, the coal liquefaction and shale oil (medium-to-long term) market will
require 37.7 Mt of hydrogen in order to replace the entire current U.S crude oil from coal
liquefaction. Hydrogen can also be used for electricity market (medium-to-long term) to
replace natural gas for peak electricity production. Finally, hydrogen can be used within the
transportation market via fuel cell vehicles. This last application is perhaps the most
promising and is expected to be the main application for hydrogen [9]. Yet, it would require
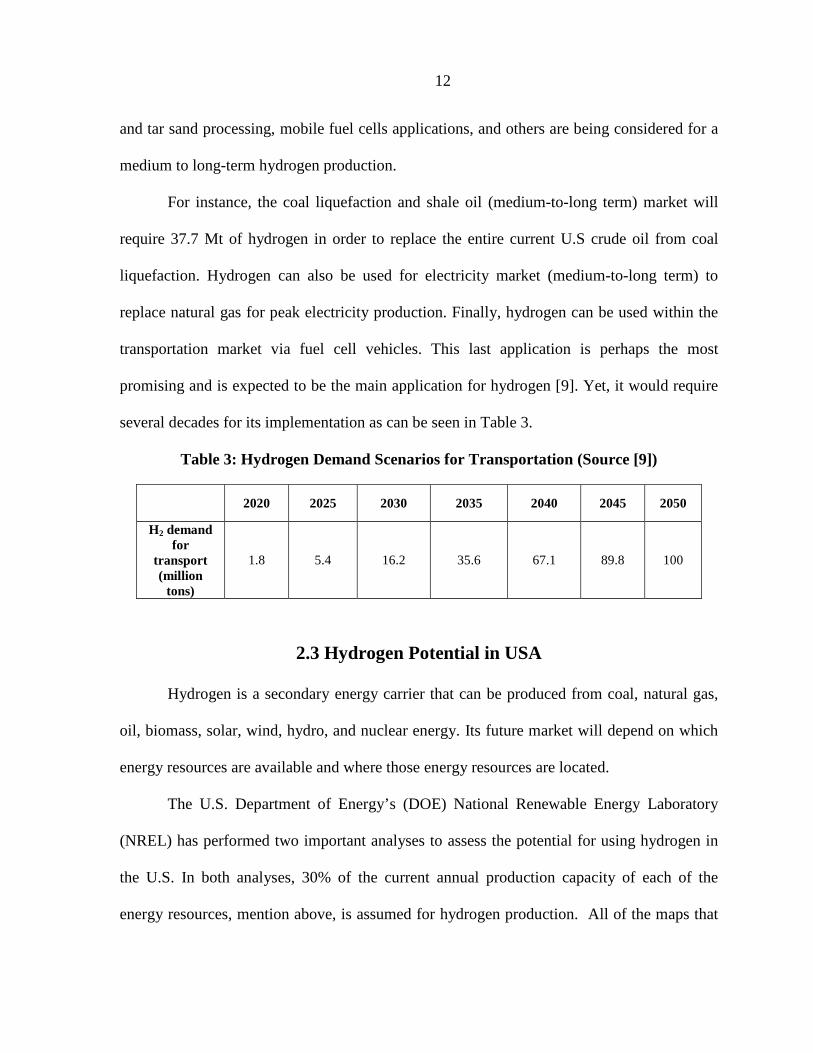
several decades for its implementation as can be seen in Table 3.
Table 3: Hydrogen Demand Scenarios for Transportation (Source [9])
2020 2025 2030 2035 2040 2045 2050
H2 demand for
transport (million
tons)
1.8 5.4 16.2 35.6 67.1 89.8 100
2.3 Hydrogen Potential in USA
Hydrogen is a secondary energy carrier that can be produced from coal, natural gas,
oil, biomass, solar, wind, hydro, and nuclear energy. Its future market will depend on which
energy resources are available and where those energy resources are located.
The U.S. Department of Energy’s (DOE) National Renewable Energy Laboratory
(NREL) has performed two important analyses to assess the potential for using hydrogen in
the U.S. In both analyses, 30% of the current annual production capacity of each of the
energy resources, mention above, is assumed for hydrogen production. All of the maps that
13
are presented in the following sections correspond to the resource assessment from the
NREL.
The first resource assessment is described in a technical report titled Hydrogen
Potential from Coal, Natural Gas, Nuclear, and Hydro Power; here, it is estimated that the
quantity of hydrogen that could be produced from coal, natural gas, nuclear, and hydro power
by county in the US is approximately 72.5 million metric tons per year [17]. This would
displace 80% of the 396 million tons of gasoline used in the US in 2007.
The second resource assessment, titled Potential for Hydrogen Production from Key
Renewable Resources in the United States, estimated the potential for hydrogen production
from key renewable resources (onshore wind, solar photovoltaic, and biomass) by county for
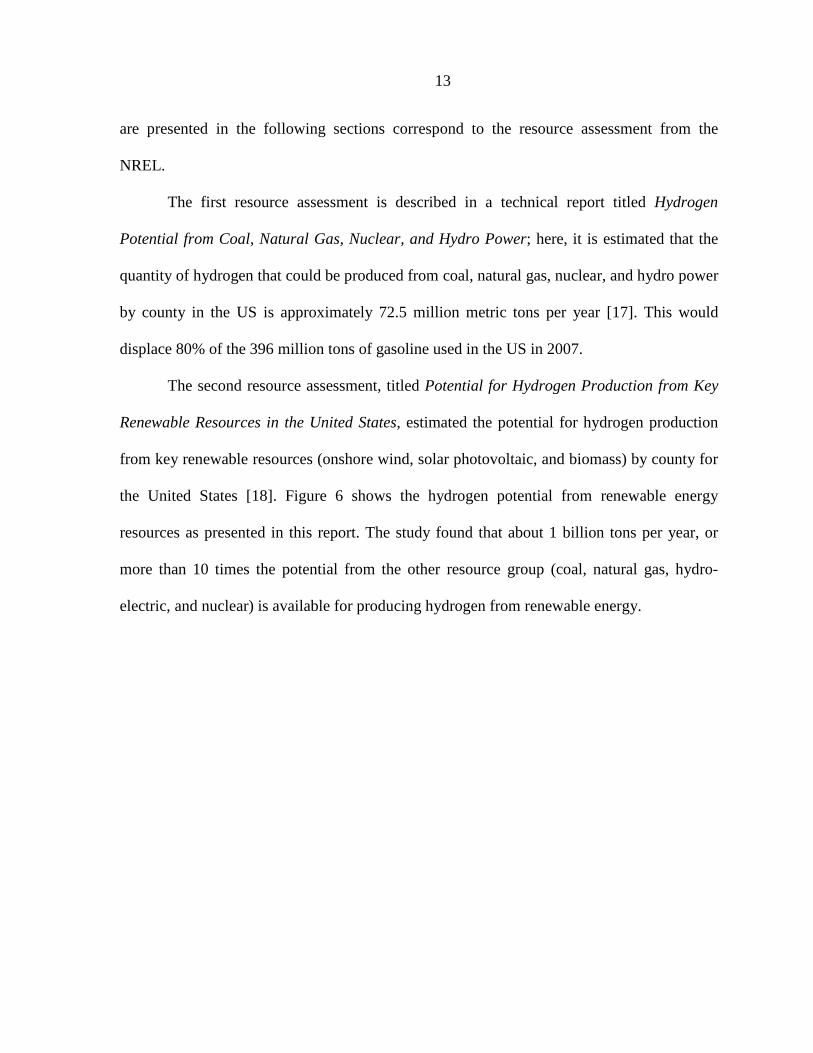
the United States [18]. Figure 6 shows the hydrogen potential from renewable energy
resources as presented in this report. The study found that about 1 billion tons per year, or
more than 10 times the potential from the other resource group (coal, natural gas, hydro-
electric, and nuclear) is available for producing hydrogen from renewable energy.
14
Figure 6 : Hydrogen Potential from Renewable Energy Resource (Source [18])
The U.S. has high potential for hydrogen production as presented in Table 4. Yet,
there are several economic and technical challenges which must be overcome before this
potential can be fully tapped.

15
Table 4: Hydrogen Potential in the U.S. (Source [17] and [18])
Hydrogen from Potential Hydrogen Production
in U.S.
Natural Gas (tons/ year) 26,805,697
Coal (tons / year) 40,485,759
Nuclear Energy (tons / year) 3,930,351
Hydro-Power (tons / year) 1,234,945
Wind Energy (tons) 301,328,935.5519
Solar Energy (tons) 790,631,720.3101
Biomass (tons) 33,299,723.8599
The following subsections overview the resource potential for hydrogen production in
the U.S.
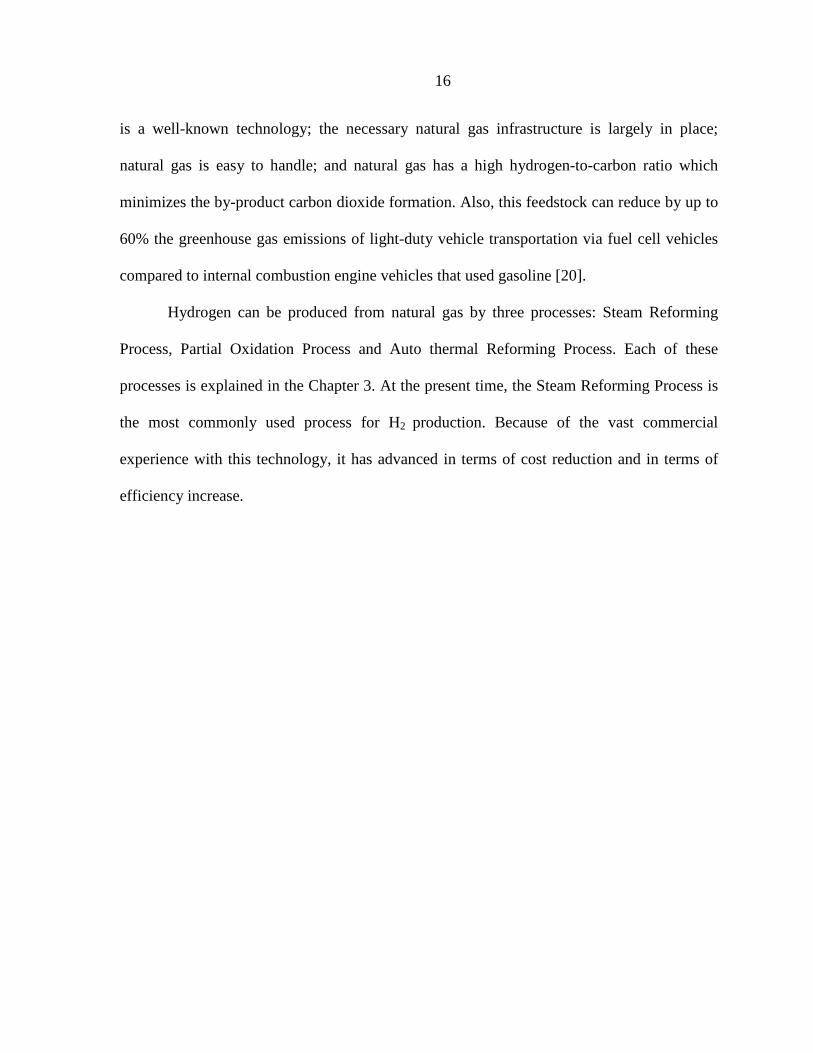
2.3.1 Natural Gas Potential
Natural gas is the most commonly used resource for hydrogen production.
Worldwide, 48% of the hydrogen production is made through natural gas. In the U.S., 95%
of hydrogen production is made by central plant natural gas reforming. Figure 7 shows the
hydrogen potential from natural gas in the U.S. Currently, this technology is the least
expensive for hydrogen production.
According to [19] natural gas is a cost-effective feedstock for produce hydrogen. The
reasons that support the use of natural gas for hydrogen production are: natural gas reforming
16
is a well-known technology; the necessary natural gas infrastructure is largely in place;
natural gas is easy to handle; and natural gas has a high hydrogen-to-carbon ratio which
minimizes the by-product carbon dioxide formation. Also, this feedstock can reduce by up to
60% the greenhouse gas emissions of light-duty vehicle transportation via fuel cell vehicles
compared to internal combustion engine vehicles that used gasoline [20].
Hydrogen can be produced from natural gas by three processes: Steam Reforming
Process, Partial Oxidation Process and Auto thermal Reforming Process. Each of these
processes is explained in the Chapter 3. At the present time, the Steam Reforming Process is
the most commonly used process for H2 production. Because of the vast commercial
experience with this technology, it has advanced in terms of cost reduction and in terms of
efficiency increase.
17
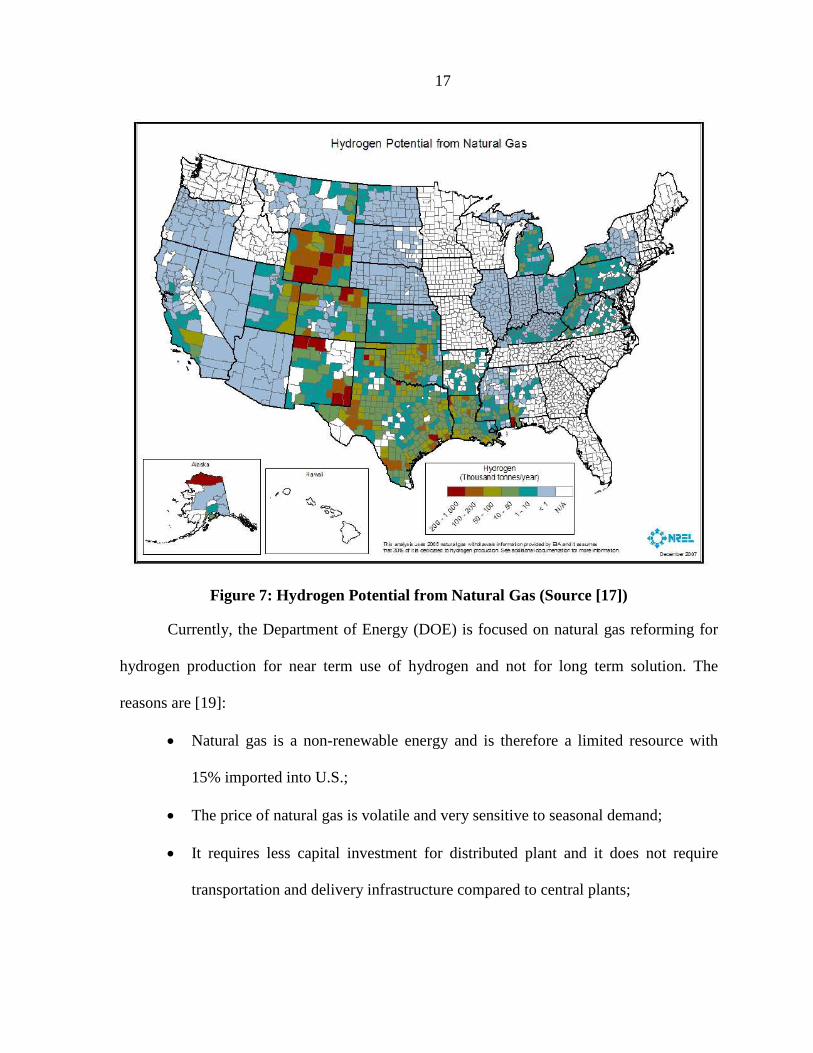
Figure 7: Hydrogen Potential from Natural Gas (Source [17])
Currently, the Department of Energy (DOE) is focused on natural gas reforming for
hydrogen production for near term use of hydrogen and not for long term solution. The
reasons are [19]:
• Natural gas is a non-renewable energy and is therefore a limited resource with
15% imported into U.S.;
• The price of natural gas is volatile and very sensitive to seasonal demand;
• It requires less capital investment for distributed plant and it does not require
transportation and delivery infrastructure compared to central plants;
18
• It releases some carbon dioxide during the H2 production process and therefore
requires carbon capture and storage to reach low carbon dioxide emissions, which
increases by 11 to 21 % the capital cost of hydrogen plant. For distributed system
this is prohibitive.
This production technology is therefore considered to be a provisional option for
initiating use of hydrogen in the U.S.
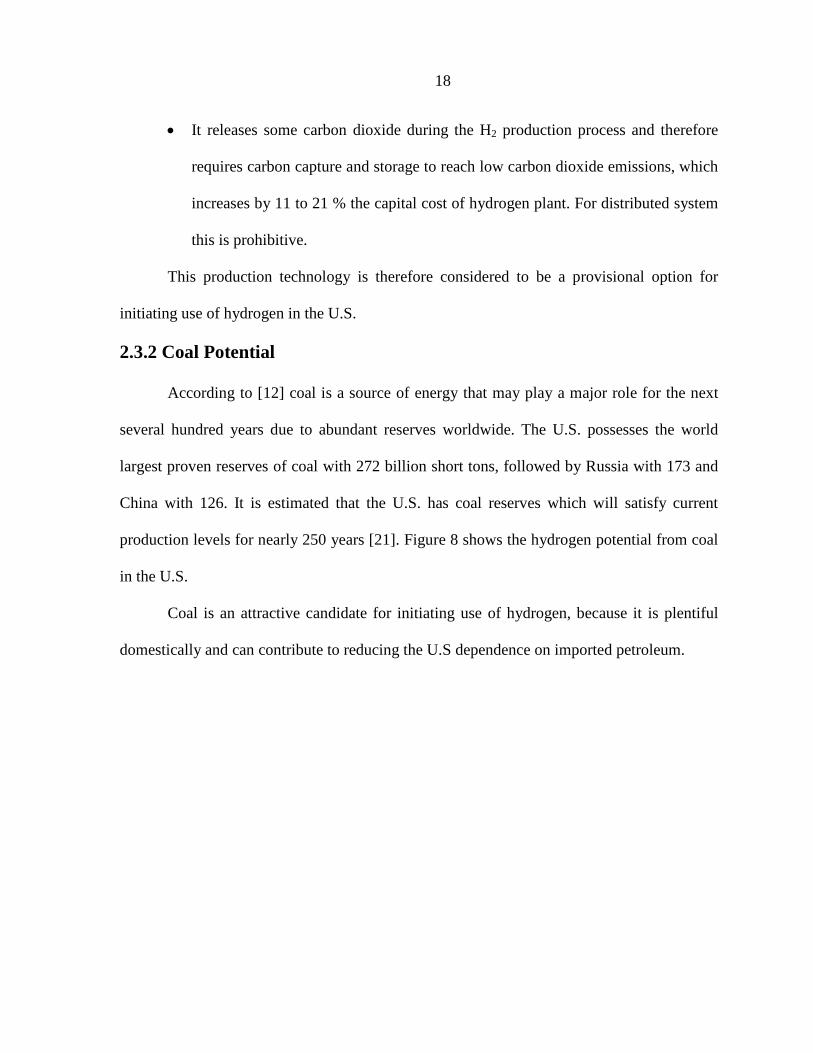
2.3.2 Coal Potential
According to [12] coal is a source of energy that may play a major role for the next
several hundred years due to abundant reserves worldwide. The U.S. possesses the world
largest proven reserves of coal with 272 billion short tons, followed by Russia with 173 and
China with 126. It is estimated that the U.S. has coal reserves which will satisfy current
production levels for nearly 250 years [21]. Figure 8 shows the hydrogen potential from coal
in the U.S.
Coal is an attractive candidate for initiating use of hydrogen, because it is plentiful
domestically and can contribute to reducing the U.S dependence on imported petroleum.
19
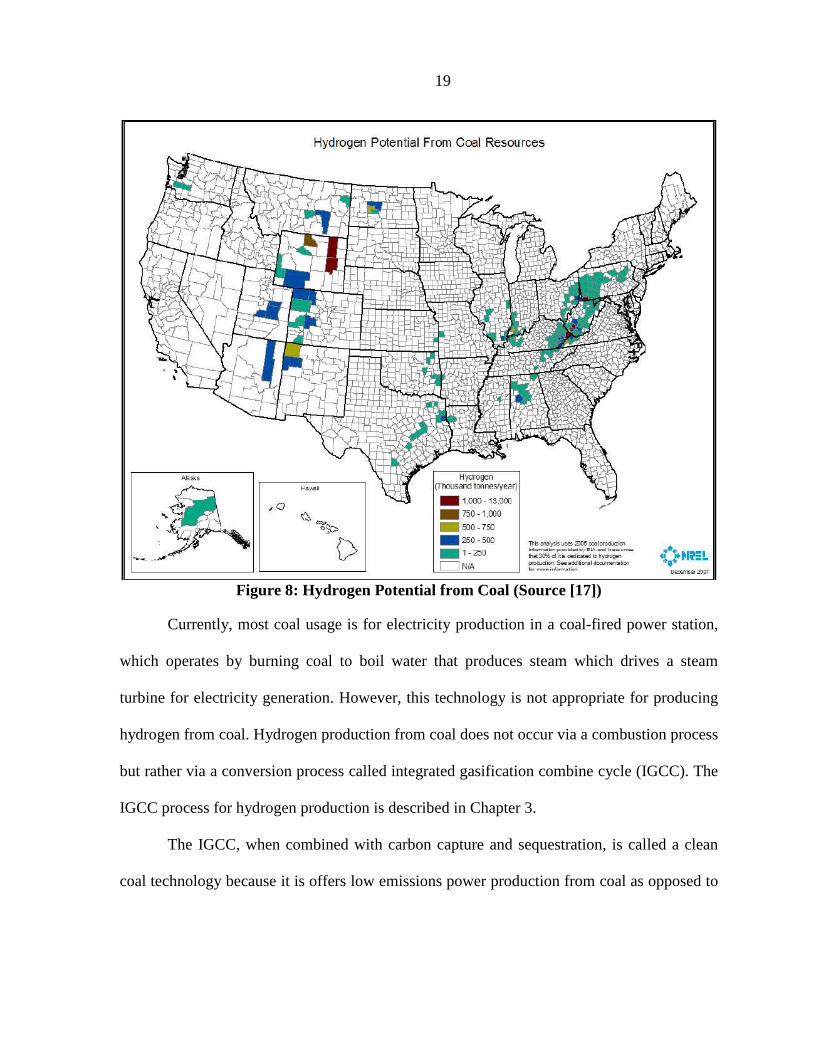
Figure 8: Hydrogen Potential from Coal (Source [17])
Currently, most coal usage is for electricity production in a coal-fired power station,
which operates by burning coal to boil water that produces steam which drives a steam
turbine for electricity generation. However, this technology is not appropriate for producing
hydrogen from coal. Hydrogen production from coal does not occur via a combustion process
but rather via a conversion process called integrated gasification combine cycle (IGCC). The
IGCC process for hydrogen production is described in Chapter 3.
The IGCC, when combined with carbon capture and sequestration, is called a clean
coal technology because it is offers low emissions power production from coal as opposed to
20
conventional coal fires power plants. Also, it is considered to be a polygeneration technology
since it can produce multiple energy products: electricity and hydrogen.
Nevertheless, one challenge is the high cost associate with the carbon capture and
sequestration technologies. The current cost of sequestering carbon dioxide is about $100-
300 per ton of carbon sequestered [21].
The emissions from coal are larger compare to any other fossil fuel for hydrogen
production. It is estimated that 19 kg of CO2 per kg of hydrogen is produced in the hydrogen
production process from coal, compared with natural gas where about 10 kg of CO2 per kg of
hydrogen is produced [19]. In addition IGCC is in an early stage of development compared
with other hydrogen production technologies.
According to [19] coal is most effectively used in producing hydrogen through very
large central plants when the demand of hydrogen is high and the distribution systems are
available.
In the future, coal usage for electricity production will play a declining role, and so
coal usage for hydrogen will become more favorable.
2.3.3 Nuclear Potential
The United States is the world largest supplier of nuclear power in the world. It has
the 4th largest uranium reserves. It operates 104 generating units in 65 nuclear power plants.
In 2008, these units produced a total of 806.2 TWh of electric energy that corresponded to
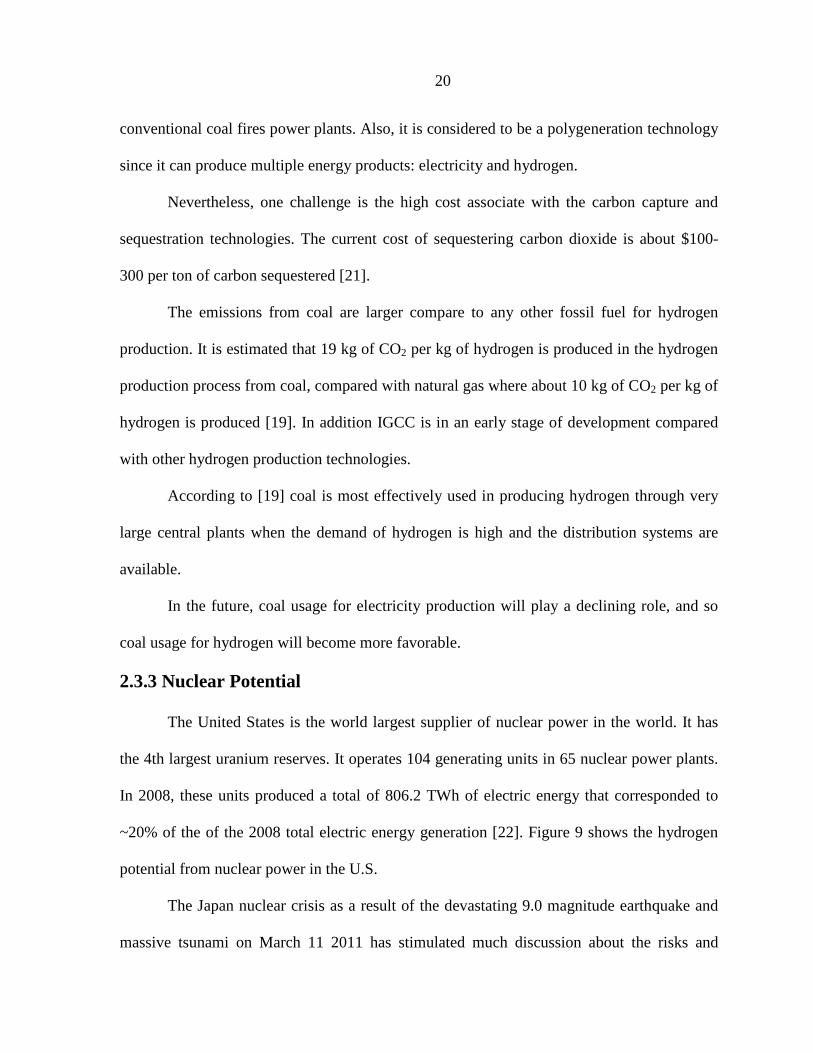
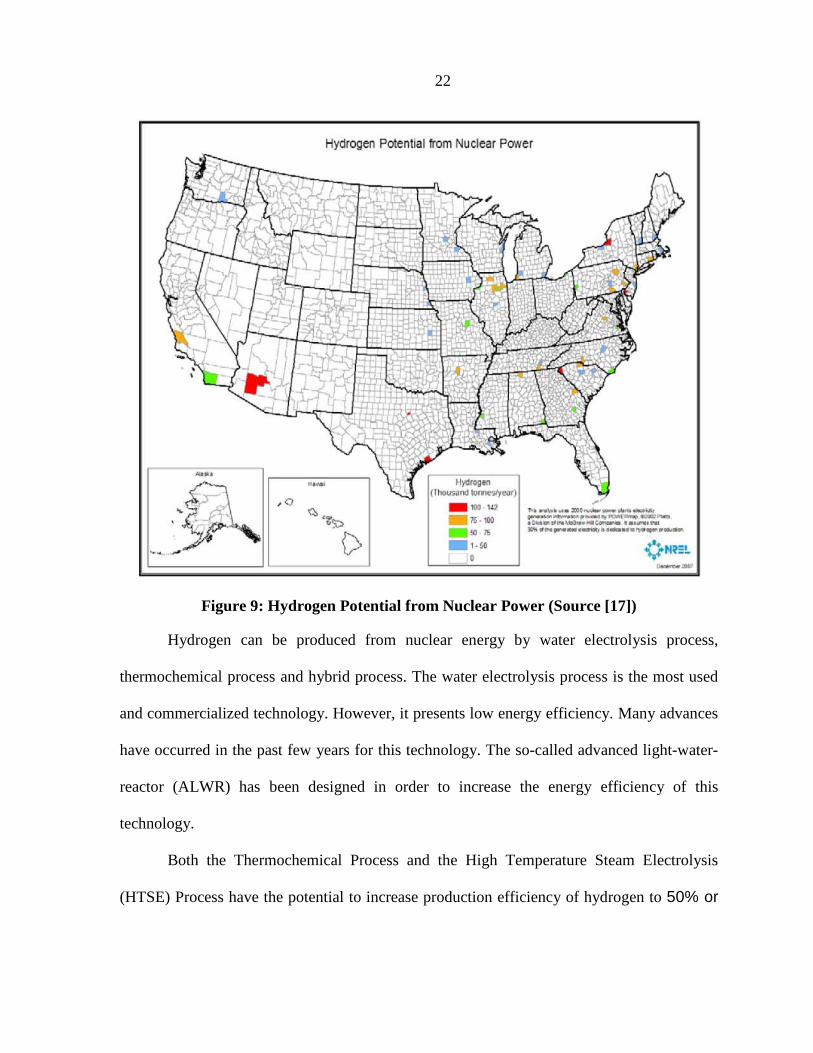
~20% of the of the 2008 total electric energy generation [22]. Figure 9 shows the hydrogen
potential from nuclear power in the U.S.
The Japan nuclear crisis as a result of the devastating 9.0 magnitude earthquake and
massive tsunami on March 11 2011 has stimulated much discussion about the risks and
21
benefits of nuclear power in the U.S. However, the U.S. Nuclear Regulatory Commission, at
the request of President Obama, has announced a comprehensive safety review of the 104
nuclear power reactors in the U.S. The Obama administration "continues to support the
expansion of nuclear power in the United States, despite the crisis in Japan” [22].
The nuclear energy is an attractive candidate for large scale of hydrogen production.
One reason for this is that use of nuclear power for hydrogen production does not result in
the emission of any of the pollutant gases such as carbon dioxide, sulfur dioxide or nitrogen
dioxide; moreover, in contrast to use of fossil fuel feedstock for hydrogen production, very
pure hydrogen for fuel cell vehicles can be obtained from nuclear technologies. For near-term
use of hydrogen, hydrogen from nuclear energy can be obtained from nuclear generation
during time intervals corresponding to off-peak electric demand.
22
Figure 9: Hydrogen Potential from Nuclear Power (Source [17])
Hydrogen can be produced from nuclear energy by water electrolysis process,
thermochemical process and hybrid process. The water electrolysis process is the most used
and commercialized technology. However, it presents low energy efficiency. Many advances
have occurred in the past few years for this technology. The so-called advanced light-water-
reactor (ALWR) has been designed in order to increase the energy efficiency of this
technology.
Both the Thermochemical Process and the High Temperature Steam Electrolysis
(HTSE) Process have the potential to increase production efficiency of hydrogen to 50% or

23
higher. Both processes require high-temperature operation in order to achieve high
efficiencies [23].
The Idaho National Laboratory (INL) is a leading institution for the
development of HTSE. It has been demonstrated at INL that both technologies are
attractive candidates for large scale production of hydrogen in an operationally cost
effective way. However, the higher efficiency and operational cost improvement
comes with higher complexity and capital cost [19].
Table 5 describes some advantages and disadvantages for the use of nuclear energy
for hydrogen production [19].
Table 5: Advantages and Disadvantages of Nuclear Energy (Source [19])
Nuclear Energy
Use for Hydrogen
Production
Advantages Disadvantages
1. Long-term domestic source: H2
from nuclear energy will be an excellent candidate in the long-term time frame. Its price is not subject to foreign pressures.
2. Carbon implications: The uses of electromechanical process produce zero CO2 emissions.
3. Efficiency of overall process: Higher efficiency can be obtained by the future technologies, such as HTSE.
1. Efficiency of conventional electrolysis process: Even though is a well know technology, it presents low energy efficiency.
2. Capital Cost: The nuclear reactor and the hydrogen plant are capital-intensive technologies. Capital and life cycles costs remain high.
3. Nuclear Waste: The nuclear waste disposal scheme remains to be finalized
4. Public Concerns: The fear of widespread devastation in case of accident. For example, the Japan earthquake.
2.3.4 Wind Potential
The United States has abundant wind resources. The U.S. wind potential is estimated
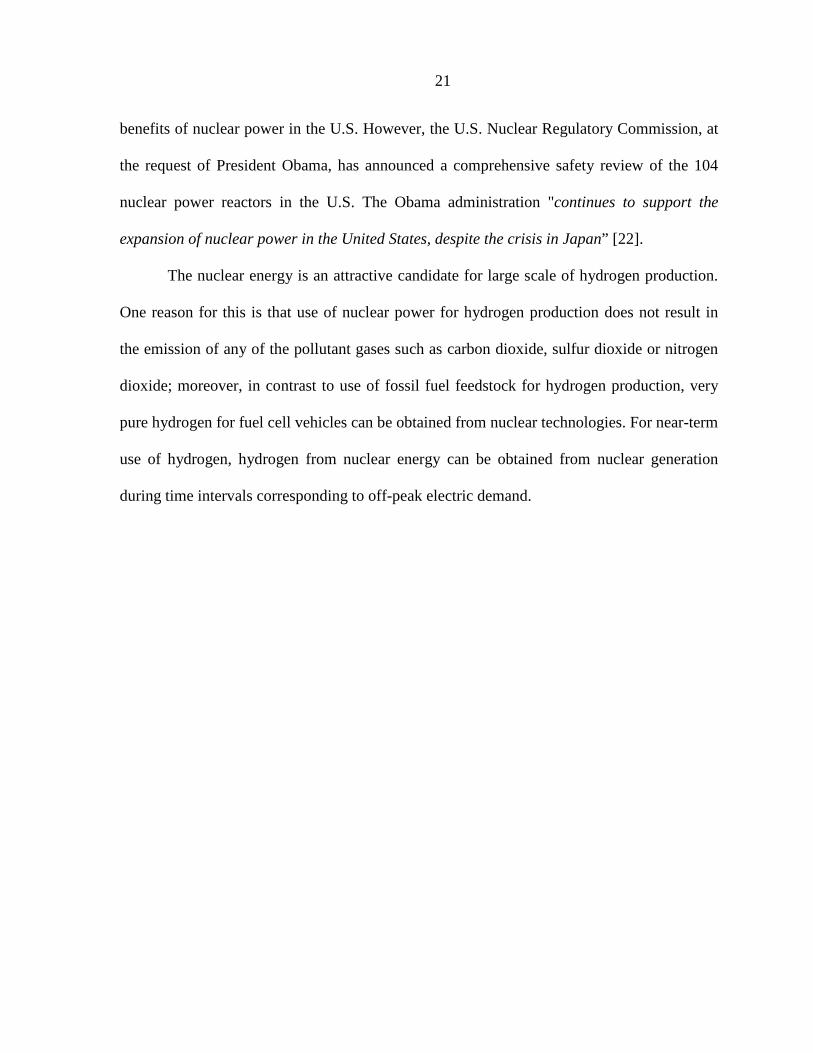
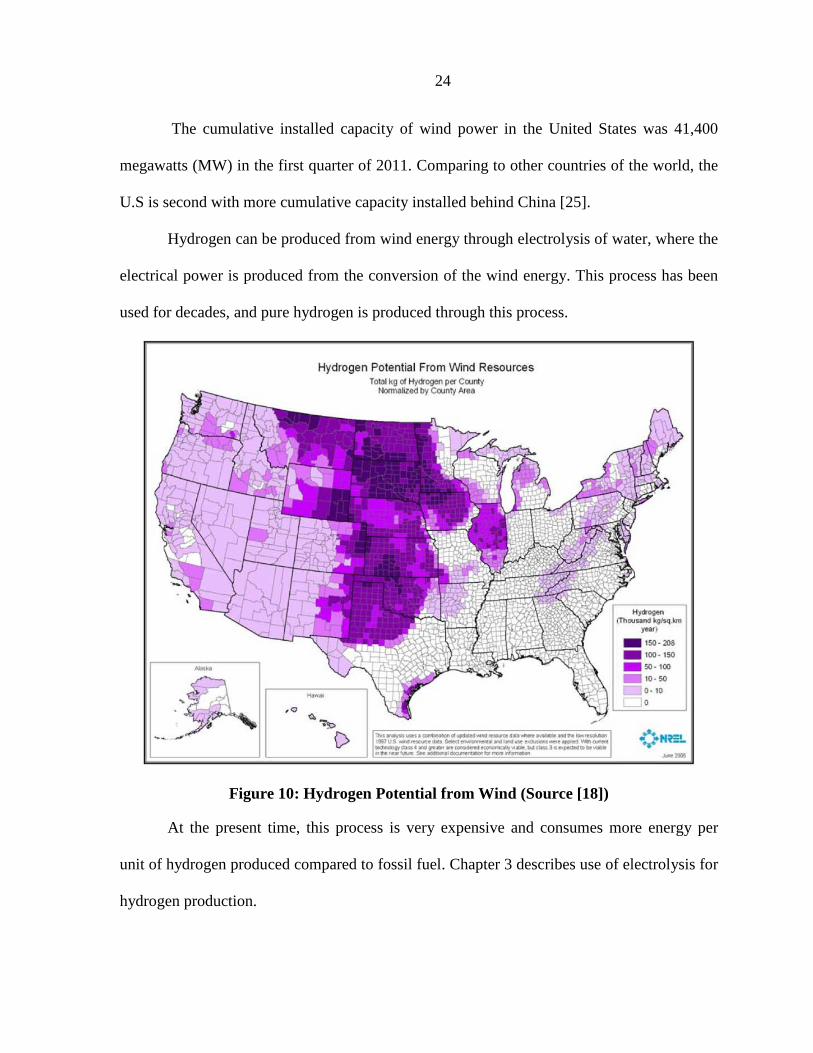
to be 10,777 TW h/ year [24]. Figure 10 shows the hydrogen potential from wind energy in
the U.S.
24
The cumulative installed capacity of wind power in the United States was 41,400
megawatts (MW) in the first quarter of 2011. Comparing to other countries of the world, the
U.S is second with more cumulative capacity installed behind China [25].
Hydrogen can be produced from wind energy through electrolysis of water, where the
electrical power is produced from the conversion of the wind energy. This process has been
used for decades, and pure hydrogen is produced through this process.
Figure 10: Hydrogen Potential from Wind (Source [18])
At the present time, this process is very expensive and consumes more energy per
unit of hydrogen produced compared to fossil fuel. Chapter 3 describes use of electrolysis for
hydrogen production.
25
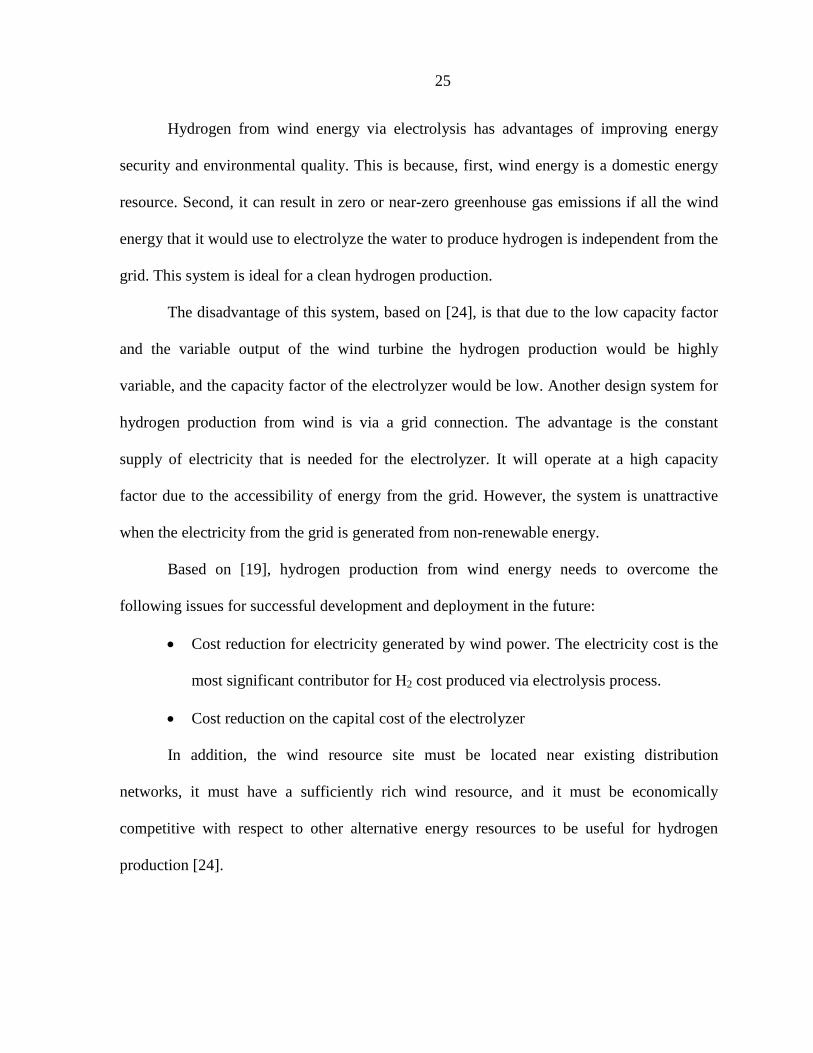
Hydrogen from wind energy via electrolysis has advantages of improving energy
security and environmental quality. This is because, first, wind energy is a domestic energy
resource. Second, it can result in zero or near-zero greenhouse gas emissions if all the wind
energy that it would use to electrolyze the water to produce hydrogen is independent from the
grid. This system is ideal for a clean hydrogen production.
The disadvantage of this system, based on [24], is that due to the low capacity factor
and the variable output of the wind turbine the hydrogen production would be highly
variable, and the capacity factor of the electrolyzer would be low. Another design system for
hydrogen production from wind is via a grid connection. The advantage is the constant
supply of electricity that is needed for the electrolyzer. It will operate at a high capacity
factor due to the accessibility of energy from the grid. However, the system is unattractive
when the electricity from the grid is generated from non-renewable energy.
Based on [19], hydrogen production from wind energy needs to overcome the
following issues for successful development and deployment in the future:
• Cost reduction for electricity generated by wind power. The electricity cost is the
most significant contributor for H2 cost produced via electrolysis process.
• Cost reduction on the capital cost of the electrolyzer
In addition, the wind resource site must be located near existing distribution
networks, it must have a sufficiently rich wind resource, and it must be economically
competitive with respect to other alternative energy resources to be useful for hydrogen
production [24].
26
Hydrogen can be produced in small-scale distributed systems that can reduce the need
for hydrogen distribution that it is appropriate to meet the early stages for the fuel cell
vehicles market. [19].
2.3.5 Solar Potential
Solar energy is a clean, abundant and available renewable energy source over the
globe. At the end of 2009, the U.S. ranked fourth with the highest amount of solar powered
installed with 1,650 MW behind Germany with 9,875 MW, Spain with 3,386 MW and Japan
with 2,633MW [26]. Even though the solar energy offers a great potential for supply energy,
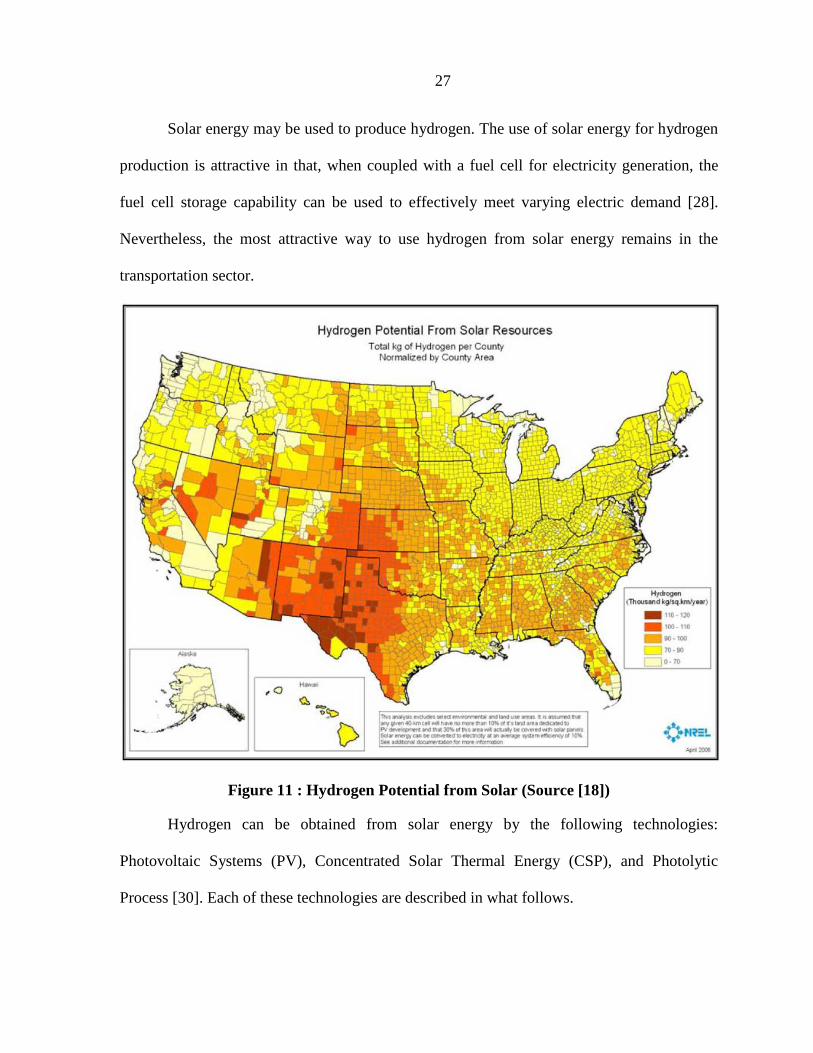
it only provides less than 1% of U.S. energy needs [27]. Figure 11 shows the hydrogen
potential from solar energy in the U.S.
At the present time, photovoltaic (PV) and concentrated solar power systems (CSP)
are used for the conversion of sunlight into electricity. Both technologies have been
demonstrated in large scale systems. However, the PV and CSP have been hindered by their
economics [28]. The electricity generated by solar energy is more than twice as expensive as
electricity from fossil fuels. The reasons for this are the high cost of the solar panel for PV
technology and the high cost of the heliostats for the CSP [19].
In addition, the capacity factor of the systems is around 20% for PV. This low
capacity factor is due to that the sunlight that arrives at the earth surface is variable
depending on location, time of day, time of year, and weather conditions [29]. In addition,
solar energy does not always match demand, although its daytime availability enables it to
match demand better than wind energy. This issue can be addressed with the use of backup
systems when the sun is not available. The principal advantage is that solar energy is that it
does not produce air pollutants or carbon-dioxide.
27
Solar energy may be used to produce hydrogen. The use of solar energy for hydrogen
production is attractive in that, when coupled with a fuel cell for electricity generation, the
fuel cell storage capability can be used to effectively meet varying electric demand [28].
Nevertheless, the most attractive way to use hydrogen from solar energy remains in the
transportation sector.
Figure 11 : Hydrogen Potential from Solar (Source [18])
Hydrogen can be obtained from solar energy by the following technologies:
Photovoltaic Systems (PV), Concentrated Solar Thermal Energy (CSP), and Photolytic
Process [30]. Each of these technologies are described in what follows.
28
2.3.5.1 Photovoltaic Systems
Hydrogen can be produced by electrolysis of water using the current generated by
PV. Hydrogen production by PV is not cost-effective due to the high cost of PV panels.
Moreover, the production of hydrogen through electrolysis from solar is not cost-competitive
because of high electricity cost and because the electrolyzers require further development
[19]. However, additional improvement in this technology is necessary for long-term
hydrogen production from PV systems. The main benefit is that it does not produce
greenhouse emissions when hydrogen is produced.
2.3.5.2 Concentrated Solar Thermal Energy
In the CSP technology, the solar radiation is concentrated into the solar receiver
mounted on the top of a central tower. High temperature heat is provided by the receiver.
This heat is used to operate a conventional power cycle through a steam turbine to generate
electricity. This electricity can be used for the dissociation of water into H2 and O2 through
the electrolysis process. Thermochemical routes of hydrogen production using CSP
technology are presented in Figure 12. The CSP system is a relatively new technology that it
has shown promise and is moving towards sustainable large-scale fuel production [28] and
[31].
Based on [28], [30] and [32], the CSP technology is considered as the benchmark for
other routes such as solar-driven water splitting thermochemical cycles for hydrogen
production. These processes involve endothermic reactions. They require higher reaction
temperature that yields higher energy conversion efficiencies. On the other hand, these higher

29
temperatures lead to greater losses by re-radiation from the solar cavity receiver [28]. These
methods are further described in [30] and [32].
Figure 12: Thermochemical Routes of Hydrogen Production using CSP (Source [28])
2.3.5.2.1 H2 from water by solar thermolysis
The thermal decomposition of water in hydrogen and oxygen is made through the
application of concentrated solar energy in a single step called water thermolysis. This
process requires higher temperature in the order of 2200 oC for effective degree of
dissociation. In order to avoid explosive mixtures, an effective technique for hydrogen and
oxygen is required [28].
2.3.5.2.2 H2 from water by solar thermochemical cycles
The water is dissociate at moderately high temperatures (927 oC) compared with the
H2 from water by solar thermolysis cycle. This cycle has the advantage of avoiding the
30
separation problem; but this method tends to cause corrosion. The leading candidates for this
approach are Sulfur-Iodine Cycle and Calcium –Bromine-Iron cycle (UT-3). Both methods
are further explained in Chapter 3.
2.3.5.2.3 H2 by decarbonization of fossil fuels
Solar cracking, solar reforming and solar steam gasification are the three solar
thermochemical processes for hydrogen production using fossil fuel. Each one is described in
what follows.
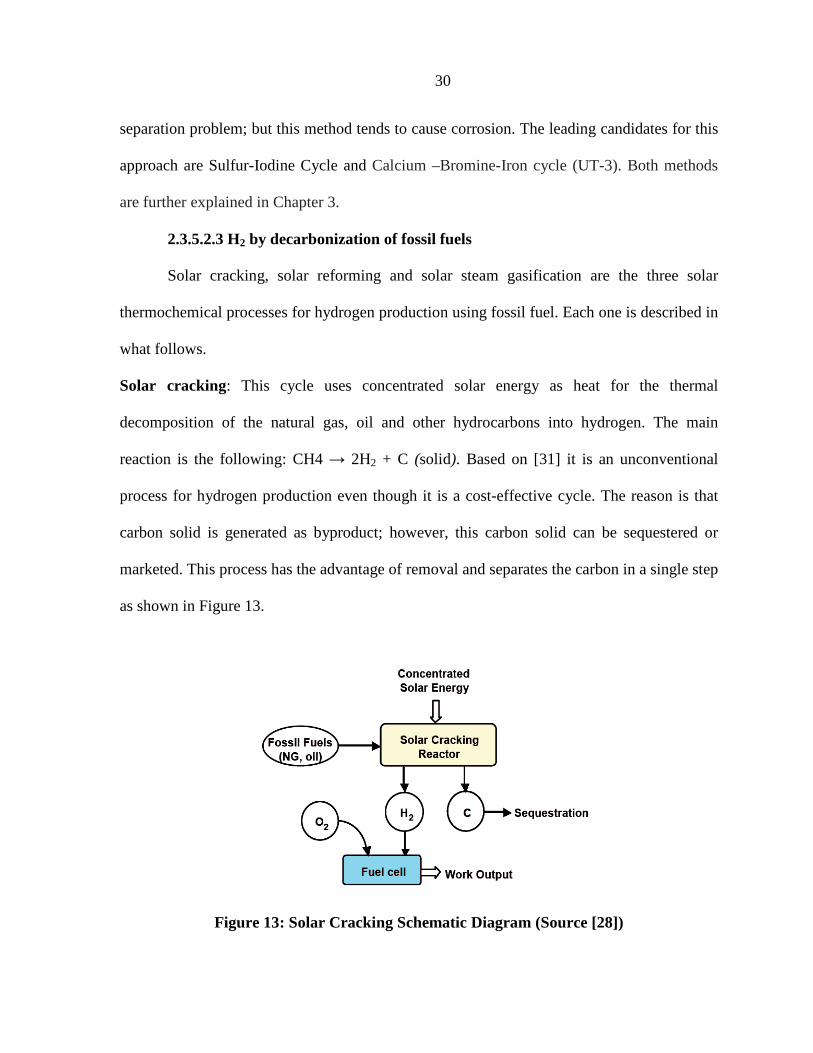
Solar cracking: This cycle uses concentrated solar energy as heat for the thermal
decomposition of the natural gas, oil and other hydrocarbons into hydrogen. The main
reaction is the following: CH4 → 2H2 + C (solid). Based on [31] it is an unconventional
process for hydrogen production even though it is a cost-effective cycle. The reason is that
carbon solid is generated as byproduct; however, this carbon solid can be sequestered or
marketed. This process has the advantage of removal and separates the carbon in a single step
as shown in Figure 13.
Figure 13: Solar Cracking Schematic Diagram (Source [28])
31
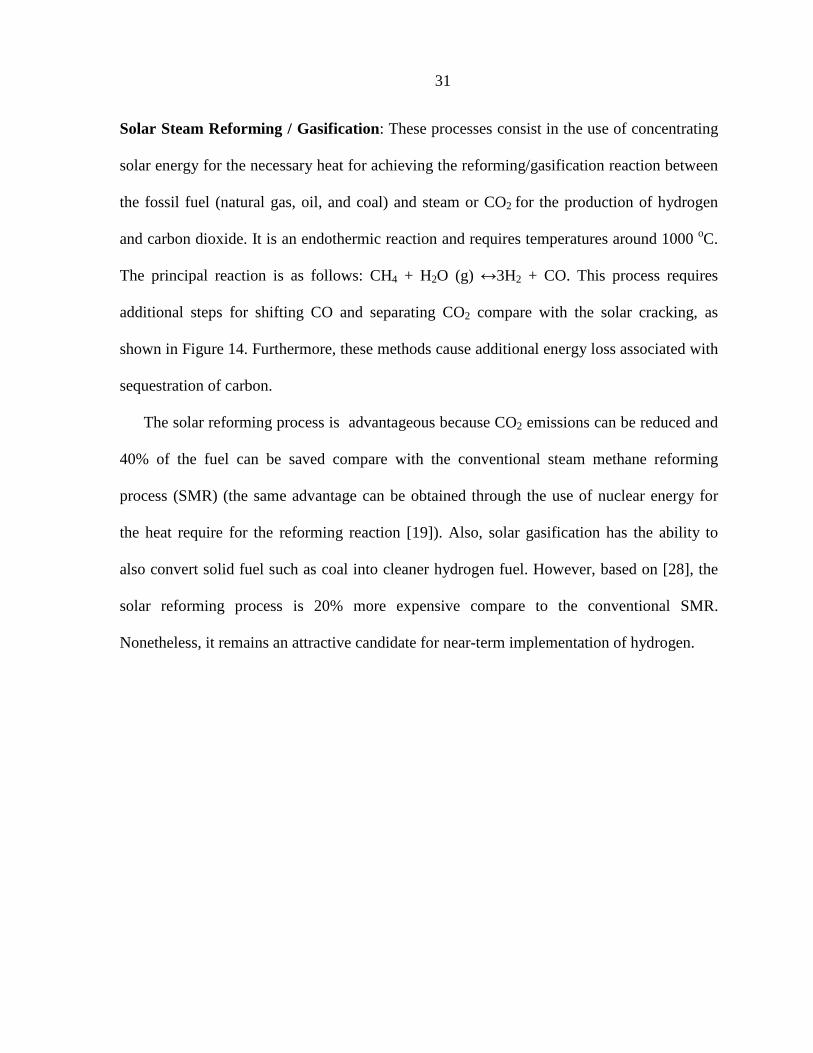
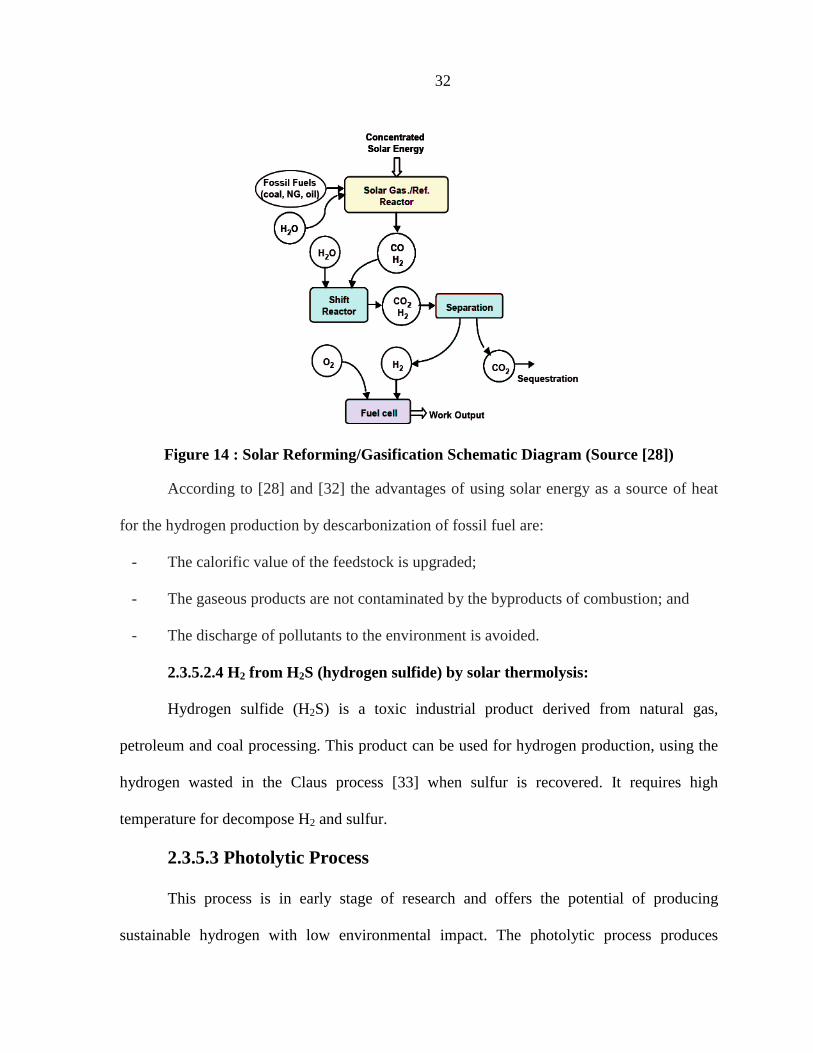
Solar Steam Reforming / Gasification: These processes consist in the use of concentrating
solar energy for the necessary heat for achieving the reforming/gasification reaction between
the fossil fuel (natural gas, oil, and coal) and steam or CO2 for the production of hydrogen
and carbon dioxide. It is an endothermic reaction and requires temperatures around 1000 oC.
The principal reaction is as follows: CH4 + H2O (g) ↔3H2 + CO. This process requires
additional steps for shifting CO and separating CO2 compare with the solar cracking, as
shown in Figure 14. Furthermore, these methods cause additional energy loss associated with
sequestration of carbon.
The solar reforming process is advantageous because CO2 emissions can be reduced and
40% of the fuel can be saved compare with the conventional steam methane reforming
process (SMR) (the same advantage can be obtained through the use of nuclear energy for
the heat require for the reforming reaction [19]). Also, solar gasification has the ability to
also convert solid fuel such as coal into cleaner hydrogen fuel. However, based on [28], the
solar reforming process is 20% more expensive compare to the conventional SMR.
Nonetheless, it remains an attractive candidate for near-term implementation of hydrogen.
32
Figure 14 : Solar Reforming/Gasification Schematic Diagram (Source [28])
According to [28] and [32] the advantages of using solar energy as a source of heat
for the hydrogen production by descarbonization of fossil fuel are:
- The calorific value of the feedstock is upgraded;
- The gaseous products are not contaminated by the byproducts of combustion; and
- The discharge of pollutants to the environment is avoided.
2.3.5.2.4 H2 from H 2S (hydrogen sulfide) by solar thermolysis:
Hydrogen sulfide (H2S) is a toxic industrial product derived from natural gas,
petroleum and coal processing. This product can be used for hydrogen production, using the
hydrogen wasted in the Claus process [33] when sulfur is recovered. It requires high
temperature for decompose H2 and sulfur.
2.3.5.3 Photolytic Process
This process is in early stage of research and offers the potential of producing
sustainable hydrogen with low environmental impact. The photolytic process produces

33
hydrogen and oxygen through the use of energy from sunlight to separate water. According
to [34], the photolytic process presents two possible routes for hydrogen production: photo
electrochemical water splitting and photo-biological water splitting, as described in what
follows.
2.3.5.3.1 Photo Electrochemical Water Splitting
The use of sunlight and a special class of semiconductor materials are used for the
production of hydrogen from water. Based on [35] this specialized semiconductor absorbs
sunlight and uses the light energy to separate the water molecules. However, this technology
needs highly durable and efficient materials for the hydrogen production.
2.3.4.3.2 Photo Biological Water Splitting
Some microorganisms such as unicellular green algae, cyanobacteria, photosynthetic
bacteria and some forms of dark fermentative bacteria and sunlight are used for hydrogen
production from water. These microorganisms consume water and produce hydrogen as a
byproduct of their natural metabolic process. According to [35] the enzymatic pathways
through which hydrogen is formed at the molecular level need to optimize it.
This process presents some disadvantages: the microorganism splits water too slow in
order to be used for commercial hydrogen, and cost-effective productions need to overcome
and lower the cost production [35].
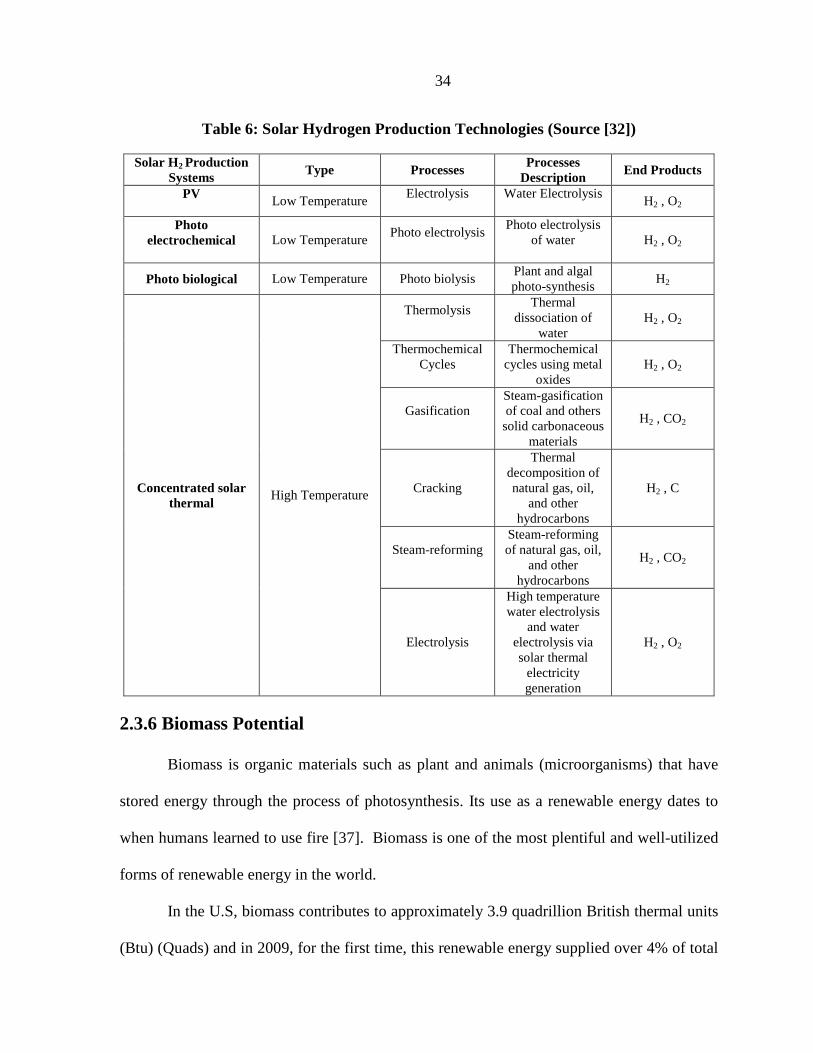
In conclusion solar hydrogen production technologies are a long term candidate for
hydrogen. Table 6 summarizes the solar hydrogen production processes mentioned above.
The advantage is that solar energy is available all over the globe and is renewable. However,
it is not competitive with fossil fuel in terms of cost, reliability and performance for
hydrogen production [36].
34
Table 6: Solar Hydrogen Production Technologies (Source [32])
Solar H2 Production Systems
Type Processes Processes
Description End Products
PV
Low Temperature Electrolysis
Water Electrolysis
H2 , O2
Photo electrochemical
Low Temperature
Photo electrolysis
Photo electrolysis of water
H2 , O2
Photo biological Low Temperature Photo biolysis Plant and algal photo-synthesis
H2
Concentrated solar thermal
High Temperature
Thermolysis
Thermal dissociation of
water H2 , O2
Thermochemical Cycles
Thermochemical cycles using metal
oxides H2 , O2
Gasification
Steam-gasification of coal and others solid carbonaceous
materials
H2 , CO2
Cracking
Thermal decomposition of natural gas, oil,
and other hydrocarbons
H2 , C
Steam-reforming
Steam-reforming of natural gas, oil,
and other hydrocarbons
H2 , CO2
Electrolysis
High temperature water electrolysis
and water electrolysis via solar thermal
electricity generation
H2 , O2
2.3.6 Biomass Potential
Biomass is organic materials such as plant and animals (microorganisms) that have
stored energy through the process of photosynthesis. Its use as a renewable energy dates to
when humans learned to use fire [37]. Biomass is one of the most plentiful and well-utilized
forms of renewable energy in the world.
In the U.S, biomass contributes to approximately 3.9 quadrillion British thermal units
(Btu) (Quads) and in 2009, for the first time, this renewable energy supplied over 4% of total
35
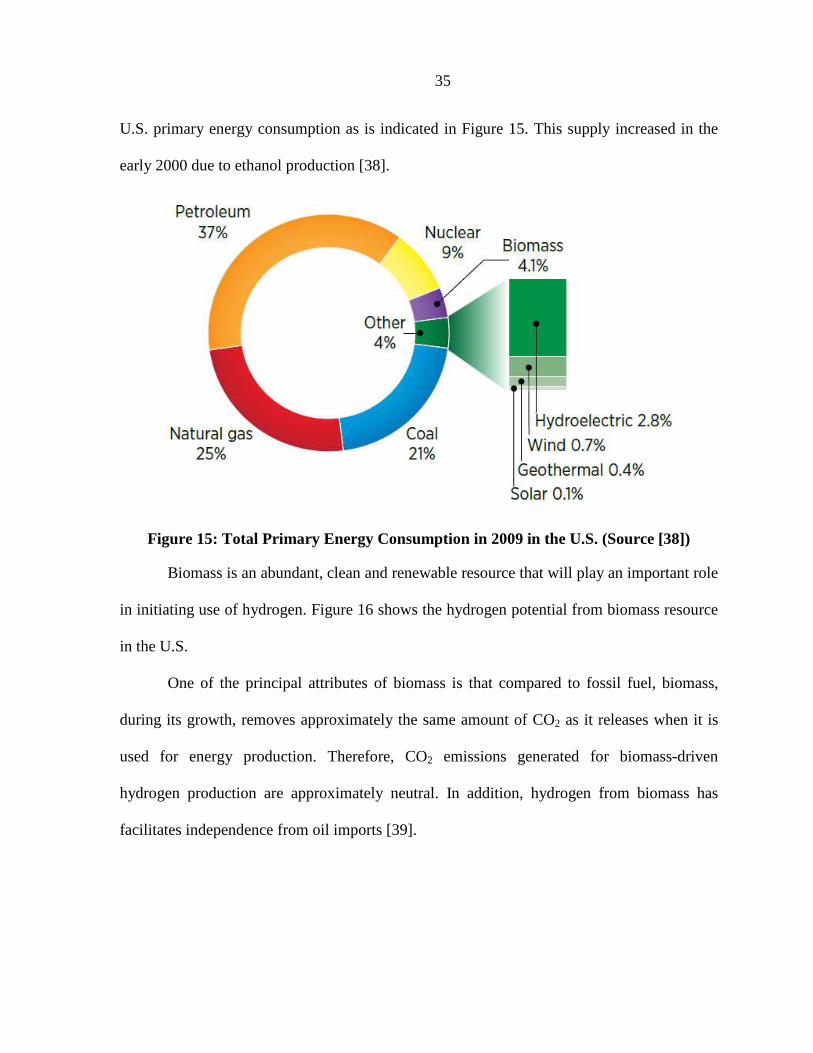
U.S. primary energy consumption as is indicated in Figure 15. This supply increased in the
early 2000 due to ethanol production [38].
Figure 15: Total Primary Energy Consumption in 2009 in the U.S. (Source [38])
Biomass is an abundant, clean and renewable resource that will play an important role
in initiating use of hydrogen. Figure 16 shows the hydrogen potential from biomass resource
in the U.S.
One of the principal attributes of biomass is that compared to fossil fuel, biomass,
during its growth, removes approximately the same amount of CO2 as it releases when it is
used for energy production. Therefore, CO2 emissions generated for biomass-driven
hydrogen production are approximately neutral. In addition, hydrogen from biomass has
facilitates independence from oil imports [39].

36
Figure 16: Hydrogen Potential from Biomass (Source [18])
Hydrogen can be produced from biomass through two types of processes:
thermochemical and biological. Further description of these processes is provided in Chapter
3.
Unfortunately, no commercial technology of biomass for hydrogen production is
available at the present time. Moreover, one of the major drawbacks is the low efficiency of
utilizing biomass for hydrogen production. High capital cost and feedstock costs are the main
challenges for hydrogen production via biomass energy. However, hydrogen from biomass
has the potential to accelerate the realization of hydrogen as a major fuel of the future.

37
CHAPTER 3. HYDROGEN ECONOMY
3.1 Overview
Hydrogen provides high-quality energy and is capable of becoming a diversified
secondary energy source. It can be used with a very high efficiency and near-zero emissions
at the point of use [5].
This chapter provides a review of the properties of H2 and its production processes.
3.2 Hydrogen as a transportation fuel
Hydrogen is the most abundant element in the universe. At standard temperature and
pressure, H2 is colorless, tasteless, odorless, and nontoxic. It is virtually never found in its
pure form; it occurs, rather, in the form of chemical compounds. For example, hydrogen is
present in water, fossil hydrocarbons, and biomass components such as carbohydrates,
protein, and cellulose [12].
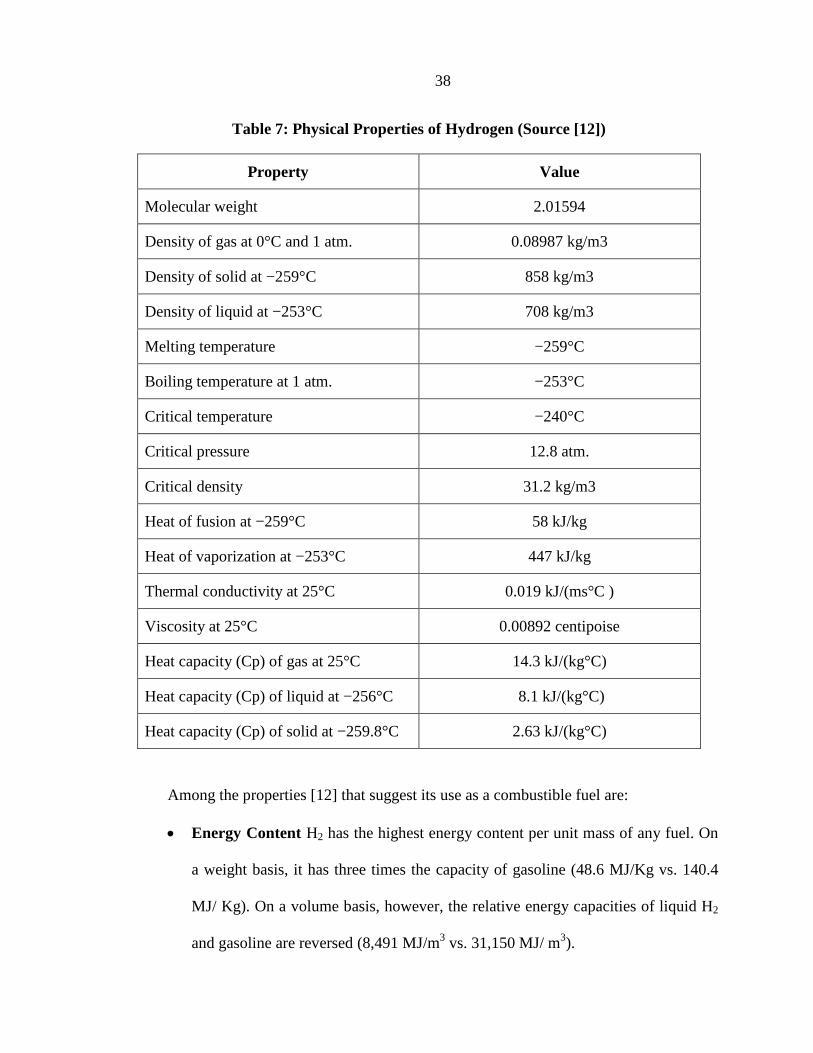
Hydrogen is the lightest of all elements. It presents a very low density per unit
volume, 0.08987 kg/m3. Hydrogen transforms from a gas to a liquid at a temperature of -
253°C (-422.99°F), and from a liquid to a solid at a temperature of -259°C (-434.6°F). Table
7 summarizes the physical properties of hydrogen and Table 8 presents the energy-related
properties of hydrogen as compared with other fuels.
38
Table 7: Physical Properties of Hydrogen (Source [12])
Property Value
Molecular weight 2.01594
Density of gas at 0°C and 1 atm. 0.08987 kg/m3
Density of solid at −259°C 858 kg/m3
Density of liquid at −253°C 708 kg/m3
Melting temperature −259°C
Boiling temperature at 1 atm. −253°C
Critical temperature −240°C
Critical pressure 12.8 atm.
Critical density 31.2 kg/m3
Heat of fusion at −259°C 58 kJ/kg
Heat of vaporization at −253°C 447 kJ/kg
Thermal conductivity at 25°C 0.019 kJ/(ms°C )
Viscosity at 25°C 0.00892 centipoise
Heat capacity (Cp) of gas at 25°C 14.3 kJ/(kg°C)
Heat capacity (Cp) of liquid at −256°C 8.1 kJ/(kg°C)
Heat capacity (Cp) of solid at −259.8°C 2.63 kJ/(kg°C)
Among the properties [12] that suggest its use as a combustible fuel are:
• Energy Content H2 has the highest energy content per unit mass of any fuel. On
a weight basis, it has three times the capacity of gasoline (48.6 MJ/Kg vs. 140.4
MJ/ Kg). On a volume basis, however, the relative energy capacities of liquid H2
and gasoline are reversed (8,491 MJ/m3 vs. 31,150 MJ/ m3).
39
• Limits of flammability define the ease with which something will burn or ignite,
causing fire or combustion [40]. H2 presents a broader range of flammability; for
example, H2 is flammable in 4-75% concentrations, while the range for gasoline is
from 1-7.6%.
• Ignition energy is the minimum energy required to ignite a combustible vapor,
gas, or dust cloud [41]. H2 has a very low ignition energy (0.02 MJ) compared to
gasoline (0.24MJ). This characteristic enables rapid ignition for a hydrogen
engine, even for a lean mixture.
• Detonation limits. H2, when confined, can be detonated over a very wide range of
concentrations. However, like many other fuels, it is very difficult to detonate if
released into the atmosphere.
• Auto ignition temperature. Compared to other fuels, hydrogen has a higher auto
ignition temperature (585 oC).
• Flame speed. H2 presents a higher flame velocity (1.85 m/s) than gasoline vapor
(0.42 m/s).
• Diffusion. H2 has very high diffusivity. This ability to disperse in air represents
an advantage because hydrogen leaks can be quickly dispersed in the environment
and unsafe conditions avoided.
• Density. H2 has very low density. This may present problems when it is used for
transportation purpose; for example, a very large volume is necessary to store
enough hydrogen to provide an adequate driving range [12]
40
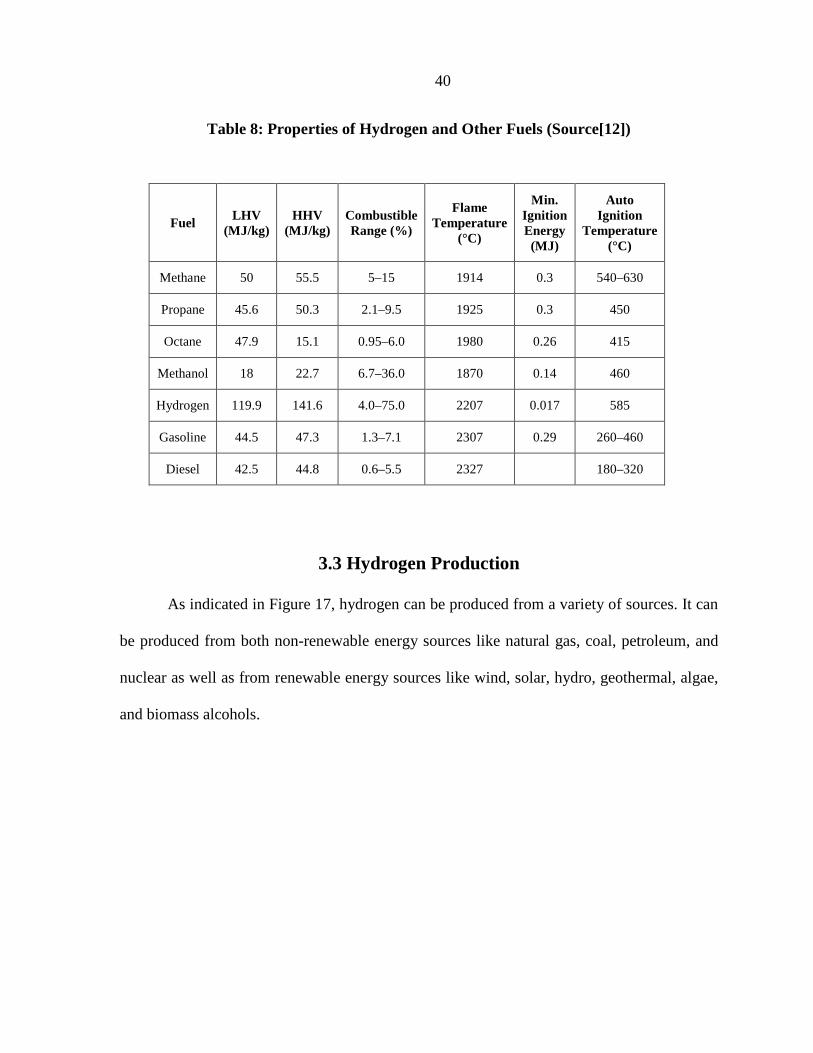
Table 8: Properties of Hydrogen and Other Fuels (Source[12])
3.3 Hydrogen Production
As indicated in Figure 17, hydrogen can be produced from a variety of sources. It can
be produced from both non-renewable energy sources like natural gas, coal, petroleum, and
nuclear as well as from renewable energy sources like wind, solar, hydro, geothermal, algae,
and biomass alcohols.
Fuel LHV
(MJ/kg) HHV
(MJ/kg) Combustible Range (%)
Flame Temperature
(°C)
Min. Ignition Energy (MJ)
Auto Ignition
Temperature (°C)
Methane 50 55.5 5–15 1914 0.3 540–630
Propane 45.6 50.3 2.1–9.5 1925 0.3 450
Octane 47.9 15.1 0.95–6.0 1980 0.26 415
Methanol 18 22.7 6.7–36.0 1870 0.14 460
Hydrogen 119.9 141.6 4.0–75.0 2207 0.017 585
Gasoline 44.5 47.3 1.3–7.1 2307 0.29 260–460
Diesel 42.5 44.8 0.6–5.5 2327 180–320
41
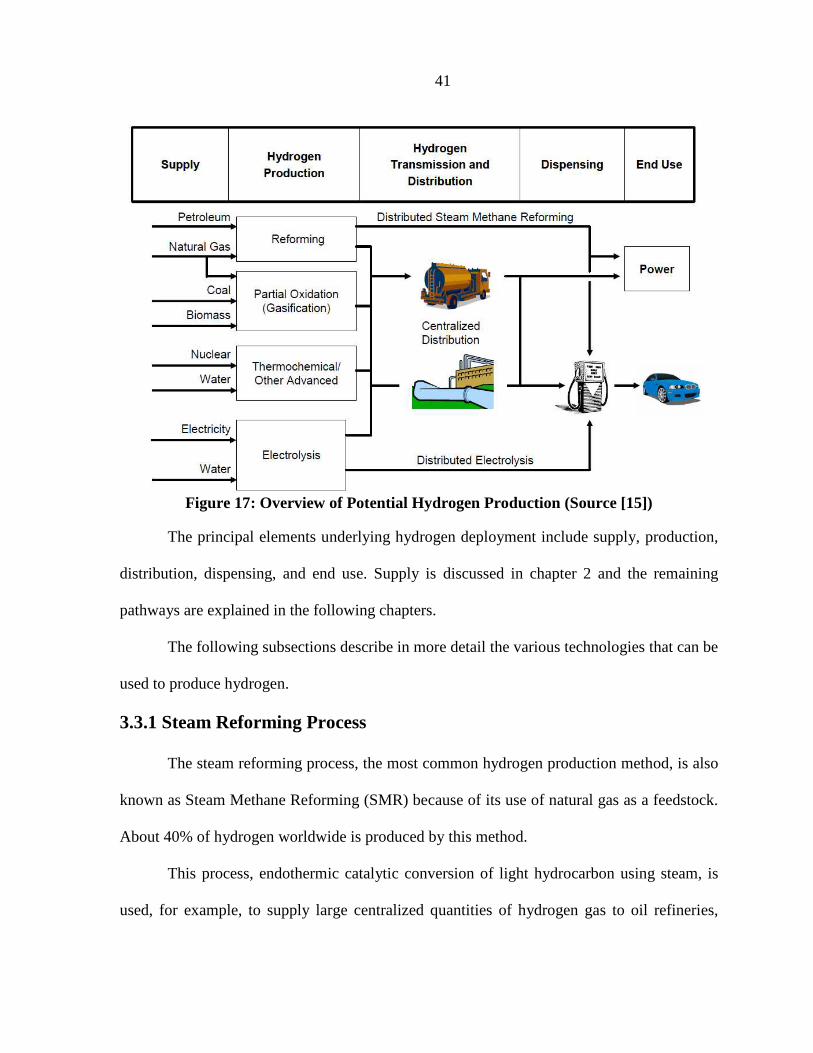
Figure 17: Overview of Potential Hydrogen Production (Source [15])
The principal elements underlying hydrogen deployment include supply, production,
distribution, dispensing, and end use. Supply is discussed in chapter 2 and the remaining
pathways are explained in the following chapters.
The following subsections describe in more detail the various technologies that can be
used to produce hydrogen.
3.3.1 Steam Reforming Process
The steam reforming process, the most common hydrogen production method, is also
known as Steam Methane Reforming (SMR) because of its use of natural gas as a feedstock.
About 40% of hydrogen worldwide is produced by this method.
This process, endothermic catalytic conversion of light hydrocarbon using steam, is
used, for example, to supply large centralized quantities of hydrogen gas to oil refineries,
42
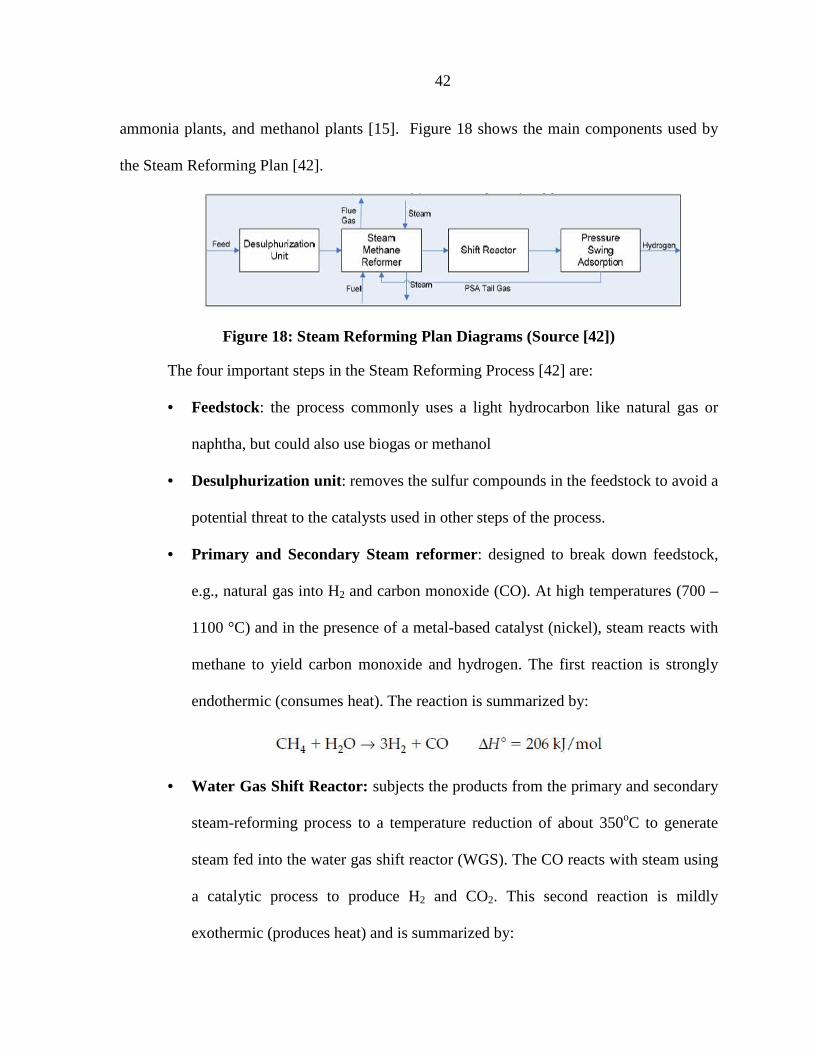
ammonia plants, and methanol plants [15]. Figure 18 shows the main components used by
the Steam Reforming Plan [42].
Figure 18: Steam Reforming Plan Diagrams (Source [42])
The four important steps in the Steam Reforming Process [42] are:
• Feedstock: the process commonly uses a light hydrocarbon like natural gas or
naphtha, but could also use biogas or methanol
• Desulphurization unit: removes the sulfur compounds in the feedstock to avoid a
potential threat to the catalysts used in other steps of the process.
• Primary and Secondary Steam reformer: designed to break down feedstock,
e.g., natural gas into H2 and carbon monoxide (CO). At high temperatures (700 –
1100 °C) and in the presence of a metal-based catalyst (nickel), steam reacts with
methane to yield carbon monoxide and hydrogen. The first reaction is strongly
endothermic (consumes heat). The reaction is summarized by:
• Water Gas Shift Reactor: subjects the products from the primary and secondary
steam-reforming process to a temperature reduction of about 350oC to generate
steam fed into the water gas shift reactor (WGS). The CO reacts with steam using
a catalytic process to produce H2 and CO2. This second reaction is mildly
exothermic (produces heat) and is summarized by:
43
• PSA: Hydrogen purification with pressure swing adsorption (PSA) to remove
CO, CO2 and CH4 gases from hydrogen,
3.3.2 Partial Oxidation Process
Partial oxidation (POx) of hydrocarbons is another method for hydrogen production.
Light hydrocarbons like natural gas can be used to produce H2 through this process.
However, the POx process usually produces H2 at a faster rate than the SMR process,
resulting in less H2 produced from a given feedstock quantity. POx more commonly uses
heavy residual oils (HROs) and coal as feedstock.
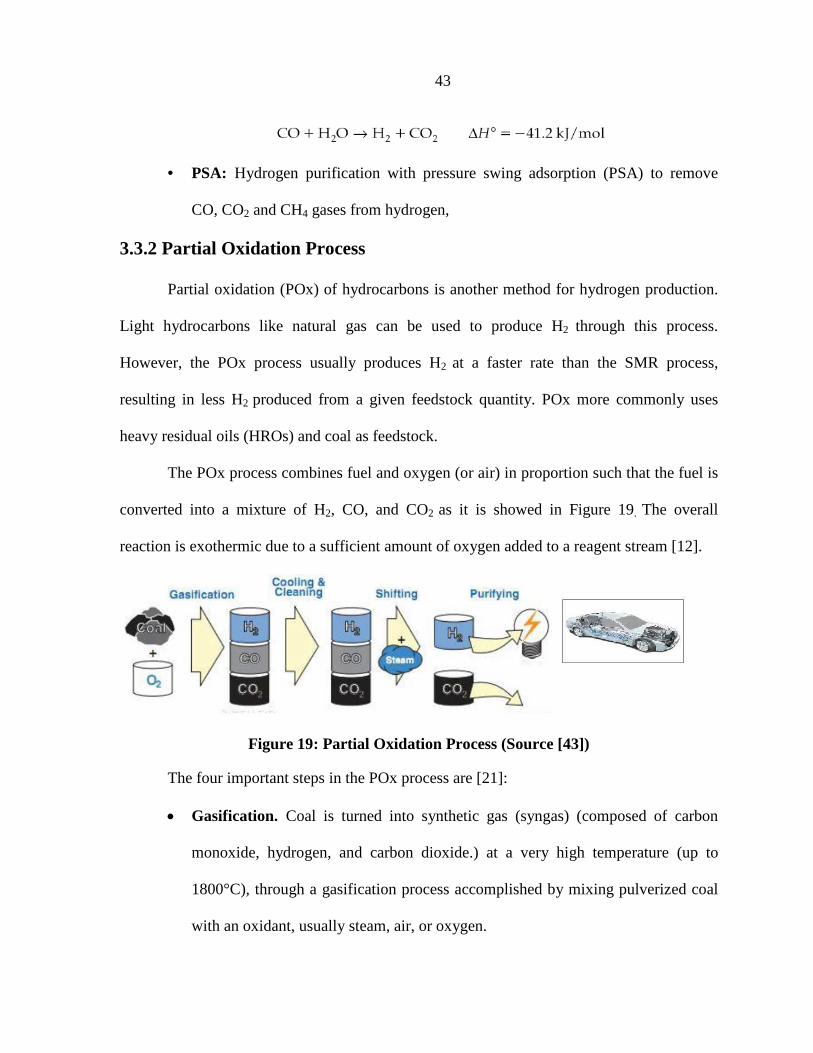
The POx process combines fuel and oxygen (or air) in proportion such that the fuel is
converted into a mixture of H2, CO, and CO2 as it is showed in Figure 19. The overall
reaction is exothermic due to a sufficient amount of oxygen added to a reagent stream [12].
Figure 19: Partial Oxidation Process (Source [43])
The four important steps in the POx process are [21]:
• Gasification. Coal is turned into synthetic gas (syngas) (composed of carbon
monoxide, hydrogen, and carbon dioxide.) at a very high temperature (up to
1800°C), through a gasification process accomplished by mixing pulverized coal
with an oxidant, usually steam, air, or oxygen.
44
• Cooling and Cleaning. The syngas is cooled and cleaned to remove extraneous
gases and particles, leaving only carbon monoxide, carbon dioxide, and hydrogen.
During syngas cleaning, mercury, sulfur, trace contaminants, and particulate
substances are removed.
• Shifting Next, the syngas is sent to a "shift reactor." During the shift reaction, the
carbon monoxide is converted into additional hydrogen and carbon dioxide by
mixing it with steam. At this point the syngas consists mostly of hydrogen and
carbon dioxide.
• Purification Once the syngas has been shifted, it is separated into separate
streams of hydrogen and carbon dioxide. The hydrogen, once cleaned, is then
ready for use, while the carbon dioxide is captured and sent off for sequestration.
3.3.3 Auto thermal Reforming Process (ATR)
The ATR process uses a combination of SMR and POx technologies. The ATR
process combines catalytic partial oxidation and steam reforming to convert both lighter and
heavier hydrocarbons; the exothermic oxidation supplies the necessary reaction heat for the
subsequent endothermic steam-reforming process [44].
ATR has the advantage of high efficiency, since the heat required is generated as part
of the process itself. This process has not up to now been widely applied.
3.3.4 Electrolysis Process
The hydrogen produced by this process constitutes around of 4% of worldwide
production and it has been in use for about a decade.
45
It is used in smaller markets and specialty applications in which higher-purity
hydrogen is required. For example, in food processing H2 can be used to increase the degree
of saturation in fats and oils [12].
Hydrogen production via electrolysis is produced by both renewable (wind, solar) and
nuclear options. The nuclear option will be explained in the next section.
Hydrogen is produced via electrolysis by passing a direct current between two
electrodes in water. The water molecule is split in an electrolyzer cell, producing oxygen at
the anode (positive electrode) and hydrogen at the cathode (negative electrode).
The following reactions take place in the electrolyser cell [12]:
In the electrolyte
At the cathode
At the anode
Overall reaction
Depending on the type of electrolyte, electrolyzers can be classified into two basic
categories: alkaline-water electrolyte (liquid electrolyte using potassium hydroxide KOH)
and solid-polymer electrolyte membrane (PEM). Both types work at low temperature.
The operating voltage, rate of hydrogen production, and capital costs are factors that
influence the performance of electrolyzers [45].
3.3.4.1 Alkaline Electrolyte
Alkaline electrolyzers use an electrolyte composed of an aqueous solution of
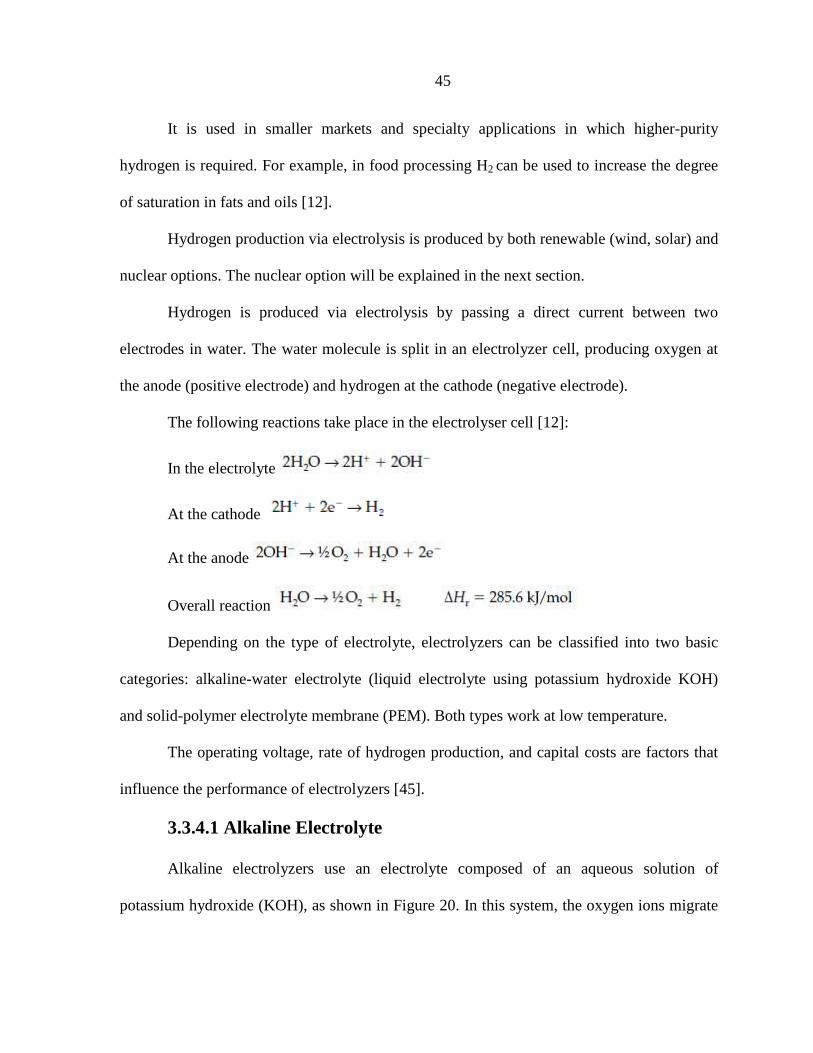
potassium hydroxide (KOH), as shown in Figure 20. In this system, the oxygen ions migrate
46
through the electrolytic material, leaving hydrogen gas dissolved in the water stream. This
hydrogen is readily extracted from the water stream directed into a separating chamber [19]
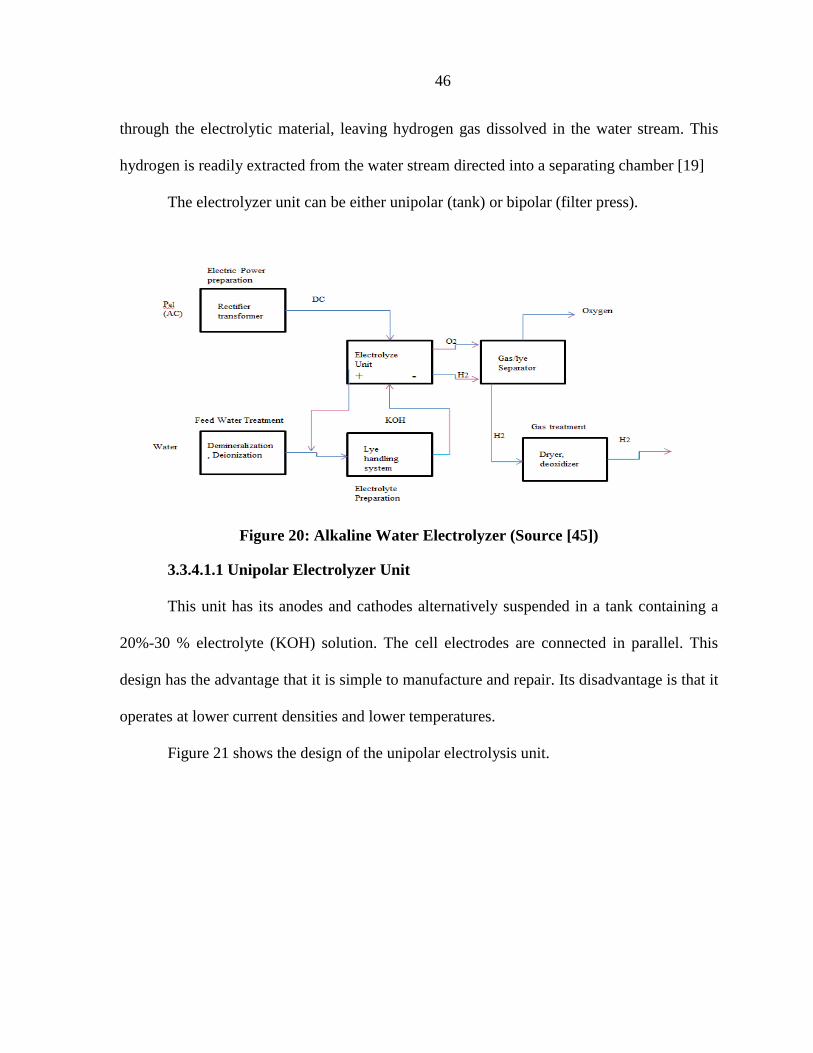
The electrolyzer unit can be either unipolar (tank) or bipolar (filter press).
Figure 20: Alkaline Water Electrolyzer (Source [45])
3.3.4.1.1 Unipolar Electrolyzer Unit
This unit has its anodes and cathodes alternatively suspended in a tank containing a
20%-30 % electrolyte (KOH) solution. The cell electrodes are connected in parallel. This
design has the advantage that it is simple to manufacture and repair. Its disadvantage is that it
operates at lower current densities and lower temperatures.
Figure 21 shows the design of the unipolar electrolysis unit.
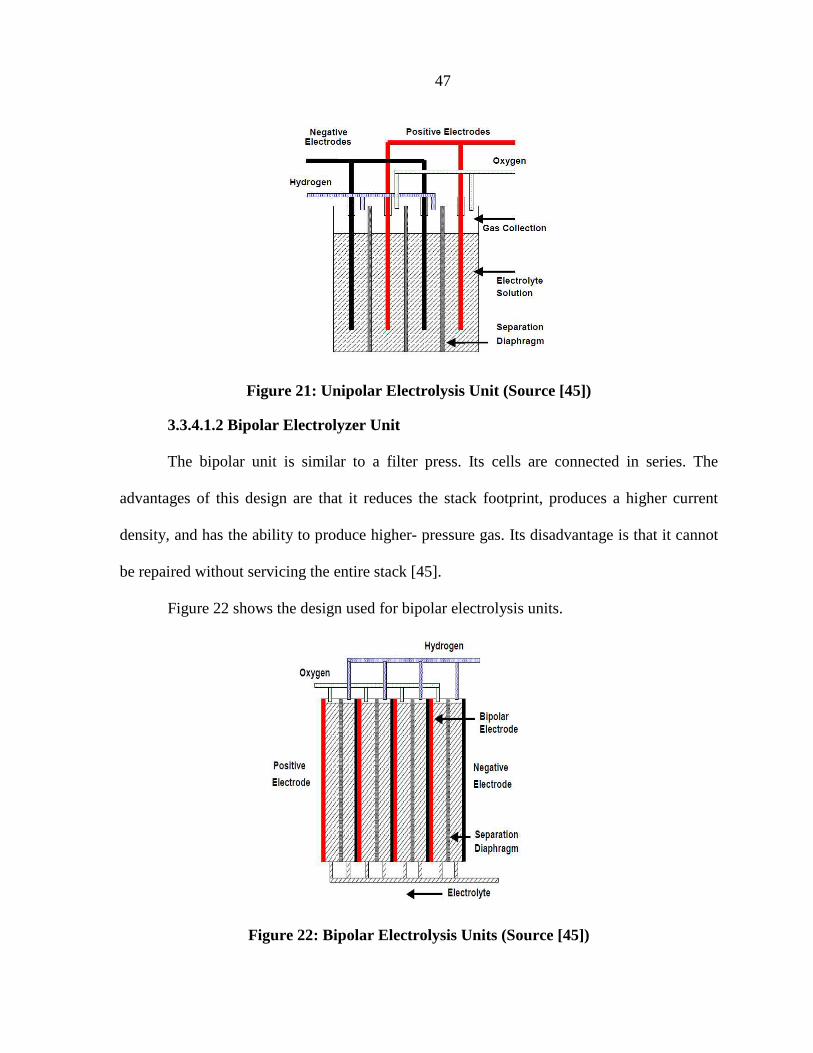
47
Figure 21: Unipolar Electrolysis Unit (Source [45])
3.3.4.1.2 Bipolar Electrolyzer Unit
The bipolar unit is similar to a filter press. Its cells are connected in series. The
advantages of this design are that it reduces the stack footprint, produces a higher current
density, and has the ability to produce higher- pressure gas. Its disadvantage is that it cannot
be repaired without servicing the entire stack [45].
Figure 22 shows the design used for bipolar electrolysis units.
Figure 22: Bipolar Electrolysis Units (Source [45])
48
3.3.4.2 Polymer Electrolyte Membrane (PEM) Electrolyzer
The PEM electrolyzer uses a solid ion-conducting membrane. Water is introduced
into the PEM electrolyzer cell and hydrogen ions are drawn through the membrane where
they recombine with electrons to form hydrogen atoms. Oxygen gas remains behind in the
water. Hydrogen gas is separately channeled from the cell stack and captured [45].
3.3.5 Thermochemical and Other Advance Processes
Hydrogen can be produced through thermochemical, electrochemical, and/or hybrid
processes using nuclear energy as the primary energy source, as shown in Figure 23.
The nuclear energy hydrogen production can be accomplished using the following
process [46]
• A Water Electrolysis process using electricity generated by the nuclear plant
• High-temperature steam electrolysis or hybrid processes using high-temperature
heat and electricity from the nuclear plant
• Thermochemical processes using heat from the nuclear plant
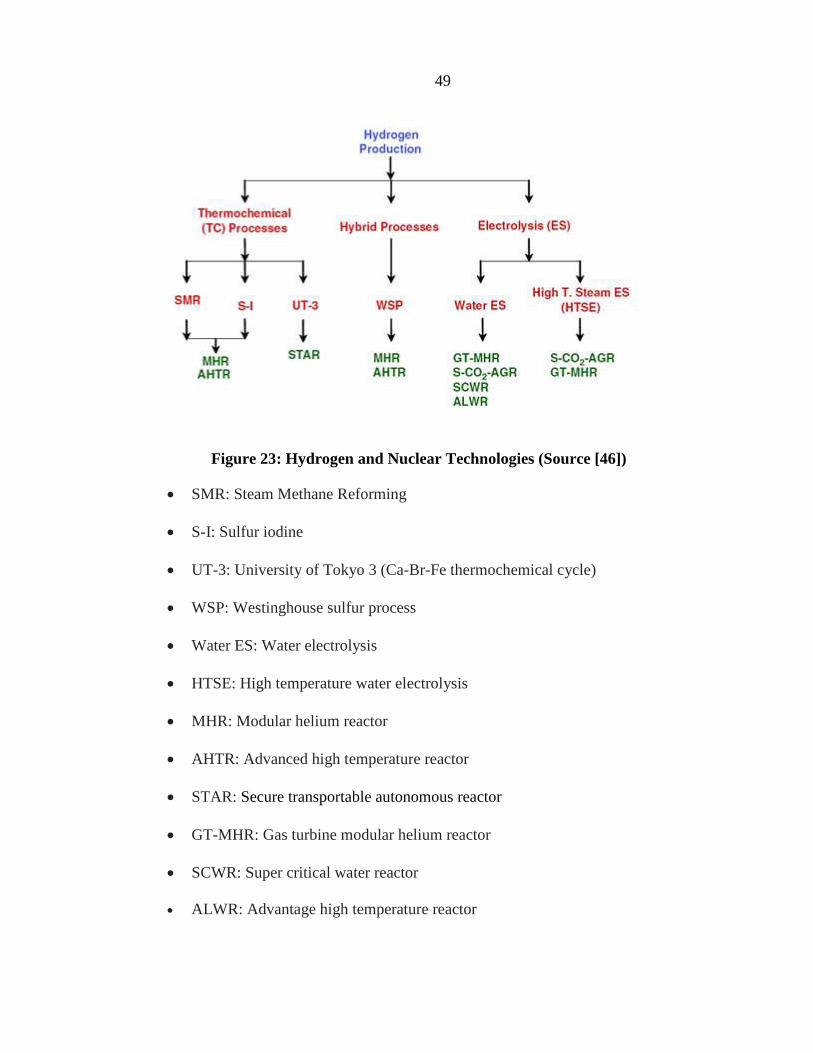
49
Figure 23: Hydrogen and Nuclear Technologies (Source [46])
• SMR: Steam Methane Reforming
• S-I: Sulfur iodine
• UT-3: University of Tokyo 3 (Ca-Br-Fe thermochemical cycle)
• WSP: Westinghouse sulfur process
• Water ES: Water electrolysis
• HTSE: High temperature water electrolysis
• MHR: Modular helium reactor
• AHTR: Advanced high temperature reactor
• STAR: Secure transportable autonomous reactor
• GT-MHR: Gas turbine modular helium reactor
• SCWR: Super critical water reactor
• ALWR: Advantage high temperature reactor
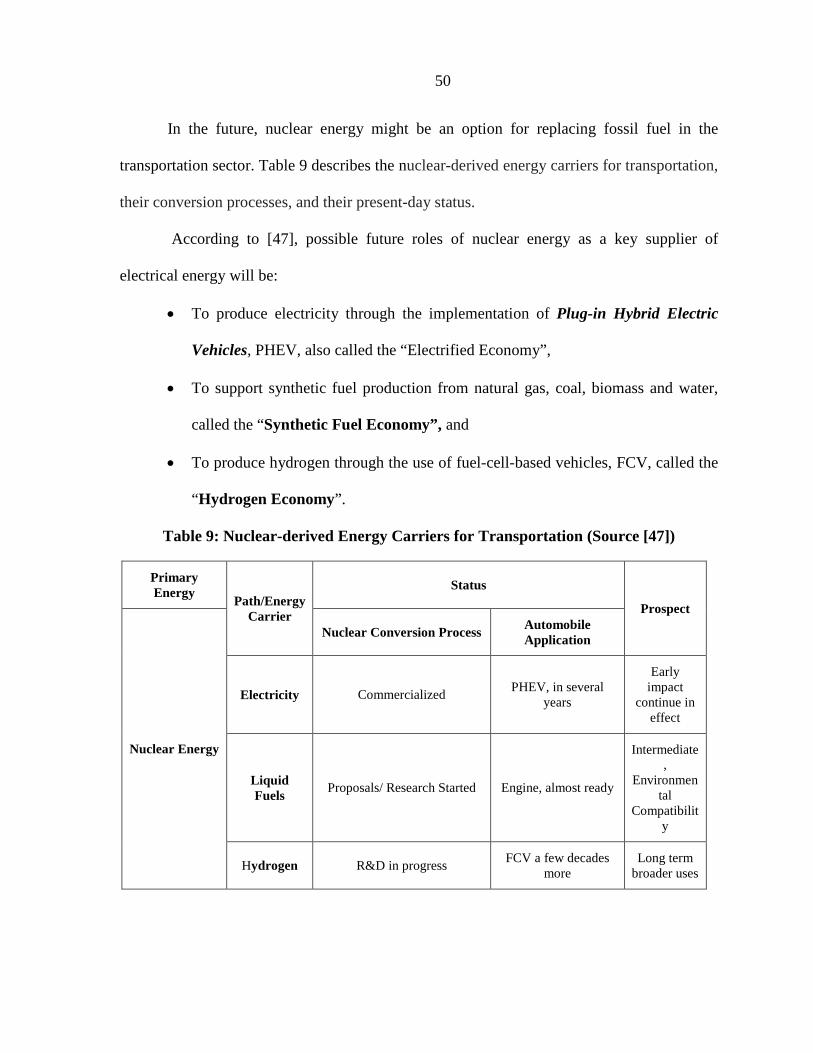
50
In the future, nuclear energy might be an option for replacing fossil fuel in the
transportation sector. Table 9 describes the nuclear-derived energy carriers for transportation,
their conversion processes, and their present-day status.
According to [47], possible future roles of nuclear energy as a key supplier of
electrical energy will be:
• To produce electricity through the implementation of Plug-in Hybrid Electric
Vehicles, PHEV, also called the “Electrified Economy”,
• To support synthetic fuel production from natural gas, coal, biomass and water,
called the “Synthetic Fuel Economy”, and
• To produce hydrogen through the use of fuel-cell-based vehicles, FCV, called the
“Hydrogen Economy”.
Table 9: Nuclear-derived Energy Carriers for Transportation (Source [47])
Primary Energy
Path/Energy Carrier
Status
Prospect
Nuclear Energy
Nuclear Conversion Process Automobile Application
Electricity Commercialized PHEV, in several
years
Early impact
continue in effect
Liquid Fuels
Proposals/ Research Started Engine, almost ready
Intermediate,
Environmental
Compatibility
Hydrogen R&D in progress FCV a few decades
more Long term
broader uses

51
3.3.5.1Thermo-chemical Process:
Hydrogen can be produced, from hydrocarbon and water through thermo-chemical
cycles that combine heat sources (thermo) with chemical reactions.
Such process can be more efficient than water electrolysis, for example, due to the
excellent thermodynamic reactions occurring at elevated temperature, requiring less electric
energy to produce a given amount of hydrogen.
Despite the fact that they are relatively new technology, thermo-chemical cycles are
considered excellent candidates for hydrogen production. These processes, however, tend to
present corrosion problems and can also generate greenhouse emissions.
Thermo-chemical processes for hydrogen production are [46]
• Nuclear Steam Methane Reforming (N-SMR)
• Sulfur Iodine (SI) cycle
• Ca-Br-Fe (UT-3) cycle
• Cu–Cl cycle
The following sections describe the processes mentioned above. In all these processes
water is used along with high-temperature chemical reactions, with hydrogen and oxygen
obtained as byproducts. The other components can be recycled.
3.3.5.1.1 Nuclear Steam Methane Reforming (N-SMR)
As mentioned above, the SMR process requires high temperatures throughout the
natural gas burning. One option for producing such high temperatures is nuclear energy. The
SMR can be coupled to the high-temperature helium-cooled reactor, and use the heat from
the modular helium reactor to replace the natural-gas burning.
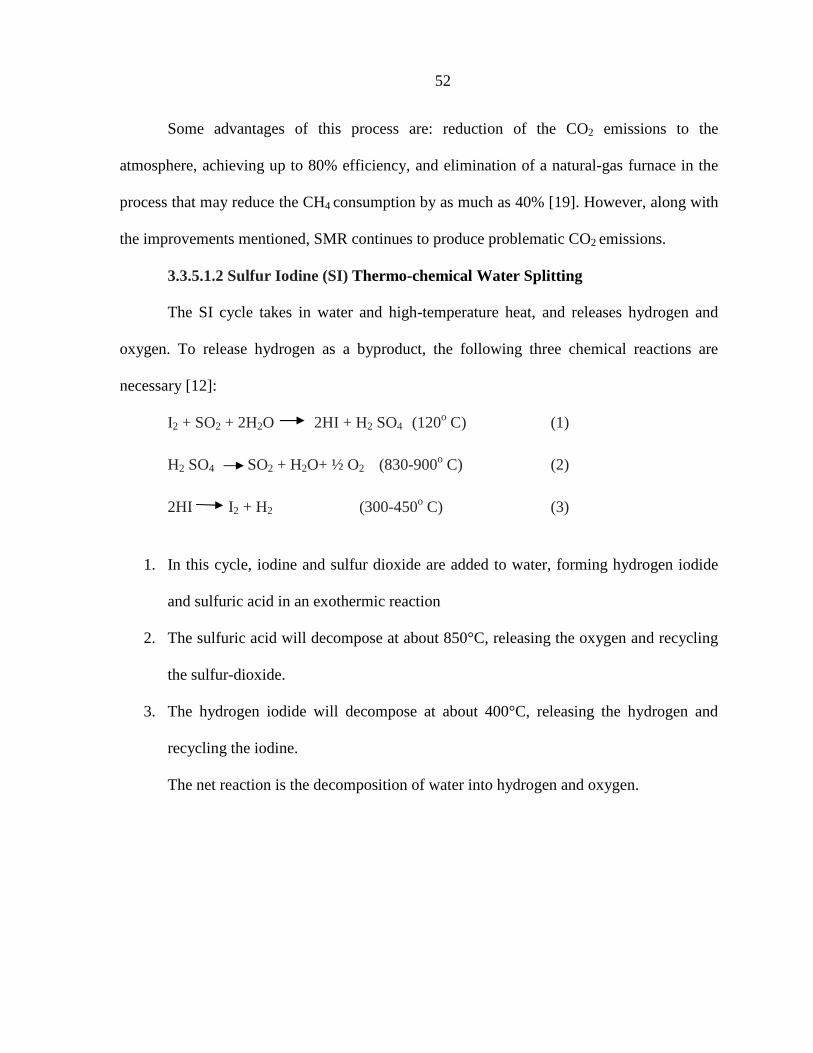
52
Some advantages of this process are: reduction of the CO2 emissions to the
atmosphere, achieving up to 80% efficiency, and elimination of a natural-gas furnace in the
process that may reduce the CH4 consumption by as much as 40% [19]. However, along with
the improvements mentioned, SMR continues to produce problematic CO2 emissions.
3.3.5.1.2 Sulfur Iodine (SI) Thermo-chemical Water Splitting
The SI cycle takes in water and high-temperature heat, and releases hydrogen and
oxygen. To release hydrogen as a byproduct, the following three chemical reactions are
necessary [12]:
I2 + SO2 + 2H2O 2HI + H2 SO4 (120o C) (1) H2 SO4 SO2 + H2O+ ½ O2 (830-900o C) (2)
2HI I2 + H2 (300-450o C) (3)
1. In this cycle, iodine and sulfur dioxide are added to water, forming hydrogen iodide
and sulfuric acid in an exothermic reaction
2. The sulfuric acid will decompose at about 850°C, releasing the oxygen and recycling
the sulfur-dioxide.
3. The hydrogen iodide will decompose at about 400°C, releasing the hydrogen and
recycling the iodine.
The net reaction is the decomposition of water into hydrogen and oxygen.
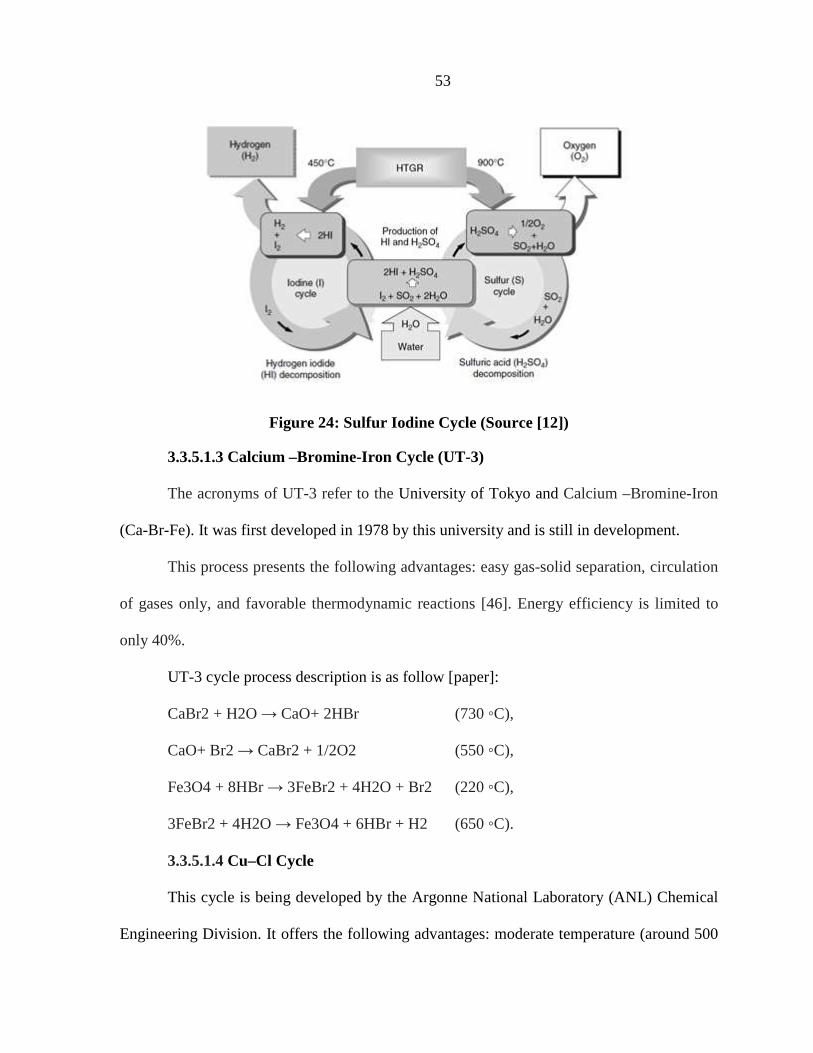
53
Figure 24: Sulfur Iodine Cycle (Source [12])
3.3.5.1.3 Calcium –Bromine-Iron Cycle (UT-3)
The acronyms of UT-3 refer to the University of Tokyo and Calcium –Bromine-Iron
(Ca-Br-Fe). It was first developed in 1978 by this university and is still in development.
This process presents the following advantages: easy gas-solid separation, circulation
of gases only, and favorable thermodynamic reactions [46]. Energy efficiency is limited to
only 40%.
UT-3 cycle process description is as follow [paper]:
CaBr2 + H2O → CaO+ 2HBr (730 ◦C),
CaO+ Br2 → CaBr2 + 1/2O2 (550 ◦C),
Fe3O4 + 8HBr → 3FeBr2 + 4H2O + Br2 (220 ◦C),
3FeBr2 + 4H2O → Fe3O4 + 6HBr + H2 (650 ◦C).
3.3.5.1.4 Cu–Cl Cycle
This cycle is being developed by the Argonne National Laboratory (ANL) Chemical
Engineering Division. It offers the following advantages: moderate temperature (around 500

54
oC), inexpensive chemicals, reduced complexity, high energy efficiency (40-45%) and, if
proven, moderate corrosion issues at 500 oC compared to SI and UT-3 [46] and [19]
processes.
There are three main reactions as described in [12]
2CuCl·nH2O + 2HCl·mH2O → 2CuCl2· (n + m)H2O+ H2, electrolysis (25–80°C)
2CuCl2 + H2O → CuCl2·CuO + 2HCL, hydrolysis (310–375°C)
CuCl2·CuO → 2CuCl+ ½ O2 decomposition (450–530°C)
3.3.5.2 Electromechanical Processes
This process can be used for hydrogen production through an electrolysis process
using a nuclear reactor to provide electricity as input.
The electromechanical processes for hydrogen production using nuclear energy are:
• Water Electrolysis using a Light-Water Reactor (LWR)
• High-Temperature steam electrolysis (HTSE)
3.3.5.2.1. Water Electrolysis by Light-Water Reactor (LWR)
The Light-Water Reactor is the most commonly-used type of nuclear technology in
the world, constituting about 80 percent worldwide of the nearly 440 operating plants [19].
The LWR is a type of thermal reactor that uses normal water as its coolant and
neutron moderator [48]. This process is the least energy-efficient, around 33%, but it does
not emit greenhouse emissions.
A new version of LWR has been in development during the past few years. The
Advances Light-Water Reactor (ALWR) is one of these. Even though is still in the research
and development stage, it has potential to offer higher efficiency and lower cost.
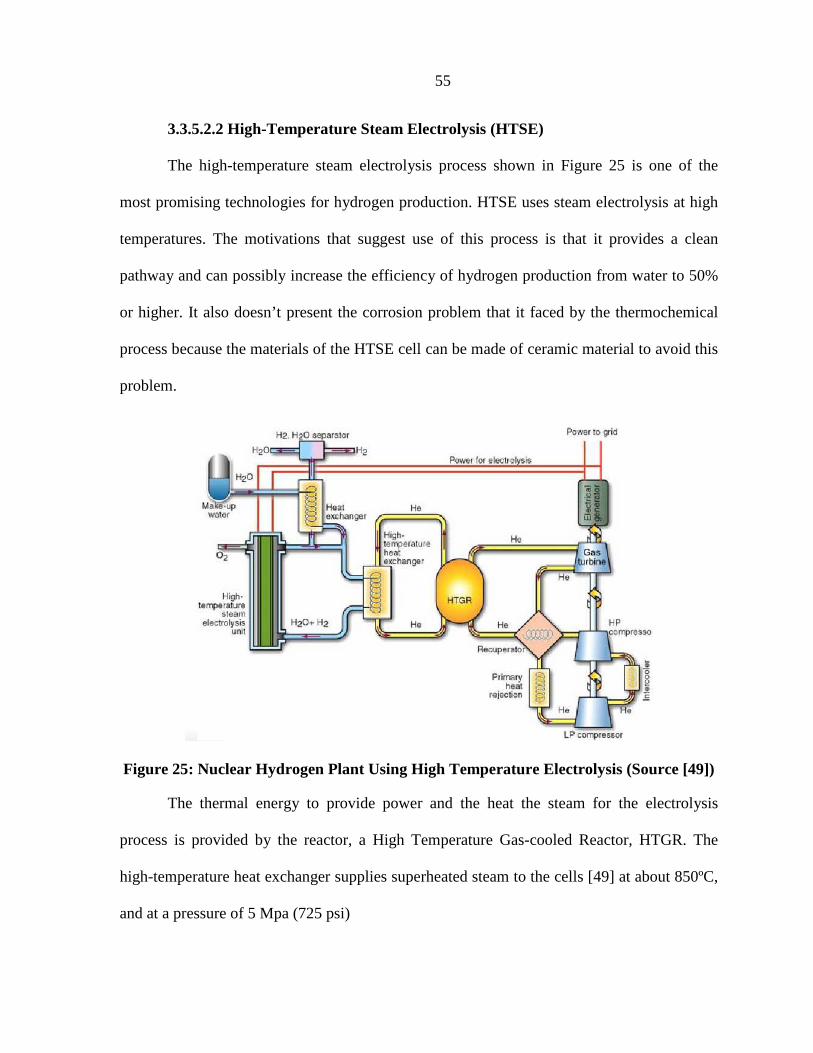
55
3.3.5.2.2 High-Temperature Steam Electrolysis (HTSE)
The high-temperature steam electrolysis process shown in Figure 25 is one of the
most promising technologies for hydrogen production. HTSE uses steam electrolysis at high
temperatures. The motivations that suggest use of this process is that it provides a clean
pathway and can possibly increase the efficiency of hydrogen production from water to 50%
or higher. It also doesn’t present the corrosion problem that it faced by the thermochemical
process because the materials of the HTSE cell can be made of ceramic material to avoid this
problem.
Figure 25: Nuclear Hydrogen Plant Using High Temperature Electrolysis (Source [49])
The thermal energy to provide power and the heat the steam for the electrolysis
process is provided by the reactor, a High Temperature Gas-cooled Reactor, HTGR. The
high-temperature heat exchanger supplies superheated steam to the cells [49] at about 850ºC,
and at a pressure of 5 Mpa (725 psi)
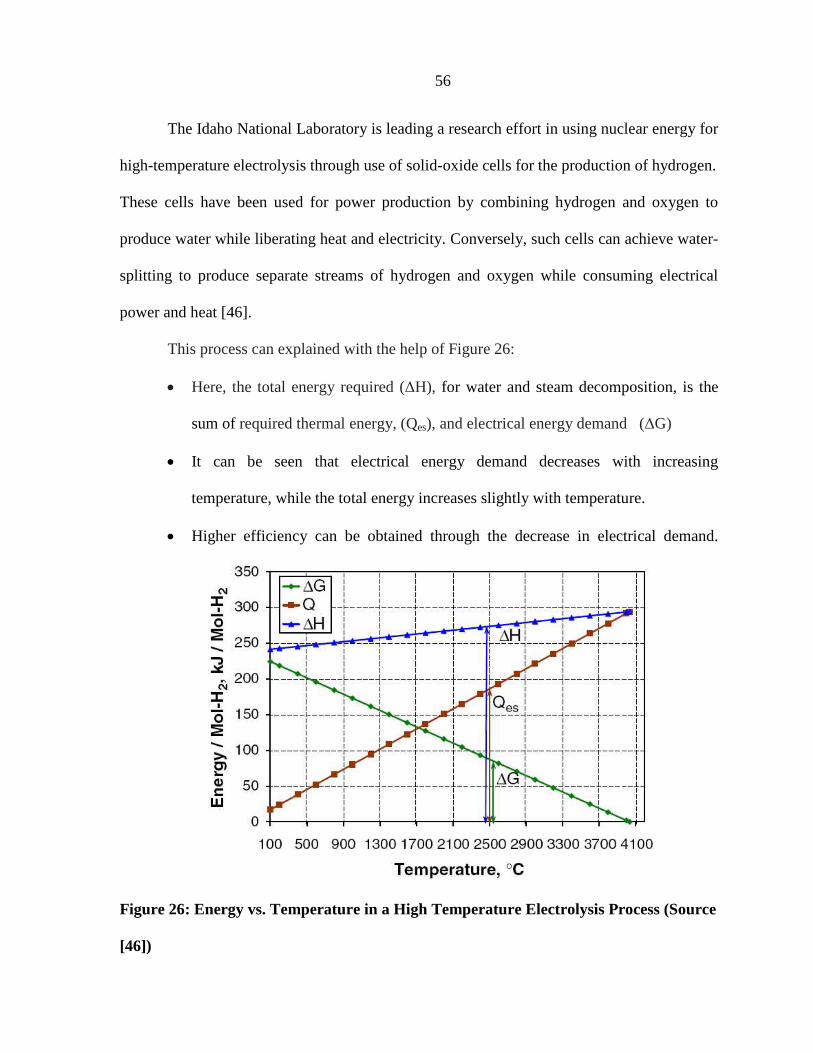
56
The Idaho National Laboratory is leading a research effort in using nuclear energy for
high-temperature electrolysis through use of solid-oxide cells for the production of hydrogen.
These cells have been used for power production by combining hydrogen and oxygen to
produce water while liberating heat and electricity. Conversely, such cells can achieve water-
splitting to produce separate streams of hydrogen and oxygen while consuming electrical
power and heat [46].
This process can explained with the help of Figure 26:
• Here, the total energy required (∆H), for water and steam decomposition, is the
sum of required thermal energy, (Qes), and electrical energy demand (∆G)
• It can be seen that electrical energy demand decreases with increasing
temperature, while the total energy increases slightly with temperature.
• Higher efficiency can be obtained through the decrease in electrical demand.
Figure 26: Energy vs. Temperature in a High Temperature Electrolysis Process (Source
[46])
57
Thermodynamically, operation at high temperature reduces the electrical energy requirement
for electrolysis and also increases the thermal efficiency of the power-generating cycle [46].
The electric energy consumption of the electrolysis process is a significant contributor to the
price of hydrogen production. For example, hydrogen production from Central-Wind
Electricity consumes 57.09 kWh/Kg H2.
Table 10 summaries the options for nuclear hydrogen production mention above [46].
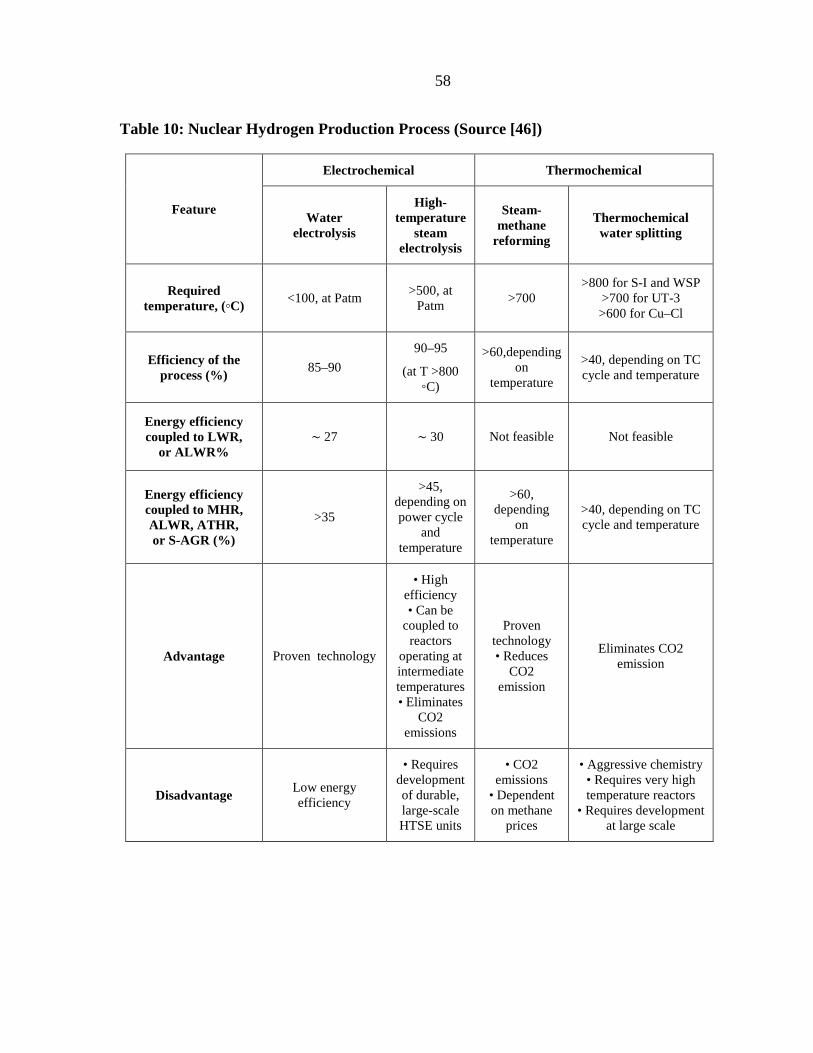
58
Table 10: Nuclear Hydrogen Production Process (Source [46])
Feature
Electrochemical Thermochemical
Water electrolysis
High-temperature
steam electrolysis
Steam-methane
reforming
Thermochemical water splitting
Required temperature, (◦C)
<100, at Patm >500, at
Patm >700
>800 for S-I and WSP >700 for UT-3 >600 for Cu–Cl
Efficiency of the process (%)
85–90
90–95
(at T >800 ◦C)
>60,depending on
temperature
>40, depending on TC cycle and temperature
Energy efficiency coupled to LWR,
or ALWR% ∼ 27 ∼ 30 Not feasible Not feasible
Energy efficiency coupled to MHR, ALWR, ATHR, or S-AGR (%)
>35
>45, depending on power cycle
and temperature
>60, depending
on temperature
>40, depending on TC cycle and temperature
Advantage Proven technology
• High efficiency • Can be
coupled to reactors
operating at intermediate temperatures • Eliminates
CO2 emissions
Proven technology • Reduces
CO2 emission
Eliminates CO2 emission
Disadvantage Low energy efficiency
• Requires development of durable, large-scale HTSE units
• CO2 emissions
• Dependent on methane
prices
• Aggressive chemistry • Requires very high temperature reactors
• Requires development at large scale
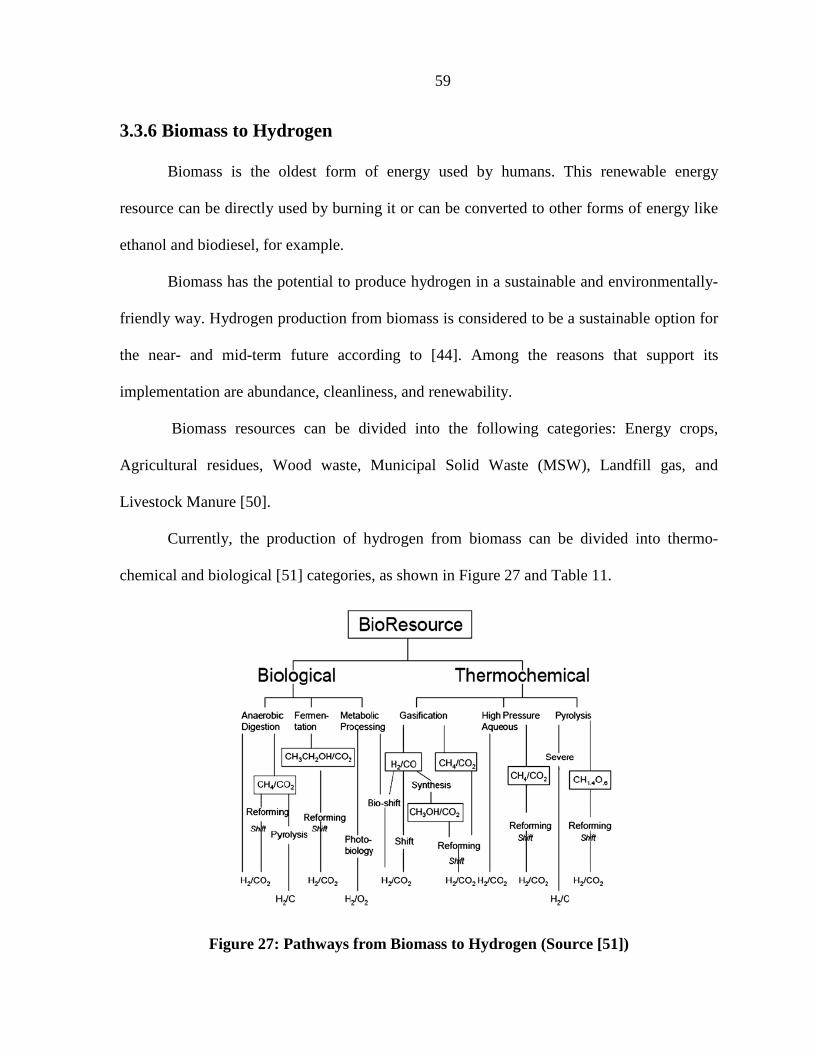
59
3.3.6 Biomass to Hydrogen
Biomass is the oldest form of energy used by humans. This renewable energy
resource can be directly used by burning it or can be converted to other forms of energy like
ethanol and biodiesel, for example.
Biomass has the potential to produce hydrogen in a sustainable and environmentally-
friendly way. Hydrogen production from biomass is considered to be a sustainable option for
the near- and mid-term future according to [44]. Among the reasons that support its
implementation are abundance, cleanliness, and renewability.
Biomass resources can be divided into the following categories: Energy crops,
Agricultural residues, Wood waste, Municipal Solid Waste (MSW), Landfill gas, and
Livestock Manure [50].
Currently, the production of hydrogen from biomass can be divided into thermo-
chemical and biological [51] categories, as shown in Figure 27 and Table 11.
Figure 27: Pathways from Biomass to Hydrogen (Source [51])
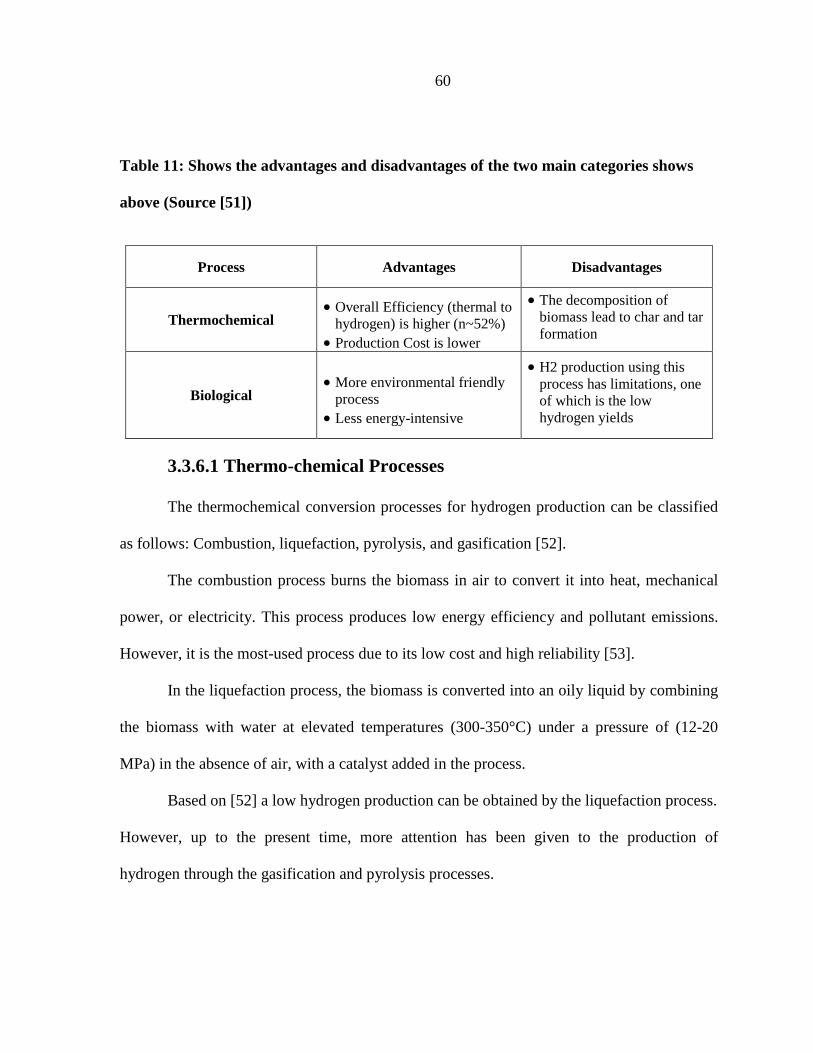
60
Table 11: Shows the advantages and disadvantages of the two main categories shows
above (Source [51])
Process Advantages Disadvantages
Thermochemical • Overall Efficiency (thermal to
hydrogen) is higher (n~52%) • Production Cost is lower
• The decomposition of biomass lead to char and tar formation
Biological • More environmental friendly
process • Less energy-intensive
• H2 production using this process has limitations, one of which is the low hydrogen yields
3.3.6.1 Thermo-chemical Processes
The thermochemical conversion processes for hydrogen production can be classified
as follows: Combustion, liquefaction, pyrolysis, and gasification [52].
The combustion process burns the biomass in air to convert it into heat, mechanical
power, or electricity. This process produces low energy efficiency and pollutant emissions.
However, it is the most-used process due to its low cost and high reliability [53].
In the liquefaction process, the biomass is converted into an oily liquid by combining
the biomass with water at elevated temperatures (300-350°C) under a pressure of (12-20
MPa) in the absence of air, with a catalyst added in the process.
Based on [52] a low hydrogen production can be obtained by the liquefaction process.
However, up to the present time, more attention has been given to the production of
hydrogen through the gasification and pyrolysis processes.
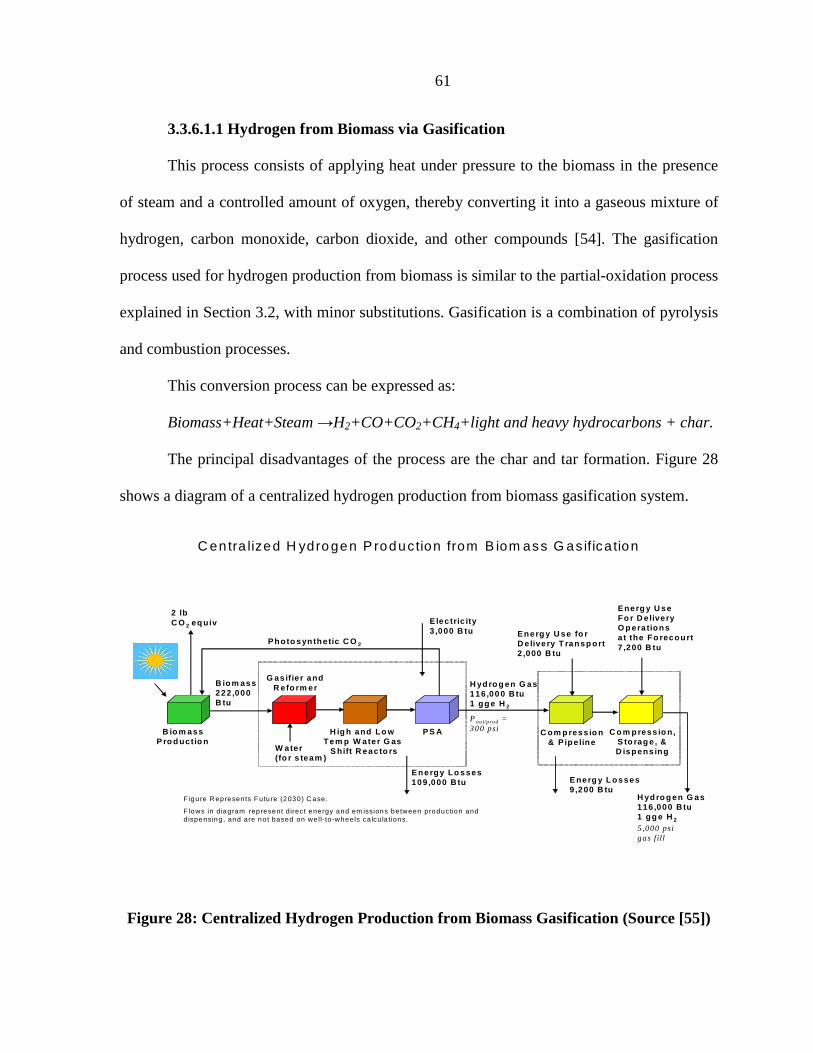
61
3.3.6.1.1 Hydrogen from Biomass via Gasification
This process consists of applying heat under pressure to the biomass in the presence
of steam and a controlled amount of oxygen, thereby converting it into a gaseous mixture of
hydrogen, carbon monoxide, carbon dioxide, and other compounds [54]. The gasification
process used for hydrogen production from biomass is similar to the partial-oxidation process
explained in Section 3.2, with minor substitutions. Gasification is a combination of pyrolysis
and combustion processes.
This conversion process can be expressed as:
Biomass+Heat+Steam →H2+CO+CO2+CH4+light and heavy hydrocarbons + char.
The principal disadvantages of the process are the char and tar formation. Figure 28
shows a diagram of a centralized hydrogen production from biomass gasification system.
Figure 28: Centralized Hydrogen Production from Biomass Gasification (Source [55])
C entra lized H ydro gen P roduction from B iom ass G as ifica tion
B io m assP ro d uctio n
G as if ie r andR efo rm er
H ig h and Lo w Tem p W ater G as
S hift R eacto rs
PS A
Photo synthetic C O 2
2 lbC O 2 eq uiv
B iom ass222 ,000 B tu
E lec tric ity3 ,000 B tu
H yd ro g en G as116 ,00 0 B tu1 gg e H 2
Energy Lo sses109 ,000 B tu
W ater (fo r s team )
5 ,000 psigas f il l
Pou t/p rod = 300 psi C o m p ress io n,
S to rag e , & D ispens ing
C om p ress io n& P ipe line
Energ y U seFo r D e liveryO p era tionsat the Fo recourt7 ,200 B tu
Energ y U se fo rD e livery T ransp ort 2 ,000 B tu
E nerg y L osses9 ,200 B tu
H yd ro g en G as116 ,000 B tu1 gg e H 2
F igure R epresents F u tu re (2030) C ase.
F lows in diagram represent direct energy and em issions be tween production and d ispensing , and are no t based on we ll-to-wheels ca lcu la tions.
62
This process has been selected as a near-term commercial application of hydrogen
production from biomass due to its similarity to coal gasification [54].
3.3.6.1.2 Hydrogen from biomass via Pyrolysis
According to [54] this process consists of heating the biomass to 500 oC in the
absence of air to convert it into liquid, solid, and gaseous fractions. This conversion process
can be expressed as follows:
Biomass + Heat → H2 + CO + CH4 + other products
Pyrolysis reaction is an endothermic reaction. It can be classified into two sub-
processes: slow pyrolysis and fast pyrolysis. Slow pyrolysis is not commonly used for
hydrogen production due to its charcoal production.
The fast pyrolysis process, on the other hand, uses a high temperature (around 800 to
900 oC) to which the biomass is heated rapidly in the absence of air to form vapor, followed
by subsequent condensation to a dark brown bio-liquid [54].
The advantage of this process is that leaves a residual of as little as 10% of the solid
char materials and converts up to 60% into gas-rich hydrogen and carbon monoxides. For
that reason, this process is an excellent competitor compared to conventional gasification
methods, even though it is in early stage of development [54].
3.3.6.2 Biological Hydrogen Production (BioH2)
The biological process is another method for biomass-based hydrogen production.
Hydrogen is produced through the use of natural biological processes used to convert and
store energy produced by sunlight [35]. These processes are considered to be carbon-neutral
and renewable energy resource for hydrogen production for the long-term future.
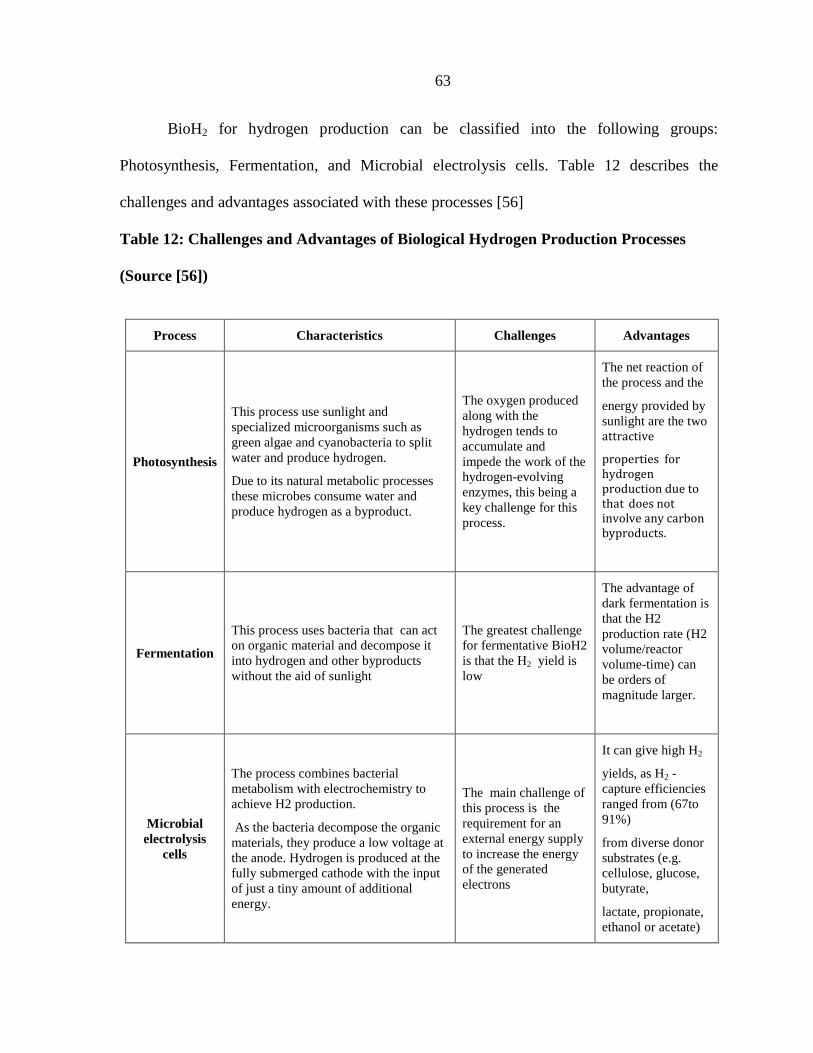
63
BioH2 for hydrogen production can be classified into the following groups:
Photosynthesis, Fermentation, and Microbial electrolysis cells. Table 12 describes the
challenges and advantages associated with these processes [56]
Table 12: Challenges and Advantages of Biological Hydrogen Production Processes
(Source [56])
Process Characteristics Challenges Advantages
Photosynthesis
This process use sunlight and specialized microorganisms such as green algae and cyanobacteria to split water and produce hydrogen.
Due to its natural metabolic processes these microbes consume water and produce hydrogen as a byproduct.
The oxygen produced along with the hydrogen tends to accumulate and impede the work of the hydrogen-evolving enzymes, this being a key challenge for this process.
The net reaction of the process and the
energy provided by sunlight are the two attractive
properties for
hydrogen
production due to
that does not
involve any carbon
byproducts.
Fermentation
This process uses bacteria that can act on organic material and decompose it into hydrogen and other byproducts without the aid of sunlight
The greatest challenge for fermentative BioH2 is that the H2 yield is low
The advantage of dark fermentation is that the H2 production rate (H2 volume/reactor volume-time) can be orders of magnitude larger.
Microbial electrolysis
cells
The process combines bacterial metabolism with electrochemistry to achieve H2 production.
As the bacteria decompose the organic materials, they produce a low voltage at the anode. Hydrogen is produced at the fully submerged cathode with the input of just a tiny amount of additional energy.
The main challenge of this process is the requirement for an external energy supply to increase the energy of the generated electrons
It can give high H2
yields, as H2 -capture efficiencies ranged from (67to 91%)
from diverse donor substrates (e.g. cellulose, glucose, butyrate,
lactate, propionate, ethanol or acetate)

64
Even though the biomass is an excellent candidate for hydrogen production due to it
is sustainability and environmental-friendlyness, at the present time no commercial plants
exist to produce hydrogen from biomass.
3.4 Hydrogen Production Technology Overview
The sections above explained the details of the technologies for hydrogen production
both in use and under development. Hydrogen production technologies must overcome
present challenges in order to produce a sustainable energy solution for the future.
This section summarizes the principal technologies for hydrogen production,
challenges, and benefits, and a time frame for their implementation as is indicated in Table
13.
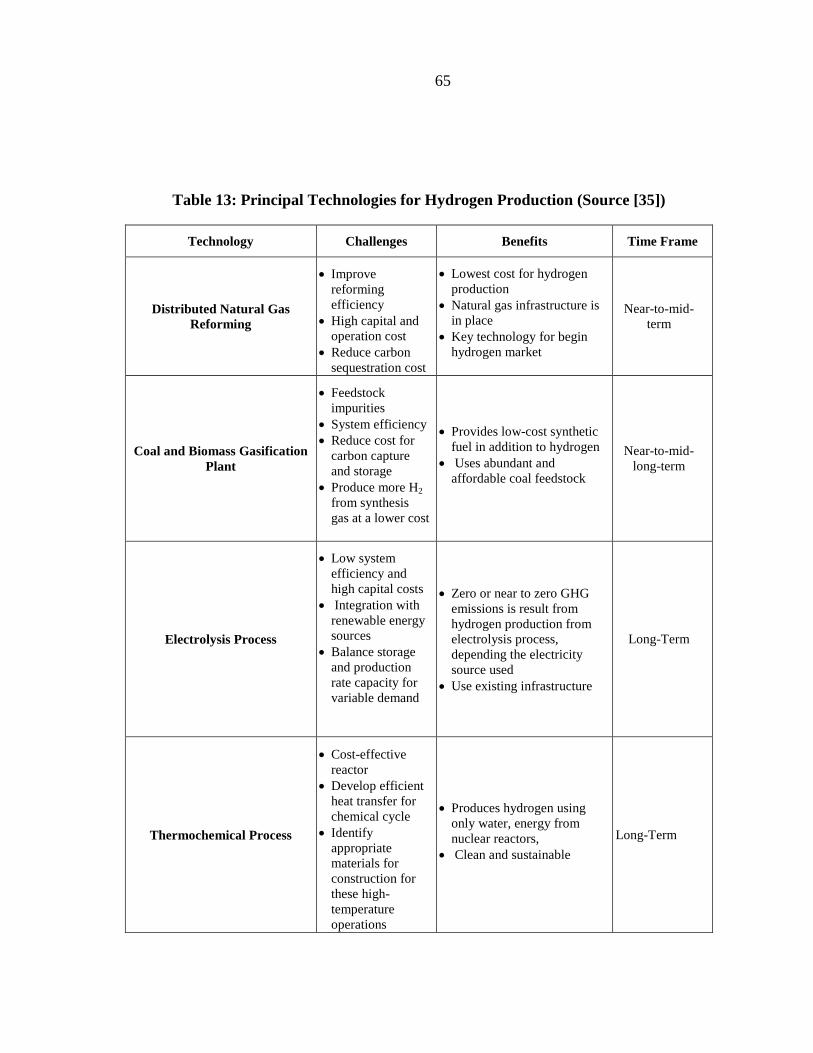
65
Table 13: Principal Technologies for Hydrogen Production (Source [35])
Technology Challenges Benefits Time Frame
Distributed Natural Gas Reforming
• Improve reforming efficiency
• High capital and operation cost
• Reduce carbon sequestration cost
• Lowest cost for hydrogen production
• Natural gas infrastructure is in place
• Key technology for begin hydrogen market
Near-to-mid-term
Coal and Biomass Gasification Plant
• Feedstock impurities
• System efficiency • Reduce cost for
carbon capture and storage
• Produce more H2
from synthesis gas at a lower cost
• Provides low-cost synthetic fuel in addition to hydrogen
• Uses abundant and affordable coal feedstock
Near-to-mid-long-term
Electrolysis Process
• Low system efficiency and high capital costs
• Integration with renewable energy sources
• Balance storage and production rate capacity for variable demand
• Zero or near to zero GHG emissions is result from hydrogen production from electrolysis process, depending the electricity source used
• Use existing infrastructure
Long-Term
Thermochemical Process
• Cost-effective reactor
• Develop efficient heat transfer for chemical cycle
• Identify appropriate materials for construction for these high-temperature operations
• Produces hydrogen using only water, energy from nuclear reactors,
• Clean and sustainable
Long-Term

66
According to [35] hydrogen cost, competitiveness, and time to market will be affected
by both the location and the scale of the technology.
The scale of production of hydrogen can be classified into Distributed and Central
types, as shown in Figure 29.
• Distributed Production: These types of technologies produce hydrogen on-site
at the refueling station. They will be used in the early stages of hydrogen
introduction with closely available feedstock. This technology could help to
reduce the “chicken and egg” problem of the hydrogen. It could reduce the initial
infrastructure costs and lead to lower infrastructure-transition costs.
• Central Production: These plants will be used to satisfy high demand for
hydrogen. It will offer lower cost once the scale is realized, resulting in a
transition from distributed to centralized production. These plants require an
efficient and low-cost delivery infrastructure [35].

67
Figure 29: Timeframe to Market Distributed and Central Production Plants (Source
[35])

68
CHAPTER 4. HYDROGEN DELIVERY, STORAGE AND FUELING
INFRASTRUCTURE
4.1 Overview
To succeed as an alternative fuel of the future, hydrogen must overcome present-day
technical and commercial challenges. There is, for example, no infrastructure system like
those that exist for electricity, natural gas, or gasoline for delivering hydrogen to consumers.
The famous “chicken and egg” problem is one of the major challenges that it is facing
the hydrogen pathways. Due to the lack of adequate fueling options, consumers will be
unwilling to purchase hydrogen-fueled vehicles and, conversely, fueling infrastructure is
unlikely to develop until a sufficient number of such vehicles are in use.
This chapter discusses the delivery and refueling infrastructure needed to transport
hydrogen from the production plant (central or distributed) to the refueling station, and
today’s available storage methods.
4.2 Hydrogen Delivery Systems
A delivery system is an essential component of the H2 infrastructure, and is one of the
principal contributors to the cost, emissions, and energy use related to the hydrogen pathway
[57].
Hydrogen can be delivered via three main methods: compressed gaseous hydrogen by
truck, liquid hydrogen by truck, and gaseous hydrogen by pipeline.
To deliver hydrogen two physical approaches, compression and liquefaction, can be
used. Both methods are widely-used at the present time. Both have the objective of
69
increasing the volumetric energy density of hydrogen to achieve energy densities consistent
with economic transport.
• Liquefaction: Liquefaction is accomplished by cooling H2 to below 20K (-253ºC)
to form a liquid. It is a multi-stage process using a series of refrigerants and
compression/expansion loops to produce the necessary extreme cold. It presents
the advantage of high energy density but at a very high capital cost. It requires use
of 1/3 of the energy in the hydrogen itself. This process is employed only in small
plants by merchant hydrogen vendors [58] and [59].
• Compression: Compression of hydrogen is less energy intensive than
liquefaction. It is a process that can be accomplished at small scales (on the order
of a few kg/day) all the way up to very large scales (hundreds of tons per day). In
this process, mechanical compressors are used to raise the pressure of a fixed
quantity of gas, often delivering it into a high pressure storage device.
Compressors require expensive materials to prevent hydrogen embrittlement and
the associated risk of part failures during use [58].
According to [57] the selection of the lowest-cost of hydrogen delivery will depend
on the attributes of geography and market characteristics, including population and radius,
population density, size and number of refueling stations, and market penetration of fuel-cell
vehicles. This study also analyzed two types of delivery models with an objective of
identifying low-cost options for H2 delivery. The two types of delivery models considered
were:
• Hydrogen Transmission Model: H2 is transported from one point to another
under control of two parameters: flow rate (tons/day) and transport distance (km).
70
The model includes compressors or liquefiers at the hydrogen plant, and truck or
pipeline methods for delivery.
• Hydrogen Distribution Model : This model includes the refueling-station
network as along with compressors or liquefiers at the hydrogen plant and trucks
and pipelines for delivery. The distribution distances, dependent in the population
density of the city, the physical size (City Radius, km), and the size and the
number of required refueling station were also considered.
4.2.1 Delivery of Compressed Hydrogen
The delivery of hydrogen in compressed gas tanks (tube trailer) is commonly used for
industrial purposes. Figure 30 shows possible compressed hydrogen delivery pathways.
For transport H2 gas by truck, a very high pressure is needed to maximize tank
capacities. This method is used over short distances for relatively small volumes (~300 kg) of
hydrogen. It is not feasible for large volumes and longer distance. Moreover, it requires a
high-pressure interface for the vehicle fuelling application .
However, tube trailers can be used as storage systems at refueling stations, reducing
the cost of storage. This also reduces the energy required to move hydrogen from one
pressurized vessel to another [59].
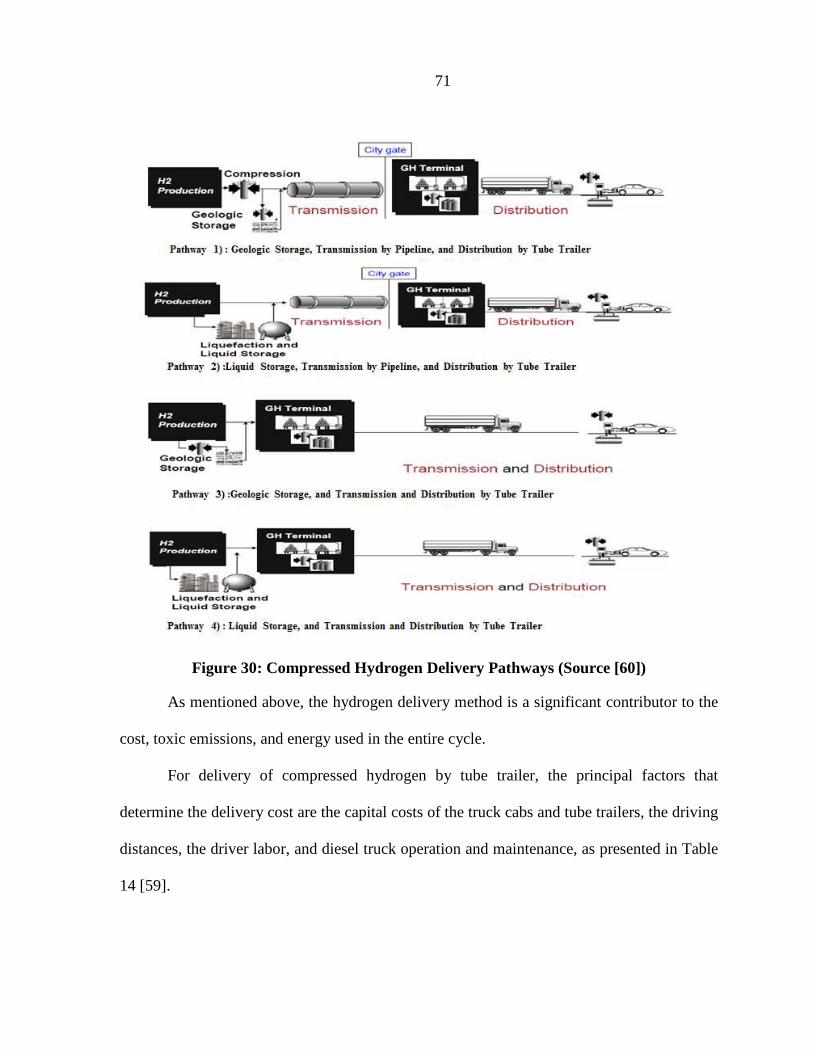
71
Figure 30: Compressed Hydrogen Delivery Pathways (Source [60])
As mentioned above, the hydrogen delivery method is a significant contributor to the
cost, toxic emissions, and energy used in the entire cycle.
For delivery of compressed hydrogen by tube trailer, the principal factors that
determine the delivery cost are the capital costs of the truck cabs and tube trailers, the driving
distances, the driver labor, and diesel truck operation and maintenance, as presented in Table
14 [59].

72
Table 14: Compressed Gas Truck Delivery System Characteristics (Source [59])
Total Truck Capacity 300 kg H2
Truck P (max) 2350 psia
Truck P (min) 440 psia
Tube Trailer Cost $150,000
Cab Cost $90,000
Undercarriage Cost $60,000
Also, this delivery method contributes to emission of a significant amount of CO2 due
to use of diesel fuel in the transport trucks.
4.2.2 Delivery of Liquid Hydrogen
The volume density of hydrogen is increased by truck delivery of liquid hydrogen.
Figure 31 shows Liquid Hydrogen Delivery Pathways. This method of delivery is used for
large volumes and medium to long distances. For example, it enables a single truck to carry
up to 10 times the volume of an equivalent gaseous tube trailer (up to 4000 kg for liquid,
compared with 300 kg for gaseous) [59].
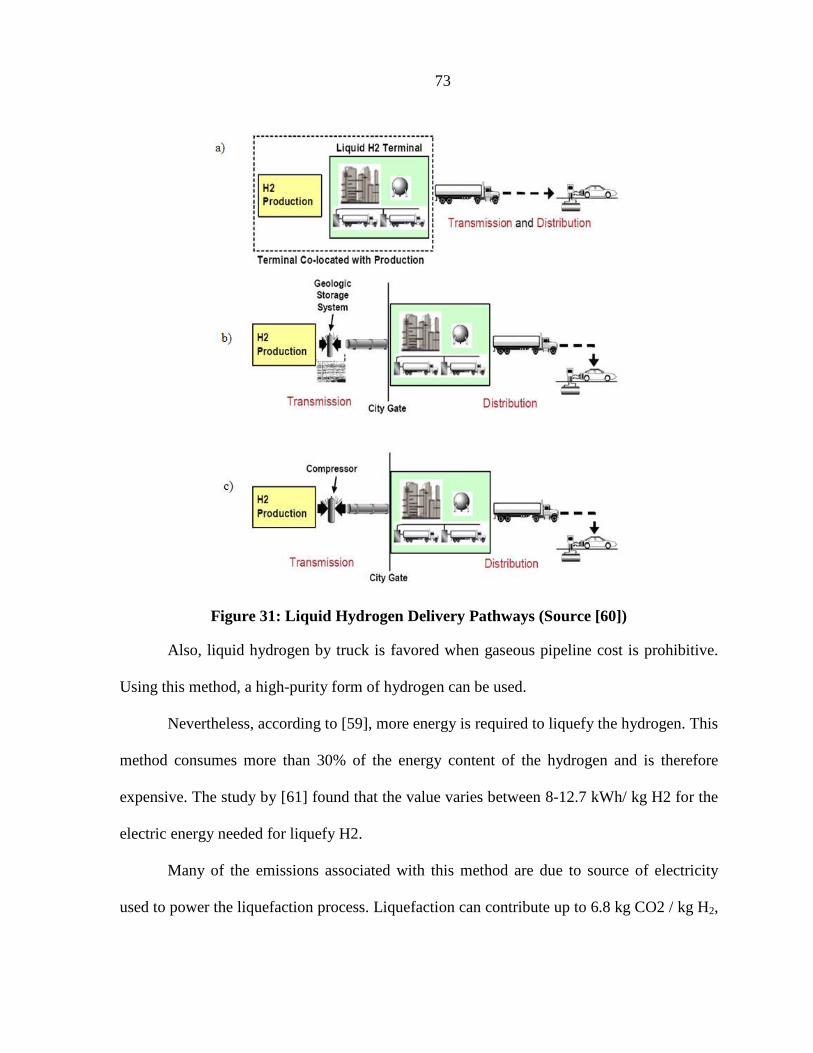
73
Figure 31: Liquid Hydrogen Delivery Pathways (Source [60])
Also, liquid hydrogen by truck is favored when gaseous pipeline cost is prohibitive.
Using this method, a high-purity form of hydrogen can be used.
Nevertheless, according to [59], more energy is required to liquefy the hydrogen. This
method consumes more than 30% of the energy content of the hydrogen and is therefore
expensive. The study by [61] found that the value varies between 8-12.7 kWh/ kg H2 for the
electric energy needed for liquefy H2.
Many of the emissions associated with this method are due to source of electricity
used to power the liquefaction process. Liquefaction can contribute up to 6.8 kg CO2 / kg H2,
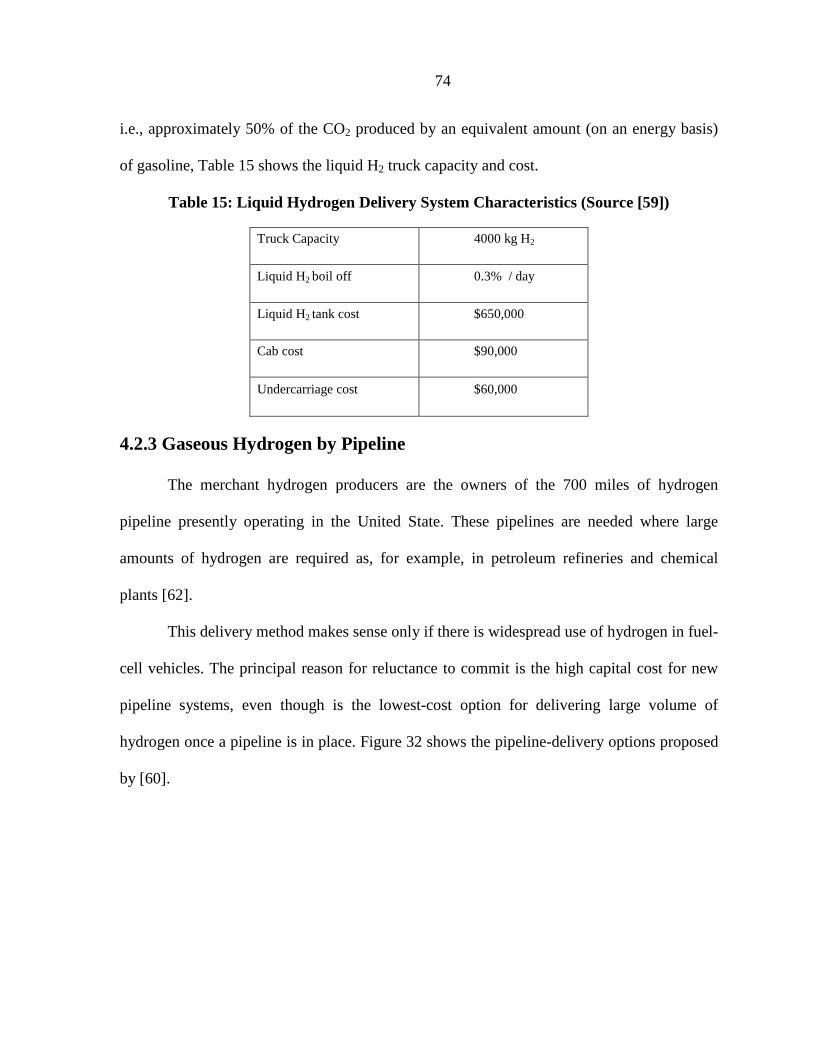
74
i.e., approximately 50% of the CO2 produced by an equivalent amount (on an energy basis)
of gasoline, Table 15 shows the liquid H2 truck capacity and cost.
Table 15: Liquid Hydrogen Delivery System Characteristics (Source [59])
Truck Capacity 4000 kg H2
Liquid H2 boil off 0.3% / day
Liquid H2 tank cost $650,000
Cab cost $90,000
Undercarriage cost $60,000
4.2.3 Gaseous Hydrogen by Pipeline
The merchant hydrogen producers are the owners of the 700 miles of hydrogen
pipeline presently operating in the United State. These pipelines are needed where large
amounts of hydrogen are required as, for example, in petroleum refineries and chemical
plants [62].
This delivery method makes sense only if there is widespread use of hydrogen in fuel-
cell vehicles. The principal reason for reluctance to commit is the high capital cost for new
pipeline systems, even though is the lowest-cost option for delivering large volume of
hydrogen once a pipeline is in place. Figure 32 shows the pipeline-delivery options proposed
by [60].
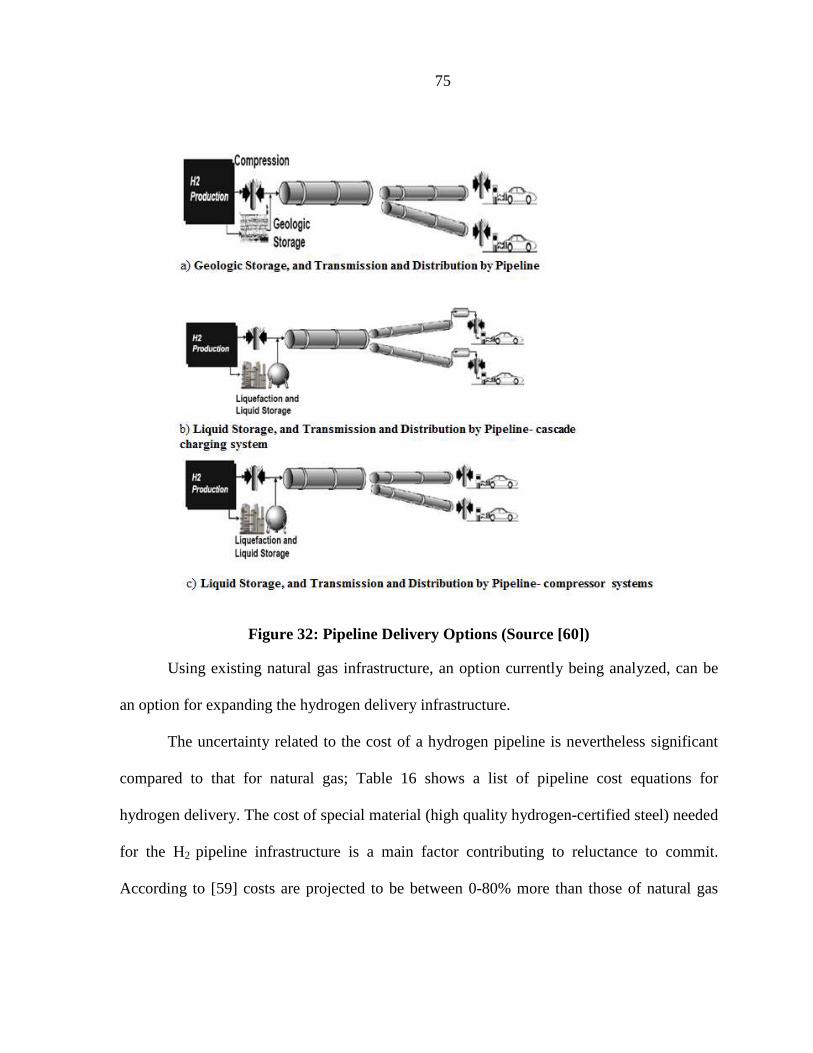
75
Figure 32: Pipeline Delivery Options (Source [60])
Using existing natural gas infrastructure, an option currently being analyzed, can be
an option for expanding the hydrogen delivery infrastructure.
The uncertainty related to the cost of a hydrogen pipeline is nevertheless significant
compared to that for natural gas; Table 16 shows a list of pipeline cost equations for
hydrogen delivery. The cost of special material (high quality hydrogen-certified steel) needed
for the H2 pipeline infrastructure is a main factor contributing to reluctance to commit.
According to [59] costs are projected to be between 0-80% more than those of natural gas
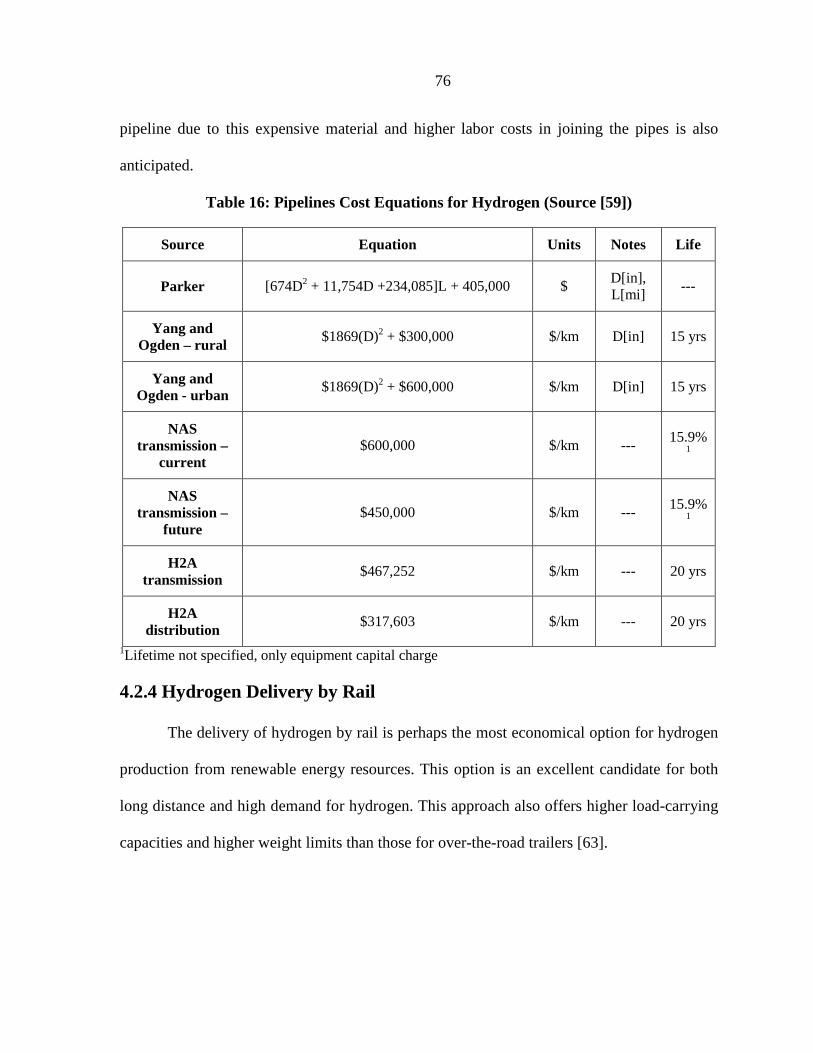
76
pipeline due to this expensive material and higher labor costs in joining the pipes is also
anticipated.
Table 16: Pipelines Cost Equations for Hydrogen (Source [59])
Source Equation Units Notes Life
Parker [674D2 + 11,754D +234,085]L + 405,000 $ D[in], L[mi] ---
Yang and Ogden – rural $1869(D)2 + $300,000 $/km D[in] 15 yrs
Yang and Ogden - urban $1869(D)2 + $600,000 $/km D[in] 15 yrs
NAS transmission –
current $600,000 $/km --- 15.9%
1
NAS transmission –
future $450,000 $/km --- 15.9%
1
H2A transmission $467,252 $/km --- 20 yrs
H2A distribution $317,603 $/km --- 20 yrs
1Lifetime not specified, only equipment capital charge
4.2.4 Hydrogen Delivery by Rail
The delivery of hydrogen by rail is perhaps the most economical option for hydrogen
production from renewable energy resources. This option is an excellent candidate for both
long distance and high demand for hydrogen. This approach also offers higher load-carrying
capacities and higher weight limits than those for over-the-road trailers [63].
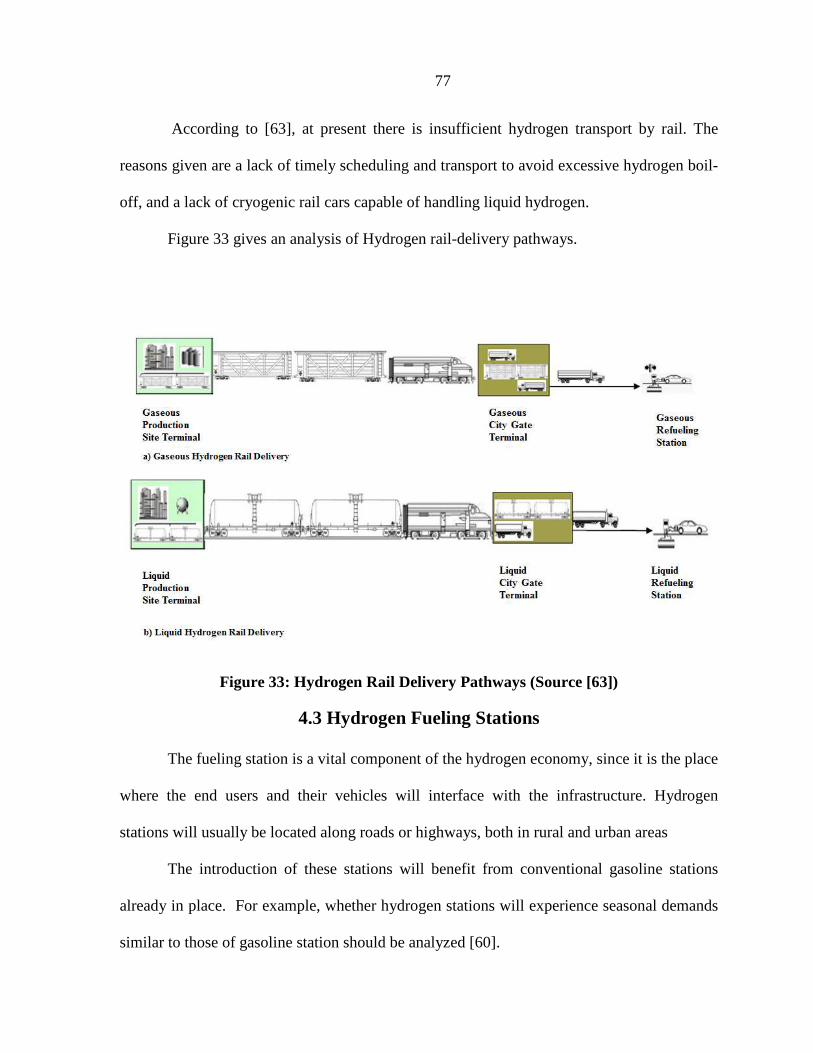
77
According to [63], at present there is insufficient hydrogen transport by rail. The
reasons given are a lack of timely scheduling and transport to avoid excessive hydrogen boil-
off, and a lack of cryogenic rail cars capable of handling liquid hydrogen.
Figure 33 gives an analysis of Hydrogen rail-delivery pathways.
Figure 33: Hydrogen Rail Delivery Pathways (Source [63])
4.3 Hydrogen Fueling Stations
The fueling station is a vital component of the hydrogen economy, since it is the place
where the end users and their vehicles will interface with the infrastructure. Hydrogen
stations will usually be located along roads or highways, both in rural and urban areas
The introduction of these stations will benefit from conventional gasoline stations
already in place. For example, whether hydrogen stations will experience seasonal demands
similar to those of gasoline station should be analyzed [60].

78
However, the fueling stations are components that must be carefully evaluated. For
instance, due to the differing methods for hydrogen production, (onsite vs. centralized
production) and delivery (compressed H2 via truck delivery, liquid H2 via truck delivery and
compressed H2 via pipeline delivery) the fueling station, unlike gasoline station, will need to
adapt to a variety of new conditions [64].
Therefore, based on [5], evolution of several different types of fueling station,
including a Compressed Hydrogen Station, a Liquid Hydrogen Station, a Pipeline Hydrogen
Station, and a Mobile Hydrogen Station, is likely: Table 17 presents an overview of the
station types.

79
Table 17: Hydrogen Fueling Stations Overview (Source [59])
Station Type Systems Diagram Characteristics
Compressed Hydrogen
Station
• Takes advantages of the tube trailer in order to store the hydrogen. It can reduce the cost and energy use.
• Two arrangements can be made: cascade and booster:
o Cascade: Divide the storage volume into multiple banks to sequentially fill the FCV. Requires high compression energy
o Booster: Stores a larger volume of H2 at an intermediate pressure. Less energy is required, but more compressors are needed.
Liquid Hydrogen
Station
• The station has the possibility of dispensing either liquid or compressed hydrogen. Even though is not ideal from an energy-use perspective, it can reduce costs for delivery and storage.
• Key components: storage tank, cryogenic hydrogen pump and vaporizer. The last unit can conserve energy by pumping the liquid up to pressure before vaporizing rather than compressing a gas.
Pipeline Hydrogen
Station
• The station consists of a gas meter, hydrogen compressor to increase pipeline pressures (typically below 1000 psi) to storage pressure (above 6000 psi), hydrogen storage tanks, and dispensers.
• The pipeline network improves the cost of H2 for existing and additional station.
• Stations built near an existing hydrogen pipeline have the advantage of a reliable low-cost source of hydrogen and eliminate the need for on-site production truck delivery.
Mobile Hydrogen
Station
• This is the simplest type of station. It consists only of high-pressure gaseous hydrogen storage and dispenser.
80
The fueling station represents one of the major obstacles for the hydrogen economy.
According to [65] the 'chicken and egg' problem will be difficult to overcome. "Who will
invest in the manufacture of fuel cell vehicles if there is no widespread hydrogen supply?”
In order to address the “chicken and egg” problem facing the hydrogen economy, the
National Renewable Energy Laboratory (NREL), in collaboration with the Department of
Energy (DOE), has analyzed the minimum infrastructure that could support the introduction
of hydrogen-fueling station in its paper titled “Analysis of Hydrogen Infrastructure needed to
enable Commercial Introduction of Hydrogen Fueled Vehicles” [66].
The study was able to determine the location and number of possible hydrogen
stations nationwide that would make hydrogen fueling feasible. Figure 34 shows Proposed
Hydrogen Fueling Stations along Major Interstates. Population densities and traffic volumes
(vehicles per day) were identified throughout the U.S. interstate system.

81
Figure 34: Proposed Hydrogen Fueling Stations in the U.S. (Source [66])
The study used a standard station configuration and cost for the analysis presented in
[66]. Table 18 displays the Standard Station configurations and their construction costs.
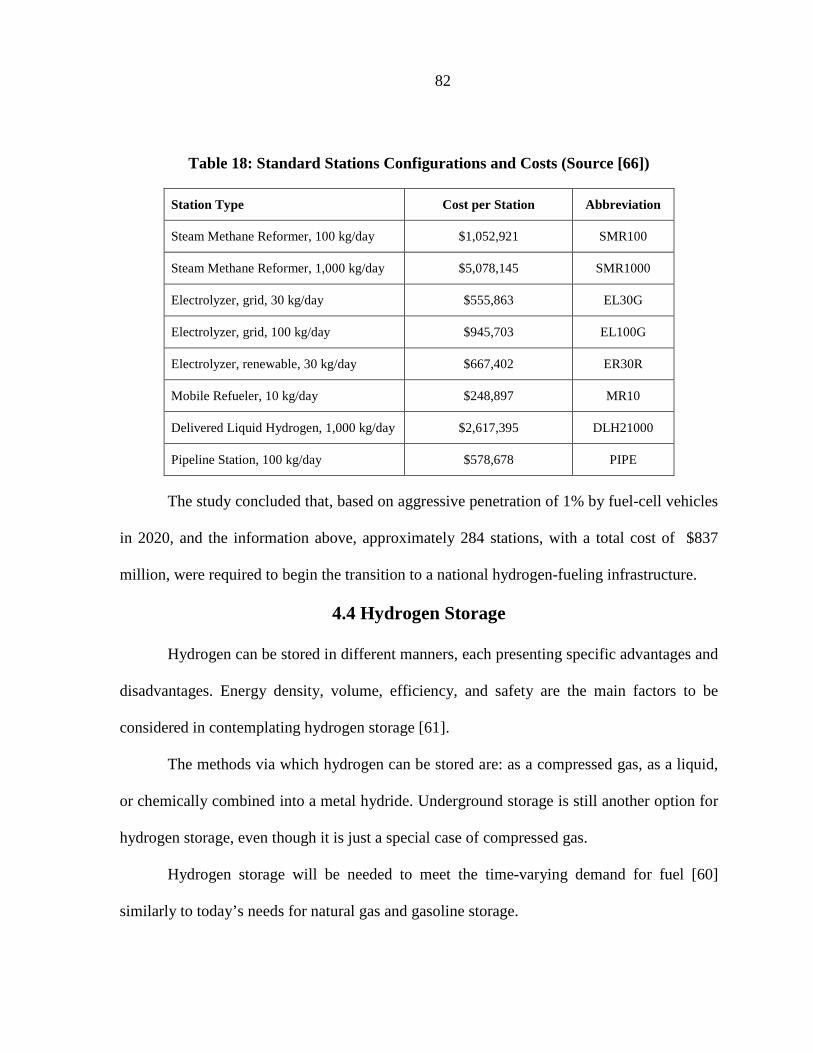
82
Table 18: Standard Stations Configurations and Costs (Source [66])
Station Type Cost per Station Abbreviation
Steam Methane Reformer, 100 kg/day $1,052,921 SMR100
Steam Methane Reformer, 1,000 kg/day $5,078,145 SMR1000
Electrolyzer, grid, 30 kg/day $555,863 EL30G
Electrolyzer, grid, 100 kg/day $945,703 EL100G
Electrolyzer, renewable, 30 kg/day $667,402 ER30R
Mobile Refueler, 10 kg/day $248,897 MR10
Delivered Liquid Hydrogen, 1,000 kg/day $2,617,395 DLH21000
Pipeline Station, 100 kg/day $578,678 PIPE
The study concluded that, based on aggressive penetration of 1% by fuel-cell vehicles
in 2020, and the information above, approximately 284 stations, with a total cost of $837
million, were required to begin the transition to a national hydrogen-fueling infrastructure.
4.4 Hydrogen Storage
Hydrogen can be stored in different manners, each presenting specific advantages and
disadvantages. Energy density, volume, efficiency, and safety are the main factors to be
considered in contemplating hydrogen storage [61].
The methods via which hydrogen can be stored are: as a compressed gas, as a liquid,
or chemically combined into a metal hydride. Underground storage is still another option for
hydrogen storage, even though it is just a special case of compressed gas.
Hydrogen storage will be needed to meet the time-varying demand for fuel [60]
similarly to today’s needs for natural gas and gasoline storage.
83
4.4.1 Compressed Hydrogen
High-pressure tanks are needed to store compressed gaseous hydrogen (CGH2). Due
to the low energy density of compressed hydrogen, the storage volume per unit of energy is
high, resulting in higher capital and operating costs
According to [61], 4-15% of the stored hydrogen energy content is needed to
accomplish compression.
Cost, volume, and weight constrains are key factors that will determine the storage
pressure and tank materials [59].
4.4.2 Liquid Hydrogen
Liquid hydrogen (LH2) is stored in cryogenic vessels. To reach a full liquid state, LH2
must be cooled to below −252.87°C. Liquid-hydrogen storage presents losses due to liquid
boil-off. At its boiling point any heat transfer to liquid causes some hydrogen evaporation,
the major disadvantage of this method. This method results in a net loss of about 30% of the
hydrogen energy content.
Liquid hydrogen storage is the most expensive storage method.
4.4.3 Metal Hydrides
Metal hydride systems can either be low temperature (-150 oC) or high temperature
(300 oC). Either method is absent of safety concerns such as leakage that can be a problem
with compressed hydrogen and LH2. This method is therefore one of the safest methods for
storing hydrogen.

84
According to [67] the total hydrogen absorbed is around 1-2% of the total weight of
the storage medium. The disadvantage of this method is that the considerable inert mass of
metal must be installed or even moved around.
85
CHAPTER 5. END USE TECHNOLOGIES
5.1 Introduction
The need for use of more sustainable energy systems to reduce dependence on
imported petroleum and replace high-carbon-emitting energy sources is one of the major
efforts that the United State is conducting at the present time.
The U.S is facing paramount problems that relate to energy security and climate
change. The transportation sector, for example, accounts for 28% of U.S. energy needs and is
responsible for serious problems with respect to air pollution, global warming, and rapid
depletion of the earth’s petroleum resources [68].
Due these problems, spokesmen for the transportation sector have called for the
development of more cleaner, higher-efficiency, and safer systems to replace conventional
vehicles in the near future.
Electric vehicles, hybrid electric, and fuel-cell vehicles are among candidates being
proposed as alternatives for replacing conventional vehicles.
This chapter gives an introduction to fuel-cell technologies describes the various
types of fuel cells, and presents discussion of various onboard storage systems.
5.2 Hydrogen Fuel Cell
Hydrogen is an energy carrier that can be used for power generation and industrial
applications, commercial, residential, and transportation sector applications, Figure 35 shows
the various hydrogen applications areas.
Presently, much attention is being addressed to the use of hydrogen in the
transportation sector through deployment of fuel-cell vehicles.
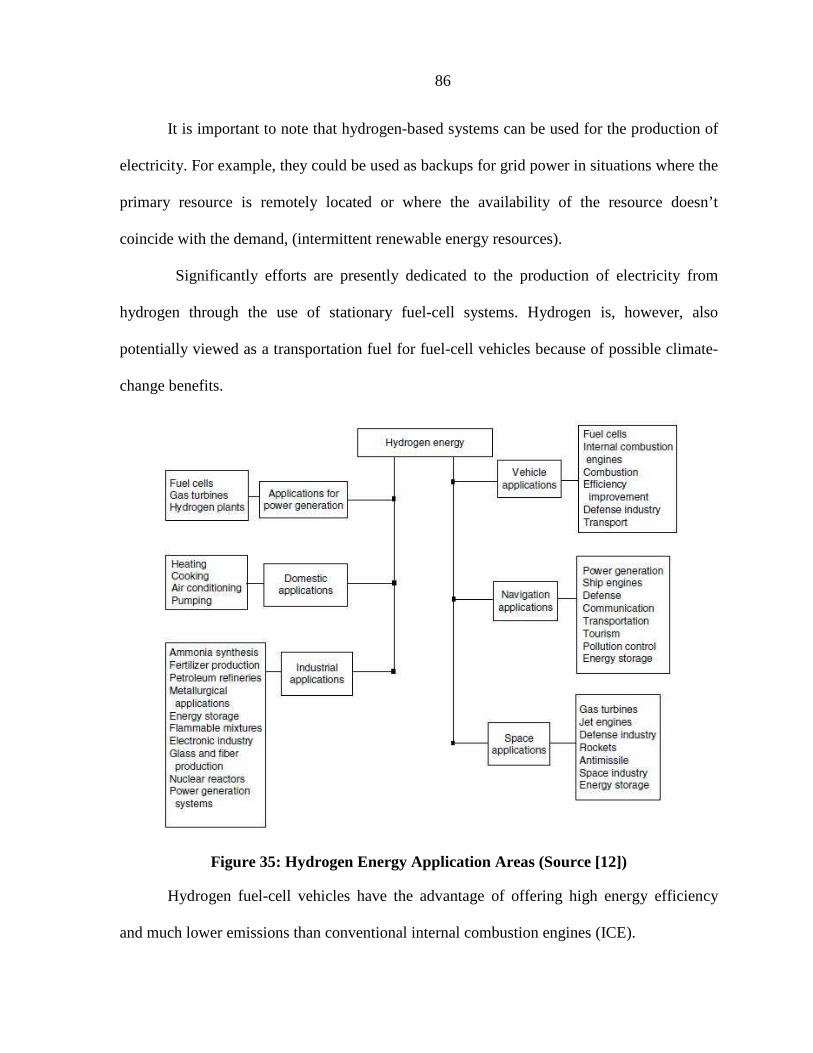
86
It is important to note that hydrogen-based systems can be used for the production of
electricity. For example, they could be used as backups for grid power in situations where the
primary resource is remotely located or where the availability of the resource doesn’t
coincide with the demand, (intermittent renewable energy resources).
Significantly efforts are presently dedicated to the production of electricity from
hydrogen through the use of stationary fuel-cell systems. Hydrogen is, however, also
potentially viewed as a transportation fuel for fuel-cell vehicles because of possible climate-
change benefits.
Figure 35: Hydrogen Energy Application Areas (Source [12])
Hydrogen fuel-cell vehicles have the advantage of offering high energy efficiency
and much lower emissions than conventional internal combustion engines (ICE).
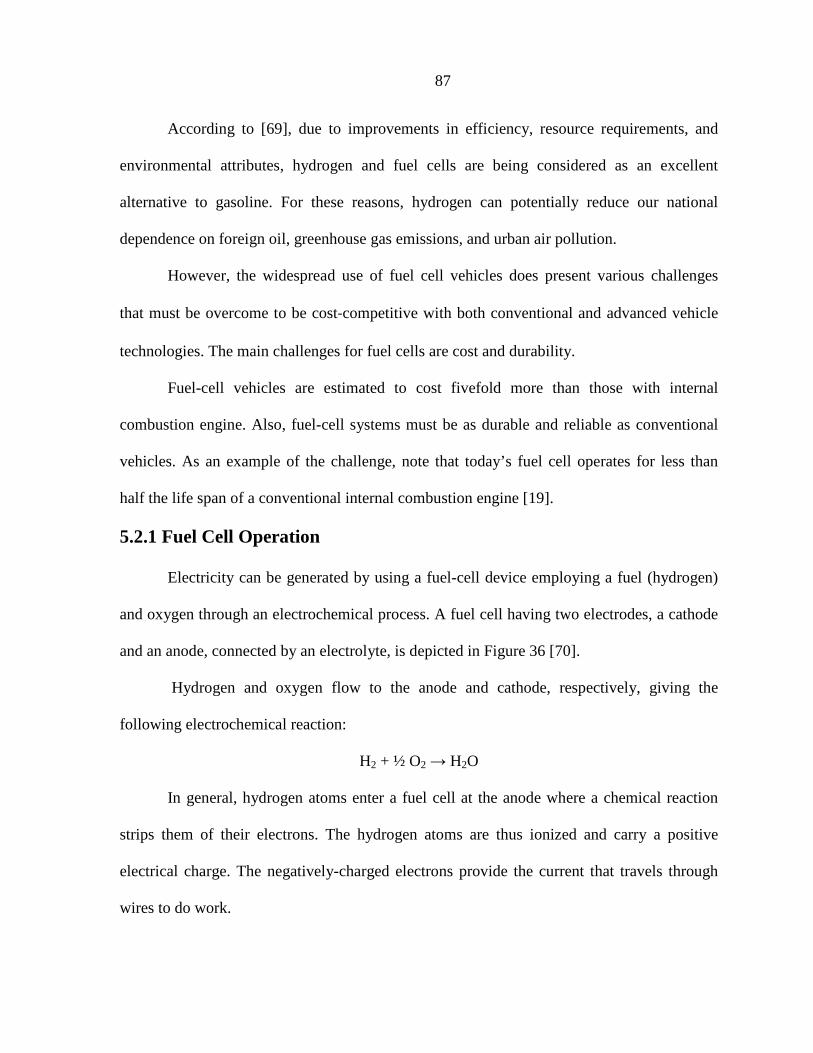
87
According to [69], due to improvements in efficiency, resource requirements, and
environmental attributes, hydrogen and fuel cells are being considered as an excellent
alternative to gasoline. For these reasons, hydrogen can potentially reduce our national
dependence on foreign oil, greenhouse gas emissions, and urban air pollution.
However, the widespread use of fuel cell vehicles does present various challenges
that must be overcome to be cost‐competitive with both conventional and advanced vehicle
technologies. The main challenges for fuel cells are cost and durability.
Fuel-cell vehicles are estimated to cost fivefold more than those with internal
combustion engine. Also, fuel-cell systems must be as durable and reliable as conventional
vehicles. As an example of the challenge, note that today’s fuel cell operates for less than
half the life span of a conventional internal combustion engine [19].
5.2.1 Fuel Cell Operation
Electricity can be generated by using a fuel-cell device employing a fuel (hydrogen)
and oxygen through an electrochemical process. A fuel cell having two electrodes, a cathode
and an anode, connected by an electrolyte, is depicted in Figure 36 [70].
Hydrogen and oxygen flow to the anode and cathode, respectively, giving the
following electrochemical reaction:
H2 + ½ O2 → H2O
In general, hydrogen atoms enter a fuel cell at the anode where a chemical reaction
strips them of their electrons. The hydrogen atoms are thus ionized and carry a positive
electrical charge. The negatively-charged electrons provide the current that travels through
wires to do work.
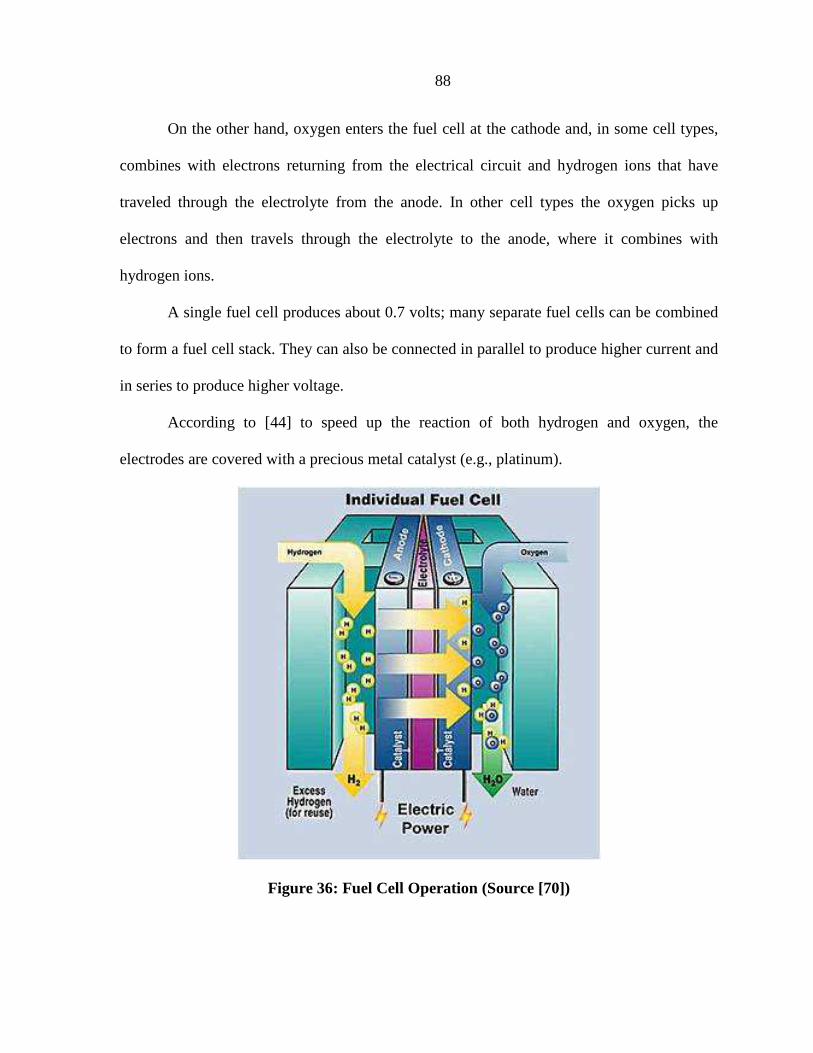
88
On the other hand, oxygen enters the fuel cell at the cathode and, in some cell types,
combines with electrons returning from the electrical circuit and hydrogen ions that have
traveled through the electrolyte from the anode. In other cell types the oxygen picks up
electrons and then travels through the electrolyte to the anode, where it combines with
hydrogen ions.
A single fuel cell produces about 0.7 volts; many separate fuel cells can be combined
to form a fuel cell stack. They can also be connected in parallel to produce higher current and
in series to produce higher voltage.
According to [44] to speed up the reaction of both hydrogen and oxygen, the
electrodes are covered with a precious metal catalyst (e.g., platinum).
Figure 36: Fuel Cell Operation (Source [70])
89
The advantage of the fuel-cell system is that, if hydrogen fuel is used, the only by-
product emitted is water. A fuel cell is a quiet, clean source of energy. Fuel cells are similar
to batteries. Both are composed of positive and negative electrodes with an intervening
electrolyte. The difference between fuel cells and batteries is that, unlike in batteries, energy
is not stored through recharging. Fuel cells obtain their energy from the hydrogen or similar
fuel supplied to them [7].
5.2.2 Types of Fuel Cells
There are six different types of fuel cells: (1) proton-exchange membrane fuel cell
(PEM), (2) alkaline fuel cell (AFC), (3) phosphoric-acid fuel cell (PAFC), (4) molten-
carbonate fuel cell (MCFC), (5) solid-oxide fuel cell (SOFC), and (6) direct-methanol fuel
cell (DMFC).They differ generally in their applications, operating temperatures, costs,
electrolytes used, and the chemical reactions involved, as indicated in Table 19.
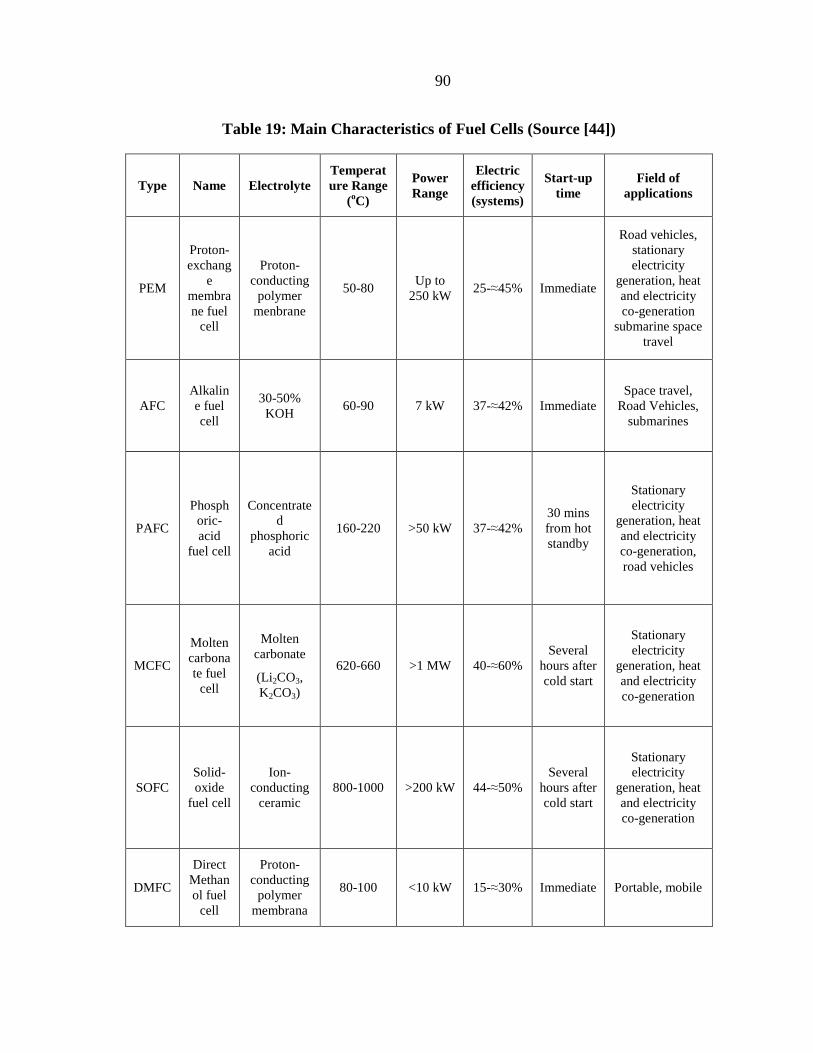
90
Table 19: Main Characteristics of Fuel Cells (Source [44])
Type Name Electrolyte Temperature Range
(oC)
Power Range
Electric efficiency (systems)
Start-up time
Field of applications
PEM
Proton-exchang
e membrane fuel
cell
Proton-conducting polymer
menbrane
50-80 Up to
250 kW 25-≈45% Immediate
Road vehicles, stationary electricity
generation, heat and electricity co-generation
submarine space travel
AFC Alkaline fuel cell
30-50% KOH
60-90 7 kW 37-≈42% Immediate Space travel,
Road Vehicles, submarines
PAFC
Phosphoric-acid
fuel cell
Concentrated
phosphoric acid
160-220 >50 kW 37-≈42% 30 mins from hot standby
Stationary electricity
generation, heat and electricity co-generation, road vehicles
MCFC
Molten carbonate fuel cell
Molten carbonate
(Li 2CO3, K2CO3)
620-660 >1 MW 40-≈60% Several
hours after cold start
Stationary electricity
generation, heat and electricity co-generation
SOFC Solid-oxide
fuel cell
Ion-conducting
ceramic 800-1000 >200 kW 44-≈50%
Several hours after cold start
Stationary electricity
generation, heat and electricity co-generation
DMFC
Direct Methanol fuel
cell
Proton-conducting polymer
membrana
80-100 <10 kW 15-≈30% Immediate Portable, mobile
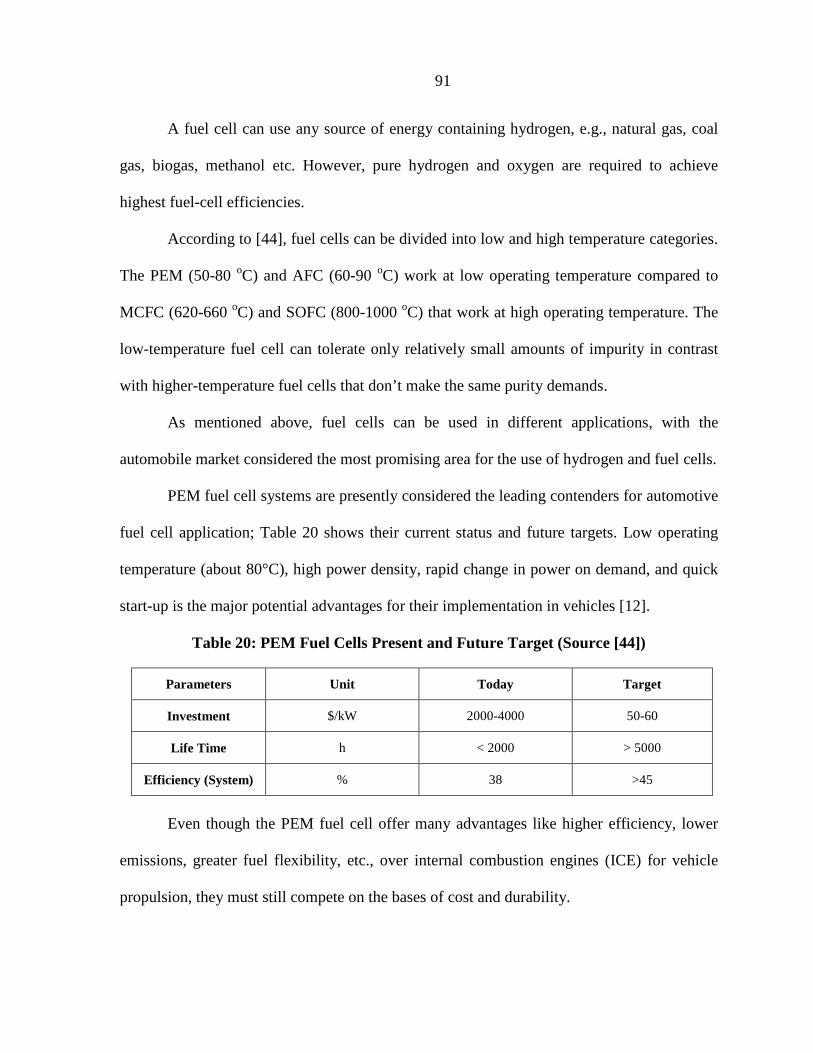
91
A fuel cell can use any source of energy containing hydrogen, e.g., natural gas, coal
gas, biogas, methanol etc. However, pure hydrogen and oxygen are required to achieve
highest fuel-cell efficiencies.
According to [44], fuel cells can be divided into low and high temperature categories.
The PEM (50-80 oC) and AFC (60-90 oC) work at low operating temperature compared to
MCFC (620-660 oC) and SOFC (800-1000 oC) that work at high operating temperature. The
low-temperature fuel cell can tolerate only relatively small amounts of impurity in contrast
with higher-temperature fuel cells that don’t make the same purity demands.
As mentioned above, fuel cells can be used in different applications, with the
automobile market considered the most promising area for the use of hydrogen and fuel cells.
PEM fuel cell systems are presently considered the leading contenders for automotive
fuel cell application; Table 20 shows their current status and future targets. Low operating
temperature (about 80°C), high power density, rapid change in power on demand, and quick
start-up is the major potential advantages for their implementation in vehicles [12].
Table 20: PEM Fuel Cells Present and Future Target (Source [44])
Parameters Unit Today Target
Investment $/kW 2000-4000 50-60
Life Time h < 2000 > 5000
Efficiency (System) % 38 >45
Even though the PEM fuel cell offer many advantages like higher efficiency, lower
emissions, greater fuel flexibility, etc., over internal combustion engines (ICE) for vehicle
propulsion, they must still compete on the bases of cost and durability.
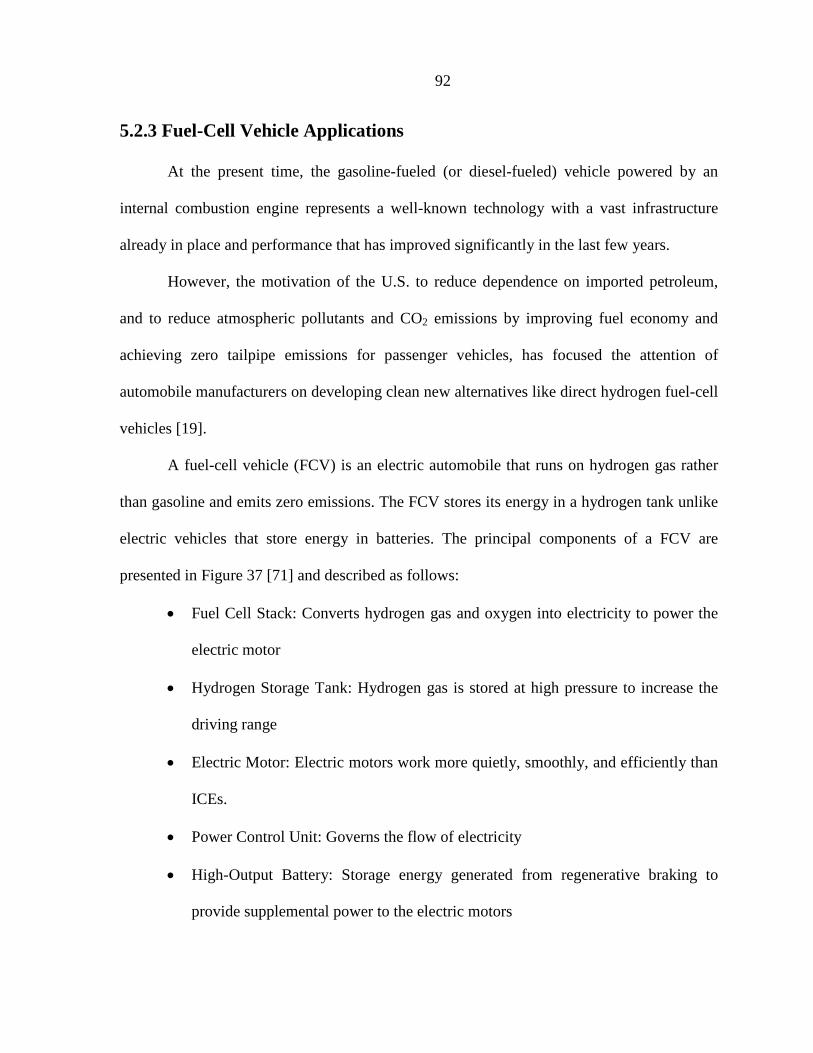
92
5.2.3 Fuel-Cell Vehicle Applications
At the present time, the gasoline-fueled (or diesel-fueled) vehicle powered by an
internal combustion engine represents a well-known technology with a vast infrastructure
already in place and performance that has improved significantly in the last few years.
However, the motivation of the U.S. to reduce dependence on imported petroleum,
and to reduce atmospheric pollutants and CO2 emissions by improving fuel economy and
achieving zero tailpipe emissions for passenger vehicles, has focused the attention of
automobile manufacturers on developing clean new alternatives like direct hydrogen fuel-cell
vehicles [19].
A fuel-cell vehicle (FCV) is an electric automobile that runs on hydrogen gas rather
than gasoline and emits zero emissions. The FCV stores its energy in a hydrogen tank unlike
electric vehicles that store energy in batteries. The principal components of a FCV are
presented in Figure 37 [71] and described as follows:
• Fuel Cell Stack: Converts hydrogen gas and oxygen into electricity to power the
electric motor
• Hydrogen Storage Tank: Hydrogen gas is stored at high pressure to increase the
driving range
• Electric Motor: Electric motors work more quietly, smoothly, and efficiently than
ICEs.
• Power Control Unit: Governs the flow of electricity
• High-Output Battery: Storage energy generated from regenerative braking to
provide supplemental power to the electric motors
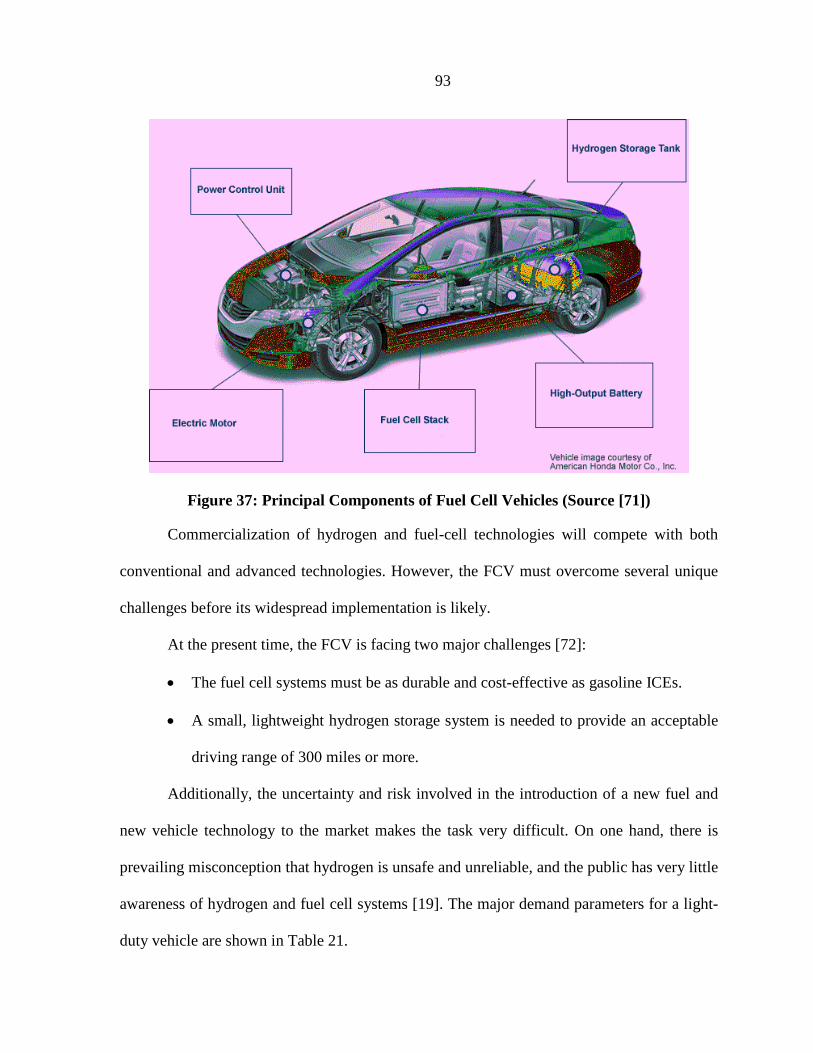
93
Figure 37: Principal Components of Fuel Cell Vehicles (Source [71])
Commercialization of hydrogen and fuel-cell technologies will compete with both
conventional and advanced technologies. However, the FCV must overcome several unique
challenges before its widespread implementation is likely.
At the present time, the FCV is facing two major challenges [72]:
• The fuel cell systems must be as durable and cost-effective as gasoline ICEs.
• A small, lightweight hydrogen storage system is needed to provide an acceptable
driving range of 300 miles or more.
Additionally, the uncertainty and risk involved in the introduction of a new fuel and
new vehicle technology to the market makes the task very difficult. On one hand, there is
prevailing misconception that hydrogen is unsafe and unreliable, and the public has very little
awareness of hydrogen and fuel cell systems [19]. The major demand parameters for a light-
duty vehicle are shown in Table 21.
94
Table 21: Light-duty Vehicle Parameters (Source [19])
Demand Category Parameter
Customer
Initial cost
Operational and maintenance costs
Quality
Range (between refueling)and refueling convenience
Passenger/cargo space
Performance (acceleration, speed, ride quality,
acceptably low levels of noise, vibration, and
harshness)
Safety
Regulatory
Emissions of pollutants (carbon monoxide [CO],
oxides of nitrogen [NOx], hydrocarbons [HC],
particulates)
Fuel efficiency
Greenhouse gas emissions
Safety
Nevertheless, fuel cell vehicles are attractive potential replacements for ICE-based
vehicles. Over the past year significant progress has been made in fuel-cell technology. For
example, the cost has decreased while performance and durability have increased
considerably. Still, the production quality of the vehicles is at an early stage [72].
Currently, several well-to-wheel studies have evaluated the fuel economy of FCVs
relative to their conventional gasoline ICE counterparts.
The U.S. Department of Energy’s (DOE), for example, is pursuing a portfolio of
technologies that have the potential to significantly reduce greenhouse-gas (GHG) emissions
and petroleum consumption, as shown in Figure 38 and Figure 39, respectively. The
technical report titled Well-to-Wheels Greenhouse Gas Emissions and Petroleum Use for
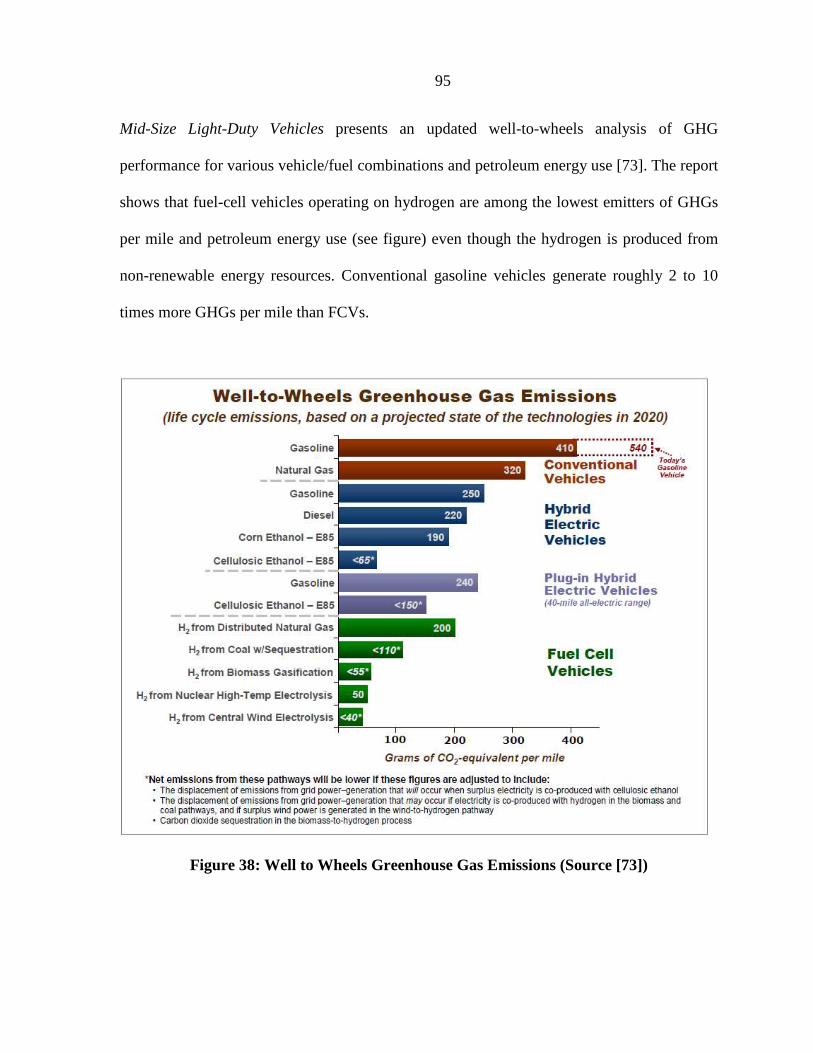
95
Mid-Size Light-Duty Vehicles presents an updated well-to-wheels analysis of GHG
performance for various vehicle/fuel combinations and petroleum energy use [73]. The report
shows that fuel-cell vehicles operating on hydrogen are among the lowest emitters of GHGs
per mile and petroleum energy use (see figure) even though the hydrogen is produced from
non-renewable energy resources. Conventional gasoline vehicles generate roughly 2 to 10
times more GHGs per mile than FCVs.
Figure 38: Well to Wheels Greenhouse Gas Emissions (Source [73])

96
Figure 39: Well-to-Wheels Petroleum Energy Use (Source [73])
5.2.4 Onboard Storage Systems
Hydrogen can be stored on board vehicles as a gas, liquid, or solid. At the present
time, high-pressure gaseous storage system seems to be the best solution with respect to
short-term introduction.
The main challenge of fuel-cell vehicle commercialization is the onboard hydrogen
storage system. On a weight basis, hydrogen has nearly three times the energy content of
gasoline (120 MJ/kg for hydrogen versus 44 MJ/kg for gasoline). However, on a volume
basis, the situation is reversed (8 MJ/liter for liquid hydrogen versus 32 MJ/liter for
97
gasoline). This challenge must be overcome in order to be able to compete with gasoline or
diesel-fueled vehicles.
The Hydrogen Fuel Initiative, launched by President George H. W. Bush in 2003, has
dedicated a significant effort to development of hydrogen storage systems [74]. Through this
effort the Department of Energy (DOE) has focused on applied research and development
(R&D) on onboard hydrogen-storage technologies supporting a driving range of greater than
300 miles (500 km) while meeting packaging, cost, safety, and performance requirements
competitive with comparable vehicles in the market place [75].
The DOE has developed a system-level target taking into consideration six broad
categories for hydrogen onboard storage performance: hydrogen capacity, cost, durability,
hydrogen charging/discharging rates, fuel quality and environmental, and safety and health,
as shown in Figure 40. These targets are based on equivalency to current gasoline storage
systems in terms of weight, volume, cost, and other operating parameters.
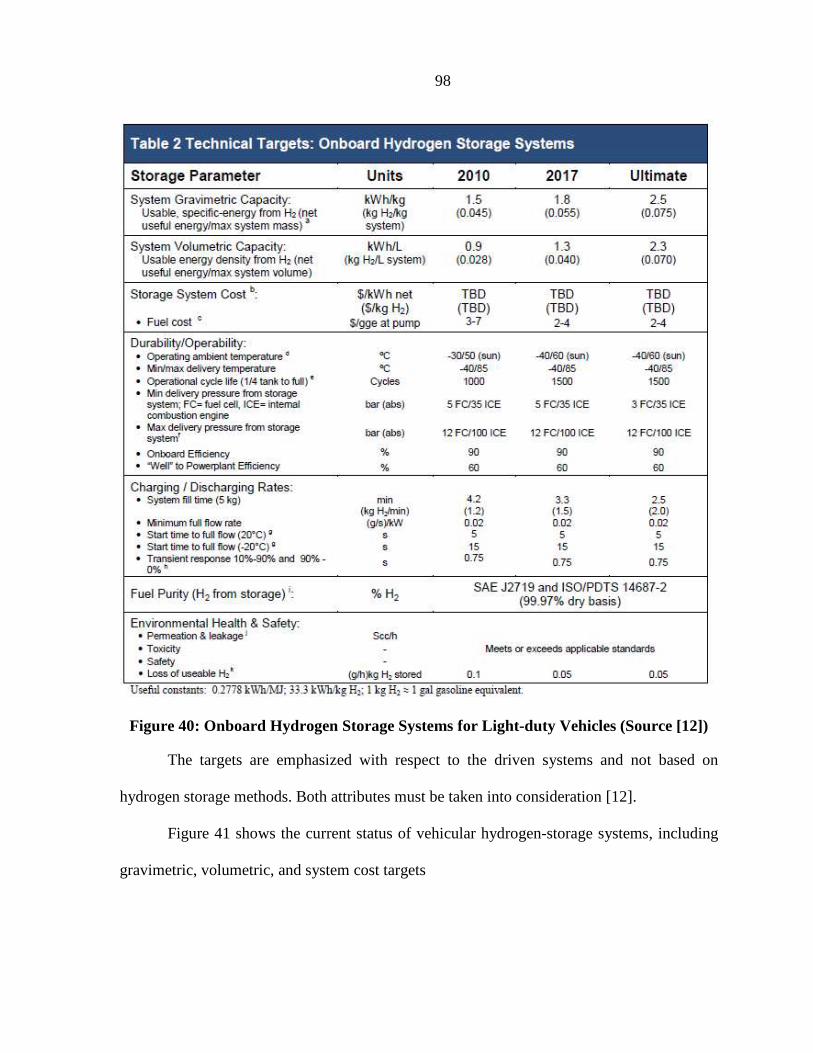
98
Figure 40: Onboard Hydrogen Storage Systems for Light-duty Vehicles (Source [12])
The targets are emphasized with respect to the driven systems and not based on
hydrogen storage methods. Both attributes must be taken into consideration [12].
Figure 41 shows the current status of vehicular hydrogen-storage systems, including
gravimetric, volumetric, and system cost targets
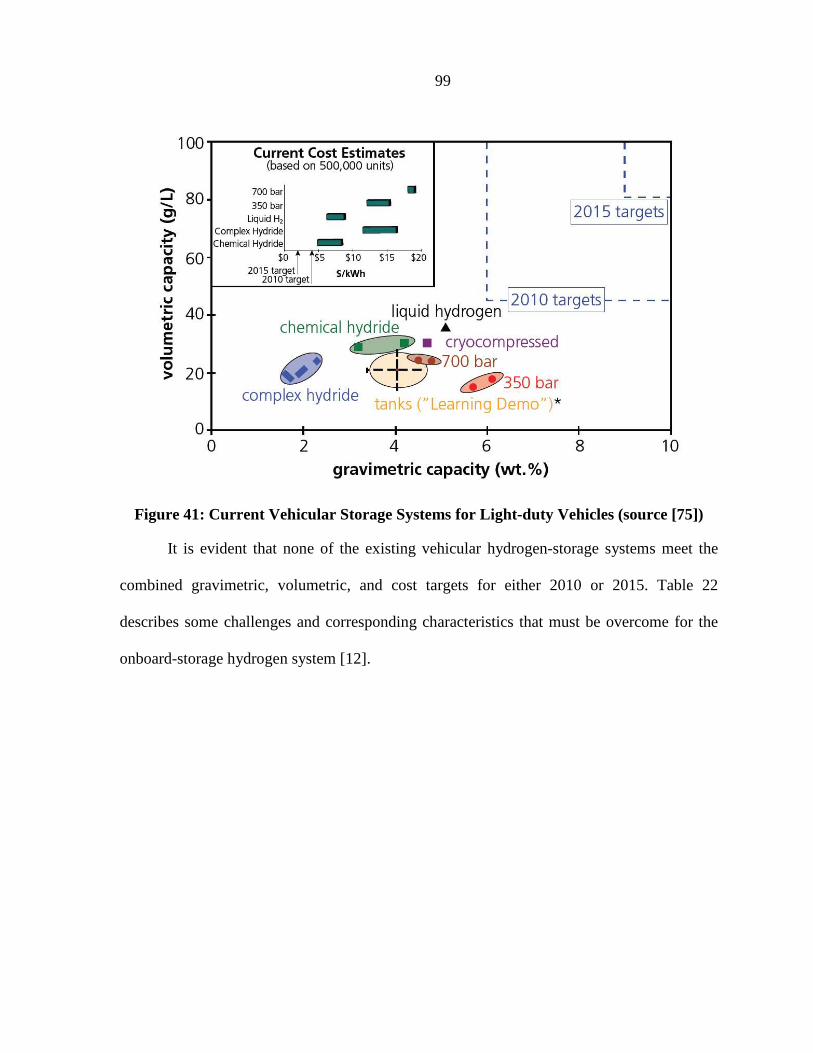
99
Figure 41: Current Vehicular Storage Systems for Light-duty Vehicles (source [75])
It is evident that none of the existing vehicular hydrogen-storage systems meet the
combined gravimetric, volumetric, and cost targets for either 2010 or 2015. Table 22
describes some challenges and corresponding characteristics that must be overcome for the
onboard-storage hydrogen system [12].
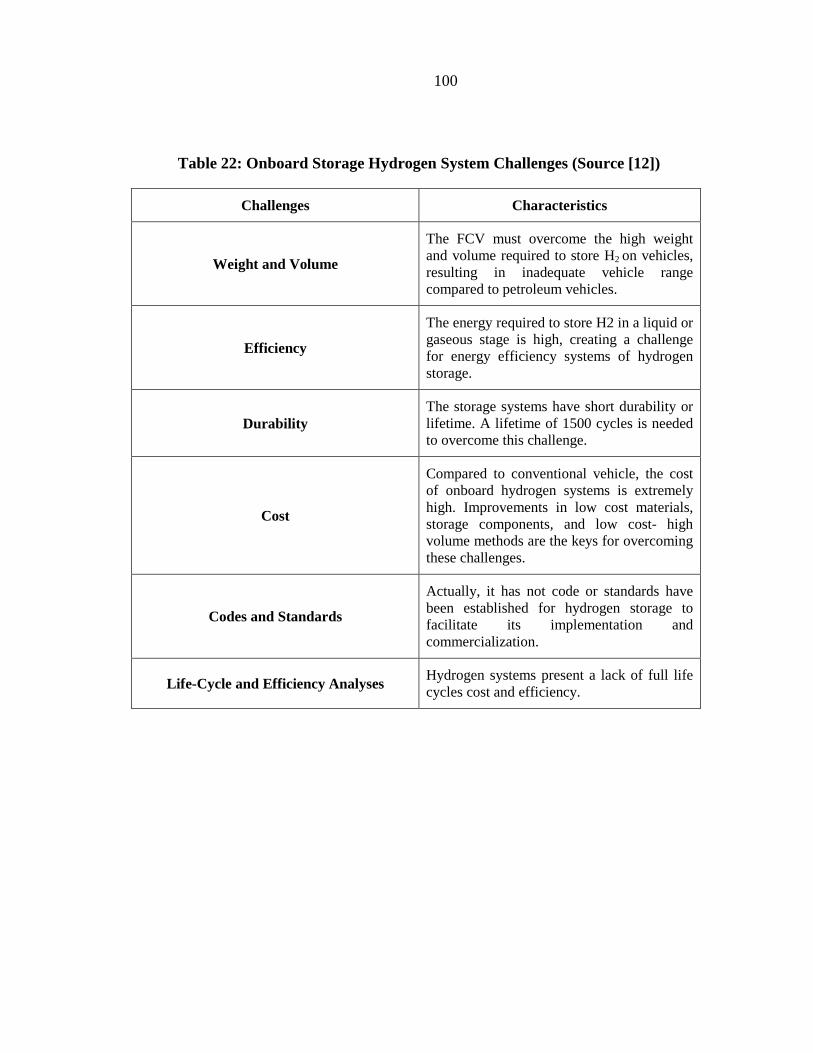
100
Table 22: Onboard Storage Hydrogen System Challenges (Source [12])
Challenges Characteristics
Weight and Volume
The FCV must overcome the high weight and volume required to store H2 on vehicles, resulting in inadequate vehicle range compared to petroleum vehicles.
Efficiency
The energy required to store H2 in a liquid or gaseous stage is high, creating a challenge for energy efficiency systems of hydrogen storage.
Durability The storage systems have short durability or lifetime. A lifetime of 1500 cycles is needed to overcome this challenge.
Cost
Compared to conventional vehicle, the cost of onboard hydrogen systems is extremely high. Improvements in low cost materials, storage components, and low cost- high volume methods are the keys for overcoming these challenges.
Codes and Standards
Actually, it has not code or standards have been established for hydrogen storage to facilitate its implementation and commercialization.
Life-Cycle and Efficiency Analyses Hydrogen systems present a lack of full life cycles cost and efficiency.
101
CHAPTER 6. STUDY OF HYDROGEN FUEL INTO NETPLAN
6.1 Introduction
New alternative and renewable technologies are being developed in the U.S in order
to produce, transport and convert clean energy for the electric and transportation systems.
These two systems are the largest energy consuming and the greatest contributors to carbon
emissions in the U.S.
In the transportation sector for example, new transportation fuels such as electricity,
natural gas, biomethane, propane, hydrogen, ethanol, renewable diesel, and biodiesel fuels;
and new vehicles technologies such as electric, hybrid electric and fuel cell vehicles are
being considered to be the solution to reduce the greenhouse gas emissions, the petroleum
use, and improve air quality in the U.S [76]. It is clear that in order to confront these
problems, the electric and the transportation sectors are moving to “green” electric resources
while at the same time electrifying the transportation sector [77].
According to [78] in order to reduce the GHG emissions and the dependence on
foreign oil, the electrification of the transportation sector holds significant potential for the
future system. However, the transition to these new fuel and vehicles alternatives
technologies will take time. Based on [77] these new alternatives and renewable energy
technologies will require considerable capital investment and will take years to build,
therefore a long-term assessment is needed in order to select from among of them. Also,
these new technologies are being used to create a highly interconnected system that
integrates the electric and transportation infrastructures which creates interdependency
between them [11].
102
For example, use of hydrogen as alternative fuel for the transportation sectors will
lead to additional electric demands that will influence the structure, operation and emissions
in the electric sector [79]. Furthermore, hydrogen would interact with and influence the
electricity grid in several ways; some examples taken from [79] and [80], follow:
• Feedstock: Both energy carriers can be generated from the same primary energy
resource that will result in a competition between them. Also, any change in the
feedstock cost will play a large role in the price of these energy carriers. Furthermore,
both will compete for renewable energy and low carbon resource to reduce the GHG
emissions that will impact the trends in carbon intensity.
• Co-production: This refers to the production or generation of multiple useful
products. Hydrogen and electricity can be produced in the same facility due to the
fact that both can be generated from the same resource. This offers benefits for the
overall energy efficiency and economics similar to that which combined cycle plants
do. Some of these benefits are: flexibility in meeting demands, increased utilization,
increased efficiency, lower emissions and carbon capture, and lower costs.
• Convergence in H2 and electricity delivery: Starr and others in [79] and [81] have
proposed an interesting and innovative idea for using these two energy carriers
together by simultaneous co-delivery of the hydrogen and the electrical energy in a
supergrid. The supergrid will transmit the electricity by using superconducting
transmission, cooled by liquid hydrogen (at 20°K) in pipes that will surround the lines
with the objective of cooling the conductors to enable superconductivity and
minimize transmission losses.
103
• Interconversion: This refers to the use of one energy carrier to address weaknesses
associated with the other energy carrier. The interaction between hydrogen and
electricity is beneficial because both are complementary energy carriers. Examples of
possible applications are: renewable variable electricity storage, off-peak electrolysis,
central hydrogen production and electricity generation, central hydrogen production
and distributed electricity production and distributed hydrogen and electricity
production. These two energy carriers will converge and co-evolve as they address
the challenges of reducing GHG emissions, petroleum dependence, and improve air
quality [79].
However, it is difficult to know how, when, and where these technological options
that exist and are still in development will be implemented and at what cost. In addition,
there is a significant number of attributes that need to be taken into consideration for the
evolution of the overall energy systems. For instance, cost, sustainability and resiliency are
attributes that must be considered in the assessment of future technologies. Also, the lifetime
associated to these technologies is crucial [77].
Hydrogen has been promoted as an alternative carrier for the transportation sector that
will address the energy security and environmental issues associated with the petroleum
systems. However, the major challenges that hydrogen is facing at the moment is the lack of
an existing infrastructure for producing, delivering and refueling the fuel to the consumers.
In the last decades, significant research has been dedicated to every aspect of the
hydrogen pathways, from feedstock, production technologies, delivery systems, refueling
stations, until fuel cell vehicles. However, “what are the energy efficient, environmentally
benign and cost effective pathways to deliver hydrogen to the consumer?” this results in a
104
large number of potential supply pathways [6]. For instance: cost, operability, environmental
impacts, safety and social implications are some performances that need to be analyzed when
assessing future commercial hydrogen as viable long-term alternative solution.
A long term assessment is necessary to assess the value of using hydrogen in the
future. Nevertheless, there are a significant number of new alternative technologies similar to
hydrogen that may play a role in future energy and transportation systems. The project
NETSCORE 21, introduced in Chapter 1, address these issues.
NETSCORE 21 project goal is to identify optimal infrastructure designs in terms of
future power generation technologies, energy transport and storage technologies, and hybrid-
electric transportation systems to achieve desirable balance between sustainability, costs, and
resiliency. As a result, the project has been able to develop a tool called NETPLAN that is
able to analyze a long-term investment and operation model for the transportation and energy
system. This chapter describes the tool NETPLAN, the mathematical formulation, the use of
NETPLAN to assess hydrogen as an alternative fuel, and analysis results.
6.2 NETPLAN
In NETPLAN, the main objective is to be able to simultaneously evaluate different
portfolios for those critical infrastructures (electric and transportation sectors) and search for
the best ones in terms of sustainability, resiliency and cost [11]. The innovative nature of this
tool is that it performs a long-term assessment for the electric/transportation infrastructure
design at a national level while accounting for their interactions and interdependencies. The
orientation is better captured in Figure 42 [10].
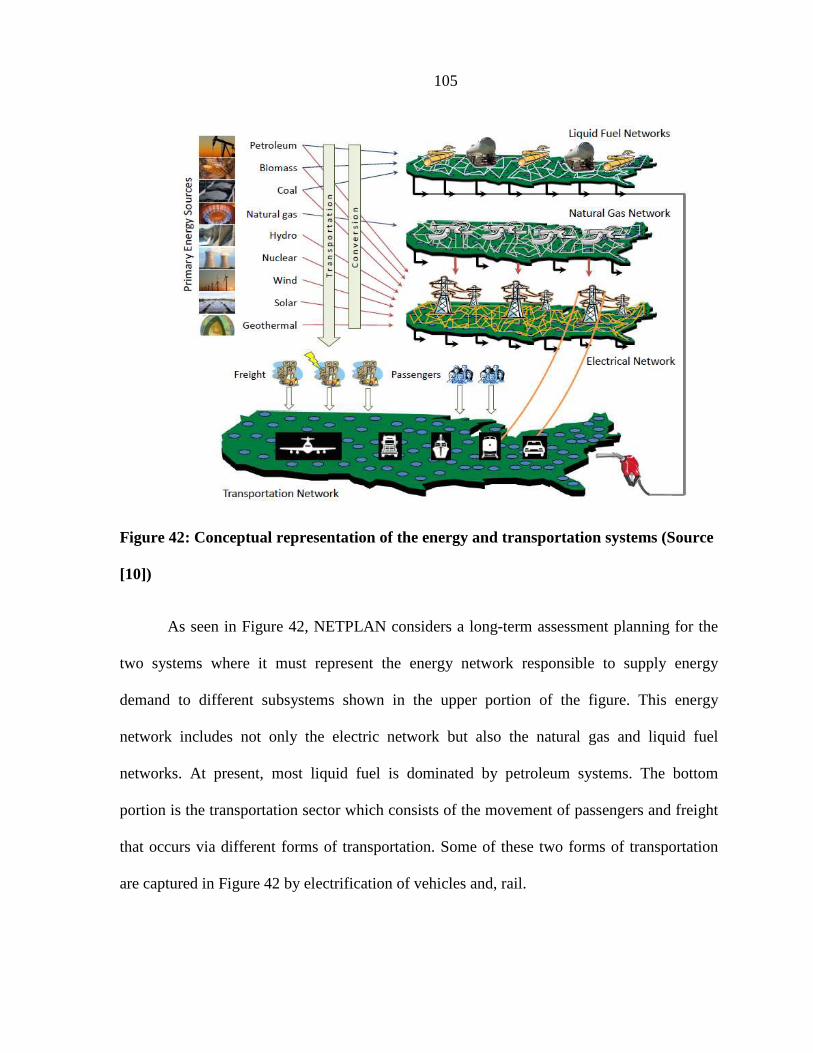
105
Figure 42: Conceptual representation of the energy and transportation systems (Source
[10])
As seen in Figure 42, NETPLAN considers a long-term assessment planning for the
two systems where it must represent the energy network responsible to supply energy
demand to different subsystems shown in the upper portion of the figure. This energy
network includes not only the electric network but also the natural gas and liquid fuel
networks. At present, most liquid fuel is dominated by petroleum systems. The bottom
portion is the transportation sector which consists of the movement of passengers and freight
that occurs via different forms of transportation. Some of these two forms of transportation
are captured in Figure 42 by electrification of vehicles and, rail.
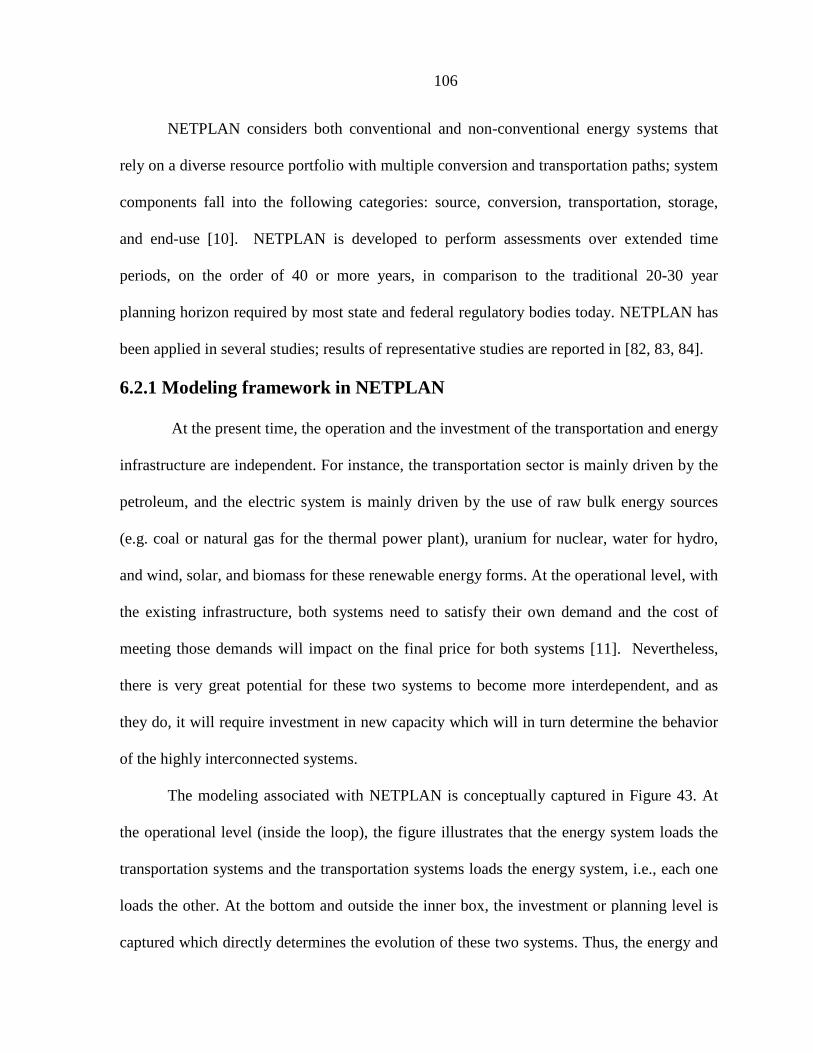
106
NETPLAN considers both conventional and non-conventional energy systems that
rely on a diverse resource portfolio with multiple conversion and transportation paths; system
components fall into the following categories: source, conversion, transportation, storage,
and end-use [10]. NETPLAN is developed to perform assessments over extended time
periods, on the order of 40 or more years, in comparison to the traditional 20-30 year
planning horizon required by most state and federal regulatory bodies today. NETPLAN has
been applied in several studies; results of representative studies are reported in [82, 83, 84].
6.2.1 Modeling framework in NETPLAN
At the present time, the operation and the investment of the transportation and energy
infrastructure are independent. For instance, the transportation sector is mainly driven by the
petroleum, and the electric system is mainly driven by the use of raw bulk energy sources
(e.g. coal or natural gas for the thermal power plant), uranium for nuclear, water for hydro,
and wind, solar, and biomass for these renewable energy forms. At the operational level, with
the existing infrastructure, both systems need to satisfy their own demand and the cost of
meeting those demands will impact on the final price for both systems [11]. Nevertheless,
there is very great potential for these two systems to become more interdependent, and as
they do, it will require investment in new capacity which will in turn determine the behavior
of the highly interconnected systems.
The modeling associated with NETPLAN is conceptually captured in Figure 43. At
the operational level (inside the loop), the figure illustrates that the energy system loads the
transportation systems and the transportation systems loads the energy system, i.e., each one
loads the other. At the bottom and outside the inner box, the investment or planning level is
captured which directly determines the evolution of these two systems. Thus, the energy and
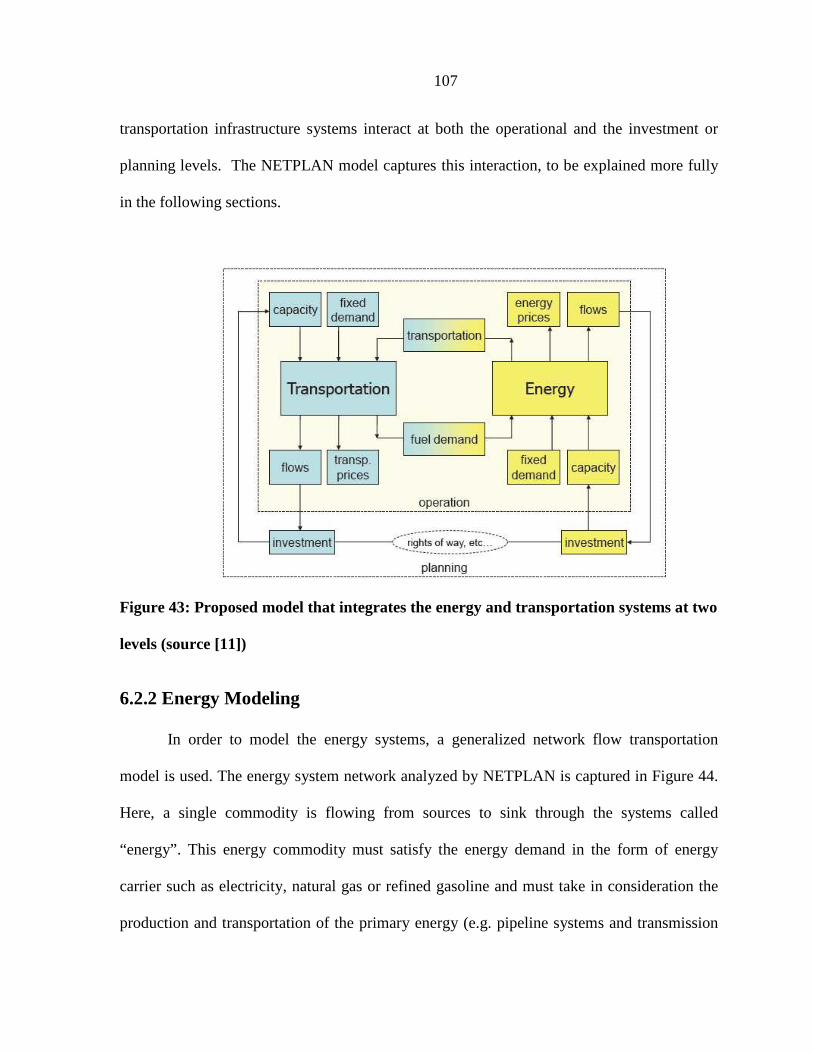
107
transportation infrastructure systems interact at both the operational and the investment or
planning levels. The NETPLAN model captures this interaction, to be explained more fully
in the following sections.
Figure 43: Proposed model that integrates the energy and transportation systems at two
levels (source [11])
6.2.2 Energy Modeling
In order to model the energy systems, a generalized network flow transportation
model is used. The energy system network analyzed by NETPLAN is captured in Figure 44.
Here, a single commodity is flowing from sources to sink through the systems called
“energy”. This energy commodity must satisfy the energy demand in the form of energy
carrier such as electricity, natural gas or refined gasoline and must take in consideration the
production and transportation of the primary energy (e.g. pipeline systems and transmission
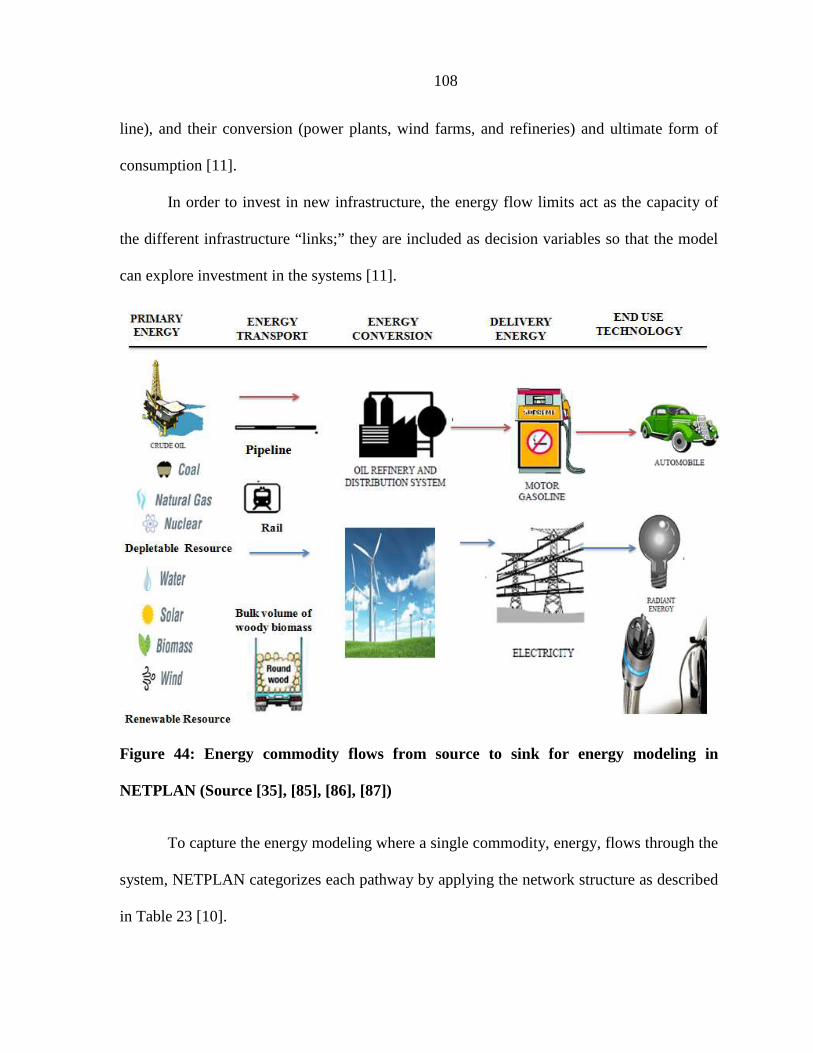
108
line), and their conversion (power plants, wind farms, and refineries) and ultimate form of
consumption [11].
In order to invest in new infrastructure, the energy flow limits act as the capacity of
the different infrastructure “links;” they are included as decision variables so that the model
can explore investment in the systems [11].
Figure 44: Energy commodity flows from source to sink for energy modeling in
NETPLAN (Source [35], [85], [86], [87])
To capture the energy modeling where a single commodity, energy, flows through the
system, NETPLAN categorizes each pathway by applying the network structure as described
in Table 23 [10].

109
Table 23: Network structure applied to the energy system in NETPLAN (Source [11])
Network Structure
Definition Types Characteristics
Nodes
Nodes are used to represent the points in the system where the conservation of energy (or flow) is enforced. A node is defined to represent both a geographical region and a type of energy.
• Sources: Represent the production of raw materials.
• Transmission: are those that all the incoming energy leave the node
• Storage: are those that are interconnected in time and allow the flow of energy between consecutive points in time.
• Demand: where physical demand of energy like electricity or natural gas is enforced
• The difference between energy coming in and out of the node is the most important parameter associated with demand of energy.
• Storage and Transmission nodes the demand is usually zero.
• Source nodes are the source of the energy that is consumed for the systems so no demand is defined.
Arcs
Arcs are used to connect nodes and represent the available routes for flows. They are defined by the origin and destination nodes and can have costs and capacities associated to them.
Two types of arcs:
• Transmission line, natural gas or petroleum pipeline are example of arcs that represent the transmission of energy geographically and at the same time belong to the same systems of sources.
• Electric generators, electrolysis facilities or refineries are example of arcs for NETPLAN because they conduct the conversion between energy types.
The two types of arcs explained above will hold the following attributes:
• Arcs that result from the same source of nodes are assigned maximum extraction rate (MBtu/month) and extraction cost ($/MBtu).
• Conversion and transportation are endowed with: capacity (MBtu-capacity/month), efficiency (%), operational cost ($/MBtu-flow/month), investment cost ($/MBtu-capacity/month), component sustainability metrics, and component resiliency (e.g., reliability).
These parameters are associated to each arc, however not all of them apply in each case: • Minimum flow. Usually is zero,
but could be positive to represent situations such as electric transmissions contracts.
• Maximum flow or arc capacity. It is a combination of the initial capacity (which can be set to gradually decrease as initial capacity is retired) and new investments.
• Investment cost, per unit of capacity added to the flow
• Minimum investment • Maximum investment • Cost, per unit of flow • Efficiency parameter, which is
a multiplier that is applied to the flow. It serves to represent, for example, losses in gas transportation and electric transmission. It can be used to transform units from one subsystem to another.
Flows Flows are the representation of energy moving along the system of arcs
Single Commodity (Energy)
Different units are used for different subnetwork: million short tons for coal, million cubic feet for natural gas, millions of gallons for the petroleum network, and GW-hours for electricity, for the only single commodity flowing in the system.
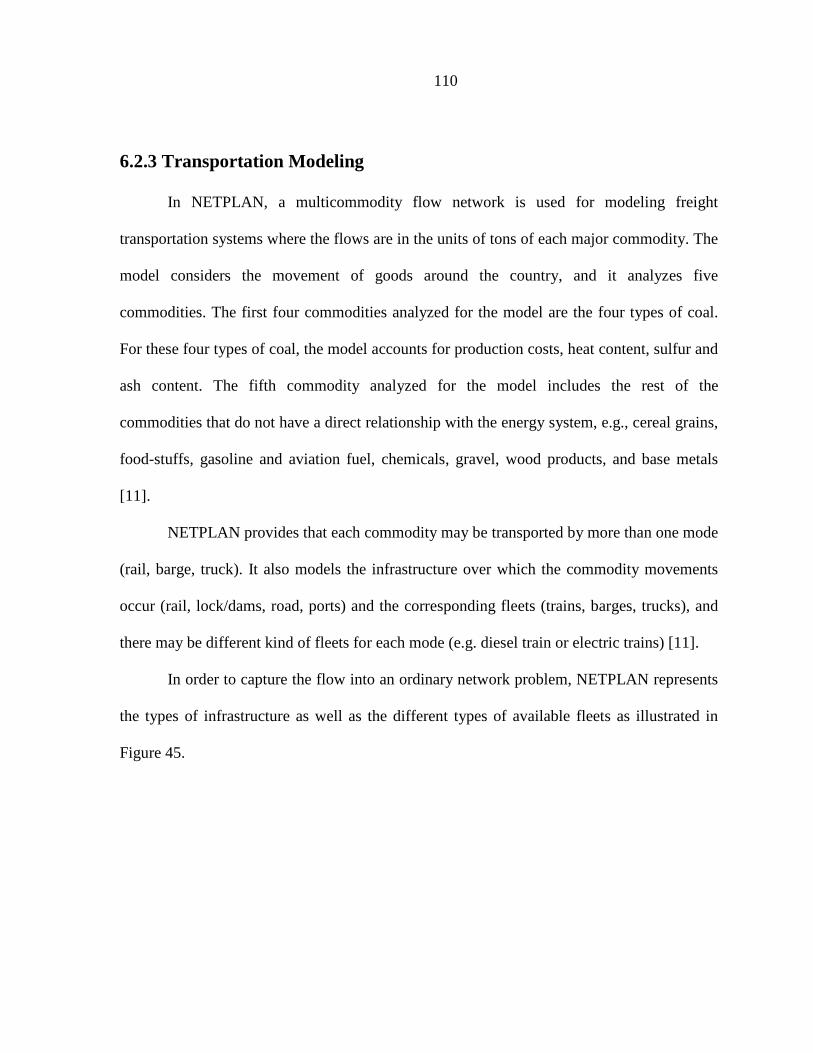
110
6.2.3 Transportation Modeling
In NETPLAN, a multicommodity flow network is used for modeling freight
transportation systems where the flows are in the units of tons of each major commodity. The
model considers the movement of goods around the country, and it analyzes five
commodities. The first four commodities analyzed for the model are the four types of coal.
For these four types of coal, the model accounts for production costs, heat content, sulfur and
ash content. The fifth commodity analyzed for the model includes the rest of the
commodities that do not have a direct relationship with the energy system, e.g., cereal grains,
food-stuffs, gasoline and aviation fuel, chemicals, gravel, wood products, and base metals
[11].
NETPLAN provides that each commodity may be transported by more than one mode
(rail, barge, truck). It also models the infrastructure over which the commodity movements
occur (rail, lock/dams, road, ports) and the corresponding fleets (trains, barges, trucks), and
there may be different kind of fleets for each mode (e.g. diesel train or electric trains) [11].
In order to capture the flow into an ordinary network problem, NETPLAN represents
the types of infrastructure as well as the different types of available fleets as illustrated in
Figure 45.
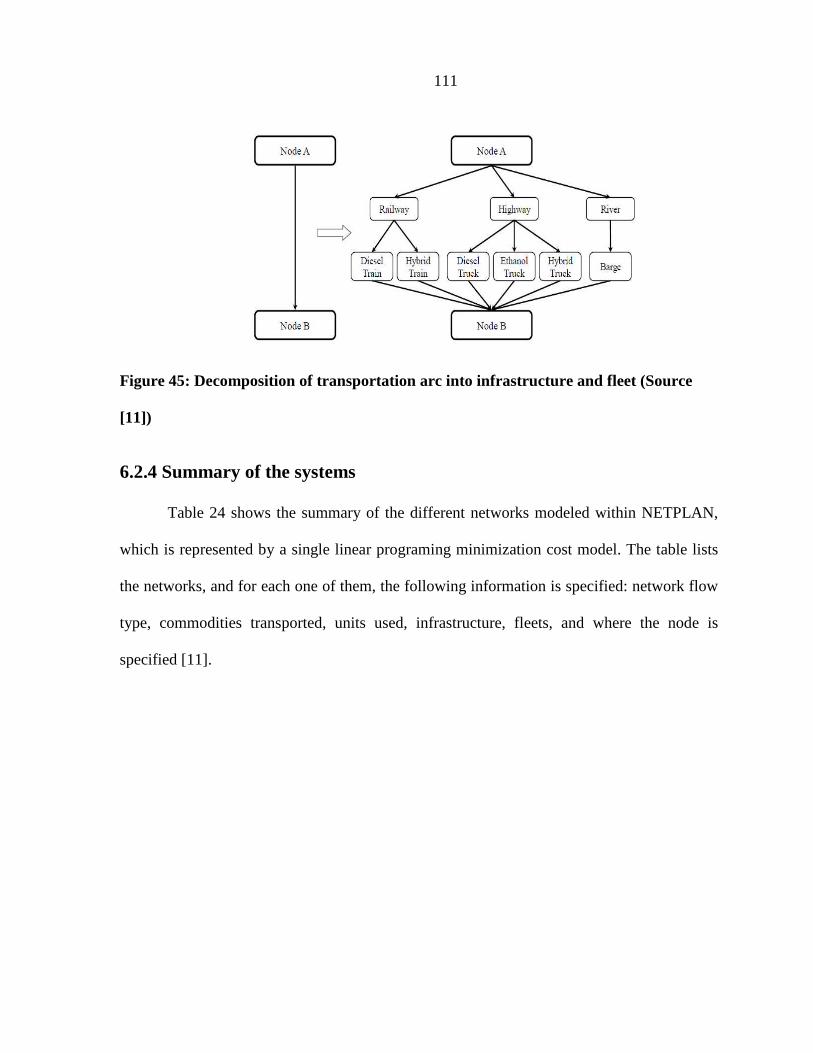
111
Figure 45: Decomposition of transportation arc into infrastructure and fleet (Source
[11])
6.2.4 Summary of the systems
Table 24 shows the summary of the different networks modeled within NETPLAN,
which is represented by a single linear programing minimization cost model. The table lists
the networks, and for each one of them, the following information is specified: network flow
type, commodities transported, units used, infrastructure, fleets, and where the node is
specified [11].
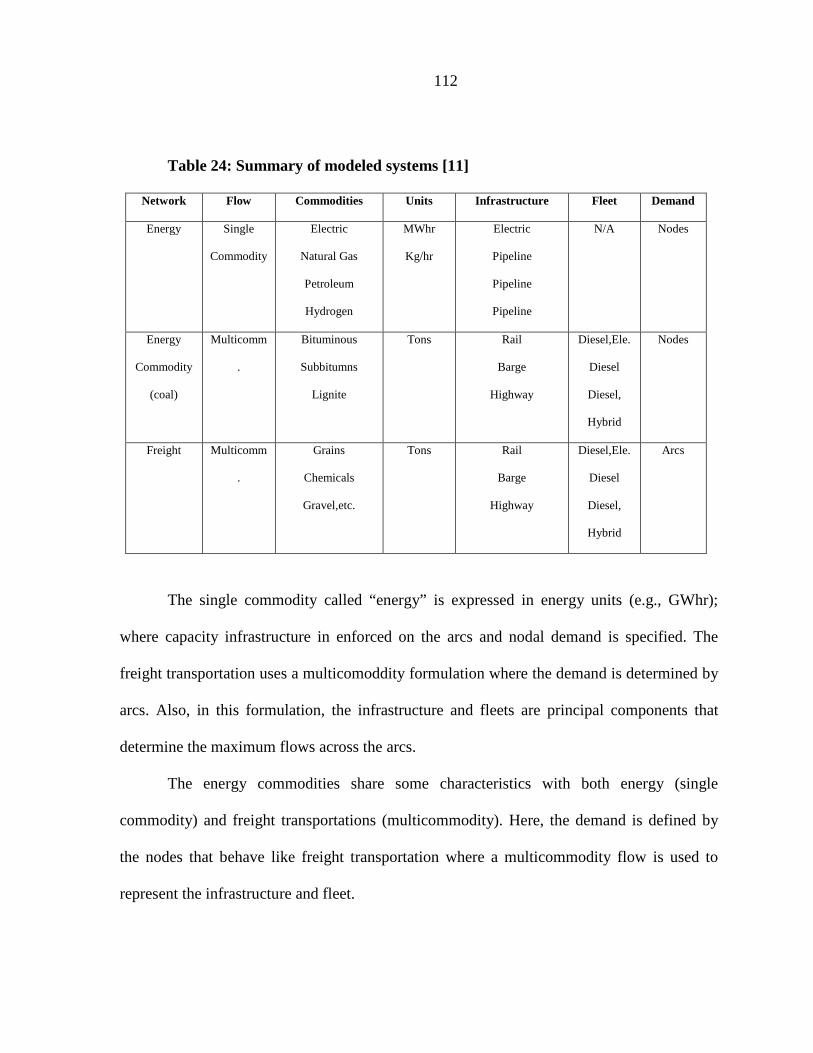
112
Table 24: Summary of modeled systems [11]
Network Flow Commodities Units Infrastructure Fleet Demand
Energy Single
Commodity
Electric
Natural Gas
Petroleum
Hydrogen
MWhr
Kg/hr
Electric
Pipeline
Pipeline
Pipeline
N/A Nodes
Energy
Commodity
(coal)
Multicomm
.
Bituminous
Subbitumns
Lignite
Tons Rail
Barge
Highway
Diesel,Ele.
Diesel
Diesel,
Hybrid
Nodes
Freight Multicomm
.
Grains
Chemicals
Gravel,etc.
Tons Rail
Barge
Highway
Diesel,Ele.
Diesel
Diesel,
Hybrid
Arcs
The single commodity called “energy” is expressed in energy units (e.g., GWhr);
where capacity infrastructure in enforced on the arcs and nodal demand is specified. The
freight transportation uses a multicomoddity formulation where the demand is determined by
arcs. Also, in this formulation, the infrastructure and fleets are principal components that
determine the maximum flows across the arcs.
The energy commodities share some characteristics with both energy (single
commodity) and freight transportations (multicommodity). Here, the demand is defined by
the nodes that behave like freight transportation where a multicommodity flow is used to
represent the infrastructure and fleet.
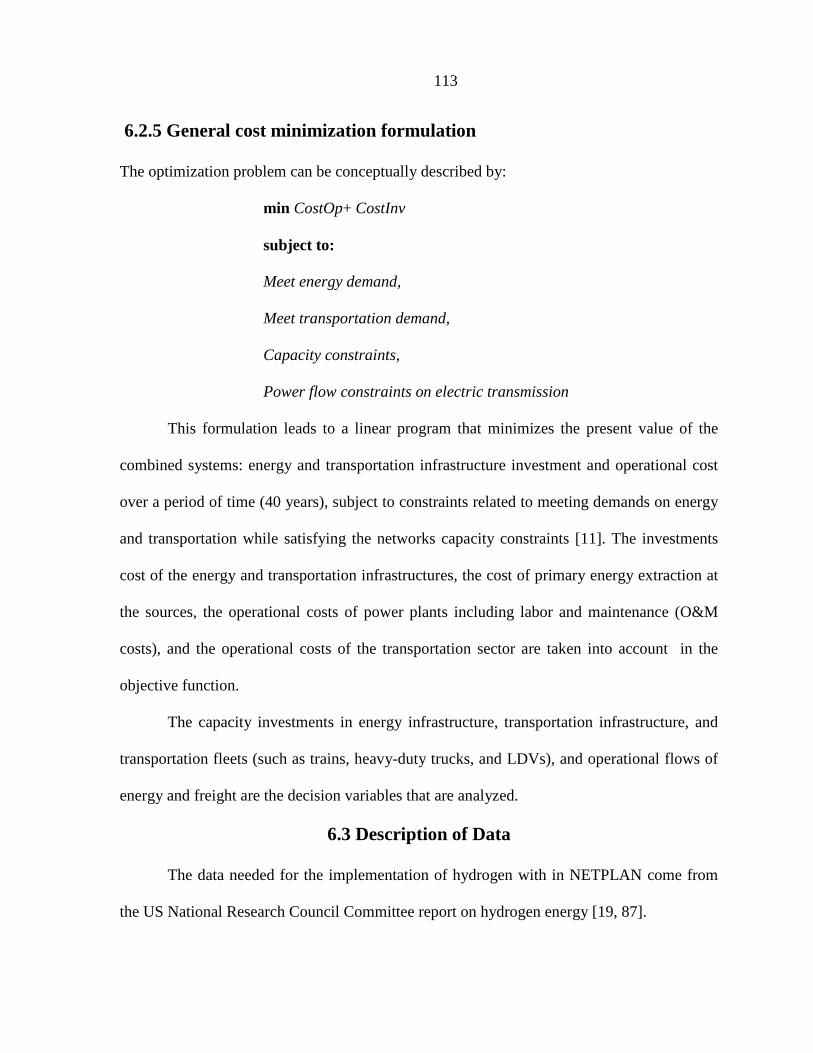
113
6.2.5 General cost minimization formulation
The optimization problem can be conceptually described by:
min CostOp+ CostInv
subject to:
Meet energy demand,
Meet transportation demand,
Capacity constraints,
Power flow constraints on electric transmission
This formulation leads to a linear program that minimizes the present value of the
combined systems: energy and transportation infrastructure investment and operational cost
over a period of time (40 years), subject to constraints related to meeting demands on energy
and transportation while satisfying the networks capacity constraints [11]. The investments
cost of the energy and transportation infrastructures, the cost of primary energy extraction at
the sources, the operational costs of power plants including labor and maintenance (O&M
costs), and the operational costs of the transportation sector are taken into account in the
objective function.
The capacity investments in energy infrastructure, transportation infrastructure, and
transportation fleets (such as trains, heavy-duty trucks, and LDVs), and operational flows of
energy and freight are the decision variables that are analyzed.
6.3 Description of Data
The data needed for the implementation of hydrogen with in NETPLAN come from
the US National Research Council Committee report on hydrogen energy [19, 87].
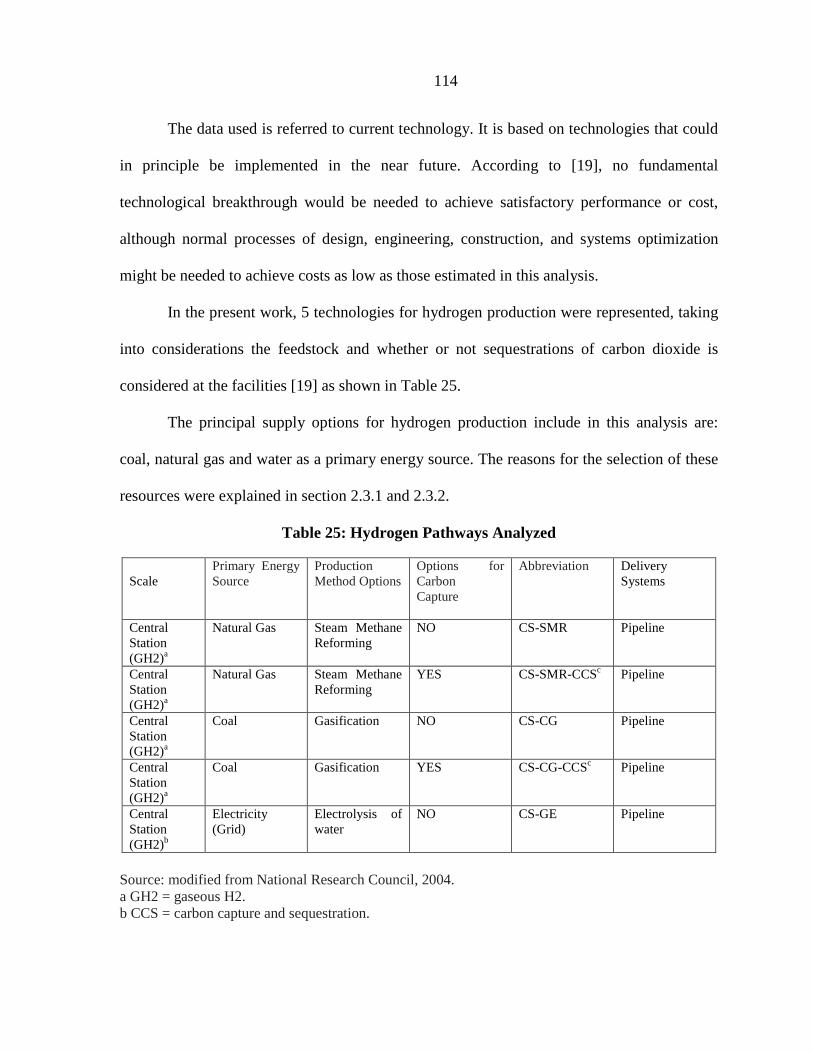
114
The data used is referred to current technology. It is based on technologies that could
in principle be implemented in the near future. According to [19], no fundamental
technological breakthrough would be needed to achieve satisfactory performance or cost,
although normal processes of design, engineering, construction, and systems optimization
might be needed to achieve costs as low as those estimated in this analysis.
In the present work, 5 technologies for hydrogen production were represented, taking
into considerations the feedstock and whether or not sequestrations of carbon dioxide is
considered at the facilities [19] as shown in Table 25.
The principal supply options for hydrogen production include in this analysis are:
coal, natural gas and water as a primary energy source. The reasons for the selection of these
resources were explained in section 2.3.1 and 2.3.2.
Table 25: Hydrogen Pathways Analyzed
Scale
Primary Energy Source
Production Method Options
Options for Carbon Capture
Abbreviation Delivery Systems
Central Station (GH2)a
Natural Gas Steam Methane Reforming
NO CS-SMR Pipeline
Central Station (GH2)a
Natural Gas Steam Methane Reforming
YES CS-SMR-CCSc Pipeline
Central Station (GH2)a
Coal Gasification NO CS-CG Pipeline
Central Station (GH2)a
Coal Gasification YES CS-CG-CCSc Pipeline
Central Station (GH2)b
Electricity (Grid)
Electrolysis of water
NO CS-GE Pipeline
Source: modified from National Research Council, 2004. a GH2 = gaseous H2. b CCS = carbon capture and sequestration.
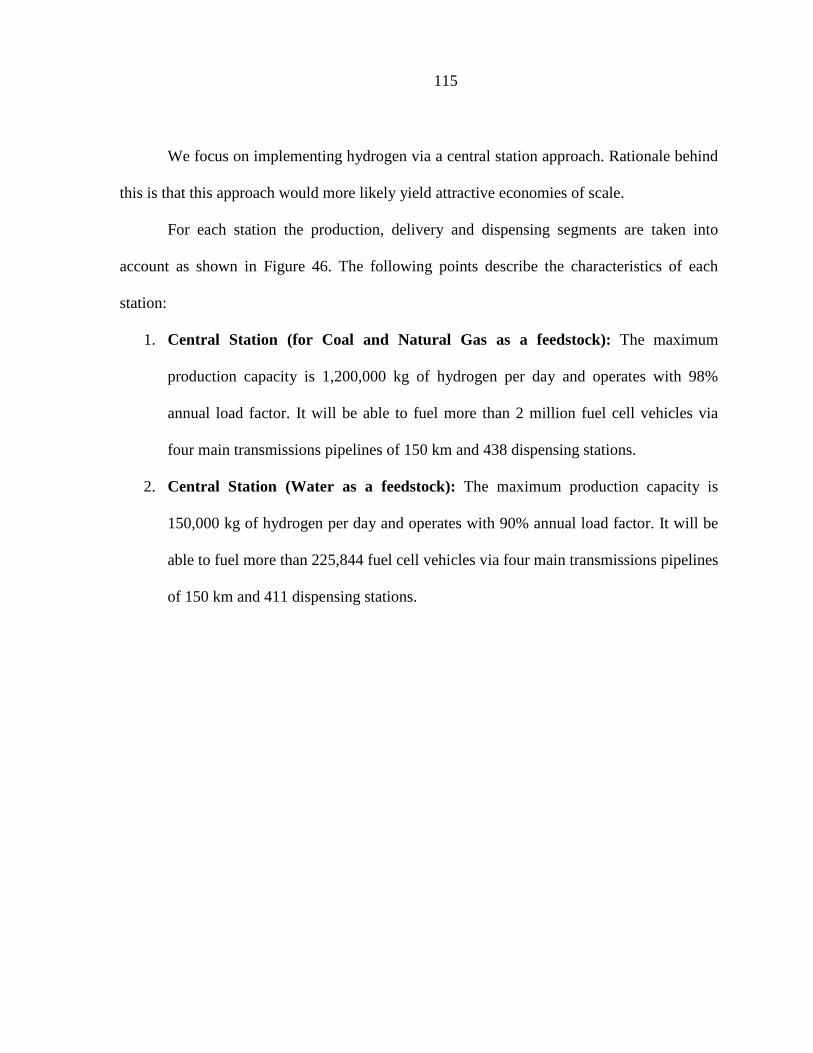
115
We focus on implementing hydrogen via a central station approach. Rationale behind
this is that this approach would more likely yield attractive economies of scale.
For each station the production, delivery and dispensing segments are taken into
account as shown in Figure 46. The following points describe the characteristics of each
station:
1. Central Station (for Coal and Natural Gas as a feedstock): The maximum
production capacity is 1,200,000 kg of hydrogen per day and operates with 98%
annual load factor. It will be able to fuel more than 2 million fuel cell vehicles via
four main transmissions pipelines of 150 km and 438 dispensing stations.
2. Central Station (Water as a feedstock): The maximum production capacity is
150,000 kg of hydrogen per day and operates with 90% annual load factor. It will be
able to fuel more than 225,844 fuel cell vehicles via four main transmissions pipelines
of 150 km and 411 dispensing stations.
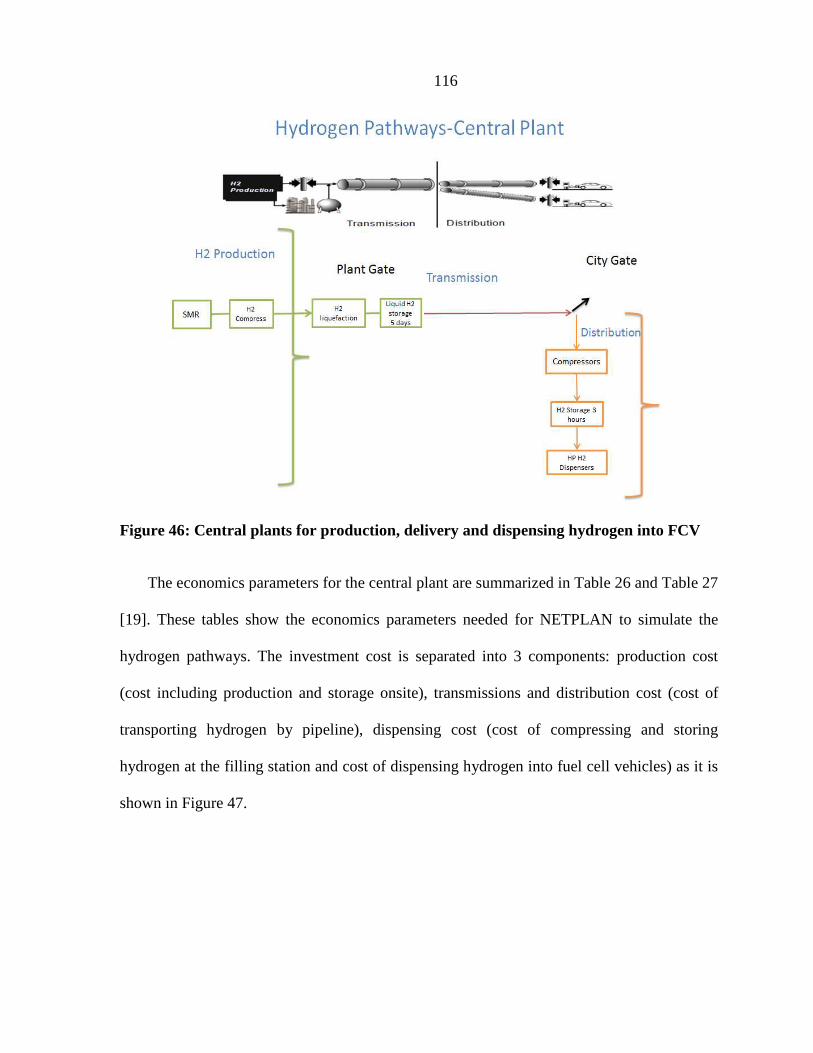
116
Figure 46: Central plants for production, delivery and dispensing hydrogen into FCV
The economics parameters for the central plant are summarized in Table 26 and Table 27
[19]. These tables show the economics parameters needed for NETPLAN to simulate the
hydrogen pathways. The investment cost is separated into 3 components: production cost
(cost including production and storage onsite), transmissions and distribution cost (cost of
transporting hydrogen by pipeline), dispensing cost (cost of compressing and storing
hydrogen at the filling station and cost of dispensing hydrogen into fuel cell vehicles) as it is
shown in Figure 47.
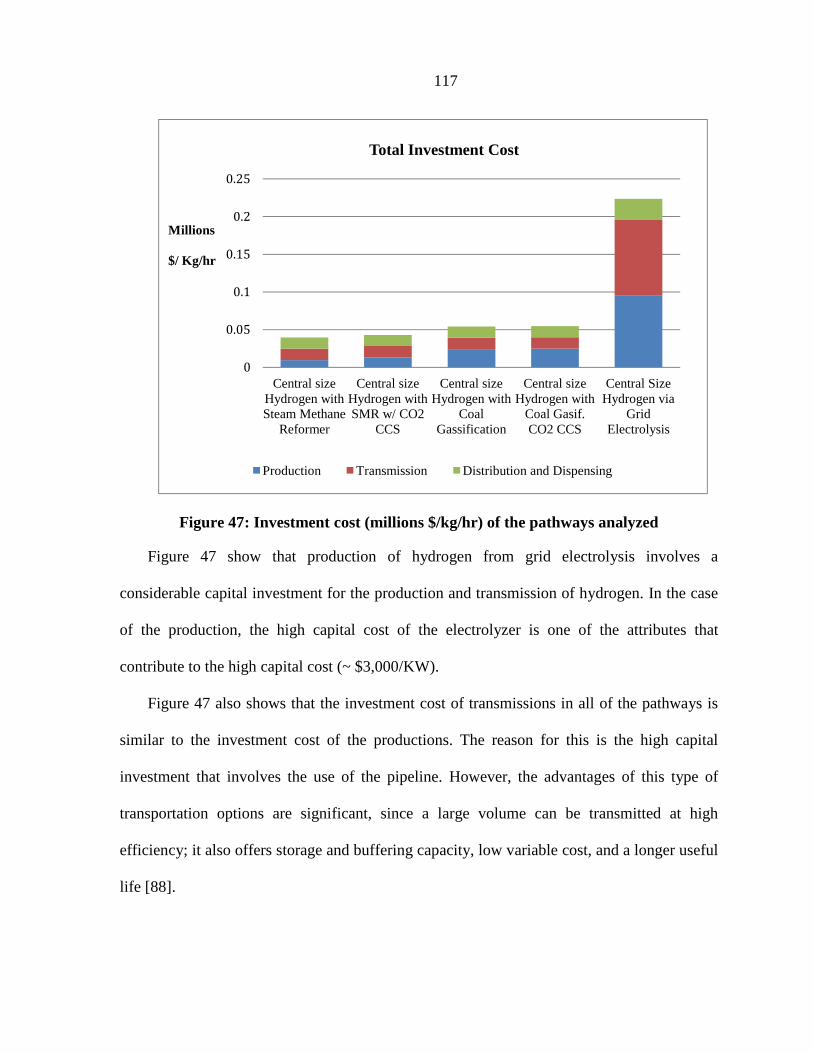
117
Figure 47: Investment cost (millions $/kg/hr) of the pathways analyzed
Figure 47 show that production of hydrogen from grid electrolysis involves a
considerable capital investment for the production and transmission of hydrogen. In the case
of the production, the high capital cost of the electrolyzer is one of the attributes that
contribute to the high capital cost (~ $3,000/KW).
Figure 47 also shows that the investment cost of transmissions in all of the pathways is
similar to the investment cost of the productions. The reason for this is the high capital
investment that involves the use of the pipeline. However, the advantages of this type of
transportation options are significant, since a large volume can be transmitted at high
efficiency; it also offers storage and buffering capacity, low variable cost, and a longer useful
life [88].
0
0.05
0.1
0.15
0.2
0.25
Central size Hydrogen with Steam Methane
Reformer
Central size Hydrogen with SMR w/ CO2
CCS
Central size Hydrogen with
Coal Gassification
Central size Hydrogen with
Coal Gasif. CO2 CCS
Central Size Hydrogen via
Grid Electrolysis
Total Investment Cost
Production Transmission Distribution and Dispensing
Millions
$/ Kg/hr

118
Figure 48 illustrates the levels of CO2 emissions corresponding to the pathways
analyzed. Here, two pathways require carbon capture and sequestration for the production of
hydrogen from coal and natural gas. Figure 48 also shows that the production of hydrogen
from water through electrolysis process it is not the best option when electricity is taken from
the grid because of the greenhouse gas emissions that can be generated per kilogram of
hydrogen produced due to the generation technologies used. Conversely, the electricity
generation using renewable or nuclear energy technologies, separate from the grid, is a
possible option for hydrogen production via electrolysis.
For each station and their respective segments, 5% and 1% of the total capital investment
was assumed to represent fixed operating cost and variable non-fuel cost. The efficiency was
taken from [87] and [88]. The electricity consumptions, the plant life and the CO2 emissions
of the process were taken from [19].
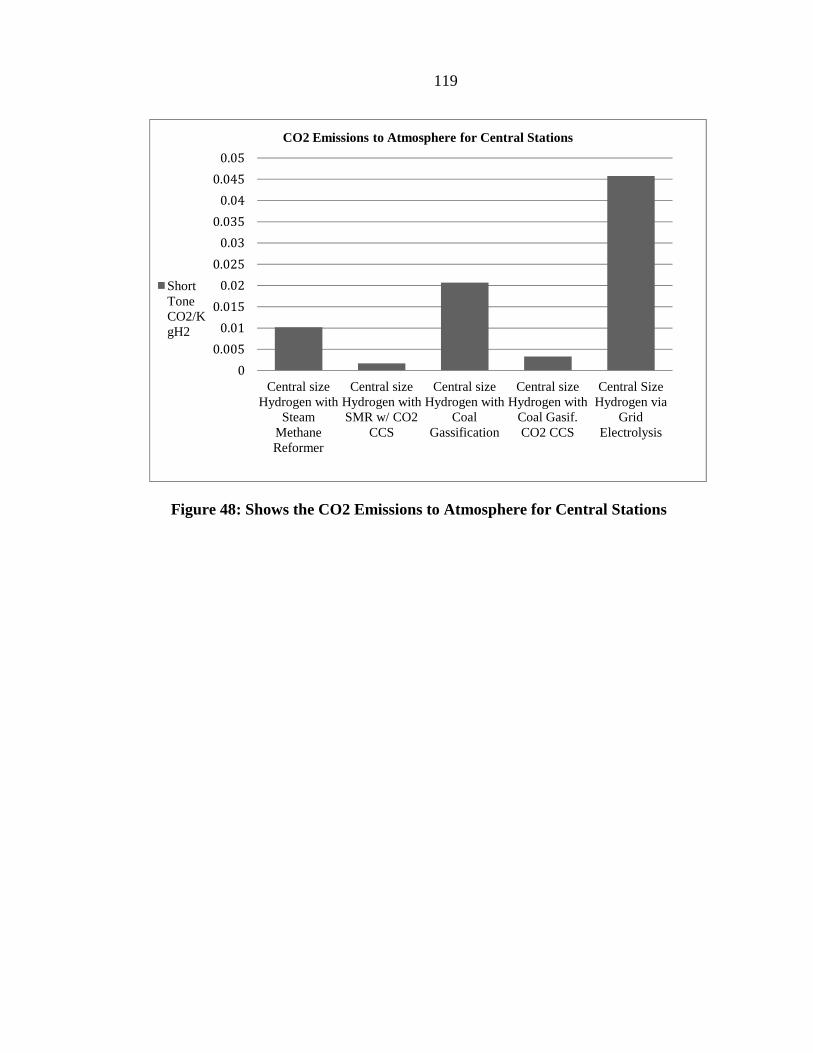
119
Figure 48: Shows the CO2 Emissions to Atmosphere for Central Stations
0
0.005
0.01
0.015
0.02
0.025
0.03
0.035
0.04
0.045
0.05
Central size Hydrogen with
Steam Methane Reformer
Central size Hydrogen with SMR w/ CO2
CCS
Central size Hydrogen with
Coal Gassification
Central size Hydrogen with
Coal Gasif. CO2 CCS
Central Size Hydrogen via
Grid Electrolysis
CO2 Emissions to Atmosphere for Central Stations
Short Tone CO2/KgH2
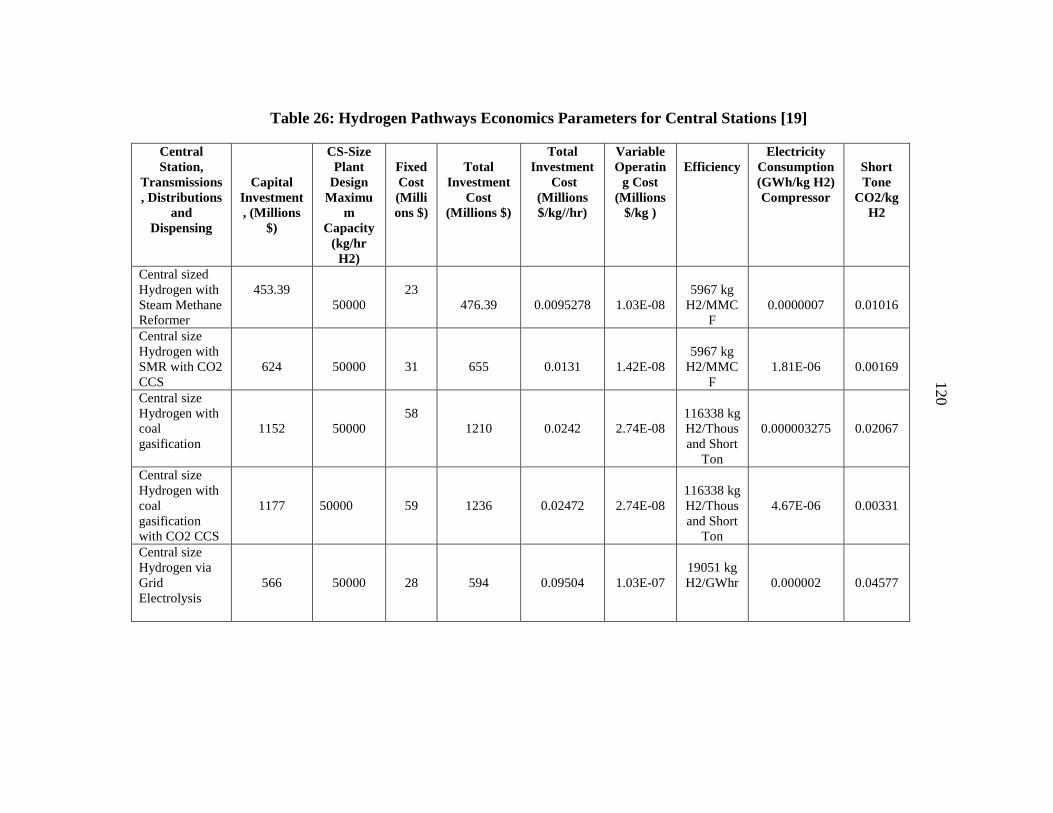
Table 26: Hydrogen Pathways Economics Parameters for Central Stations [19]
Central Station,
Transmissions, Distributions
and Dispensing
Capital Investment, (Millions
$)
CS-Size Plant
Design Maximu
m Capacity
(kg/hr H2)
Fixed Cost (Millions $)
Total
Investment Cost
(Millions $)
Total Investment
Cost (Millions $/kg//hr)
Variable Operatin
g Cost (Millions
$/kg )
Efficiency
Electricity Consumption (GWh/kg H2) Compressor
Short Tone
CO2/kg H2
Central sized Hydrogen with Steam Methane Reformer
453.39
50000 23
476.39
0.0095278
1.03E-08
5967 kg
H2/MMCF
0.0000007
0.01016
Central size Hydrogen with SMR with CO2 CCS
624
50000 31
655
0.0131
1.42E-08
5967 kg
H2/MMCF
1.81E-06
0.00169
Central size Hydrogen with coal gasification
1152
50000
58
1210
0.0242
2.74E-08
116338 kg H2/Thousand Short
Ton
0.000003275
0.02067
Central size Hydrogen with coal gasification with CO2 CCS
1177
50000 59
1236
0.02472
2.74E-08
116338 kg H2/Thousand Short
Ton
4.67E-06
0.00331
Central size Hydrogen via Grid Electrolysis
566
50000 28
594
0.09504
1.03E-07
19051 kg H2/GWhr
0.000002
0.04577
120
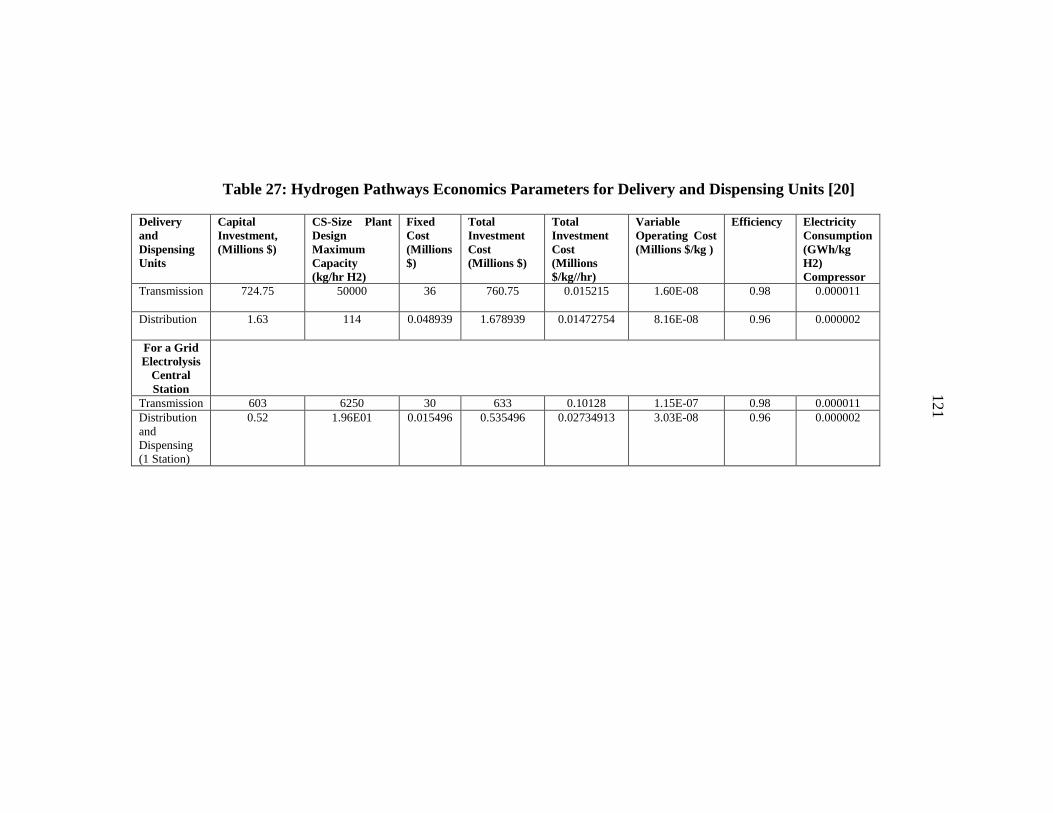
Table 27: Hydrogen Pathways Economics Parameters for Delivery and Dispensing Units [20]
Delivery and Dispensing Units
Capital Investment, (Millions $)
CS-Size Plant Design Maximum Capacity (kg/hr H2)
Fixed Cost (Millions $)
Total Investment Cost (Millions $)
Total Investment Cost (Millions $/kg//hr)
Variable Operating Cost (Millions $/kg )
Efficiency Electricity Consumption (GWh/kg H2) Compressor
Transmission 724.75 50000 36 760.75 0.015215 1.60E-08 0.98 0.000011
Distribution 1.63 114 0.048939 1.678939 0.01472754 8.16E-08 0.96 0.000002
For a Grid Electrolysis
Central Station
Transmission 603 6250 30 633 0.10128 1.15E-07 0.98 0.000011 Distribution and Dispensing (1 Station)
0.52 1.96E01 0.015496 0.535496 0.02734913 3.03E-08 0.96 0.000002
121
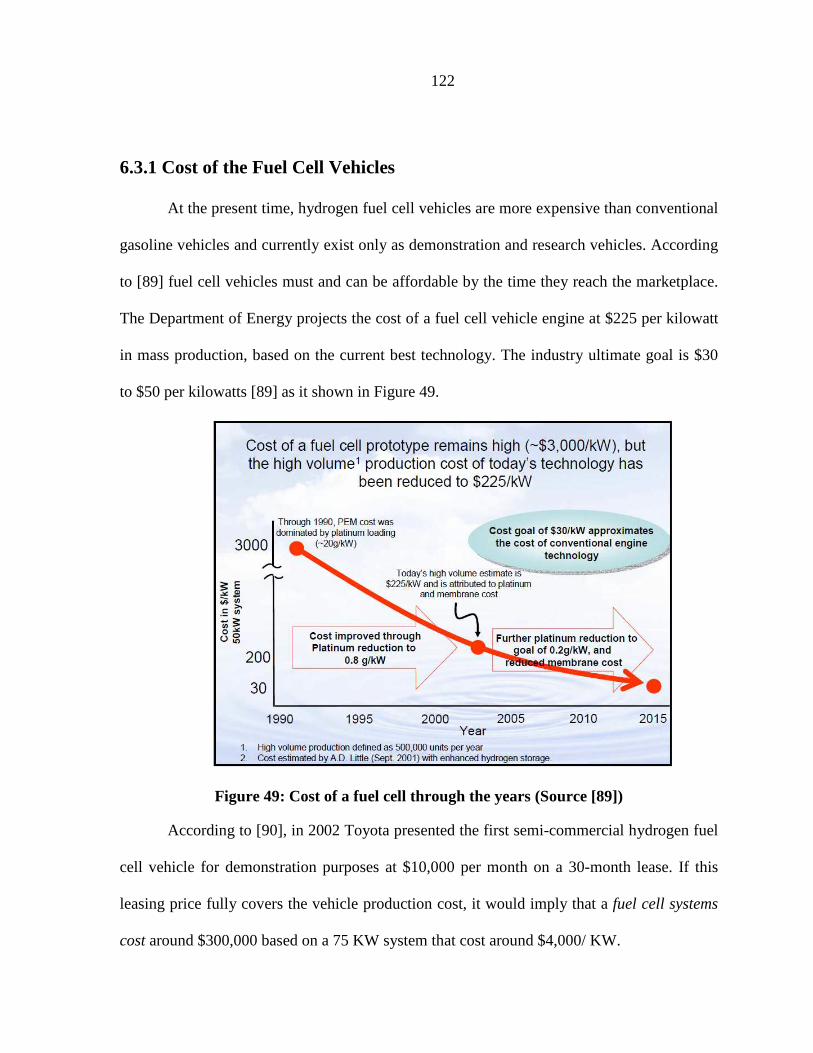
122
6.3.1 Cost of the Fuel Cell Vehicles
At the present time, hydrogen fuel cell vehicles are more expensive than conventional
gasoline vehicles and currently exist only as demonstration and research vehicles. According
to [89] fuel cell vehicles must and can be affordable by the time they reach the marketplace.
The Department of Energy projects the cost of a fuel cell vehicle engine at $225 per kilowatt
in mass production, based on the current best technology. The industry ultimate goal is $30
to $50 per kilowatts [89] as it shown in Figure 49.
Figure 49: Cost of a fuel cell through the years (Source [89])
According to [90], in 2002 Toyota presented the first semi-commercial hydrogen fuel
cell vehicle for demonstration purposes at $10,000 per month on a 30-month lease. If this
leasing price fully covers the vehicle production cost, it would imply that a fuel cell systems
cost around $300,000 based on a 75 KW system that cost around $4,000/ KW.
123
However, fuel cell vehicles could be introduced if the government subsidies lower the
fuel cell price as is the case in the current promotional strategy for compressed natural gas
vehicles [91]. Fortunately, the rapid cost declines are not an unreasonable assumption, as cost
reductions due to technology and process improvements have been taking place in the past
for a wide variety of new technologies [90]. Hydrogen vehicles will require fervent and
sustained commitment by hydrogen producers, transporters, and retail vehicles
manufacturing, consumers and governments in order to achieve success in the transportation
sector [92].
According to [91] in 2015, the fuel cell vehicles price is expected to range between
US $49,850 and US $60,750. The price of the fuel cell vehicle selected in this study is US
$60,750 for all the years. It is assumed that the FCV has a lifespan of 10 years and each
vehicle consumed 185 kg H2/ year.
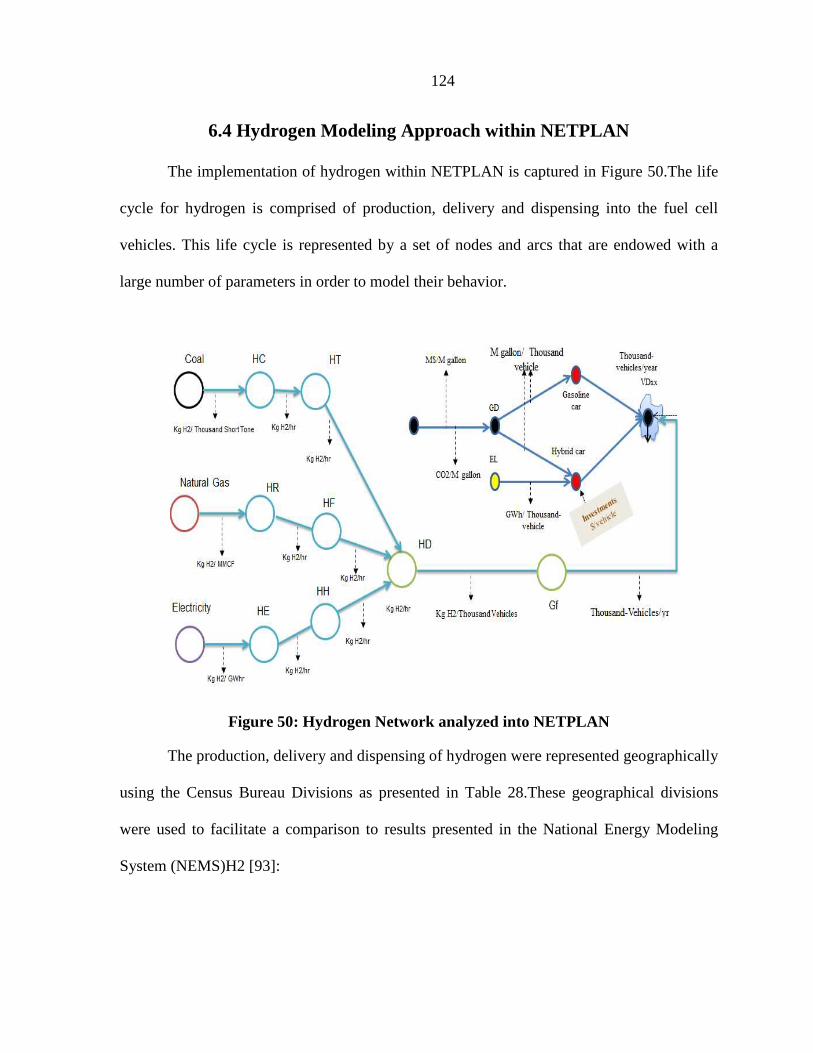
124
6.4 Hydrogen Modeling Approach within NETPLAN
The implementation of hydrogen within NETPLAN is captured in Figure 50.The life
cycle for hydrogen is comprised of production, delivery and dispensing into the fuel cell
vehicles. This life cycle is represented by a set of nodes and arcs that are endowed with a
large number of parameters in order to model their behavior.
Figure 50: Hydrogen Network analyzed into NETPLAN
The production, delivery and dispensing of hydrogen were represented geographically
using the Census Bureau Divisions as presented in Table 28.These geographical divisions
were used to facilitate a comparison to results presented in the National Energy Modeling
System (NEMS)H2 [93]:
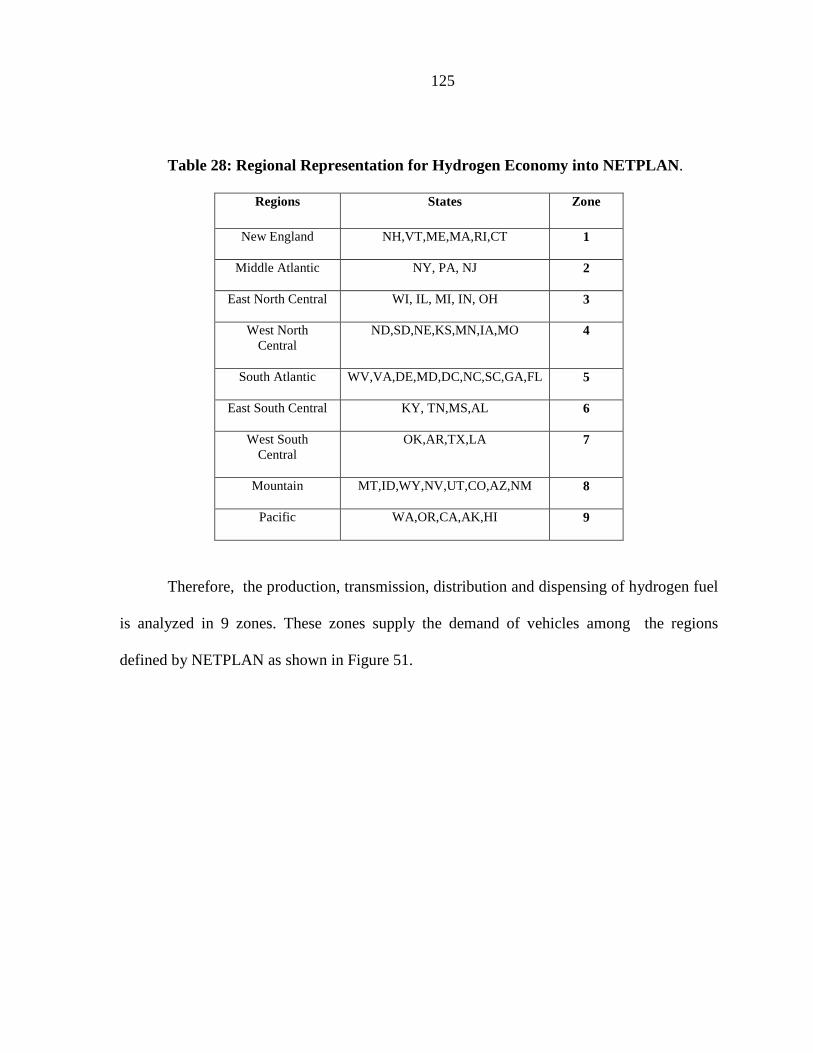
125
Table 28: Regional Representation for Hydrogen Economy into NETPLAN .
Regions States Zone
New England NH,VT,ME,MA,RI,CT 1
Middle Atlantic NY, PA, NJ 2
East North Central WI, IL, MI, IN, OH 3
West North Central
ND,SD,NE,KS,MN,IA,MO 4
South Atlantic WV,VA,DE,MD,DC,NC,SC,GA,FL 5
East South Central KY, TN,MS,AL 6
West South Central
OK,AR,TX,LA 7
Mountain MT,ID,WY,NV,UT,CO,AZ,NM 8
Pacific WA,OR,CA,AK,HI 9
Therefore, the production, transmission, distribution and dispensing of hydrogen fuel
is analyzed in 9 zones. These zones supply the demand of vehicles among the regions
defined by NETPLAN as shown in Figure 51.
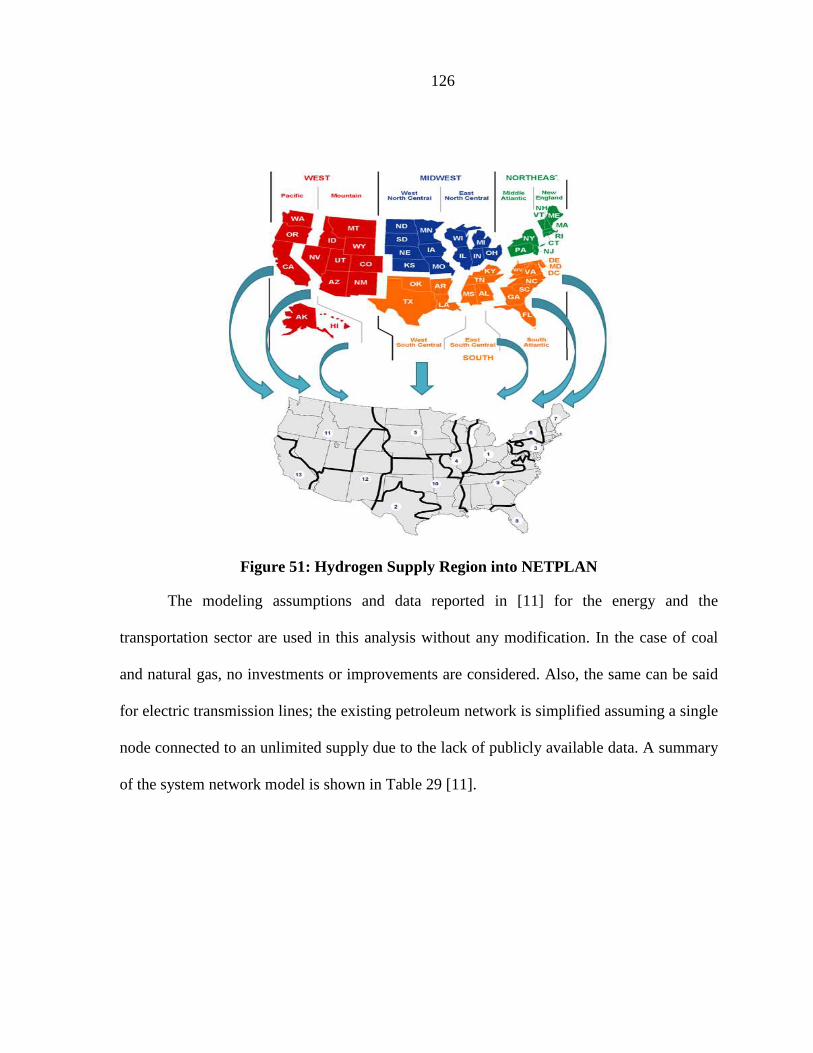
126
Figure 51: Hydrogen Supply Region into NETPLAN
The modeling assumptions and data reported in [11] for the energy and the
transportation sector are used in this analysis without any modification. In the case of coal
and natural gas, no investments or improvements are considered. Also, the same can be said
for electric transmission lines; the existing petroleum network is simplified assuming a single
node connected to an unlimited supply due to the lack of publicly available data. A summary
of the system network model is shown in Table 29 [11].
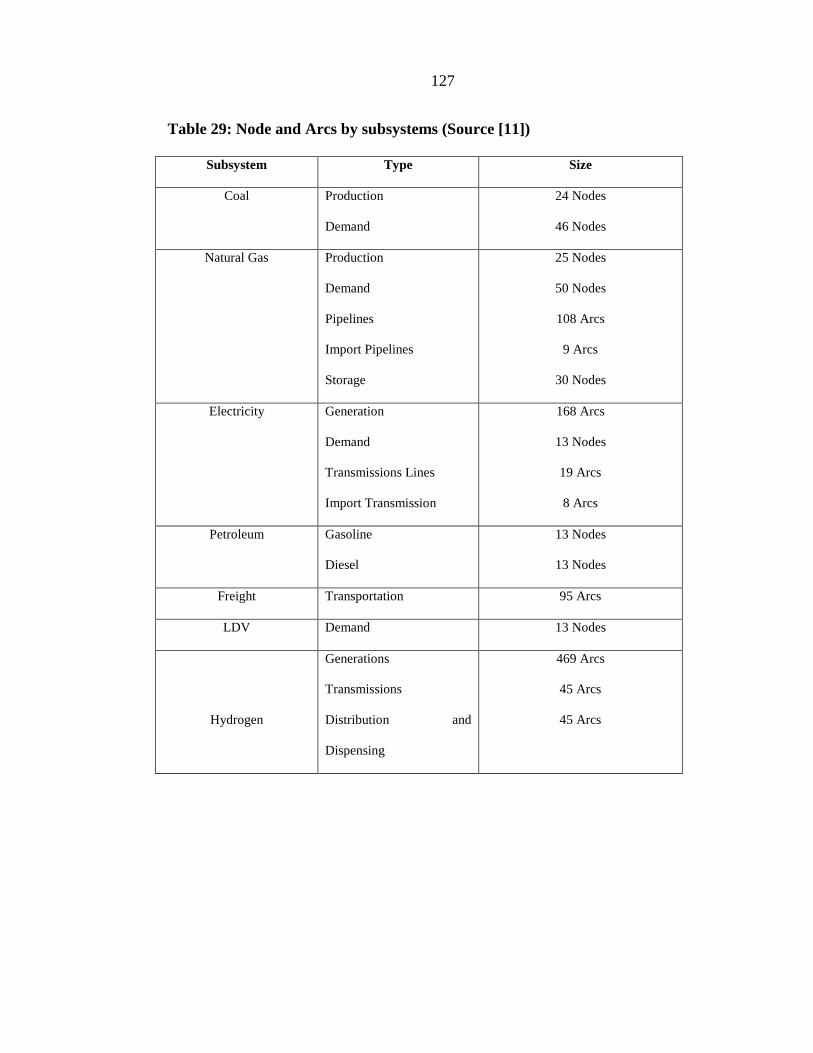
127
Table 29: Node and Arcs by subsystems (Source [11])
Subsystem Type Size
Coal Production
Demand
24 Nodes
46 Nodes
Natural Gas Production
Demand
Pipelines
Import Pipelines
Storage
25 Nodes
50 Nodes
108 Arcs
9 Arcs
30 Nodes
Electricity Generation
Demand
Transmissions Lines
Import Transmission
168 Arcs
13 Nodes
19 Arcs
8 Arcs
Petroleum Gasoline
Diesel
13 Nodes
13 Nodes
Freight Transportation 95 Arcs
LDV Demand 13 Nodes
Hydrogen
Generations
Transmissions
Distribution and
Dispensing
469 Arcs
45 Arcs
45 Arcs
128
6.5 Hydrogen Assumptions Analysis and Results into NETPLAN
In order to become economically attractive for the transportation sector, hydrogen
needs to overcome the challenges that are facing at the present time, for example:
• The construction of a supporting fuel infrastructure (chicken and egg problem)
• The ability to achieve economies of scale in production;
• The reduction on the cost of fuel cell and the storage systems in the fuel cell
vehicles;
• The reduction on the cost of the hydrogen production from renewable energies
• The reduction on the cost of the hydrogen refueling stations
However, it is difficult to know how options which include significant use of
hydrogen pathways will be implemented, and at what cost, when there is a lot of uncertain in
the technology, as is the case at the present time. According to [92], if the technology goal of
the Department of Energy related to fuel cell vehicles and infrastructure research are met, a
sustainable transition to hydrogen appears to be achievable, but only if strong policy is
deployed which induces the early transition of the market penetration of large number of fuel
cell vehicles.
Based on these perspectives, assumptions are presented here which focus on the
deployment of fuel cell vehicles. The following scenarios were analyzed:
1. Determination of FCV purchase price for FCV to become economically
competitive with gasoline-fueled vehicles: The objective here is to identify the FCV
purchase price to allow it to successfully compete with gasoline-fueled vehicles,
given the price of gasoline is $4/gallon. In this scenario, we assume the PHEV is
significantly more expensive than the gasoline-fueled vehicle.
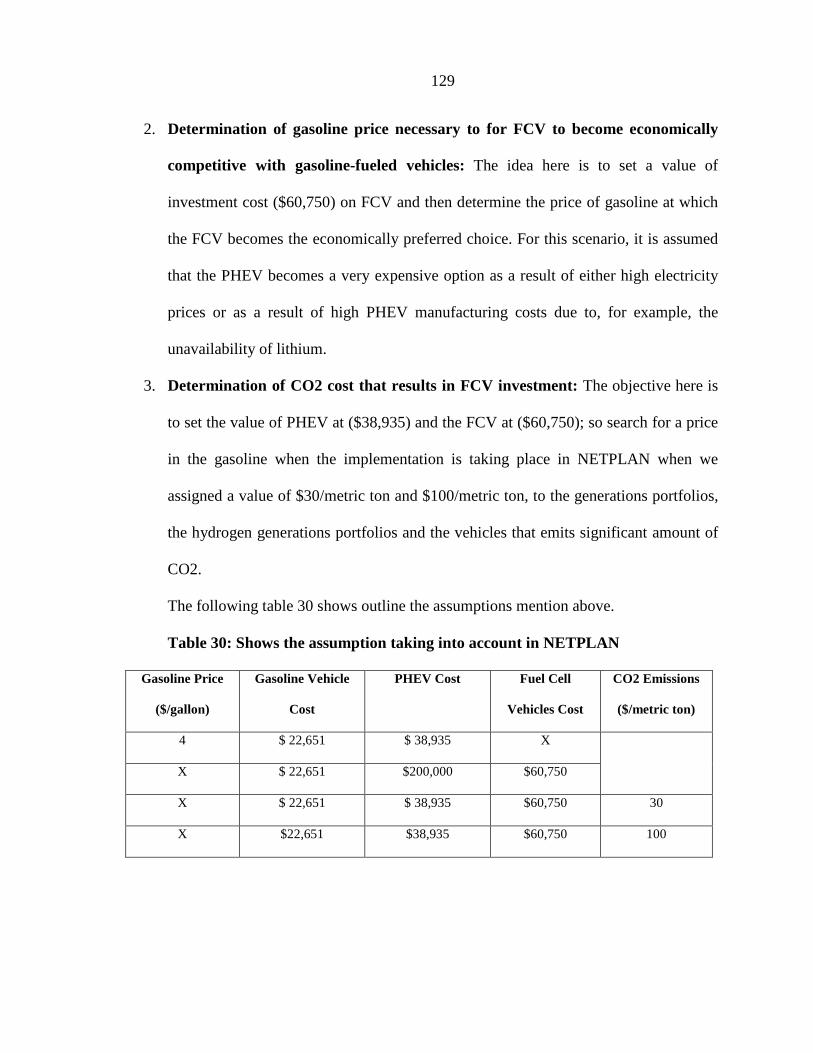
129
2. Determination of gasoline price necessary to for FCV to become economically
competitive with gasoline-fueled vehicles: The idea here is to set a value of
investment cost ($60,750) on FCV and then determine the price of gasoline at which
the FCV becomes the economically preferred choice. For this scenario, it is assumed
that the PHEV becomes a very expensive option as a result of either high electricity
prices or as a result of high PHEV manufacturing costs due to, for example, the
unavailability of lithium.
3. Determination of CO2 cost that results in FCV investment: The objective here is
to set the value of PHEV at ($38,935) and the FCV at ($60,750); so search for a price
in the gasoline when the implementation is taking place in NETPLAN when we
assigned a value of $30/metric ton and $100/metric ton, to the generations portfolios,
the hydrogen generations portfolios and the vehicles that emits significant amount of
CO2.
The following table 30 shows outline the assumptions mention above.
Table 30: Shows the assumption taking into account in NETPLAN
Gasoline Price
($/gallon)
Gasoline Vehicle
Cost
PHEV Cost Fuel Cell
Vehicles Cost
CO2 Emissions
($/metric ton)
4 $ 22,651 $ 38,935 X
X $ 22,651 $200,000 $60,750
X $ 22,651 $ 38,935 $60,750 30
X $22,651 $38,935 $60,750 100
130
6.5.1 Results
The following graph shows the results obtained from NETPLAN due to the above
assumptions.
1. Determination of FCV purchase price for FCV to become economically competitive
with gasoline-fueled vehicles
Here the investment cost of the FCV was reduced considerable compare to its actual
price; and the value of $4/gallon was set for the operational cost of the gasoline vehicles. The
value of the PHEV was set to $ 38,935 but it was not selected by NETPLAN during the
simulation.
A series of simulations were performed in order to obtain results for the
implementation of FCV in supplying the demand of vehicles in NETPLAN as it is shown in
Figure 52. It can be noted that the penetration of FCV began to take place when the price was
set to $32,000 and continued to increase when the cost was reduced until it reached the same
price of the gasoline vehicles. Figure 53 shows the deployment of gasoline vehicles by zone
into NETPLAN.
The technology selected by NETPLAN for the production of hydrogen was Steam
Methane Reformer central station without CCS. The use of the natural gas as the feedstock
for hydrogen production is due to the fact that this technology presents the low investment
cost and the operational cost compared with the others technologies. The rest of the
technologies correspond to: Steam Methane Reformer with CCS, Coal Gasification with and
without CCS and Electrolysis of water using grid electricity.
On the other hand, the hydrogen supply node is based on the Census Region
Divisions that it will supply hydrogen to the fuel cell vehicles needed by the 13 zones defined
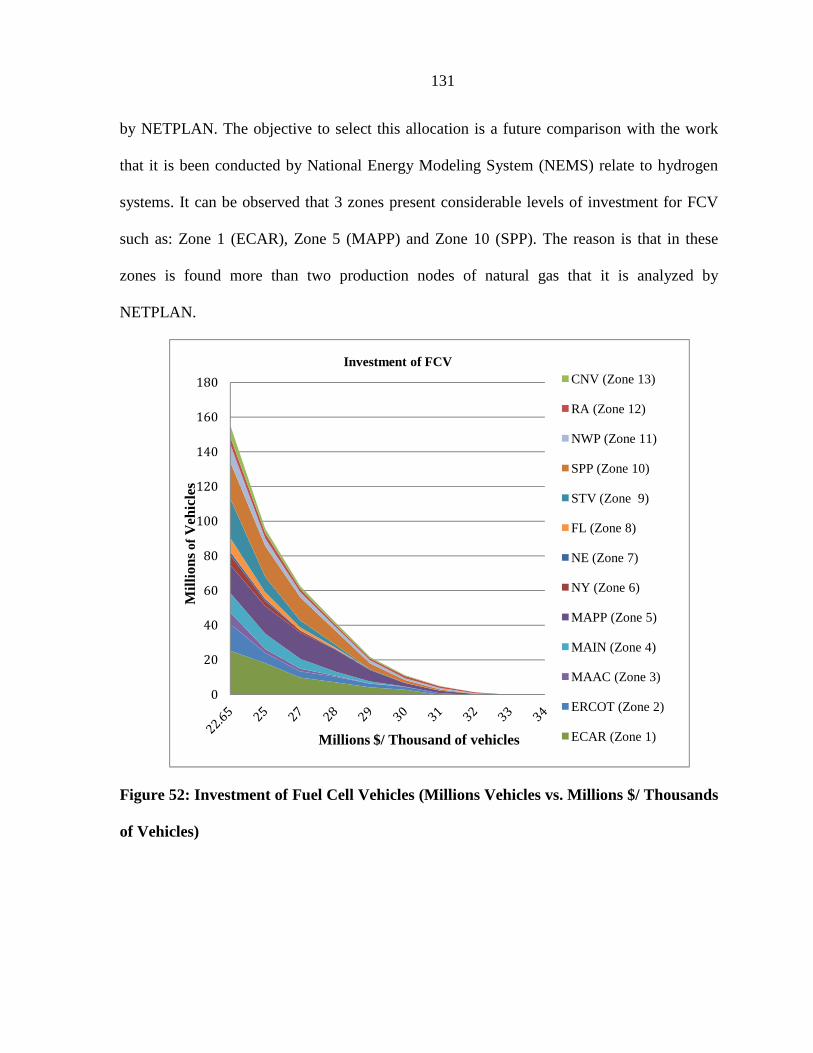
131
by NETPLAN. The objective to select this allocation is a future comparison with the work
that it is been conducted by National Energy Modeling System (NEMS) relate to hydrogen
systems. It can be observed that 3 zones present considerable levels of investment for FCV
such as: Zone 1 (ECAR), Zone 5 (MAPP) and Zone 10 (SPP). The reason is that in these
zones is found more than two production nodes of natural gas that it is analyzed by
NETPLAN.
Figure 52: Investment of Fuel Cell Vehicles (Millions Vehicles vs. Millions $/ Thousands
of Vehicles)
0
20
40
60
80
100
120
140
160
180
Investment of FCV CNV (Zone 13)
RA (Zone 12)
NWP (Zone 11)
SPP (Zone 10)
STV (Zone 9)
FL (Zone 8)
NE (Zone 7)
NY (Zone 6)
MAPP (Zone 5)
MAIN (Zone 4)
MAAC (Zone 3)
ERCOT (Zone 2)
ECAR (Zone 1)Millions $/ Thousand of vehicles
Mill
ions
ofV
ehic
les
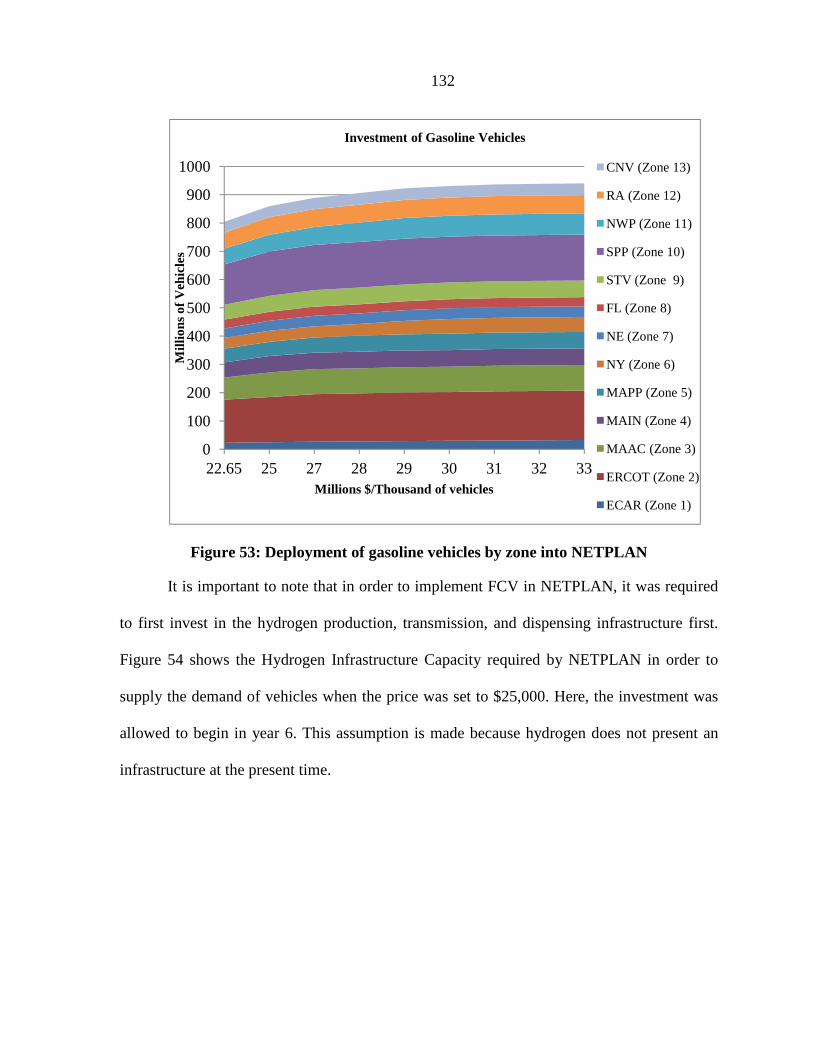
132
Figure 53: Deployment of gasoline vehicles by zone into NETPLAN
It is important to note that in order to implement FCV in NETPLAN, it was required
to first invest in the hydrogen production, transmission, and dispensing infrastructure first.
Figure 54 shows the Hydrogen Infrastructure Capacity required by NETPLAN in order to
supply the demand of vehicles when the price was set to $25,000. Here, the investment was
allowed to begin in year 6. This assumption is made because hydrogen does not present an
infrastructure at the present time.
0
100
200
300
400
500
600
700
800
900
1000
22.65 25 27 28 29 30 31 32 33
Mill
ions
of V
ehic
les
Millions $/Thousand of vehicles
Investment of Gasoline Vehicles
CNV (Zone 13)
RA (Zone 12)
NWP (Zone 11)
SPP (Zone 10)
STV (Zone 9)
FL (Zone 8)
NE (Zone 7)
NY (Zone 6)
MAPP (Zone 5)
MAIN (Zone 4)
MAAC (Zone 3)
ERCOT (Zone 2)
ECAR (Zone 1)
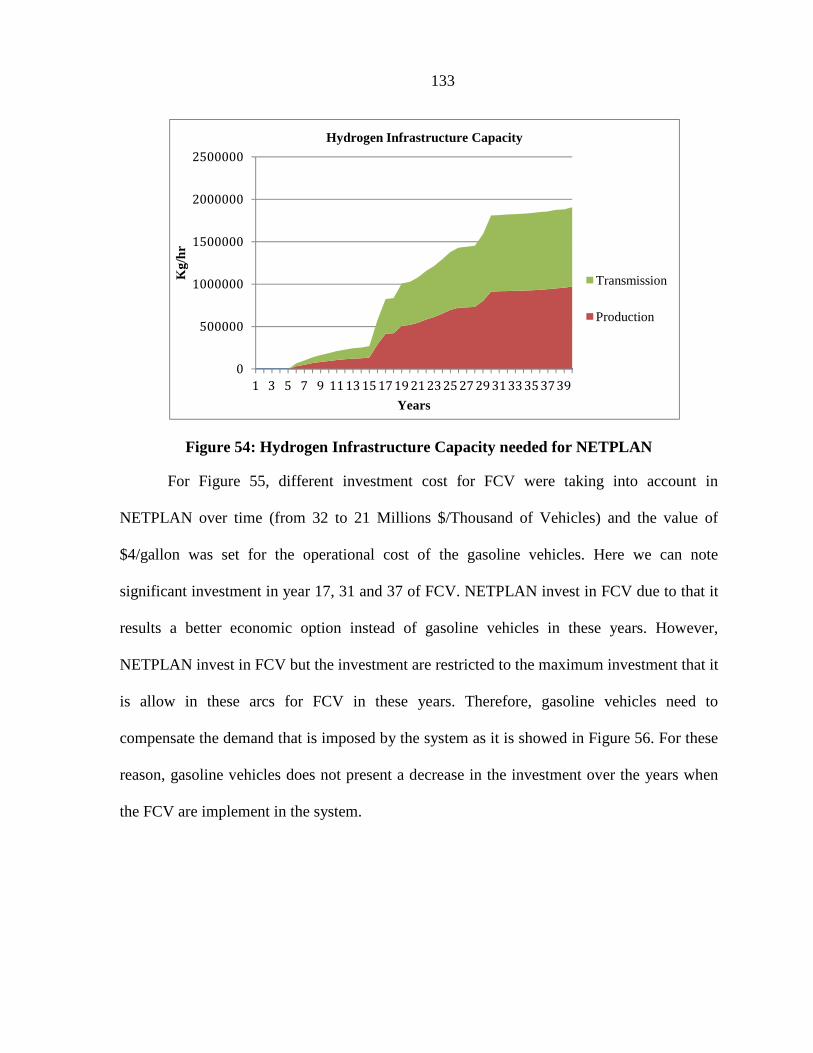
133
Figure 54: Hydrogen Infrastructure Capacity needed for NETPLAN
For Figure 55, different investment cost for FCV were taking into account in
NETPLAN over time (from 32 to 21 Millions $/Thousand of Vehicles) and the value of
$4/gallon was set for the operational cost of the gasoline vehicles. Here we can note
significant investment in year 17, 31 and 37 of FCV. NETPLAN invest in FCV due to that it
results a better economic option instead of gasoline vehicles in these years. However,
NETPLAN invest in FCV but the investment are restricted to the maximum investment that it
is allow in these arcs for FCV in these years. Therefore, gasoline vehicles need to
compensate the demand that is imposed by the system as it is showed in Figure 56. For these
reason, gasoline vehicles does not present a decrease in the investment over the years when
the FCV are implement in the system.
0
500000
1000000
1500000
2000000
2500000
1 3 5 7 9 11 13 15 1719 21 2325 27 29 3133 35 3739
Kg/
hr
Years
Hydrogen Infrastructure Capacity
Transmission
Production
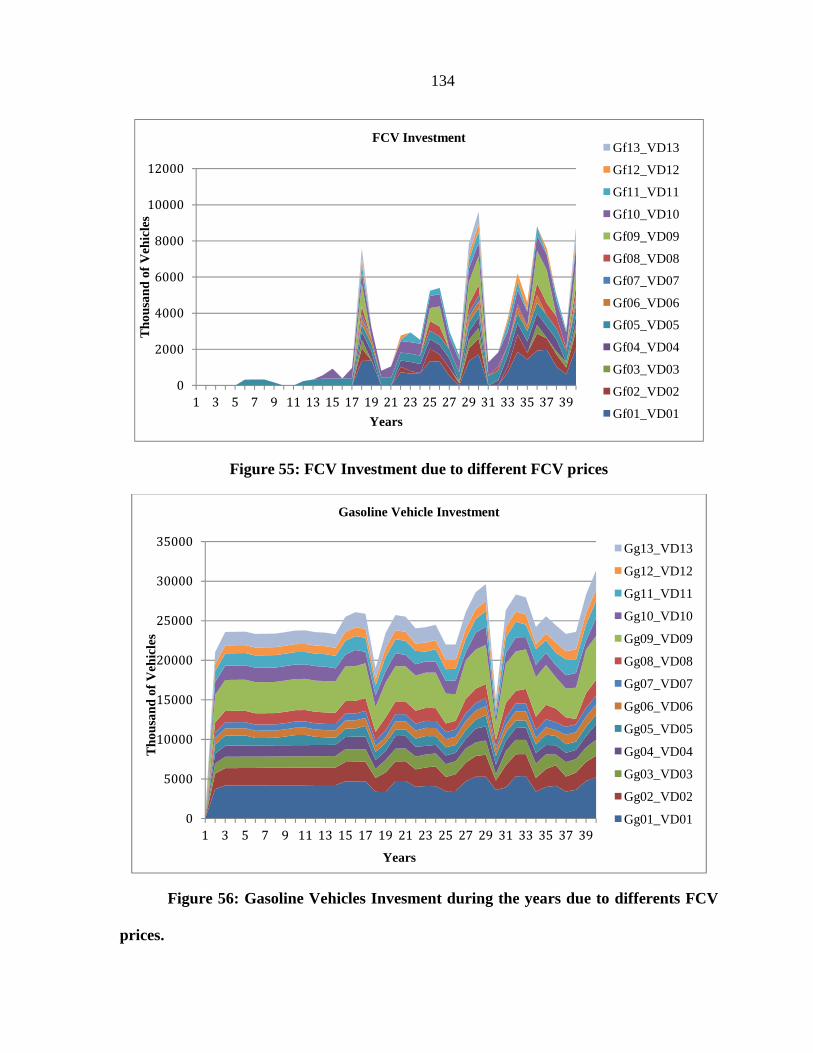
134
Figure 55: FCV Investment due to different FCV prices
Figure 56: Gasoline Vehicles Invesment during the years due to differents FCV
prices.
0
2000
4000
6000
8000
10000
12000
1 3 5 7 9 11 13 15 17 19 21 23 25 27 29 31 33 35 37 39
Tho
usan
d of
Veh
icle
s
Years
FCV Investment Gf13_VD13
Gf12_VD12
Gf11_VD11
Gf10_VD10
Gf09_VD09
Gf08_VD08
Gf07_VD07
Gf06_VD06
Gf05_VD05
Gf04_VD04
Gf03_VD03
Gf02_VD02
Gf01_VD01
0
5000
10000
15000
20000
25000
30000
35000
1 3 5 7 9 11 13 15 17 19 21 23 25 27 29 31 33 35 37 39
Tho
usan
d of
Veh
icle
s
Years
Gasoline Vehicle Investment
Gg13_VD13
Gg12_VD12
Gg11_VD11
Gg10_VD10
Gg09_VD09
Gg08_VD08
Gg07_VD07
Gg06_VD06
Gg05_VD05
Gg04_VD04
Gg03_VD03
Gg02_VD02
Gg01_VD01
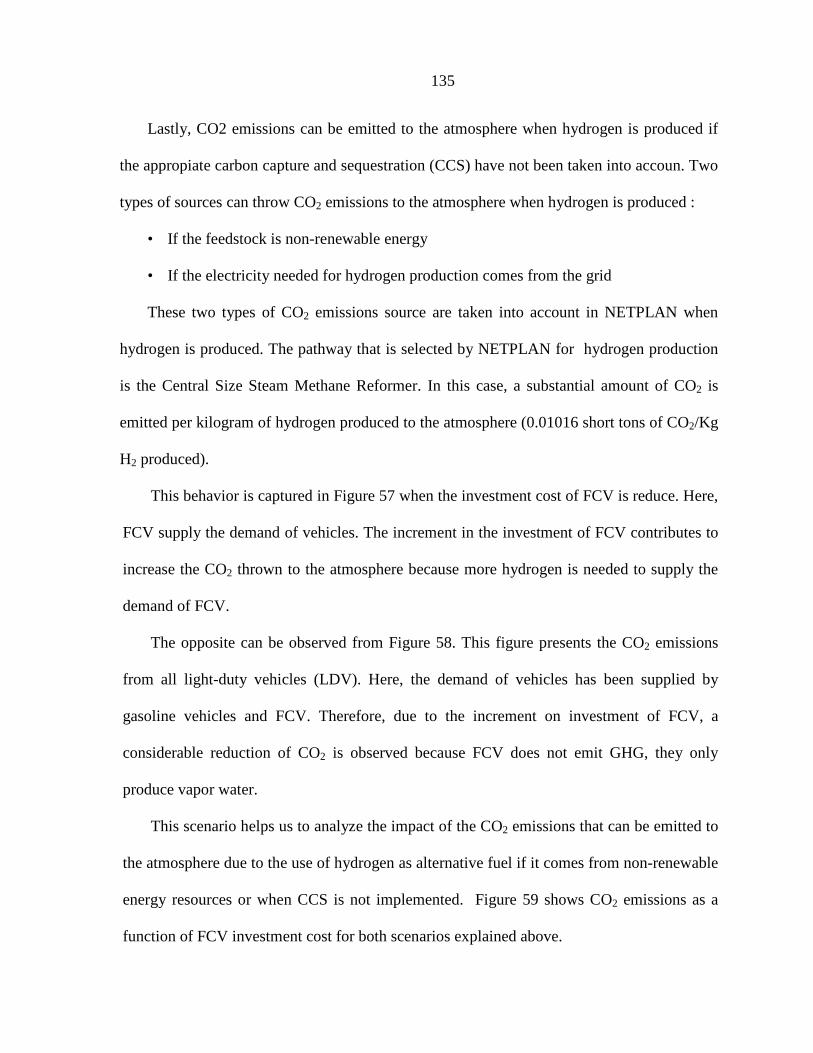
135
Lastly, CO2 emissions can be emitted to the atmosphere when hydrogen is produced if
the appropiate carbon capture and sequestration (CCS) have not been taken into accoun. Two
types of sources can throw CO2 emissions to the atmosphere when hydrogen is produced :
• If the feedstock is non-renewable energy
• If the electricity needed for hydrogen production comes from the grid
These two types of CO2 emissions source are taken into account in NETPLAN when
hydrogen is produced. The pathway that is selected by NETPLAN for hydrogen production
is the Central Size Steam Methane Reformer. In this case, a substantial amount of CO2 is
emitted per kilogram of hydrogen produced to the atmosphere (0.01016 short tons of CO2/Kg
H2 produced).
This behavior is captured in Figure 57 when the investment cost of FCV is reduce. Here,
FCV supply the demand of vehicles. The increment in the investment of FCV contributes to
increase the CO2 thrown to the atmosphere because more hydrogen is needed to supply the
demand of FCV.
The opposite can be observed from Figure 58. This figure presents the CO2 emissions
from all light-duty vehicles (LDV). Here, the demand of vehicles has been supplied by
gasoline vehicles and FCV. Therefore, due to the increment on investment of FCV, a
considerable reduction of CO2 is observed because FCV does not emit GHG, they only
produce vapor water.
This scenario helps us to analyze the impact of the CO2 emissions that can be emitted to
the atmosphere due to the use of hydrogen as alternative fuel if it comes from non-renewable
energy resources or when CCS is not implemented. Figure 59 shows CO2 emissions as a
function of FCV investment cost for both scenarios explained above.
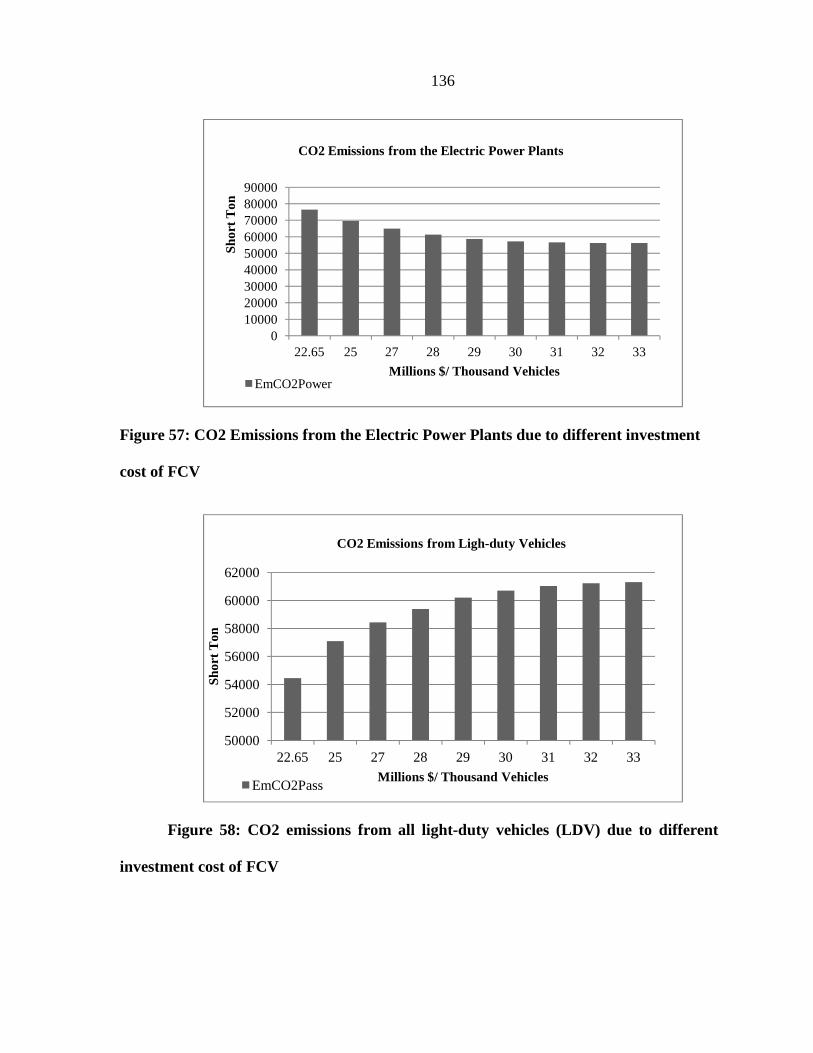
136
Figure 57: CO2 Emissions from the Electric Power Plants due to different investment
cost of FCV
Figure 58: CO2 emissions from all light-duty vehicles (LDV) due to different
investment cost of FCV
0100002000030000400005000060000700008000090000
22.65 25 27 28 29 30 31 32 33
Sho
rt T
on
Millions $/ Thousand Vehicles
CO2 Emissions from the Electric Power Plants
EmCO2Power
50000
52000
54000
56000
58000
60000
62000
22.65 25 27 28 29 30 31 32 33
Sho
rt T
on
Millions $/ Thousand Vehicles
CO2 Emissions from Ligh-duty Vehicles
EmCO2Pass
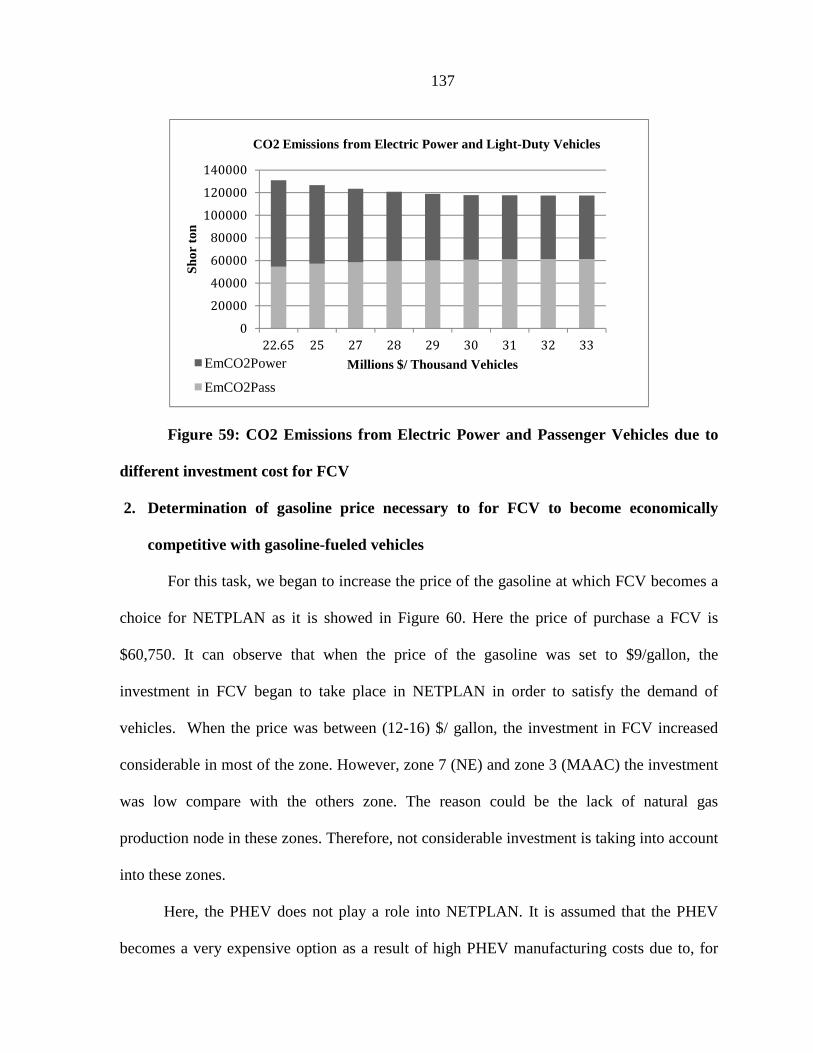
137
Figure 59: CO2 Emissions from Electric Power and Passenger Vehicles due to
different investment cost for FCV
2. Determination of gasoline price necessary to for FCV to become economically
competitive with gasoline-fueled vehicles
For this task, we began to increase the price of the gasoline at which FCV becomes a
choice for NETPLAN as it is showed in Figure 60. Here the price of purchase a FCV is
$60,750. It can observe that when the price of the gasoline was set to $9/gallon, the
investment in FCV began to take place in NETPLAN in order to satisfy the demand of
vehicles. When the price was between (12-16) $/ gallon, the investment in FCV increased
considerable in most of the zone. However, zone 7 (NE) and zone 3 (MAAC) the investment
was low compare with the others zone. The reason could be the lack of natural gas
production node in these zones. Therefore, not considerable investment is taking into account
into these zones.
Here, the PHEV does not play a role into NETPLAN. It is assumed that the PHEV
becomes a very expensive option as a result of high PHEV manufacturing costs due to, for
0
20000
40000
60000
80000
100000
120000
140000
22.65 25 27 28 29 30 31 32 33
Sho
r to
n
Millions $/ Thousand Vehicles
CO2 Emissions from Electric Power and Light-Duty Vehicles
EmCO2Power
EmCO2Pass
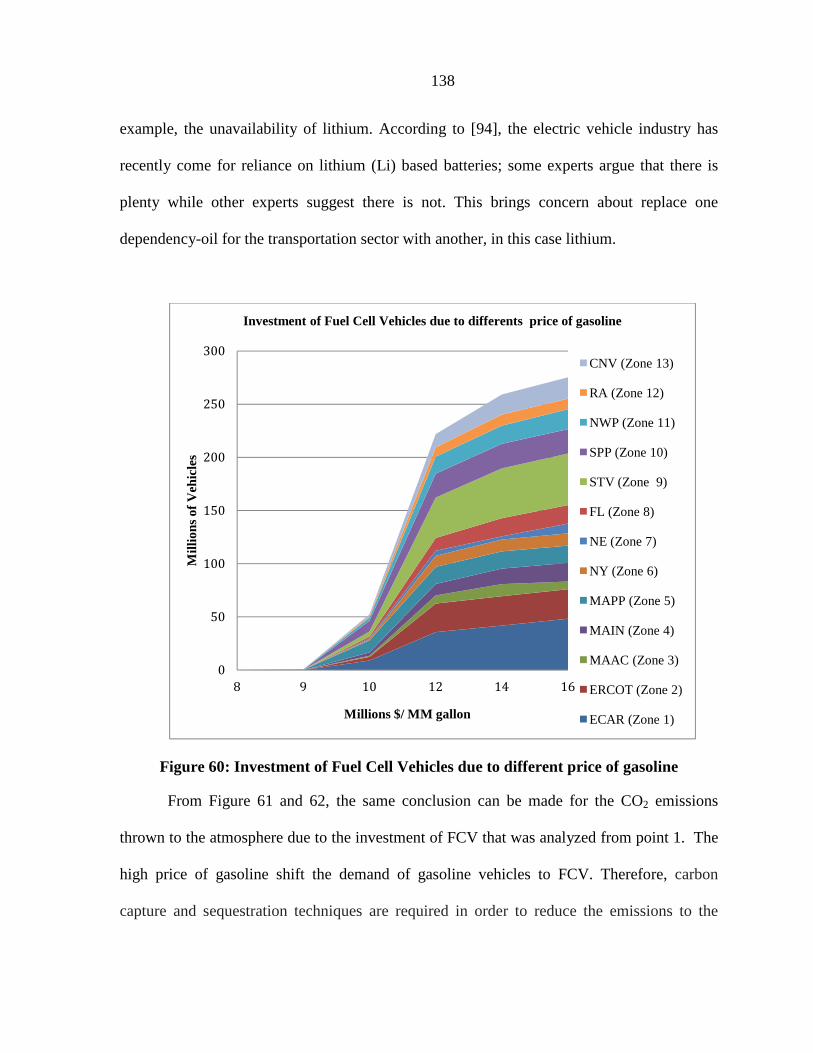
138
example, the unavailability of lithium. According to [94], the electric vehicle industry has
recently come for reliance on lithium (Li) based batteries; some experts argue that there is
plenty while other experts suggest there is not. This brings concern about replace one
dependency-oil for the transportation sector with another, in this case lithium.
Figure 60: Investment of Fuel Cell Vehicles due to different price of gasoline
From Figure 61 and 62, the same conclusion can be made for the CO2 emissions
thrown to the atmosphere due to the investment of FCV that was analyzed from point 1. The
high price of gasoline shift the demand of gasoline vehicles to FCV. Therefore, carbon
capture and sequestration techniques are required in order to reduce the emissions to the
0
50
100
150
200
250
300
8 9 10 12 14 16
Mill
ions
of V
ehic
les
Investment of Fuel Cell Vehicles due to differents price of gasoline
CNV (Zone 13)
RA (Zone 12)
NWP (Zone 11)
SPP (Zone 10)
STV (Zone 9)
FL (Zone 8)
NE (Zone 7)
NY (Zone 6)
MAPP (Zone 5)
MAIN (Zone 4)
MAAC (Zone 3)
ERCOT (Zone 2)
ECAR (Zone 1)Millions $/ MM gallon
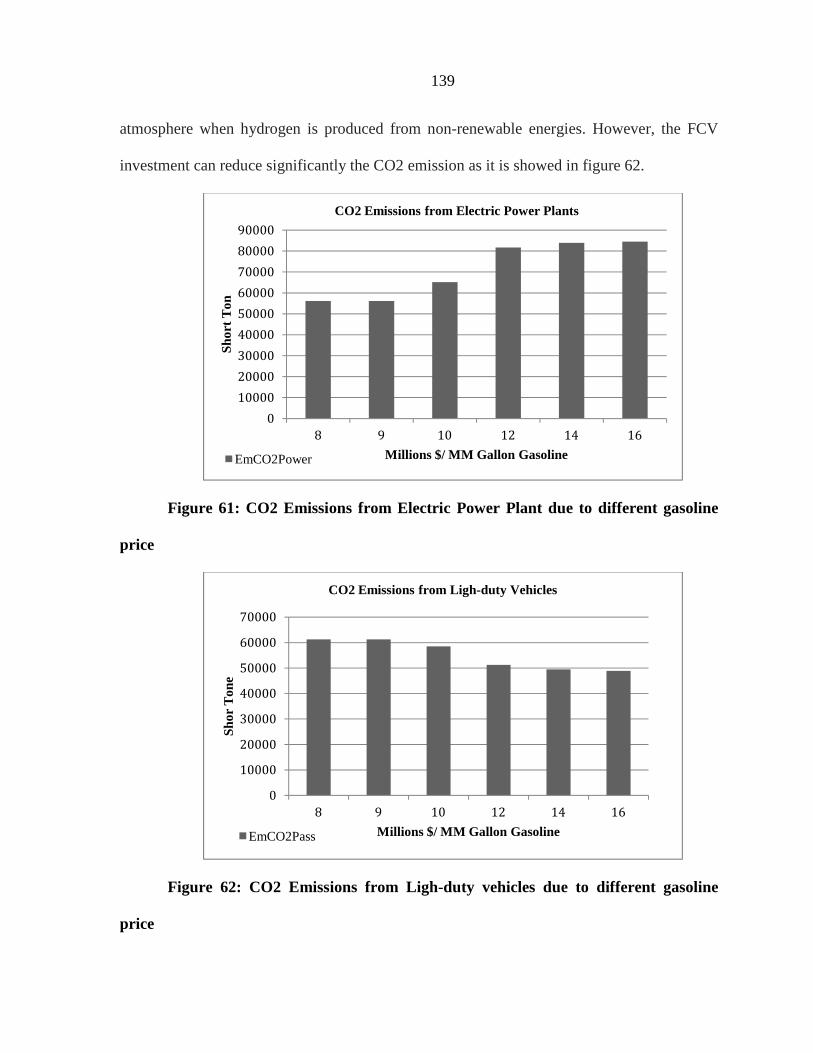
139
atmosphere when hydrogen is produced from non-renewable energies. However, the FCV
investment can reduce significantly the CO2 emission as it is showed in figure 62.
Figure 61: CO2 Emissions from Electric Power Plant due to different gasoline
price
Figure 62: CO2 Emissions from Ligh-duty vehicles due to different gasoline
price
0
10000
20000
30000
40000
50000
60000
70000
80000
90000
8 9 10 12 14 16
Sho
rt T
on
Millions $/ MM Gallon Gasoline
CO2 Emissions from Electric Power Plants
EmCO2Power
0
10000
20000
30000
40000
50000
60000
70000
8 9 10 12 14 16
Sho
r T
one
Millions $/ MM Gallon Gasoline
CO2 Emissions from Ligh-duty Vehicles
EmCO2Pass

140
3. Determination of CO2 cost that result in FCV investment
The objective was search for a price in the gasoline when the implementation of FCV
is taking place in NETPLAN when we assigned a value of 0$/ metric ton, $30/metric ton and
$100/metric ton to the generations portfolios that emits significant amount of CO2 to the
atmosphere.
The generations portfolios that were applied this incremental cost were: pulverized
coal, integrated gasification combined cycle, natural gas combined cycle, oil and geothermal.
The extra cost was added to the variable non-fuel operating cost based on the value
mentioned above and their respective thrown to the atmosphere for the case of the
generations portfolios (mlns $/GWh).
Figures 63, 64 and 65, show the investment in FCV due to different price of gasoline
when a value of $0/metric ton, $30/metric ton and $100/metric ton was added to the
operational cost of the generation portfolios that emitted significant amount of CO2. From
these figure we can observed that the investment of FCV began when the price of the
gasoline is around 8-10$/ gallon for the $0/metric ton scenario. Contrary to figure 64, the
investment of FCV began at the price of $10/gallon; for both, the FCV investment increase
when the price of gasoline increment. However, from figure 65, we can observed that when
we assigned 100$/metric ton to the operation cost of the generations portfolios mention
above, the investment of FCV is not as huge compare with the others two scenarios. The
reason can be that the electricity needed for hydrogen production is very expensive compare
with 0 and 30 $/metric ton.
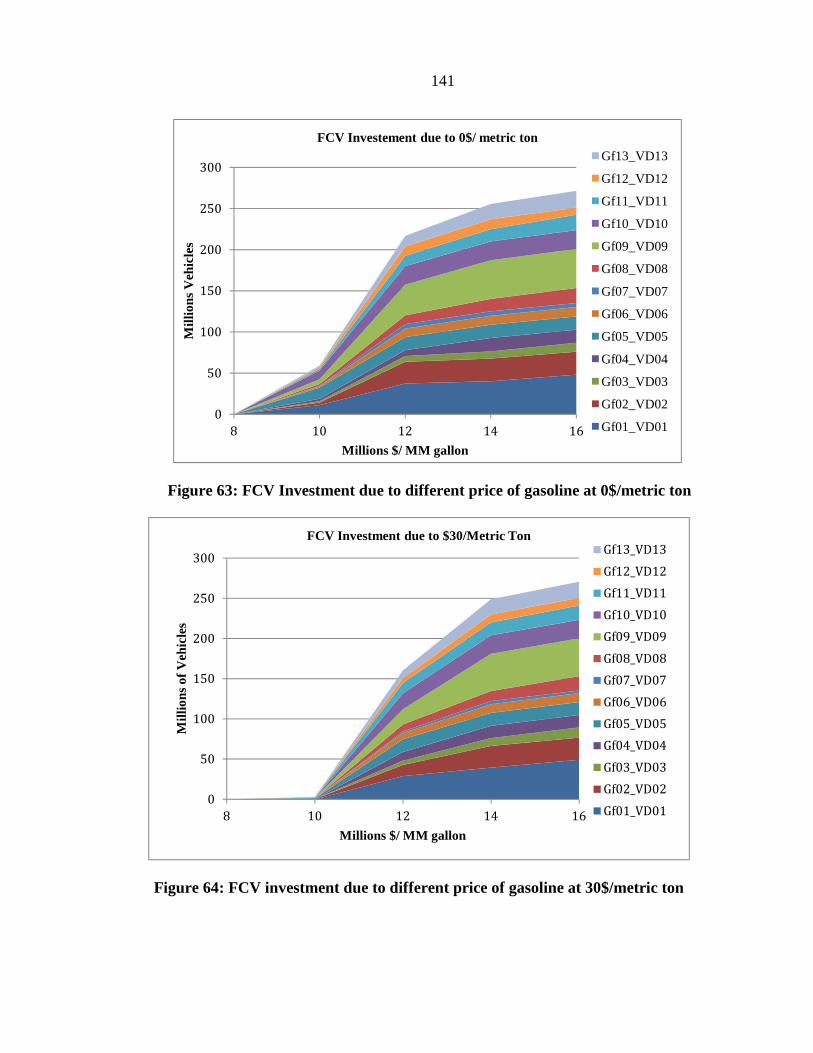
141
Figure 63: FCV Investment due to different price of gasoline at 0$/metric ton
Figure 64: FCV investment due to different price of gasoline at 30$/metric ton
0
50
100
150
200
250
300
8 10 12 14 16
Mill
ions
Veh
icle
s
Millions $/ MM gallon
FCV Investement due to 0$/ metric tonGf13_VD13
Gf12_VD12
Gf11_VD11
Gf10_VD10
Gf09_VD09
Gf08_VD08
Gf07_VD07
Gf06_VD06
Gf05_VD05
Gf04_VD04
Gf03_VD03
Gf02_VD02
Gf01_VD01
0
50
100
150
200
250
300
8 10 12 14 16
Mill
ions
of V
ehic
les
Millions $/ MM gallon
FCV Investment due to $30/Metric TonGf13_VD13
Gf12_VD12
Gf11_VD11
Gf10_VD10
Gf09_VD09
Gf08_VD08
Gf07_VD07
Gf06_VD06
Gf05_VD05
Gf04_VD04
Gf03_VD03
Gf02_VD02
Gf01_VD01
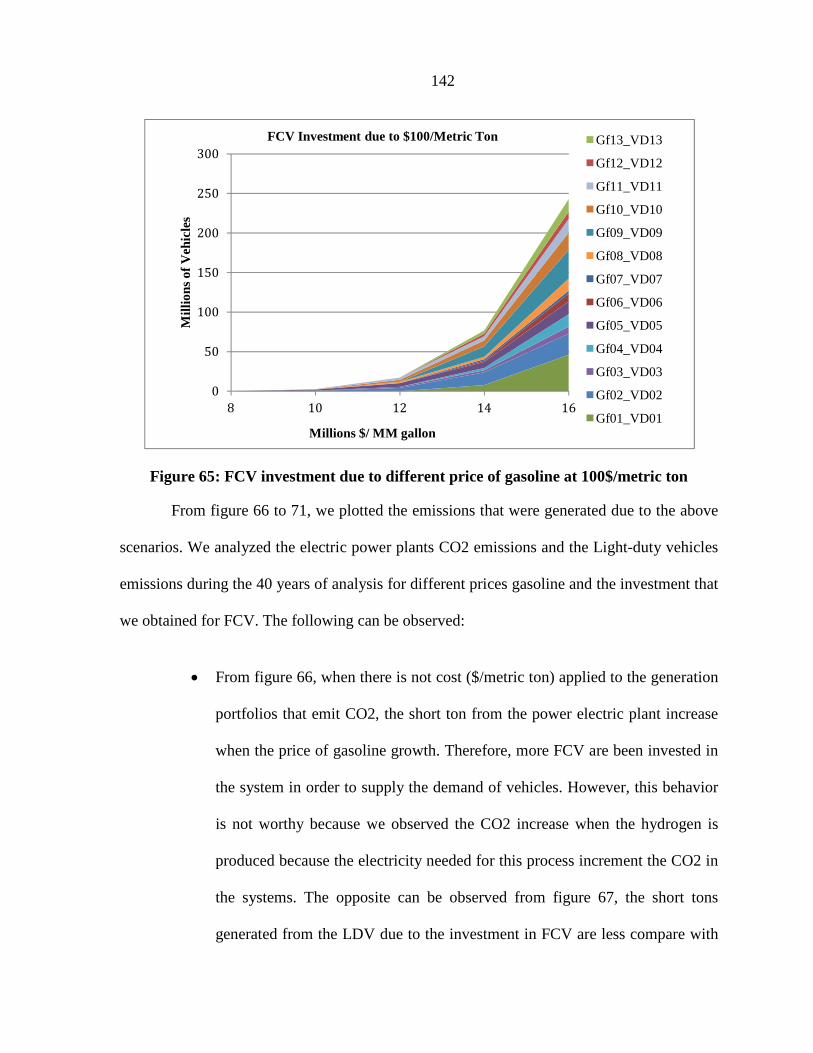
142
Figure 65: FCV investment due to different price of gasoline at 100$/metric ton
From figure 66 to 71, we plotted the emissions that were generated due to the above
scenarios. We analyzed the electric power plants CO2 emissions and the Light-duty vehicles
emissions during the 40 years of analysis for different prices gasoline and the investment that
we obtained for FCV. The following can be observed:
• From figure 66, when there is not cost ($/metric ton) applied to the generation
portfolios that emit CO2, the short ton from the power electric plant increase
when the price of gasoline growth. Therefore, more FCV are been invested in
the system in order to supply the demand of vehicles. However, this behavior
is not worthy because we observed the CO2 increase when the hydrogen is
produced because the electricity needed for this process increment the CO2 in
the systems. The opposite can be observed from figure 67, the short tons
generated from the LDV due to the investment in FCV are less compare with
0
50
100
150
200
250
300
8 10 12 14 16
Mill
ions
of V
ehic
les
Millions $/ MM gallon
FCV Investment due to $100/Metric Ton Gf13_VD13
Gf12_VD12
Gf11_VD11
Gf10_VD10
Gf09_VD09
Gf08_VD08
Gf07_VD07
Gf06_VD06
Gf05_VD05
Gf04_VD04
Gf03_VD03
Gf02_VD02
Gf01_VD01
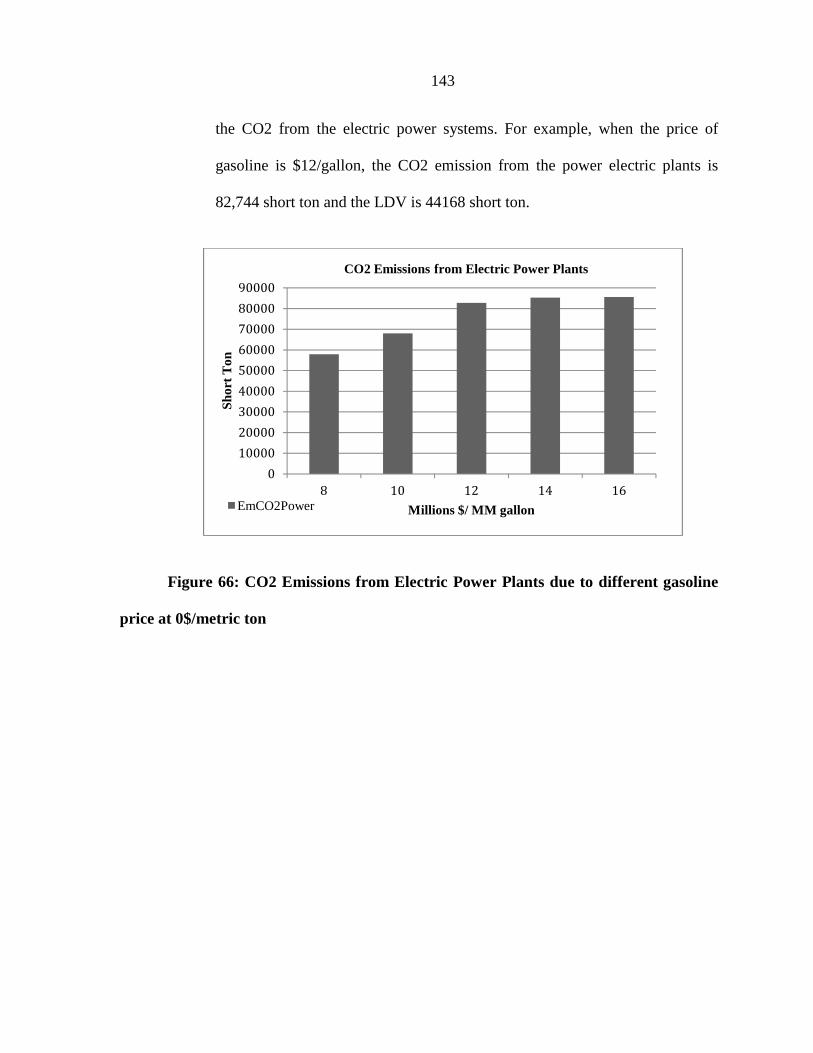
143
the CO2 from the electric power systems. For example, when the price of
gasoline is $12/gallon, the CO2 emission from the power electric plants is
82,744 short ton and the LDV is 44168 short ton.
Figure 66: CO2 Emissions from Electric Power Plants due to different gasoline
price at 0$/metric ton
0
10000
20000
30000
40000
50000
60000
70000
80000
90000
8 10 12 14 16
Sho
rt T
on
Millions $/ MM gallon
CO2 Emissions from Electric Power Plants
EmCO2Power
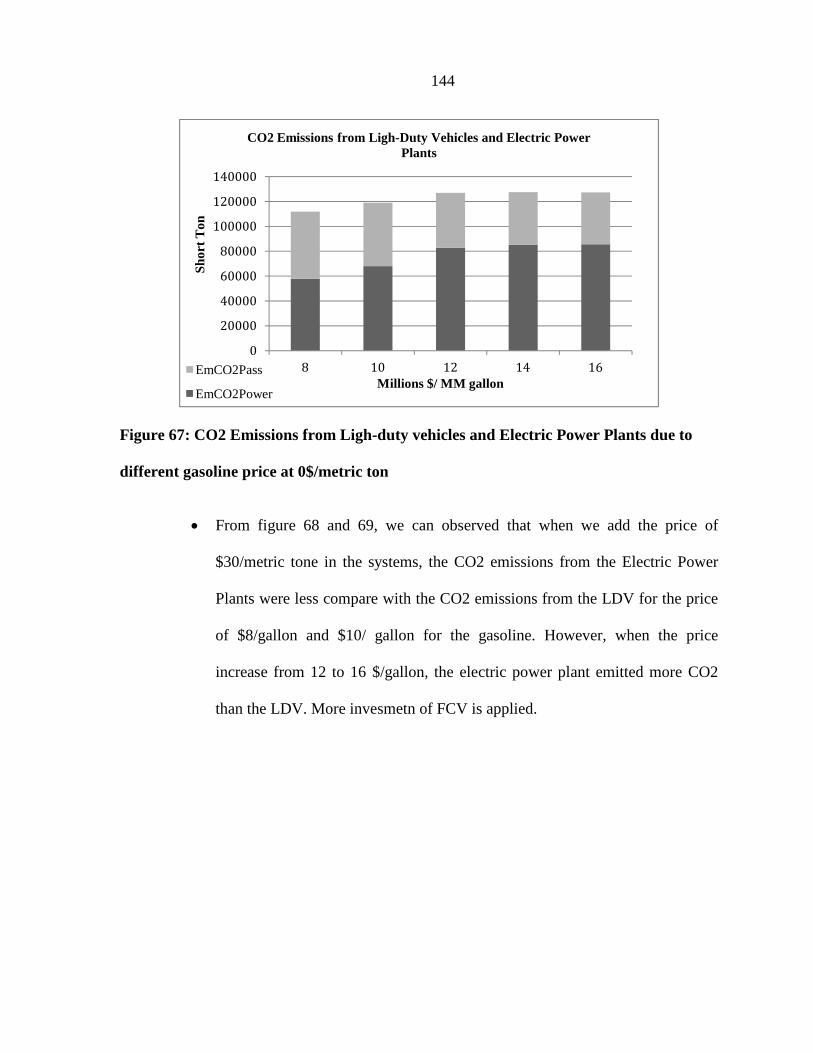
144
Figure 67: CO2 Emissions from Ligh-duty vehicles and Electric Power Plants due to
different gasoline price at 0$/metric ton
• From figure 68 and 69, we can observed that when we add the price of
$30/metric tone in the systems, the CO2 emissions from the Electric Power
Plants were less compare with the CO2 emissions from the LDV for the price
of $8/gallon and $10/ gallon for the gasoline. However, when the price
increase from 12 to 16 $/gallon, the electric power plant emitted more CO2
than the LDV. More invesmetn of FCV is applied.
0
20000
40000
60000
80000
100000
120000
140000
8 10 12 14 16
Sho
rt T
on
Millions $/ MM gallon
CO2 Emissions from Ligh-Duty Vehicles and Electric Power Plants
EmCO2Pass
EmCO2Power
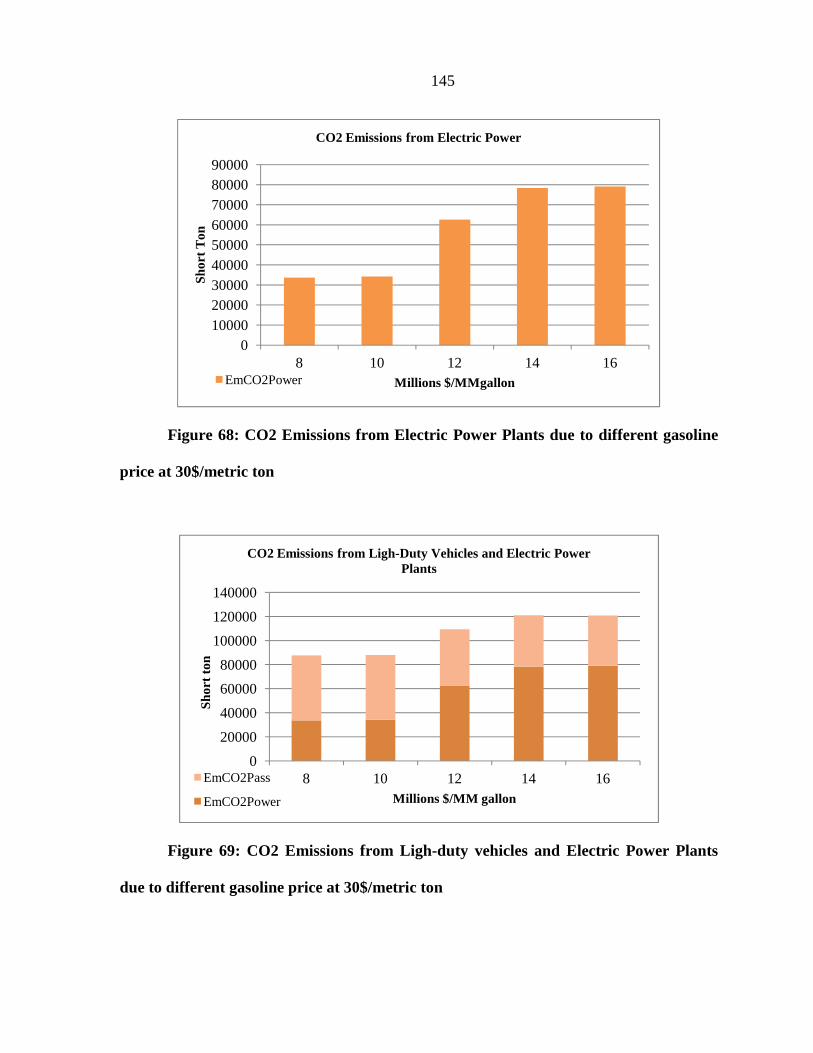
145
Figure 68: CO2 Emissions from Electric Power Plants due to different gasoline
price at 30$/metric ton
Figure 69: CO2 Emissions from Ligh-duty vehicles and Electric Power Plants
due to different gasoline price at 30$/metric ton
0100002000030000400005000060000700008000090000
8 10 12 14 16
Sho
rt T
on
Millions $/MMgallon
CO2 Emissions from Electric Power
EmCO2Power
0
20000
40000
60000
80000
100000
120000
140000
8 10 12 14 16
Sho
rt to
n
Millions $/MM gallon
CO2 Emissions from Ligh-Duty Vehicles and Electric Power Plants
EmCO2Pass
EmCO2Power
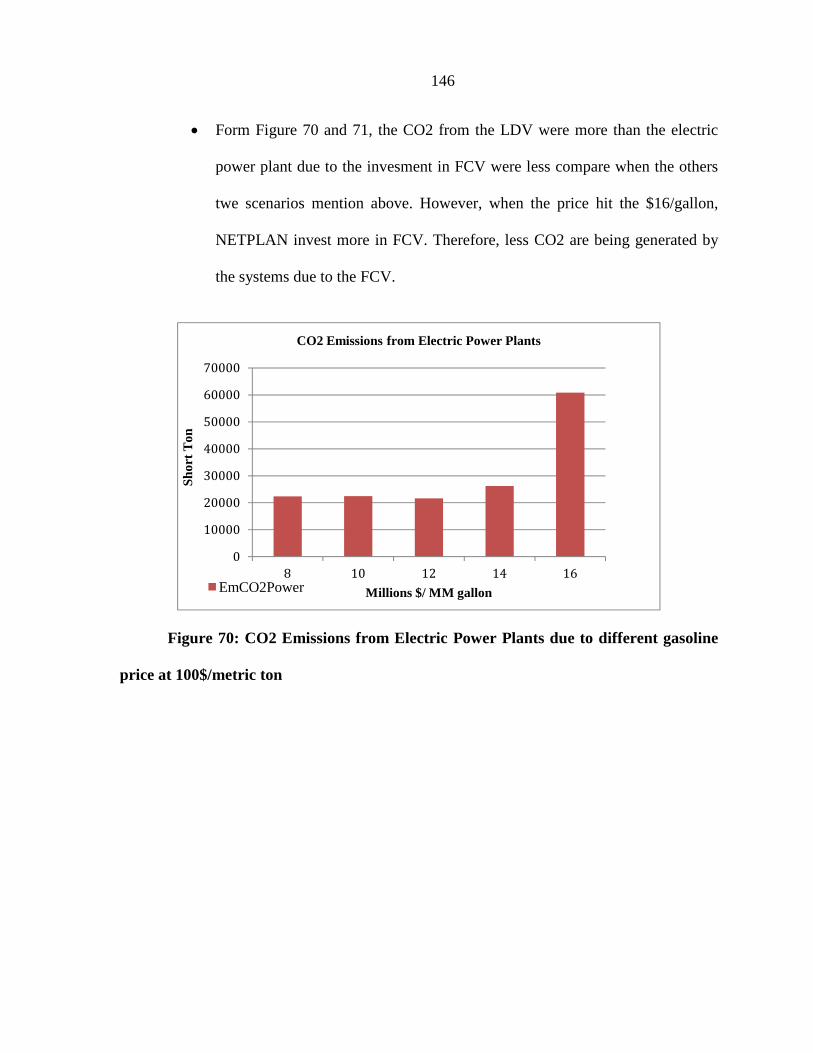
146
• Form Figure 70 and 71, the CO2 from the LDV were more than the electric
power plant due to the invesment in FCV were less compare when the others
twe scenarios mention above. However, when the price hit the $16/gallon,
NETPLAN invest more in FCV. Therefore, less CO2 are being generated by
the systems due to the FCV.
Figure 70: CO2 Emissions from Electric Power Plants due to different gasoline
price at 100$/metric ton
0
10000
20000
30000
40000
50000
60000
70000
8 10 12 14 16
Sho
rt T
on
Millions $/ MM gallon
CO2 Emissions from Electric Power Plants
EmCO2Power
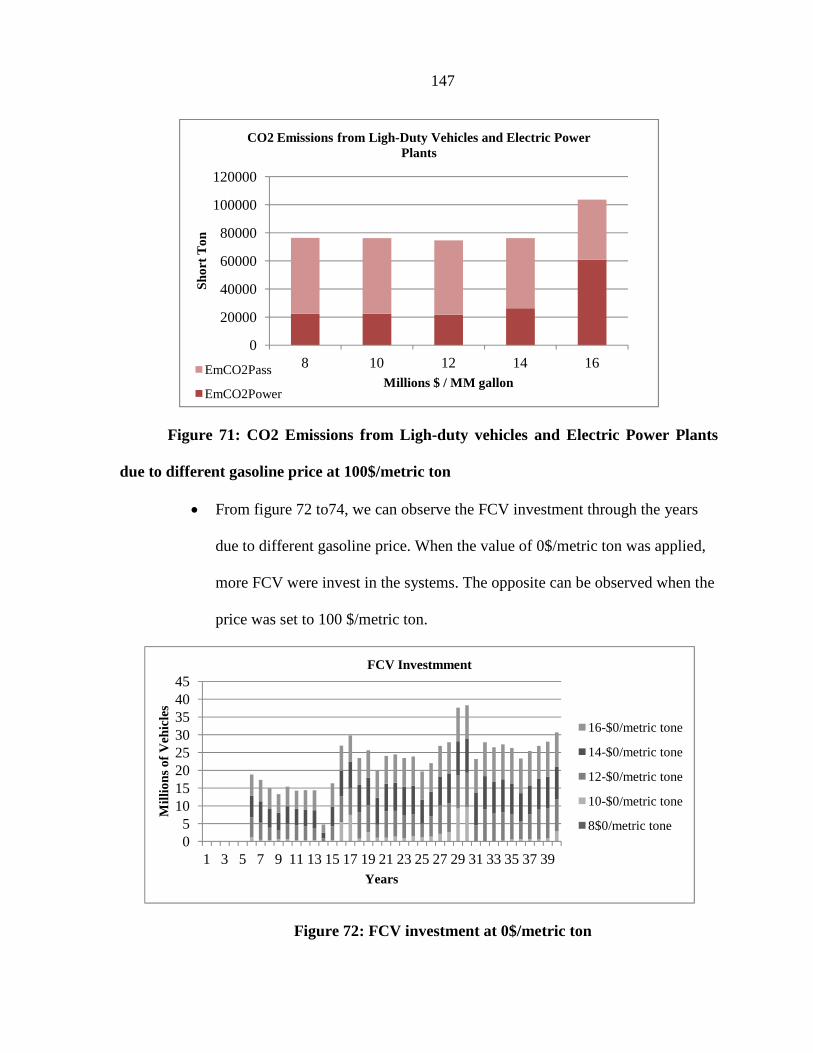
147
Figure 71: CO2 Emissions from Ligh-duty vehicles and Electric Power Plants
due to different gasoline price at 100$/metric ton
• From figure 72 to74, we can observe the FCV investment through the years
due to different gasoline price. When the value of 0$/metric ton was applied,
more FCV were invest in the systems. The opposite can be observed when the
price was set to 100 $/metric ton.
Figure 72: FCV investment at 0$/metric ton
0
20000
40000
60000
80000
100000
120000
8 10 12 14 16
Sho
rt T
on
Millions $ / MM gallon
CO2 Emissions from Ligh-Duty Vehicles and Electric Power Plants
EmCO2Pass
EmCO2Power
05
1015202530354045
1 3 5 7 9 11 13 15 17 19 21 23 25 27 29 31 33 35 37 39
Mill
ions
of V
ehic
les
Years
FCV Investmment
16-$0/metric tone
14-$0/metric tone
12-$0/metric tone
10-$0/metric tone
8$0/metric tone
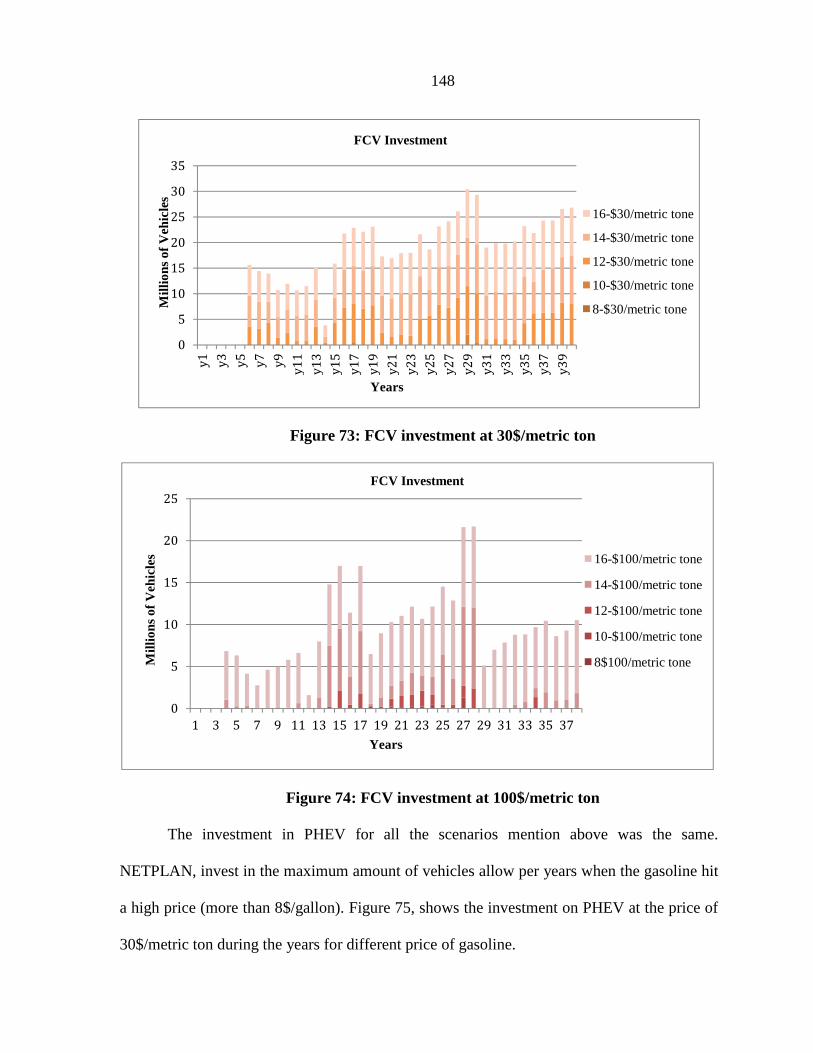
148
Figure 73: FCV investment at 30$/metric ton
Figure 74: FCV investment at 100$/metric ton
The investment in PHEV for all the scenarios mention above was the same.
NETPLAN, invest in the maximum amount of vehicles allow per years when the gasoline hit
a high price (more than 8$/gallon). Figure 75, shows the investment on PHEV at the price of
30$/metric ton during the years for different price of gasoline.
0
5
10
15
20
25
30
35
y1
y3
y5
y7
y9
y1
1
y1
3
y1
5
y1
7
y1
9
y2
1
y2
3
y2
5
y2
7
y2
9
y3
1
y3
3
y3
5
y3
7
y3
9
Mill
ions
of V
ehic
les
Years
FCV Investment
16-$30/metric tone
14-$30/metric tone
12-$30/metric tone
10-$30/metric tone
8-$30/metric tone
0
5
10
15
20
25
1 3 5 7 9 11 13 15 17 19 21 23 25 27 29 31 33 35 37
Mill
ions
of V
ehic
les
Years
FCV Investment
16-$100/metric tone
14-$100/metric tone
12-$100/metric tone
10-$100/metric tone
8$100/metric tone
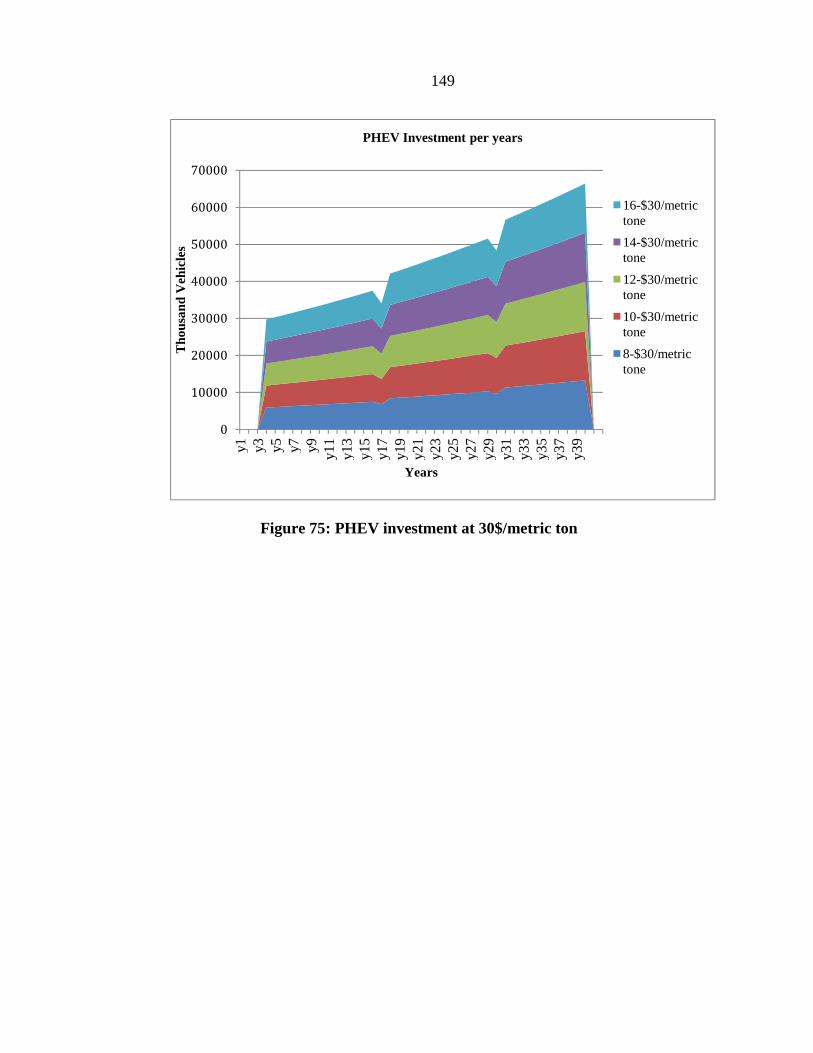
149
Figure 75: PHEV investment at 30$/metric ton
0
10000
20000
30000
40000
50000
60000
70000
y1 y3 y5 y7 y9 y11
y13
y15
y17
y19
y21
y23
y25
y27
y29
y31
y33
y35
y37
y39
Tho
usan
d V
ehic
les
Years
PHEV Investment per years
16-$30/metric tone
14-$30/metric tone
12-$30/metric tone
10-$30/metric tone
8-$30/metric tone
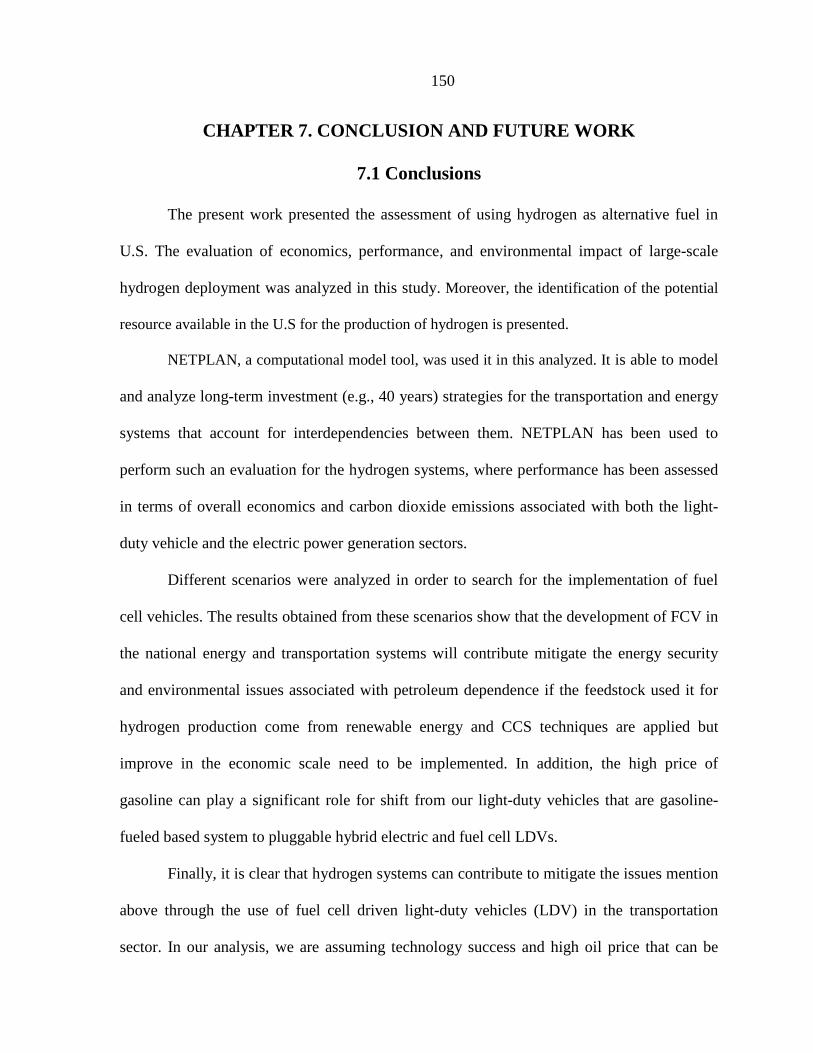
150
CHAPTER 7. CONCLUSION AND FUTURE WORK
7.1 Conclusions
The present work presented the assessment of using hydrogen as alternative fuel in
U.S. The evaluation of economics, performance, and environmental impact of large-scale
hydrogen deployment was analyzed in this study. Moreover, the identification of the potential
resource available in the U.S for the production of hydrogen is presented.
NETPLAN, a computational model tool, was used it in this analyzed. It is able to model
and analyze long-term investment (e.g., 40 years) strategies for the transportation and energy
systems that account for interdependencies between them. NETPLAN has been used to
perform such an evaluation for the hydrogen systems, where performance has been assessed
in terms of overall economics and carbon dioxide emissions associated with both the light-
duty vehicle and the electric power generation sectors.
Different scenarios were analyzed in order to search for the implementation of fuel
cell vehicles. The results obtained from these scenarios show that the development of FCV in
the national energy and transportation systems will contribute mitigate the energy security
and environmental issues associated with petroleum dependence if the feedstock used it for
hydrogen production come from renewable energy and CCS techniques are applied but
improve in the economic scale need to be implemented. In addition, the high price of
gasoline can play a significant role for shift from our light-duty vehicles that are gasoline-
fueled based system to pluggable hybrid electric and fuel cell LDVs.
Finally, it is clear that hydrogen systems can contribute to mitigate the issues mention
above through the use of fuel cell driven light-duty vehicles (LDV) in the transportation
sector. In our analysis, we are assuming technology success and high oil price that can be
151
apply in the future. However, the need for strong policy for the implementation of hydrogen
as alternative clean fuel is a reality.
7.2 Future Work
Future research, we propose the following directions:
• Analyze the hydrogen as “energy commodity” (multicommodity): Hydrogen can be
transport by truck. The early transition of hydrogen, as alternative fuel, will be by
using this type of transportation systems. It is clear that the oil consumption for
transport hydrogen is an attribute that will play a role that need to be account for the
interdependence between transportation and the energy systems
• Analyze the hydrogen for electricity production: This secondary carrier would
interact with and influence the electricity grid in several ways, for example, the
competition between the feedstock.
• Analyze the hydrogen production from renewable energies resource: The production
of hydrogen from renewable energies resource requires storage systems due to this
types of energies varies during the day but, hydrogen can be store an used it later
when the power production is low or peak demand. Contrary to electricity, hydrogen
can be stored and used later to generate electricity.
• Analyze the hydrogen from biomass: Biomass is an abundant, clean and renewable
resource that will play an important role in initiating use of hydrogen. One of the
principal attributes of biomass is that during its growth, removes approximately the
same amount of CO2 as it releases when it is used for energy production. However,
no commercial technology of biomass for hydrogen production is available at the
present time.
152
BIBLIOGRAPHY
[1] U.S. Department of Energy. (2011). Annual Energy Review 2010. Annual Review,
U.S. Department of Energy, U.S. Energy Information Administration, Washington.
[2] U.S. Energy Information Administration. (2011, February). Emissions of Greenhouse
Gases Report. Retrieved from U.S. Energy Information Administration:
http://205.254.135.24/oiaf/1605/ggrpt/carbon.html
[3] United State Department of Energy; United State Department of Transportation.
(2006). Hydrogen Posture Plan: An Integrated Research, Development and
Demostration Plan. Strategic Plan, Offices of Energy Efficiency and Renewable
Energy, Fossil Energy, Science and Technology, Nuclear Energy.
[4] United State Department of Energy. (2004). Hydrogen Posture Plan: An Integrated
Research, Development and Demostration Plan. Strategic Plan.
[5] Ogden, J. (1999). Prospects for building a hydrogen energy infrastructure. Annual
Review of Energy and the Environment , 24 (1), 227-279.
[6] Hugo, A., Rutter, P., Pistikopoulos, S., Amorelli, A., & Zoia, G. (2005). Hydrogen
infrastructure strategic planning using multi-objective optimization. International
Journal of Hydrogen Energy , 30 (15), 1523-1534.
[7] U.S. Department of Energy. (2002). A National Vision of America's Transition to a
Hydrogen Economy: To 2030 and Beyond. Summary.
153
[8] U.S. Department of Energy. (2002). National Hydrogen Energy Roadmap:
Production, Delivery, Storage, Conversion, Applications, Public Education and
Outreach. Roadmap.
[9] Yildiz, B., Petri, M. C., Conzelmann, G., & Forsberg, C. (2005). Configuration and
Technology Implications of Potential Nuclear Hydrogen System Applications.
Technical Report, Argonne National Laboratory, Nuclear Engineering Division.
[10] McCalley, J., Aliprantis, D., Gkritza, K., Somani, A., & Wang, L. 21st Century
National Energy and Transportation Infrastructure: Balancing Sustainability, Cost
and Resiliency (NETSCORE-21). Project Summary, Iowa State University, Ames,
IA.
[11] Ibanez, E. (2011). A multiobjective optimization approach to the operation and
investment of the national energy and transportation systems. PhD Thesis, Iowa
State University, Electrical Department, Ames, IA.
[12] Pant, K. K., Gupta, R. B., Muradov, N. Z., Lin, S.-Y., Hino, R., Yan, X. L., et al.
(2009). Production and Use of Hydrogen. In R. B. Gupta (Ed.), Hydrogen Fuel:
Production, Transport and Storage (pp. 1-282). CRC Press.
[13] Lipman, T. (2011). An Overview of Hydrogen Production and Storage System with
Renewable Hydrogen Case Studies. Technical Report, Clean Energy States Alliance.
[14] Office of Air and Radiation. (2008). Technical Support Document for Hydrogen
Production: Proposed Rule for Mandatory Reporting of Greenhouse Gases.
Technical Report, U.S. Environmental Protection Agency, Office of Air and
Radiation.
154
[15] Energy Information Administration. (2008). The Impact of Increased Use of
Hydrogen on Petroleum Consumption and Carbon Dioxide Emissions. Retrieved
from U.S. Energy Information Administration:
http://www.eia.gov/oiaf/servicerpt/hydro/pdf/oiafcneaf(08)04.pdf
[16] Stolten, D. (2010). Hydrogen and Fuel Cells: Fundamentals, Technologies and
Applications. Wiley-VCH.
[17] Milbrandt, A., & Mann, M. (2009). Hydrogen Resource Assessment: Hydrogen
Potential from Coal, Natural Gas, Nuclear, and Hydro Power. Technical Report,
National Renewable Energy laboratory (NREL).
[18] Milbrandt, A., & Mann, M. (2007). Potential for Hydrogen Production from Key
Renewable Resources in the United States. Technical Report, National Renewable
Energy Laboratory (NREL).
[19] National Research Council; National Academy of Engineering. The Hydrogen
Economy: Opportunities, Costs, Barriers and R&D Needs. Th National Academies
Press.
[20] U.S. Department of Energy. (2009). Hydrogen Production. Retrieved from U.S.
Department of Energy:
http://www1.eere.energy.gov/hydrogenandfuelcells/production/natural_gas.html
[21] New York State Energy Research and Development Authority. (n.d.). nyserda.
Retrieved from
http://www.getenergysmart.org/Files/HydrogenEducation/8HydrogenProductionCoa
l.pdf
155
[22] Nuclear power in the United States. (n.d.). Retrieved from Wikipedia:
http://en.wikipedia.org/wiki/Nuclear_power_in_the_United_States
[23] O'Brien, J., Stoots, C., Herring, J., McKellar, M., Harvego, E., Sohal, M., et al.
(2010). High Temperature Electrolysis for Hydrogen Production from Nuclear
Energy – Technology Summary. Idaho National Laboratory.
[24] Bartels, J. R., Pate, M. B., & Olson, N. K. (2010). An economic survey of hydrogen
production from conventional and alternative energy sources. International Journal
of Hydrogen Energy , 35 (16), 8371-8384.
[25] Wind power in the United States. (n.d.). Retrieved from Wikipedia:
http://en.wikipedia.org/wiki/Wind_power_in_the_United_States
[26] Staff. (2011, August 12). US Solar Energy Potential. Retrieved from CoolerPlanet:
http://blog.coolerplanet.com/2011/08/12/us-solar-energy-potential/
[27] Renewable Energy Sources in the United States. (n.d.). Retrieved from
NationalAtlas.gov: http://nationalatlas.gov/articles/people/a_energy.html#three
[28] Meier, D. A., & Sattler, D. C. (2009, August). Solar Power And Chemical Energy
Systems. Retrieved from SolarPACES:
http://www.solarpaces.org/Library/docs/Solar_Fuels.pdf
[29] Solar Energy and Power. (n.d.). Retrieved from The Shawnee Tribe:
http://www.shawnee-
tribe.com/Solar%20energy%20and%20power%20shawnee%20project%20ver%202.
156
[30] Joshi, A., Dincer, I., & Reddy, B. (2010). Exergetic assessment of solar hydrogen
production methods. International Journal of Hydrogen Energy , 35 (10), 4901-
4908.
[31] Aringhoff, R., Brakmann, G., Geyer, D. M., & Teske, S. (2005). Exploiting the Heat
from the Sun to Combat Climate Change. Technical Report, Greenpeace
International; ESTIA; IEA SolarPACES Implementing Agreement.
[32] Joshi, A. S., Dincer, I., & Reddy, B. V. (2011). Solar hydrogen production: A
comparative performance assessment. International Journal of Hydrogen Energy ,
36 (17), 11246-11257.
[33] Claus process. (n.d.). Retrieved from Wikipedia:
http://en.wikipedia.org/wiki/Claus_process
[34] Hydrogen Production. (n.d.). Retrieved from U.S. Department of Energy:
http://www1.eere.energy.gov/hydrogenandfuelcells/production/photo_processes.htm
l
[35] The FreedomCAR and Fuel Partnership. (2009, January). Energy Efficiency &
Renewable Energy. Retrieved from U.S. Department of Energy:
https://www1.eere.energy.gov/hydrogenandfuelcells/pdfs/h2_tech_roadmap.pdf
[36] Book Solar Energy Generation falta agregar
[37] How Biomass Energy Works. (n.d.). Retrieved from Union of Concerned Scientists:
Citizens and Scientists for Environmental Solutions:
http://www.ucsusa.org/clean_energy/technology_and_impacts/energy_technologies/
how-biomass-energy-works.html
157
[38] Perlack, R., & Stokes, B. (2011). U.S. Billion-Ton Update: Biomass Supply for a
Bioenergy and Bioproducts Industry. U.S. Department of Energy, Oak Ridge
National Laboratory.
[39] Hydrogen Production. (n.d.). Retrieved from U.S. Department of Energy:
http://www1.eere.energy.gov/hydrogenandfuelcells/production/biomass_gasification
.html
[40] Flammability. (n.d.). Retrieved from Wikipedia:
http://en.wikipedia.org/wiki/Flammability
[41] Minimum ignition energy. (n.d.). Retrieved from Wikipedia:
http://en.wikipedia.org/wiki/Minimum_Ignition_Energy
[42] Farid, A., Gallarda, J., Mineur, B., Bradley, S., Ott, W., & Ibler, M. (2009). Best
Available Techniques for Hydrogen Production by Steam Methane Reforming.
Retrieved from European Industrial Gases Association:
http://www.eiga.org/index.php?id=181&tx_abdownloads_pi1%5Baction%5D=getvi
ewclickeddownload&tx_abdownloads_pi1%5Buid%5D=1556&no_cache=1
[43] pendiente figura Ch3 pag 7
[44] Ball, M., & Wietschel, M. (2009). The Hydrogen Economy: Opportunities and
Challenges. (M. Ball, & M. Wietschel, Eds.) Cambridge University Press.
[45] Kroposki, B., Levene, J., Harrison, K., Sen, P., & Novachek, F. (2006). Electrolysis:
Information and Opportunities for Electric Power Utilities. Technical, National
Renewable Energy Laboratory (NREL).
158
[46] Yildiz, B., & Kazimi, M. (2006). Efficiency of Hydrogen Production Systems Using
Alternative Nuclear Energy Technologies. International Journal of Hydrogen
Energy , 31 (1), 77-92.
[47] OECD Nuclear Energy Agency. (2010). Nuclear Production of Hydrogen: Fourth
Information Exchange Meeting. Organization for Economic.
[48] Light Water Reactor. (n.d.). Retrieved from Wikipedia:
http://en.wikipedia.org/wiki/Light_water_reactor
[49] Idaho National Laboratory. (n.d.). Next Generation Nuclear Plant. Retrieved from
http://www.nextgenerationnuclearplant.com/d/hightemperatureelectrolysis.pdf
[50] Myers, D., Ariff, G., James, B., & Kuhn, R. (2003). Hydrogen from Renewable
Energy Sources: Pathway to 10 Quads for Transportation Uses in 2030 to 2050. U.S.
Deparment of Energy Consultants Report, Directed Technologies Inc.
[51] Balat, H., & Kirtay, E. (2010). Hydrogen from Biomass - Present scenario and future
prospects. International Journal of Hydrogen Energy , 35 (14), 7416-7426.
[52] Ni, M., Leung, D., Leung, M., & Sumathy, K. (2006). An overview of hydrogen
production from biomass. Fuel Processing Technology , 87 (5), 461-472.
[53] IEA Bioenergy - Task 32. (n.d.). Biomass Combustion and Co-firing: An Overview.
(N. Carling, Ed.) Retrieved from http://www.ieabcc.nl/publications/t32.pdf
[54] Saxena, R., Seal, D., Kumar, S., & Goyal, H. (2008). Thermo-chemical Routes for
Hydrogen Rich Gas from Biomass: A review. (Elsevier, Ed.) Renewable and
Sustainable Energy Reviews , 12 (7), 1909-1927.
[55] cs_centra_biomass_gasification. (n.d.). Retrieved from Google:
http://tinyurl.com/3w9pjg7
159
[56] Lee, H., Vermaas, W., & Rittmann, B. (2010). Biological Hydrogen Production:
prospects and challenges. Trends in Biotechnology , 28 (5), 262-271.
[57] Yang, C., & Ogden, J. (2007). Determining the lowest-cost hydrogen delivery mode.
International Journal of Hydrogen Energy , 32 (2), 268-286.
[58] Hydrogen Delivery Technology Roadmap. (2007, February). Retrieved from U.S.
Department of Energy:
http://www1.eere.energy.gov/hydrogenandfuelcells/delivery/pdfs/delivery_roadmap
0207.pdf
[59] Yang, C., & Ogden, J. (2007). Hydrogen Delivery and Refuling Infrastructure.
Project, California Energy Comission, Public Interest Energy Research (PIER)
Program.
[60] Nexant, Inc.; Air Liquide; Argonne National Laboratory; Chevron Technology
Venture; Gas Technology Institute; National Renewable Energy Laboratory; Pacific
Northwest National Laboratory; Tiax LLC. (2008). H2A Hydrogen Delivery
Infrastructure Analysis Models and Conventional Pathway Options Analysis Results.
Interim Report.
[61] Amos, W. A. (1998). Costs of Storing and Transporting Hydrogen. Technical
Report, National Renewable Energy Laboratory.
[62] Hydrogen Delivery - Current Technology. (2008, 12 12). Retrieved from U.S.
Department of Energy:
http://www1.eere.energy.gov/hydrogenandfuelcells/delivery/current_technology.htm
l?m=1&
160
[63] Sozinova, O. (2010, June 9). H2A Delivery Analysis and H2A Delivery Components
Model. National Renewable Energy Laboratory.
[64] Nicholas, M., Weinert, J., & Miller, M. (n.d.). Hydrogen Station Economic Analysis
and Siting in Southern California. 15.
[65] Experts: Hydrogen economy possible in time. (2005, 2 28). Retrieved from
msnbc.msn.com: http://www.msnbc.msn.com/id/4177740/ns/us_news-
environment/t/experts-hydrogen-economy-possible-time/#.TjnHiIIuKY8
[66] Melendez, M., & Milbrandt, A. (2005). Analysis of the Hydrogen Infrastructure
Needed to Enable Commercial Introduction of Hydrogen-Fueled Vehicles. National
Hydrogen Association: Annual Hydrogen Conference 2005 (p. 20). Washington,
DC: National Renewable Energy Laboratory.
[67] Fuel Cell Buses. (n.d.). Retrieved from Northeast Advanced Vehicle Consortium:
http://www.navc.org/storage.html
[68] Ehsani, M., Gao, Y., & Emadi, A. (2010). Modern Electric, Hybrid Electric and
Fuel Cell Vehicles: Fundaments, Theory and Design. CRC Press.
[69] Yang, C. (2008). Hydrogen and Electricity: Parallels, Interactions and Convergence.
International Journal of Hydrogen Energy , 33 (8), 1977-1994.
[70] Fuel Cells. (n.d.). Retrieved from ClimateLab:
http://climatelab.org/@api/deki/files/233/=fuelcell.jpg
[71] Fuel Cells Vehicles. (n.d.). Retrieved from U.S. Department of Energy:
http://www.fueleconomy.gov/feg/fuelcell.shtml
[72] National Research Council (U.S.); Committee on Assessment of Resource Need for
Fuel Cells and Hydrogen Technologies. (2008). Transitions to Alternative
161
Transportation Technologies: A Focus on Hydrogen. Washington D.C., U.S.: The
National Academy Press.
[73] Nguyen, T., & Ward, J. (2010). Well-to-Wheels Greenhouse Gas Emissions And
Petroleum Use for Mid-Size Light-Duty Vehicles. Program Record, U.S. Department
of Energy.
[74] Fuel Cell Technologies Program Multi-Year Research, Development and
Demonstration Plan. (n.d.). Retrieved from U.S. Department of Energy:
http://www1.eere.energy.gov/hydrogenandfuelcells/mypp/
[75] The FreedomCAR And Fuel Partnership; Office of Energy Efficiency and
Renewable Energy. (2009). Targets for Onboard Hydrogen Storage Systems for
Light-Duty Vehicles. Technical Report, U.S. Department of Energy.
[76] California Energy Commission. (2010). 2010-2011 Investment Plan for the
Alternative and Renewable Fuel and ehicle Technology Program. Commission
Report, California Energy Commission.
[77] McCalley, J., Ibanez, E., Gu, Y., Gkritza, K., Aliprantis, D., Wang, L., et al. (2010).
National Long-term Investment Planning for Energy and Transportation Systems.
Power and Energy Society General Meeting , 1-7.
[78] D. C. Aliprantis, K. Gkritza, D. Wu, J. Brown, J. Gi_ord, E. Kastrouni, L. Gonzalez-
Marciaga, and J. Slegers, “Sustainability assessment of energy and transportation
infrastructures for investment planning," in NSF EFRI RESIN workshop, Univ. of
Arizona, Tucson, Jan. 13-14, 2011.
[79] Yang, C. (2008). Hydrogen and Electricity: Parallels, Interactions and Convergence.
International Journal of Hydrogen Energy , 33 (8), 1977-1994.
162
[80] Yang, C., & Ogden, J. (2007). Co-Production of H2 and Electricity. Davis, CA: UC
Davis , 22.
[81] Overbye, T., Starr, C., Grant, P., & Schneider, T. (2002). National Energy Supergrid
Workshop Report. Workshop Report, University of Illinois at Urbana-Champaign,
Palo Alto.
[82] E. Ibáñez, J. McCalley, D. Aliprantis, R. Brown, K. Gkritza, A. Somani, and L. Wang
―National Energy and Transportation Systems: Interdependencies within a Long
Term Planning Model,‖ Proc. of IEEE Energy 2030 Conf., Atlanta, Georgia, Nov.
2008.
[83] E. Ibáñez, K. Gkritza, J. McCalley, D. Aliprantis, R. Brown, A. Somani, and L. Wang
―Interdependencies between Energy and Transportation Systems for National Long
Term Planning," in ―Sustainable Infrastructure Systems: Simulation, Imaging, and
Intelligent Engineering," K. Gopalakrishnan, S. Peeta, editors, Springer-Verlag,
Berlin, 2010.
[84] E. Ibáñez, and J. McCalley, ―Multiobjective evolutionary algorithm for long-term
planning of the national energy and transportation systems‖, Conf. on Energy,
Sustainability and Climate Change, Gainesville, Florida, Feb. 2010.
[85] Swisher, J., Jannuzi, G., & Redlinger, R. (1997). Tool and Methods for Integrated
Resource Planning: Improving Energy Efficiency and Protecting the Environment.
United Nations Environment Programme. Denmark: Riso National Laboratory.
[86] Chris. (2009, December 16). PLUG-IN CAR: START WAVING GOODBYE TO THE
GAS STATION. Retrieved from mapawatt: http://mapawatt.com/2009/12/16/plug-in-
car/
163
[87] Ruth, M., Laffen, M., & Timbario, T. (2009). Hydrogen Pathways: Cost, Well-to-
Wheels Energy Use, and Emissions for the Current Technology Status of Seven
Hydrogen Production, Delivery, and Distribution Scenarios. Technical Report,
National Renewable Energy Laboratory.
[88] Nazmiye Balta-Ozkan, Ramachandran Kannan, Neil Strachan (2007). UKSHEC
Social Science Working Paper No.32. Policy Studies Institute.
[89] Robert Rose (2009). Questions and Answers about Hydrogen and Fuel Cells.
Breakthrough Technologies Institute.
[90] International Energy Agency (2005). Prospects for Hydrogen and Fuel Cells. IEA,
Paris, France.
[91] Ji-Yong Lee, Moosang Yoo, Kyounghoon Cha, Tae Won Lim, Tak Hur (2009). Life
cycle cost analysis to examine the economical feasibility of hydrogen as an
alternative fuel. International Journal of Hydrogen Energy 34 (2009) 4243 – 4255.
[92] David L. Greene, Paul N. Leiby, David Bowman (2007). Integrated Analysis of
Market Transformation Scenarios with HyTrans. Oak Ridge National Laboratory,
EconoTech.
[93] Frances Wood, Niko Kydes, Thomas Jenkin, Marc Melaina (2011). NEMS-H2:
Hydrogen’s Role in Climate Mitigation and Oil Dependence Reduction. National
Renewable Energy Laboratory.