Assessment of third party risk around Zürich airport
62
Eidgenössisches Departement für Umwelt, Verkehr, Energie und Kommunikation UVEK Bundesamt für Zivilluftfahrt BAZL Anhang A.4 Flughafen Zürich Sachplan Infrastruktur der Luftfahrt (SIL) Assessment of third party risk around Zürich airport vom 17. Juni 2016 Die Karten im Bericht sind reproduziert mit Bewilligung der swisstopo (© 2014 swisstopo BA140421)
Transcript of Assessment of third party risk around Zürich airport

Eidgenössisches Departement für Umwelt, Verkehr, Energie und Kommunikation UVEK Bundesamt für Zivilluftfahrt BAZL
Anhang A.4 Flughafen Zürich Sachplan Infrastruktur der Luftfahrt (SIL)
Assessment of third party risk around Zürich airport
vom 17. Juni 2016
Die Karten im Bericht sind reproduziert mit Bewilligung der swisstopo (© 2014 swisstopo BA140421)

COMPANY CONFIDENTIAL
Assessment of third party risk around Zürich Airport In the context of SIL process Zürich Airport
C u s t o m e r
FOCA Switzerland
NLR-CR-2014-215 - July 2014

N a t i o n a l A e r o s p a c e L a b o r a t o r y N L R
A n t h o n y F o k k e r w e g 2
1 0 5 9 C M A m s t e r d a m
T h e N e t h e r l a n d s
T e l + 3 1 ( 0 ) 8 8 5 1 1 3 1 1 3
w w w . n l r . n l
COMPANY CONFIDENTIAL
COMPANY CONFIDENTIAL
Assessment of third party risk around Zürich Airport In the context of SIL process Zürich Airport
Y.S. Cheung and L. de Haij
C u s t o m e r
FOCA Switzerland July 2014

Assessment of third party risk around Zürich Airport
COMPANY CONFIDENTIAL
2 | NLR-CR-2014-215 COMPANY CONFIDENTIAL
No part of this report may be reproduced and/or disclosed, in any form or by any means without the prior
written permission of the owner.
Customer FOCA Switzerland
Contract number 790000305 (NLR-project 2494117)
Owner FOCA Switzerland
Division NLR Air Transport
Distribution Limited
Classification of title Company Confidential
Date July 2014
Approved by:
Author
Y.S. Cheung
L. de Haij
Reviewer
R. de Jong
Managing department
R. Hermans
Date Date Date

COMPANY CONFIDENTIAL
COMPANY CONFIDENTIAL NLR-CR-2014-215 | 3
6BSummary
The Federal Office of Civil Aviation (FOCA) of Switzerland and Flughafen Zürich AG are jointly
working on the realisation of the “Sachplan Infrastruktur der Luftfahrt” (SIL), the Sectoral
Aviation Infrastructure Plan, for Zürich airport. In the SIL Zürich a number of operational variants
with different use of runways and flight routes are considered. Nine operational variants are
studied in detail in the process of SIL Zürich. These variants concern changes in the airport
operation due to development foreseen in the future to cope with the expected growth of the air
traffic at Zürich airport.
National Aerospace Laboratory NLR is contracted by FOCA to conduct a study on third party risk,
i.e. the risk for people in the vicinity of Zürich airport, for the SIL variants 1 through 4, 5a, 5b, 5c,
6 and 7. FOCA requires that the information on third party risk should be made available in
support of the decision-making. The information helps evaluate how each SIL-variant performs in
terms of risk, and helps assess whether the risk around Zürich airport is of the same order of
magnitude when compared to other Western,international airports.
The risk assessment comprises two parts. The first part encompasses the calculations of the
individual risk and the societal risk of all nine SIL Zürich variants mentioned before, and the
visualisation of the results: individual risk contours and societal risk curves (also known as FN-
curves). The second part involves the mutual comparison of the risk of the variants and the
overall comparison of Zürich airport’s risk with other studies on third party risk around an airport.
The results of the individual risk show that the 10-6
/year contours cover part of the built-up and
residential areas in the surroundings of the airport. The risk contours do not form easy-to-grasp
risk information for comparing variants. This is because on one hand a few variants have a quite
comparable traffic situation as that of variant 1 which is chosen as basis for comparison, and on
the other hand the levels of risk contour that are chosen in this study are limited to 10-5
/year and
10-6
/year only. Therefore the differences in the risk contours may not be significant.
The results of the societal risk show that the societal risk curves or FN-curves of the SIL Zürich
variants lie in a narrow band and they do not deviate much from each other. However, by
investigating the societal risk in detail, it is found that variant 2 has the highest risk for the group
sizes considered. Variant 7 is the only variant that has smaller risk when compared with variant 1.
All other variants have either identical risk to or higher risk than variant 1. Moreover, when
Assessment of third party risk around Zürich Airport
COMPANY CONFIDENTIAL
4 | NLR-CR-2014-215 COMPANY CONFIDENTIAL
compared with other western international airports, the societal risk curve of Zürich airport
shows a comparable pattern and is not exceptional.
COMPANY CONFIDENTIAL
COMPANY CONFIDENTIAL NLR-CR-2014-215 | 5
7BContent
Abbreviations 7
Definitions 8
1 Introduction 9
2 Methodology of risk assessment 12
3 Results 15
3.1 Individual risk 15
3.1.1 Variant 1 16
3.1.2 Variant 2 17
3.1.3 Variant 3 and Variant 4 18
3.1.4 Variants 5a, 5b and 5c 19
3.1.5 Variant 6 20
3.1.6 Variant 7 20
3.2 Societal risk 22
3.3 Comparison analysis of societal risk 25
3.3.1 Bar-plot comparison of societal risk 25
3.3.2 Spider-plot comparison of societal risk 26
3.3.3 Comparison of Zürich and other airports 31
4 Discussion of results 33
5 Conclusions 34
6 References 35
Appendix A Risk metrics 36
Appendix B Overview of input data 38
Appendix B.1 Coordinate system, study area and grid size 38
Appendix B.2 Airport runways 38
Appendix B.3 Flight routes 39
Appendix B.4 Traffic and aircraft fleet mix data 40
Assessment of third party risk around Zürich Airport
COMPANY CONFIDENTIAL
6 | NLR-CR-2014-215 COMPANY CONFIDENTIAL
Appendix B.5 Aircraft maximum take-off weight data 40
Appendix B.6 Population data 41
Appendix C Figures of flight routes 42
Appendix D List of aircraft types and MTOW 51
Appendix E Movements per variant 55
Appendix F Identification of risk calculation 56
COMPANY CONFIDENTIAL
COMPANY CONFIDENTIAL NLR-CR-2014-215 | 7
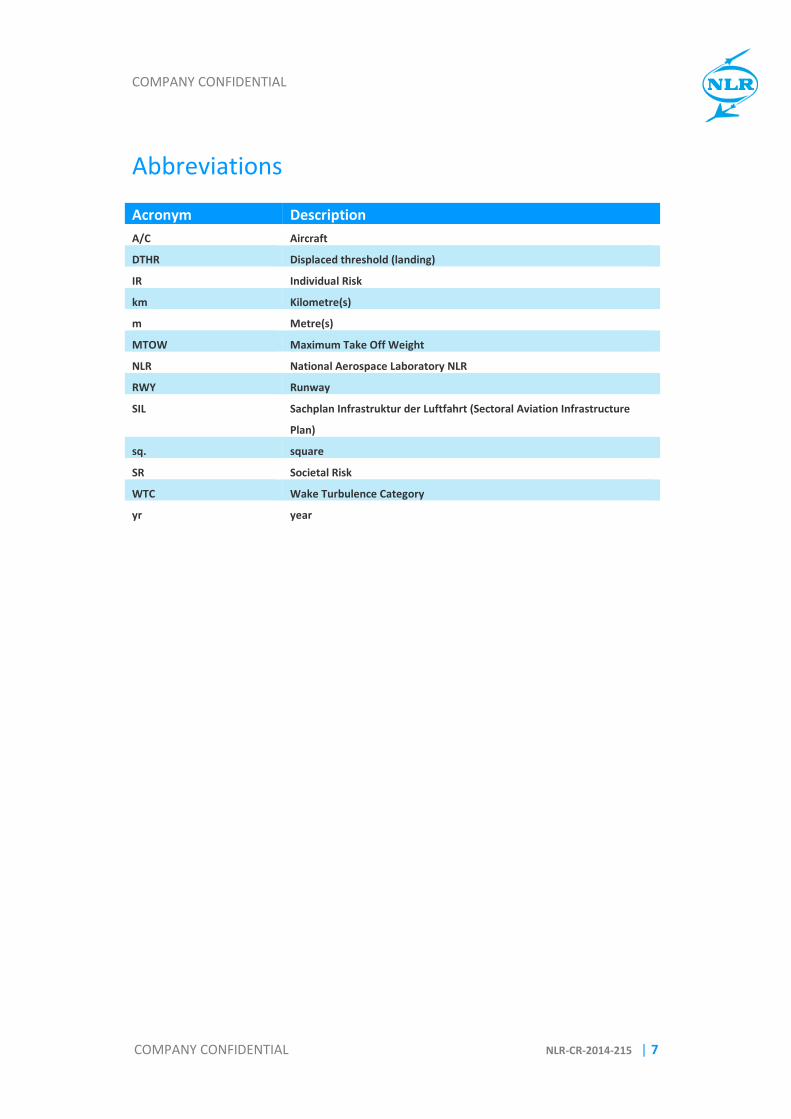
Abbreviations
Acronym Description
A/C Aircraft
DTHR Displaced threshold (landing)
IR Individual Risk
km Kilometre(s)
m Metre(s)
MTOW Maximum Take Off Weight
NLR National Aerospace Laboratory NLR
RWY Runway
SIL Sachplan Infrastruktur der Luftfahrt (Sectoral Aviation Infrastructure
Plan)
sq. square
SR Societal Risk
WTC Wake Turbulence Category
yr year

Assessment of third party risk around Zürich Airport
COMPANY CONFIDENTIAL
8 | NLR-CR-2014-215 COMPANY CONFIDENTIAL
Definitions
Definition Description
Aircraft accident (third
party)
Any unintended contact with the ground outside the runway. This
includes all types of occurrences including for instance fatal accidents,
non-fatal accidents, major losses and hull losses.
Aircraft movement A take-off or a landing (equivalent: a departure or an arrival)
Calculation grid A small square area for which risk value is calculated
ICAO code ICAO Aircraft Type Designator (Doc 8643). Aircraft type is (mostly)
denoted by a combination of four letters and numbers.
Overrun An accident in which the aircraft runs off the end of the runway.
Overshoot An accident in which the aircraft contacts the ground beyond the end of
the runway.
Straight-in A straight landing flight route or approach path to the runway.
Study area A defined part of the geographical area outside the perimeter of the
airport, which is considered to be subject to increased risk of aircraft
accidents due to the presence of the airport.
Third party Inhabitant around an airport
Undershoot An accident in which the aircraft contacts the ground before the runway
while on (final) approach.
Veer-off An accident in which the aircraft runs off either side of the runway.
COMPANY CONFIDENTIAL
COMPANY CONFIDENTIAL NLR-CR-2014-215 | 9
1 Introduction
The Federal Office of Civil Aviation (FOCA) of Switzerland and Flughafen Zürich AG are jointly
working on the realisation of the “Sachplan Infrastruktur der Luftfahrt” (SIL), the Sectoral
Aviation Infrastructure Plan, for Zürich airport. As described by the airport, the SIL sets out the
purpose, required perimeter, the main aspects of use, and development and general operating
conditions for the airport.
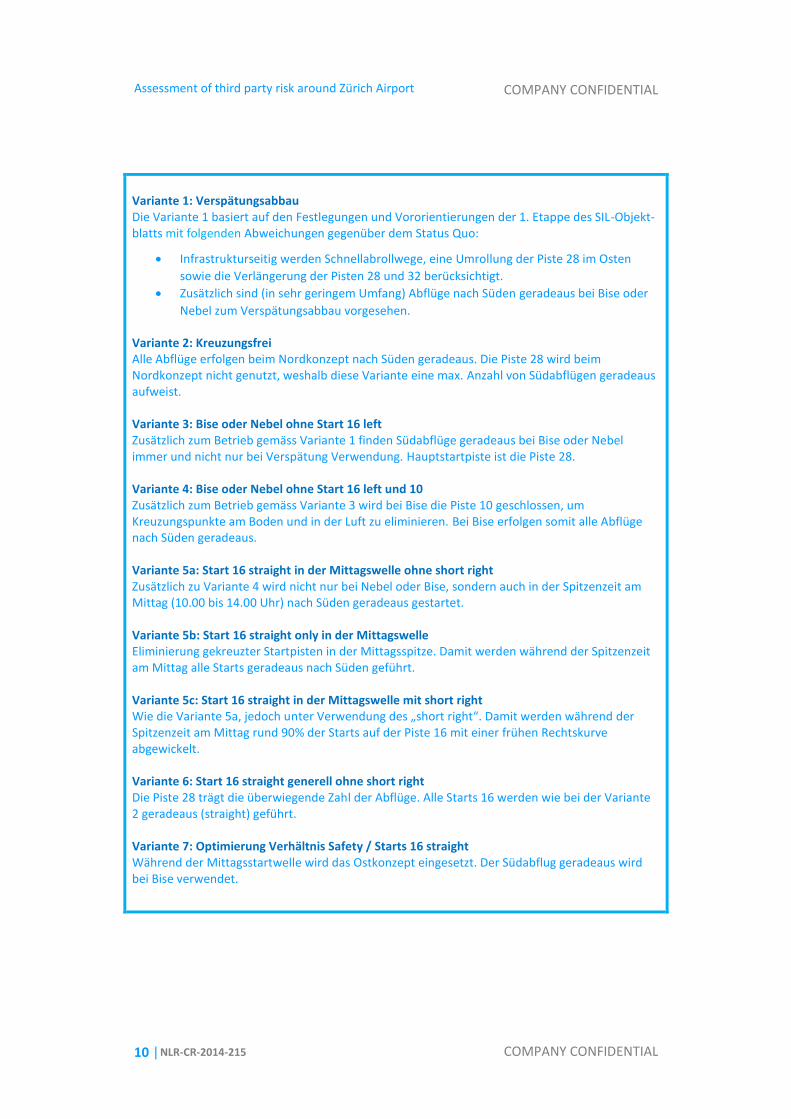
In the SIL Zürich a number of operational variants with different use of runways and flight routes
are considered. Nine operational variants are studied in detail in the process of SIL Zürich. The
original description of the SIL Zürich variants in German is given in this report on the next page.
These variants concern changes in the airport operation due to development foreseen in the
future to cope with the expected growth of the air traffic at Zürich airport. The time frame for
this development situation is around 2030.
Third party risk, i.e. the risk for people in the vicinity of an airport, is among other aspects like
capacity, economics and environmental impacts, an aspect that should be addressed in the
context of the SIL-process for Zürich airport. FOCA requires that the information on third party
risk should be made available in support of the decision-making. The information helps evaluate
how each SIL-variant performs in terms of risk, and helps assess whether the risk around Zürich
airport is of the same order of magnitude when this is compared with other western
international airports.
National Aerospace Laboratory NLR is contracted by FOCA to conduct a study on third party risk
around Zürich airport for the SIL variants mentioned. In the risk assessment, both individual risk
and societal risk are determined. The risk assessment comprises two parts. The first part
encompasses the calculations of the individual risk and the societal risk of all nine SIL Zürich
variants, and the visualisation of the results: individual risk contours and societal risk curves (also
known as FN-curves). The second part involves the mutual comparison of the risk of the variants
and the overall comparison of Zürich airport’s risk with other studies on third party risk around
an airport. The emphasis of the comparison is on the societal risk.
Assessment of third party risk around Zürich Airport
COMPANY CONFIDENTIAL
10 | NLR-CR-2014-215 COMPANY CONFIDENTIAL
Variante 1: Verspätungsabbau Die Variante 1 basiert auf den Festlegungen und Vororientierungen der 1. Etappe des SIL-Objekt-blatts mit folgenden Abweichungen gegenüber dem Status Quo:
Infrastrukturseitig werden Schnellabrollwege, eine Umrollung der Piste 28 im Osten
sowie die Verlängerung der Pisten 28 und 32 berücksichtigt.
Zusätzlich sind (in sehr geringem Umfang) Abflüge nach Süden geradeaus bei Bise oder
Nebel zum Verspätungsabbau vorgesehen. Variante 2: Kreuzungsfrei Alle Abflüge erfolgen beim Nordkonzept nach Süden geradeaus. Die Piste 28 wird beim Nordkonzept nicht genutzt, weshalb diese Variante eine max. Anzahl von Südabflügen geradeaus aufweist. Variante 3: Bise oder Nebel ohne Start 16 left Zusätzlich zum Betrieb gemäss Variante 1 finden Südabflüge geradeaus bei Bise oder Nebel immer und nicht nur bei Verspätung Verwendung. Hauptstartpiste ist die Piste 28. Variante 4: Bise oder Nebel ohne Start 16 left und 10 Zusätzlich zum Betrieb gemäss Variante 3 wird bei Bise die Piste 10 geschlossen, um Kreuzungspunkte am Boden und in der Luft zu eliminieren. Bei Bise erfolgen somit alle Abflüge nach Süden geradeaus. Variante 5a: Start 16 straight in der Mittagswelle ohne short right Zusätzlich zu Variante 4 wird nicht nur bei Nebel oder Bise, sondern auch in der Spitzenzeit am Mittag (10.00 bis 14.00 Uhr) nach Süden geradeaus gestartet. Variante 5b: Start 16 straight only in der Mittagswelle Eliminierung gekreuzter Startpisten in der Mittagsspitze. Damit werden während der Spitzenzeit am Mittag alle Starts geradeaus nach Süden geführt. Variante 5c: Start 16 straight in der Mittagswelle mit short right Wie die Variante 5a, jedoch unter Verwendung des „short right“. Damit werden während der Spitzenzeit am Mittag rund 90% der Starts auf der Piste 16 mit einer frühen Rechtskurve abgewickelt. Variante 6: Start 16 straight generell ohne short right Die Piste 28 trägt die überwiegende Zahl der Abflüge. Alle Starts 16 werden wie bei der Variante 2 geradeaus (straight) geführt. Variante 7: Optimierung Verhältnis Safety / Starts 16 straight Während der Mittagsstartwelle wird das Ostkonzept eingesetzt. Der Südabflug geradeaus wird bei Bise verwendet.
COMPANY CONFIDENTIAL
COMPANY CONFIDENTIAL NLR-CR-2014-215 | 11
This report documents the third party risk assessment for all nine SIL Zürich variants. After this
introduction, section 2 addresses the methodology adopted in the analysis and briefly describes
the data applied in the risk assessment. Section 3 presents the results of the calculations of both
individual risk and societal risk. Comparisons of Zürich’s societal risk results with other airports
are also presented. Section 4 gives a discussion of the results and finally, in section 5, a few
conclusions are drawn.

Assessment of third party risk around Zürich Airport
COMPANY CONFIDENTIAL
12 | NLR-CR-2014-215 COMPANY CONFIDENTIAL
2 Methodology of risk assessment
The methodology applied in the assessment of third party risk is in accordance with that used in
the NLR risk analysis for Zürich airport in 2011 (Ref. 1). This includes the use of the NLR third
party risk model standard for large airports and the application of the specific accident rates
derived for Zürich-like airports. A comprehensive description of the methodology adopted in the
NLR third party risk model is given in reference 2.
The Zürich-like airports comprise Zürich airport itself and 65 comparable Western airports. The
Western airports that are considered to be comparable with Zürich are based on a number of
selection criteria. These include the traffic volume, the presence of airport equipment (terminal
approach radar, automatic terminal information system (ATIS), and meteorological information
for aircraft in flight (VOLMET)), and the geographical location (Europe and North-America).
The NLR risk model consists of three components: accident probability (accident rates), accident
location and accident consequences (see Figure 2-1). As mentioned previously, the accident rates
applied here in the assessment are obtained from the set of 66 airports, including Zürich. The
accident location and the accident consequences in the NLR risk model were derived from an
extensive set of data concerning aircraft accidents, operations and airports worldwide. These
data, which also encompass the data in the derivation of accident rates for Zürich-like airports,
are extracted from the NLR Air Safety Databases.
Figure 2-1: A schematic representation of the third party risk model applied in the assessment of third party
risk around Zürich airport
The accident types considered in the third party risk model are (i) take-off overshoot, (ii) take-off
overrun, (iii) landing undershoot, and (iv) landing overrun. These four accident types are depicted
in Figure 2-2.
Results
IR / SR
Accident Probability
Model
Accident Location
Model
Accident Consequence
Model Inputs
Specific accident rates for
Zürich-like airports
Parameters of NLR risk model for
large airports
Third party risk model

COMPANY CONFIDENTIAL
COMPANY CONFIDENTIAL NLR-CR-2014-215 | 13
By definition veer-offs during take-off or landing are also third party risk accident types. However
in a standard risk assessment veer-offs are not considered because on large international airports
(like Zürich and Amsterdam Schiphol) considerable space is available on the sides of a runway
where an aircraft could stop in case of a veer-off. Risk of veer-offs is therefore assumed to be
limited to the terrain within the airport boundary and not to pose risk to third-parties.
Figure 2-2: The accident types used in the NLR Third Party Risk model: landing undershoot, landing overrun,
take-off overshoot and take-off overrun
As mentioned in the Introduction, for the SIL Zürich variants both individual risk and societal risk
are determined. The definition of individual risk and societal risk is given in Appendix A.
In order to calculate the risk around Zürich airport, input data are needed. Under the auspices of
Flughafen Zürich AG, the input data for all nine SIL Zürich variants are provided to NLR for
processing into calculation inputs. The risk calculation input data set is comprised of the
following:
The traffic fleet mix data for each variant. The traffic fleet mix data contain the number
of movements (departures and arrivals) per aircraft type, and the information of those
aircraft types. The movement data also indicate which runway and route for arrival and
departure is used by the aircraft.
The airport runways and flight routes. The airport runways including the use of landing
displaced thresholds and the flight routes (ground projection of the nominal flight paths)
are considered in the calculations as this information determines the risk distribution
over the surrounding of the airport.
Assessment of third party risk around Zürich Airport
COMPANY CONFIDENTIAL
14 | NLR-CR-2014-215 COMPANY CONFIDENTIAL
In the SIL Zürich variants, it is foreseen that runway 28 and runway 32 will be extended.
These changes in runway use are taken into account in the risk calculations.
The population densities. The data of population densities are required in particular for
the calculations of societal risk. The population considered is located in different types
of buildings or objects, like residence, office, school etc., and is discerned for daytime
and night-time period. For the present societal risk calculation the population data files
are those applied in the NLR risk study in 2011 (Ref. 1).
Appendix B presents a detailed description of the data applied in the risk calculations. Further,
appendices C through E present the figures of flight routes, an overview of the aircraft types and
their MTOW, and the number of movements per variant.
COMPANY CONFIDENTIAL
COMPANY CONFIDENTIAL NLR-CR-2014-215 | 15
3 Results
This section presents the calculation results of individual risk and societal risk for the SIL Zürich
variants considered. Appendix F presents the identifications for the risk calculations.
Individual risk is shown as contours, i.e. lines with iso-probability, on a geographical map
showing Zürich airport and its surroundings. The risk contours considered in this risk assessment
are 1∙10-5
/year (1 per 100,000 years) and 1∙10-6
/year (1 per million years). These two values are
chosen in accordance with the study conducted in 2011.
Societal risk is displayed as a curve on a double-logarithmic scale showing the risk value (F) per
year for groups with more than N persons. The groups considered in this assessment contain 10,
20, 40, 100, 200, 400 and 1,000 persons. The persons regarded in the societal risk calculations are
located in the vicinity of Zürich airport and within the study area used in the risk assessment.
3.1 Individual risk
On page 16 to page 21, the individual risk contours of different SIL Zürich variants are presented.
The risk contours of variant 1 are used as comparison basis.
Due to the difference in the number of air traffic movements, the use of runways and flight
routes, the resulting risk contours are in general different for each SIL Zürich variant. However,
since only the 10-5
/year and 10-6
/year risk contours are investigated, those differences might not
be observable for some variants. In other words, the changes in the risk contours when
comparing with those of variant 1 might only be significant for lower risk values.
For the sake of clarity of this report only the risk contours with significant changes are presented
and discussed here.

Assessment of third party risk around Zürich Airport
COMPANY CONFIDENTIAL
16 | NLR-CR-2014-215 COMPANY CONFIDENTIAL
3.1.1 Variant 1
Figure 3-1 depicts the plot of the individual risk contours for SIL Zürich variant 1.
Figure 3-1: Individual risk contours of Variant 1: 10-5
/year (black, long dashed lines) and 10-6
/year (black,
short dashed lines)
From the individual risk contours presented the following can be observed:
The spiked 10-6
/year risk contours are due to arrivals on the runways.
On the west side of the airport, at runway threshold 10, the risk contour is shorter and
less spiked; it is only caused by departure traffic on runway 28 as there are no arrivals on
runway 10.
CH
1903

COMPANY CONFIDENTIAL
COMPANY CONFIDENTIAL NLR-CR-2014-215 | 17
The 10-6
/year risk contour is the longest at the northwest of the airport; it is due to the
large amount of arrival traffic on runway 14. The shortest 10-6
risk contour is located at
runway threshold 32; this contour is a result of landing overrun risk on RWY 14.
The effect of displaced threshold for arrivals on runway 34 is observable in contrast with
that of runway 14 .
The effect of extending runway 10-28 is observable; the 10-6
/year risk contour there lies
outside the current runway location.
The 10-6
/year contours cover part of different built-up and residential areas in the
vicinity of the airport.
To the south of the airport, at runway threshold 34, a bifurcation or branching in the
10-6
/year risk contours is observed. The pointed contour is caused by the arrivals, as
mentioned before. The branched contour is attributed to the departure traffic on
runway 16 following flight route turning to the left shortly after take-off.
3.1.2 Variant 2
Figure 3-2 presents a contour plot in which variant 2 is compared with variant 1. A marked
difference can be observed in the distribution of individual risk between these variants.
The risk contour of variant 2 at runway threshold 34 is significant larger than that of
variant 1. This is due to the larger number of departures on RWY 16. As a result, the
contour covers a larger part of built-up area south of the airport.
The contours at runway 10 are much smaller for variant 2 due to the limited number of
departures on RWY 28.
No noticeable differences are found in the north-west (RWY 14 and RWY 16) and the
east (RWY 28 and RWY 32).

Assessment of third party risk around Zürich Airport
COMPANY CONFIDENTIAL
18 | NLR-CR-2014-215 COMPANY CONFIDENTIAL
Figure 3-2: Individual risk contours of variant 2 with 10-5
/year (red) and 10-6
/year (blue) comparing with
variant 1
3.1.3 Variant 3 and Variant 4
The differences between the (10-5
/year and 10-6
/year) risk contours of variant 3 and variant 4
with variant 1 are small. Hence, their contour plots are not presented here.
Variant 3 has almost the same number of movements and use of flight routes. Therefore the
resulting risk contours are almost identical to those of variant 1.
Although variant 4 does not have departures on RWY 10, due to the fact that the number of
arrivals on RWY 28 is more dominant and the fact that the accident rate of landing undershoot is
higher than other rates of other accident types, the difference in the 10-5
/year and the 10-6
/year
CH
1903
COMPANY CONFIDENTIAL
COMPANY CONFIDENTIAL NLR-CR-2014-215 | 19
risk contours is not visible. Difference could only be observed by showing contours with lower
risk values.
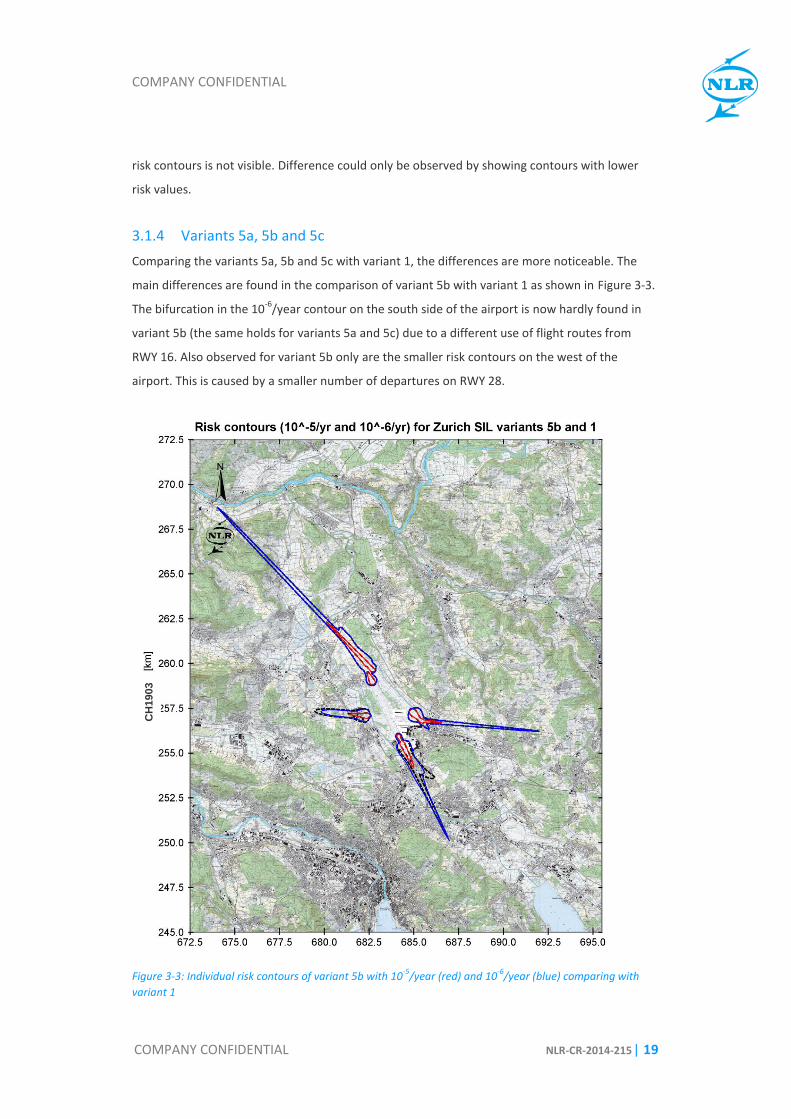
3.1.4 Variants 5a, 5b and 5c
Comparing the variants 5a, 5b and 5c with variant 1, the differences are more noticeable. The
main differences are found in the comparison of variant 5b with variant 1 as shown in Figure 3-3.
The bifurcation in the 10-6
/year contour on the south side of the airport is now hardly found in
variant 5b (the same holds for variants 5a and 5c) due to a different use of flight routes from
RWY 16. Also observed for variant 5b only are the smaller risk contours on the west of the
airport. This is caused by a smaller number of departures on RWY 28.
Figure 3-3: Individual risk contours of variant 5b with 10-5
/year (red) and 10-6
/year (blue) comparing with
variant 1
CH
1903

Assessment of third party risk around Zürich Airport
COMPANY CONFIDENTIAL
20 | NLR-CR-2014-215 COMPANY CONFIDENTIAL
3.1.5 Variant 6
Figure 3-4 presents a comparison of risk contours variant 6 with variant 1. Noticeable is the
difference at runway threshold 34, the south side of the airport. Although variant 6 has more
departures on RWY16, the different use of flight routes prevents the shaping of a bifurcation in
the 10-6
/year contour.
Figure 3-4: Individual risk contours of variant 6 with 10-5
/year (red) and 10-6
/year (blue) comparing with
variant 1
3.1.6 Variant 7
Figure 3-5 depicts the individual risk contour plot with the comparison of variant 7 and variant 1.
The individual risk contours of variant 7 are quite different from those of variant 1.
CH
1903

COMPANY CONFIDENTIAL
COMPANY CONFIDENTIAL NLR-CR-2014-215 | 21
The risk contours at the south of the airport are smaller. As a result, only a small area of
residential area is covered. The bifurcation or branching of the risk contour is barely
visible.
At the east of the airport the risk contours are however longer and larger. Nonetheless,
those contours seem not to extend to residential areas.
On the contrary, at the north-west of the airport the spiked part of 10-6
/year risk
contour is smaller and shorter. However, due to a slightly larger numbers of departures
there, the bifurcation in the 10-6
/year contour increases in size. By visual inspection, the
branch of the 10-6
/year risk contour extends to part of built-up area.
Figure 3-5: Individual risk contours of variant 7 with 10-5
/year (red) and 10-6
/year (blue) comparing with
variant 1
CH
1903
Assessment of third party risk around Zürich Airport
COMPANY CONFIDENTIAL
22 | NLR-CR-2014-215 COMPANY CONFIDENTIAL
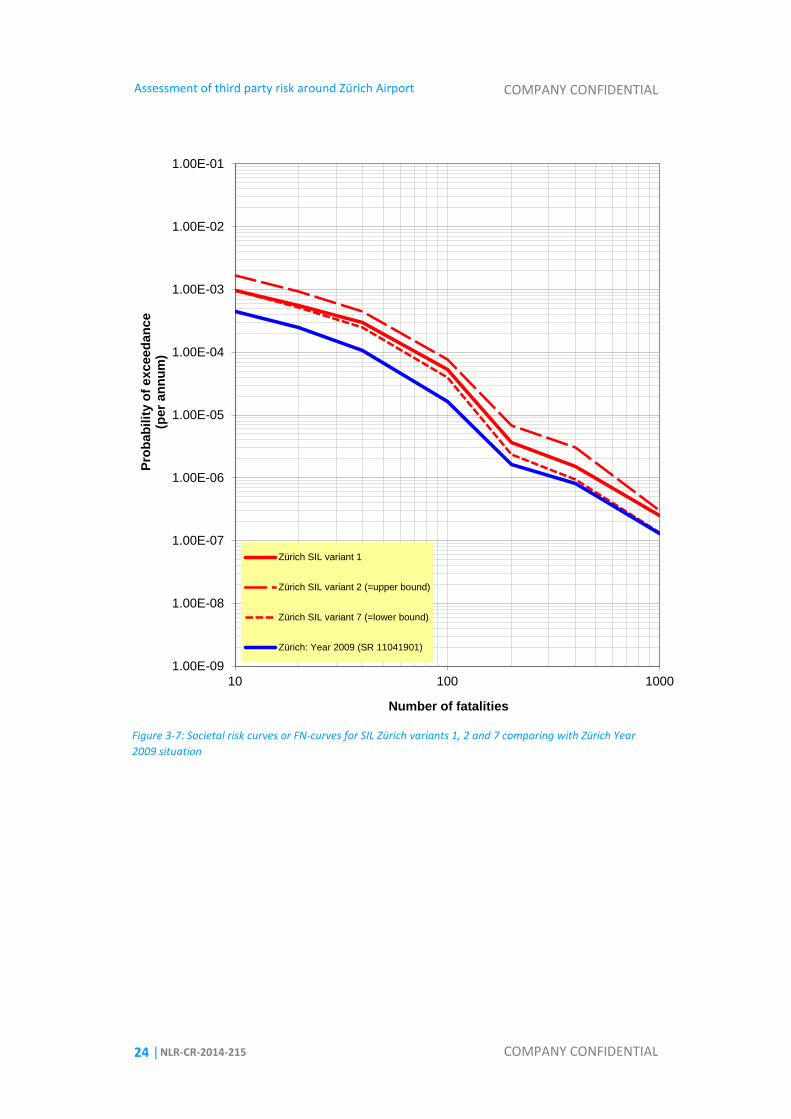
3.2 Societal risk
The societal risk curves or FN-curves for all nine SIL Zürich variants are presented subsequently in
Figure 3-6.
First by visual inspection of this figure, the societal risk curve of the SIL Zürich variants do not
deviate much from each other. The curves are found within a narrow band following a certain
pattern. The risk for smaller group sizes is higher than that for larger group sizes. This means that
there is a smaller probability that an aircraft crash killing a large group of persons on ground
takes place.
Differences among the variants can still be observed. The risk curve of variant 2 lies well above all
other variants for each group size considered. On the contrary, the risk curve of variant 7 lies
under all other variants. These two variants form apparently the upper and the lower bound
where the risk curves of all other variants lie in between.

COMPANY CONFIDENTIAL
COMPANY CONFIDENTIAL NLR-CR-2014-215 | 23
Figure 3-6: Societal risk curves or FN-curves for the nine SIL Zürich variants
Figure 3-7 presents the FN-curves of variants 1, 2 and 7, and that of the actual year situation in
2009. The latter is obtained from the 2011 risk study. From this figure it can be seen that the risk
of SIL Zürich variants is higher than the situation in 2009 because of the larger number of
movements in the scenario and the different flight routes used. For larger group sizes (400 or
more), the risk of SIL Zürich variant 7 is comparable to that of the actual year situation despite
the fact that the SIL variant has much more traffic.
1.00E-09
1.00E-08
1.00E-07
1.00E-06
1.00E-05
1.00E-04
1.00E-03
1.00E-02
10 100 1000
Pro
bab
ilit
y o
f exceed
an
ce
(pe
r a
nn
um
)
Number of fatalities
SIL variant 1
SIL variant 2
SIL variant 3
SIL variant 4
SIL variant 5a
SIL variant 5b
SIL variant 5c
SIL variant 6
SIL variant 7
Assessment of third party risk around Zürich Airport
COMPANY CONFIDENTIAL
24 | NLR-CR-2014-215 COMPANY CONFIDENTIAL
Figure 3-7: Societal risk curves or FN-curves for SIL Zürich variants 1, 2 and 7 comparing with Zürich Year
2009 situation
1.00E-09
1.00E-08
1.00E-07
1.00E-06
1.00E-05
1.00E-04
1.00E-03
1.00E-02
1.00E-01
10 100 1000
Pro
bab
ilit
y o
f exceed
an
ce
(per
an
nu
m)
Number of fatalities
Zürich SIL variant 1
Zürich SIL variant 2 (=upper bound)
Zürich SIL variant 7 (=lower bound)
Zürich: Year 2009 (SR 11041901)

COMPANY CONFIDENTIAL
COMPANY CONFIDENTIAL NLR-CR-2014-215 | 25
3.3 Comparison analysis of societal risk
The societal risk of SIL Zürich variants is further investigated and compared. Since the societal risk
results as discussed in section 3.2 are examined visually, the discussion of comparison for that
would be unilateral. Therefore complementary comparison tools may be deemed necessary.
For comparing the societal risk of the SIL Zürich variants, two comparison tools are devised. The
first one is the application of bar-plot by showing all variants with respect to a reference variant,
i.e. variant 1. The second one is the application of spider-plot by showing separately the risk of
each variant compared with that of the reference variant.
Furthermore, to demonstrate the magnitude of risk that Zürich airport attains, the Zürich’s risk is
put into comparison with other western international airports for which societal risk has been
determined before. The comparison is based on the FN-curve only. The order of magnitude of
risk is briefly discussed.
3.3.1 Bar-plot comparison of societal risk
To demonstrate how each SIL Zürich variant performs, a comparison of societal risk is needed.
Since there is no universal standard or criterion for comparing societal risk due to air traffic or for
airport, SIL Zürich variant 1 is taken here as a reference. The purpose of such comparison is to
show the performance of the SIL Zürich variants in terms of societal risk.
The performance is measured by the percentage change in risk per group size with respect to
variant 1 (chosen as reference). The following simple relation per group size is adopted:
where i = variant number 2, 3, 4, 5a/b/c, 6 or 7.
This relation shows the amount of change in risk for a group of persons for each variant
comparing with the risk for variant 1. A positive percentage of change means in this regard an
increase in risk. In other words, variant i has higher risk than variant 1 for certain group size. A
negative percentage means a decrease in risk: variant i has then lower risk.
Figure 3-8 shows the bar-plot of societal risk per group size for each variant in comparison with
the reference, variant 1.

Assessment of third party risk around Zürich Airport
COMPANY CONFIDENTIAL
26 | NLR-CR-2014-215 COMPANY CONFIDENTIAL
The bar-plot takes simultaneously all variants in comparison with variant 1 and takes all group
sizes in consideration. In addition, the plot shows at once the changes in societal risk.
From this figure it can be seen that variant 2 has a higher societal risk than the reference whilst
variant 7 has a lower risk. After variant 2, variant 5b seems to have higher risk than the other
variants. In general, except for variant 7, all other variants have higher societal risk values than
variant 1 for the group sizes considered.
Figure 3-8: Comparison of all variants with variant 1 across different group size (societal risk)
3.3.2 Spider-plot comparison of societal risk
Spider-plots or spider-charts are adopted here to compare each variant with the reference,
variant 1. The spider-plots as displayed in Figure 3-9 through Figure 3-16 are constructed with the
following steps:
The risk values per group size for variant 1 are first normalized which means the risk
value for each group size considered, i.e. 10, 20, 40, 100, 200, 400 and 1000, is set to
100%.
The risk values per group size for the variant considered are compared to those of
variant 1 (chosen as reference). The ratio is determined as percentage with the following
relation:
where i = variant number 2, 3, 4, 5a/b/c, 6 or 7.
-60.00%
-40.00%
-20.00%
0.00%
20.00%
40.00%
60.00%
80.00%
100.00%
120.00%
10 20 40 100 200 400 1000
SIL var 2
SIL var 3
SIL var 4
SIL var 5a
SIL var 5b
SIL var 5c
SIL var 6
SIL var 7
Incr
ease
in r
isk
D
ecre
ase
in r
isk

COMPANY CONFIDENTIAL
COMPANY CONFIDENTIAL NLR-CR-2014-215 | 27
Two curves in the spider-plot are then drawn: one for variant 1 and one for variant i
considered.
The advantage of this way of presenting the societal risk is that one can observe at a glance how
each variant changes with respect to the reference, variant 1. If, for instance, for each group size
the risk value of the variant considered is larger than those of variant 1, its curve (spider-plot)
would then be larger and encompass the curve of variant 1.
Figure 3-9: Spider-plot with comparison of variant 2 and variant 1
Figure 3-10: Spider-plot with comparison of variant 3 and variant 1
0.00%
50.00%
100.00%
150.00%
200.00%
10
20
40
100200
400
1000
Comparison V2 and V1
SIL var 1
SIL var 2
0.00%
50.00%
100.00%
150.00%
200.00%
10
20
40
100200
400
1000
Comparison V3 and V1
SIL var 1
SIL var 3

Assessment of third party risk around Zürich Airport
COMPANY CONFIDENTIAL
28 | NLR-CR-2014-215 COMPANY CONFIDENTIAL
Figure 3-11: Spider-plot with comparison of variant 4 and variant 1
Figure 3-12: Spider-plot with comparison of variant 5a and variant 1
0.00%
50.00%
100.00%
150.00%
200.00%
10
20
40
100200
400
1000
Comparison V4 and V1
SIL var 1
SIL var 4
0.00%
50.00%
100.00%
150.00%
200.00%
10
20
40
100200
400
1000
Comparison V5a and V1
SIL var 1
SIL var 5a

COMPANY CONFIDENTIAL
COMPANY CONFIDENTIAL NLR-CR-2014-215 | 29
Figure 3-13: Spider-plot with comparison of variant 5b and variant 1
Figure 3-14: Spider-plot with comparison of variant 5c and variant 1
0.00%
50.00%
100.00%
150.00%
200.00%
10
20
40
100200
400
1000
Comparison V5b and V1
SIL var 1
SIL var 5b
0.00%
50.00%
100.00%
150.00%
200.00%
10
20
40
100200
400
1000
Comparison V5c and V1
SIL var 1
SIL var 5c

Assessment of third party risk around Zürich Airport
COMPANY CONFIDENTIAL
30 | NLR-CR-2014-215 COMPANY CONFIDENTIAL
Figure 3-15: Spider-plot with comparison of variant 6 and variant 1
Figure 3-16: Spider-plot with comparison of variant 7 and variant 1
From the subsequent figures shown in Figure 3-9 through Figure 3-16, the following is observed:
Variant 2 has the largest spider-plot for the group sizes considered.
Variant 7 is the only variant that has a smaller spider-plot than variant 1.
The spider plot of variant 3 is almost identical to that of variant 1.
0.00%
50.00%
100.00%
150.00%
200.00%
10
20
40
100200
400
1000
Comparison V6 and V1
SIL var 1
SIL var 6
0.00%
50.00%
100.00%
150.00%
200.00%
10
20
40
100200
400
1000
Comparison V7 and V1
SIL var 1
SIL var 7

COMPANY CONFIDENTIAL
COMPANY CONFIDENTIAL NLR-CR-2014-215 | 31
The plots of variant 4 and variant 1 are quite comparable. Only for larger group sizes
(200, 400) the plot of variant 4 is slightly larger than variant 1.
By observing the plots of variants 5a, 5b and 5c comparing with variant 1: the plot of 5b
is the largest of the three, and the plot of 5c is somewhat larger than 5a.
Variant 6 has a larger plot than variant 1. However, for group of 1000 persons, the plots
of these two variants seem to coincide. In other words, the risk for a group of 1000
people is comparable for both variants.
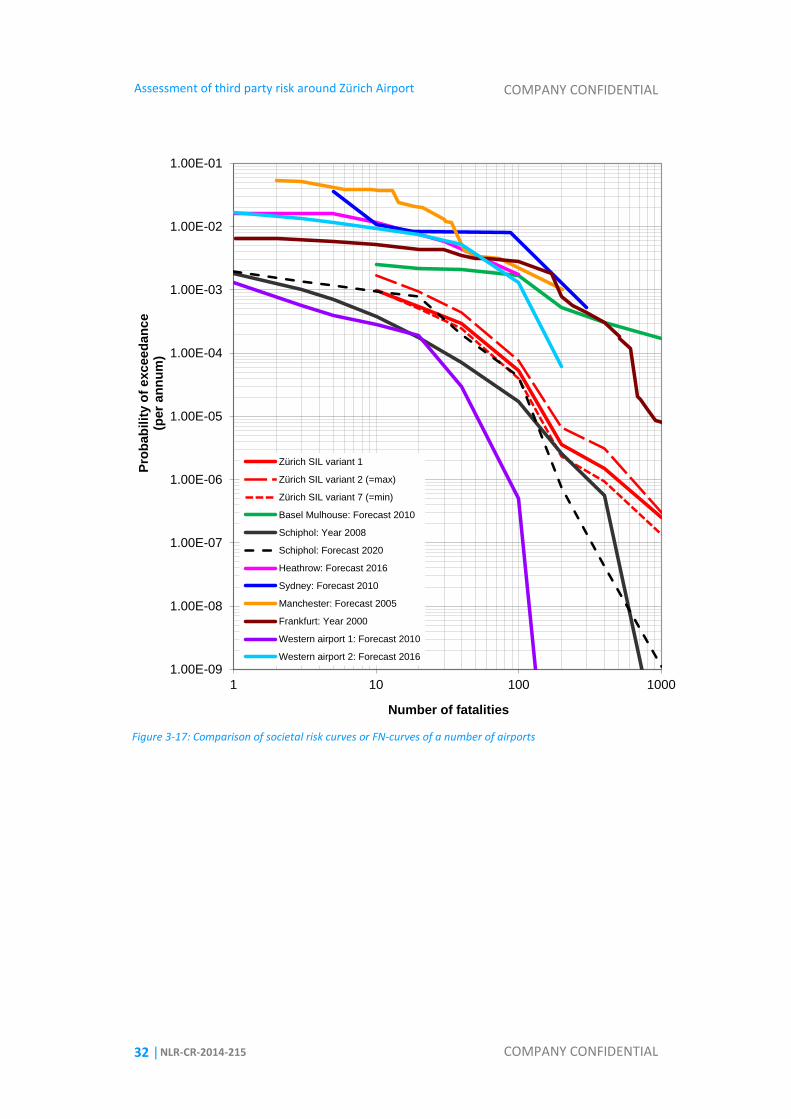
3.3.3 Comparison of Zürich and other airports
A comparison of the societal risk of Zürich is made with the risks of other airports. The purpose of
this comparison is to demonstrate the level or the order of magnitude of the risk that Zürich
airport attains in comparison with other western international airports.
Figure 3-17 shows the societal risk curves (FN-curves) of different airports. The societal risk
curves in this figure are derived from a variety of sources or references as follows:
The risk curves of SIL Zürich variants in the present study.
The risk curves of Schiphol airport (Ref. 3) and Western airports 1 and 2 are derived
from various NLR studies. The names of both Western airports are withheld due to
confidentiality.
The risk curves of Heathrow, Sydney, Manchester and Frankfurt are obtained from an
NLR-study in which the societal risks of these airports were compared with Schiphol’s
(Ref. 4). The sources of the risk curves are in their turn derived from a number of risk
analysis reports available to NLR.
The risk curve of Base-Mulhouse is determined by NLR using reference 5 and only the
groups 10, 20, 40, 100, 200, 400 and 1000 are regarded.
In the figure, the societal risk curves of SIL Zürich variant 1, 2 and 7 are depicted in red solid line,
long dashed line and short dashed line, respectively. Other variants of SIL Zürich are not shown
because variants 2 and 7 form well for the group sizes 10 through 1000, the upper bound and
lower bound of the societal risk curves in which the risk of other SIL Zürich variants lie in
between. The risk curve of variant 1 is shown here as a reference.
From this figure it can be seen that the Zürich airport’s societal risk is not exceptional in
comparison with other airports.
Assessment of third party risk around Zürich Airport
COMPANY CONFIDENTIAL
32 | NLR-CR-2014-215 COMPANY CONFIDENTIAL
Figure 3-17: Comparison of societal risk curves or FN-curves of a number of airports
1.00E-09
1.00E-08
1.00E-07
1.00E-06
1.00E-05
1.00E-04
1.00E-03
1.00E-02
1.00E-01
1 10 100 1000
Pro
bab
ilit
y o
f e
xc
ee
da
nc
e
(per
an
nu
m)
Number of fatalities
Zürich SIL variant 1
Zürich SIL variant 2 (=max)
Zürich SIL variant 7 (=min)
Basel Mulhouse: Forecast 2010
Schiphol: Year 2008
Schiphol: Forecast 2020
Heathrow: Forecast 2016
Sydney: Forecast 2010
Manchester: Forecast 2005
Frankfurt: Year 2000
Western airport 1: Forecast 2010
Western airport 2: Forecast 2016
COMPANY CONFIDENTIAL
COMPANY CONFIDENTIAL NLR-CR-2014-215 | 33
4 Discussion of results
In this risk assessment for SIL Zürich variants, the Individual risk is calculated and risk contours
are determined. Due to the different number of movements and use of flight routes and
runways, some differences in the resulting risk contours are observed. However, because of the
levels of risk contours chosen in this study, the differences for some variants are not entirely
detectable and are thus not significant. Therefore the information of individual risk is not easy to
grasp in comparing the variants.
Societal risk is calculated and FN-curves are determined for the SIL Zürich variants as well. The
resulting FN-curves show a narrow band in which the risks of the SIL Zürich variants lie in
between. The societal risk curves are in general quite comparable and do not deviate much.
By evaluating the societal risk in detail, however, differences between the variants can be
observed. The differences are shown by using the bar-plot and spider-plot presentations of the
societal risk for the groups of people considered. By combining the results of both bar-plot and
spider-plot presentations the results show clearly that variant 7 gives the lowest (societal) risk
whereas variant 2 the highest. Variant 7 is thus the most favourable SIL Zürich variant in terms of
risk. Following variant 7 are variants 3 and 4 as they present the risk levels almost identical to
that of variant 1.
In addition to the mutual comparison of the SIL Zürich variants, the societal risk of Zürich airport
is also put into comparison with other airports. The result shows that overall the societal risk
curve of Zürich airport is not exceptional. In other words, the order of magnitude of Zürich risk is
comparable with a number of western international airports.
Assessment of third party risk around Zürich Airport
COMPANY CONFIDENTIAL
34 | NLR-CR-2014-215 COMPANY CONFIDENTIAL
5 Conclusions
Individual risk
The resulting individual risk contours show that 10-6
/year contours cover part of the
built-up and residential areas in the surroundings of the airport.
The individual risk contours do not form easy-to-grasp risk information for comparing
variants. This is because some variants have quite comparable traffic situation as that of
the reference situation, variant 1, and the levels of risk contour that are chosen in this
study are limited to 10-5
/year and 10-6
/year. Therefore the differences may not be
significant for some variants.
Societal risk
The resulting societal risk curves of different SIL Zürich variants lie in a narrow band and
they do not deviate much.
In the comparison of societal risk curve of Zürich with other western international
airports, Zürich’s curve shows a comparable pattern and is not exceptional.
By evaluating the societal risk in detail, however, it is found that of all SIL Zürich variants,
variant 2 has the highest risk for the group sizes considered. Variant 7 has the smallest
risk and is the only variant that has smaller risk than variant 1. All other variants have
risk that is either identical to or higher than variant 1.
COMPANY CONFIDENTIAL
COMPANY CONFIDENTIAL NLR-CR-2014-215 | 35
6 References
1. An analysis of third party risk around Zürich Airport, With a derivation of specific accident
rates, NLR report NLR-CR-2011-081 (Company confidential), Y.S. Cheung, J.A. Post and
L. de Haij, November 2011.
2. An enhanced method for the calculation of third party risk around large airports, with
application to Schiphol, NLR report NLR-CR-2000-147, A.J. Pikaar, C.J.M. de Jong and
J. Weijts, April 2000.
3. Strategische Milieuverkenning voor de ontwikkeling van Schiphol op middellange termijn,
Schiphol Group and LVNL, najaar 2008 (report in Dutch).
4. Externe veiligheid luchthaven Schiphol 2001 en groepsrisico rond diverse luchthavens:
bijlage voor de Milieubalans 2002, NLR-CR-2002-237, J. Weijts and M.K.H. Giesberts,
August 2002 (report in Dutch).
5. Risikoanalyse für den Flughafen Basel-Mülhausen – Kurzfassung, (web document),
GfL (Berlin) and Arcadis Trischler & Partner GmbH (Darmstadt), June 2001 (report in
German).
6. An overview of quantitative risk measures for loss of life and economic damage,
Journal of Hazardous Materials A99 (2003) 1 -30, S.N. Jonkman, P.H.A.J.M. van Gelder and
J.K. Vrijling, 2003.
Assessment of third party risk around Zürich Airport
COMPANY CONFIDENTIAL
36 | NLR-CR-2014-215 COMPANY CONFIDENTIAL
Appendix A 0BRisk metrics
Individual risk (IR) is defined as the local probability per year that a person, who is permanently
residing at this particular location, suffers fatal injury as a direct consequence of an aircraft
accident on or near his/her position. Two important characteristics of the Individual Risk are:
Individual Risk represents a point-location risk; it is calculated separately for every location
around the airport and differs from location to location.
Individual Risk is independent of the actual population around the airport; it is calculated for
a fictive person who is presumed to stay permanently in one single location.
Societal Risk (SR) is defined as the probability per year that a group larger than a given number of
persons (third parties) is killed due to a single aircraft accident. Societal Risk is presented as an
FN-curve, where F (frequency) 0F
1) stands for the probability per year and N stands for the group
size. Due to the wide range of values of probability and group sizes, the FN-curve is practically
plotted on a double-logarithmic scale. In practice, only a selected number of group sizes is
calculated, for example, N{1, 3, 5, 10, 20, 40, 100, 200, 400, 1000}.
Two important characteristics of the Societal Risk are:
Societal Risk represents the risk over the total study area around the airport.
Societal Risk depends on the actual population distribution around the airport; in a
hypothetical situation where no population is present anywhere around an airport, the
Societal Risk for this airport would be null (zero).
The essential difference between Individual Risk and Societal Risk is shown in Figure A.1.
Depicted in the figure are two situations, A and B, with an identical risk source. Although both
situations could have the same individual risk as a consequence of the risk source, due to the
different population distributions in the surrounding of the risk source, situation B has larger
societal risk than situation A. It may be clear that the use of both main risk metrics can be
important in expressing third party risk.
1) In terms of statistics this quantity is a frequency that depends on the distribution of group sizes in the population sample.

COMPANY CONFIDENTIAL
COMPANY CONFIDENTIAL NLR-CR-2014-215 | 37
Figure A.1: Difference between Individual Risk (IR) and Societal Risk (SR). The Individual Risk levels are for
situation A and B the same. However, due to the different distribution of population, Societal Risk for
situation B is higher than that for A. Figure is adapted from reference 6
Assessment of third party risk around Zürich Airport
COMPANY CONFIDENTIAL
38 | NLR-CR-2014-215 COMPANY CONFIDENTIAL
Appendix B 1BOverview of input data
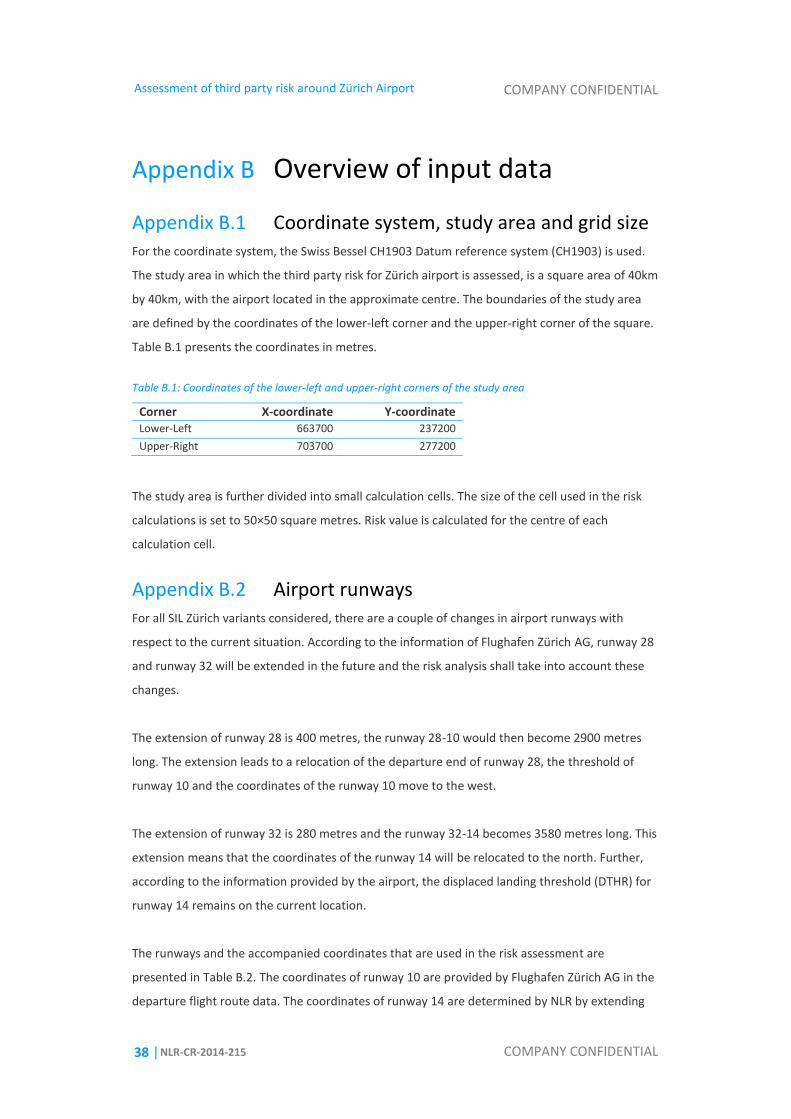
Appendix B.1 Coordinate system, study area and grid size For the coordinate system, the Swiss Bessel CH1903 Datum reference system (CH1903) is used.
The study area in which the third party risk for Zürich airport is assessed, is a square area of 40km
by 40km, with the airport located in the approximate centre. The boundaries of the study area
are defined by the coordinates of the lower-left corner and the upper-right corner of the square.
Table B.1 presents the coordinates in metres.
Table B.1: Coordinates of the lower-left and upper-right corners of the study area
Corner X-coordinate Y-coordinate Lower-Left 663700 237200
Upper-Right 703700 277200
The study area is further divided into small calculation cells. The size of the cell used in the risk
calculations is set to 50×50 square metres. Risk value is calculated for the centre of each
calculation cell.
Appendix B.2 Airport runways For all SIL Zürich variants considered, there are a couple of changes in airport runways with
respect to the current situation. According to the information of Flughafen Zürich AG, runway 28
and runway 32 will be extended in the future and the risk analysis shall take into account these
changes.
The extension of runway 28 is 400 metres, the runway 28-10 would then become 2900 metres
long. The extension leads to a relocation of the departure end of runway 28, the threshold of
runway 10 and the coordinates of the runway 10 move to the west.
The extension of runway 32 is 280 metres and the runway 32-14 becomes 3580 metres long. This
extension means that the coordinates of the runway 14 will be relocated to the north. Further,
according to the information provided by the airport, the displaced landing threshold (DTHR) for
runway 14 remains on the current location.
The runways and the accompanied coordinates that are used in the risk assessment are
presented in Table B.2. The coordinates of runway 10 are provided by Flughafen Zürich AG in the
departure flight route data. The coordinates of runway 14 are determined by NLR by extending

COMPANY CONFIDENTIAL
COMPANY CONFIDENTIAL NLR-CR-2014-215 | 39
the runway with 280 metres to the North. These coordinates are delivered to Flughafen Zürich
for confirmation. The remaining coordinates are derived from the previous risk study in
reference 1.
Table B.2: Coordinates of the airport runways
Runway X-coordinate Y-coordinate Description / Remark Runway length
10 682458.1 257077.7 10-28 for take-off* 2900 metres
28 685347.3 256816.8 28-10 for both take-off and landing 2900 metres
14 682419.0 259925.6 14-32 used for take-off on 14, if any** 3580 metres
14(DTHR) 682715.5 259614.2 14D-32 for landing on 14 with DTHR 3150 metres
32 684888.1 257332.0 32-14 for take-off*** 3580 metres
16 682715.1 258904.9 16-34 for take-off and landing on 16 3700 metres
34 684326.7 255574.8 34-16 for take-off on 34 3700 metres
34(DTHR) 684129.1 255985.1 34D-16 for landing on 34 with DTHR 3245 metres
*) Take-offs on RWY 10 are only for SIL Zürich variant 1 and variant 3, and there are landings on RWY 10.
**) In the SIL Zürich variants there are no take-offs on RWY 14.
***) There are no landings on RWY 32 in the variants.
Appendix B.3 Flight routes The departure flight routes are delivered by Flughafen Zürich AG and the arrival flight routes are
derived from the risk study in 2011 (Ref. 1). The arrival flight routes in this risk study were
provided by FOCA and were originally delivered by the airport.
The flight route data for departures are provided by Flughafen Zürich AG in CAD file format DXF.
The departure routes contain nominal routes and they are derived from the tracks data as used
in the airport noise calculations for the SIL Zürich variants. In the risk calculations, aircraft
departing from Zürich airport are assumed to follow the nominal routes.
For arrivals, route data are initially provided by the airport. These route data contain vectoring
paths for approach over a large area around the airport and end at a far point on the extended
line of the runway. However, no route data are provided from that point to the runway end. For
the purpose of calculation of risk due to arrivals to Zürich, the arrival route data should be made
complete. In consultation with Flughafen Zürich AG, the flight route data for arrivals for this risk
assessment are therefore derived from those applied in the risk study in 2011 (Ref. 1). Those
arrival routes consist of a number of straight-in ILS approach paths on four runways only, i.e.
RWY 14, 16, 28 and 34. These approach paths extend through the point about the Final Approach
Fix (FAF). Aircraft approaching to Zürich airport in the SIL variants are assumed to use one of
these straight-in approach paths.
Appendix C presents the flight routes used in the present risk assessment.
Assessment of third party risk around Zürich Airport
COMPANY CONFIDENTIAL
40 | NLR-CR-2014-215 COMPANY CONFIDENTIAL
Appendix B.4 Traffic and aircraft fleet mix data The traffic data consists of aircraft types and aircraft movements per runway and route.
Flughafen Zürich AG has initially provided a data set of the traffic as used in the noise
calculations. Prior to the execution of risk calculations, NLR has analysed the information
provided and considered that a number of adjustments in the data is necessary. In consultation
with the airport, the following modifications are made:
The representative aircraft types, which were applied in the noise calculations, are
replaced by a set of detailed aircraft types as used in the design of the operational
concept originally. In the risk assessment, the MTOW of each representative aircraft
type for noise is replaced by the MTOW that is averaged over a range of detailed aircraft
types and their movements within the same noise category of the representative
aircraft type.
The traffic data, which are provided in detail in different time blocks, are differentiated
in daytime and in night-time periods. For day-time the period between 07-19 hours is
assumed. For night-time the period 19-07 hours is assumed. This differentiation in day
and night is only necessary for the societal risk calculations to demonstrate the effects
of population located in different objects. During daytime, it is likely that people are
more present at work (in offices, factories, schools etc.) than at homes (in residential
areas). During night-time, it is likely the other way round.
The traffic data are available for the time blocks 06-07, 07-21, 21-22 and 22-23. Between
23-06 no traffic is foreseen. In the determination of the daytime traffic, NLR assigned
12/14 of the traffic in the time block 07-21. The remaining 2/14 of the traffic in this time
block together with traffic in the time blocks 06-07, 21-22 and 22-23 are assigned to the
night-time traffic.
Appendix B.5 Aircraft maximum take-off weight data The aircraft maximum take-off weight is an input parameter that determines the accident
consequences in the risk model. The aircraft MTOW information applied in the risk calculations
for Zürich airport is based on the official list of MTOWs that is used in the Environmental
Information Regulation for Amsterdam Schiphol Airport. The data are derived from the
authoritative “Jane’s All the World’s Aircraft” information.
Prior to the risk calculations, NLR has determined for each detailed aircraft type the correct
MTOW by using the aforementioned source. Combining the MTOW information and the number
of movements per detailed aircraft type in each WTC-category, the weighted MTOW for a noise
representative aircraft can be determined.
COMPANY CONFIDENTIAL
COMPANY CONFIDENTIAL NLR-CR-2014-215 | 41
Appendix D gives an overview of the MTOWs as used in the risk calculations. The MTOWs for the
noise-representative aircraft type are the same for all SIL Zürich variants.
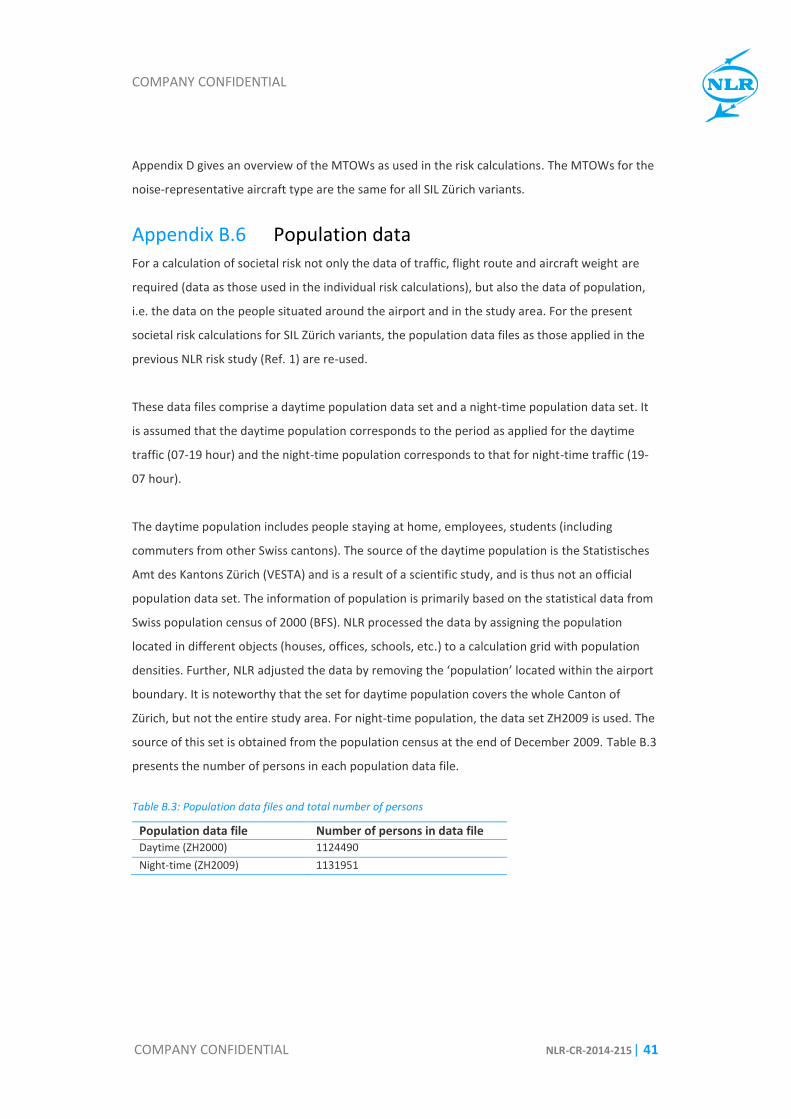
Appendix B.6 Population data For a calculation of societal risk not only the data of traffic, flight route and aircraft weight are
required (data as those used in the individual risk calculations), but also the data of population,
i.e. the data on the people situated around the airport and in the study area. For the present
societal risk calculations for SIL Zürich variants, the population data files as those applied in the
previous NLR risk study (Ref. 1) are re-used.
These data files comprise a daytime population data set and a night-time population data set. It
is assumed that the daytime population corresponds to the period as applied for the daytime
traffic (07-19 hour) and the night-time population corresponds to that for night-time traffic (19-
07 hour).
The daytime population includes people staying at home, employees, students (including
commuters from other Swiss cantons). The source of the daytime population is the Statistisches
Amt des Kantons Zürich (VESTA) and is a result of a scientific study, and is thus not an official
population data set. The information of population is primarily based on the statistical data from
Swiss population census of 2000 (BFS). NLR processed the data by assigning the population
located in different objects (houses, offices, schools, etc.) to a calculation grid with population
densities. Further, NLR adjusted the data by removing the ‘population’ located within the airport
boundary. It is noteworthy that the set for daytime population covers the whole Canton of
Zürich, but not the entire study area. For night-time population, the data set ZH2009 is used. The
source of this set is obtained from the population census at the end of December 2009. Table B.3
presents the number of persons in each population data file.
Table B.3: Population data files and total number of persons
Population data file Number of persons in data file Daytime (ZH2000) 1124490
Night-time (ZH2009) 1131951
Assessment of third party risk around Zürich Airport
COMPANY CONFIDENTIAL
42 | NLR-CR-2014-215 COMPANY CONFIDENTIAL
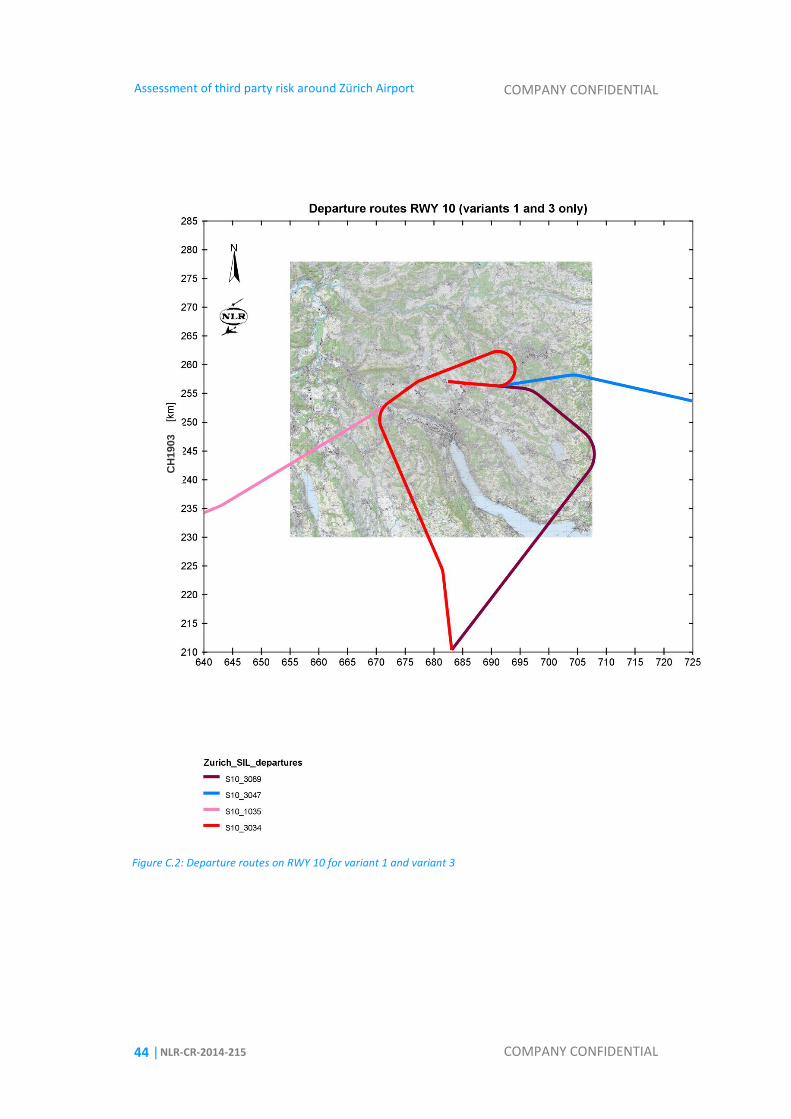
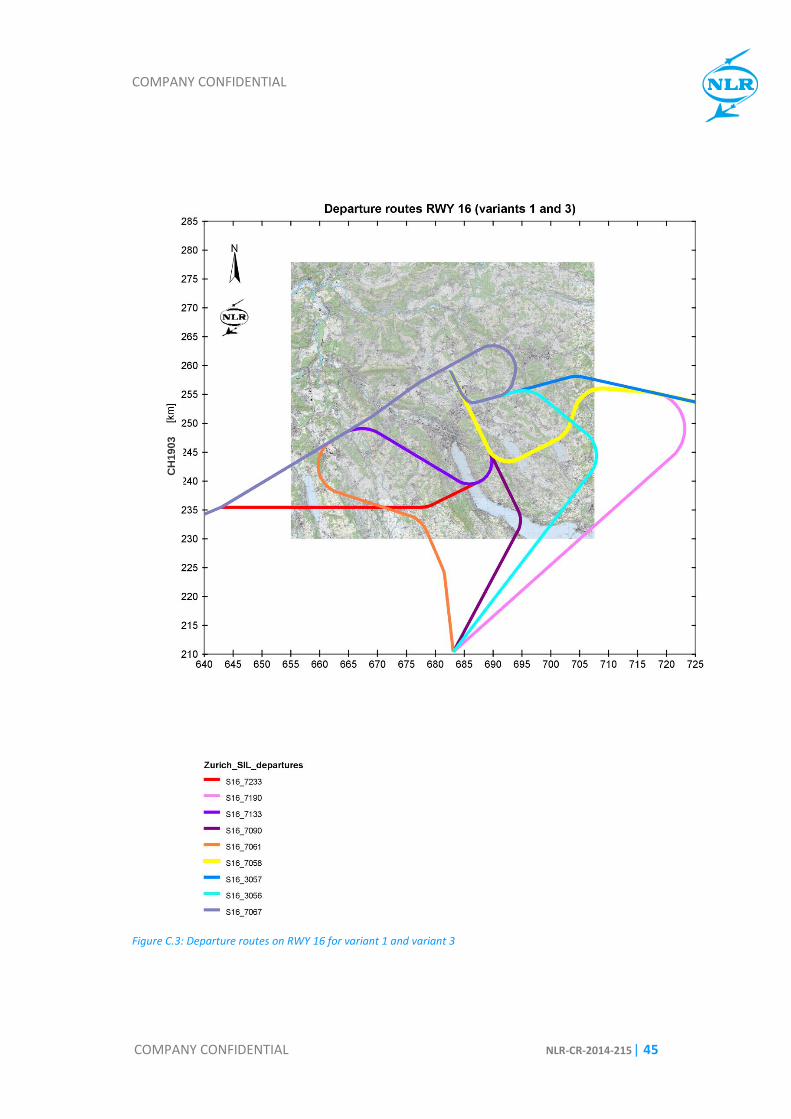
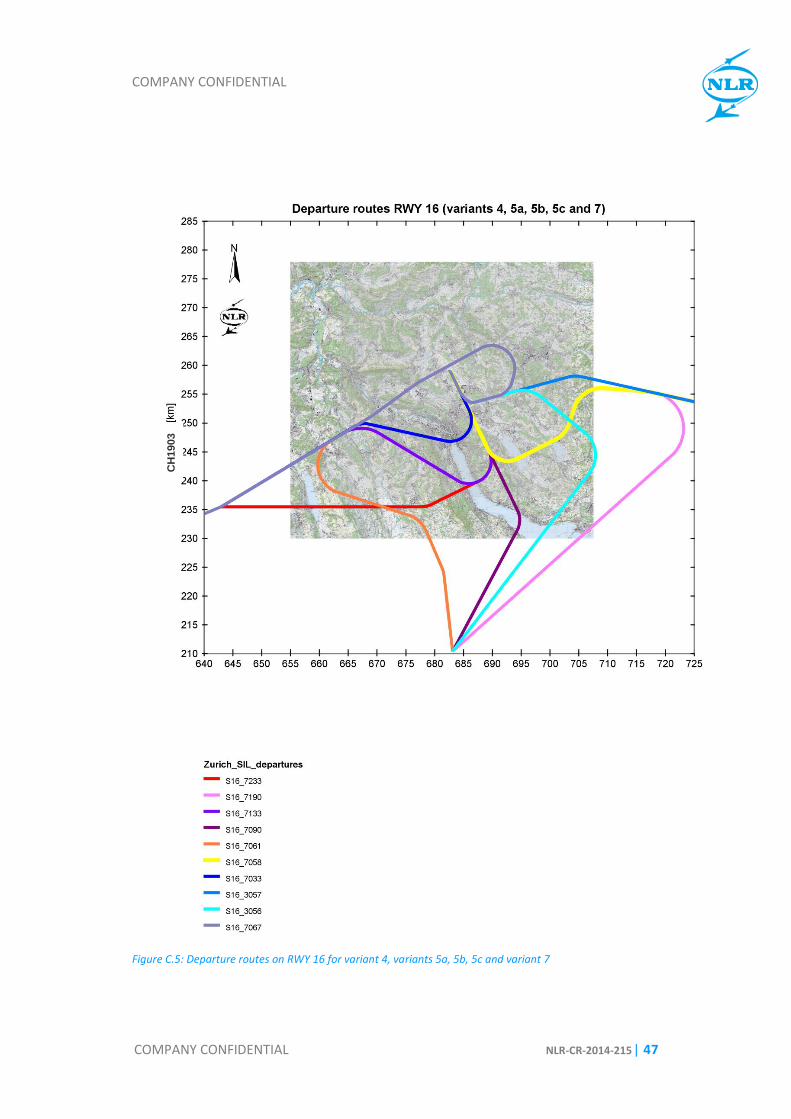
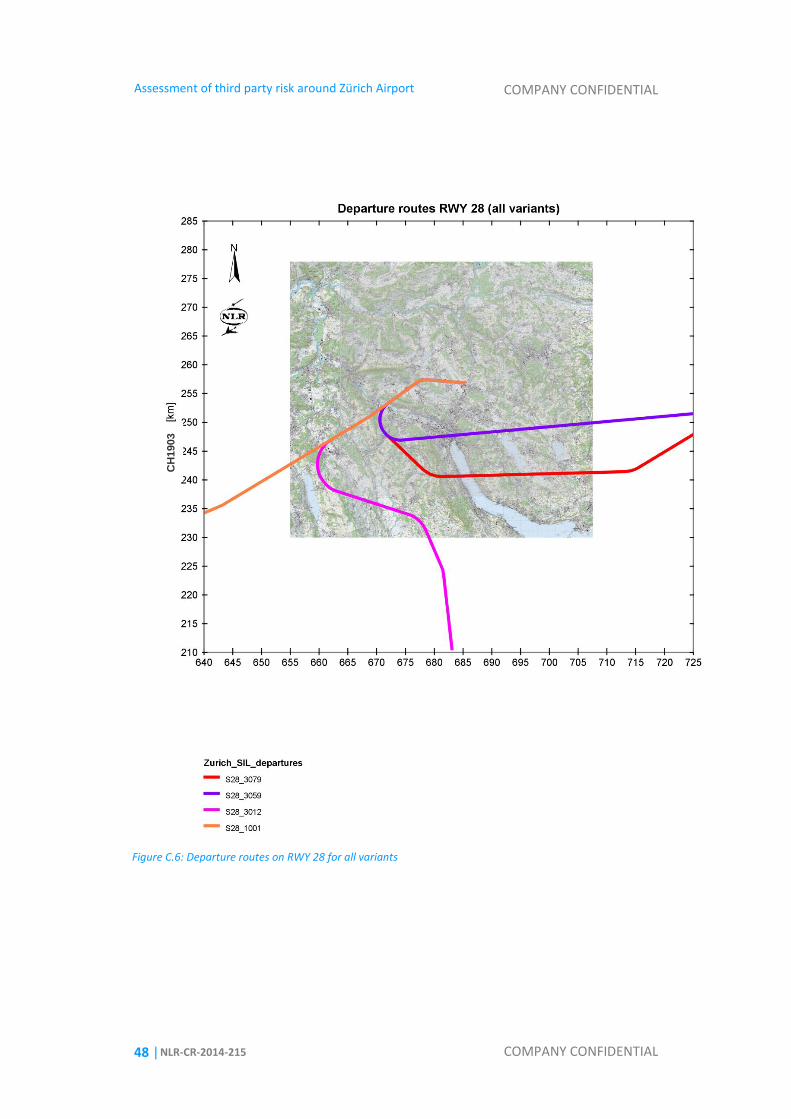
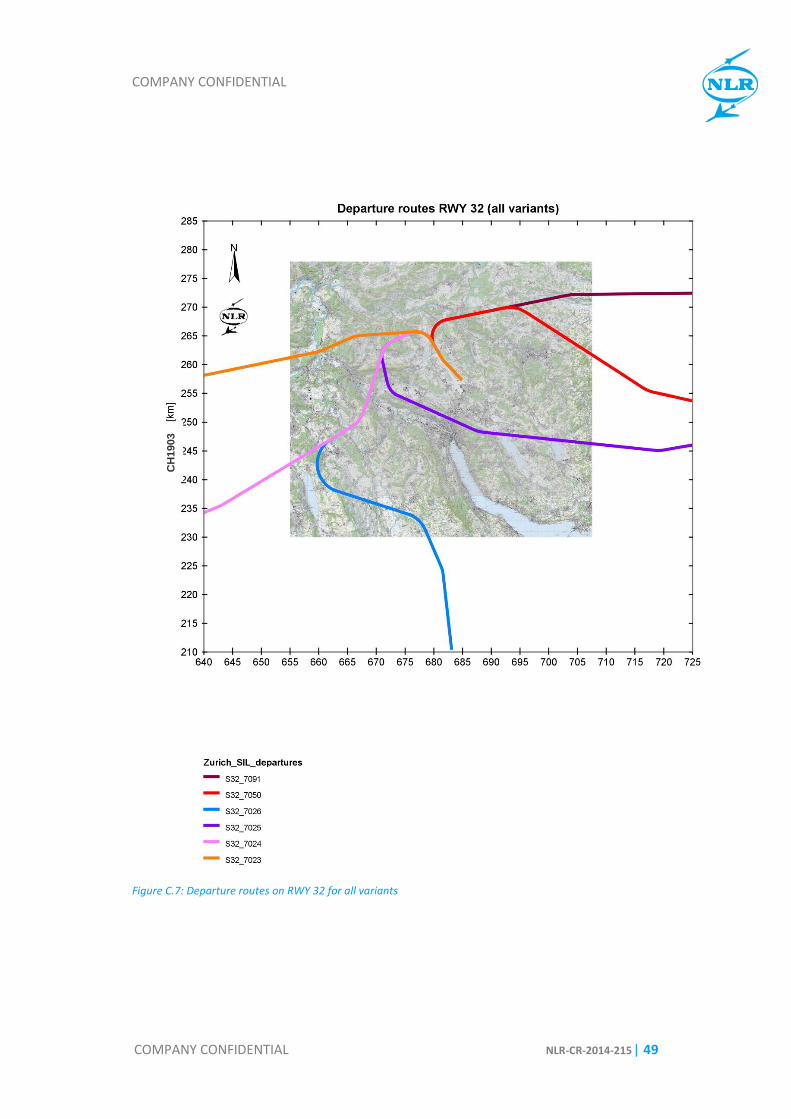
Appendix C 2BFigures of flight routes
This appendix present the figures of the flight routes as used in the risk calculations for the SIL
Zürich variants. The flight routes are presented on a larger area (85 by 75 sq.km) than the study
area (40 by 40 sq.km). The purpose of this presentation is to clearly show the direction that each
route for a departure and an arrival is following.
It is noteworthy that the map material available to NLR for presenting the figures is limited to a
smaller area (approximately the size of the study area).

COMPANY CONFIDENTIAL
COMPANY CONFIDENTIAL NLR-CR-2014-215 | 43
Figure C.1: Arrival routes for all variants
CH
1903
Assessment of third party risk around Zürich Airport
COMPANY CONFIDENTIAL
44 | NLR-CR-2014-215 COMPANY CONFIDENTIAL
Figure C.2: Departure routes on RWY 10 for variant 1 and variant 3
CH
1903
COMPANY CONFIDENTIAL
COMPANY CONFIDENTIAL NLR-CR-2014-215 | 45
Figure C.3: Departure routes on RWY 16 for variant 1 and variant 3
CH
1903

Assessment of third party risk around Zürich Airport
COMPANY CONFIDENTIAL
46 | NLR-CR-2014-215 COMPANY CONFIDENTIAL
Figure C.4: Departure routes on RWY 16 for variant 2 and variant 6
CH
1903
COMPANY CONFIDENTIAL
COMPANY CONFIDENTIAL NLR-CR-2014-215 | 47
Figure C.5: Departure routes on RWY 16 for variant 4, variants 5a, 5b, 5c and variant 7
CH
1903
Assessment of third party risk around Zürich Airport
COMPANY CONFIDENTIAL
48 | NLR-CR-2014-215 COMPANY CONFIDENTIAL
Figure C.6: Departure routes on RWY 28 for all variants
CH
1903
COMPANY CONFIDENTIAL
COMPANY CONFIDENTIAL NLR-CR-2014-215 | 49
Figure C.7: Departure routes on RWY 32 for all variants
CH
1903

Assessment of third party risk around Zürich Airport
COMPANY CONFIDENTIAL
50 | NLR-CR-2014-215 COMPANY CONFIDENTIAL
Figure C.8: Departure routes on RWY 34 for all variants
CH
1903

COMPANY CONFIDENTIAL
COMPANY CONFIDENTIAL NLR-CR-2014-215 | 51
Appendix D 3BList of aircraft types and MTOW
Table D.1: MTOWs for noise-representative aircraft types
Noise-representative A/C type Weighted MTOW (metric tonnes)
A3103 171.826
A319 68.046
A320 78.000
A321 94.000
A3302 236.929
A3403 570.079
A3406 380.000
B73F 78.992
B73S 69.971
B73V 61.000
B7473 187.220
B7474 427.323
B7572 116.000
B7672 179.000
B7673 187.000
B7772 304.011
CL65 18.672
E145 28.097
FK10 46.000
FK70 50.816
MD11 283.360
RJ100 41.200
TU54M 57.225
Assessment of third party risk around Zürich Airport
COMPANY CONFIDENTIAL
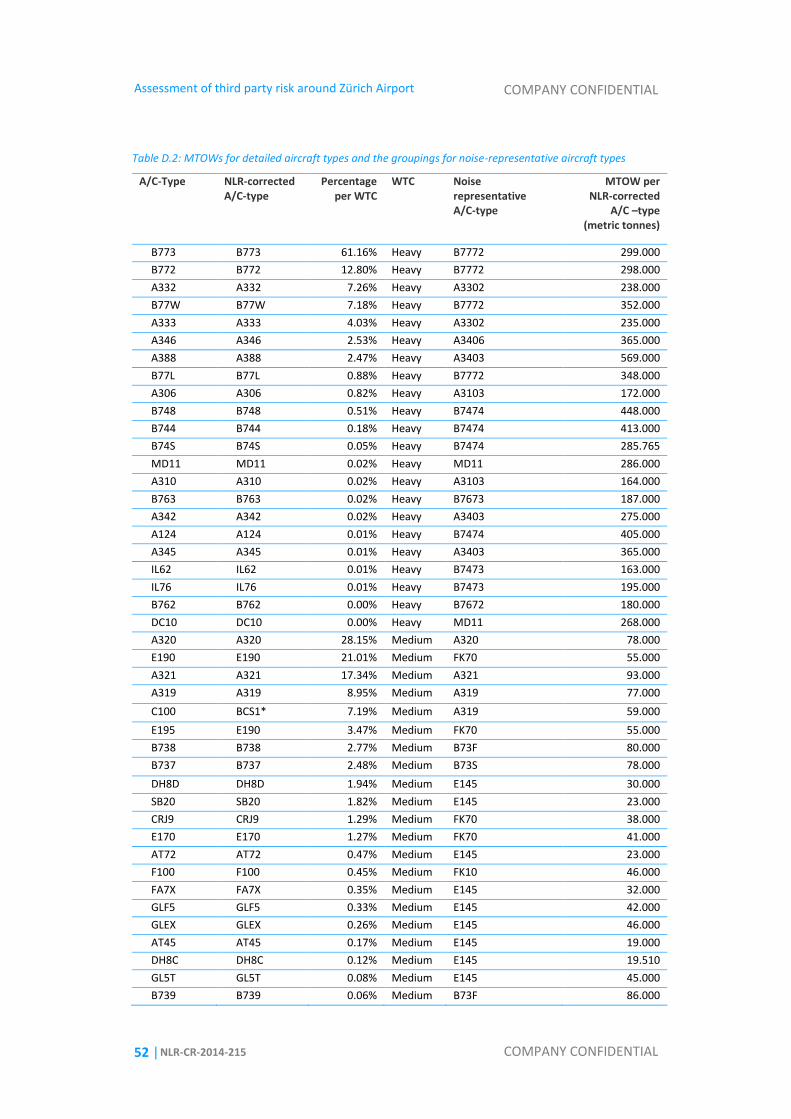
52 | NLR-CR-2014-215 COMPANY CONFIDENTIAL
Table D.2: MTOWs for detailed aircraft types and the groupings for noise-representative aircraft types
A/C-Type NLR-corrected A/C-type
Percentage per WTC
WTC Noise representative A/C-type
MTOW per NLR-corrected
A/C –type (metric tonnes)
B773 B773 61.16% Heavy B7772 299.000
B772 B772 12.80% Heavy B7772 298.000
A332 A332 7.26% Heavy A3302 238.000
B77W B77W 7.18% Heavy B7772 352.000
A333 A333 4.03% Heavy A3302 235.000
A346 A346 2.53% Heavy A3406 365.000
A388 A388 2.47% Heavy A3403 569.000
B77L B77L 0.88% Heavy B7772 348.000
A306 A306 0.82% Heavy A3103 172.000
B748 B748 0.51% Heavy B7474 448.000
B744 B744 0.18% Heavy B7474 413.000
B74S B74S 0.05% Heavy B7474 285.765
MD11 MD11 0.02% Heavy MD11 286.000
A310 A310 0.02% Heavy A3103 164.000
B763 B763 0.02% Heavy B7673 187.000
A342 A342 0.02% Heavy A3403 275.000
A124 A124 0.01% Heavy B7474 405.000
A345 A345 0.01% Heavy A3403 365.000
IL62 IL62 0.01% Heavy B7473 163.000
IL76 IL76 0.01% Heavy B7473 195.000
B762 B762 0.00% Heavy B7672 180.000
DC10 DC10 0.00% Heavy MD11 268.000
A320 A320 28.15% Medium A320 78.000
E190 E190 21.01% Medium FK70 55.000
A321 A321 17.34% Medium A321 93.000
A319 A319 8.95% Medium A319 77.000
C100 BCS1* 7.19% Medium A319 59.000
E195 E190 3.47% Medium FK70 55.000
B738 B738 2.77% Medium B73F 80.000
B737 B737 2.48% Medium B73S 78.000
DH8D DH8D 1.94% Medium E145 30.000
SB20 SB20 1.82% Medium E145 23.000
CRJ9 CRJ9 1.29% Medium FK70 38.000
E170 E170 1.27% Medium FK70 41.000
AT72 AT72 0.47% Medium E145 23.000
F100 F100 0.45% Medium FK10 46.000
FA7X FA7X 0.35% Medium E145 32.000
GLF5 GLF5 0.33% Medium E145 42.000
GLEX GLEX 0.26% Medium E145 46.000
AT45 AT45 0.17% Medium E145 19.000
DH8C DH8C 0.12% Medium E145 19.510
GL5T GL5T 0.08% Medium E145 45.000
B739 B739 0.06% Medium B73F 86.000
COMPANY CONFIDENTIAL
COMPANY CONFIDENTIAL NLR-CR-2014-215 | 53
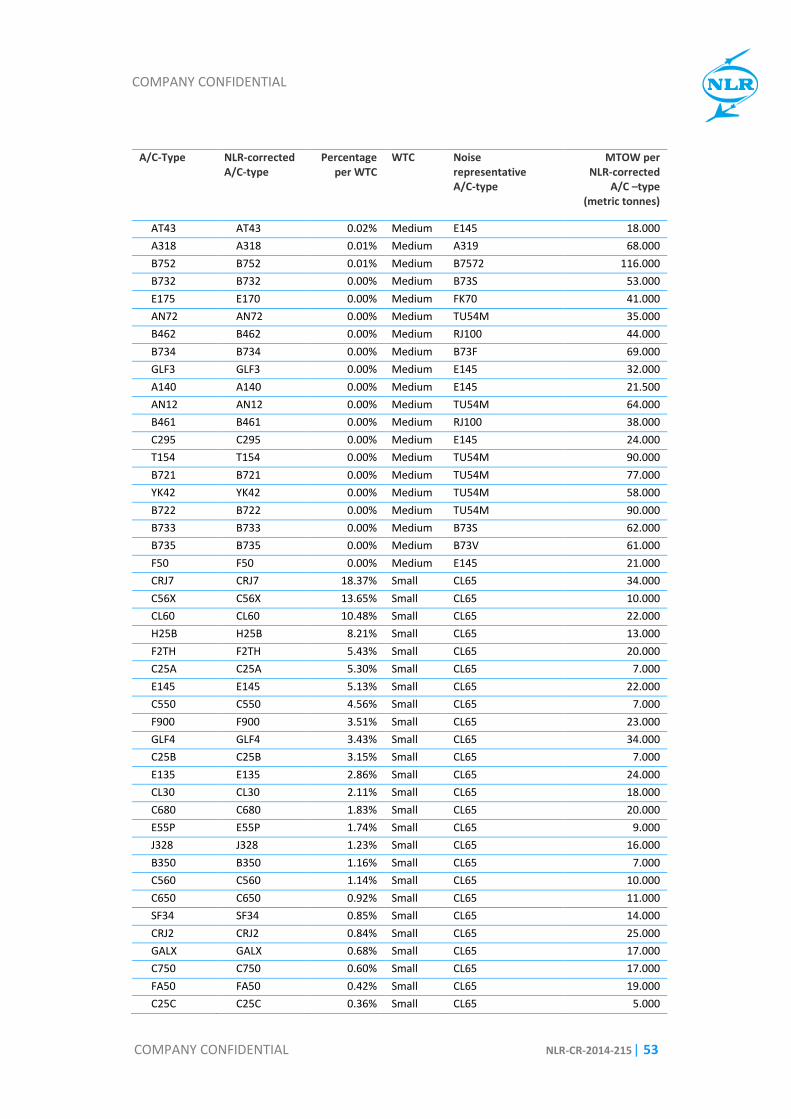
A/C-Type NLR-corrected A/C-type
Percentage per WTC
WTC Noise representative A/C-type
MTOW per NLR-corrected
A/C –type (metric tonnes)
AT43 AT43 0.02% Medium E145 18.000
A318 A318 0.01% Medium A319 68.000
B752 B752 0.01% Medium B7572 116.000
B732 B732 0.00% Medium B73S 53.000
E175 E170 0.00% Medium FK70 41.000
AN72 AN72 0.00% Medium TU54M 35.000
B462 B462 0.00% Medium RJ100 44.000
B734 B734 0.00% Medium B73F 69.000
GLF3 GLF3 0.00% Medium E145 32.000
A140 A140 0.00% Medium E145 21.500
AN12 AN12 0.00% Medium TU54M 64.000
B461 B461 0.00% Medium RJ100 38.000
C295 C295 0.00% Medium E145 24.000
T154 T154 0.00% Medium TU54M 90.000
B721 B721 0.00% Medium TU54M 77.000
YK42 YK42 0.00% Medium TU54M 58.000
B722 B722 0.00% Medium TU54M 90.000
B733 B733 0.00% Medium B73S 62.000
B735 B735 0.00% Medium B73V 61.000
F50 F50 0.00% Medium E145 21.000
CRJ7 CRJ7 18.37% Small CL65 34.000
C56X C56X 13.65% Small CL65 10.000
CL60 CL60 10.48% Small CL65 22.000
H25B H25B 8.21% Small CL65 13.000
F2TH F2TH 5.43% Small CL65 20.000
C25A C25A 5.30% Small CL65 7.000
E145 E145 5.13% Small CL65 22.000
C550 C550 4.56% Small CL65 7.000
F900 F900 3.51% Small CL65 23.000
GLF4 GLF4 3.43% Small CL65 34.000
C25B C25B 3.15% Small CL65 7.000
E135 E135 2.86% Small CL65 24.000
CL30 CL30 2.11% Small CL65 18.000
C680 C680 1.83% Small CL65 20.000
E55P E55P 1.74% Small CL65 9.000
J328 J328 1.23% Small CL65 16.000
B350 B350 1.16% Small CL65 7.000
C560 C560 1.14% Small CL65 10.000
C650 C650 0.92% Small CL65 11.000
SF34 SF34 0.85% Small CL65 14.000
CRJ2 CRJ2 0.84% Small CL65 25.000
GALX GALX 0.68% Small CL65 17.000
C750 C750 0.60% Small CL65 17.000
FA50 FA50 0.42% Small CL65 19.000
C25C C25C 0.36% Small CL65 5.000

Assessment of third party risk around Zürich Airport
COMPANY CONFIDENTIAL
54 | NLR-CR-2014-215 COMPANY CONFIDENTIAL
A/C-Type NLR-corrected A/C-type
Percentage per WTC
WTC Noise representative A/C-type
MTOW per NLR-corrected
A/C –type (metric tonnes)
HA4T HA4T 0.36% Small CL65 18.000
G150 G150 0.34% Small CL65 12.000
LJ40 LJ40 0.31% Small CL65 10.000
SW4 SW4 0.22% Small CL65 8.000
C551 C551 0.20% Small CL65 7.000
D328 D328 0.18% Small CL65 14.000
ASTR ASTR 0.10% Small CL65 12.000
H25C H25C 0.08% Small CL65 15.000
B190 B190 0.06% Small CL65 8.000
SW3 SW3 0.06% Small CL65 6.000
E120 E120 0.04% Small CL65 13.000
JS32 JS32 0.03% Small CL65 7.350
D228 D228 0.03% Small CL65 7.000
AC95 AC95 0.02% Small CL65 4.680
FA20 FA20 0.01% Small CL65 14.000
L29B L29B 0.01% Small CL65 19.051
*) The aircraft type is the new Bombardier CS 100.

COMPANY CONFIDENTIAL
COMPANY CONFIDENTIAL NLR-CR-2014-215 | 55
Appendix E 4BMovements per variant Table E.1: Number of departures per runway and per variant
RWY V1 V2 V3 V4 V5a V5b V5c V6 V7
10 6111 6111
14
16 28652 132837 28695 34859 34855 66304 36617 35183 23633
28 100220 2528 100220 100220 102195 72387 102195 102863 80150
32 33830 37092 33830 33830 34110 34110 34110 34800 61792
34 5205 6459 5205 5205 5244 5244 5244 5336 8633
Total 174018 178916 174061 174114 176404 178045 178166 178182 174208
Table E.2: Number of arrivals per runway and per variant
RWY V1 V2 V3 V4 V5a V5b V5c V6 V7
10
14 121401 124367 121401 121401 123926 123833 123926 125448 92202
16 2478 2538 2478 2478 2529 2527 2529 2560 1882
28 33661 34411 33661 33661 34639 34639 34639 34435 64116
32
34 16503 16849 16503 16503 16468 16468 16468 16521 16220
Total 174043 178165 174043 174043 177562 177467 177562 178964 174420
Assessment of third party risk around Zürich Airport
COMPANY CONFIDENTIAL
56 | NLR-CR-2014-215 COMPANY CONFIDENTIAL
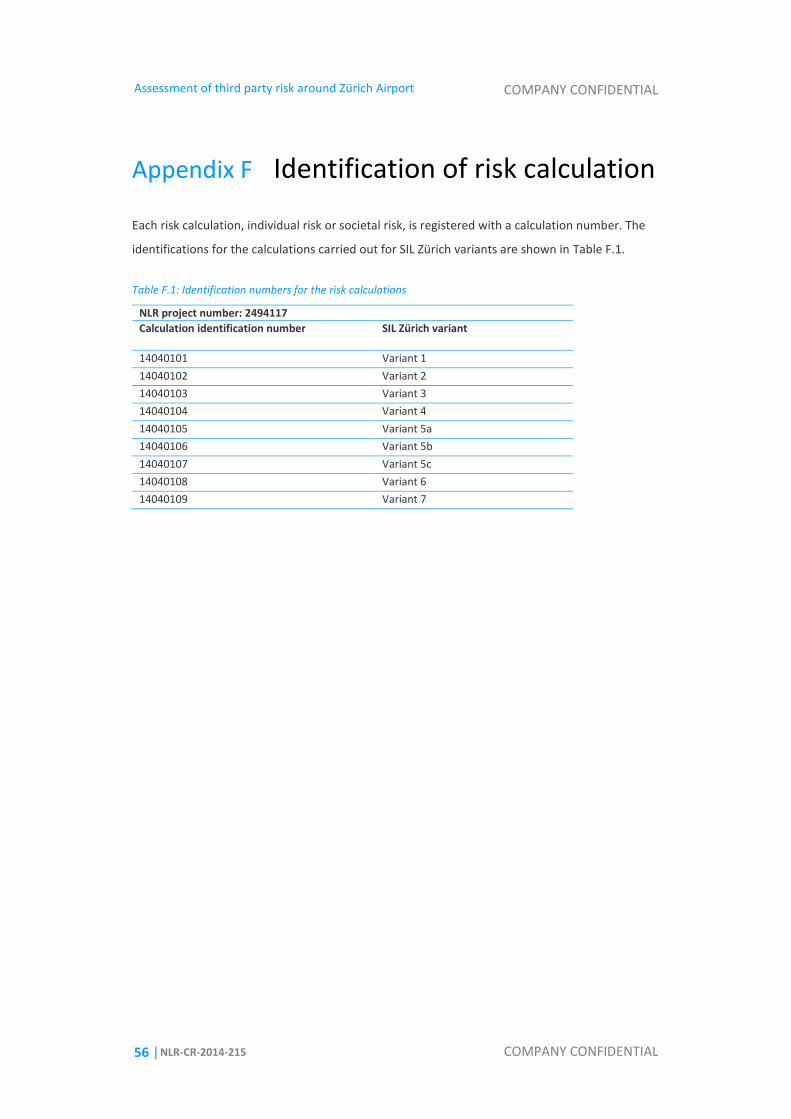
Appendix F 5BIdentification of risk calculation
Each risk calculation, individual risk or societal risk, is registered with a calculation number. The
identifications for the calculations carried out for SIL Zürich variants are shown in Table F.1.
Table F.1: Identification numbers for the risk calculations
NLR project number: 2494117
Calculation identification number
SIL Zürich variant
14040101 Variant 1
14040102 Variant 2
14040103 Variant 3
14040104 Variant 4
14040105 Variant 5a
14040106 Variant 5b
14040107 Variant 5c
14040108 Variant 6
14040109 Variant 7
W H A T I S N L R ?
The NLR i s a D utc h o rg an i s at io n th at i de n t i f i es , d ev e lop s a n d a p pl i es h i gh -t ech know l ed g e i n t he
aero s pac e sec tor . Th e NLR ’s ac t i v i t i es ar e soc ia l ly r e lev an t , m ar ke t -or i en ta te d , an d co n d uct ed
not- for - p rof i t . I n t h i s , th e NLR s erv e s to bo ls te r th e gove r nm en t ’s i n nova t iv e c apa b i l i t ie s , w h i l e
a lso p romot i ng t he i n nova t iv e a n d com p et i t iv e ca pa c i t ie s o f i t s p ar tn er com pa ni e s .
The NLR, renowned for its leading expert ise, professional approach and independent consultancy, is
staffed by c l ient-orientated personnel who are not only highly ski l led and educated, but al so
continuously strive to develop and improve their competencies. The NLR moreover possesses an
impressive array of high qual ity research faci l i t ies.