Assessment of the learning climate, basic psychological ...
120
Purdue University Purdue e-Pubs Open Access eses eses and Dissertations Spring 2015 Assessment of the learning climate, basic psychological needs and perceived knowledge transfer in an active classroom Sanjana Hemanth Purdue University Follow this and additional works at: hps://docs.lib.purdue.edu/open_access_theses Part of the Educational Psychology Commons is document has been made available through Purdue e-Pubs, a service of the Purdue University Libraries. Please contact [email protected] for additional information. Recommended Citation Hemanth, Sanjana, "Assessment of the learning climate, basic psychological needs and perceived knowledge transfer in an active classroom" (2015). Open Access eses. 505. hps://docs.lib.purdue.edu/open_access_theses/505
Transcript of Assessment of the learning climate, basic psychological ...
Purdue UniversityPurdue e-Pubs
Open Access Theses Theses and Dissertations
Spring 2015
Assessment of the learning climate, basicpsychological needs and perceived knowledgetransfer in an active classroomSanjana HemanthPurdue University
Follow this and additional works at: https://docs.lib.purdue.edu/open_access_theses
Part of the Educational Psychology Commons
This document has been made available through Purdue e-Pubs, a service of the Purdue University Libraries. Please contact [email protected] foradditional information.
Recommended CitationHemanth, Sanjana, "Assessment of the learning climate, basic psychological needs and perceived knowledge transfer in an activeclassroom" (2015). Open Access Theses. 505.https://docs.lib.purdue.edu/open_access_theses/505

Sanjana
Typewriter
in Building Construction Management
Sanjana
Typewriter


ASSESSMENT OF THE LEARNING CLIMATE, BASIC PSYCHOLOGICAL
NEEDS AND PERCEIVED KNOWLEDGE TRANSFER IN AN ACTIVE
CLASSROOM.
A Thesis
Submitted to the Faculty
of
Purdue University
by
Sanjana Hemanth
In Partial Fulfillment of the
Requirements for the Degree
of
Master of Science in Building Construction Management
May 2015
Purdue University
West Lafayette, Indiana
ii
To my late grandfather Dr. S. Ranganna for being my inspiration
To Hemanth, Mamatha and Skandaa to whom I owe everything
To Sushanth for being my pillar

iii
TABLE OF CONTENTS
Page
LIST OF TABLES .............................................................................................................. v LIST OF FIGURES .......................................................................................................... vii
ABSTRACT…………………………………………………………………………….viii
CHAPTER 1. INTRODUCTION ................................................................................. 1
1.1 Scope ......................................................................................................... 2
1.2 Research Question and Objectives of the Study ....................................... 5
1.3 Significance ............................................................................................... 5
1.4 Assumptions .............................................................................................. 6
1.5 Limitations ................................................................................................ 6
1.6 Delimitations ............................................................................................. 7
1.7 Definition of terms .................................................................................... 7
CHAPTER 2. LITERATURE REVIEW ...................................................................... 9
2.1 Learning models and the IMPACT program............................................. 9
2.2 Active Learning in the BCM 10001 course ............................................ 13
2.3 Survey Instrument ................................................................................... 15
2.4 History of Active Learning and Learning Climate.................................. 23
2.5 Self Determination Theory and Motivation ............................................ 26
2.6 Data Collection using Surveys ................................................................ 31
2.7 Summary ................................................................................................. 33
CHAPTER 3. METHODOLOGY .............................................................................. 34
3.1 Framework .............................................................................................. 34
3.2 Hypotheses .............................................................................................. 35
3.3 Population and Sample ............................................................................ 36
3.4 Reliability and Validity ........................................................................... 36
3.5 Data Collection ........................................................................................ 37

iv
Page
3.6 Data Analysis .......................................................................................... 39
CHAPTER 4. RESULTS AND ANALYSIS ............................................................. 46
4.1 Research Question 1 ................................................................................ 52
4.2 Research Question 2 ................................................................................ 63
4.3 Research Question 3 ................................................................................ 73
4.4 Summary ................................................................................................. 81
CHAPTER 5. DISCUSSIONS, CONCLUSIONS & RECOMMENDATIONS ........ 83
5.1 Discussion ............................................................................................... 83
5.2 Conclusions ............................................................................................. 88
5.3 Recommendations and Future Research ................................................. 91
REFERENCES……. ........................................................................................................ 95
APPENDICES
Appendix A Fall 2013 Survey ................................................................................... 102 Appendix B Fall 2014 and Spring 2014 Survey ........................................................ 104
Appendix C IRB Form............................................................................................... 107
v
LIST OF TABLES
Table Page
Table 1.1: Comparison between BCM 10001 in Fall 2013, Spring 2014 and Fall 2014.... 4
Table 2.1: Models of Learning.......................................................................................... 22
Table 2.2: Basic Psychological Needs .............................................................................. 28
Table 2.3: Various forms of motivation ............................................................................ 29
Table 3.1: Internal Consistency using Cronbach’s Alpha ................................................ 37
Table 3.2: Analysis methods used ..................................................................................... 45
Table 3.3: Analysis methods used ..................................................................................... 45
Table 4.1: Survey Respondent Statistics ........................................................................... 47
Table 4.2: Demographics by Major for Fall-2013, Spring2014 and Fall-2014 ................ 48
Table 4.3: One way ANOVA for pre-test vs post-survey in Fall 2013 ............................. 53
Table 4.4: One way ANOVA for pre-survey vs post-survey in Spring-2014 ................... 54
Table 4.5: One way ANOVA for pre-survey vs post-survey in Fall 2014 ....................... 54
Table 4.6: Descriptive Analysis for Learning Climate in Fall-2013 ................................. 55
Table 4.7: Descriptive Analysis for the Learning Climate in Spring-2014 ...................... 57
Table 4.8: Descriptive analysis for Learning Climate in Fall-2014 .................................. 59
Table 4.9: One way ANOVA test on Learning Climate of Fall-2013, Spring-2014 and
Fall-2014. .......................................................................................................................... 60
vi
Table Page
Table 4.10: Tukey Kramer Post-Hoc tests for Learning Climate ..................................... 61
Table 4.11: One way ANOVA for pre-survey vs post-survey in Fall 2013 ..................... 64
Table 4.12: One way ANOVA for pre-survey vs post-survey in Spring 2014 ................. 64
Table 4.13: One way ANOVA for Basic Psychological Needs in Fall-2014 ................... 64
Table 4.14: Basic Psychological Needs Fall-2013 ............................................................ 65
Table 4.15: Descriptive Analysis for Basic Psychological Needs for Spring 2014 .......... 67
Table 4.16: Descriptive Analysis for the Basic Psychological Needs in Fall-2014 ......... 69
Table 4.17: One way ANOVA comparing Basic Psychological Needs for Fall-2013,
Spring-2014 and Fall-2013 ............................................................................................... 70
Table 4.18: Tukey Kramer Post-Hoc tests for Basic Psychological Needs ...................... 71
Table 4.19: One way ANOVA for pre-survey vs post-survey in Fall 2013 ..................... 74
Table 4.20: One way ANOVA for pre-survey vs post-survey in Spring 2014 ................. 74
Table 4.21: One way ANOVA for pre-survey vs post-survey in Spring 2014 ................. 74
Table 4.22: Descriptive analysis for Perceived Knowledge Transfer in Fall-2013 .......... 76
Table 4.23: Descriptive analysis for Perceived Knowledge Transfer in Spring-2014 ...... 77
Table 4.24: Descriptive analysis for Perceived Knowledge Transfer in Fall-2014 .......... 79
Table 4.25: One way ANOVA tests on post-surveys of Fall-2013, Spring-2014 and Fall-
2014................................................................................................................................... 80
Table 4.26: Comparison of results……………………………………………………….82
vii
LIST OF FIGURES
Figure Page
Figure 2.1: BCM 10001 classroom for Fall 2013 and Fall 2014 ...................................... 12
Figure 2.2: BCM 10001 classroom for Spring 2014......................................................... 12
Figure 4.1: Demographics of Fall 2013, Spring 2014 and Fall 2014 by Class Standing . 48
Figure 4.2: Demographics by Majors for Fall-2013 ......................................................... 49
Figure 4.3: Demographics by Major for Spring-2014 ...................................................... 50
Figure 4.4: Demographics by Major for Fall-2014 ........................................................... 50
Figure 4.5. Comparison of average Learning Climate score ............................................ 62
Figure 4.6. Comparison of Average Basic Psychological Needs Score ........................... 72
Figure 4.7. Comparison of average Perceived Knowledge Transfer Score ...................... 80
Figure 5.1: Comparison between BCM 10001 and other courses associated with IMPACT
........................................................................................................................................... 91
viii
ABSTRACT
Hemanth, Sanjana. M.S.B.C.M., Purdue University, May 2015. Assessment of the
Learning Climate, Basic Psychological Needs and Perceived Knowledge Transfer in an
Active Classroom. Major Professor: Dr. Daphene Koch.
The thesis analyzes the impact of introducing active learning components by measuring
the learning climate, basic psychological needs and perceived knowledge transfer of one
course. This thesis has utilized the data obtained by the IMPACT team to evaluate the
learning climate of the classroom with the evolution of the course by measuring the
cognitive presence, learning presence and teaching presence in each of the semesters. The
results of this study show the impact of the different elements of active learning in a
classroom. The study of data over three semesters for one class is a model for other large
intake foundational courses to show the impact of infusing various active learning
elements into a course on its Learning Climate, Basic Psychological Needs and Perceived
Knowledge Transfer.

1
CHAPTER 1. INTRODUCTION
“Tell me and I forget. Teach me and I remember. Involve me and I learn.”
-Benjamin Franklin (Pargellis & Farrand, 1949)
“Why can’t learning be fun?” This statement has been made by many students at
some point in their academic lives. As a child I remember that I always wished my
classroom was similar to that of the children’s cartoon series The Magic School Bus that
aired on television. In one of the episodes, The Magic School Bus made learning Biology
fun for students by magically transporting the entire class into the immune system of a
sick student in order to watch how white blood cells react and fight off an infection. In
retrospect, it made me realize that games and activities are meant to be fun and engaging
but when applied in academics it can create a new approach towards learning is obtained.
A game of chess, for example is canonical problem solving exercise that sharpen
intellectual, strategizing and decision making abilities (Squire, 2008). History and
research are testimonies to the success of cognitive education through active learning
(Prince, 2004). This thesis analyzes the impact of introducing active learning components
by measuring the learning climate, basic psychological needs and perceived knowledge
transfer of one course. Various forms of active learning have proven to be front runners
of educational methods, by allowing the students to spend time-on-task, thereby
enhancing their knowledge (Linehan, Kirman, Lawson, Chan, & Lane, 2011).
2
Educational activities or serious games are structured in a way that allows a person to
think from different perspectives and sharpen one’s mental faculties in different areas
(Squire, 2008).
To improve higher education pedagogies, Instruction Matters – Purdue Academic
Course Transformations program (IMPACT) program was developed to assist faculty in
creating more engaging classrooms. The mission of the program is “to improve student
competency and confidence through redesign of foundational courses by using research
findings on a sound student-centered teaching and learning” (IMPACT Management &
IMPACT Assessment, 2014a). IMPACT was developed to assist with the redesign of
courses to include innovation, implementation and assessment which are critical to
success (Arthur & Zelda, 1987; Levesque-Bristol, Weaver, & Parker, 2012). The experts
leading this initiative created tools for assessment based on The Self Determination
Theory. This tool was used in all courses associated with IMPACT. A survey of students
enrolled in these courses associated with IMPACT was conducted in the beginning and
the end of each semester in order to collect data related to learning climate, psychological
needs and perceived knowledge transfer.
1.1 Scope
A large intake foundational course with the Department of Building Construction
Management (BCM) at Purdue University, West Lafayette was chosen for the study. This
is the BCM 10001 course on ‘Introduction to Construction Management’ which is an
overview of the construction industry. It includes the overall construction process,
through start-up of the complete facility, career opportunities in the construction industry,
3
an introduction to the materials and management systems and basic of the vocabulary of
the industry.
The BCM 10001 course was transformed during the fall of 2013. A team
comprising of Center for Instructional Excellence (CIE), Discovery Learning Research
Center (DLRC), Extended Campus, Information Technology at Purdue (iTaP) Teaching
and Learning, and the Purdue Libraries was formed by IMPACT to assist the instructor in
creating a more active classroom (IMPACT Management & IMPACT Assessment,
2014a). As with all IMPACT courses, data for the BCM 10001 was collected during the
pre-survey handed out during 2nd - 3rd week as well as the post-survey handed out
during the 13th - 14th weeks of the semester to assess the learning climate, basic
psychological needs and perceived knowledge transfer of the students in the class.
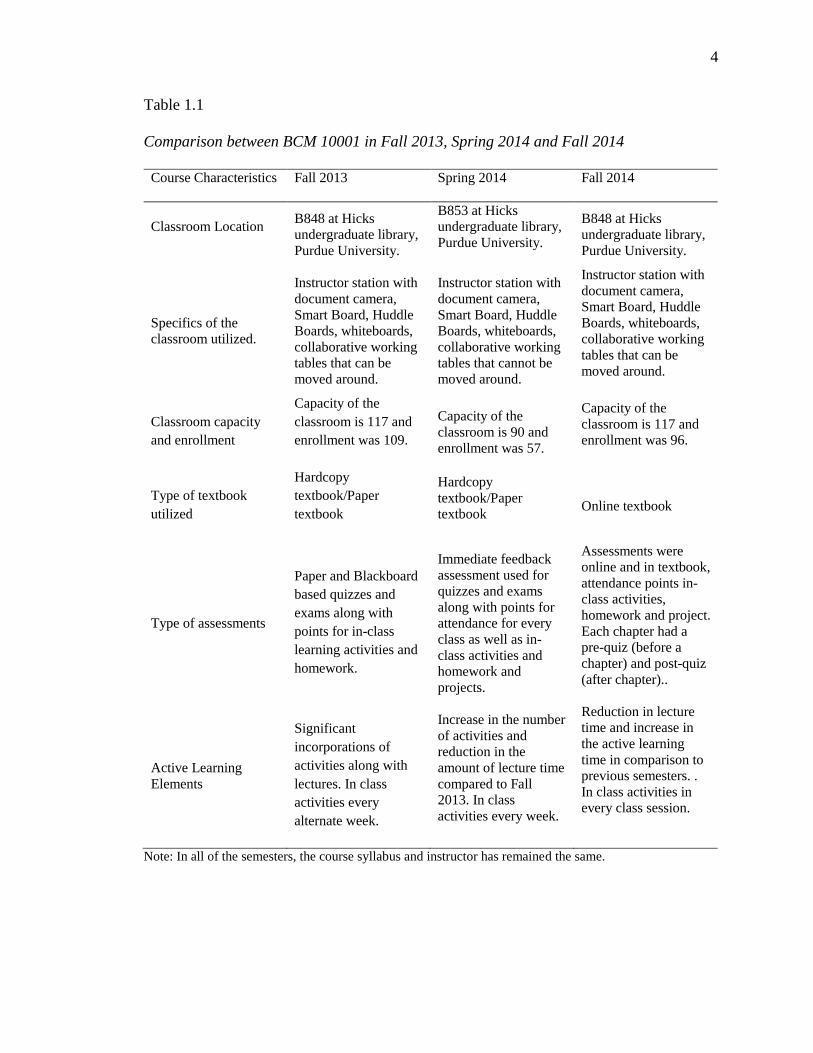
Utilizing the data that the IMPACT team collected over the semesters of Fall-2013,
Spring-2014 and Fall-2014, the thesis has observed the impact created by the
revolutionizing of teaching pedagogies on the chosen course whose classes take place at
John W. Hicks Undergraduate Library (Hicks). The data obtained by the researcher from
the IMPACT team is over three semesters namely Fall-2013, Spring-2014 and Fall-2014
with development of active learning in the classroom in each of the semesters as
illustrated in Table 1.1.
4
Table 1.1
Comparison between BCM 10001 in Fall 2013, Spring 2014 and Fall 2014
Course Characteristics Fall 2013 Spring 2014 Fall 2014
Classroom Location B848 at Hicks
undergraduate library,
Purdue University.
B853 at Hicks
undergraduate library,
Purdue University.
B848 at Hicks
undergraduate library,
Purdue University.
Specifics of the
classroom utilized.
Instructor station with
document camera,
Smart Board, Huddle
Boards, whiteboards,
collaborative working
tables that can be
moved around.
Instructor station with
document camera,
Smart Board, Huddle
Boards, whiteboards,
collaborative working
tables that cannot be
moved around.
Instructor station with
document camera,
Smart Board, Huddle
Boards, whiteboards,
collaborative working
tables that can be
moved around.
Classroom capacity
and enrollment
Capacity of the
classroom is 117 and
enrollment was 109.
Capacity of the
classroom is 90 and
enrollment was 57.
Capacity of the
classroom is 117 and
enrollment was 96.
Type of textbook
utilized
Hardcopy
textbook/Paper
textbook
Hardcopy
textbook/Paper
textbook
Online textbook
Type of assessments
Paper and Blackboard
based quizzes and
exams along with
points for in-class
learning activities and
homework.
Immediate feedback
assessment used for
quizzes and exams
along with points for
attendance for every
class as well as in-
class activities and
homework and
projects.
Assessments were
online and in textbook,
attendance points in-
class activities,
homework and project.
Each chapter had a
pre-quiz (before a
chapter) and post-quiz
(after chapter)..
Active Learning
Elements
Significant
incorporations of
activities along with
lectures. In class
activities every
alternate week.
Increase in the number
of activities and
reduction in the
amount of lecture time
compared to Fall
2013. In class
activities every week.
Reduction in lecture
time and increase in
the active learning
time in comparison to
previous semesters. .
In class activities in
every class session.
Note: In all of the semesters, the course syllabus and instructor has remained the same.
5
1.2 Research Question and Objectives of the Study
This thesis has utilized the data obtained by the IMPACT team to evaluate the
learning climate of the classroom with the evolution of the course by measuring the
cognitive presence, learning presence and teaching presence in each of the semesters;
thereby, paving the way for the research questions to be:
1. Is there a difference in the students’ perception of learning climate in
BCM 10001 comparing data from Fall-2013, Spring-2014 and Fall-
2014?
2. Is there a difference in the students’ perception of Basic Psychological
Needs in BCM 10001 comparing data from Fall-2013, Spring-2014
and Fall-2014?
3. Is there a difference in the students’ perception of knowledge transfer
in BCM 10001 comparing data from Fall-2013, Spring-2014 and Fall-
2014?
1.3 Significance
The results of this study will show the impact of the different elements of active
learning in a classroom. This study of data over three semesters for one class can be a
model for other large intake foundational courses to show the impact of infusing various
active learning elements into a course on its Learning Climate, Basic Psychological
Needs and Perceived Knowledge Transfer. Based on the results of the study, inference
can be made as to whether the active learning components can be applied to other classes.
6
1.4 Assumptions
The following assumptions are inherent to the pursuit of this study:
1. Only students registered in the course will be participating in the study.
2. There are no legal restrictions from the participating departments to allow
their students to participate in the study.
3. Students will be willing to participate in the study and the survey all through
the semester.
4. The students will answer all questions honestly and accurately to the best of
their knowledge and experience.
5. Findings from the students of a few semesters can be used to draw
conclusions about all the semesters.
1.5 Limitations
The following limitations are inherent to the pursuit of this study:
1. The study is driven by findings from surveys conducted by the IMPACT team and
is limited by time, instruments used by the IMPACT team and existing data.
2. The study is limited to one course that is offered once every semester.
3. The amount of data obtained is limited by the number of volunteers who are
willing to participate in the study.
4. The data encompassed is for 3 semesters namely Fall 2013, Spring 2014 and Fall
2014 and this is limited by the time frame available to the researcher.

7
5. The possibility of a survey encompassing a larger group of people is ruled out
keeping in mind the paucity of time and the number of students registered for the
course.
1.6 Delimitations
The following delimitations are inherent to the pursuit of this study:
1. The research will be conducted only on one course at Purdue University, West
Lafayette.
2. Volunteers in the study are undergraduate students and are enrolled in the chosen
BCM 10001 course.
1.7 Definition of terms
Active Learning: “Active learning is generally defined as any instructional
method that engages students in the learning process. In short, active learning requires
students to do meaningful learning activities and think about what they are
doing.”(Prince, 2004).
Learning Climate: Learning Climate refers to students’ perceptions of the student‐
centeredness of the learning environment (IMPACT Management Team & IMPACT
Assessment Team, 2014a).
Basic Psychological Need: This consists of three portion that is: The need for
autonomy which refers to students’ need to feel a sense of volition and self‐determination
in the course; the need for competence which refers to students’ need to feel capable in
mastering the learning activity in the course; the need for relatedness which refers to

8
students’ need to form meaningful interpersonal relationships with people in the course.
These components help determine the motivation levels and assess its Basic
Psychological Need (IMPACT Management Team & IMPACT Assessment Team,
2014a).
Perceived Knowledge Transfer: Reflection about the extent students perceive that
the information learned would transfer beyond the course (IMPACT Management Team
& IMPACT Assessment Team, 2014a).
Serious Games: Used synonymously with the term ‘activity’ and is defined as “A
serious game is a game in which education (in its various forms) is the primary goal,
rather than entertainment” (Marsh, 2011).
Faculty Learning Communities: “A cross-disciplinary faculty and staff group who
engage in an active, collaborative programs with a curriculum about enhancing teaching
and learning coupled with frequent seminars and activities that provide learning,
development, the scholarship of teaching, and community building” (Cox, 2004).
9
CHAPTER 2. LITERATURE REVIEW
The following chapter contains the review of the literature referenced during the
exploration of the stated research problem. The review of literature looks into history of
active learning, IMPACT team’s study and the Self Determination Theory. The chapter
also looks into the methods of data collection using survey and consists of the analysis of
findings. This chapter aims at providing clarity on the impending study of the chosen
subject.
2.1 Learning models and the IMPACT program
Instruction Matters: Purdue Academic Course Transformation (IMPACT) was
launched in December 2010 by the Provost’s Office. A large collaborative initiative, the
IMPACT program is an integrated campus-wide effort, involving multiple key partners
across campus including the President’s Office, Office of the Provost and Center for
Instructional Excellence (CIE) (IMPACT Management Team & IMPACT Assessment
Team, 2014a). The overarching goal of IMPACT is to achieve a greater student-centered
learning environment by incorporating active and collaborative learning, as well as other
student-centered teaching and learning practices and technologies, into large enrollment

10
foundational courses. Creating a student-centered learning environment will foster
student engagement and student competence, as well as increased attainment of course-
specific learning outcomes (IMPACT Management Team & IMPACT Assessment Team,
2014b). The IMPACT program leaders strive to measure effectiveness of the professional
development aspect, embedded support for course redesign and implementation, and the
classroom effect on pedagogical approaches used. The IMPACT team leaders redesign
courses in order to recognize the need of each participant while including innovation,
implementation, assessment, and institutionalization which are critical to success (Arthur
& Zelda,1987; Levesque-Bristol, Weaver, & Parker, 2012). It also looks into faculty-
focused principles, wherein the faculty are the drivers for curriculum change being
ultimately responsible for identifying the learning outcomes and providing the support
needed to focus student time and attention on learning, experimenting, and implementing
research-based changes in their classes (IMPACT Management Team & IMPACT
Assessment Team, 2014a; Levesque-Bristol et al., 2012). The courses developed by the
IMPACT team are delivered through the Faculty Learning Communities (FLCs) and
educational sessions throughout a semester. It also looks into the effect IMPACT courses
have on student success and retention along with the long-term results that occur due to
practices by faculty, departments, and institutions (Levesque-Bristol et al., 2012). The
principles on which the courses are redesigned look into where the faculty is at right now
along with how and what he/she is looking to accomplish based on the genre of students
taking the course. The re-design looks into faculty approach in the attainment of the set
goals, keeping in mind the set goals and outcomes (IMPACT Management Team &
IMPACT Assessment Team, 2014b; Levesque-Bristol et al., 2012). Currently, 120
11
courses have been redesigned by the IMPACT team at Purdue and the goal is maintain a
transformation rate of 60 courses per year (IMPACT Management Team & IMPACT
Assessment Team, 2014b).
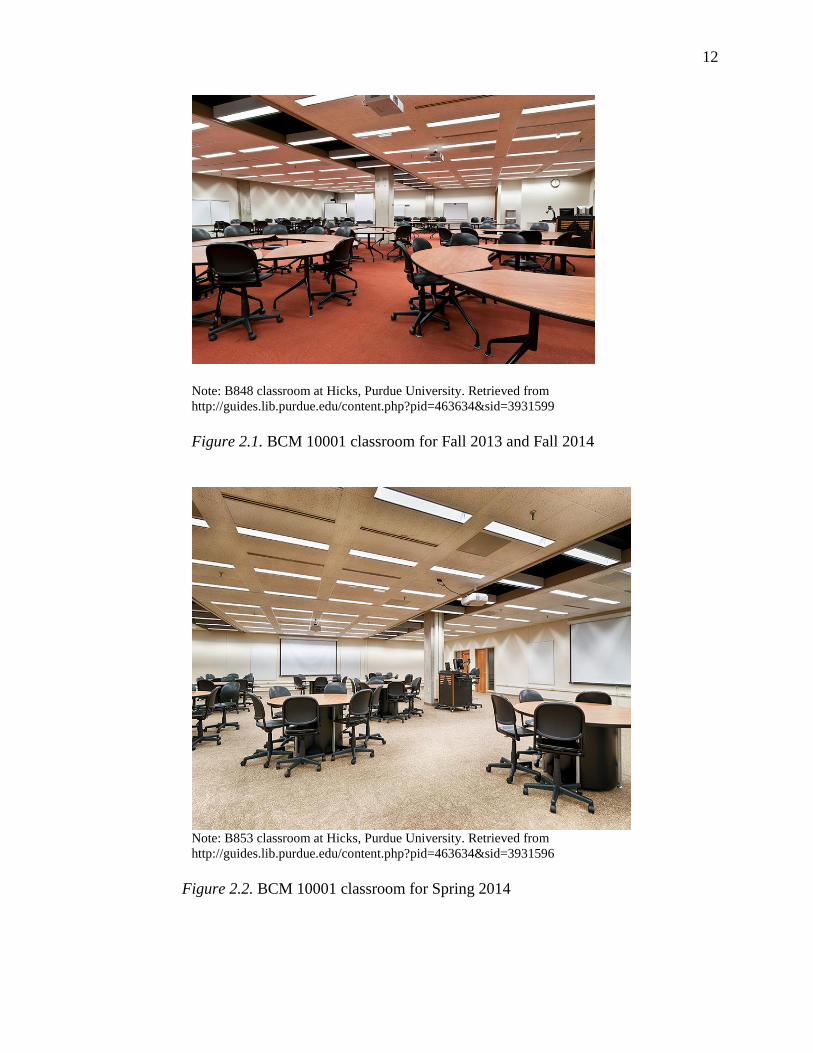
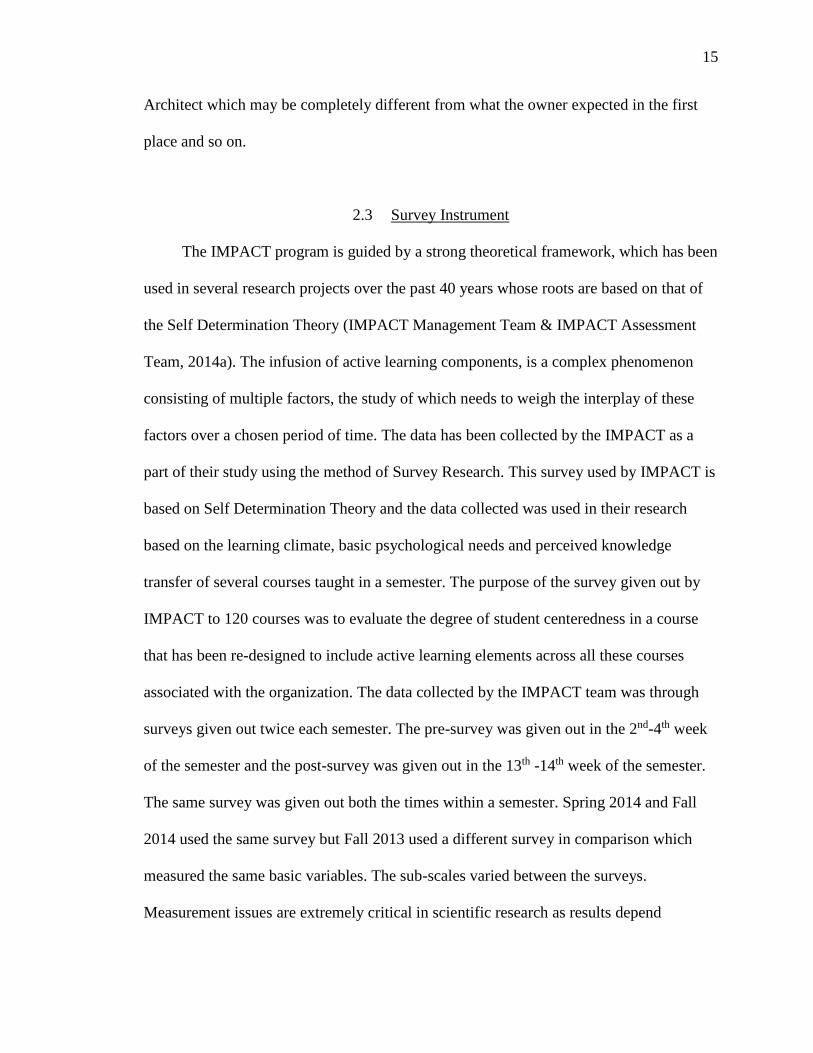
The classes for these courses are held in IMPACT classrooms located on the lower
level of Hicks at Purdue University. During Fall 2013 and Fall 2014, HICKS B848
(Figure 2.1) was used. During Spring 2014, the use of an active classroom was slightly
different the room HICKS B853 (Figure 2.2) was assigned. The rooms have all of the
same teacher resources, multiple projectors, document camera, multiple white boards and
group tables. The difference is that the room B848 has a capacity of 117 and the tables
and chairs are on wheels so they can be configured according to the assignment of the
day. Room B853 with a capacity of 90 is a larger area, but the tables are not movable so
the students are restricted by the number of tables and forced into larger groups.
The learnings studio formats are intended to enhance the innovative, interactive
sessions of the course (IMPACT Management Team & IMPACT Assessment Team,
2014a; Levesque-Bristol et al., 2012).
12
Note: B848 classroom at Hicks, Purdue University. Retrieved from
http://guides.lib.purdue.edu/content.php?pid=463634&sid=3931599
Figure 2.1. BCM 10001 classroom for Fall 2013 and Fall 2014
Note: B853 classroom at Hicks, Purdue University. Retrieved from
http://guides.lib.purdue.edu/content.php?pid=463634&sid=3931596
Figure 2.2. BCM 10001 classroom for Spring 2014

13
2.2 Active Learning in the BCM 10001 course
The BCM 10001 course saw a progression in the amount of active learning
elements infused each semester as well. The classes for BCM 10001 were held twice a
week in all the semesters from 12:00 PM to 1:15PM. In the Fall of 2013, active learning
components or activities were conducted every alternative week. Activities included the
Mock Career Fair which aimed to build confidence amongst the students while
approaching companies during a career fair. The mock career fair had representatives
from a few companies coming in and the classroom was set up to resemble a career fair.
The students had to dress appropriately and approach the companies exactly like how
they would at a career fair. Eventually, the company representatives gave the students
individual feedback on how the student could improve himself/herself for the actual
career fair. Some of the other activities included: The Marshmallow Challenge aimed at
encouraging team work, creative thinking and planning; in class estimating in order apply
concepts of cost analysis and estimation; a team based commercial project involving
ideating and solution finding and so on. In the Spring of 2014, the frequency of in-class
active learning activities increased to once a week. Along with the activities introduced in
Fall 2013, Spring 2014 saw the introduction of the Mini Design Project wherein students
had to work in teams to identify one design flaw within the infrastructure of the Purdue
University campus. After this identification, the students had to come up with a plan on
how to fix the design flaw thereby encouraging creative thinking as well helping students
apply the knowledge obtained. The other activities introduced were: Plan reading
assignment wherein the students were given actual construction plans for a building in
order to help them understand different components of the building are illustrated on a

14
plan; Peanut Butter and Jelly Sandwich Contest wherein students compete with each
other in groups to make a peanut butter and jelly sandwich judged based on the difference
between actual cost and time taken to make the sandwich vs the estimate and schedule
prepared prior by the students and so on. In Fall of 2014, active learning elements
became a component of every class. Along with the activities introduced in both Fall
2013 and Spring 2014, several new activities were introduced to the course. One such
activity was the Little Free Library Project wherein the course in partnered with the West
Lafayette Library on a service project related to the Little Free Library. The objective of
the project was to familiarize the students with the big picture of the construction industry
while applying their knowledge. The outcome of the project included designing the
project based on the location of the library picked by team, identifying options related to
green or sustainable materials that could be used as well the creation of an excel sheet
organized based on the CSI Master format, creation of a schedule and estimate for the
project, illustration of the model using any 3-D design software while emphasizing on
team work. At the end of the semester, the projects designs were collected by the West
Lafayette Public Library and voted upon in order to be implemented. Other activities
included were the radioactive golf ball activity whose objective is work within deadlines
with the activity comprising a limited timeframe within which students need to design
and construct a device that can move a golf ball from one bag to another without human
contact; The Architect-Builder-Owner activity whose objective is to understand the
importance of communication as the activity has an owner describing his requirement,
the architect designs the project based on his understanding of the owner and the Builder
constructs the project using paper craft materials based on his understanding of the
15
Architect which may be completely different from what the owner expected in the first
place and so on.
2.3 Survey Instrument
The IMPACT program is guided by a strong theoretical framework, which has been
used in several research projects over the past 40 years whose roots are based on that of
the Self Determination Theory (IMPACT Management Team & IMPACT Assessment
Team, 2014a). The infusion of active learning components, is a complex phenomenon
consisting of multiple factors, the study of which needs to weigh the interplay of these
factors over a chosen period of time. The data has been collected by the IMPACT as a
part of their study using the method of Survey Research. This survey used by IMPACT is
based on Self Determination Theory and the data collected was used in their research
based on the learning climate, basic psychological needs and perceived knowledge
transfer of several courses taught in a semester. The purpose of the survey given out by
IMPACT to 120 courses was to evaluate the degree of student centeredness in a course
that has been re-designed to include active learning elements across all these courses
associated with the organization. The data collected by the IMPACT team was through
surveys given out twice each semester. The pre-survey was given out in the 2nd-4th week
of the semester and the post-survey was given out in the 13th -14th week of the semester.
The same survey was given out both the times within a semester. Spring 2014 and Fall
2014 used the same survey but Fall 2013 used a different survey in comparison which
measured the same basic variables. The sub-scales varied between the surveys.
Measurement issues are extremely critical in scientific research as results depend
16
ultimately on the development of high quality measures that can assess the variable in
question with a degree of accuracy (Creswell, 2003). Social and psychological variables
are harder to assess as the variable of interest is not visible directly (Creswell, 2003).
Without accurate and consistent measurement, the statistical tabulation and quantitative
analysis of survey data would not make sense. Therefore, there was a need to validate and
check for internal consistency in order to measure the reliability of the survey
(Weissinger & Bandalos, 1995; Creswell, 2003).
(Morris et al., 2014) The surveys used by the IMPACT team in Fall 2013 are
based on the one used by Ryan and Deci in 1985, the pioneers of SDT in their research
which has been tested by Ryan and Deci and the IMPACT team for its validity by
running a pilot study. IMPACT measured the same variables as this thesis but to answer
different research questions pertaining to student perception amongst various active
learning courses. (Morris et al., 2014) In order to conduct a pilot study, the IMPACT
assessment team used trained observers who were mainly stuff and faculty at Purdue to
collect data as well as self-reported data using the Fall 2013 survey (Morris et al., 2014).
This study was conducted between September 2011 and November 2011 using 13
observers with 884 self-reported surveys and 72 classroom observations (Morris et al.,
2014). The observers were trained on what to look for. Data was then collected in
IMPACT classrooms by the observers and students self-reported data as well. The
IMPACT team collected both the data types in the same class in order to establish
concurrent validity of the survey (Morris et al., 2014). Both the observer data and self-
reported data were collected each week from a random sample (Morris et al., 2014). The

17
observer data and the self-report data were then compared to determine if the self-report
results of the Fall 2013 survey was a viable alternative to observation collection methods
(Morris et al., 2014). The Kaiser-Meyer-Olkin (KMO) test which is “measure of
sampling adequacy that test the partial correlations among factor variables” and a
Bartlett’s test which is “a measure of sphericity testing whether the correlation matrix is
an identity matrix were conducted on the data obtained” (Morris et al., 2014). The
KMO/Bartlett test showed the observer range of 0.616 to 0.804 (p=0.01) and the self-
reported range of 0.556 to 0.833 (p=0.01) among all the questions in the survey (Morris
et al., 2014). Based on these results, the IMPACT team found that the survey had face
validity and reflected the characteristics of learner- centered instruction (Morris et al.,
2014). A test for inter-rater reliability amongst the observers was conducted which
resulted in an intra-class correlation (ICC) of 0.726 for single measures and 0.995 for
averaged measures which confirmed that observers rated and reviewed courses the same
way (Morris et al., 2014). In order to show the concurrence between the observation data
and self-reported data, multiple dependence coefficients were computed using gamma,
Spearman, and Pearson correlation coefficients. Strong correlation was obtained due to
which it was concluded that self-reporting of data was a viable alternative to observation
(Morris et al., 2014). All correlations that were obtained by the IMPACT team in the Fall
2013 survey were statistically significant and answer the research questions posed by
them thereby reinforcing the construct validity of the data collection method (Morris et
al., 2014).
The survey used by the IMPACT team Spring 2014 and Fall 2014 are a direct
adaptation of Ryan and Deci’s Basic Psychological Needs Scale (work satisfaction scale),

18
Self Determination Scale and Learning Climate scale (6-item version). In order to
establish the reliability and validity of the Learning Climate scale, a pilot study was
conducted by Black, A. E., & Deci, E. L. on students taking a university introductory
course. The students were randomly assigned to a study groups (Black & Deci, 2000).
The Learning Climate Scale handed out to the students during two different class
meetings. During the first class meeting in which data was collected (T1), 289 responses
were obtained out of 380 students present at the time (Black & Deci, 2000). During the
second class meeting in which data was collected (T2), 137 responses were collected
from the students who responded during the first class as well. The studies showed
internal consistencies of 0.93 and 0.94 during T1 and T2 respectively (Black & Deci,
2000). The researchers also found that T1 and T2 scores were significantly correlated [r
(136) = 0.50, p < .0001] (Black & Deci, 2000).
In order to establish the reliability and validity of the Basic Psychological Needs
Scale, that consisted of the subscales of Autonomy, Relatedness and Competence as per
SDT, a study was conducted by Ilardi, Leone, Kasser & Ryan (1992) consisting of a
sample of employees at a shoe factory and found that the internal reliability score of .74
and this score correlated significantly with five of the subscales from the Job Description
Index a well-standardized measure of job satisfaction thereby proving the criterion
validity of the survey (Ilardi, Leone, Kasser, & Ryan, 1993; Smith, Kendall, & Hulin,
1969). Williams, Krusch, Papciak & Ryan (1992) used this survey in their research that
measured motivation to work in a sample of individuals with chronic back pain and
reported an internal consistency of 0.85 and the score correlated positively and
significantly with a measure of internally self-regulated reasons for returning to work (r
19
= .75, p < .01) and with the general self-esteem scale of the Multidimensional Self-
Esteem Inventory (r = .36, p < .05) thereby reinforcing the criterion validity (Ilardi,
Leone, Kasser, & Ryan, 1993; O'Brien & Epstein, 1988; Williams, Krusch, Papciak, &
Ryan, 1992). The self-determination scale had internal consistencies ranging between
0.85 to 0.93 in various samples measured by Sheldon, K. M., Ryan, R. M., & Reis, H
(1996). A test-retest reliability of 0.77 over an 8 week period was obtained as well. The
self-determination scale questions are generally in the same section as that of the Basic
Psychological Needs as one of its sub scales (Sheldon, Ryan & Reis, 1996).
It is important to note that although the Ryan and Deci’s Basic Psychological Needs
Scale (work satisfaction scale), Self Determination Scale and Learning Climate scale (6-
item version) were presented as is together in the Spring 2014 and Fall 2014 survey, no
tests were conducted by the IMPACT team itself to ascertain the validity of the
instrument. However, the IMPACT team did obtain statistically significant results both
the semesters.
In the redesigning of their classes, IMPACT faculty are introduced to the
following models: the supplemental model, the replacement Model (Including Hybrid
and Flipped) The Fully Online Model of Active Learning. The supplemental model is
defined as that which typically retains the basic structure of a traditional course but
supplements lectures and textbook readings with technology-based, online, out-of-class
activities. Some active learning strategies can also be integrated during the face-to-face
lectures (Ryan & Deci, 2000a). The supplemental model of a classroom is synonymous to
that of an active learning classroom. Today, just knowing ‘how’ is not sufficient to
remain competitive, but the application of tools and knowledge in new domains and

20
situations is essential. Industry specialists report that people at every organizational level
must be creative and flexible problem solvers (Prince, 2004). This calls for an
instructional method that engages students in the learning process, requiring them to
indulge in learning activities while giving them an opportunity to think about what they
are doing, paving the way for the concept of ‘Active Learning’. In practice, active
learning refers to activities that, instead of transferring knowledge to students, engage
students in a continuous collaborative process of building and reshaping understanding,
as a natural consequence of their experiences and authentic interactions with the world to
activities that are introduced into the classroom (Grabinger & Dunlap, 1995; Prince,
2004).
The replacement model of learning slightly differs from that of the supplemental
model, as instructor-created video lectures or other videos and interactive lessons are
reviewed by students before class. It is a step ahead of the supplemental model wherein
some face-to-face class time can be eliminated and replaced by out-of-class, online, and
interactive learning activities (IMPACT Management Team & IMPACT Assessment
Team, 2014a; Levesque-Bristol et al., 2012; Perry & Pilati, 2011). This form of learning
is synonymous to that of ‘collaborative learning’. As Stewart (1988) says,
philosophically, the collaborative classroom can be described as a critique of the teacher-
centered classroom. In the latter, authority is vested in a teacher who disseminates
knowledge to students. Class time is mostly used for working through problems and
collaborative learning (Stewart, 1988). The students work together in small groups
toward a common goal and the activity is a joint problem solving experience. Learning is
expected to occur as a side-effect of problem solving, measured by the elicitation of new

21
knowledge or by the improvement of cognitive learning performance (Bruffee, 1984;
Stewart, 1988). Bruffee (1984) traces the history of this model of learning to have
originated in the 1950s and 1960s by a group of British secondary school teachers and
also by a biologist studying British post-graduate medical education. It is said that in the
American colleges, the roots of collaborative learning lie in the awareness of faculty and
administrators had in the early 1970s about the difficulty students entering college faced.
Students had difficulty doing as well in academic studies as their native ability suggested
they should be able to do. The difficulty was then attributed to the fact that all the
students seemed to have difficulty adapting to the traditional or "normal" conventions of
the college classroom (Bruffee, 1984). From Mason (1970) comes the term collaborative
learning, the insight that traditional learning fostered a destructive competitiveness rather
than cooperation, and the practice of ‘indirect’ teaching in which the teacher sets the
problem and organizes students to work it out collaboratively (Dillenbourg, 1999; Mason,
1970).
The ‘flipped classroom model’ is based on fully replacement model; wherein,
what is traditionally done in class and as homework is switched or flipped. For example,
instead of students listening to a lecture in class and then going home to work on an
assignment, they read material and view videos on the assigned chapter before coming to
class and then engage in active learning strategies such as debates on current issues
during class (Gilboy, Heinerichs, Pazzaglia, & Chester, 2014). Over 20 years ago, King
(1993) in his research, encouraged faculty to move from being a ‘‘sage on the stage’’ to
more of a ‘‘guide on the side’’ in their teaching approaches. A sage on the stage refers to
an instructor who imparts knowledge on the student through lecture alone, whereas is a
22
guide on the side provides students with assistance and correction to explore the content
independently or within a group (King, 1993; Mazzolini & Maddison, 2003). The flipped
classroom type of instruction enables the professor to be with students when they are
engaging in higher levels of Bloom's taxonomy, such as application, analysis, and
synthesis (Mazzolini & Maddison, 2003).
The fully online model eliminates all in-class meetings and moves all learning
experiences online, using Web-based, multi-media resources, commercial software, or
automatically evaluated assessments with guided feedback and alternative staffing
models (IMPACT Management Team & IMPACT Assessment Team, 2014b; Levesque-
Bristol et al., 2012). The fully online model is generally implemented as teaching tool for
distance education courses. Online learning has become entrenched in today’s scenario
and is only expected to grow during the coming years with the advent of technology
(Perry & Pilati, 2011). IMPACT does support courses implementing these models as a
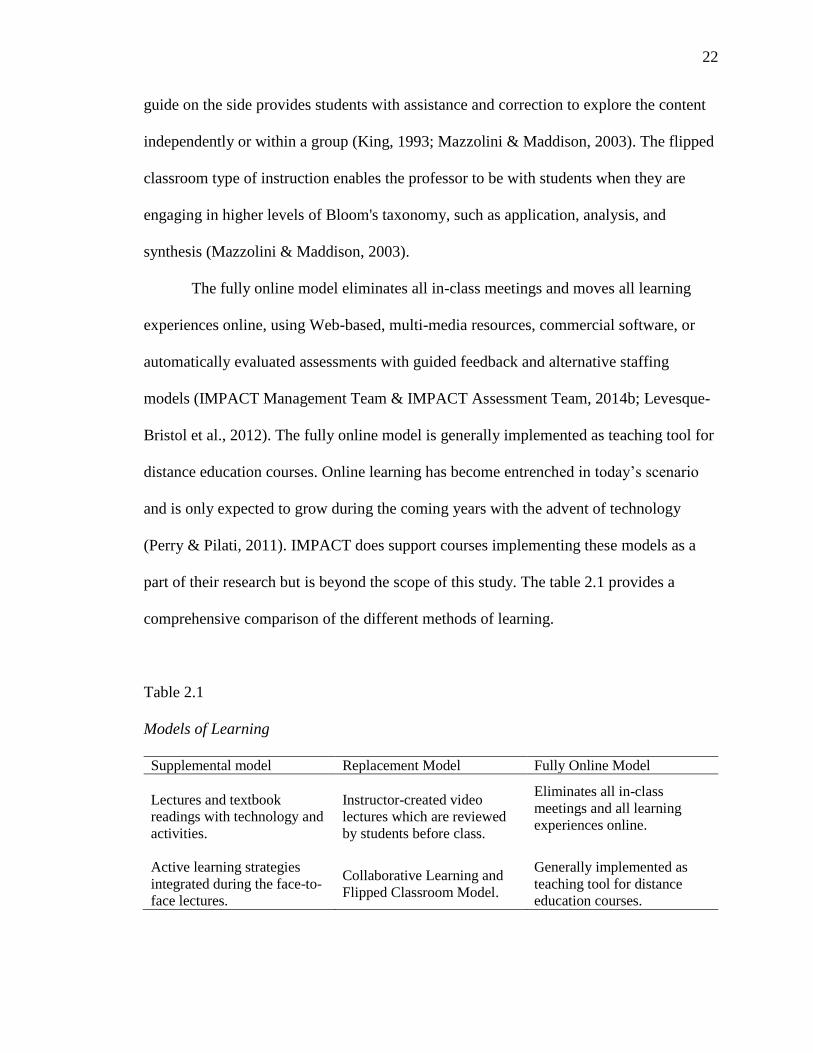
part of their research but is beyond the scope of this study. The table 2.1 provides a
comprehensive comparison of the different methods of learning.
Table 2.1
Models of Learning
Supplemental model Replacement Model Fully Online Model
Lectures and textbook
readings with technology and
activities.
Instructor-created video
lectures which are reviewed
by students before class.
Eliminates all in-class
meetings and all learning
experiences online.
Active learning strategies
integrated during the face-to-
face lectures.
Collaborative Learning and
Flipped Classroom Model.
Generally implemented as
teaching tool for distance
education courses.
23
2.4 History of Active Learning and Learning Climate
According to Garrison, Anderson, & Archer (2001), the balance of three core
elements; cognitive presence, social presence, and teaching presence is absolutely
essential for efficacious higher education. Cognitive presence refers to the limit to which
learners are able to construct meaning and critical thinking through sustained
communication. Social presence refers to the ability of individuals to project their
personal characteristics into the community while teaching presence, in an educational
environment, is performed mainly by the instructor (Garrison, Anderson, & Archer,
2001). An evaluation of the impact of a course hence involves examining the
aforementioned indicators. The cognitive, social and teaching presence together
constitute the ‘learning climate’ of a class (Ke, 2010).The most common form of
cognitive learning, which ties in with the concept of active learning, are games. The term
‘Serious Game’ appears to be juxtaposed phrase with both the terms contradicting each
other. ‘Serious’ is said to represent the purpose of the game/activity without having any
bearing over its content (Michael & Chen, 2005; Susi, Johannesson, & Backlund, 2007).
These types of activities or games bring in a whole new dimension to learning, allowing
it to be an effective teaching or learning tool in vast areas such as healthcare, military,
education, productivity etc.
Looking back as far as the stone age, there have been documentations from the
Roman Empire era, of sand tables and icons being used for allowing leaders to strategize
exactly like the way they would on a battlefield, allowing them to visualize and critically
analyze their own ideas while pitting them against someone else as a learning activity
(Smith, 2009; Weiner & Milton, 1959). Some mythologies too, like the Indian holy book
24
of ‘Mahabharata’ talks about ‘Pachisi’, a game that provided insights and strategies on
the nuances of various subjects like gambling and military planning and also be used in
today’s supply chain management (Gohn, 2012; Wu & Choi, 2013). The cognitive
learning through these activities was in a relaxed atmosphere (social presence) without
any pressure. A couple hundred years later, in the paper age, there have been evidences of
strategic board games emerging in the Middle East, Europe and Asia. The game of
‘WeiHai’ dated back to 3000 BCE, was a meant to teach a person about how to gain
territorial advantage. This activity used ‘tokens’ that player could manipulate to expand
his territory thereby sharpening a leader’s political strategizing skills and is said to be
basis of the modern game ‘GO’ (Smith, 2009). Chess is said to have been originated from
the Indian game of ‘Chaturanga’, conceptualized for the purposes of military training in
the Chandragupta Maurya era of the Indian history, dated around 500 BC. It was a two to
four player activity played on a board that included the military equipment available at
that point in time (By, 2011; Smith, 2009). The 13th - 14th century saw the creation of
‘Koenigspiel’ or the "King's Game" by Christopher Weikhmann of Ulam, Germany
which was a predecessor of today’s chess with clear hierarchal power distribution for the
pieces used. In the 17th and 18th century, games like ‘War Chess’ and ‘Kriegsspiels’, each
of which furthered the detail and structure of the activity (Smith, 1995, 2009, 2014). By
the 19th century, active learning was being used in some colleges, governmental
organizations for various purposes. Prior to the Pearl Harbor bombing, the Japanese used
this tool to train their arsenal for the impending attack (Smith, 2009). Politics,
strategizing and war-fare were the major focus of serious gaming activities and history
has once again proven that active learning is an effective tool for cognitive learning.
25
In the 20th Century, John Dewey who is considered to the father of modern-day
active learning recognized several forms of active learning and their effect on cognitive
presence, social presence and teaching presence (Dewey, 1916, 1985; Giles & Eyler,
1994). John Dewey (1916) is the source of the idea that there is an organic connection
between experience and education and the recognition that one simply couldn't do away
with authority in the classroom: it had to be relocated. He recognized that active learning
strategies increase the student engagement in the learning process leaving them more
satisfied with their learning experience. He encouraged the use of electronic and
interactive media in learning, learning through activities, collaborative learning and
problem based learning while recognizing the importance of learning climate of a
classroom (Bringle & Hatcher, 1999; Dewey, 1916, 1985). There are several factors that
influence the learning climate of the classroom – the primary factors being the
instructor’s attitude and patterns and the response by the students. The design and the
orientation of the classroom space is yet another factor that plays a key role in the
learning climate (Bringle & Hatcher, 2011; Hager, 1974). A teacher, regardless of his/her
standing, conducts a class in a manner he/she is most comfortable with thereby
establishing a certain type of pattern (Baldwin, 2009). This pattern leads a course to
predominantly be that of a traditional lecture or a discussion. The students adjust to this
pattern set by the faculty and their response coincides with this pattern, leading them to
respond differently to different instructors (Goertz, Olah, & Riggan, 2009). This
combination of instructional pattern combined with student behavior leads to a specific
classroom environment which we call the ‘learning climate’ (Hager, 1974). Other than
these factors, the content of the course, the necessity to use one’s cognitive and emotional

26
resources, social, and spatial situations created in the classroom also play a significant
role in its climate (Arndt, 2012).
2.5 Self Determination Theory and Motivation
The climate for undergraduate Science, Technology, Engineering and
Mathematics (STEM) education is a collaborative effort at many levels. The arrival and
proliferation of electronic resources and digital libraries have already influenced and
changed the way students and scholars use print resources and traditional libraries
(Baldwin, 2009; Liu, 2006). A number of factors suggest that Self Determination Theory
(SDT) is an appropriate frame-work for addressing motivation in the online learning
environment. First, SDT may serve as a theoretical framework that integrates issues in
online learning (Chen & Jang, 2010; Ciani, Sheldon, Hilpert, & Easter, 2011). SDT
addresses autonomy, relatedness, and competency as determinants of motivation. The
three constructs correspond to features of online learning such as flexible learning
(Moore, 1993), computer-mediated communication and social interaction (Gunawardena,
1995), and challenges for learning technical skills (Howland & Moore, 2010). The notion
of contextual support is especially valuable, as online learners need a variety of support
from instructors, peers, administrators, and technical support personnel (Mills, 2003;
Tait, 2000, 2004). Past experimental research indicates that self-determination theory
predicts a variety of learning outcomes, including performance, persistence, and course
satisfaction (Ryan & Deci, 2000b). Self-determination theory has the potential to address
learning problems such as student attrition in the active learning environment (Chen &
Jang, 2010). As Neimiec and Ryan (2009) stated in their research:

27
Self-determination theory (SDT) assumes that inherent in human nature is
the propensity to be curious about one’s environment and interested in
learning and developing one’s knowledge. All too often, however,
educators introduce external controls into learning climates, which can
undermine the sense of relatedness between teachers and students, and stifle
the natural, volitional processes involved in high-quality learning (Niemiec
& Ryan, 2009).
SDT takes into interest the factors that help student success grow by
understanding theories of motivation, emotion and student development. SDT is of great
importance in the domain of education, in which students’ natural tendencies to learn
represent the greatest resource educators can tap. This is also a domain in which external
factors are imposed in order to facilitate student learning. The external factors introduced
in the class are that of the components of active learning including the introduction of an
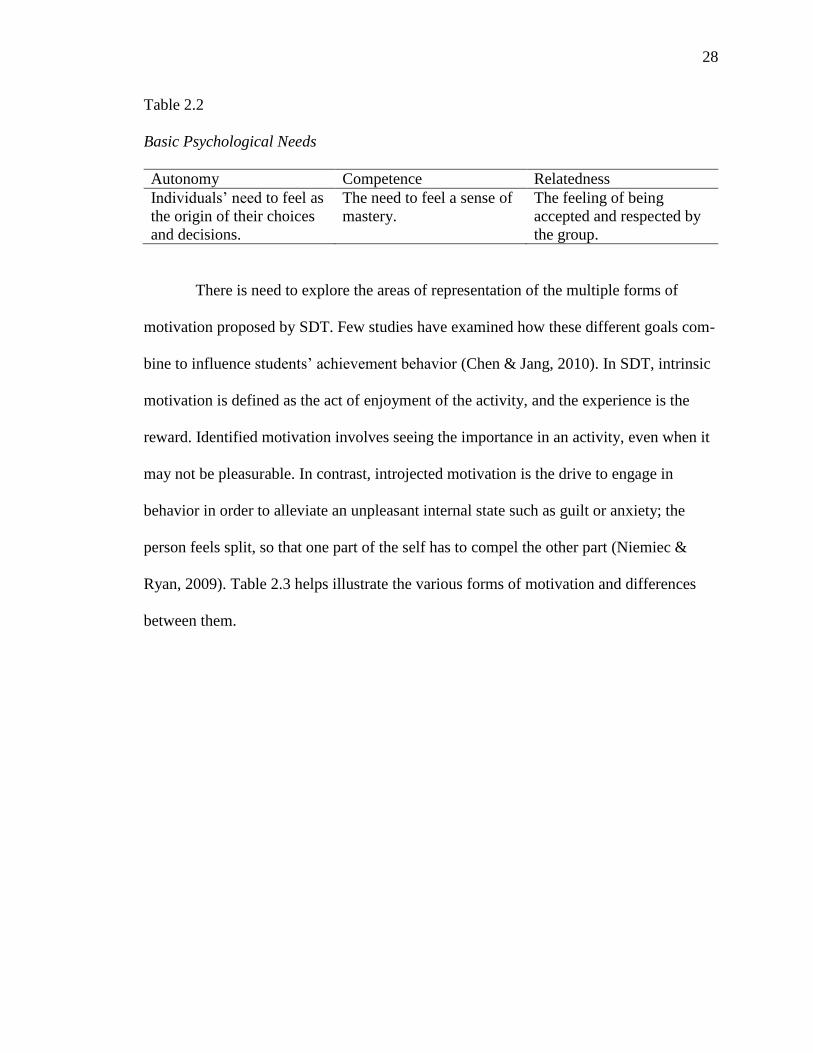
online textbook (Niemiec & Ryan, 2009). SDT describes three innate basic psychological
needs namely the need for autonomy, competence, and relatedness (Ryan & Deci, 2000a,
2000b). The authors defined the need for autonomy as the individuals’ need to feel as the
origin of their choices and decisions, the need for competence as the need to feel a sense
of mastery, and the need for relatedness – the feeling of being accepted and respected by
the group. According to SDT, a person is said to be motivated when the psychological
needs have been met, which is when they have the feeling of being autonomous,
competent, and related in life. In this case, students have the inner resources needed to
fully engage with the classroom (Ryan, Connell, & Deci, 1985).
28
Table 2.2
Basic Psychological Needs
Autonomy Competence Relatedness
Individuals’ need to feel as
the origin of their choices
and decisions.
The need to feel a sense of
mastery.
The feeling of being
accepted and respected by
the group.
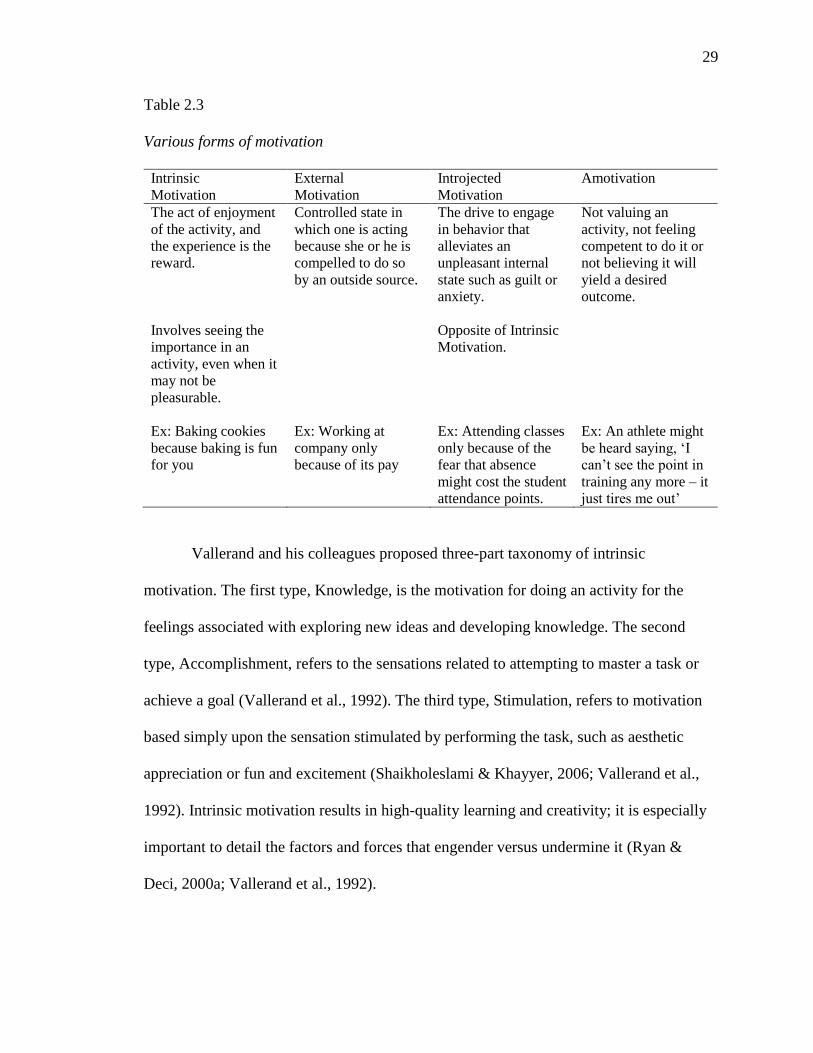
There is need to explore the areas of representation of the multiple forms of
motivation proposed by SDT. Few studies have examined how these different goals com-
bine to influence students’ achievement behavior (Chen & Jang, 2010). In SDT, intrinsic
motivation is defined as the act of enjoyment of the activity, and the experience is the
reward. Identified motivation involves seeing the importance in an activity, even when it
may not be pleasurable. In contrast, introjected motivation is the drive to engage in
behavior in order to alleviate an unpleasant internal state such as guilt or anxiety; the
person feels split, so that one part of the self has to compel the other part (Niemiec &
Ryan, 2009). Table 2.3 helps illustrate the various forms of motivation and differences
between them.
29
Table 2.3
Various forms of motivation
Intrinsic
Motivation
External
Motivation
Introjected
Motivation
Amotivation
The act of enjoyment
of the activity, and
the experience is the
reward.
Controlled state in
which one is acting
because she or he is
compelled to do so
by an outside source.
The drive to engage
in behavior that
alleviates an
unpleasant internal
state such as guilt or
anxiety.
Not valuing an
activity, not feeling
competent to do it or
not believing it will
yield a desired
outcome.
Involves seeing the
importance in an
activity, even when it
may not be
pleasurable.
Opposite of Intrinsic
Motivation.
Ex: Baking cookies
because baking is fun
for you
Ex: Working at
company only
because of its pay
Ex: Attending classes
only because of the
fear that absence
might cost the student
attendance points.
Ex: An athlete might
be heard saying, ‘I
can’t see the point in
training any more – it
just tires me out’
Vallerand and his colleagues proposed three-part taxonomy of intrinsic
motivation. The first type, Knowledge, is the motivation for doing an activity for the
feelings associated with exploring new ideas and developing knowledge. The second
type, Accomplishment, refers to the sensations related to attempting to master a task or
achieve a goal (Vallerand et al., 1992). The third type, Stimulation, refers to motivation
based simply upon the sensation stimulated by performing the task, such as aesthetic
appreciation or fun and excitement (Shaikholeslami & Khayyer, 2006; Vallerand et al.,
1992). Intrinsic motivation results in high-quality learning and creativity; it is especially
important to detail the factors and forces that engender versus undermine it (Ryan &
Deci, 2000a; Vallerand et al., 1992).
30
External motivation is a controlled state in which one is acting because she or he
is compelled to do so by an outside source. Having autonomous (internalized), as
opposed to controlled (non-internalized), reasons for engaging in learning activities is
associated with increased effort, persistence, achievement, and learning (Ciani, Sheldon,
Hilpert, & Easter, 2011; Boiché, Sarrazin, Grouzet, Pelletier, & Chanal, 2008). The least
self-determined form of extrinsic motivation is External Regulation. Such behaviors are
performed to satisfy an external demand or obtain an externally imposed contingency. A
second type of extrinsic motivation is Introjected Regulation; such behaviors are
performed when there is a feeling of pressure to avoid guilt or anxiety or to attain ego-
enhancement or pride (Ryan & Deci, 2000b; Shaikholeslami & Khayyer, 2006). A more
autonomous or self-determined form of extrinsic motivation is regulation through
identification. Here the individual has identified with the personal importance of a
behavior and has thus accepted its regulation as his own. Understanding these different
types of extrinsic motivation, and what fosters each of them, is an important issue for
educators who cannot always rely on intrinsic motivation to foster learning (Ryan &
Deci, 2000a, 2000b).
Ryan & Deci’s (2000a) approach focuses primarily on psychological needs—
namely, the innate needs for competence, autonomy, and relatedness while recognizing
that basic need satisfaction accrues in part from engaging in interesting activities. Thus,
when intrinsically interesting activities are spoken about, it refers to the tasks that, on
average, many people find to be intrinsically interesting. There is considerable practical
utility in focusing on task properties and their potential intrinsic interest, as it leads
toward improved task design or selection to enhance motivation (Ryan & Deci, 2000a).
31
Amotivation is the state of lacking an intention to act. When amotivated, a person’s
behavior lacks intentionality and a sense of personal causation. Amotivation results from
not believing it will yield a desired outcome (Deci, 1971; Ryan, 1995; Seligman, 1975).
Theorists who have treated motivation as a unitary concept have been concerned only
with the distinction between what we call amotivation and motivation (Ryan & Deci,
2000a).
2.6 Data Collection using Surveys
There are different types of quantitative research namely descriptive, experimental
and correlational. One of the challenges a researchers has is to decide how data needs to
be collected (Dillman, 2000). The method of survey research which is a present oriented
methodology, used to collect facts and assess beliefs, interests and attitudes (Creswell,
2003). This type of research is oriented towards the determination of the status of a given
phenomenon than towards the isolation of causative factors accounting for its existence.
Mail and face-to face surveys are the oldest recorded survey data collection modes.
Face-to-face interview was extensively found in the fifties and sixties of the twentieth
century, the telephone survey quickly became popular during the seventies and soon
became the predominant mode of data collection by surveys (Dillman, 2000; Nathan
2001). The rapid growth of computers saw its influence in the data collection methods as
well. The development of programs saw the introduction of computer-assisted self-
interviewing (CASI) in face-to-face interviews, and became popular with interviews on
sensitive topics as the respondent can answer the questions with privacy and the
32
interviewer remains at a respectful distance, but is available for assistance (Couper &
Nicholls, 1998).
The latest development in the field of surveys is the web or Internet survey. These
surveys are cost and time efficient making them very popular. They have great potential,
but have limitations (e.g. nonresponse). Web surveys allow the respondent to take the
survey at a location, time and place he/she is comfortable with (Couper, 2000). Studies
have found that the interviewees respond better when surveys involving social and
psychological needs are taken at their leisure and at an environment he/she is comfortable
in. Web surveys help reach out several people simultaneously and to a very large extent
help negate interviewer bias (Czaja & Blair, 1996). The data has been collected by the
IMPACT team as a part of their study using the web surveys. Both the pre-surveys and
post-surveys were sent by e-mail to each students of each of the semesters. The same
survey was sent to the survey for both the pre-survey and the post-survey. The purpose of
the survey was to establish the status of the phenomenon under investigation which was
the degree of student centeredness of an active classroom. It has been established that
surveys may generally be self-administered of administered in the presence of an
interviewer (Leeuw & Collins, 1997). Given the number of people and also the fact that
surveys have to do with psychology and social situations yield more accurate results
when self-administered due to lack of peer or social pressure, handing out the survey
online was the best option to collect data (Creswell, 2003).
33
2.7 Summary
This literature review summarizes the various aspects of learning and forms the
basis of the study. Through the process of the study, the researcher found a couple of
studies whose context was similar to the chosen study which provided direction to the
study. It was found through the study of the literature that the course chosen for the study
followed the supplemental model of teaching (active learning classroom) while
progressing towards a replacement model of teaching (flipped classroom). The findings
from the literature also revealed that in order to measure the effect of the infusion of
active learning elements in a classroom, the factor of learning climate, basic
psychological needs (autonomy, competence and relatedness) and perceived knowledge
transfer are all measured by SDT which provided the framework for the study.

34
CHAPTER 3. METHODOLOGY
The chapter introduces the research framework and methodology adopted to study
the research question. The goal of the study was to assess the effect of the infusion of
active learning elements into a classroom including that of an online textbook. The
methodology adopted in collaboration with the IMPACT team followed a logical pattern
which leads to the identification of the same. This chapter explains the approach adopted
for data collection methods, statistical analysis and data analysis techniques. It then
concludes with a discussion of analyzing data and the process of drawing meaningful
conclusions.
3.1 Framework
Considering inherent nature of the study, the methodology adopted for the thesis
is that of a quantitative one. As Creswell (2003) says, quantitative research is a means for
exploring and understanding the meaning individuals or a group ascribe to a social or a
human problem. The process of research involves emerging questions and procedures,
data collected typically in the participant’s setting and data analysis inductively building
from particulars to general themes leading to the interpretations of the data (Creswell,

35
2003). The data collected from a survey given out by the IMPACT team is based
on SDT is used to answer the research questions of this thesis. The purpose of the survey
given
out by the IMPACT team to 120 courses was to evaluate the degree of student
centeredness those courses.
3.2 Hypotheses
This thesis looks into the evaluation of the following hypothesis due to the
introduction of an online textbook:
H10: There is no difference in the students’ perception of learning climate in BCM 10001
comparing data from Fall-2013, Spring-2014 and Fall-2014.
H1α: There is a difference in the students’ perception of learning climate in BCM 10001
comparing data from Fall-2013, Spring-2014 and Fall-2014.
H20: There is no difference in the students’ perception of Basic Psychological Needs in
BCM 10001 comparing data from Fall-2013, Spring-2014 and Fall-2014.
H2α: There is a difference in the students’ perception of Basic Psychological Needs in
BCM 10001 comparing data from Fall-2013, Spring-2014 and Fall-2014.
H30: There is no difference in the students’ perception of knowledge transfer in BCM
10001 comparing data from Fall-2013, Spring-2014 and Fall-2014.
H3α: There is a difference in the students’ perception of knowledge transfer in BCM
10001 comparing data from Fall-2013, Spring-2014 and Fall-2014.
36
3.3 Population and Sample
The population of the study consisted of the students enrolled in the BCM 1001
course in the semester of Fall-2013, Spring-2014 and Fall-2014. The sample consisted of
those who chose to reply to the survey conducted by the IMPACT team.
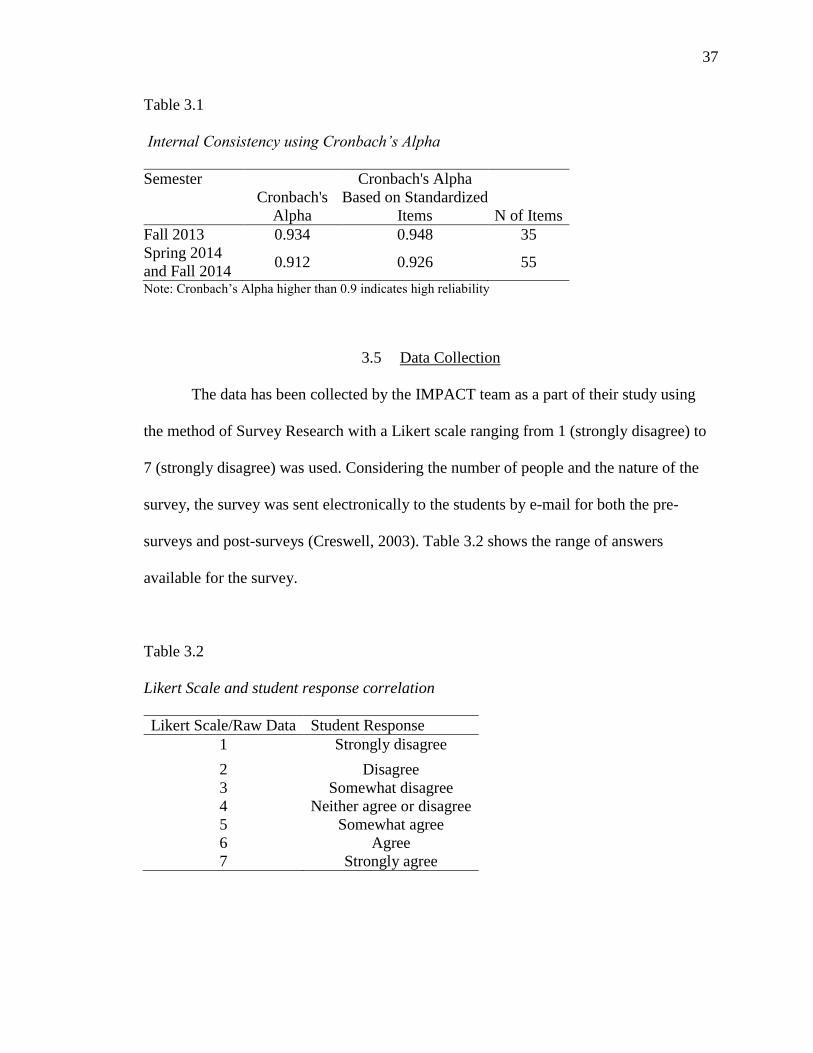
3.4 Reliability and Validity
As survey’s given in the semester of Fall-2013 differed from that of Fall-2014 and
Spring-2014, there was a need to check the internal consistency of the surveys which
essentially is a measure based on the correlations between different items on the same
survey (Creswell, 2003). Internal consistency is measured with Cronbach's alpha which
calculated from the pairwise correlations between items. Internal consistency ranges
between negative infinity and one. Higher scores indicate high internal consistencies
making the survey reliable (Weissinger & Bandalos, 1995). A Chronbach’s Alpha test for
internal consistency was conducted on both the surveys in order to determine the
reliability of the surveys. This test was done using SPSS. The results of the tests are in
Table 3.1. It is clear from the tables that the Cronbach’s Alpha value is higher than 0.9
which indicates that both the surveys were highly reliable. The validity of the surveys
was obtained from the pilot studies conducted by IMPACT as well as literature of the
SDT.
37
Table 3.1
Internal Consistency using Cronbach’s Alpha
Semester
Cronbach's
Alpha
Cronbach's Alpha
Based on Standardized
Items N of Items
Fall 2013 0.934 0.948 35
Spring 2014
and Fall 2014 0.912 0.926 55
Note: Cronbach’s Alpha higher than 0.9 indicates high reliability
3.5 Data Collection
The data has been collected by the IMPACT team as a part of their study using
the method of Survey Research with a Likert scale ranging from 1 (strongly disagree) to
7 (strongly disagree) was used. Considering the number of people and the nature of the
survey, the survey was sent electronically to the students by e-mail for both the pre-
surveys and post-surveys (Creswell, 2003). Table 3.2 shows the range of answers
available for the survey.
Table 3.2
Likert Scale and student response correlation
Likert Scale/Raw Data Student Response
1 Strongly disagree
2 Disagree
3 Somewhat disagree
4 Neither agree or disagree
5 Somewhat agree
6 Agree
7 Strongly agree
38
The questions contained in the surveys for Spring of 2014 and Fall of 2014 were
the same but different from the survey given in the Fall of 2013. However, all the surveys
measured the same basic parameters. The same surveys were handed out twice to the
same set of students in a semester i.e. once at the beginning of the semester (pre-survey)
and once at the end of the semester (post-survey). These surveys can be found in
Appendix A. In each semester, the students received the pre-survey in the 2nd – 4th week
and the post-survey in 13th – 14th week. The author obtained the data collected by the
IMPACT team for the semesters of Fall-2013, Spring-2014 and Fall-2014 specifically for
the BCM 10001 course. Information regarding the IMPACT mean across all the courses
for all the questions was obtained from reports regarding BCM 10001 handed by
IMPACT to the instructor of the course was collected by the author. This information
was then utilized to compare by the method of descriptive statistics the mean of BCM
10001 with the IMPACT mean across all associated courses. Demographics of the
different majors of the students in the class each semester as well as course standing was
also obtained from the course rosters handed by the instructor of the course. The pre-
survey data and the post-survey data were obtained for each of the semesters. The data
received was raw data in the form of numbers between 1 & 7 on an excel sheet. These
numbers represent student responses ranging from Strongly Agree to Strongly Disagree.
Correlation of the raw data to the student response is seen in Table 3.2.
In order to analyze the data, the questions from the questionnaire was strategically
grouped in accordance with the information obtained from the literature review and is
based primarily on SDT. For Fall 2013 survey, question numbering 1 to 16 were used to
analyze the learning climate, 17 to 26 were used to analyze the Basic Psychological

39
Needs and 27 to 34 were used to analyze the Perceived Knowledge Transfer. The Fall
2013 survey can be found in Appendix A. For Spring 2014/ Fall 2014 survey, question 1
to 6 were used to analyze Learning Climate, 7 to 43 were used to analyze Basic
Psychological Needs and 44 to 51 were used to analyze Perceived Knowledge Transfer.
The Spring 2014/ Fall 2014 survey can be found in Appendix B. Some of the questions
had reverse-coded items, for which higher scores reflect lower satisfaction of the need.
Mathematical corrections were made using Microsoft Excel to the responses obtained to
these questions in order make it comparable to the other questions.
3.6 Data Analysis
The data analysis was conducted based on recommendations given by the experts at
The Statistical Consulting Services (SCS), Purdue University. Demographics of the
different majors of the students in the class each semester as that was obtained from the
rosters were represented in the form of pie charts showing the number of students in
different majors or colleges within Purdue University and percentage of the class they
make up using Microsoft Excel. A bar chart was formed to show the representation of
students from various class standings for each semester in comparison to the other two
semesters using Microsoft Excel. The data obtained by the researcher from the IMPACT
team is in the form of numbers ranging from 1 to 7 and the amount of data received is
based on the number of students that responded to the questionnaire each semester
(IMPACT Management Team & IMPACT Assessment Team, 2014c). In order to analyze
the data, an average score per respondent per section was then taken for the purpose of
inferential statistics. Owing to the nature of data obtained, a test of Analysis of Variance
40
(ANOVA) are conducted in order to get statistical significance for the data. This is a
procedure that helps determining the differences between mean scores of factors to
determine statistical significance (Gall, Gall, & Borg, 1999). The One way ANOVA test
was used to reveal significant differences between the data’s of pre and post surveys each
semester as well as differences between the post-surveys of all the semesters. Also, an
average score per question was then taken for the purpose of the differential statistics
which helped obtained the standard deviation per question in each section. The standard
deviation of all the responses for a question enables us to measure the size of the
measurement error (Bland & Altman, 1996). In order to calculate the standard deviation
from the average, each response for a question is squared and subtracted from the average
of all responses and the result is squared resulting in the squared difference for that
response. The average of all the squared differences is then calculated to obtain the
standard deviation (Nunnally, Bernstein & Berge, 1967). The descriptive analysis was
provided and calculated for the questions in which at least 15 students and 25% of the
students enrolled in the BCM 10001 responded to the survey in order to prevent
statistical anomalies. The results obtained from the descriptive analysis was compared
with the average value obtained by the IMPACT team. The analysis procedure was based
on the recommendation and guidance given by the Statistical Consultants at The
Department of Statistics, Purdue University. Software packages are used for the analysis
owing to the volume of data; SPSS has been used for the descriptive statistics and
ANOVA while Microsoft Excel is used to produce charts and tables to display data,
accordingly (Mills, 2002). The questionnaire is categorized into three parts, namely:

41
1. Learning Climate
The combination of instructional pattern combined with student behavior leads to
a specific classroom environment called the ‘learning climate’ (Hager, 1974). The
content of the course, the necessity to use one’s cognitive and emotional resources,
social, and spatial situations created in the classroom also play a significant role in the
learning climate (Arndt, 2012). With the infusion of active learning elements, there is a
change in the learning climate and it is necessary to determine the students’ perception of
the degree of student centeredness of the course in order to measure the effects of the
active learning elements. The first part of the questionnaire helps assess the learning
climate of the course with its questions pertaining to the student perception of the
instructor and the course. The questions that were used to determine the learning climate
are numbers 1 to 16 in the Fall 2013 survey found in Appendix A and 1 to 6 in the Spring
2014/Fall 2014 survey found in Appendix B. Although the complete questionnaire can be
found in the appendices, in order to provide clarity to the reader, some of the questions
from the first part of the questionnaire have been chosen at random and presented below:
My instructor conveyed confidence in my ability to do well in the course.
My instructor listens to how I would like to do things.
My instructor tries to understand how I see things before suggesting a new
way to do things.
The comparison between the data obtained from both the pre-survey and post-
survey of one semester in order to determine the change in the learning climate within
that semester was made by analyzing the learning climate portions of the questionnaire
using the inferential method of One-Way ANOVA using SPSS in order to reveal
42
statistically significant differences. Comparison between the results obtained in the pre-
survey and post-survey helps identify as to whether there were changes in the Learning
Climate as perceived by the students in the beginning of the semester as compared to the
end of the semester. Descriptive statistical assessments along with One Way ANOVA
test that finds statistically significant differences, for the post-survey of all the semesters
assesses as to whether the learning climate of the students were met thereby answering
the first hypothesis.
2. Basic Psychological Needs
The second part of the questionnaire pertains to the basic psychological needs of
the students looking into the feelings of volition and choice when given choices and
options about how to perform or present their work, the extent to which students are
confident about mastery of content material as well as the feelings of being connected,
intellectually and emotionally, to other students in the class, as well as to their instructor
(IMPACT Management Team IMPACT Assessment Team, 2014c; Niemiec & Ryan,
2009; Ryan & Deci, 2000a). The questions that were used to determine the Basic
Psychological Needs are numbers 17 to 26 in the Fall 2013 survey found in Appendix A
and 7 to 43 in the Spring 2014/Fall 2014 survey found in Appendix B. Some of the
questions on this section contained questions that had reverse-coded items, for which
higher scores reflect lower satisfaction of the need. Mathematical corrections using
Microsoft Excel were made to the responses obtained to these questions in order make it
comparable to the other questions. Comparison between the results obtained in the pre-
survey and post-survey helps identify as to whether there were changes in the Basic

43
Psychological Needs as perceived by the students in the beginning of the semester as
compared to the end of the semester was made by analyzing the Basic Psychological
Needs portions of the questionnaire using the inferential method of One-Way ANOVA
using SPSS in order to reveal statistically significant differences. Descriptive statistical
assessments along with the One Way ANOVA test that finds statistically significant
differences, for the post-survey of all the semesters assesses as to whether the basic
psychological needs of the students were met thereby answering the second hypothesis.
Although the complete questionnaire can be found in the appendices, in order to provide
clarity to the reader, some of the questions from the second part of the questionnaire have
been chosen at random and presented below:
Autonomy
a. I am free to express my ideas and opinions in this course.
b. When I am in this course, I have to do what I am told.
Competence
a. I have been able to learn interesting new skills in this course.
b. Most days I feel a sense of accomplishment from this course.
Relatedness
a. I really like the people in this course.
b. I pretty much keep to myself when in this course.
Self-Regulation Scale
The questions below are related to your feelings of why you are taking the
BCM 10001 course:
a. Intrinsic Regulation

44
Because I really enjoy it
b. Integration
Because acquiring all kinds of knowledge is fundamental for me
3. Perceived Knowledge Transfer
The third and final part of the questionnaire looks into the perceived knowledge
transfer along with the student perception of the course module on whole in terms of its
importance and future applicability (IMPACT Management Team & IMPACT
Assessment Team, 2014a; Levesque-Bristol, 2014; Niemiec & Ryan, 2009). The
questions that were used to determine the Perceived Knowledge Transfer are numbers 27
to 34 in the Fall 2013 survey found in Appendix A and 44 to 51 in the Spring 2014/Fall
2014 survey found in Appendix B. The comparison between the data obtained between
the pre-survey and post-survey within a semester for this portion of the questionnaire was
made by the inferential statistical method of One-Way ANOVA using SPSS in order to
reveal statistically significant differences. Comparison between the results obtained in the
pre-survey and post-survey helps identify as to whether there were changes in the
Knowledge Transfer scale as perceived by the students in the beginning of the semester
as compared to the end of the semester. Descriptive statistical assessments along with the
One Way ANOVA test that finds statistically significant differences, for the post-survey
of all the semesters assesses as to whether the basic psychological needs of the students
were met thereby answering the third hypothesis. Although the complete questionnaire
can be found in the Appendices A and B, in order to provide clarity to the reader, some of

45
the questions from the third part of the questionnaire have been chosen at random and
presented below:
Perceived Knowledge Transfer Scale
I feel confident in my ability to apply the course material in other classes that I
have.
I understand how I will use the information learned in this class in my
professional life.
Information learned in this course will inform my future learning experiences.
It is necessary to note that the same questionnaire, for both pre-survey and post-
survey, was given out to the responders of the chosen semesters.
An illustration of the method of analysis has been shown in Table 3.2.
Table 3.3
Analysis methods used
What was analyzed
Difference in the
students’ perception
of learning climate
in BCM 10001
Difference in the
students’ perception
of Basic
Psychological Needs
in BCM 10001
Difference in the
students’ perception
of knowledge
transfer in BCM
10001
Between the pre-
survey and post-
survey of each
semester (Fall 2013,
Spring 2014, Fall
2014).
One-Way ANOVA
test.
One-Way ANOVA
test.
One-Way ANOVA
test.
Among the post-
surveys of the all the
semesters (Fall
2013, Spring 2014
and Fall 2014)
Descriptive analysis
and One-Way
ANOVA tests.
Descriptive analysis
and One-Way
ANOVA tests.
Descriptive analysis
and One-Way
ANOVA tests.

46
CHAPTER 4. RESULTS AND ANALYSIS
The goal of this study was to examine the effects of infusing active learning elements
into a classroom consisting of students in the BCM 10001 ‘Introduction to Construction
Management’ course at The Department of Building Construction Management in Purdue
University. The instrument consisted of three sections that align with the objectives of the
study:
1. Learning Climate
2. Basic Psychological Needs
3. Perceived knowledge transfer
Descriptive and inferential statistics and selected variables were used to explore
the research questions. Analyses were conducted to examine the experiences of the
students who had chosen the course. The results, therefore, were organized around each
research question posited for the study and arranged by semester concluding with the
comparison post-survey results of each of the sections through all the semester. The
statistics of the number of respondents to the surveys each semester is shown in table
4.1.It is very important to note that these numbers represent the number of people who
attempted the survey – not necessarily answered all the questions. The incomplete
surveys have not been eliminated as the response to one question is independent of the
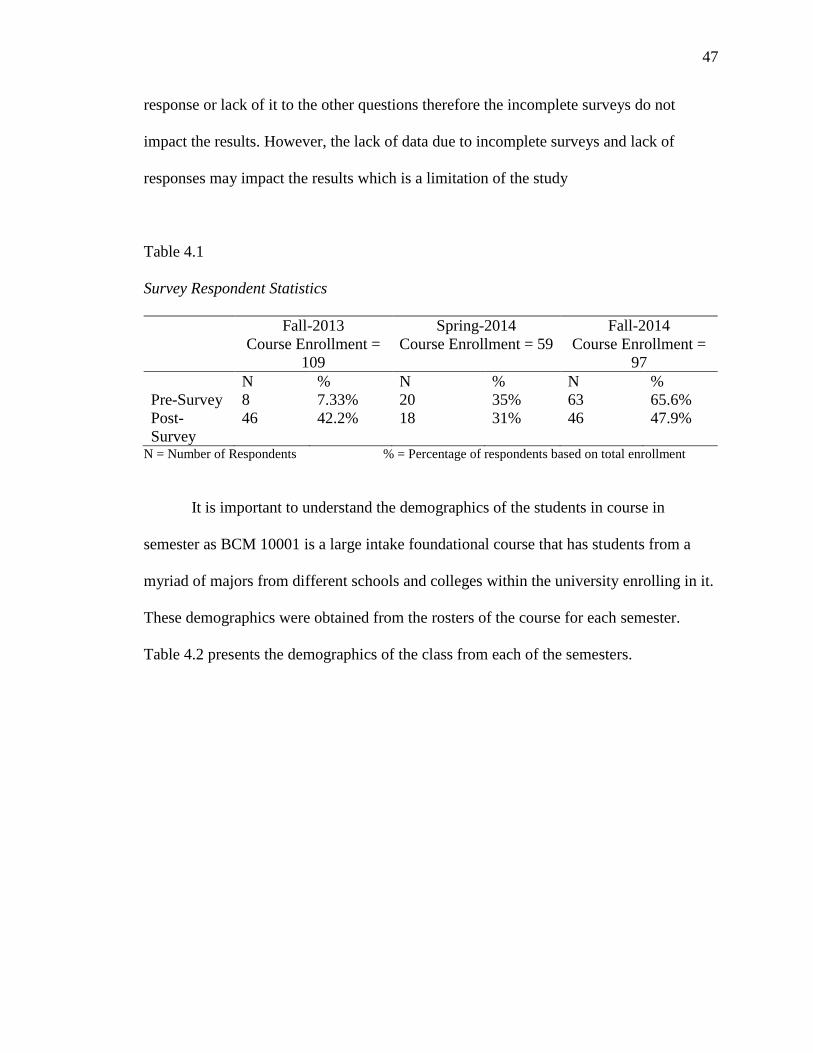
47
response or lack of it to the other questions therefore the incomplete surveys do not
impact the results. However, the lack of data due to incomplete surveys and lack of
responses may impact the results which is a limitation of the study
Table 4.1
Survey Respondent Statistics
Fall-2013
Course Enrollment =
109
Spring-2014
Course Enrollment = 59
Fall-2014
Course Enrollment =
97
N % N % N %
Pre-Survey 8 7.33% 20 35% 63 65.6%
Post-
Survey
46 42.2% 18 31% 46 47.9%
N = Number of Respondents % = Percentage of respondents based on total enrollment
It is important to understand the demographics of the students in course in
semester as BCM 10001 is a large intake foundational course that has students from a
myriad of majors from different schools and colleges within the university enrolling in it.
These demographics were obtained from the rosters of the course for each semester.
Table 4.2 presents the demographics of the class from each of the semesters.
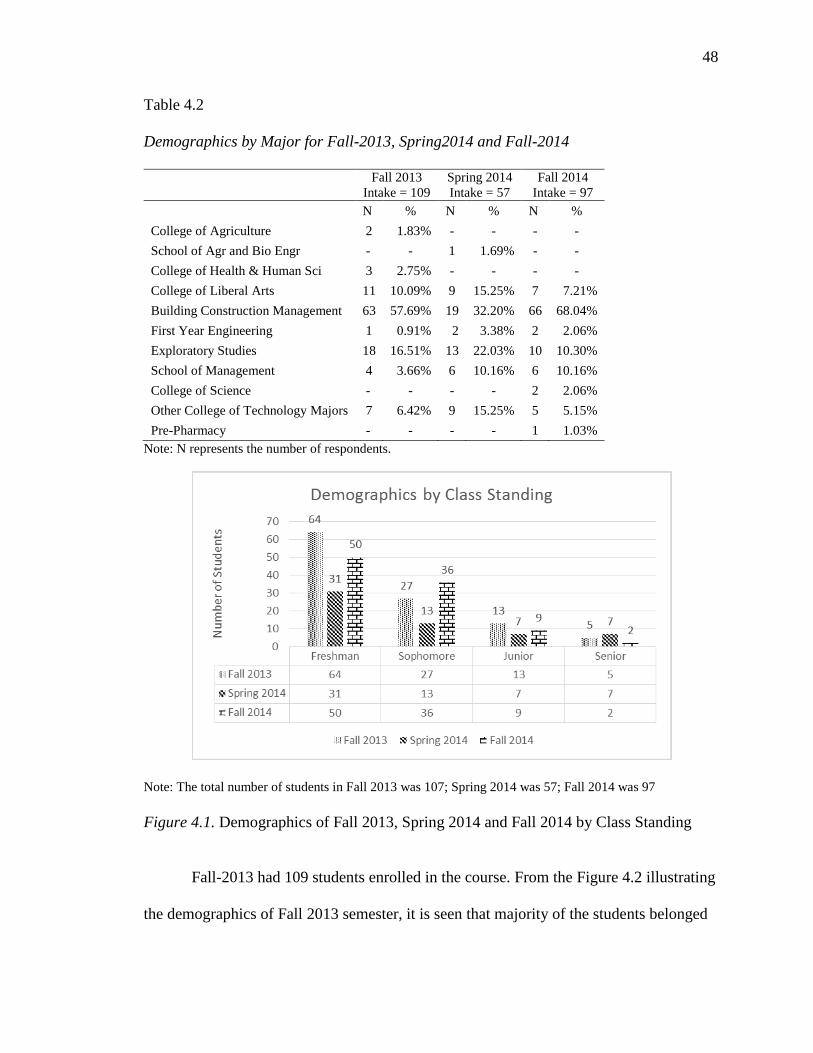
48
Table 4.2
Demographics by Major for Fall-2013, Spring2014 and Fall-2014
Fall 2013
Intake = 109
Spring 2014
Intake = 57
Fall 2014
Intake = 97
N % N % N %
College of Agriculture 2 1.83% - - - -
School of Agr and Bio Engr - - 1 1.69% - -
College of Health & Human Sci 3 2.75% - - - -
College of Liberal Arts 11 10.09% 9 15.25% 7 7.21%
Building Construction Management 63 57.69% 19 32.20% 66 68.04%
First Year Engineering 1 0.91% 2 3.38% 2 2.06%
Exploratory Studies 18 16.51% 13 22.03% 10 10.30%
School of Management 4 3.66% 6 10.16% 6 10.16%
College of Science - - - - 2 2.06%
Other College of Technology Majors 7 6.42% 9 15.25% 5 5.15%
Pre-Pharmacy - - - - 1 1.03%
Note: N represents the number of respondents.
Note: The total number of students in Fall 2013 was 107; Spring 2014 was 57; Fall 2014 was 97
Figure 4.1. Demographics of Fall 2013, Spring 2014 and Fall 2014 by Class Standing
Fall-2013 had 109 students enrolled in the course. From the Figure 4.2 illustrating
the demographics of Fall 2013 semester, it is seen that majority of the students belonged
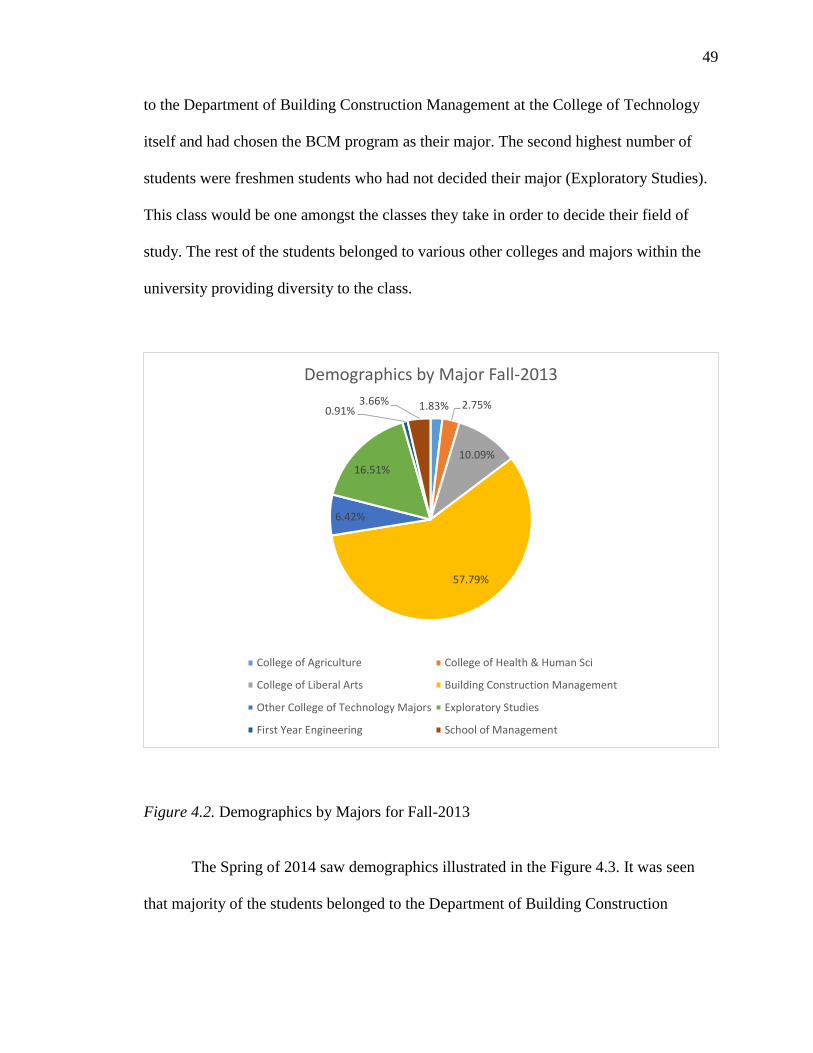
49
to the Department of Building Construction Management at the College of Technology
itself and had chosen the BCM program as their major. The second highest number of
students were freshmen students who had not decided their major (Exploratory Studies).
This class would be one amongst the classes they take in order to decide their field of
study. The rest of the students belonged to various other colleges and majors within the
university providing diversity to the class.
Figure 4.2. Demographics by Majors for Fall-2013
The Spring of 2014 saw demographics illustrated in the Figure 4.3. It was seen
that majority of the students belonged to the Department of Building Construction
1.83% 2.75%
10.09%
57.79%
6.42%
16.51%
0.91%3.66%
Demographics by Major Fall-2013
College of Agriculture College of Health & Human Sci
College of Liberal Arts Building Construction Management
Other College of Technology Majors Exploratory Studies
First Year Engineering School of Management
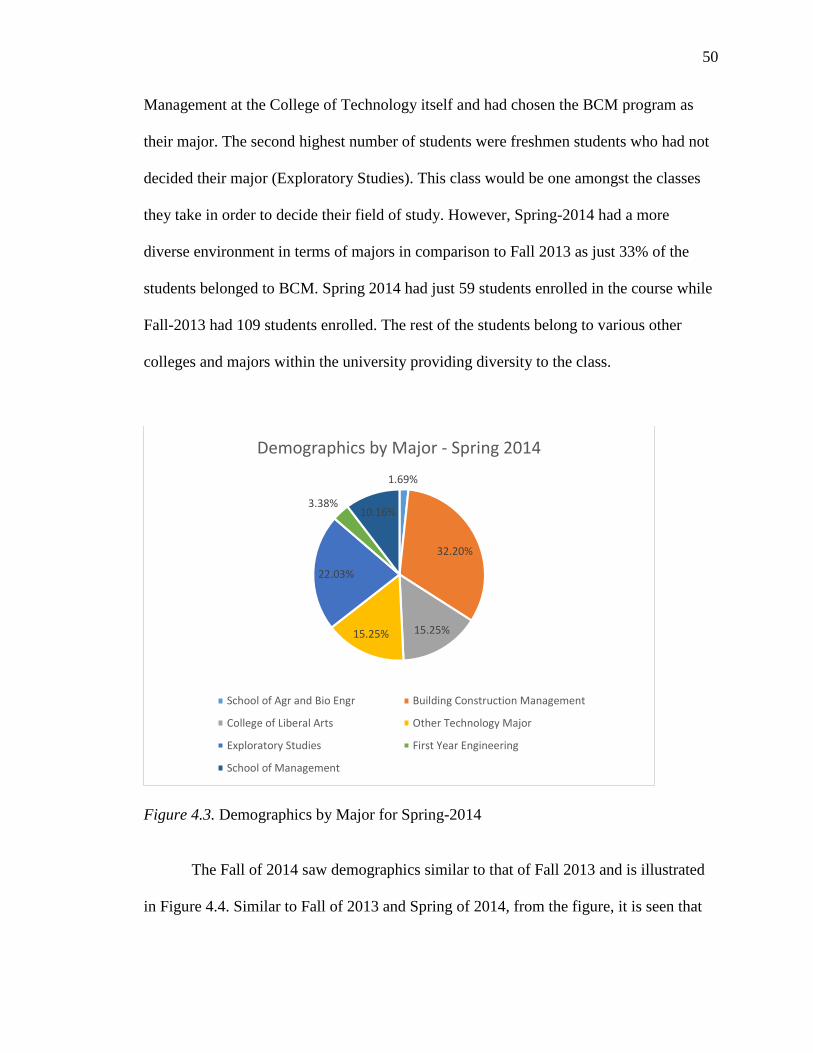
50
Management at the College of Technology itself and had chosen the BCM program as
their major. The second highest number of students were freshmen students who had not
decided their major (Exploratory Studies). This class would be one amongst the classes
they take in order to decide their field of study. However, Spring-2014 had a more
diverse environment in terms of majors in comparison to Fall 2013 as just 33% of the
students belonged to BCM. Spring 2014 had just 59 students enrolled in the course while
Fall-2013 had 109 students enrolled. The rest of the students belong to various other
colleges and majors within the university providing diversity to the class.
Figure 4.3. Demographics by Major for Spring-2014
The Fall of 2014 saw demographics similar to that of Fall 2013 and is illustrated
in Figure 4.4. Similar to Fall of 2013 and Spring of 2014, from the figure, it is seen that
1.69%
32.20%
15.25%15.25%
22.03%
3.38%10.16%
Demographics by Major - Spring 2014
School of Agr and Bio Engr Building Construction Management
College of Liberal Arts Other Technology Major
Exploratory Studies First Year Engineering
School of Management

51
majority of the students belonged to the Department of Building Construction
Management at the College of Technology itself and had chosen the BCM program as
their major in Fall of 2014 as well. The second highest number of students were freshmen
students who had not decided their major (Exploratory Studies). The rest of the students
belong to various other colleges and major within the university providing diversity to the
class. This class would be one amongst the classes they take in order to decide their field
of study. This demographic is very similar to that of Fall-2013 than Spring-2014. It is
important to note that the intake between the semesters varied. Spring 2014 had just 59
students enrolled in the course while Fall-2013 had 109 students enrolled. Fall 2014 had
97 students enrolled in the course. Therefore, it can be concluded that Spring-2014 had
much lower course enrollment when compared to Fall-2013 and Fall-2014 but had the
highest diversity by major.
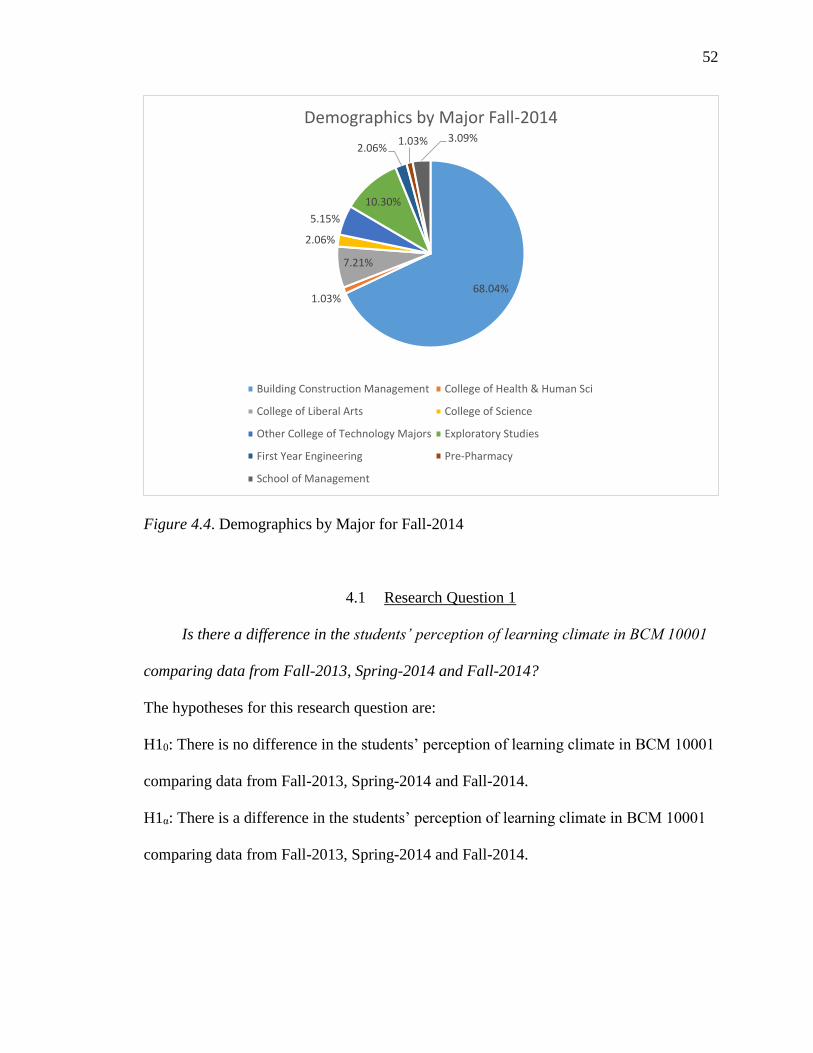
52
Figure 4.4. Demographics by Major for Fall-2014
4.1 Research Question 1
Is there a difference in the students’ perception of learning climate in BCM 10001
comparing data from Fall-2013, Spring-2014 and Fall-2014?
The hypotheses for this research question are:
H10: There is no difference in the students’ perception of learning climate in BCM 10001
comparing data from Fall-2013, Spring-2014 and Fall-2014.
H1α: There is a difference in the students’ perception of learning climate in BCM 10001
comparing data from Fall-2013, Spring-2014 and Fall-2014.
68.04%1.03%
7.21%
2.06%
5.15%
10.30%
2.06%1.03% 3.09%
Demographics by Major Fall-2014
Building Construction Management College of Health & Human Sci
College of Liberal Arts College of Science
Other College of Technology Majors Exploratory Studies
First Year Engineering Pre-Pharmacy
School of Management

53
Comparison between the results obtained in the pre-survey and post-survey within
a semester was conducted for Fall of 2013, Spring 2014 and Fall 2014 in order to identify
the change of the learning climate of the course with the semester. The comparison
between the pre-survey and post-survey was made by the inferential statistical method of
One-way ANOVA using the SPSS software and the results are as shown in Table 4.3,
Table 4.4 and Table 4.5 for Fall 2013, Spring 2014 and Fall 2014 respectively. A 95%
confidence level is taken and since p is greater than 0.05 and it is seen in the table that a
p-value greater than 0.05 is obtained for all three semesters. Therefore, we can conclude
that there is no statistical evidence that there was a significant difference between the
results obtained for the Learning Climate in the pre-survey as compared to that of the
post-survey for the semesters of Fall-2013, Spring-2014 and Fall-2014. However, this can
also be attributed to the fact there was insufficient data available in the pre-surveys of all
the semesters (Less than 25% responses).
Table 4.3
One way ANOVA for pre-test vs post-survey in Fall 2013
Sum of
squares
Degrees of
freedom
Mean
square Fs P
Variance
component
(%)
Among
groups 0.304 1 0.304 0.654 0.422 -
Between
groups 24.175 52 0.465 -
Total 24.479 53 Note: Significant at p<0.05 level
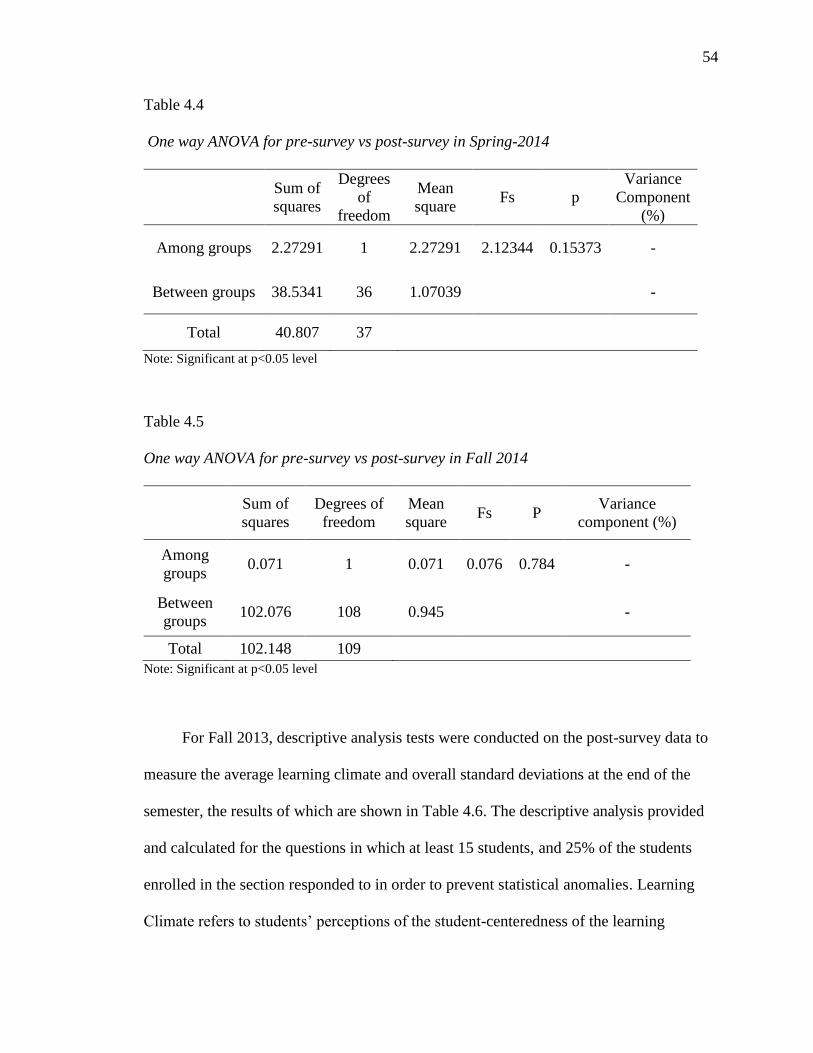
54
Table 4.4
One way ANOVA for pre-survey vs post-survey in Spring-2014
Sum of
squares
Degrees
of
freedom
Mean
square Fs p
Variance
Component
(%)
Among groups 2.27291 1 2.27291 2.12344 0.15373 -
Between groups 38.5341 36 1.07039 -
Total 40.807 37
Note: Significant at p<0.05 level
Table 4.5
One way ANOVA for pre-survey vs post-survey in Fall 2014
Sum of
squares
Degrees of
freedom
Mean
square Fs P
Variance
component (%)
Among
groups 0.071 1 0.071 0.076 0.784 -
Between
groups 102.076 108 0.945 -
Total 102.148 109
Note: Significant at p<0.05 level
For Fall 2013, descriptive analysis tests were conducted on the post-survey data to
measure the average learning climate and overall standard deviations at the end of the
semester, the results of which are shown in Table 4.6. The descriptive analysis provided
and calculated for the questions in which at least 15 students, and 25% of the students
enrolled in the section responded to in order to prevent statistical anomalies. Learning
Climate refers to students’ perceptions of the student-centeredness of the learning

55
environment. Higher scores reflect a more student-centered environment, while lower
scores are reflective of a more instructor-centered. The average Learning Climate score is
5.716 while the overall standard deviation is 0.77 indicating that the students mildly to
moderately agree about the learning climate being student centered. The average score of
the Fall-2013 learning climate for the BCM 10001 course is significantly higher than the
average learning climate obtained by the IMPACT team which is 5.11 across several
courses for the same semester.
Table 4.6.
Descriptive Analysis for Learning Climate in Fall-2013
Learning Climate N Likert
Mean
Standard
Deviation
IMPACT
Mean
My instructor provided me with choices
and options on how to complete the work.
46
5.67 0.92 4.93
My instructor understood my perspective. 46
5.78 0.99 5.08
My instructor encouraged me to ask
questions.
46
5.91 1.11
5.57
My instructor listened to how I would like
to do things.
46
5.63 1.25 4.96
My instructor tried to understand how I
saw things before suggesting a new way to
do things.
46
5.59 0.98 5.01
Learning Climate Scores
Fall 2013 46 5.716 0.77 5.11
Note: N represents the number of respondents. Higher scores for the Likert and IMPACT mean reflect
higher satisfaction of the need.
For Spring 2014, descriptive analysis tests were conducted on the post-survey data
to measure the average learning climate and overall standard deviations at the end of the

56
semester, the results of which are shown in Table 4.7. The descriptive analysis provided
and calculated for the questions in which at least 15 students, and 25% of the students
enrolled in the section responded to in order to prevent statistical anomalies. Learning
Climate refers to students’ perceptions of the student-centeredness of the learning
environment. Higher scores reflect a more student-centered environment, while lower
scores are reflective of a more instructor-centered. The average Learning Climate score is
6.4 and overall standard deviation is 0.5 indicating that the students moderately to
strongly agree about learning climate being student centered. This is a considerable
increase from the Learning Climate scores of Fall 2013 which saw an average score of
5.716 with an overall standard deviation of 0.77. The average score in Spring-2014 for
the learning climate for BCM 10001 course is significantly higher than the average
learning climate obtained by the IMPACT team which is 5.51 across several courses for
the same semester. The IMPACT mean has seen a significant increase in the Spring 2014
semester in comparison to Fall of 2013 where the average was 5.11.

57
Table 4.7
Descriptive Analysis for the Learning Climate in Spring-2014
Learning Climate N Likert
Mean
Standard
Deviation
IMPACT
Mean
I feel that my instructor provides
me choices and options. 18 6.06 0.73
5.41
I feel understood by my instructor. 18 6.44 0.7 5.48
My instructor conveyed confidence
in my ability to do well in the
course.
18 6.61 0.61 5.64
My instructor encouraged me to ask
questions. 18 6.56 0.62
5.83
My instructor listens to how I
would like to do things. 18 6.44 0.7
5.35
My instructor tries to understand
how I see things before suggesting a
new way to do things.
18 6.28 0.75 5.38
Learning Climate Scores for
Spring 2014 18 6.4 0.5 5.51
Note: N represents the number of respondents. Higher scores for the Likert and IMPACT mean reflect
higher satisfaction of the need.
For Fall 2014, descriptive analysis tests were conducted on the post-survey data to
measure the average learning climate and overall standard deviations at the end of the
semester, the results of which are shown in Table 4.8. The descriptive analysis provided
and calculated for the questions in which at least 15 students, and 25% of the students
enrolled in the section responded to in order to prevent statistical anomalies. Learning
Climate refers to students’ perceptions of the student-centeredness of the learning
environment. Higher scores reflect a more student-centered environment, while lower
scores are reflective of a more instructor-centered. The average Learning Climate score is
58
5.85 with an overall standard deviation of 1.04 students mildly to strongly agree about
learning climate being student centered. This score is a slight decrease in comparison to
Spring-2014 which saw an average Learning Climate score of 6.4 with an overall
standard deviation of 0.5. However, the Learning Climate scores of Fall 2014 are higher
than the Learning Climate scores of Fall 2013 which saw an average score of 5.716 with
an overall standard deviation of 0.77. The average score in Fall-2014 for the learning
climate for BCM 10001 course is significantly higher than the average learning climate
obtained by the IMPACT team which is 5.32 across several courses for the same
semester. The IMPACT mean has seen a significant decrease in the Fall of 2014 semester
in comparison to Spring of 2013 where the average was 5.51.

59
Table 4.8
Descriptive analysis for Learning Climate in Fall-2014
Learning Climate N Likert
Mean
Standard
Deviation
IMPACT
Mean
I feel that my instructor provides me
choices and options. 64 5.83 1.18
5.21
I feel understood by my instructor. 64 5.89 1.07 5.22
My instructor conveyed confidence in
my ability to do well in the course. 64 6.06 1.11
5.45
My instructor encouraged me to ask
questions. 64 6.02 1.18
5.68
My instructor listens to how I would
like to do things. 64 5.67 1.22
5.15
My instructor tries to understand how I
see things before suggesting a new way
to do things.
64 5.64 1.28 5.22
Learning Climate Scores for Fall
2014 64 5.85 1.04 5.32
Note: N represents the number of respondents. Higher scores for the Likert and IMPACT mean reflect
higher satisfaction of the need.
A One way ANOVA analysis was conducted on the Learning Climate data
obtained from the post-surveys of Fall-2013, Spring-2014 and Fall-2014 in order to
inferentially compare the results obtained. It is seen from Table 4.9 that a significance or
p-value of 0.026 is obtained. Since a confidence level of 95% was taken in and the
obtained p value is less than 0.05, it is concluded that there is a significant difference
between the data obtained in each of the semesters.

60
Table 4.9
One way ANOVA test on Learning Climate of Fall-2013, Spring-2014 and Fall-2014.
Sum of
Squares
Degrees of
Freedom
Mean
Square F P
Between Groups 4.014 2 2.007 3.787 .026
Within Groups 57.238 108 .530
Total 61.252 110 Note: Significant at p<0.05 level
In order to find out which semester gave out better results, further post-hoc testing
using the Tukey Kramer tests are conducted and the results obtained are as seen in Table
4.10. It is clear from the table that the results obtained from Spring-2014 are significantly
higher than that of Fall-2013 and Fall-2014. It is also seen that results of Fall-2014 is
higher than of Fall-2013 but not significantly different.
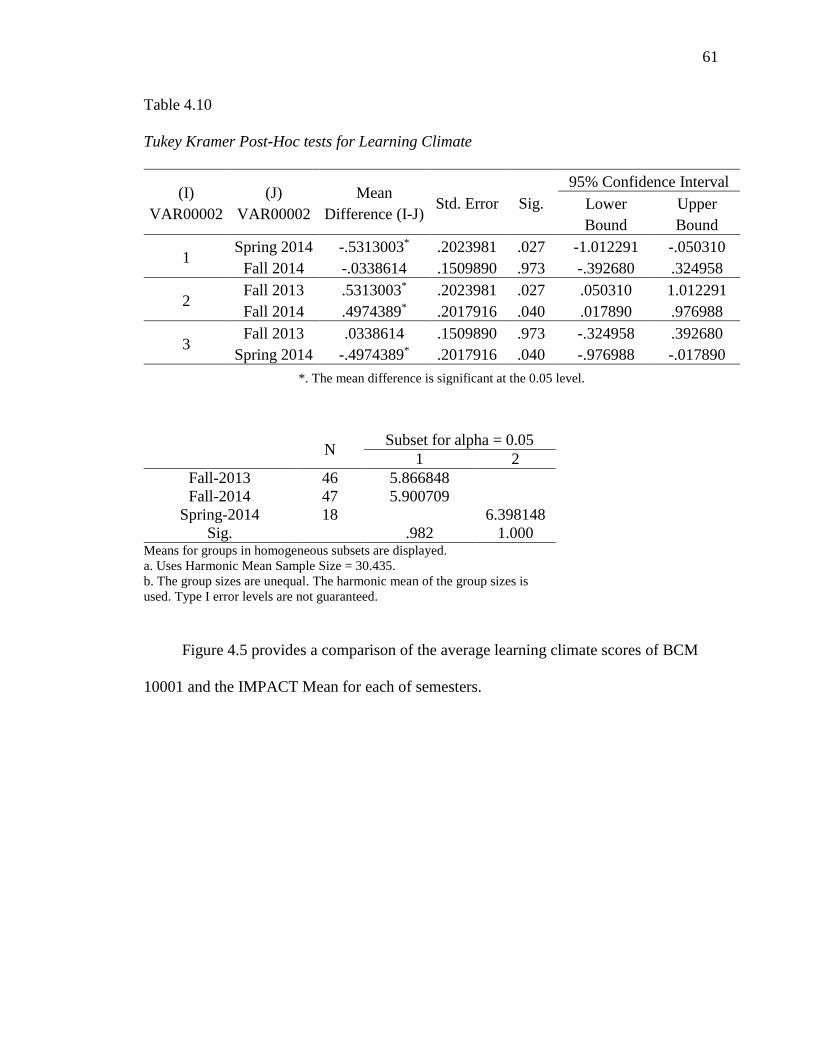
61
Table 4.10
Tukey Kramer Post-Hoc tests for Learning Climate
(I)
VAR00002
(J)
VAR00002
Mean
Difference (I-J) Std. Error Sig.
95% Confidence Interval
Lower
Bound
Upper
Bound
1 Spring 2014 -.5313003* .2023981 .027 -1.012291 -.050310
Fall 2014 -.0338614 .1509890 .973 -.392680 .324958
2 Fall 2013 .5313003* .2023981 .027 .050310 1.012291
Fall 2014 .4974389* .2017916 .040 .017890 .976988
3 Fall 2013 .0338614 .1509890 .973 -.324958 .392680
Spring 2014 -.4974389* .2017916 .040 -.976988 -.017890
*. The mean difference is significant at the 0.05 level.
N Subset for alpha = 0.05
1 2
Fall-2013 46 5.866848
Fall-2014 47 5.900709
Spring-2014 18 6.398148
Sig. .982 1.000 Means for groups in homogeneous subsets are displayed.
a. Uses Harmonic Mean Sample Size = 30.435.
b. The group sizes are unequal. The harmonic mean of the group sizes is
used. Type I error levels are not guaranteed.
Figure 4.5 provides a comparison of the average learning climate scores of BCM
10001 and the IMPACT Mean for each of semesters.

62
Figure 4.5. Comparison of average Learning Climate score
It is concluded that the alternate hypothesis stated below is true.
H1α: There is a difference in the students’ perception of learning climate in BCM 10001
comparing data from Fall-2013, Spring-2014 and Fall-2014.
Therefore, there is a change in the learning climates with the infusion of active
learning elements as perceived by the students of each semester in comparison to the other
two semesters. Further, it is seen that Spring-2014 had higher score indicating higher
student centered learning in comparison to Fall-2013 and Fall-2014, although Fall 2014
had higher amounts of active learning elements in comparison between to the other two
semesters.
63
4.2 Research Question 2
Is there a difference in the students’ perception of Basic Psychological Needs in BCM
10001 comparing data from Fall-2013, Spring-2014 and Fall-2014?
The hypotheses for this research question are:
H20: There is no difference in the students’ perception of Basic Psychological Needs in
BCM 10001 comparing data from Fall-2013, Spring-2014 and Fall-2014.
H2α: There is a difference in the students’ perception of Basic Psychological Needs in
BCM 10001 comparing data from Fall-2013, Spring-2014 and Fall-2014.
Comparison between the results obtained in the pre-survey and post-survey within
a semester was conducted for Fall of 2013, Spring 2014 and Fall 2014 in order to identify
the change in the student perception of the basic psychological needs within a semester
was made by the inferential statistical method of One-way ANOVA using SPSS and the
results are as shown in Table 4.11, Table 4.12 and Table 4.13 for Fall-2013, Spring-2014
and Fall-2014 respectively (Gall, Gall, & Borg, 1999). A 95% confidence level is taken
and it is seen that p is greater than 0.05, we can conclude that there is no statistical
evidence that there was a significant difference between the results obtained for between
the results obtained for the Basic Psychological Needs in the pre-survey as compared to
that of the post-survey for each of the semesters. However, the extremely large p value
can also be attributed to the fact there was insufficient data available in the pre-survey
(Less than 25%).

64
Table 4.11
One way ANOVA for pre-survey vs post-survey in Fall 2013
Sum of
squares
Degrees of
freedom
Mean
square Fs P
Variance
component
(%)
Among
groups 0.003309 1 0.003309 0.007844 0.929768 -
Between
groups 21.93736 52 0.421872 -
Total 21.94067 53 Note: Significant at p<0.05 level
Table 4.12
One way ANOVA for pre-survey vs post-survey in Spring 2014
Sum of
squares
Degrees
of
freedom
mean
square F p
Variance
component
(%)
Among groups 0.9723 1 0.9723 2.1213 0.1539 -
Between groups 16.5007 36 0.4583 -
Total 17.4731 37 Note: Significant at p<0.05 level
Table 4.13
One way ANOVA for Basic Psychological Needs in Fall-2014
Sum of
squares
Degrees
of
freedom
Mean
square
Fs P Variance
component
(%)
Among groups 0.072073 1 0.072073 0.198506 0.65683 -
Between groups 38.84928 107 0.363077 -
Total 38.92136 108
Note: Significant at p<0.05 level

65
For Fall-2013, descriptive analysis tests were conducted on the post-survey data
to measure the average values for the basic psychological needs and the overall standard
deviations at the end of the semester, the results of which are shown in Table 4.14. The
descriptive analysis provided and calculated for the questions in which at least 15
students, and 25% of the students enrolled in the section responded to in order to prevent
statistical anomalies. Higher scores reflect higher satisfaction of the need; (R) denotes
reverse-coded items, for which higher scores reflect lower satisfaction of the need. The
average Basic Psychological Needs score is 5.25 and overall standard deviation is 1.06
indicating that the students mildly to moderately agree about the course satisfying their
Basic Psychological Needs. The average score in Fall-2013 for the Basic Psychological
Needs for the BCM 10001 course is significantly higher than the average basic
psychological needs obtained by the IMPACT team which is 4.66 across several courses
for the same semester.
Table 4.14
Basic Psychological Needs Fall-2013
Basic Psychological Needs N Likert
Mean
Standard
Deviation
IMPACT
Mean
People in this course told me I was good at what I
was doing. 46 5.13 1.28 4.59
I was able to learn interesting new skills in this
course. 46 5.61 0.98 4.98
Most days I felt a sense of accomplishment from
being in this course. 46 5.02 1.48 4.41
Basic Psychological Needs in Fall-2013 46 5.25 1.06 4.66
Note: N represents the number of respondents. Higher scores for the Likert and IMPACT mean reflect higher satisfaction of the need;
(R) denotes reverse‐coded items, for which higher scores reflect lower satisfaction of the need. Both the IMPACT scores and scores
for BCM 10001 have been reported as is in this table. However, the scores were converted to a positive score while calculating the average reported.

66
For the Spring of 2014, descriptive analysis tests were conducted on the post-
survey data to measure the average values for the basic psychological needs and the
overall standard deviations at the end of the semester, the results of which are shown in
Table 4.15. The descriptive analysis provided and calculated for the questions in which at
least 15 students, and 25% of the students enrolled in the section responded to in order to
prevent statistical anomalies. Higher scores reflect higher satisfaction of the need; (R)
denotes reverse-coded items, for which higher scores reflect lower satisfaction of the
need. The average Basic Psychological Need score for Spring-2014 is 4.9 and overall
standard deviation is 0.86 indicating that the students range from being neutral to
moderately agreeing about the course satisfying their Basic Psychological Needs. This is
a reduction from that of Fall 2013 which saw an average score of 5.25 and a standard
deviation of 1.06. The average score in Spring-2014 for the Basic Psychological Needs
for the BCM 10001 course is significantly higher than the Basic Psychological Needs
satisfaction obtained by the IMPACT team which is 4.71 across several courses for the
same semester. The IMPACT average saw a significant increase as well in comparison to
the Fall-2013 score of 4.66.

67
Table 4.15
Descriptive Analysis for Basic Psychological Needs for Spring 2014
Basic Psychological Needs Spring-2014 N Likert
Mean
Standard
Deviation
IMPACT
Mean
I feel like I can make a lot of inputs in deciding how my
coursework gets done. 18 5.44 1.38 4.79
I feel pressured in this course. (R) 18 3.28 1.67 5.22
I am free to express my ideas and opinions in this
course. 18 5.44 1.1
3.33
When I am in this course, I have to do what I am
told.(R) 18 5.06 0.87 4.59
My feelings are taken into consideration in this course. 18 4.89 1.23 3.76
I feel like I can pretty much be myself in this course. 18 5.56 1.25 5.43
There is not much opportunity for me to decide for
myself how to go about my coursework. (R) 18 3.61 1.46 4.08
I do not feel very competent in this course. (R) 18 2.83 1.47 5.3
People in this course tell me I am good at what I do. 18 4.61 1.46 4.8
I have been able to learn interesting new skills in this
course. 18 5.22 1 4.99
Most days I feel a sense of accomplishment from this
course. 18 4.61 1.09 5.02
In this course I do not get much of a chance to show how
capable I am. (R) 18 3.83 1.86 4.44
I often do not feel very capable in this course. (R) 18 3.11 1.78 4.76
I really like the people in this course. 18 5.22 1.11 3.63
I get along with people in this course. 18 5.50 1.15 4.69
I pretty much keep to myself when in this course. (R) 18 4.06 1.86 4.25
I consider the people in this course to be my friends. 18 5.00 1.24 5.12
People in this course care about me. 18 5.00 1.14 3.06
There are not many people in this course that I am close
to. (R) 18 4.22 1.99 3.30
The people in this course do not seem to like me much.
(R) 18 3.17 1.54 3.69
People in this course are pretty friendly towards me. 18 5.50 0.92 5.45
Basic Psychological Needs for Spring-2014 18 4.9 0.86 4.71
Note: N represents the number of respondents. Higher scores for the Likert and IMPACT mean reflect higher satisfaction of the need;
(R) denotes reverse‐coded items, for which higher scores reflect lower satisfaction of the need. Both the IMPACT scores and scores for BCM 10001 have been reported as is in this table. However, the scores were converted to a positive score while calculating the
average reported.
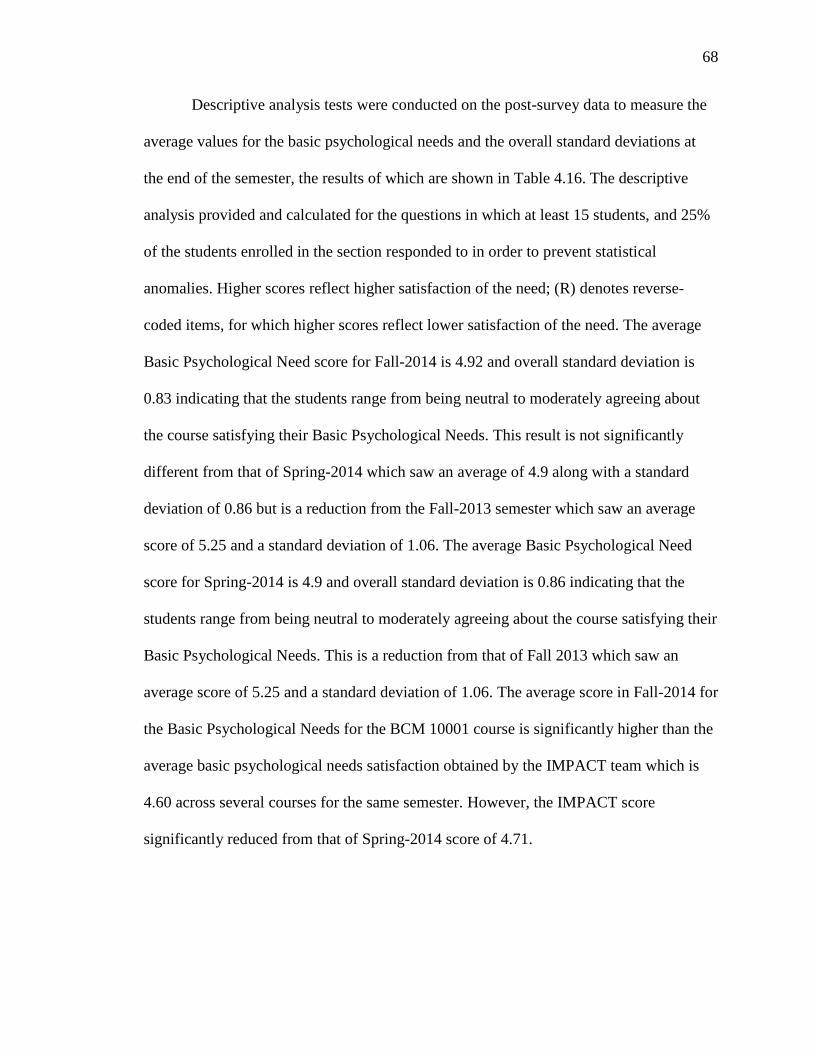
68
Descriptive analysis tests were conducted on the post-survey data to measure the
average values for the basic psychological needs and the overall standard deviations at
the end of the semester, the results of which are shown in Table 4.16. The descriptive
analysis provided and calculated for the questions in which at least 15 students, and 25%
of the students enrolled in the section responded to in order to prevent statistical
anomalies. Higher scores reflect higher satisfaction of the need; (R) denotes reverse-
coded items, for which higher scores reflect lower satisfaction of the need. The average
Basic Psychological Need score for Fall-2014 is 4.92 and overall standard deviation is
0.83 indicating that the students range from being neutral to moderately agreeing about
the course satisfying their Basic Psychological Needs. This result is not significantly
different from that of Spring-2014 which saw an average of 4.9 along with a standard
deviation of 0.86 but is a reduction from the Fall-2013 semester which saw an average
score of 5.25 and a standard deviation of 1.06. The average Basic Psychological Need
score for Spring-2014 is 4.9 and overall standard deviation is 0.86 indicating that the
students range from being neutral to moderately agreeing about the course satisfying their
Basic Psychological Needs. This is a reduction from that of Fall 2013 which saw an
average score of 5.25 and a standard deviation of 1.06. The average score in Fall-2014 for
the Basic Psychological Needs for the BCM 10001 course is significantly higher than the
average basic psychological needs satisfaction obtained by the IMPACT team which is
4.60 across several courses for the same semester. However, the IMPACT score
significantly reduced from that of Spring-2014 score of 4.71.
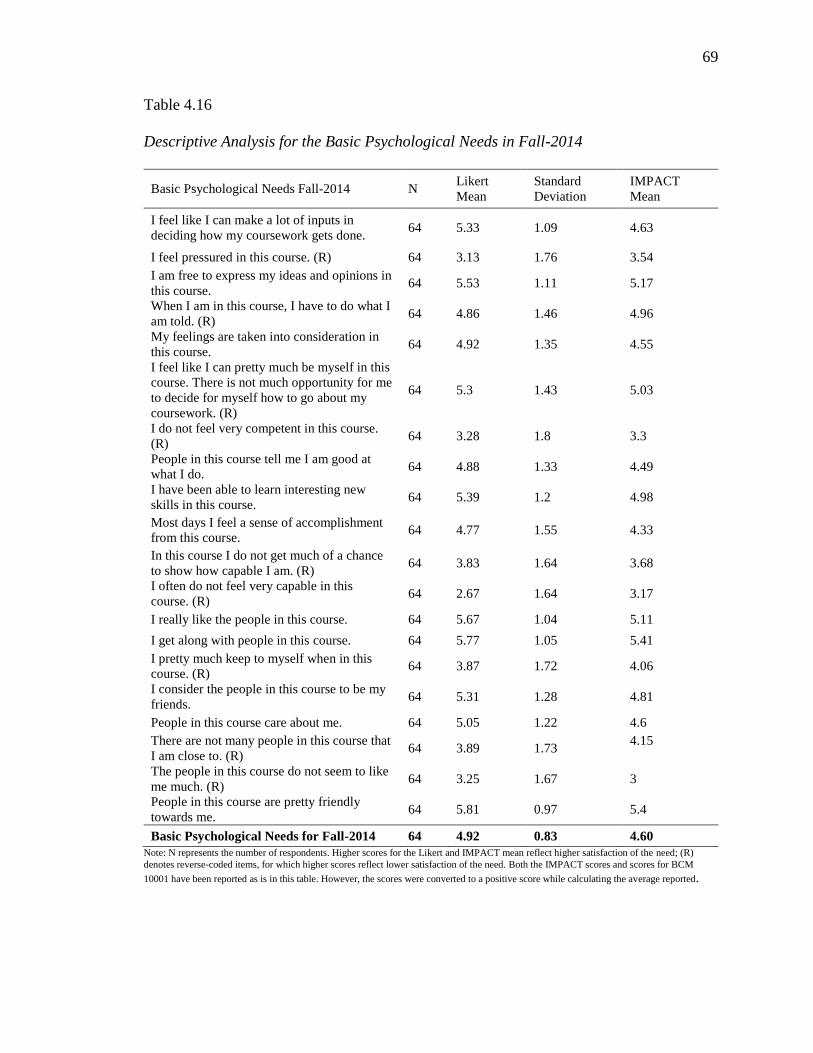
69
Table 4.16
Descriptive Analysis for the Basic Psychological Needs in Fall-2014
Basic Psychological Needs Fall-2014 N Likert
Mean
Standard
Deviation
IMPACT
Mean
I feel like I can make a lot of inputs in
deciding how my coursework gets done. 64 5.33 1.09 4.63
I feel pressured in this course. (R) 64 3.13 1.76 3.54
I am free to express my ideas and opinions in
this course. 64 5.53 1.11 5.17
When I am in this course, I have to do what I
am told. (R) 64 4.86 1.46 4.96
My feelings are taken into consideration in
this course. 64 4.92 1.35 4.55
I feel like I can pretty much be myself in this
course. There is not much opportunity for me
to decide for myself how to go about my
coursework. (R)
64 5.3 1.43 5.03
I do not feel very competent in this course.
(R) 64 3.28 1.8 3.3
People in this course tell me I am good at
what I do. 64 4.88 1.33 4.49
I have been able to learn interesting new
skills in this course. 64 5.39 1.2 4.98
Most days I feel a sense of accomplishment
from this course. 64 4.77 1.55 4.33
In this course I do not get much of a chance
to show how capable I am. (R) 64 3.83 1.64 3.68
I often do not feel very capable in this
course. (R) 64 2.67 1.64 3.17
I really like the people in this course. 64 5.67 1.04 5.11
I get along with people in this course. 64 5.77 1.05 5.41
I pretty much keep to myself when in this
course. (R) 64 3.87 1.72 4.06
I consider the people in this course to be my
friends. 64 5.31 1.28 4.81
People in this course care about me. 64 5.05 1.22 4.6
There are not many people in this course that
I am close to. (R) 64 3.89 1.73
4.15
The people in this course do not seem to like
me much. (R) 64 3.25 1.67 3
People in this course are pretty friendly
towards me. 64 5.81 0.97 5.4
Basic Psychological Needs for Fall-2014 64 4.92 0.83 4.60
Note: N represents the number of respondents. Higher scores for the Likert and IMPACT mean reflect higher satisfaction of the need; (R)
denotes reverse‐coded items, for which higher scores reflect lower satisfaction of the need. Both the IMPACT scores and scores for BCM
10001 have been reported as is in this table. However, the scores were converted to a positive score while calculating the average reported.

70
A One way ANOVA analysis was conducted on the Basic Psychological Needs
data obtained from the post-surveys of Fall-2013, Spring-2014 and Fall-2014 in order to
inferentially compare the results obtained. The results obtained from the One-way
ANOVA test are shown in Table 4.17. From the table, it is seen that a significance or p-
value of 0.01 is obtained. Since a confidence level of 95% was taken in and the obtained
p value is less than 0.05, it is concluded that there is a significant difference between the
data obtained in each of the semesters.
Table 4.17
One way ANOVA comparing Basic Psychological Needs for Fall-2013, Spring-2014 and
Fall-2013
Sum of
Squares
Degrees of
Freedom Mean Square F P
Between Groups 4.954 2 2.477 7.21 .001
Within Groups 36.400 107 .340
Total 41.353 109 Note: Significant at p<0.05 level
In order to find out which semester gave out better results, further post-hoc testing
using the Tukey Kramer tests are conducted and the results obtained are as seen in Table
4.18. It is clear that the results obtained from Fall-2013 are significantly higher than that
of Spring 2014 and Fall-2014. It is also seen that results of Fall-2014 is higher than of
Spring-2014 but not significantly different.

71
Table 4.18
Tukey Kramer Post-Hoc tests for Basic Psychological Needs
Tukey HSD
(I)
VAR00002 (J) VAR00002
Mean
Difference (I-
J) Std. Error Sig.
95% Confidence Interval
Lower Bound Upper Bound
1 2 .43832* .16216 .022 .0529 .8237
3 .42696* .12162 .002 .1379 .7160
2 1 -.43832* .16216 .022 -.8237 -.0529
3 -.01136 .16216 .997 -.3968 .3740
3 1 -.42696* .12162 .002 -.7160 -.1379
2 .01136 .16216 .997 -.3740 .3968 *. The mean difference is significant at the 0.05 level.
VAR00002 N
Subset for alpha =
0.05
1 2
Spring-
2014 18 4.8783
Fall-2014 46 4.8896
Fall-2013 46 5.3166
Sig. .997 1.000 Means for groups in homogeneous subsets are
displayed.
a. Uses Harmonic Mean Sample Size = 30.293.
b. The group sizes are unequal. The harmonic mean of
the group sizes is used. Type I error levels are not
guaranteed.
Figure 4.6 provides a visual comparison of the average Basic Psychological Needs
score for each of semesters thereby providing a pictorial representation of the results of
BCM 10001 and the IMPACT Mean for each of semesters. It can be seen that the scores
of Fall-2013 were higher than the other two semesters. It is also seen that the average
score in Spring-2014 was slightly lower than that of Fall-2014 although it was not
significantly different.

72
Figure 4.6. Comparison of Average Basic Psychological Needs Score
It is concluded that the alternate hypothesis stated below is true:
H2α: There is a difference in the students’ perception of Basic Psychological Needs in
BCM 10001 comparing data from Fall-2013, Spring-2014 and Fall-2014.
Therefore, there is a change in the Basic Psychological Needs with the infusion of
active learning elements as perceived by the students of each semester in comparison to
the other two semesters. Further, it is seen that Fall-2013 had a higher score indicating
better motivation and psychological satisfaction in comparison to that of Fall-2013 and
Spring-2014.

73
4.3 Research Question 3
Is there a difference in the students’ perception of knowledge transfer in BCM 10001
comparing data from Fall-2013, Spring-2014 and Fall-2014?
The hypotheses for this research question are:
H30: There is no change in the student perception of transfer of knowledge perceived by
the students of each semester in comparison to the other two semesters (Fall-2013,
Spring-2014 and Fall-2014)
H3α: There is a change in the perception of transfer of knowledge as perceived by the
students of each semester in comparison to the other two semesters (Fall-2013, Spring-
2014 and Fall-2014)
Comparison between the results obtained in the pre-survey and post-survey within
a semester was conducted for Fall of 2013, Spring 2014 and Fall 2014 in order to identify
the change of the Perceived Knowledge Transfer within a semester was made by the
inferential statistical method of One-way ANOVA using SPSS and the results are as
shown in Table 4.19, Table 4.20 and Table 4.21 for Fall 2013, Spring 2014 and Fall 2014
respectively. A 95% confidence level is taken and it is seen that p is greater than 0.05 for
each of the semesters. Therefore it can be concluded that there is no statistical evidence
that there was a significant difference between the results obtained for between the results
obtained for the Perceived Knowledge Transfer in the pre-survey as compared to that of
the post-survey for each of the semesters. However, the extremely large p value can also
be attributed to the fact there was insufficient data available in both the pre-survey as
well as post-surveys (Less than 30).
74
Table 4.19
One way ANOVA for pre-survey vs post-survey in Fall 2013
Sum of
squares
Degrees of
freedom
Mean
square Fs P
Variance
component (%)
Among
groups 0.3220 1 0.3220 0.5101 0.4782 -
Between
groups 32.8260 52 0.6312 -
Total 33.1481 53 Note: Significant at p<0.05 level
Table 4.20
One way ANOVA for pre-survey vs post-survey in Spring 2014
Sum of
squares
Degrees of
freedom
mean
square Fs P
Variance
component (%)
Among
groups 1.7718 1 1.7718 1.6331 0.2058 -
Between
groups 69.4317 64 1.0848 -
Total 71.2036 65 Note: Significant at p<0.05 level
Table 4.21
One way ANOVA for pre-survey vs post-survey in Spring 2014
Sum of
squares
Degrees
of
freedom
mean
square Fs P
Variance
component
(%)
Among
groups 0.7624 1 0.7624 0.7668 0.3831 -
Between
Groups 106.389 107 0.9942 -
Total 107.1514 108 Note: Significant at p<0.05 level
75
For Fall of 2013, descriptive analysis tests were conducted on the post-survey
data to measure the average values for the perceived knowledge transfer and the overall
standard deviations at the end of the semester, the results of which are shown in Table
4.22. The descriptive analysis provided and calculated for the questions in which at least
15 students, and 25% of the students enrolled in the section responded to in order to
prevent statistical anomalies. Perceived Knowledge Transfer reflects that to what extent
students perceive that the information learned would transfer beyond the course. Higher
scores reflect better perceived knowledge transfer ability. The average Perceived
Knowledge Transfer score is 5.72 while the overall standard deviation is 0.62 indicating
that the students mildly to moderately agree about the perception that the information
learned would transfer beyond the course. The average score in Fall-2013 for the
Perceived Knowledge Transfer for the BCM 10001 course is significantly higher than the
average learning climate obtained by the IMPACT team which is 5.08 across several
courses for the same semester.

76
Table 4.22
Descriptive analysis for Perceived Knowledge Transfer in Fall-2013
Perceived Knowledge Transfer N Likert
Mean
Standard
Deviation
IMPACT
Mean
I feel confident in my ability to apply the
course material in other classes that I have. 46 5.54 0.94 5.1
I feel confident in my ability to apply the
course material in my professional life. 46 5.65 0.92 5.15
I feel as if the material covered in this course is
relevant to my future career. 46 5.8 0.96 5.04
Given the future career that I have chosen, it is
important for me to learn the information
covered in this class.
46 5.85 0.94 4.97
I understand how I will use the information
learned in this class in my professional life. 46 5.7 1.05 4.98
Information learned in this course will inform
my future learning experiences. 46 5.72 0.75 5.04
I believe that it is important for me to learn the
information included in this course. 46 5.85 0.97 5.14
The information learned in this course will
help me become a better-rounded individual. 46 5.63 1.08 5.21
Perceived Knowledge Transfer Score for
Fall-2013 46 5.72 0.69 5.08
Note: N represents the number of respondents. Higher scores for the Likert and IMPACT mean reflect
higher satisfaction of the need.
For the Spring of 2014, descriptive analysis tests were conducted on the post-
survey data to measure the average values for the perceived knowledge transfer and the
overall standard deviations at the end of the semester, the results of which are shown in
Table 4.23. The descriptive analysis provided and calculated for the questions in which at
least 15 students, and 25% of the students enrolled in the section responded to in order to
prevent statistical anomalies. Perceived Knowledge Transfer reflects that to what extent
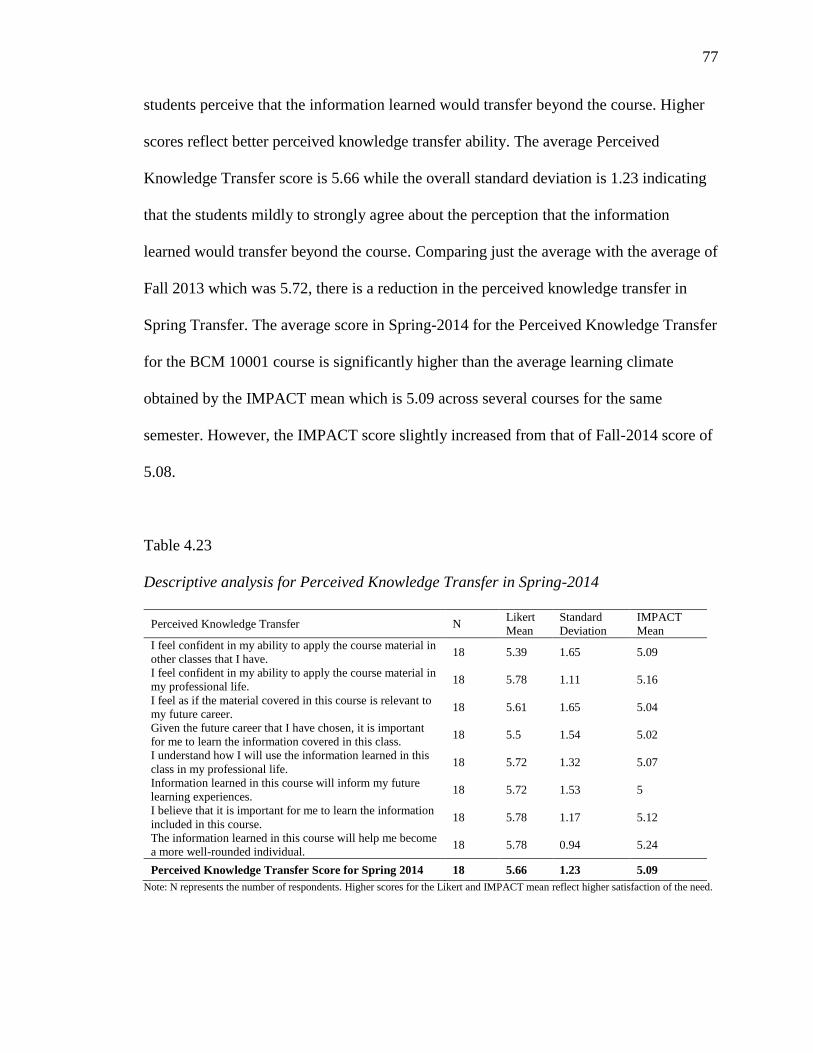
77
students perceive that the information learned would transfer beyond the course. Higher
scores reflect better perceived knowledge transfer ability. The average Perceived
Knowledge Transfer score is 5.66 while the overall standard deviation is 1.23 indicating
that the students mildly to strongly agree about the perception that the information
learned would transfer beyond the course. Comparing just the average with the average of
Fall 2013 which was 5.72, there is a reduction in the perceived knowledge transfer in
Spring Transfer. The average score in Spring-2014 for the Perceived Knowledge Transfer
for the BCM 10001 course is significantly higher than the average learning climate
obtained by the IMPACT mean which is 5.09 across several courses for the same
semester. However, the IMPACT score slightly increased from that of Fall-2014 score of
5.08.
Table 4.23
Descriptive analysis for Perceived Knowledge Transfer in Spring-2014
Perceived Knowledge Transfer N Likert
Mean
Standard
Deviation
IMPACT
Mean
I feel confident in my ability to apply the course material in
other classes that I have. 18 5.39 1.65 5.09
I feel confident in my ability to apply the course material in
my professional life. 18 5.78 1.11 5.16
I feel as if the material covered in this course is relevant to
my future career. 18 5.61 1.65 5.04
Given the future career that I have chosen, it is important
for me to learn the information covered in this class. 18 5.5 1.54 5.02
I understand how I will use the information learned in this
class in my professional life. 18 5.72 1.32 5.07
Information learned in this course will inform my future
learning experiences. 18 5.72 1.53 5
I believe that it is important for me to learn the information
included in this course. 18 5.78 1.17 5.12
The information learned in this course will help me become
a more well-rounded individual. 18 5.78 0.94 5.24
Perceived Knowledge Transfer Score for Spring 2014 18 5.66 1.23 5.09
Note: N represents the number of respondents. Higher scores for the Likert and IMPACT mean reflect higher satisfaction of the need.
78
For Fall of 2014, descriptive analysis tests were conducted on the post-survey
data to measure the average values for the perceived knowledge transfer and the overall
standard deviations at the end of the semester, the results of which are shown in Table
4.24. The descriptive analysis provided and calculated for the questions in which at least
15 students, and 25% of the students enrolled in the section responded to in order to
prevent statistical anomalies. Perceived Knowledge Transfer reflects that to what extent
students perceive that the information learned would transfer beyond the course. Higher
scores reflect better perceived knowledge transfer ability. The average Perceived
Knowledge Transfer score is 5.63 overall and the standard deviation is 1.01 indicating
that the students mildly to strongly agree about the perception that the information
learned would transfer beyond the course. Comparing just the average of Fall-2014 with
the average of Spring-2014 as well as Fall-2013 there is a reduction in the perceived
knowledge transfer. However, the difference is not significant and it is important to
observe that the there is a significant difference in the standard deviation indicating the
presence of data at both ends of the spectrum. The average score in Fall 2014 for the
Perceived Knowledge Transfer for the BCM 10001 course is significantly higher than the
average learning climate obtained by the IMPACT team which is 5.06 across several
courses for the same semester. However, the IMPACT score slightly decreased from that
of Spring-2014 score of 5.09.
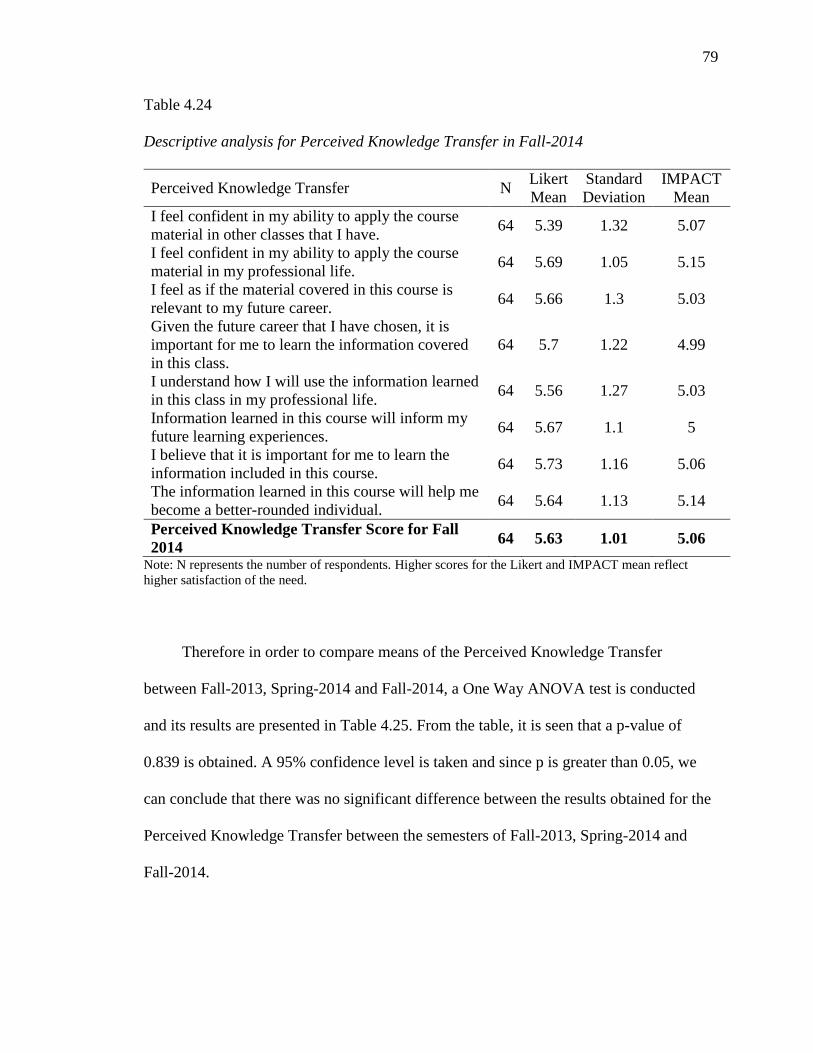
79
Table 4.24
Descriptive analysis for Perceived Knowledge Transfer in Fall-2014
Perceived Knowledge Transfer N Likert
Mean
Standard
Deviation
IMPACT
Mean
I feel confident in my ability to apply the course
material in other classes that I have. 64 5.39 1.32 5.07
I feel confident in my ability to apply the course
material in my professional life. 64 5.69 1.05 5.15
I feel as if the material covered in this course is
relevant to my future career. 64 5.66 1.3 5.03
Given the future career that I have chosen, it is
important for me to learn the information covered
in this class.
64 5.7 1.22 4.99
I understand how I will use the information learned
in this class in my professional life. 64 5.56 1.27 5.03
Information learned in this course will inform my
future learning experiences. 64 5.67 1.1 5
I believe that it is important for me to learn the
information included in this course. 64 5.73 1.16 5.06
The information learned in this course will help me
become a better-rounded individual. 64 5.64 1.13 5.14
Perceived Knowledge Transfer Score for Fall
2014 64 5.63 1.01 5.06
Note: N represents the number of respondents. Higher scores for the Likert and IMPACT mean reflect
higher satisfaction of the need.
Therefore in order to compare means of the Perceived Knowledge Transfer
between Fall-2013, Spring-2014 and Fall-2014, a One Way ANOVA test is conducted
and its results are presented in Table 4.25. From the table, it is seen that a p-value of
0.839 is obtained. A 95% confidence level is taken and since p is greater than 0.05, we
can conclude that there was no significant difference between the results obtained for the
Perceived Knowledge Transfer between the semesters of Fall-2013, Spring-2014 and
Fall-2014.

80
Table 4.25
One way ANOVA tests on post-surveys of Fall-2013, Spring-2014 and Fall-2014.
Sum of
squares
Degrees of
freedom
mean
square Fs P
Variance
component
(%)
Between Groups 0.301 2 0.151 0.175 0.839
Within Groups 91.02 106 0.859
Total 91.321 108 Note: Significant at p<0.05 level
Figure 4.7 provides a comparison of the Perceived Knowledge Transfer of BCM
10001 and the IMPACT Mean for each of semesters. It is clear from the figure as well
that there is no significant difference in the Perceived Knowledge Transfer between one
semester and another.
Figure 4.7. Comparison of average Perceived Knowledge Transfer Score
81
Therefore, the following null hypothesis is true:
H30: There is no change in the student perception of transfer of knowledge perceived by
the students of each semester in comparison to the other two semesters (Fall-2014, Fall-
2013 and Spring-2014)
It can be concluded that there is no change in the perceived knowledge transfer
with the infusion of active learning element in each semester as compared to the other
two semesters.
4.4 Summary
The scores for Learning Climate, Basic Psychological Needs and Perceived
Knowledge transfer were calculated by the methods of One-Way ANOVA and
Descriptive Statistics. It is seen from Table 4.26 that two of the three null hypotheses
were proven to be false. It is important to note that, for each semester, the BCM 10001
mean was significantly higher than that of the IMPACT mean. Also, it is seen that
Spring-2014 had the best learning climate while Fall-2013 had better perception of the
Basic Psychological Needs transfer. However, there was no significant difference in the
perceived knowledge transfer amongst the three semesters.
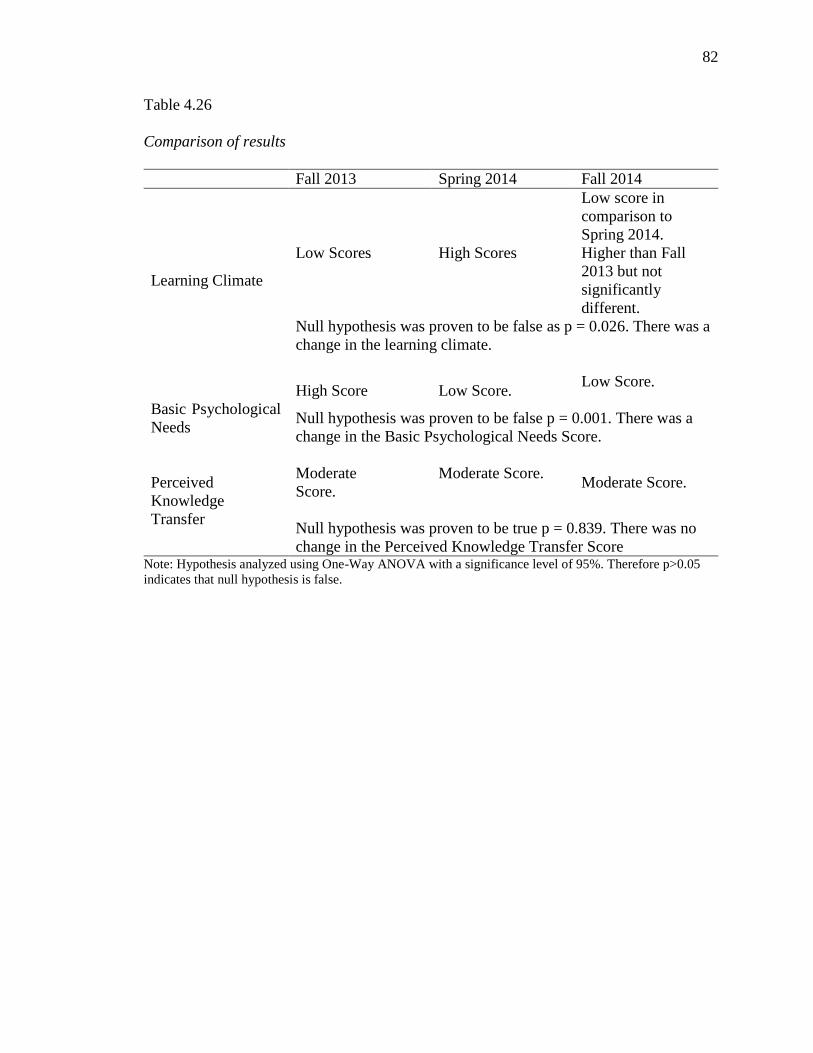
82
Table 4.26
Comparison of results
Fall 2013 Spring 2014 Fall 2014
Learning Climate
Low Scores High Scores
Low score in
comparison to
Spring 2014.
Higher than Fall
2013 but not
significantly
different.
Null hypothesis was proven to be false as p = 0.026. There was a
change in the learning climate.
Basic Psychological
Needs
High Score Low Score. Low Score.
Null hypothesis was proven to be false p = 0.001. There was a
change in the Basic Psychological Needs Score.
Perceived
Knowledge
Transfer
Moderate
Score.
Moderate Score.
Moderate Score.
Null hypothesis was proven to be true p = 0.839. There was no
change in the Perceived Knowledge Transfer Score Note: Hypothesis analyzed using One-Way ANOVA with a significance level of 95%. Therefore p>0.05
indicates that null hypothesis is false.

83
CHAPTER 5. DISCUSSIONS, CONCLUSIONS & RECOMMENDATIONS
This thesis looked into evaluating the impact of infusing the development of active
learning elements into a large intake foundational course at Purdue University over the
course of three semesters to assess the learning climate, basic psychological needs and
the perceived knowledge transfer of the students in the class. Utilizing the data that the
IMPACT team collected over the semesters of Fall-2013, Spring-2014 and Fall-2014, the
results of this study helps understand the impact of the different elements of active
learning in a classroom. The results obtained each semester are compared to the overall
IMPACT results as well. Based on the results of the study, inference can be made as to
whether the active learning components can be applied to other classes.
5.1 Discussion
The author was present in the class all three semesters and some of the observations
have been discussed along with the results obtained from the data analysis. The
discussion for the thesis has been arranged into three sections and is as follows:
1. Learning Climate:
The comparison between pre-survey and post-survey for every semester to measure
the learning climate revealed no significant difference between the results obtained in two
84
surveys within a semester. This can attributed to the lack of responses to the pre-surveys
of all the semesters. Upon comparing the post-survey descriptive analysis results it was
seen that the learning climate in the Fall-2013 semester was lower than the other two
semesters indicating a more faculty centered learning than student centered learning inthe
Fall-2013 semester. Fall 2013 had the least amount of active learning elements infused
into the course in comparison to the other two semesters. Although the classes were being
held in an IMPACT classroom B848 at Hicks undergraduate library that had a capacity of
117 with the semester’s enrollment being 109. The classroom consisted of various
facilities including that of an instructor station, collaborative working tables that could be
moved around projector, etc., the assessments were made through conventional
paper/blackboard exams and quizzes as well as in class activities which were graded.
This result is consistent with literature findings.
It is seen in both the descriptive analysis and One-Way ANOVA tests that Spring-
2014 had a better learning climate than Fall-2014 although Fall 2014 had higher amounts
of active learning. During Spring 2014, the classes were held at the IMPACT classroom
B853 located at Hicks undergraduate library. The room included 3 projectors, one
instructor station with document camera, and several whiteboards, collaborative working
tables that could not be moved around. The room also had a lower capacity of 90 and the
enrollment for the semester was 57 resulting in higher faculty-student ratio. Immediate
feedback assessment used for quizzes and exams. The author observed that the students
enjoyed taking quizzes using this technique and there was a sense of enthusiasm to take a
test that was not observed in Fall 2013. Spring 2014 had lower intake and used a different

85
classroom and assessment methods in comparison to that of Fall 2013 and Fall 2014
which may be factors that resulted in a better learning climate.
Fall 2014 had the highest amount of active learning yet saw results much lower than
Spring 2014 and comparable to that of Fall 2013 which had the least amount of active
learning. One of the possible reasons for the low learning climate maybe due to the fact
that both Fall 2013 and Fall 2014 used the same classroom that is IMPACT classroom
B848 at Hicks undergraduate library that had a capacity of 117 with the enrollments in
Fall 2013 and Fall 2014 being 109 and 96 respectively. These enrollments are
significantly higher than that of Spring 2014 leading to a lower student-faculty ratio. Both
Fall 2013 and Fall 2014 had assessment methods that were different from each other as
well as that of Spring 2014. Also, Fall 2014 implemented the use of an online textbook in
comparison to the conventional textbook used in the other two semester which may have
caused the reduction in learning climate despite the increase in active learning elements
in the course. The author also observed that the students were not used to the online
textbook. Also, since it was the first time the online textbook was being implemented,
there was a lot of confusion in the classroom pertaining to the textbook and the
assessment within them. In order to ascertain the effect of the online textbook on the
learning climate, data from a future semester utilizing the book may be analyzed. The
above reasons and discussions are mere speculations and future research must be
conducted to ascertain the exact cause of the reduction in learning climate.
The average for each of the semesters for this section were significantly higher than
the IMPACT mean obtained for the learning climate across several courses indicating
that BCM 10001 had higher student centeredness than most courses associated with

86
IMPACT. The IMPACT mean is measured across around 120 large enrollment
foundational courses similar to that of BCM 10001. However, the exact differences
between the learning climates of these courses with that of BCM 10001 is not known.
2. Basic Psychological Needs:
The comparison between pre-survey and post-survey for every semester to measure
the Basic Psychological Needs revealed no significant difference between the results
obtained in two surveys within a semester. This can attributed to the lack of responses to
the pre-surveys. Upon comparing the post-survey results of Fall-2013, Spring-2014 and
Fall-2014, it was found that Fall-2013 provided the highest Basic Psychological Needs
satisfaction. Fall 2013 had the lowest amount of active learning elements infused into the
course which means that the course was more faculty centered than the other two
semesters. The reason behind the high satisfaction may be due to the fact that most
courses that a student attends through the day would be similar to that of Fall 2013
providing a sense of familiarity to the students allowing them to feel more
psychologically satisfied with the course.
Spring-2014 provided the lowest Basic Psychological Needs satisfaction although the
result was not significantly different from that of Fall-2014. Spring 2014 had the highest
amount of student centeredness measured in terms of learning climate as compared to the
other two semesters. The reason for the low satisfaction maybe due to the fact that the
course was significantly different from the normal courses the students attend which are
highly faculty centered. Although Fall 2014 had higher amounts of active learning, the
results are not significantly different from that of Spring 2014. This may be due to the

87
introduction of the online textbook or the assessment method which is different from the
other two semesters. Assessments for the semester were done within the textbook. These
discussion are mere speculations and further research needs to be conducted in order to
ascertain the exact cause low basic psychological needs satisfaction in the semesters that
have higher student centeredness and active learning elements. The average for each of
the semesters for this section were significantly higher than the IMPACT mean obtained
for the learning climate across several courses indicating that BCM 10001 had higher
satisfaction of the basic psychological need than most courses associated with IMPACT.
The IMPACT mean is measured across around 120 large enrollment foundational courses
similar to that of BCM 10001. However, the exact differences between the basic
psychological needs of these courses with that of BCM 10001 is not known.
3. Perceived Knowledge Transfer:
The comparison between pre-survey and post-survey for every semester to measure
the Perceived Knowledge Transfer revealed no significant differences between the results
obtained in two surveys within a semester. This can attributed to the lack of responses to
the pre-surveys. Upon comparing the post-survey results of Fall-2013, Spring-2014 and
Fall-2014, there was no significant difference in the way the students perceived their
knowledge transferred. This may be due to the fact the instructor and the content of the
course remained the same although method of content delivery varied. In all three
semesters, the author observed in class that the students recognized the importance of the
course and were enthusiastic about the knowledge gained. The average for each of the
semesters for this section were significantly higher than the IMPACT mean obtained
88
across several courses indicating that students BCM 10001 had better perception of the
knowledge being transferred than most courses associated with IMPACT. The IMPACT
mean is measured across around 120 large enrollment foundational courses similar to that
of BCM 10001. However, the exact differences between the perceived knowledge
transfer of these courses with that of BCM 10001 is not known.
5.2 Conclusions
The conclusions for the thesis have been arranged into three sections and are as
follows:
1. Learning Climate
Learning Climate refers to students’ perceptions of the student‐centeredness of the
learning environment. The results of this thesis show that the Learning Climate in
Fall-2013 semester was lower than the other two semesters indicating a more faculty
centered learning than student centered learning in the Fall-2013 semester. This indicated
that the other two semesters had a better learning climate than Fall-2013 which had the
least amount of active learning elements infused into the course.
However, Spring-2014 had higher learning climate scores in comparison to Fall-2014
although the latter had higher amounts of active learning elements in class along with the
inclusion of an online textbook. It is not clear as to what caused the reduction of the
learning climate and further testing is necessary to determine the exact cause making the
students perceive the course to be faculty centered when the intent of the infusion is to
increase the student centeredness in the Fall of 2014. If the infusion of active learning in
Fall-2014 improved the student centeredness of the course, then it can be concluded that

89
the replacement of a conventional textbook with an online textbook would be the cause of
reduction in learning climate from Spring-2014 to Fall-2014 although Fall-2014 had
higher active learning components in comparison to the other two semesters. This is a
speculation based on the author’s observation in class. Further research needs to be
conducted on data obtained from the future semesters utilizing the online book as well as
the impact of introducing an online textbook into an active learning classroom in order to
ascertain the stated speculation. As discussed earlier, Spring 2014 had the lowest
enrollment in comparison to the other two semesters leading to a better faculty to student
ratio, better diversity and different classroom being utilized for the course which may
also have been factors that influenced a better learning climate in comparison to the other
two semesters.
2. Basic Psychological Need
The Basic Psychological Need in the form measured in this thesis and by the
IMPACT team is based on the Self Determination Theory as mentioned earlier. SDT
addresses autonomy, relatedness, and competency as determinants of motivation.
However, Niemiec & Ryan did make mention in their research that educators introduce
external controls into learning climates, which can undermine the sense of relatedness
between teachers and students, and stifle the natural, volitional processes involved in
high-quality learning (Niemiec & Ryan, 2009). It was interesting to find that the semester
with the least amount of Active Learning elements provided the highest amount of
motivation and psychological satisfaction. It was also interesting to find that the semester
(Spring-2014) with the highest learning climate provided the lowest Basic Psychological
90
Needs satisfaction although the result was not significantly different from that of Fall-
2014. This is finding is in accordance with Niemiec & Ryan’s research and indicates that
the infusion of active learning elements into learning climates can possibly undermine the
Basic Psychological Needs of the students (Niemiec & Ryan, 2009).
3. Perceived Knowledge Transfer
It was seen in the literature review that engagement in higher levels of Bloom’s
taxonomy may improve the students’ perception of knowledge transfer (King, 1993;
Mazzolini & Maddison, 2003). Upon comparing the results of Fall-2013, Spring-2014
and Fall-2014, it was found that there was no significant difference in the way the
students perceived their knowledge to be transferred. This may be due to the fact that the
instructor and the content of the course remained the same for all three semesters.
However, it is important to note that in three semesters, the perceived knowledge transfer
ranged between mildly to strongly agree indicating that the students in all semesters
understood, to a very large extent, the importance and applicability of the knowledge
obtained in the course.
However, the average for each of the semesters for each of the sections were
significantly higher than the IMPACT mean obtained for the learning climate across
several courses. As seen in Figure 5.1, it can be concluded that the BCM 10001 course is
doing much better than most courses associated with IMPACT undergoing a
transformation in order to be more student centered.

91
Figure 5.1. Comparison between BCM 10001 and other courses associated with
IMPACT
5.3 Recommendations and Future Research
Infusion of active learning elements into the classroom improved the learning
climate from Fall-2013 to Spring-2014 for the BCM 10001 course. The active learning
elements infused in Spring-2014 were that classes were being held in IMPACT
classrooms that support active learning by incorporating collaborative working tables,
interactive smart-boards, and multiple projector facilities. There was also a reduction in
the amount lecture time and quizzes were now taken using an immediate feedback
assessment technique instead. It is recommended to continue having the above active
learning elements infused in these two semesters throughout the course although there
was reduction in the Basic Psychological Needs perception.
92
The third semester, Fall-2014, utilized an online textbook in place of a conventional
textbook used in the previous semesters and all assessments were done online, within the
textbook. There was a reduction in the amount of lecture time and a significant increase
in the active learning time and reduction of lecture time in comparison to previous
semesters but this also led to a reduction in the Learning Climate and Basic Psychological
Needs. This reduction in the learning climate may be due to the classroom utilized, high
enrollment during the semester leading to lower faculty-student ratio and/or the
introduction of an online textbook. This is however a speculation drawn from the results
obtained and therefore, till future research has been made, it is recommended that the
classes be conducted in B853 with lower enrollment, elements of an online textbook be
replaced with the conventional textbook and the assessments done within the textbook be
switched back to using the immediate feedback assessment methods. The perceived
knowledge transfer remained the same throughout all the semesters. In order to see a
change in the perceived knowledge transfer, a change in the course content and instructor
would need to be made. However, the average score obtained for the BCM 10001 course
in each of the semesters for all the sections were significantly higher than the IMPACT
mean obtained for the corresponding sections across several courses indicating that the
course is doing much better than most IMPACT courses.
In a nutshell, the recommendations are as follows:
1. Infusion of Active Learning Elements made in Spring-2014 must be continued as
they increased the learning climate of the course and classes must be conducted in
the low capacity classroom B853 which led to higher faculty-student ratio.
93
2. The elements introduced in Fall-2014 lowered the learning climate as well and the
Basic Psychological needs. Therefore the presence of an online textbook and
excess reduction of lecture time and increase in active learning time must be
looked into.
3. There may be a measured change in the perception of knowledge transfer with a
change in the instructor and/or syllabus. In order to see an increase in the
perception, a change in either of them or both is recommended.
The future research needed to be conducted is as follows:
1. Future research should look into finding the right amount of active learning
elements that can be infused without lowering the learning climate.
2. Further research needs to be done by collecting data from future semesters which
utilize the online textbook to check if the learning climate improved with the
increase in instructor and student comfort for utilizing the textbook.
3. It is recommended that in the future, it should be ascertained whether the
introduction of an online textbook lowered the learning climate. Also, it should be
studied as to what can be done to balance the learning climate with the
introduction of an online textbook within an active classroom. Research should
look into assessing as to whether the online nature of the textbook itself caused
the reduction in the learning climate or whether it was an issue with this particular
textbook and the way it was designed or adapted that caused the reduction.
4. Future research should investigate as to what could be done to increase the Basic
Psychological Needs within an active classroom and identify the exact causes of
94
the current reduction. Impact of each of the sub-factors of the Basic Psychological
Need namely Autonomy, Competence and Relatedness in order to determine the
type of motivation within the classroom.
5. Research should further investigate as to how the perceived knowledge transfer of
a course can be increased through active learning elements without changing the
syllabus of the course or the instructor. Investigation on whether a change in
either the syllabus or the instructor or both causes a change in the perceived
knowledge transfer needs to be made.
Overall, this study helps faculty evaluate the learning climate of the classroom,
understand as to whether the basic psychological needs of the classroom were met and if
there is perception of knowledge transfer. Based on the results of the study, a large
enrollment foundational course similar to that of BCM 10001 can infer from this study
that the learning climate of a course can be improved with the infusion of active learning
elements within a classroom along with reduction in conventional lecture. It can also be
inferred that a lower enrollment leading to higher faculty student-ratio may be beneficial
for the learning climate. However, the increase in learning climate through active
learning element may cause a significant reduction the satisfaction of the students’ Basic
Psychological Needs but will not alter the students’ perception of the knowledge transfer
as long as the instructor and the course content remain the same.

REFERENCES
95
REFERENCES
Arndt, P. A. (2012). Design of learning spaces: Emotional and cognitive effects of
learning environments in relation to child development. Mind, Brain, and
Education, 6(1), 41-48.
Arthur, W., & Zelda, F. (1987). Seven Principles for Good Practice in Undergraduate
Education. American Association for Higher Education, Washington, D.C., (080),
3–7.
B848 [Print Photo]. Retrieved from [Print Photo]. Retrieved from
http://guides.lib.purdue.edu/content.php?pid=463634&sid=3931599
B853 [Print Photo]. Retrieved from
http://guides.lib.purdue.edu/content.php?pid=463634&sid=3931596
Baldwin, R. G. (2009). The climate for undergraduate teaching and learning in STEM
fields. New Directions for Teaching and Learning, 2009(117), 9-17.
Black, A. E., & Deci, E. L. (2000). The effects of instructors' autonomy support and
students' autonomous motivation on learning organic chemistry: A self‐determination theory perspective. Science education, 84(6), 740-756.
Blair, J., Czaja, R. F., & Blair, E. A. (2013). Designing surveys: A guide to decisions and
procedures. Sage Publications.
Bland, J. M., & Altman, D. G. (1996). Statistics notes: measurement error.
Bmj, 313(7059), 744.
Boiché, J., Sarrazin, P. G., Grouzet, F. M., Pelletier, L. G., & Chanal, J. P. (2008).
Students' motivational profiles and achievement outcomes in physical education: A
self-determination perspective. Journal of Educational Psychology, 100(3), 688.
Bringle, R. G., & Hatcher, J. A. (1999). Reflection in service learning: Making meaning
of experience. Educational Horizons, 77, 179-185.

96
Bringle, R. G., & Hatcher, J. A. (2011). International service learning. In R. G. Bringle, J.
A. Hatcher, & S. G. Jones (Eds.), IUPUI Series on Service Learning Research:
International Service Learning: Conceptual Frameworks and Research (pp. 21–46).
Broeck, A., Vansteenkiste, M., Witte, H., Soenens, B., & Lens, W. (2010). Capturing
autonomy, competence, and relatedness at work: Construction and initial validation
of the Work‐related Basic Need Satisfaction scale. Journal of Occupational and
Organizational Psychology, 83(4), 981-1002.
Bruffee, K. A. (1984). Collaborative learning and the" conversation of mankind". College
English, 635-652.
By, T. (2011). Formalizing Game-play. Simulation & Gaming, 1046878110388239.
Chen, K. C., & Jang, S. J. (2010). Motivation in online learning: Testing a model of self-
determination theory. Computers in Human Behavior, 26(4), 741-752.
Chickering, A. W., & Gamson, Z. F. (1987). Seven principles for good practice in
undergraduate education. AAHE bulletin, 3, 7.
Ciani, K. D., Sheldon, K. M., Hilpert, J. C., & Easter, M. A. (2011). Antecedents and
trajectories of achievement goals: A self‐determination theory perspective. British
Journal of Educational Psychology, 81(2), 223-243.
Couper, M. P. (2000). Review: Web surveys: A review of issues and approaches. Public
opinion quarterly, 464-494.
Couper, M. P., & Nicholls, W. L. II (1998). The history and development of computer
assisted survey information collection methods. Computer assisted survey
information collection. New York: Wiley.
Cox, M. D. (2004). Introduction to faculty learning communities. New directions for
teaching and learning, 2004(97), 5-23
Creswell, J. W. (2003). Research design: Qualitative, quantitative, and mixed methods
approaches. Sage.
Deci, E. L. (1971). Effects of externally mediated rewards on intrinsic
motivation. Journal of personality and Social Psychology, 18(1), 105.
Dewey, J. (1916). Democracy and education. New York: Free P
Dewey, J. (1985). Democracy and education, 1916. J. A. Boydston, & P. Baysinger
(Eds.). Carbondale: Southern Illinois University Press.
97
Dillenbourg, P. (1999). What do you mean by collaborative learning? Collaborative-
learning: Cognitive and Computational Approaches.1-19.
Dillman, D. A. (2000). Mail and internet surveys: The tailored design method (Vol. 2).
New York: Wiley.
Epstein, M. L., Lazarus, A. D., Calvano, T. B., Matthews, K. A., Hendel, R. A., Epstein,
B. B., & Brosvic, G. M. (2010). Immediate feedback assessment technique promotes
learning and corrects inaccurate first responses. The Psychological Record, 52(2), 5.
Gall, J. P., Gall, M. D., & Borg, W. R. (1999). Applying educational research: A practical
guide.
Garrison, D. R., Anderson, T., & Archer, W. (2001). Critical thinking, cognitive
presence, and computer conferencing in distance education. American Journal of
distance education, 15(1), 7-23.
Gilboy, M. B., Heinerichs, S., & Pazzaglia, G. (2014). Enhancing Student Engagement
Using the Flipped Classroom. Journal of nutrition education and behavior.
Giles, D. E., & Eyler, J. (1994). The theoretical roots of service-learning in John Dewey:
Toward a theory of service-learning. Michigan Journal of Community Service
Learning, 1(1), 77-85.
Goertz, M. E., Oláh, L. N., & Riggan, M. (2009). From Testing to Teaching: The Use of
Interim Assessments in Classroom Instruction. CPRE Research Report# RR-
65. Consortium for Policy Research in Education.
Gohn, C. (2012). Gambling culture in China as compared to that of India. In Asia Pacific
Gambling Studies Conferences.
Grabinger, R. S., & Dunlap, J. C. (1995). Rich environments for active learning: A
definition. Research in learning Technology, 3(2).
Gunawardena, C. N. (1995). Social presence theory and implications for interaction and
collaborative learning in computer conferences. International journal of educational
telecommunications, 1(2), 147-166.
Hager, W. R. (1974). An Investigation of Verbal Behavior and Learning Climate in
Undergraduate Engineering Classrooms. Journal of Research in Science Teaching,
11(2), 121–131.
Howland, J. L., & Moore, J. L. (2002). Student perceptions as distance learners in
Internet-based courses. Distance education, 23(2), 183-195.
98
Ilardi, B. C., Leone, D., Kasser, T., & Ryan, R. M. (1993). Employee and Supervisor
Ratings of Motivation: Main Effects and Discrepancies Associated with Job
Satisfaction and Adjustment in a Factory Setting1. Journal of Applied Social
Psychology, 23(21), 1789-1805.
IMPACT Management Team & IMPACT Assessment Team. (2014a). IMPACT Data
Collection and Analysis Team, Part 1. IMPACT Reports, Paper 2. Retrieved from
http://docs.lib.purdue.edu/impactreps/2
IMPACT Management Team & IMPACT Assessment Team. (2014b). IMPACT Data
Collection and Analysis Team, Part 2. IMPACT Reports, Paper 3. Retrieved from
http://docs.lib.purdue.edu/impactreps/3
IMPACT Management Team & IMPACT Assessment Team. (2014c). IMPACT Data
Collection and Analysis Team, Part 3. IMPACT Reports, Paper 4.
Ke, F. (2010). Examining online teaching, cognitive, and social presence for adult
students. Computers & Education, 55(2), 808–820.
doi:10.1016/j.compedu.2010.03.013
King, A. (1993). From Sage on the Stage to Guide on the Side. College Teaching.
Leeuw, E. D., & Collins, M. (1997). Data collection methods and survey quality: an
overview. Survey measurement and process quality, 197-220.
Levesque-Bristol, C. (2014). Annual IMPACT Report 2014: A report by the IMPACT
Data Collection and Analysis Team, Part 2.
Levesque-Bristol, C., Weaver, G., & Parker, L. C. (2012). Developing, Implementing and
Assessing Large- Scale Redesign Effort at a Research University : Tales from the
IMPACT Initiative at Purdue University.
Linehan, C., Kirman, B., Lawson, S., & Chan, G. (2011, May). Practical, appropriate,
empirically-validated guidelines for designing educational games. In Proceedings of
the SIGCHI Conference on Human Factors in Computing Systems (pp. 1979-1988).
ACM.
Liu, Z. (2006). Print vs. electronic resources: A study of user perceptions, preferences,
and use. Information Processing & Management, 42(2), 583-592.
Marsh, T. (2011). Serious games continuum: Between games for purpose and experiential
environments for purpose. Entertainment Computing, 2(2), 61-68.
Mason, E. (1970). Collaborative learning. London: Ward Lock Educational.

99
Mazzolini, M., & Maddison, S. (2003). Sage, guide or ghost? The effect of instructor
intervention on student participation in online discussion forums. Computers &
Education, 40(3), 237-253.
Michael, D. R., & Chen, S. L. (2005). Serious games: Games that educate, train, and
inform. Muska & Lipman/Premier-Trade.
Mills, J. D. (2002). Using computer simulation methods to teach statistics: A review of
the literature. Journal of Statistics Education, 10(1), 1-20.
Mills, R. (2003). The centrality of learner support in open and distance learning: A
paradigm shift in thinking. Rethinking learner support in distance education:
Change and continuity in an international context, 102-113.
Moore, M. G. (1993). 2 Theory of transactional distance. Theoretical principles of
distance education, 22.
Morris, R. C., Parker, L. C., Nelson, D., Pistilli, M. D., Hagen, A., Levesque-Bristol, C.,
& Weaver, G. (2014). Development of a Student Self-Reported Instrument to Assess
Course Reform. Educational Assessment, 19(4), 302-320.
Nathan, G. (2001). Telesurvey Methodologies for Household Surveys-A Review and
Some Thoughts for the Future?. Survey Methodology, 27(1), 7-32.
Niemiec, C. P., & Ryan, R. M. (2009). Autonomy, competence, and relatedness in the
classroom: Applying self-determination theory to educational practice. Theory and
Research in Education, 7(2), 133-144.
Nunnally, J. C., Bernstein, I. H., & Berge, J. M. T. (1967). Psychometric theory(Vol.
226). New York: McGraw-Hill.
O'Brien, E. J., & Epstein, S. (1988). The multidimensional self-esteem inventory:
Professional manual. Psychological Assessment Resources.
Pargellis, S., & Farrand, M. (1949). The Autobiography of Benjamin Franklin. The
Mississippi Valley Historical Review, 36(3), 504.
Perry, E. H., & Pilati, M. L. (2011). Online learning. New Directions for Teaching and
Learning, 2011(128), 95-104.
Prince, M. (2004). Does active learning work? A review of the research. Journal of
engineering education, 93(3), 223-231.
Ryan, R. M. (1995). Psychological needs and the facilitation of integrative
processes. Journal of personality, 63(3), 397-427.

100
Ryan, R. M., Connell, J. P., & Deci, E. L. (1985). A motivational analysis of self-
determination and self-regulation in education. Research on motivation in
education: The classroom milieu, 2, 13-51.
Ryan, R. M., & Deci, E. L. (2000a). Intrinsic and Extrinsic Motivations: Classic
Definitions and New Directions. Contemporary Educational Psychology, 25(1), 54–
67. http://doi.org/10.1006/ceps.1999.1020
Ryan, R. M., & Deci, E. L. (2000b). Self-determination theory and the facilitation of
intrinsic motivation, social development, and well-being. American Psychologist,
55(1), 68–78. http://doi.org/10.1037//0003-066X.55.1.68
Seligman, M. (1975). Helplessness San Francisco.
Shaikholeslami, R., & Khayyer, M. (2006). INTRINSIC MOTIVATION, EXTRINSIC
MOTIVATION AND LEARNING ENGLISH AS A FOREIGN LANGUAGE 1.
Pyschological Reports, 99(3), 813–818.
Sheldon, K. M., Ryan, R. M., & Reis, H. T. (1996). What makes for a good day?
Competence and autonomy in the day and in the person. Personality and Social
Psychology Bulletin, (22), 1270-1279.
Smith, P. C, Kendall, L. M., & Hulin, C. L. (1969). The measurement of satisfaction in
work and retirement. Chicago: Rand McNally
Smith, R. (1995). Essential techniques for military modelling & simulation. In
Proceedings of the 30th conference on winter simulation (pp. 805–812). IEEE
Computer Society Press.
Smith, R. (2009). The Long History of Gaming in Military Training. Simulation &
Gaming, 41(1), 6–19. http://doi.org/10.1177/1046878109334330
Smith, R. (2014). The oxford handbook of virtual reality. (M. Grimshaw, Ed.).
Squire, K. D. (2008). Video Games and Education : Designing Learning Systems for an
Interactive Age. Educational Technology, 48(2), 17–26.
Stewart, D. C. (1988). Collaborative and Composition : Learning Boon or Bane ?
Rhetoric Review, 7(1), 58–83.
Susi, T., Johannesson, M., & Backlund, P. (2007). Serious Games – An Overview.
Tait, A. (2000). Planning Student Support for Open and Distance Learning. Open
Learning: The Journal of Open and Distance Learning, 15(3), 287–299.
http://doi.org/10.1080/713688410
101
Tait, A. (2004). Re-thinking Learner Support in Distance Education: Change and
Continuity in an International Context (p. 232). Routledge.
Vallerand, R. J., Pelletier, L. G., Blais, M. R., Briere, N. M., Senecal, C., & Vallieres, E.
F. (1992). The Academic Motivation Scale: A Measure of Intrinsic, Extrinsic, and
Amotivation in Education. Educational and Psychological Measurement, 52(4),
1003–1017. http://doi.org/10.1177/0013164492052004025
Weissinger, E., & Bandalos, D. L. (1995). Development, reliability and validity of a scale
to measure intrinsic motivation in leisure. Journal of Leisure Research, 27(4), 379.
Weiner, M. ., & Milton, G. (1959). An introduction to war games.
Williams, G. C., Krusch, D., Papciak, A., & Ryan, R. M. (1992). Motivation in a pain
rehabilitation program. Unpublished manuscript, University of Rochester.
Wu, Z., & Choi, T. Y. (2013). Triadic Relations in a Game of Pachisi, 11(4), 305–312.

APPENDICES

102
Appendix A Fall 2013 Survey
Fall 2013 IMPACT Student Survey Questions and Constructs
Are you still enrolled in BCM 1001 being taught in ...
What is your age in years? (Please use a numerical / response, for example, 25)
Do any elements of BCM 1001 meet in-person, or is the entire...
Classroom Space
Use the scale below to indicate / your level of agreement with each of the items below...
1. The classroom physical space met my needs for learning.
2. The instructor utilized classroom technologies which further engaged my interest in the
class.
About the Learning Experience
The questions below are related to your learning experience in ...
1. My instructor provided me with choices and options on how to complete the work.
2. My instructor understood my perspective.
3. My instructor encouraged me to ask questions.
4. My instructor listened to how I would like to do things.
5. My instructor tried to understand how I saw things before suggesting a new way to do
things.
6. My instructor stimulated my interest in the subject.
7. My instructor made sure I really understood the goals of the course and what I needed
to do.
8. The instructor encouraged students to learn from each other.
9. The instructor provided opportunities for students to challenge opinions expressed in
the course.
10. The instructor connected course content to students’ experience and knowledge.
11. The instructor asked students to explain their ideas.
12. The instructor encouraged students to participate actively in class.
13. The instructor provided opportunities for students to ask questions.
14. The instructor provided opportunities for students to process new information.
15. The instructor allowed students to answer a question or solve a problem in more than
one way.
16. The instructor maintained a climate of respect within the course for what others had
to say.
Your Overall Experience
The following questions concern your feelings about your experience in ...
17. I did not feel very competent in this course.
18. People in this course told me I was good at what I was doing.
19. I was able to learn interesting new skills in this course.

103
20. Most days I felt a sense of accomplishment from being in this course.
21. In this course I did not get much of a chance to show how capable I was.
22. When I was in this course I often did not feel very capable.
23. I felt confident in my ability to learn this material.
24. I was capable of learning the material in this course.
25. I was able to achieve my goals in this course.
26. I felt able to meet the challenge of performing in this course.
Please consider the following questions as they relate to BCM 1001: …
27. I feel confident in my ability to apply the course material in other classes that I have
28. I feel confident in my ability to apply the course material in my professional life
29. I feel as if the material covered in this course is relevant to my future career
30. Given the future career that I have chosen, it is important for me to learn the
information covered in this class
31. I understand how I will use the information learned in this class in my professional
life
32. Information learned in this course will inform my future learning experiences
33. I believe that it is important for me to learn the information included in this course
34. The information learned in this course will help me become a better-rounded
individual.
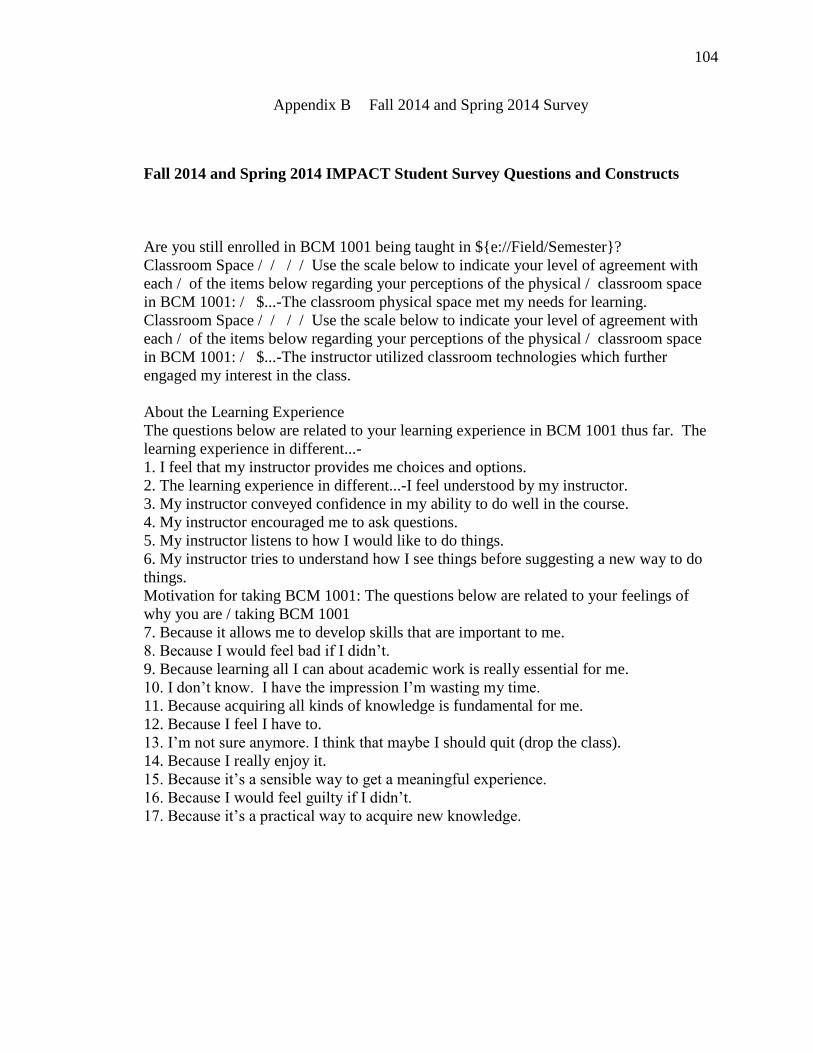
104
Appendix B Fall 2014 and Spring 2014 Survey
Fall 2014 and Spring 2014 IMPACT Student Survey Questions and Constructs
Are you still enrolled in BCM 1001 being taught in ${e://Field/Semester}?
Classroom Space / / / / Use the scale below to indicate your level of agreement with
each / of the items below regarding your perceptions of the physical / classroom space
in BCM 1001: / $...-The classroom physical space met my needs for learning.
Classroom Space / / / / Use the scale below to indicate your level of agreement with
each / of the items below regarding your perceptions of the physical / classroom space
in BCM 1001: / $...-The instructor utilized classroom technologies which further
engaged my interest in the class.
About the Learning Experience
The questions below are related to your learning experience in BCM 1001 thus far. The
learning experience in different...-
1. I feel that my instructor provides me choices and options.
2. The learning experience in different...-I feel understood by my instructor.
3. My instructor conveyed confidence in my ability to do well in the course.
4. My instructor encouraged me to ask questions.
5. My instructor listens to how I would like to do things.
6. My instructor tries to understand how I see things before suggesting a new way to do
things.
Motivation for taking BCM 1001: The questions below are related to your feelings of
why you are / taking BCM 1001
7. Because it allows me to develop skills that are important to me.
8. Because I would feel bad if I didn’t.
9. Because learning all I can about academic work is really essential for me.
10. I don’t know. I have the impression I’m wasting my time.
11. Because acquiring all kinds of knowledge is fundamental for me.
12. Because I feel I have to.
13. I’m not sure anymore. I think that maybe I should quit (drop the class).
14. Because I really enjoy it.
15. Because it’s a sensible way to get a meaningful experience.
16. Because I would feel guilty if I didn’t.
17. Because it’s a practical way to acquire new knowledge.

105
18. Because I really like it.
19. Because experiencing new things is a part of who I am.
20. Because that’s what I’m supposed to do.
21. I don’t know. I wonder if I should continue.
22. Because I would feel awful about myself if I didn’t.
23. Because it’s really fun.
24. Because that’s what I was told to do.
Your Overall Experience
The following questions concern your feelings about your / experience in BCM 1001:
Please indicate how true / each of the following...-
25. I feel like I can make a lot of inputs in deciding how my coursework gets done.
26. I really like the people in this course.
27. I do not feel very competent in this course.
28. People in this course tell me I am good at what I do.
29. I feel pressured in this course.
30. I get along with people in this course.
31. I pretty much keep to myself when in this course.
32. I am free to express my ideas and opinions in this course.
33. I consider the people in this course to be my friends.
34. I have been able to learn interesting new skills in this course.
35. My feelings are taken into consideration in this course.
36. In this course I do not get much of a chance to show how capable I am.
37. People in this course care about me.
38. There are not many people in this course that I am close to.
39. I feel like I can pretty much be myself in this course.
40. The people in this course do not seem to like me much.
41. I often do not feel very capable in this course.
42. There is not much opportunity for me to decide for myself how to go about my
coursework.
43. People in this course are pretty friendly towards me.
Relevance of the Learning Experience
Please consider the following questions as they relate to BCM 1001 and record the extent
to which you agree using the choices...
44. I feel confident in my ability to apply the course material in other classes that I
have.
45. I feel confident in my ability to apply the course material in my professional life.
46. I feel as if the material covered in this course is relevant to my future career.
47. Given the future career that I have chosen, it is important for me to learn the
information covered in this class.
48. I understand how I will use the information learned in this class in my
professional life.
49. Information learned in this course will inform my future learning experiences.
50. I believe that it is important for me to learn the information included in this
course.

106
51. The information learned in this course will help me become a better-rounded
individual.
107
Appendix C IRB Form