Assessment of the impact of on-site sanitation … of the impact of on-site sanitation systems ......
13
Environ Monit Assess DOI 10.1007/s10661-011-1965-2 Assessment of the impact of on-site sanitation systems on groundwater pollution in two diverse geological settings—a case study from India Paras R. Pujari · C. Padmakar · Pawan K. Labhasetwar · Piyush Mahore · A. K. Ganguly Received: 10 September 2010 / Accepted: 17 February 2011 © Springer Science+Business Media B.V. 2011 Abstract On-site sanitation has emerged as a pre- ferred mode of sanitation in cities experiencing rapid urbanization due to the high cost involved in off-site sanitation which requires conventional sewerages. However, this practice has put severe stress on groundwater especially its quality. Under the above backdrop, a study has been undertaken to investigate the impact of on-site sanitation on quality of groundwater sources in two mega cities namely Indore and Kolkata which are situated in two different geological settings. The parameters for the studies are distance of groundwater source from place of sanitation, effect of summer and monsoon seasons, local hydro-geological condi- tions, and physico-chemical parameters. NO 3 and fecal coliform concentrations are considered as main indexes of pollution in water. Out of many conclusions which can be made from this studies, one major conclusion is about the influence of on- site sanitation on groundwater quality is minimal in Kolkata, whereas it is significant in Indore. This difference is due to the difference in hydroge- ological parameters of these two cities, Kolkata P. R. Pujari (B ) · C. Padmakar · P. K. Labhasetwar · P. Mahore · A. K. Ganguly National Environmental Engineering Research Institute, Nehru Marg, Nagpur 440020, Maharashtra, India e-mail: [email protected] being on alluvium quaternary and Indore being on Deccan trap of Cretaceous to Paleogene age. Keywords Groundwater · On-site sanitation systems · Pollution · TDS · Nitrate · Fecal coliforms Introduction Groundwater constitutes one of the principal sources of freshwater. On a global scale, it con- stitutes about 22.6% of the freshwater available in the earth. Groundwater is a principal source for irrigation and drinking in the rural India. It continues to be a reliable source for drinking and domestic use even in urban and peri-urban areas where there is no centralized water supply by the civic authorities. In view of the groundwater being used for potable purpose, it is desirable that the quality is maintained safe as per the recom- mended guidelines (BIS 1991). The groundwater quality is deteriorated due to geogenic as well as anthropogenic factors. Among the anthropogenic factors, the impact of on-site sanitation on ground- water quality has been a subject of much concern. The contamination of groundwater due to on-site sanitation systems has been reported by different authors since the 1980s (Lu et al. 2008; Pujari et al. 2007; Dzwairo et al. 2006; NEERI report 2005; Nsubuga et al. 2004; Lawrence et al. 2001;
Transcript of Assessment of the impact of on-site sanitation … of the impact of on-site sanitation systems ......

Environ Monit AssessDOI 10.1007/s10661-011-1965-2
Assessment of the impact of on-site sanitation systemson groundwater pollution in two diverse geologicalsettings—a case study from India
Paras R. Pujari · C. Padmakar ·Pawan K. Labhasetwar · Piyush Mahore ·A. K. Ganguly
Received: 10 September 2010 / Accepted: 17 February 2011© Springer Science+Business Media B.V. 2011
Abstract On-site sanitation has emerged as a pre-ferred mode of sanitation in cities experiencingrapid urbanization due to the high cost involvedin off-site sanitation which requires conventionalsewerages. However, this practice has put severestress on groundwater especially its quality. Underthe above backdrop, a study has been undertakento investigate the impact of on-site sanitation onquality of groundwater sources in two mega citiesnamely Indore and Kolkata which are situated intwo different geological settings. The parametersfor the studies are distance of groundwater sourcefrom place of sanitation, effect of summer andmonsoon seasons, local hydro-geological condi-tions, and physico-chemical parameters. NO3 andfecal coliform concentrations are considered asmain indexes of pollution in water. Out of manyconclusions which can be made from this studies,one major conclusion is about the influence of on-site sanitation on groundwater quality is minimalin Kolkata, whereas it is significant in Indore. Thisdifference is due to the difference in hydroge-ological parameters of these two cities, Kolkata
P. R. Pujari (B) · C. Padmakar · P. K. Labhasetwar ·P. Mahore · A. K. GangulyNational Environmental Engineering ResearchInstitute, Nehru Marg, Nagpur 440020,Maharashtra, Indiae-mail: [email protected]
being on alluvium quaternary and Indore being onDeccan trap of Cretaceous to Paleogene age.
Keywords Groundwater · On-sitesanitation systems · Pollution · TDS · Nitrate ·Fecal coliforms
Introduction
Groundwater constitutes one of the principalsources of freshwater. On a global scale, it con-stitutes about 22.6% of the freshwater availablein the earth. Groundwater is a principal sourcefor irrigation and drinking in the rural India. Itcontinues to be a reliable source for drinking anddomestic use even in urban and peri-urban areaswhere there is no centralized water supply bythe civic authorities. In view of the groundwaterbeing used for potable purpose, it is desirable thatthe quality is maintained safe as per the recom-mended guidelines (BIS 1991). The groundwaterquality is deteriorated due to geogenic as well asanthropogenic factors. Among the anthropogenicfactors, the impact of on-site sanitation on ground-water quality has been a subject of much concern.The contamination of groundwater due to on-sitesanitation systems has been reported by differentauthors since the 1980s (Lu et al. 2008; Pujariet al. 2007; Dzwairo et al. 2006; NEERI report2005; Nsubuga et al. 2004; Lawrence et al. 2001;

Environ Monit Assess
Chidavaenzi et al. 2000; Mallard et al. 1994;Andrews 1988; Canter and Knox 1985; Hagedon1984; Dewalle and Schaff 1980; Lewis et al. 1980;Brown et al. 1979). It is reported that 25% of allhousing units in the USA have on-site sanitationsystems (Bunnels et al. 1999) and they are report-ed to be source of local and regional groundwatercontamination in USA and elsewhere (Bunnelset al. 1999; Clawges and Vowinkel 1996).
Studies pertaining to impact of on-site sanita-tion systems on groundwater assume significantimportance in India considering the fact that ur-banization is on the rise and it is not possibleto bring the entire city under centralized watersupply and sewerage system. The high cost in-volved in providing conventional sewerage has ledto increasing adoption of on-site sanitation espe-cially in the peri-urban areas of big cities in India.The absence of centralized water supply leadspeople to depend on groundwater sources likebore-well, hand-pumps, and open wells to meet
their drinking and domestic requirements. In viewof the water being used for potable purpose, itis desirable that the impact of on-site sanitationsystem on groundwater quality be assessed andensure the maintenance of its quality throughproper intervention.
The groundwater contamination from on-sitesanitation system vis-à-vis geological settings hasbeen dealt by different workers since the 1980s.The hydrogeological factors, i.e., depth to watertable, nature of the soil matrix, and lateral sepa-ration between the on-site sanitation and ground-water source are the key parameters affectinggroundwater pollution (Lawrence et al. 2001;Lewis et al. 1980). Dzwairo et al. (2006) reportedthat groundwater samples collected within 25 mdistance from pit latrines in Kamangira villagein Zimbabwe were affected by the pit latrine.The parameters affected were the total and fecalcoliforms, and nitrate. Similar findings have beenreported recently by Pujari et al. (2007) and Lu
Fig. 1 Schematic map ofIndia with the study areas(Indore and Kolkata)

Environ Monit Assess
Fig. 2 Schematic map ofsampling locations inAhilya Nagar, Indore
et al. (2008) in studies carried out in China andIndia, respectively. Lu et al. (2008) reported el-evated concentration of nitrate due to leakingseptic tanks in China.
The present work is a comprehensive attemptto study the impact of on-site sanitation systemson groundwater quality in two different geologicalsettings in India. The two cities, namely Indore
and Kolkata are located in the hard rock basalticregion and Indo-Gangetic plains, respectively.The study was undertaken in summer (April 2002)and monsoon (August 2002) seasons to investigatethe temporal variations in the concentration ofcontaminants in groundwater. The key objectivewas to find out if the groundwater quality isaffected by the installation of on-site sanitation
Fig. 3 Schematic map ofsampling locations inChandan Nagar Indore

Environ Monit Assess
Fig. 4 Litholog from Bhatpara near the study area(Source: CGWB Eastern region 2001). The depth unit ismeter
systems and whether the pollution level is affectedby the underlying geology. Studies (Lawrenceet al. 2001; Lewis et al. 1980) have indicated thatchloride, nitrate, and fecal coliforms are the pa-rameters affected by installation of on-site san-itation systems. The parameters considered asimpact indicators were nitrate (NO3) and fecalcoliforms (FC). The incidence of water-borne dis-ease was discussed with the inhabitants in thestudy areas during the sampling as well.
Study area
The study was undertaken in Indore and Kolkatacities (Fig. 1). Indore is located at latitude 22◦44′N and longitude 75◦50′ E. It is one of the most im-portant cities in Central India. The city has lot ofcommercial importance. The city experiences sub-humid tropical climate and receives well-spreadrainfall (mean annual rainfall, 1,050 mm approxi-mately) during the south-west monsoon. Geologi-cally, the city is characterized by Indore formationbelonging to the Deccan trap of Cretaceous toPaleogene age (68–62 my). The basalt flows un-derlie the black cotton soil, which has a thicknessof 2.00 to 3.00 m. The region has ‘Aa’ and com-pound ‘pahoehoe’ basaltic lava flows. The upperportion of each flow is vesicular basalt whereasthe lower portion is massive basalt (GSI 2002).Besides, fractures are present in the lava flows.Hydrogeologically, the depth to water table variesfrom 10–20 m below ground level (bgl) in summer(April 2002) to 5–10 m (bgl) in monsoon (August
Fig. 5 Schematic map ofsampling locations inMathpara, Barrackpore,Kolkata

Environ Monit Assess
Fig. 6 Schematic map ofsampling locations inMathpara, Barrackpore,Kolkata
2002). The aquifer is of unconfined type. Theaquifer has mostly secondary porosity in the formof fractures and the disposition of fractures andvesicular units govern the movement of ground-
Fig. 7 TDS concentration in samples collected fromAhilya Nagar, Indore
water flow. The region has moderate groundwaterpotential (GSI 2002).
Two sites, namely Ahilya Nagar and ChandanNagar were selected in the city for analysis ofgroundwater quality. The site at Ahilya Nagar is
Fig. 8 NO3 concentration in samples collected fromAhilya Nagar, Indore

Environ Monit Assess
Fig. 9 FC concentration in samples collected from AhilyaNagar, Indore
characterized by better sanitation and the area isinhabited by people from higher income group.The site has approximately 170 inhabitants. Thedomestic garbage is regularly transported fromthe community dustbins to the solid waste dis-posal site located in the outskirts of the city. Thesite has a community septic tank (Fig. 2) whichis connected to the individual toilets. There aregroundwater sources (open wells, hand-pumps)in the individual houses (Fig. 2). Groundwater isextracted from the unconfined aquifer to meettheir drinking requirements. Nine (numbered 1–9)samples have been collected for analysis in AhilyaNagar. In contrast, the site at Chandan Nagar(Fig. 3) is inhabited by people from the lowerincome group. The locality is densely populated ascompared to Ahilya Nagar. The site has approxi-mately 300 inhabitants. Besides, there is no propersewerage system. The wastewater from houses iscarried through open drains. The domestic solidwaste are scattered in the locality in an unorga-nized way. Often, the effluent from the latrines isdirectly connected to the open drains. Six (num-bered 1–6) samples were collected for analysis.
The sampling points were close to the individualseptic tanks. The locality is also supplied waterby the civic authorities. However, the inhabitantsare still dependent on the groundwater source fortheir drinking water requirements.
Kolkata is located at latitude 22◦32′ N andlongitude 88◦22′ E. The city experiences a mod-erate climate with an average annual rainfallof 1,580 mm. It receives rainfall mostly fromthe southwest monsoon. Physiographically, thecity forms the eastern flank of the Indo-gangeticplains. The surface deposits are mainly alluvium ofquaternary to recent in age. It is underlain by claylenses. The soil characteristics range from fine-loamy silt to sandy loam with intermittent claylenses. Two sites (Mathpara and Palpara) havebeen selected for the study. Both the sites arepart of Barrackpore Municipality of the North24 Parganas district. The predominant form ofsanitation is pit-latrines in the two selected lo-calities. The aquifer occurs under both confinedand unconfined conditions. A litholog (Fig. 4)collected near the area shows the continuation ofalluvium up to approximately 250.0 m. The poros-ity is mainly of primary type as deciphered in thelitholog (CGWB 2001). The study area has verygood groundwater potential and the yield is of theorder of 150 m3/h. The un-confined aquifer is veryshallow and thin (approximately 6.0 m) whereasthe confined aquifer is deep and it extends from 90to 150 m (Fig. 4). Interaction with the inhabitantsindicated that the installed groundwater abstrac-tion sources are tapping the deep aquifer in thezone (90 to 150 m depth) in the study area. Boththe sites are inhabited by people from the lowerincome group.
There is no organized solid waste managementat the site. Individual houses have pit latrines andthere are open wells around the pit latrines (Figs. 5
Table 1 Criticalparameters of samplesfrom Ahilya Nagar,Indore
Parameters Seasons Samples
IA1 IA2 IA3 IA4 IA5 IA6 IA7 IA8 IA9 Avg
TDS (mg/L) Summer 290 480 475 370 480 380 460 485 640 451.9Monsoon 345 420 385 365 370 350 420 405 390 356.7
NO3 (mg/L) Summer 32 80 36 47 11 23 20 3 6 28.66Monsoon 73 114 73 83 75 55 81 18 16 65.33
FC (CFU/100 mL) Summer 40 45 36 180 80 26 440 112 250 134.3Monsoon 1,120 80 20 36 1,600 200 412 ND 24 388
Environ Monit Assess
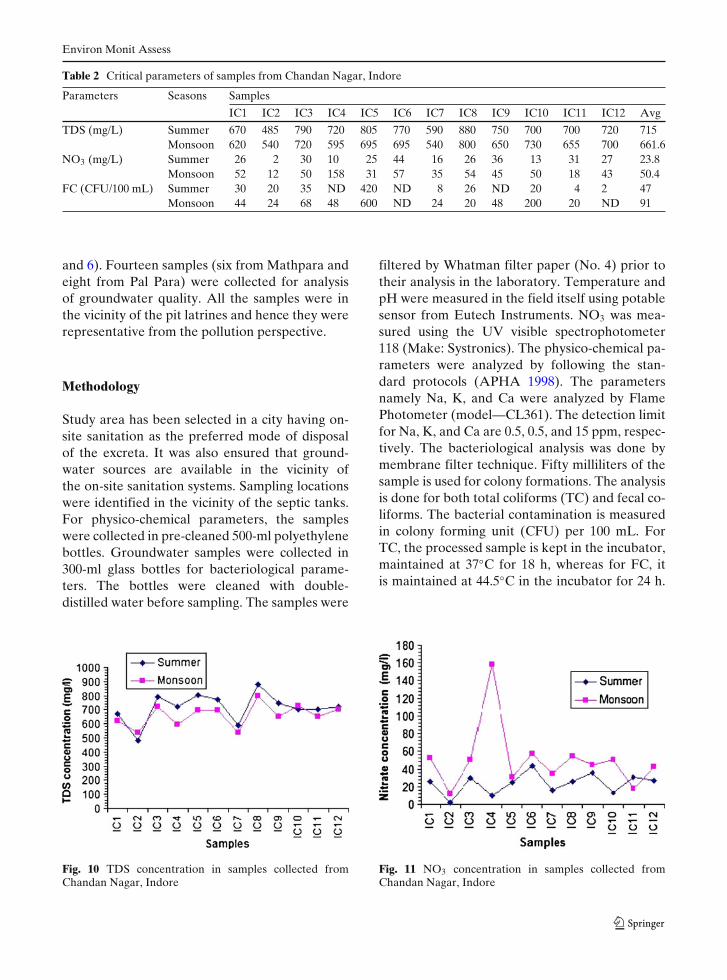
Table 2 Critical parameters of samples from Chandan Nagar, Indore
Parameters Seasons Samples
IC1 IC2 IC3 IC4 IC5 IC6 IC7 IC8 IC9 IC10 IC11 IC12 Avg
TDS (mg/L) Summer 670 485 790 720 805 770 590 880 750 700 700 720 715Monsoon 620 540 720 595 695 695 540 800 650 730 655 700 661.6
NO3 (mg/L) Summer 26 2 30 10 25 44 16 26 36 13 31 27 23.8Monsoon 52 12 50 158 31 57 35 54 45 50 18 43 50.4
FC (CFU/100 mL) Summer 30 20 35 ND 420 ND 8 26 ND 20 4 2 47Monsoon 44 24 68 48 600 ND 24 20 48 200 20 ND 91
and 6). Fourteen samples (six from Mathpara andeight from Pal Para) were collected for analysisof groundwater quality. All the samples were inthe vicinity of the pit latrines and hence they wererepresentative from the pollution perspective.
Methodology
Study area has been selected in a city having on-site sanitation as the preferred mode of disposalof the excreta. It was also ensured that ground-water sources are available in the vicinity ofthe on-site sanitation systems. Sampling locationswere identified in the vicinity of the septic tanks.For physico-chemical parameters, the sampleswere collected in pre-cleaned 500-ml polyethylenebottles. Groundwater samples were collected in300-ml glass bottles for bacteriological parame-ters. The bottles were cleaned with double-distilled water before sampling. The samples were
Fig. 10 TDS concentration in samples collected fromChandan Nagar, Indore
filtered by Whatman filter paper (No. 4) prior totheir analysis in the laboratory. Temperature andpH were measured in the field itself using potablesensor from Eutech Instruments. NO3 was mea-sured using the UV visible spectrophotometer118 (Make: Systronics). The physico-chemical pa-rameters were analyzed by following the stan-dard protocols (APHA 1998). The parametersnamely Na, K, and Ca were analyzed by FlamePhotometer (model—CL361). The detection limitfor Na, K, and Ca are 0.5, 0.5, and 15 ppm, respec-tively. The bacteriological analysis was done bymembrane filter technique. Fifty milliliters of thesample is used for colony formations. The analysisis done for both total coliforms (TC) and fecal co-liforms. The bacterial contamination is measuredin colony forming unit (CFU) per 100 mL. ForTC, the processed sample is kept in the incubator,maintained at 37◦C for 18 h, whereas for FC, itis maintained at 44.5◦C in the incubator for 24 h.
Fig. 11 NO3 concentration in samples collected fromChandan Nagar, Indore

Environ Monit Assess
The samples collected are from the unconfinedaquifer in Indore and the deep confined aquiferin Kolkata.
Results and discussions
Physico-chemical and bacteriological parameterswere analyzed for all the samples in pre-monsoonand monsoon seasons. Studies (Lu et al. 2008;Dzwairo et al. 2006; Lawrence et al. 2001; Dewalleand Schaff 1980; Lewis et al. 1980) dealing withthe assessment of on-site sanitation on ground-water quality indicate that the parameters likelyto be affected are the nitrate, chloride, and fecalcoliforms. Lawrence et al. (2001) reported thatan estimated 4 kg/year of nitrogen is released perperson and under aerobic conditions, a significantpercentage of this nitrogen will be oxidized toform nitrate. It is also reported (Lawrence et al.2001) that chloride (4 gm/day) is released perperson through urine, feces, and sweat. Hence,groundwater source is vulnerable to nitrate con-tamination due to continuous loading of nitratefrom on-site sanitation systems. Hence, any at-tempt to study the impact of on-site sanitationsystems on groundwater should focus on criticalparameters, namely, NO3 and fecal coliforms. Inthe present study, the focus was only on para-meters, namely, nitrate and fecal coliforms. TheTDS were discussed to get an overall idea of thegroundwater quality.
Indore
In Ahilya Nagar, the TDS, nitrate, and FC arepresented in Figs. 7, 8, and 9, respectively. Re-garding TDS, it can be noticed (Table 1, Fig. 7)that in general, the concentration is less in mon-soon as compared to summer and it is within thepermissible limit (2,000 mg/L) of BIS (1991). Theaverage concentration in monsoon (356 mg/L) isless than that in summer (452 mg/L). The reducedconcentration in monsoon can be attributed to thedilution taking place on account of recharge of theshallow aquifer due to the monsoon rains. How-ever, the nitrate concentration (Fig. 8) presentsa contrasting picture. The concentration level inmonsoon (average 65 mg/L) is more as compared
Fig. 12 FC concentration in samples collected fromChandan Nagar, Indore
to summer (average 29 mg/L). This pattern hasbeen observed in earlier studies also (Lawrenceet al. 2001; NEERI report 2005; Pujari et al. 2007).It is evident that the nitrate concentration is within the desirable BIS limit of 45 mg/L for all thesamples in Ahilya Nagar except samples IA2 andIA4 during summer season. In Monsoon, all thesamples exceed the desirable limit of BIS (1991)except samples IA8 and IA9. The decrease insummer season can be attributed to the loweringof the groundwater table wherein anaerobic con-dition is created and nitrate is partially convertedto nitrogen (Lawrence et al. 2001). The fecal col-iform concentration (Fig. 9) is in general more inmonsoon as compared to summer. All the samplesare contaminated by fecal coliforms in summerand monsoon except IA8, which is not contami-nated in monsoon. The infiltration and rechargein the monsoon can lead to faster movement ofthe pathogens in the vadose zone, which is verythin (up to 4 m) and there are fractures in the rockmatrix which serve as preferential pathways. As aresult, they are likely to reach the water table ata faster rate in monsoon as compared to summer.
Table 3 Statistical correlation of critical parameters inAhilya Nagar
Summer Monsoon
Distance Nitrate FC Distance Nitrate FC
Distance 1 1Nitrate 0.26 1 0.56 1FC −0.051 −0.29 1 0.60 0.22 1

Environ Monit Assess
Table 4 Criticalparameters of samplesfrom Mathpara, Kolkata
Parameters Seasons Samples
KNM1 KNM2 KNM3 KNM4 KNM5 KNM6 Avg
TDS (mg/L) Summer 512 524 533 524 540 528 526.8333Monsoon 345 336 354 324 367 394 353.3333
NO3 (mg/L) Summer 0.4 0.6 0.4 0.2 0.4 0.3 0.383333Monsoon 0.3 0.4 0.4 0.3 0.4 0.3 0.35
FC (mg/L) Summer 4 5 1 1 1 2 2.333333Monsoon 1 ND ND ND 1 ND 0.333333
This can be responsible for increase in the survivalrate of pathogens and thereby increasing the FCconcentration in monsoon. The increase in watertable leads to aerobic conditions and thereby in-creasing the survival rate of the coliforms.
In Chandan Nagar site, the TDS concentrationin monsoon is reduced as compared to summerlevel (Table 2, Fig. 10). All the samples haveTDS with in the BIS (1991) limit of 2,000 mg/L.However, the concentration of nitrate and FC(Figs. 11 and 12) is more in monsoon as comparedto summer. A close look at the nitrate concentra-tion (Fig. 11) reveals that the concentration rangesfrom 2–44 mg/L (average 24 mg/L) in summer and12–158 mg/L in monsoon (average 50 mg/L). Allthe samples have nitrate within the desirable limitin summer. However, all the samples exceptingIC2, IC5, IC7, IC11, and IC12 have nitrate con-centration exceeding the BIS (1991) limit in mon-soon. The FC concentration in Chandan Nagar(Table 2) varies from not detectable (ND) to400 CFU/100 mL in summer. In monsoon, it variesfrom ND to 600 CFU/100 mL. All the samples
Fig. 13 TDS concentration in samples collected fromMathpara, Kolkata
are contaminated by fecal coliforms in summerexcept samples IC4, IC6, and IC9. In monsoon,all the samples are contaminated except IC6. Theanalysis indicates that the highest concentrationin Chandan Nagar is 600 CFU/100 ml whereasthe highest in Ahilya Nagar is 1,600 CFU/100 ml.Though the overall sanitation scenario in AhilyaNagar is definitely better as compared to ChandanNagar, the concentration level of the contami-nants suggests an adverse scenario.
A statistical correlation was attempted on pa-rameters namely, the distance of the source fromthe community septic tank, the nitrate concentra-tion, and the fecal coliform concentration for sam-ples collected in Ahilya Nagar. The correlation insummer indicates that the distance has a positivecorrelation with the nitrate and a negative corre-lation with the fecal coliforms (Table 3). It is alsoobserved that the nitrate and fecal coliforms havea negative correlation. However, in monsoon, thenitrate and fecal coliform have a positive corre-lation with the distance (Table 3) and a positivecorrelation (0.22) exists between nitrate and fecalcoliforms. This indicates that there can be other
Fig. 14 NO3 concentration in samples collected fromMathpara, Kolkata

Environ Monit Assess
Fig. 15 FC concentration in samples collected fromMathpara, Kolkata
factors, apart from distance which are affectingthe concentration of nitrate and fecal coliforms.
As the vadose zone is very thin (3 to 4 m)and the intervening medium is weathered basalt,the travel time between the source and recep-tor is very less. Hence, the chances of contami-nants reaching the water table (3 to 4 m depthin monsoon and 10 to 12 m in summer) is veryhigh. The shallow water table aided by presenceof fractures can aggravate the pollution as thetravel time from the source (septic tank) to thereceptor (open well/hand-pump) is likely to beless. The statistical correlation for Ahilya Nagar(Table 3) indicates that in monsoon, the nitrateand FC can be attributed to the same source. Thesignificant positive correlation of nitrate and FCwith distance negates the view that concentrationdecreases with the distance.
Kolkata
As in the case of Ahilya Nagar and ChandanNagar, the TDS level in Mathpara in Kolkatashows similar pattern (Table 4, Fig. 13). The TDS
varies in the range 52–540 mg/L in summer and324–394 mg/L in monsoon. All the samples haveTDS within the BIS limit, i.e., 2,000 mg/L. As faras nitrate is concerned, it varies in the range 0.2–0.6 mg/L in summer and 0.3–0.4 mg/L in mon-soon (Table 3, Fig. 14). The temporal variationof nitrate concentration is not following the trendobserved in Indore city wherein the concentra-tion increased in monsoon. The FC concentra-tion is found in the range 1–5 CFU/100 mL insummer and ND–1 CFU/100 mL in monsoon(Fig. 15)
The parameters namely TDS, NO3, and FC inrespect of Palpara have similar range as in the caseof Mathpara (Tables 4 and 5). The TDS variesin the range 398–518 mg/L in summer and 276–488 mg/L in monsoon (Fig. 16). As far as nitrateis concerned, it varies in the range 0.2–0.6 mg/Lin summer and 0.3–0.4 mg/L in monsoon (Fig. 17).The FC concentration varies in the range ND–2CFU/100 mL in summer and ND–1 CFU/100 mLin monsoon (Fig. 18). A close examination of thescenario in Mathpara (Figs. 13–15) and Palpara(Figs. 16, 17, and 18) reveals that the contami-nation is very less as compared to Ahilya Nagar(Figs. 7–9) and Chandan Nagar (Figs. 11–13). Be-sides, the nitrate concentration (Fig. 15) is veryless and with in the recommended limit of BIS(1991) and WHO (1993). As mentioned above,the groundwater is extracted from the confinedaquifer situated between 90 and 150 m (bgl). Thislayer underlies a thick clay layer (10 to 90 m). Inview of the thick clay layer overlying the aquifer(Fig. 5), there is significant reduction of the con-taminants (microbial as well as chemical) reach-ing the water table at a depth of 90 m. Most ofthe contaminants are likely to be retarded and
Table 5 Criticalparameters of samplesfrom Palpara, Kolkata
aAverage is less than 1
Parameters Seasons Samples
KNP1 KNP2 KNP3 KNP4 KNP5 KNP6 KNP7 KNP8 Avg
TDS (mg/L) Summer 398 512 514 518 498 488 498 492 490Monsoon 276 350 362 329 348 390 488 326 359
NO3 (mg/L) Summer 0.5 0.4 0.4 0.4 0.6 0.4 0.2 0.5 0.4Monsoon 0.4 0.3 0.3 0.3 0.3 0.3 0.3 0.4 0.3
FC (mg/L) Summer 2 ND 1 ND 2 ND 2 1 1Monsoon ND ND ND 1 ND ND ND ND –a

Environ Monit Assess
Fig. 16 TDS concentration in samples collected fromPalpara, Kolkata
adsorbed before reaching the confined aquifer at90 m depth.
Questionnaire survey
Opinion was sought from the owners of thewells regarding the use of water and prevalenceof any water-borne disease in the area. Thoughthe contamination in terms of nitrate and fe-cal coliforms was significant in Ahilya Nagarand Chandan Nagar, the respondents in ChandanNagar mentioned about incidence of water-bornedisease in the area. The residents in AhilyaNagar mentioned that the well water was onlyused for domestic purpose other than drinking.They reported that there has not been any out-break of water-borne disease. The respondentsin Kolkata in general did not have any com-plaints about the groundwater quality. Incidenceof water-borne disease was also not mentioned bythem during the interviews.
Fig. 17 NO3 concentration in samples collected fromPalpara, Kolkata
Fig. 18 FC concentration in samples collected fromPalpara, Kolkata
Conclusions
1. The study areas at Indore which are char-acterized by hard rock show significant con-centration of nitrate and fecal coliforms. Thenitrate exceeds the desirable limit (45 mg/L)of BIS and hence the situation is alarmingfor both the localities, namely, Ahilya Nagarand Chandan Nagar. As far as fecal coliformis concerned, excepting three samples, therest are contaminated by fecal coliforms insummer as well as monsoon. As per the BISguidelines, fecal coliform should be absent inorder that the water can be considered safe fordrinking. There is health risk due to elevatednitrate concentration (exceeding BIS limit) inmost of the samples.
2. The study areas at Kolkata, which are char-acterized by alluvial formations show minimalconcentration of nitrate and fecal coliforms.The nitrate concentration is with in the desir-able limit of BIS. The fecal coliform concen-tration is also less and it varied in the rangeND to 5 CFU/100 mL.
3. The presence of shallow water table (10–20 m)in summer and 5–10 m in monsoon) in Indoreand coupled with the presence of fractures inthe underlying rocks renders the water sourcevulnerable to pollution from the on-site san-itation systems. It is also observed that at alateral distance of 150 m (Fig. 3), the com-munity septic tank does not render the sourcesafe for drinking. It is likely that there are

Environ Monit Assess
preferential pathways in the form of fracturesmay be responsible for contamination at thisdistance.
4. The available litholog (Fig. 5) close to thestudy area indicates that there is a thick claylayer of approximately 76 m above the water-bearing sand horizon. The groundwater is ex-tracted from the sand layer underlying the76-m thick clay layer. The presence of thisclay layer is likely to act as an adsorbant forthe contaminants which percolate from thepit latrine. As there is a significant distanceof 150 m from the source (pit latrine) to thereceptor (groundwater source), the fecal col-iforms are likely to die down before reachingthe water table (Lawrence et al. 2001). Thechemical contaminants, namely, nitrate arelikely to be adsorbed on the intervening claylayer.
5. The study conclusively reveals that the im-pact of the on-site sanitation system has pro-nounced effect on shallow unconfined aquiferin hard rock region, i.e., Indore as comparedto confined aquifer in the Indo-Gangeticplains, i.e., Kolkata. The effect will be samefor both chemical and bacteriological conta-minants. However, the bacteriological conta-minants are minimally present in the deepaquifer underlying the thick clay layer inKolkata. The distance of travel, nature of thesoil matrix, and the depth of water table areaffecting the concentration level of the chem-ical and bacteriological contaminants.
Recommendations
1. On-site sanitation program should be discour-aged in hard rock areas with shallow watertable. The results indicate that the nitrate levelexceeds the desirable limit of BIS and almostall the samples are contaminated from fecalcoliforms. The groundwater sources shouldnot be used for drinking purpose. If off-sitesanitation cannot be provided, best engineer-ing design should be ensured and operationand maintenance (O&M) should be an inte-gral part of the low-cost sanitation program.
2. The nitrate concentration is well within thedesirable limits of BIS in Kolkata. The bac-terial contamination is also insignificant (notdetectable to 6 CFU/100 mL). This water willnot pose any health risk as far as nitrate andfecal coliforms are concerned.
3. Critical parameters like the depth of the watertable, soil characteristics, and rock strata needto be considered in any program on installa-tion of on-site sanitations where groundwateris used for drinking purpose.
4. A systematic lithological mapping and hydro-geological mapping needs to be carried out inany area which is going to be served by on-sitesanitation facilities. If a confined aquifer withsustainable yield exists in the study area, thismay be preferred to the shallow aquifer.
5. Mandatory monitoring of groundwatersources needs to be carried out in areasserved by on-site sanitation systems. Themonitoring needs to be carried out forindicator parameters like nitrate, chloride,and fecal coliforms by agency responsible forwater supply and sanitation.
Acknowledgements The authors express their acknowl-edgment to CPHEEO-WHO for sponsoring the researchstudy. Acknowledgment is due to Dr. S. R. Baseer,Geologist, Geological Survey of India (GSI), Kolkata, forfruitful discussions and necessary help. The assistance ofDr. Vaishali Nitnaware and Ms. Leena Khare and Mr.Pramod Adhau is acknowledged.
References
Andrews, E. E. (1988). Hydrogeologic case study of septictank effluent discharge, Figureure eight Island, NorthCarolina. In Coastal water resources, proc. symp. atWilmington, North Carolina (pp. 505–507). AmericanWater Resources Association, Bethesda, Maryland.
APHA (1998). Standard methods for the examinationof water and wastewater (20th ed.). Washington:American Public Health Association.
Brown, K. W., Wolf, H. W., Donnelly, K. C., & Slowey, J. F.(1979). The movement of faecel colliforms and col-iphages below septic lines. Journal of EnvironmentalQuality, 17, 401–408.
Bunnels, J. F., Zambella, R. A., Margon, M. D., & Gray,D. M. (1999). A comparison of nitrogen removal bysubsurface dosing and standard septic systems in sandysoils. Journal of Environmental Management, 56, 209–219.

Environ Monit Assess
Bureau of Indian Standards (BIS) (1991). Drinking waterspecif ication: IS 10500:1991. New Delhi, India.
Canter, L. W., & Knox, R. C. (1985). Septic tank sys-tem ef fects on groundwater quality. Michigan: LewisPublishers.
CGWB (2001). Of f icial communication from C.G.W.B.Eastern region.
Chidavaenzi, K., Bradley, M., Jere, M., & Nhandara, C.(2000). Pit latrine ef f luent inf iltration into groundwa-ter: The Epworth study. London: Water sanitation andHealth, IWA
Clawges, R. M., & Vowinkel, E. F. (1996). Variable indicat-ing nitrate contamination in bedrock aquifers, Newarkbasin, New Jersey. Water Resources Bulletin, 32, 1055–1066.
Dewalle, F. B., & Schaff, R. M. (1980). Groundwater pol-lution by septic tank drain fields. Journal of Environ-mental Engineering, 106, 631–636.
Dzwairo, B., Hoko, Z., Love, D., & Guzha, E. (2006). As-sessment of the impacts of pit latrines on groundwaterquality in rural areas: A case study from Maronderadistrict, Zimbabwe. Physics and Chemistry of theEarth, 31, 779–788.
GSI (2002). District resource map of Indore district.Published by GSI (2002).
Hagedon, C. (1984). Microbiological aspects of groundwa-ter pollution due to septic tanks. In B. Britton, & C. P.Gerba (Eds.), Groundwater pollution microbiology(pp. 181–196). New York: Wiley.
Lawrence, A. R., Macdonald, D. M. J., Howard, A. G.,Barret, M. H., Pedley, S., Ahmed, K. M., et al. (2001).
Guidelines for assessing the risk of groundwater fromon-site sanitation. Commissioned report (CR/01/142)of British Geological Survey.
Lewis, W. J., Fester, S., & Drasar, B. S. (1980). Risk ofgroundwater pollution by on-site sanitation in develop-ing countries. A Literature Review, IRCWD ReportNo. 01/82.
Lu, Y., Tang, C., Chen, J., & Sakura, Y. (2008). Impact ofseptic tank systems on local groundwater quality andwater supply in the Pearl River Delta, China: Casestudy. Hydrological Processes, 22, 443–450.
Mallard, F., Reygrobellet, J. L., & Soulie, M. (1994).Transport and retention of faecel bacteria at sewage-polluted fractured rock sites. Journal of EnvironmentQuality, 23, 1352–1363.
NEERI (2005). Impact of on-site sanitation systems onquality of groundwater and surface water sources sub-mitted to CPHEEO-WHO. New Delhi.
Nsubuga, F. B., Kanisiime, F., & Okot-Okumu, J. (2004).Pollution of protected springs in relation to high andlow density settlements in Kampala-Uganda. Physicsand Chemistry of the Earth, 29, 1153–1159.
Pujari, P. R., Nanoti, M. V., Nitnaware, V. C., Khare,L. A., Thacker, N. P., & Kelkar, P. S. (2007). Effectof on-site sanitation on groundwater contaminationin a basaltic environment—A case study from India.Environmental Monitoring and Assessment, 134, 271–278.
WHO (1993). Guidelines for drinking water quality, recom-mendations (Vol. 1, 2nd ed.). Geneva: World HealthOrganization.