Assessment of Skempton's pore water pressure parameters B ...
30
Assessment of Skempton's pore water pressure parameters B and A using a high-capacity tensiometer Sanlon, P., Sivakumar, V., Solan, B., Tripathy, S., MacKinnon, P., Donohue, S., & Ramaiah, B. J. (2019). Assessment of Skempton's pore water pressure parameters B and A using a high-capacity tensiometer. Geotechnique, 71(2), 1-10. https://doi.org/10.1680/jgeot.18.P.191 Published in: Geotechnique Document Version: Peer reviewed version Queen's University Belfast - Research Portal: Link to publication record in Queen's University Belfast Research Portal Publisher rights © 2019 ICE. This work is made available online in accordance with the publisher’s policies. Please refer to any applicable terms of use of the publisher. General rights Copyright for the publications made accessible via the Queen's University Belfast Research Portal is retained by the author(s) and / or other copyright owners and it is a condition of accessing these publications that users recognise and abide by the legal requirements associated with these rights. Take down policy The Research Portal is Queen's institutional repository that provides access to Queen's research output. Every effort has been made to ensure that content in the Research Portal does not infringe any person's rights, or applicable UK laws. If you discover content in the Research Portal that you believe breaches copyright or violates any law, please contact [email protected]. Download date:01. Jan. 2022
Transcript of Assessment of Skempton's pore water pressure parameters B ...

Assessment of Skempton's pore water pressure parameters B and Ausing a high-capacity tensiometer
Sanlon, P., Sivakumar, V., Solan, B., Tripathy, S., MacKinnon, P., Donohue, S., & Ramaiah, B. J. (2019).Assessment of Skempton's pore water pressure parameters B and A using a high-capacity tensiometer.Geotechnique, 71(2), 1-10. https://doi.org/10.1680/jgeot.18.P.191
Published in:Geotechnique
Document Version:Peer reviewed version
Queen's University Belfast - Research Portal:Link to publication record in Queen's University Belfast Research Portal
Publisher rights© 2019 ICE.This work is made available online in accordance with the publisher’s policies. Please refer to any applicable terms of use of the publisher.
General rightsCopyright for the publications made accessible via the Queen's University Belfast Research Portal is retained by the author(s) and / or othercopyright owners and it is a condition of accessing these publications that users recognise and abide by the legal requirements associatedwith these rights.
Take down policyThe Research Portal is Queen's institutional repository that provides access to Queen's research output. Every effort has been made toensure that content in the Research Portal does not infringe any person's rights, or applicable UK laws. If you discover content in theResearch Portal that you believe breaches copyright or violates any law, please contact [email protected].
Download date:01. Jan. 2022

1
Assessment of the Skempton’s pore water pressure parameters B and A using
a high capacity tensiometer
P. Sanlon, Byrne Looby Partners, Belfast, UK
V. Sivakumar, Queen’s University Belfast, UK
B. Solan, Ulster University, UK
S. Tripathy, Cardiff University, UK
P. Mackinnon, Queen’s University Belfast, UK
and
S. Donohue, University College Dublin, Ireland
Corresponding author: V. Sivakumar School of Natural and Built Environment Queen’s University Belfast BT7 1NN [email protected]
Main text Click here to access/download;Main text;Bvaluepaper_17July-Siva_ST.docx
1 2 3 4 5 6 7 8 9 10 11 12 13 14 15 16 17 18 19 20 21 22 23 24 25 26 27 28 29 30 31 32 33 34 35 36 37 38 39 40 41 42 43 44 45 46 47 48 49 50 51 52 53 54 55 56 57 58 59 60 61 62 63 64 65

2
Assessment of the Skempton’s pore water pressure parameters B and A using
a high capacity tensiometer
P. Sanlon, V. Sivakumar, B. Solan, S. Tripathy, P. Mackinnon and S. Donohue
ABSTRACT
Saturation of soils is a prerequisite in many laboratory tests involving consolidation,
permeability and stress-strain behaviour. The saturation process is usually time
consuming, particularly in clay-rich soils, and this can incur substantial cost and
potential delays in reporting findings. The saturation of samples is assessed using the
well-established Skempton’s pore water pressure parameter B. In a situation where the
soil is fully saturated the B-value is approximately one. It is often the case that fine soil
samples extracted from the ground, particularly those from below the water table,
remain saturated. However, current testing protocols require evidence to verify a
complete saturation prior to subsequent laboratory investigations. This paper reports
experimental results exploring the hypothesis that, if the sample is ‘perceived’ to be
saturated, then further saturation procedures may not be necessary to obtain reliable
geotechnical parameters. Laboratory investigations were conducted on three different
clays (Kaolin Clay, Belfast Clay and Oxford Clay) in a testing chamber instrumented
with a high capacity tensiometer. The confining pressures were applied in a ramped
fashion under undrained conditions. The response of the tensiometer confirmed that
the samples were saturated from the very beginning of the loading process, as implied
by the B-value being close to one. Further supplementary investigations were carried
out to assess the Skempton’s pore water pressure parameter A and the stress-strain
behaviour of the soils. The combined finding provides further evidence to suggest that
the saturation process as suggested in standards may not be necessary for fine grained
soils to establish reliable geotechnical design parameters.
Keywords: Clays, Laboratory tests, Mineralogy, Pore pressures, Sampling, Suction
1 2 3 4 5 6 7 8 9 10 11 12 13 14 15 16 17 18 19 20 21 22 23 24 25 26 27 28 29 30 31 32 33 34 35 36 37 38 39 40 41 42 43 44 45 46 47 48 49 50 51 52 53 54 55 56 57 58 59 60 61 62 63 64 65

3
INTRODUCTION
The extraction of soil samples from the ground under “perfect conditions” (Class 4
sampling) generates negative pore water pressure (Carrubba, 2000; Hight et al., 2003:
Donohue et al., 2009; Donohue et al., 2010; Delage et al., 2016). Whether or not the
negative pore water pressure makes air get into the voids and causes the sample to
become de-saturated (i.e. the degree of saturation Sr<1) depends on various factors:
material type (particle size distribution), stress history, clay mineralogy and soil density
(Young et al., 1983; Graham et al., 1988: Doran et al., 2000; Long, 2003; Sivakumar et
al., 2009). Lynch et al. (2019) suggested that, for clay-rich soils such as kaolin, the
suction (i.e. the negative pore water pressure) required to initiate the desaturation
process is greater than 1000kPa, but for other clay-rich soils, for example Belfast Clay
and Oxford Clay, this value may be much higher due to their mineralogical
compositions. However, in many cases the suction in a sample recovered from
moderate depths (say up to 50m below the ground level) is much less than the suction
required for the air to enter the void spaces. In such cases, although the soil possesses
suction, the sample remains saturated. Nevertheless, the current testing standards
provide procedures to ensure full saturation of soil samples. The main limitation of the
existing procedure is that it does not have provision to measure the negative pore water
pressure in the sample before applying any external stresses.
Skempton (1954) proposed a hypothesis for the development of pore water pressure
upon external loading using two parameters, namely B and A. Since then the hypothesis
has been widely accepted among geotechnical engineering practitioners and
academics (Clayton et al.,1995; BSEN ISO17892-9, 2018). The excess pore water
pressure in soils during changes in stress regimes can be determined, for axial
symmetry stress conditions, using the following equation involving the pore water pressure
parameters B and A (Skempton, 1954).
∆𝑢 = 𝐵[∆𝜎3 + 𝐴( ∆𝜎1 − ∆𝜎3)] (Eq 1)
where u is the change in pore water pressure and 1 and 3 are the changes in major
and minor principal stresses respectively. There are two aspects that need attention:
(a) the B–value which symbolises the degree of saturation of the sample and
(b) the A-value which symbolises the changes in pore water pressure under shear
loading.
1 2 3 4 5 6 7 8 9 10 11 12 13 14 15 16 17 18 19 20 21 22 23 24 25 26 27 28 29 30 31 32 33 34 35 36 37 38 39 40 41 42 43 44 45 46 47 48 49 50 51 52 53 54 55 56 57 58 59 60 61 62 63 64 65

4
B-value: The primary purpose of this investigation was to assess the B-value of clay-rich
soils subjected to the removal of external loading under undrained conditions (symbolising
the extraction of samples from the ground under perfect sampling conditions). The removal
of overburden stresses during sampling generates negative pore water pressure within
the soil. If that negative pore water pressure is sufficient to allow air to enter into the pore
spaces (for example in the case of silt and sand), then the saturation process is essential
and that can only be confirmed by assessing the B-value. In clay-rich soils such negative
pore water pressure should be extremely high for the air to get into the void spaces, but
this is not usually the case. This paper therefore reports a vast amount of data to confirm
that the samples of clay-rich soils remain saturated even when high external stresses are
removed.
A-value: If the material is linearly elastic, isotropic and subjected to undrained loading or
unloading, A = 1/3. In normally consolidated soils, the A-value varies non-linearly with the
shear strain. Skempton et al. (1963) applied Equation 1 to understand the impact of stress
changes during sampling which was considered to be an elastic process. They pointed
out that, in general, there is no reason to suppose that A = 1/3 in natural soils which are
often anisotropic. Doran et al. (2000) revised the Skempton’s pore water pressure
parameter As by taking account of anisotropy and derived the following relationship:
∆𝑢 = 𝐵[∆σ3 + (𝐴 − J 3𝐺∗⁄ )(∆σ1 − ∆σ3)] where 𝐴s = 1/3 − J/3𝐺∗ (Eq 2)
where J is the coupling parameter and G* is the modified shear modulus (Graham et
al., 1983). For most natural soils the value of J/3G* (which is the slope of the undrained
stress path in p’-q plane at low strain, Doran et al., 2000) is negative (p' = mean effective
stress and q = deviator stress). This makes the overall pore water pressure parameter
A larger than 1/3. This aspect was also investigated in this paper.
EXPERIMENTAL WORK
Three different soils were tested namely: Kaolin, Belfast and Oxford Clays. All these
three soils are clay-rich materials and the relevant physical properties are listed in Table
1.
Sampling Procedure
Four different methods were adopted to generate samples.
1 2 3 4 5 6 7 8 9 10 11 12 13 14 15 16 17 18 19 20 21 22 23 24 25 26 27 28 29 30 31 32 33 34 35 36 37 38 39 40 41 42 43 44 45 46 47 48 49 50 51 52 53 54 55 56 57 58 59 60 61 62 63 64 65

5
Sampling Method A: Dry Kaolin Clay was mixed with de-aired water to achieve a water
content of 1.5 × liquid limit using a Cope 2000 mixer. This was consolidated one-
dimensionally to a vertical pressure of 600kPa or 800kPa depending upon the testing
requirements (Table 2) in a chamber (100mm diameter and 300mm height). The
consolidation of the slurry lasted 3 days. Upon completion, the external loading was
removed and the sample was extruded and trimmed to required height for further
testing.
Sampling Method B: The correct assessment of the B-value requires the testing of
materials that have known initial suction values to confirm the reliability of the high
capacity tensiometer used in this study. In Sampling Method A, although the samples
were subjected to known vertical stresses, the stress conditions within the samples at
the end of the consolidation were not isotropic. In addition, the side friction between the
consolidation chamber and the clay impacted the distribution of vertical stresses along
the sample. It would, therefore, not be possible to judge the expected suction in the
sample upon removal of the consolidation pressure. Therefore, the following procedure
was adopted for preparing samples with known suctions upon removal of consolidation
pressures.
A 150mm diameter membrane was sealed against the pedestal of a triaxial cell. A slurry
of Kaolin or Belfast Clay was then carefully filled into the membrane to a height of
300mm. In order to avoid bulging of the membrane under the weight of the slurry, the
membrane was supported with a thin wire mesh. The top of the membrane was then
sealed against a top cap. The triaxial cell was assembled and filled with water and the
slurry was subjected to the required confining pressures (isotropic stress conditions)
listed in Table 2. Drainage of the water was allowed from the base. The consolidation
of the samples lasted ~4 days for the Kaolin Clay and 21 days for the Belfast Clay.
Following the consolidation process a small amount of vacuum was applied on the
drainage line to remove the water in the porous disc placed at the bottom of the sample.
This procedure was carried out to ensure that the sample would not have access to
water upon removal of the cell pressure. The sample was then removed from the
system and a thin-wall sample tube with an internal diameter of 100mm was used to
extract a cylindrical sample. Some of the samples have had further treatment under
Sampling Method C.
Sampling Method C. It was anticipated that the suction in the sample prepared using
Sampling Method B would be equivalent to the magnitude of the applied external
1 2 3 4 5 6 7 8 9 10 11 12 13 14 15 16 17 18 19 20 21 22 23 24 25 26 27 28 29 30 31 32 33 34 35 36 37 38 39 40 41 42 43 44 45 46 47 48 49 50 51 52 53 54 55 56 57 58 59 60 61 62 63 64 65

6
confining pressure in the triaxial cell. However, a concern was that the subsequent
extraction of samples using a thin-walled sample tube could have generated sample
disturbances (Clayton et al., 1995; Lunne et al., 1997; Donohue et al., 2009) which
might lead to reduced suction and stiffness. Therefore, as a modification to Sampling
Method B, two Kaolin Clay samples (Tests 9 and 10 in Table 2) and a sample of Belfast
Clay (Test 13) were initially prepared using Sampling Method B. The extracted samples
of 100mm diameter and known height were then recompressed to the same
consolidation pressures (under isotropic stress conditions) applied during initial
formation in a standard triaxial cell, with a 100mm diameter pedestal. The intention here
was to remove the excess pore water pressure that may have been generated during
the sampling process. Once again, before removing the consolidation pressure, the
porous disc located at the base of the sample was dried by applying a small amount of
vacuum. No further trimming was carried out as the sample changed its volume only
marginally.
Sampling Method D: Natural samples of Oxford and Belfast Clays were delivered to
the laboratory in sampling tubes. They were extruded from the tubes (103mm in
diameter core) and carefully trimmed to 100mm diameter using a standard soil lathe.
Testing Chamber
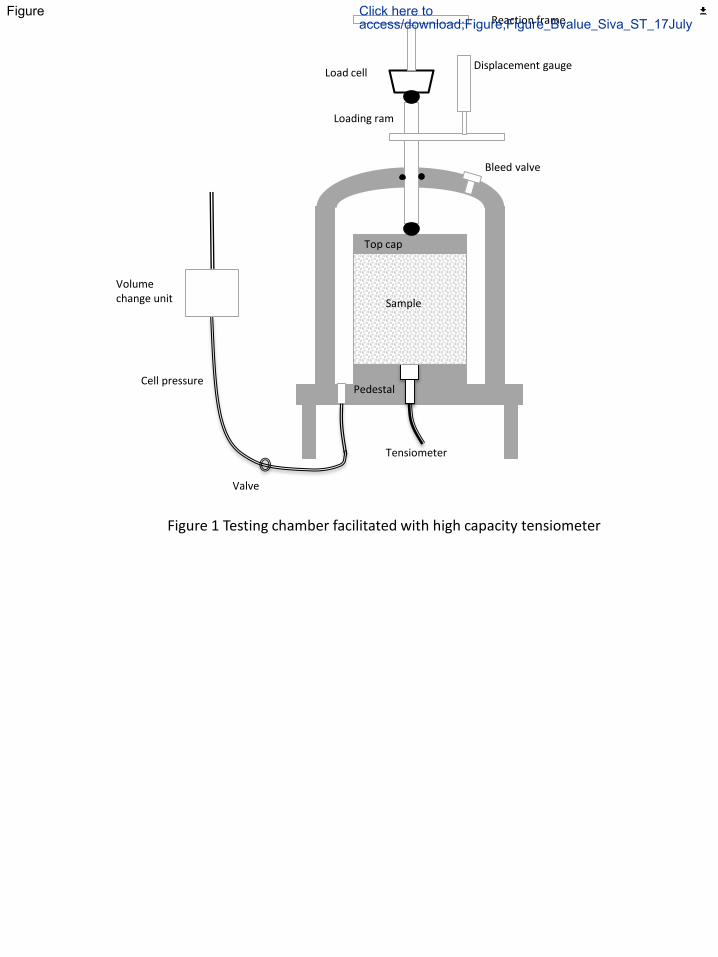
Figure 1 shows the testing chamber used in the research. The chamber contained a
high capacity tensiometer, located at the pedestal, which was capable of measuring
pore water pressure of -1500 kPa (Lynch et al., 2019). More details on the tensiometer
can be found in Lourenco et al. (2007). No drainage provisions were provided either in
the pedestal or in the top cap as the investigations required loading under undrained
conditions.
The tensiometer required a careful saturation procedure. Initially the chamber was filled
with de-aired water and pressurised to 1000 kPa for several days. The tensiometer was
calibrated in the positive pressure range, assuming the calibration parameters remain
the same in the negative pressure range (Ridley et al., 2003; Take et al., 2003;
Lourenco et al., 2007). The tensiometer was calibrated before each test as suggested
by Lourenco (2008). Figure 2 shows the calibration factors (intercept and the slope) of
the tensiometer for several calibration events and it appears the slope remains
generally unchanged during the course of the investigation.
.
1 2 3 4 5 6 7 8 9 10 11 12 13 14 15 16 17 18 19 20 21 22 23 24 25 26 27 28 29 30 31 32 33 34 35 36 37 38 39 40 41 42 43 44 45 46 47 48 49 50 51 52 53 54 55 56 57 58 59 60 61 62 63 64 65

7
Although tests were conducted under constant water mass conditions, it is possible that
the external loading may have resulted in a minor volume change of the sample. A flow
of water into the annulus between the sample and chamber would therefore give an
indication of a sample volume change. The chamber was calibrated for the apparent
volume change (i.e. without the sample in the chamber) by pressurising it to 1500kPa,
at a rate of 1kPa/minute and the volume of water flowing into the chamber was
measured using the volume change unit shown in Figure 1.
Testing Procedure
In total 16 tests were carried out as listed in Table 2. Upon completion of the sampling
(Methods A-D), the samples were trimmed to 140mm height (the maximum height that
the testing chamber can accommodate). In a commercial situation the height of the
sample should be at least 160mm to meet the requirement of height to diameter ratio
of at least 1.6; this is only required if the samples are taken to the shearing stage.
Alteration of the height to diameter ratio below 1.6 can influence the performance of
soils particularly at a large strain, however given that the study focused on the relative
stress-strain behaviour of soils (as a part of the A-value assessment), this size was
deemed acceptable for the current research.
Samples were assembled in the testing chamber and sealed with a rubber membrane.
The chamber was filled with de-aired water and pressurised to a nominal cell pressure
of 50kPa and allowed to stabilise for 24 hours. Figure 3 shows the response of the
tensiometer. The response time was slightly longer in the case of Belfast and Oxford
Clays. Both of these clays have considerably lower permeability than Kaolin Clay. On
the following day, the cell pressure was increased to 800kPa at a rate of 0.8kPa per
minute. Upon reaching the target cell pressure and allowing a further 6 hours of
stabilization time (during this resting period there were no significant changes in the
pore water pressure), the samples were subjected to shear loading at a rate of
0.08kPa/minute. The test condition in this case is referred to as “positive loading” (Table
2). In another set of tests, the samples were subjected to shear loading at a cell
pressure of 50kPa without ramping the cell pressure to 800 kPa. In these cases, the
pore water pressure in the samples remained negative. The testing under this condition
is referred to as “negative loading” (Table 2). Samples of Oxford and Belfast Clays were
also tested in a standard triaxial cell following the procedure recommended in BS1377,
Part 8 (1990).
1 2 3 4 5 6 7 8 9 10 11 12 13 14 15 16 17 18 19 20 21 22 23 24 25 26 27 28 29 30 31 32 33 34 35 36 37 38 39 40 41 42 43 44 45 46 47 48 49 50 51 52 53 54 55 56 57 58 59 60 61 62 63 64 65

8
RESULTS AND DISCUSSION
Reliability of suction measurements
To ensure the tensiometer was reading the correct suction values an evaluation was
carried out using the data obtained on a Belfast Clay sample (Sampling Method C, Test
Number 13). Kaolin Clay was not considered for this purpose as it tends to undergo
significant stress relief upon unloading which will be further discussed later in the article.
The sample was originally consolidated to 600kPa of confining pressure in a large
triaxial cell (150mm pedestal) and after trimming to the required height it was
reconsolidated 610kPa in a standard triaxial cell (100 mm pedestal). Upon the removal
of this pressure, the expected negative pore water pressure in the sample was around
-610kPa.
Figure 4 shows the changes in cell pressure (3) and pore water pressure (u) in the
sample plotted against time during the course of ramping the confining pressure from
50kPa to 800kPa. During this period, a 0.1% volume change took place and the pore
water pressure in the sample increased from -578kPa (at a cell pressure of 50kPa) to
190kPa. The effective stress in the sample was therefore would have been
approximately 628kPa as indicated in Figure 4. This value was reasonably close to the
effective stress in the sample (617kPa) at the end of the application of cell pressure of
800kPa. There is only a 11kPa difference between the start and end of the calibration
process, which is not significant. These observations gave confidence in the reliability
of the tensiometer measurements.
Assessment of B-value
Figure 5 shows the pore water pressure, plotted against cell pressure, where the cell
pressure was ramped from 50kPa to 800kPa over a period 48 hours for samples of one-
dimensionally compressed Kaolin Clay (Tests 1 and 3), isotropically compressed Kaolin
Clay (Tests 4, 5 and 6), isotropically compressed Belfast Clay (Test 13) and a natural
sample of Oxford Clay (Test 12). The relevant values of initial negative pore water
pressure at an external cell pressure of 50kPa are also included. The reader will notice
some small anomalies in the response of the tensiometer in the pressure range
between -100 and 100 kPa, particularly in the case of Belfast and Oxford Clays. The
supplier of the tensiometer confirmed that the support systems for the diaphragm
containing the strain gauges for the tensiometer were not perfectly matched on either
side. This may lead to a situation where the diaphragm responded slightly differently to
negative and positive pressures. Overall the tensiometer yielded very useful information
1 2 3 4 5 6 7 8 9 10 11 12 13 14 15 16 17 18 19 20 21 22 23 24 25 26 27 28 29 30 31 32 33 34 35 36 37 38 39 40 41 42 43 44 45 46 47 48 49 50 51 52 53 54 55 56 57 58 59 60 61 62 63 64 65

9
for the purpose of this investigation. In all cases, the volumetric strains of the samples
when the cell pressures were applied were < 0.15%, which is insignificant.
Figure 5 allows a direct evaluation of the B-value indicated by the slopes of the lines
(solid-lines) which highlights how the B-values changed with cell pressure. A
comparison of the theoretical B-value lines for saturated soils (shown with dashed lines)
with the tested soils confirms that all the samples tested appeared to be saturated from
the beginning of the application of the confining pressures. This was indicated by B-
values (u/3) value of ~1 (varies between 0.95-1.0). Interestingly the Belfast Clay
sample exhibited the same response even with a significant negative pore water
pressure of -578kPa at the beginning of the application of confining pressure. The
slopes of the solid lines seem to suggest that the samples were saturated at the time of
extraction, sampling and trimming, therefore prompting a question regarding the need
for saturating the samples of clay-rich soils before further testing.
Some additional pieces of information collected from this research allowed the
assessment of stress relief (i.e. the expected effective stress in the sample based on
the initial consolidation pressure) under unloading conditions. This aspect has been
examined by many researchers (Graham et al., 1988). The Kaolin Clay samples have
shown significant stress relief upon unloading under undrained conditions. The samples
prepared under one-dimensional consolidation during the initial preparation cannot
legitimately be brought into this discussion, as the stress regime, particularly the lateral
stresses, is unknown (Tests 1, 2 and 3). This could have been one of the possible
reasons for significantly lower effective stresses in the samples upon unloading (Table
3). The discussion will therefore focus on the samples prepared using isotropic
compression (Sampling Methods B and C; Tests 4-10 and 13). Table 3 lists the
consolidation pressures before sampling, and the effective stresses in the samples,
when the specimens were subjected to 50kPa of confining pressure. The following
assessments were made based on the investigations:
(a) Stress relief in all the Kaolin Clay samples was significant when Sampling Method
B was adopted (Tests 4-8).
(b) Stress relief in the sample of Belfast Clay was not significant when the sample
was prepared using Sampling Method C (Test 13).
(c) Stress relief in the case of the Kaolin Clay sample prepared using Sampling
Method C was significant, but less than that observed in the case of samples
prepared using Sampling Method B (Tests 9 and 10).
1 2 3 4 5 6 7 8 9 10 11 12 13 14 15 16 17 18 19 20 21 22 23 24 25 26 27 28 29 30 31 32 33 34 35 36 37 38 39 40 41 42 43 44 45 46 47 48 49 50 51 52 53 54 55 56 57 58 59 60 61 62 63 64 65

10
In all of the cases, the water in the filter disc was depleted before the removal of external
confining pressures and therefore water influx from the filter disc to the samples cannot
be the prime reason for the reduced effective stresses. Therefore, the possible
contributing factors for the reduction in effective stresses under undrained loading (also
referred to as stress relief) include: sample disturbances during the extraction
process, cavitation of water, particle size distribution, and clay mineralogy (Graham et
al.,1988).
The influence of sample disturbances (i.e. induced excess pore water pressure) was
eliminated by reconsolidating the samples to the same stress history in a standard
triaxial cell (Sampling Method C). This was done in Tests 9 and 10 in the case of Kaolin
Clay and Test 13 in the case of Belfast Clay. Where this procedure was not exercised
(Tests 4-8) the average stress relief was about 30%. When the reconsolidation process
was undertaken, as described in Sampling Method C, the stress relief was ~ 10% in the
case of Kaolin Clay (Tests 9 and 10, Table 3). Table 3 demonstrates that the stress
relief was not significant in the case of the Belfast Clay. On the aspect of cavitation, the
negative pore water pressure required for the air to come out of solution in the case of
Kaolin Clay is more than 1000 kPa (Lynch et al., 2019). In addition, information
presented in the early part of this article suggests that the B-value was close to 1 and
any reasons to postulate any air within the pore spaces are limited. Therefore, the
particle size distribution and the mineralogy of the soils tested probably have played a
more significant role in relation to the stress relief in Kaolin Clay.
The Kaolin Clay used in the present investigation is made of 100% kaolinite mineral
and the kaolinite particles were generally uniform in size. Also, the attractive force is
more predominant in the kaolinite-water system. Under external loading, the kaolin
particle arrangement tends to be more dispersed (Baille et al., 2014), and in the event
of an unloading process, structural rearrangement could take place. In such cases the
dispersed structure can become more flocculated leading to a potential micro-
remoulding process. This remoulding resulted in the reduced effective stresses in the
samples. In the case of Belfast Clay, the clay mineralogy was predominantly illite and
therefore the repulsive forces are more predominant (Sridharan et al., 1982). Under
external loading, the tendency of the particles to become flocculated is limited,
particularly in the presence of silt and sand particles, which are not present in Kaolin
Clay. In the event of removal of external loading, potential structural arrangement is
1 2 3 4 5 6 7 8 9 10 11 12 13 14 15 16 17 18 19 20 21 22 23 24 25 26 27 28 29 30 31 32 33 34 35 36 37 38 39 40 41 42 43 44 45 46 47 48 49 50 51 52 53 54 55 56 57 58 59 60 61 62 63 64 65

11
limited, and therefore little or no micro-remoulding takes place, hence leading to little or
no stress relief.
Stress-strain behaviour, stress paths and assessment of pore water pressure
parameter A
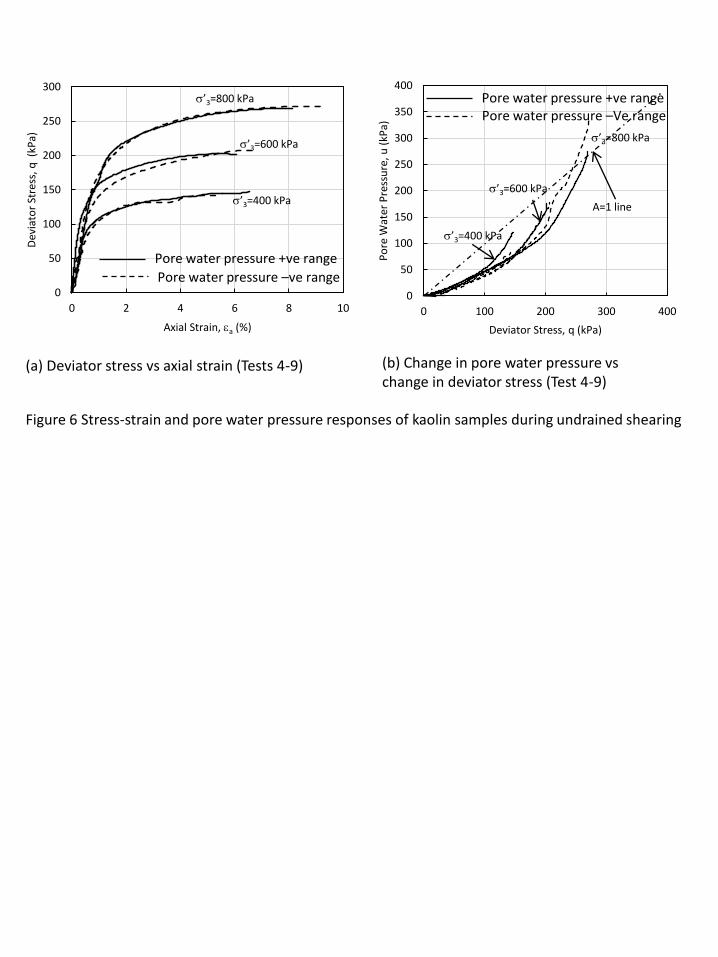
Figure 6 shows the stress-strain responses of the samples of Kaolin Clay prepared
using Sampling Methods B and C (Tests 4-9). The solid lines indicate the samples
tested by bringing the pore water pressure to the positive range. The broken lines
indicate when the samples were tested while the pore water pressures were still in the
negative range. Both types of loading conditions resulted in similar axial strains at failure
(6-9%). Given that the loading conditions in the present research were “stress
controlled”, it was not be possible to take the samples to a true critical state. The pore
water pressure parameter A (u/q), varied with axial strain as shown in Figure 6b. The
value of A gradually increased with axial strain and reached a value approximating to 1
for all the tests, except Test 9 (Sampling Method C). For the latter, the A-value was over
1, which was expected for near-normally consolidated Kaolin Clay (Sivakumar et al.,
2018). An A-value below 1, in the other cases, implies that the samples may have been
slightly overconsolidated before the undrained compression. This agrees well with the
earlier comment, that samples of Kaolin Clay prepared using Sampling Method B have
undergone about 30% stress relief, making them slightly overconsolidated.
Further interesting information was obtained when the responses of the samples during
the undrained compression were plotted in terms of p' and q. To allow a suitable
comparison, the stress paths for an overconsolidated sample (Test 10, Table 2) and a
consolidated undrained compression test carried out by adopting the procedure
recommended in the BS1377, Part 8, 1990 are shown in Figures 7a and 7b respectively.
The information for the latter was obtained from the authors’ database. Figure 7a shows
the stress path of the sample tested in Test 10. In this case the overconsolidation ratio
was 2 and therefore the sample exhibited classical elastic behaviour at the early stage
of compression. The sample inherited isotropic elastic properties during its initial
formation, given the previous stress conditions were isotropic. On this basis, the value
of the cross-anisotropic parameter J/3G* is equal to 0, implying that the slope of the
stress path would be vertical in the q:p’ plane. Figure 7a shows exactly this, confirming
the pore water pressure parameter A = 1/3. Figure 7b shows the stress path for a
sample which was consolidated to 800kPa of effective consolidation pressure prior to
undrained shearing. The shape of the stress path is typical of normally consolidated
clays, where the stress path leans toward the q axis from the very beginning of the
1 2 3 4 5 6 7 8 9 10 11 12 13 14 15 16 17 18 19 20 21 22 23 24 25 26 27 28 29 30 31 32 33 34 35 36 37 38 39 40 41 42 43 44 45 46 47 48 49 50 51 52 53 54 55 56 57 58 59 60 61 62 63 64 65

12
undrained compressions. These two observations aid the discussion on the stress
paths for Tests 4-9 (Table 3).
The direction of the stress path at the early stage of the shearing (Test 4-9) is
approximately vertical irrespective of the loading condition (negative or positive) (see
Figure 7c). This indicates that J/3G* is equal to 0, suggesting A = 1/3, and the behaviour
of samples was near elastic (i.e. the samples were slightly overconsolidated). This
agrees favourably with the earlier comment that stress reliefs in these samples were
considerable, mounting up to 30% in Tests 4-8 and about 10% in Test 9, which would
have made the samples slightly overconsolidated. The stress paths soon lean towards
to the left and right, for positive and negative loading conditions respectively, and they
approached the near critical state failure condition. The slope of the critical state line,
represented by M, has a value of approximately 0.7 for positive loading and 0.68 for the
negative loading conditions. This equates to an angle of internal friction of 19o. This is
considered strong evidence to suggest that the responses of the samples are not
significantly affected by the loading conditions (i.e. pore water pressure being positive
or negative).
Figure 8 shows the stress paths obtained on samples of Oxford Clay, which was in its
natural state before testing. One of the samples was tested under negative pore water
pressure conditions (Test 11) and other sample was tested using the BS1377, Part 8,
1990 procedure (Test 12B). The slope of the stress paths at the early stage of shearing
was represented by J/3G*. The cross-anisotropic parameter value was approximately
0.29 under positive loading and 0.27 under negative loading conditions. The agreement
between these two values is reasonably good. The slopes of the critical state line in
positive and negative loading conditions are 1.44 and 1.35 respectively. The differences
are small contributing to a friction angle difference of just over 1o. For normal design
situations this difference in friction angle would not adversely impact the design
process. This difference may have been due to possible variations in the natural
materials as they were extracted from different sample tubes. In addition, except the
sample tested using BS1377, Part 8, 1990 procedure, the deviator stress was applied
using stress control loading and achieving true critical state is not possible. Also note
that as both samples have had significantly different initial effective stresses,
consequently they attained different deviator stresses at the critical state. Similar
information is echoed in the case of Belfast Clay and the relevant information is shown
in Figure 9. The slope of the initial stress path is approximately 0.18 in the case of
positive loading (Test 15) and 0.15 in the case of negative loading (Test 14). The slope
1 2 3 4 5 6 7 8 9 10 11 12 13 14 15 16 17 18 19 20 21 22 23 24 25 26 27 28 29 30 31 32 33 34 35 36 37 38 39 40 41 42 43 44 45 46 47 48 49 50 51 52 53 54 55 56 57 58 59 60 61 62 63 64 65

13
of the critical state line is 1.04 and 1.0 respectively for positive and negative loading,
confirming the earlier postulation.
Evaluation
The information presented in this article suggests that the B-value was 1 for
reconstituted and natural samples of predominantly clay-rich materials. According to
the BS1377, Part 8 (1990) procedure, a B-value approximating to 1 is ensured by
increasing the back pore water pressure and cell pressure in steps over a set period of
time. In the present investigation, B-values ~ 1 (after the sampling process) were
confirmed by using a high capacity tensiometer to measure the initial negative pore
water pressure in the samples. However, the authors concede the fact that only a few
commercial/research laboratories have the provision to use high capacity tensiometers,
therefore implementing the procedure reported herein would be costly. An alternative
procedure may be considered, in which the clay-rich samples can be consolidated to
the required effective stresses, without the saturation process prior to shearing. Such a
procedure was evaluated and proven acceptable for measuring the permeability of
compacted clays prepared at the wet of optimum water content (Murray, 2002;
Sivakumar et al., 2015). This research presents evidence to suggest that the strength,
anisotropic parameters and the pore water pressure parameter A are unaffected by the
alternative testing conditions.
CONCLUSIONS
The saturation of samples for laboratory investigations is assessed by determining the
pore water pressure parameter, B. This paper examined whether the saturation process
is necessary in clay-rich soils using a chamber equipped with a high capacity
tensiometer. As a part of the investigation, the Skempton’s pore water pressure
parameter A was also studied.
The B-value was examined on Kaolin, Belfast and Oxford clays. The observations have
shown that the B-value approximated to 1 from the very beginning of the application of
confining pressure in a ramped fashion under undrained conditions. This has
highlighted the possibility of avoiding the need for saturating samples by elevating back
and the confining pressures. Further observations collected by shearing the samples to
critical state confirmed that the A-values were not significantly affected by pore water
pressure being in positive or negative range. The undrained stress paths obtained
through two types of loading, as stated above, resulted in a similar trend, including
capturing the degree of anisotropy. Stress relief is a significant issue in the sampling
1 2 3 4 5 6 7 8 9 10 11 12 13 14 15 16 17 18 19 20 21 22 23 24 25 26 27 28 29 30 31 32 33 34 35 36 37 38 39 40 41 42 43 44 45 46 47 48 49 50 51 52 53 54 55 56 57 58 59 60 61 62 63 64 65

14
process. The investigation reported in this paper suggests that, while the sampling
method being the primary cause of stress relief, other factors include particle size and
clay minerology may contribute to further stress relief.
REFERENCES
Baille, W., Tripathy, S., and Schanz, T. (2014). “Effective stress in clays of various
mineralogy.” Vadose Zone J., 13(5).
British Standards Institution. (1990) BS1377- Part 8 Methods of test for soils for civil
engineering purposes. London. BSI
British Standards Institution. (2018) BS EN ISO17892-9 Geotechnical investigation and
testing. Laboratory testing of soil. Consolidated triaxial compression tests on
water saturated soils. London. BSI
Carrubba, P. (2000). Stress relief disturbance and residual pore pressure in cohesive
soils, Soils and Foundations, 40 (1), pp. 57-72.
Clayton, C.R.I., Matthews, M.C., Simons, N.E., (1995). Site investigation: A handbook
for engineers. 2nd edn. Cambridge, Mass., USA: Wiley, John & Sons.
Delage, P., Menaceur,H.,Tang, A.M. and Talandier, J., 2016. Stress release and suction
generation in the Callovo-Oxfordian claystone, 2016. E3S Web of Conferences,
9, Art. no. 18004.
Donohue, S. and Long, M., (2009). Suction measurements as indicators of sample
quality in soft clay, ASTM Geotechnical Testing Journal 32, No. 3, 286-297.
Donohue, S. and Long, M., (2010). ‘Assessment of sample quality in soft clay using
shear wave velocity and suction measurements’, Géotechnique, 60(11), pp.
883–889. doi: 10.1680/geot.8.t.007.3741.
Doran, I.G., Sivakumar, V., Graham, J. and Johnston, A., (2000). “Estimation of in situ
stresses using anisotropic elasticity and suction measurements.” Géotechnique,
Vol. 50(2), pp. 189-196.
Graham, J. and Houlsby, G. T., (1983). Anisotropic elasticity in a natural plastic clay.
Geotechnique 33, No pp. 165-180.
Graham, J., and Lau, S.L.K., (1988). Influence of stress-release disturbance, storage,
and reconsolidation procedures on the shear behaviour of reconstituted
underwater clay, Geotechnique, 38 (2), pp. 279-300.
Hight,D.,W. and Leroueil,S., (2003). Workshop, Characterisation and engineering
properties of natural soils; 2002; Singapore in Characterisation and engineering
properties of natural soils; 255-362
1 2 3 4 5 6 7 8 9 10 11 12 13 14 15 16 17 18 19 20 21 22 23 24 25 26 27 28 29 30 31 32 33 34 35 36 37 38 39 40 41 42 43 44 45 46 47 48 49 50 51 52 53 54 55 56 57 58 59 60 61 62 63 64 65

15
Long, M., (2003), “Characterization and Engineering Properties of Athlone Laminated
Clay,” Proceedings International Workshop on Characterisation and
Engineering Properties of Natural Soils ("Natural Soils 2002"),757-790
Lourenço, S.D.N. (2008). Suction Measurements and Water Retention in Unsaturated
Soils, PhD thesis, Durham University
Lourenço, S.D.N., Gallipoli, D., Toll, D., Evans, F. and Medero, G., (2007).
Determination of the Soil Water Retention Curve with tensiometers,
Experimental unsaturated soil mechanics, (ed. Schanz T), Berlin, Springer-
Verlag, 95-102.
Lunne, T., T. Berre and S. Strandvik (1997). Sample disturbance effects in soft low
plastic Norwegian clay. Proc. of the Symp. on Recent Develop. in Soil and
Pavement Mech., Rio de Janeiro.
Lynch, K., Sivakumar, V., Tripathy, S. and Hughes, D, (2018). Development of a
laboratory technique for obtaining soil water retention curves under external
loading. Geotechnique. https://doi.org/10.1680/jgeot.17P.176
Murray.E.J. (2002). “Procedure for the Determination of Permeability of Clayey Soils
in A Triaxial Cell Using the Accelerated Permeability Test”, Environmental R&D
Technical Report p1-398/TR/2).
Ridley, A.M., Dineen, K., Burland, J.B. and Vaughan P.R., (2003). Soil matrix suction:
some examples of its measurement and application in geotechnical
engineering. Geotechnique, 53, Vol 2, pp 241-253
Sivakumar, V. and Anderson, C. (2015). “Impact of Testing Procedure on Permeability
of Compacted Soils.” Geotechnical Engineering, Vol. 168, No. 5, pp 442-458.
Sivakumar, V., Donohue, D., Rodvand, L., Nanda, S. and Tripathy, S. (2018). Behaviour
of normally consolidated clay containing isolated solid inclusions. Geotechnical
Engineering, https://doi.org/10.1680/jgeen.17.00131
Sivakumar, V., Navaneethan, T., Hughes, D. and Gallagher, G., (2009). “An
assessment of the earth pressure coefficient in overconsolidated clays.”
Géotechnique, Vol. 59 Vol. 10, pp 825-838.
Skempton A.W., (1954). The Pore-Pressure Coefficients A and B. Geotechnique. 4 (4),
143-147.
Skempton,A.W. and Sowa, V.A., (1963). The behaviour of saturated clays during
sampling and testing. Géotechnique, Vol. 13, pp 269-290.
Sridharan A and Jayadeva MS (1982) Double layer theory and compressibility of
clays.Géotechnique,32(2):133–144,
https://doi.org/10.1680/geot.1982.32.2.133.
1 2 3 4 5 6 7 8 9 10 11 12 13 14 15 16 17 18 19 20 21 22 23 24 25 26 27 28 29 30 31 32 33 34 35 36 37 38 39 40 41 42 43 44 45 46 47 48 49 50 51 52 53 54 55 56 57 58 59 60 61 62 63 64 65
16
Take, W.A., and Bolton, M.D., (2003). Tensiometer saturation and the reliable
measurement of soil suction, Géotechnique, Vol 53, pp 159-172
Young, A.G, Quiros, G.W. and Ehlers, C.J., (1983). Effects of offshore sampling and
testing on undrained soil shear strength. In: Proceedings of the 15th annual
offshore technology conference; pp. 193-204.
1 2 3 4 5 6 7 8 9 10 11 12 13 14 15 16 17 18 19 20 21 22 23 24 25 26 27 28 29 30 31 32 33 34 35 36 37 38 39 40 41 42 43 44 45 46 47 48 49 50 51 52 53 54 55 56 57 58 59 60 61 62 63 64 65

Table 1 Physical properties
Soil type Liquid Limit% Plastic Limit % Clay fraction% Main mineral
Kaolin Clay 70 30 90 Kaolinite
Belfast Clay 60 26 60 Illite
Oxford Clay 71 33 75 illite
Table Click here to access/download;Table;Tablles -20June.docx

Table 2 Testing schedules
Test No Soil Type Loading conditions
Sampling Method
Consolidation pressure kPa
Removal of water in filter
Reconsolidation Testing condition
Void ratio Degree of saturation≠
Water content
1 Kaolin Clay One-dimensional A 600 NO No Positive 1.160 99 0.43
2 Kaolin Clay One-dimensional A 600 NO No Negative NA
3 Kaolin Clay One-dimensional A 800 NO No Positive 1.114 98 0.41
4 Kaolin Clay Isotropic B 400 Yes No Positive 1.154 99 0.43
5 Kaolin Clay Isotropic B 600 Yes No Positive 1.081 100 0.41
6 Kaolin Clay Isotropic B 800 Yes No Positive 1.031 100 0.39
7 Kaolin Clay Isotropic B 400 Yes No Negative 1.164 99 0.43
8 Kaolin Clay Isotropic B 600 Yes No Negative 1.085 98 0.40
9 Kaolin Clay Isotropic C 800 Yes Yes Negative 1.041 99 0.39
10 Kaolin Clay Isotropic C 800 400 (OCR =2) Yes Yes Negative 1.069 98 0.40
11 Oxford Clay Natural D Depth 3.5m Not applicable Not applicable Negative 0.675 99 0.25
12 Oxford Clay Natural** D Depth 3.5m Not applicable Not applicable Positive 0.692 100 0.26
12B Oxford Clay Natural* D Depth 3.5m Not applicable Not applicable Positive 0.690 100 0.26
13 Belfast Clay Isotropic C 600 Yes Yes (610 kPa) Not sheared 0.814 100 0.30
14 Belfast Clay Natural D Depth 18.0m Not applicable Not applicable Negative 0.786 99 0.29
15 Belfast Clay Natural* D Depth 18.0m Not applicable Not applicable Positive 0.771 98 0.28
* Tested in a standard triaxial cell (BS1377, Part 8 (1990)) ** Not sheared ≠ Calculated based on initial sample dimensions, where it was more than 100%, it was taken as 100%.
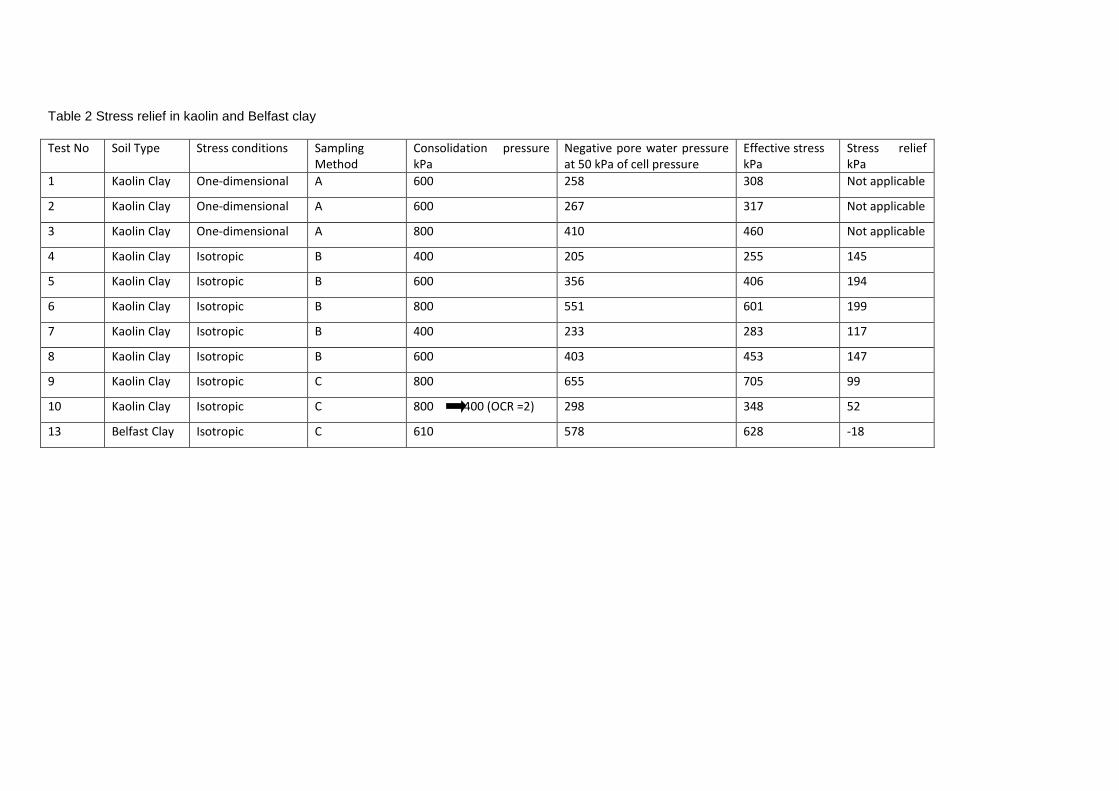
Table 2 Stress relief in kaolin and Belfast clay
Test No Soil Type Stress conditions Sampling Method
Consolidation pressure kPa
Negative pore water pressure at 50 kPa of cell pressure
Effective stress kPa
Stress relief kPa
1 Kaolin Clay One-dimensional A 600 258 308 Not applicable
2 Kaolin Clay One-dimensional A 600 267 317 Not applicable
3 Kaolin Clay One-dimensional A 800 410 460 Not applicable
4 Kaolin Clay Isotropic B 400 205 255 145
5 Kaolin Clay Isotropic B 600 356 406 194
6 Kaolin Clay Isotropic B 800 551 601 199
7 Kaolin Clay Isotropic B 400 233 283 117
8 Kaolin Clay Isotropic B 600 403 453 147
9 Kaolin Clay Isotropic C 800 655 705 99
10 Kaolin Clay Isotropic C 800 400 (OCR =2) 298 348 52
13 Belfast Clay Isotropic C 610 578 628 -18
Tensiometer
Sample
Cell pressure Pedestal
Top cap
Displacement gauge
Bleed valve
Figure 1 Testing chamber facilitated with high capacity tensiometer
Valve
Loading ram
Volume change unit
Load cell
Reaction frameFigure Click here to
access/download;Figure;Figure_Bvalue_Siva_ST_17July

300
350
400
450
500
550
600
1 2 3 4 5 6 7 8 9
Inte
rcep
t kP
a
Calibration event
0.25
0.30
0.35
0.40
0.45
0.50
1 2 3 4 5 6 7 8 9
Slo
pe
of
the
calib
rati
on
kP
a/m
v
Calibration event
Figure 2 Calibration factors for the tensiometer
(a) Intercept (b) Slope

-700
-600
-500
-400
-300
-200
-100
0
0 300 600 900 1200 1500
Po
re w
ater
pre
ssu
re k
Pa
Time (minutes)
Belfast Clay
Oxford Clay
Kaolin Clay
Figure 3 Response time of the tensiometer to negative pore water pressures in kaolin, Belfast and Oxford Clays at 50 kPa of confining pressure
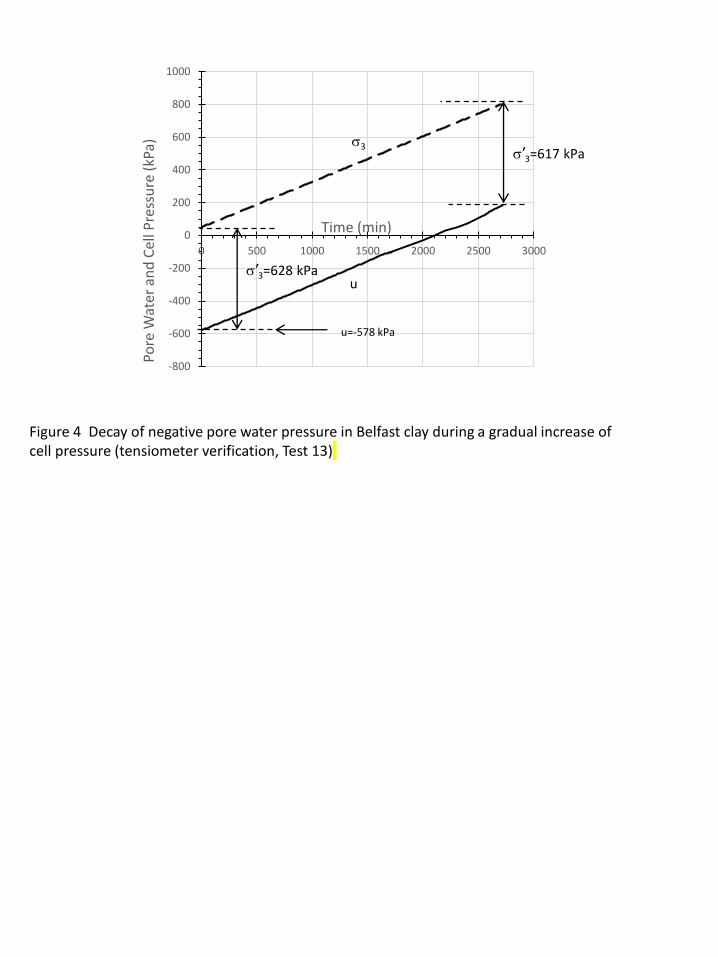
Figure 4 Decay of negative pore water pressure in Belfast clay during a gradual increase of cell pressure (tensiometer verification, Test 13)
-800
-600
-400
-200
0
200
400
600
800
1000
0 500 1000 1500 2000 2500 3000
Pore
Wat
er a
nd
Cel
l Pre
ssu
re (
kPa)
Time (min)
s3
us’3=628 kPa
s’3=617 kPa
u=-578 kPa

u = 0.95s3
R² = 0.999
-600
-400
-200
0
200
400
600
0 200 400 600 800
Po
re W
ater
Pre
ssu
re (
kPa)
Cell pressure kPa
-600
-400
-200
0
200
400
600
0 200 400 600 800
Po
re W
ater
Pre
ssu
re (
kPa)
Cell pressure kPa
-600
-400
-200
0
200
400
600
0 200 400 600 800
Po
re W
ater
Pre
ssu
re (
kPa)
Cell pressure kPa
-600
-400
-200
0
200
400
600
0 200 400 600 800P
ore
Wat
er P
ress
ure
(kP
a)
Cell pressure kPa
-600
-400
-200
0
200
400
600
0 200 400 600 800
Po
re W
ater
Pre
ssu
re (
kPa)
Cell pressure kPau-= 1.0s3
R2=0.999
(a) One-dimensionally consolidated kaolin (600 kPa, Test 1) (b) One-dimensionally consolidated kaolin (800 kPa, Test 3)
(c) Isotopically consolidated kaolin (400 kPa, Test 4)
(e) Isotopically consolidated kaolin (800 kPa, Test 6)
(d) Isotopically consolidated kaolin (600 kPa, Test 5)
(f) Isotopically consolidated Belfast clay (600 kPa, Test 13)
(g) Natural Oxford clay, Test 12
45O line (B=1) 45O line (B=1)
45O line (B=1)45O line (B=1)
45O line (B=1)
Figure 5 Assessment of B value of various samples
-600
-400
-200
0
200
400
600
0 200 400 600 800
Wat
er
Pre
ssu
re (
kPa)
Cell pressure kPa
45O line (B=1)
-800
-600
-400
-200
0
200
400
0 200 400 600 800
Po
re W
ater
Pre
ssu
re (
kPa)
Cell Pressure (kPa)
u-= 1.0s3
R2=0.999
45O line (B=1)
Co
nfi
nin
g p
ress
ure
, s3=5
0 k
Pa
Co
nfi
nin
g p
ress
ure
, s3=5
0 k
Pa
Co
nfi
nin
g p
ress
ures
3=5
0 k
Pa
Co
nfi
nin
g p
ress
ure
, s3=
50
kP
aC
on
fin
ing
pre
ssu
re, s
3=5
0 k
Pa
Co
nfi
nin
g p
ress
ure
, s3=
50
kP
aC
on
fin
ing
pre
ssu
re, s
3=5
0 k
Pa
u = -410 kPau = -258 kPa
u = -205 kPau = -350 kPa
u =-551 kPa
u = -126 kPa
u=-578 kPa
u-= 0.98s3
R2=0.999
u-= 0.99s3
R2=0.999 u-= 0.98s3
R2=0.999
u-= 0.98s3
R2=0.995
0
50
100
150
200
250
300
0 2 4 6 8 10
Dev
iato
r St
ress
, q
(kP
a)
Axial Strain, ea (%)
0
50
100
150
200
250
300
350
400
0 100 200 300 400
Po
re W
ater
Pre
ssu
re, u
(kP
a)
Deviator Stress, q (kPa)
s’3=400 kPa
s’3=800 kPa
s’3=600 kPa
Pore water pressure +ve range
Pore water pressure –ve range
s’3=400 kPa
s’3=800 kPa
s’3=600 kPa
Figure 6 Stress-strain and pore water pressure responses of kaolin samples during undrained shearing
(a) Deviator stress vs axial strain (Tests 4-9) (b) Change in pore water pressure vs change in deviator stress (Test 4-9)
Pore water pressure +ve rangePore water pressure –Ve range
A=1 line

0
50
100
150
200
250
0200400600800
Dev
iato
r st
ress
kP
a
Mean effective stress p’ kPa
Stress path
J/3G*
0
50
100
150
200
250
300
0 200 400 600 800
Dev
iato
r St
ress
, q
(kP
a)
Mean effective stress p'
0200400600800
Mean effective stress p' kPa
J/3G*
MM
M
Figure 7 Stress paths of normally consolidated and overconsolidated kaolin samples
(a) Overconsolidated sample (OCR = 2, Test 10 )
(c) Stress paths obtained on samples of kaolin with initial pore water pressures in negative and positive values
J/3G*
PWP (+VE)PWP (-VE)
0
50
100
150
200
250
300
350
400
0 200 400 600 800
Dev
iato
r st
ress
kP
a
Mean effective stress p’ kPa
(b) Normally consolidated (data fromauthors data base)
PWP (-VE)PWP (+VE)
M

0
50
100
150
200
250
300
0 50 100 150 200 250
Dev
iato
r St
ress
, q
(kP
a)
Mean Effective Stress, p' (kPa)
050100150200250
Mean Effective Stress, p' (kPa)
J/3G*J/3G*
M
M
Figure 8 Stress paths of Oxford Clay loaded under undrained conditions (Test 11 and 12B)
PWP (+VE)PWP (-VE)

050100150200250300
Mean effective stress p’ kPa
0
50
100
150
200
250
300
0 50 100 150 200 250 300D
evia
tor
stre
ss k
Pa
Mean effective stress p’ kPa
J/3G*
J/3G*
MM
Figure 9 Stress paths of Belfast Clay loaded under undrained conditions (Test 14 and 15)
PWP (+VE)PWP (-VE)

Supplementary material
Click here to access/downloadSupplementary material
List of figures.docx