Assessment of safety characteristics for Li-ion …i Assessment of safety characteristics for Li-ion...
94
THESIS FOR THE DEGREE OF LICENTIATE OF ENGINEERING Assessment of safety characteristics for Li-ion battery cells by abuse testing FREDRIK LARSSON Department of Applied Physics Chalmers University of Technology Göteborg, Sweden 2014
Transcript of Assessment of safety characteristics for Li-ion …i Assessment of safety characteristics for Li-ion...
THESIS FOR THE DEGREE OF LICENTIATE OF ENGINEERING
Assessment of safety characteristics for Li-ion battery cells by abuse testing
FREDRIK LARSSON
Department of Applied Physics
Chalmers University of Technology
Göteborg, Sweden 2014
Assessment of safety characteristics for Li-ion battery cells by abuse testing
FREDRIK LARSSON
Thesis for the degree of Licentiate of Engineering
© Fredrik Larsson, 2014
Department of Applied Physics
CHALMERS UNIVERSITY OF TECHNOLOGY
SE-412 96 Göteborg
Sweden
www.chalmers.se
Telephone: +46 (0)31-772 00 00
Author’s e-mail: [email protected]
Printed by Chalmers Reproservice
Göteborg, Sweden 2014

i
Assessment of safety characteristics for Li-ion battery cells by abuse testing
FREDRIK LARSSON
Department of Applied Physics, Chalmers University of Technology
ABSTRACT
Despite the many advantages with lithium-ion batteries there can be disadvantages in form of safety issues. In an abuse situation a Li-ion cell can undergo a thermal runaway releasing excessive heat, flammable and toxic gas emissions and eventually accompanied by dissembling/explosion and fire. Abuse tests are a method for assessment of the safety characteristics of Li-ion batteries. Results on cells and electrolytes from abuse testing by overcharge, short circuiting, external heating and fire test are presented and discussed. The thermal runaway was studied by external heating of various commercial Li-ion cells with cylindrical and pouch packaging. Cells with lithium cobalt based oxides showed a thermal runaway at
around 200 °C with a maximum rate of temperature increase of about 5000 °C/min. Cells with lithium iron phosphate (LFP) showed significantly lower reactivity but a thermal runaway did still occur for some cells. Short circuit and overcharge tests of LFP pouch cells showed in most cases temperature increases
below about 100 °C. Fires did not occur in these tests except one unexpected fire during an overcharge test. The fire tests show that the reactivity of Li-ion cells in a fire are dependent on the state of charge (SOC), however, the total heat release shows a low SOC dependence. Toxic emissions of hydrogen fluoride (HF), phosphorous oxyfluoride (POF3) and phosphorus pentafluoride (PF5) were studied by FTIR in fire experiments conducted on electrolytes and cells. The results are extrapolated to obtain an estimate of the possible emissions from a fire in an electric vehicle. Keywords: Lithium-ion, battery, safety, abuse test, overcharge, short circuit, thermal runaway, fire, toxic gases

ii

iii
LIST OF PUBLICATIONS I. F. Larsson, P. Andersson, B.-E. Mellander, “Are electric vehicles safer than
combustion engine vehicles?”, in: B. Sandén, P. Wallgren (Eds.), Systems perspectives on Electromobility, Chalmers University of Technology, Göteborg, ISBN 978-91-980973-9-9, p 33-44, 2014.
II. F. Larsson, B.-E. Mellander, “Energy storage system safety in electrified vehicles”, Fires in vehicles (FIVE) 2012, Conference proceedings, p 303-306, Chicago, USA.
III. F. Larsson, B.-E. Mellander, “Abuse by external heating, overcharge and short circuiting of commercial lithium-ion battery cells”, Journal of the Electrochemical Society, 161 (10) A1611-A1617 (2014), DOI: 10.1149/2.0311410jes.
IV. P. Andersson, P. Blomqvist, A. Lorén, F. Larsson, ”Using FTIR to determine toxic gases in fires with Li-ion batteries”, Submitted to Fire and Materials.
V. F. Larsson. P. Andersson, P. Blomqvist, A. Lorén, B.-E. Mellander, ”Characteristics of Lithium-ion batteries during fire tests”, Journal of Power Sources, in press, DOI: 10.1016/j.jpowsour.2014.08.027.

iv

v
ACKNOWLEDGEMENTS I am very grateful to Professor Bengt-Erik Mellander for all this knowledge and positive spirit supporting me. Many thanks also to my other supervisors, Petra Andersson and Ingvar Albinsson. Thanks to all fantastic colleagues at SP and Chalmers. Special thanks to Ingvar Karlson and Maurizio Furlani. I gratefully acknowledge the Swedish Energy Agency and the FFI-program, the Swedish Fire Research Board and the Swedish Fire Protection Association for financial support. Special thanks to FKG and Stephen Wallman for the support. I would also like to thank the former company Effpower for supporting the initiation of my PhD-project and Peter Leisner, head of department of SP Electronics, for arranging the continuity of the project from Effpower. The project partners of the FFI-project “FFI Safer battery systems in electrified vehicles – develop knowledge, design and requirements to secure a broad introduction of electrified vehicles” are also gratefully acknowledged. To my family and especially to beautiful Malin and Holger.
Fredrik Larsson
Göteborg, August 2014

vi
CONTENTS ABSTRACT ........................................................................................................................................................................ I
LIST OF PUBLICATIONS ............................................................................................................................................... III
ACKNOWLEDGEMENTS ............................................................................................................................................ V
1 INTRODUCTION ................................................................................................................................................... 3
2 PAPER I: ARE ELECTRIC VEHICLES SAFER THAN COMBUSTION ENGINE VEHICLES? ... 6
3 PAPER II: ENERGY STORAGE SYSTEM SAFETY IN ELECTRIFIED VEHICLES ....................... 7
4 PAPER III: ABUSE BY EXTERNAL HEATING, OVERCHARGE AND SHORT CIRCUITING OF COMMERCIAL LITHIUM-ION BATTERY CELLS ............................................................................................ 8
5 PAPER IV: USING FTIR TO DETERMINE TOXIC GASES IN FIRES WITH LI-ION BATTERIES ................................................................................................................................................................... 11
6 PAPER V: CHARACTERISTICS OF LITHIUM-ION BATTERIES DURING FIRE TESTS ......... 13
7 CONCLUSIONS .................................................................................................................................................. 15
8 REFERENCES ..................................................................................................................................................... 16

2

3
1 INTRODUCTION
The world is facing environmental changes and a diminishing oil supply. The greenhouse
effect poses a threat to our civilization, and CO2 emissions are believed to be the main
contributor to an increased temperature. The transportation sector has a large share of the
CO2 emissions. The fossil driven traffic also results in severe air pollution in many cities
which results in health problems. Sweden has a goal to reach a fossil independent vehicle
fleet in the year 2030 and to have a carbon neutral society in the year 2050 [1]. One way to
reach those goals is to use batteries and electrify the combustion engine propelled vehicles of
today; passenger cars, heavy-duty vehicles, etc.
Electrified vehicles (xEV) use either pure electric propulsion or combined electric and
combustions engine propulsion. The pure electric vehicle (EV) has zero tail pipe emissions
and has an energy storage system typically consisting of lithium-ion (Li-ion) batteries. The
hybrid electric vehicle (HEV) and plug-in hybrid electric vehicle (PHEV) typically uses a
smaller sized battery. The HEV battery technology most often used today for e.g. Toyota
Prius is nickel-metal hydride (NiMH) batteries while the PHEV typically uses Li-ion
batteries.
The lithium-ion technology offers high energy and power densities, long life time and fast
recharging compared to e.g. lead-acid and NiMH battery technologies. Li-ion is a family
name including many different cathode and anode materials that use lithium ions for
transport between the electrodes. On the commercial market today there are a number of
different electrode materials for Li-ion batteries. The lithium cobalt oxide (LCO), LiCoO2,
was the first one introduced on the market by Sony in the 1990s. By mixing the cobalt with
other materials a variety of cobalt based oxides is possible. Typically nickel, manganese or
aluminum are used forming e.g. nickel manganese cobalt oxide (NMC), LiNixMnyCozO2 and
nickel cobalt aluminum oxide (NCA), LiNxCoyAlzO2, where x+y+z=1. There are also
cathode materials without cobalt, e.g. lithium manganese oxide (LMO), LiMn2O4.
Phosphates are also used as cathode material [2] and the most widely used today is lithium-
iron phosphate (LFP), LiFePO4. Commercial anode materials for Li-ion batteries are
dominated by carbon materials, e.g. natural and synthetic graphite, but lithium titanate oxide
(LTO), Li4Ti5O12, is also used by some manufacturers. There are many potential electrode
materials for use in Li-ion batteries and there are intensive research activities within this
area, e.g. cells with higher voltage and for use in higher temperatures as well as the Li-air
battery. Theoretically the Li-air battery, which uses air (oxygen) as cathode, can reach an
energy density more than 10 times higher than today’s Li-ion batteries but several major

4
challenges must be overcome, including safety aspects and the Li-air battery is not likely to
be commercialized within 20-30 years [3].
Today Li-ion batteries are widely used in different applications. They have been used for a
long time in consumer products such as laptops, mobile phones, digital cameras and power
tools. The automotive industry has more recently started to use Li-ion batteries in xEVs and
with increasing yearly volumes. The high energy density of Li-ion cells gives batteries with
low weight and volumes which have had a major impact on product development and design.
However, the Li-ion technology has some drawbacks regarding safety aspects compared to
other battery technologies, e.g. lead-acid and NiMH. Lithium-ion batteries have a high cell
voltage due to the use of lithium which enables the high energy density but this can also give
safety problems and incidents and accidents have happened, some of them with a large
media interest [4-7].
Li-ion cells cannot use water based electrolytes due to the high cell voltage, typically 3.7 V
(the value varies for different cell chemistries), and use instead organic electrolytes which
are volatile and flammable. The electrolyte consists of organic solvents, a Li-salt and
additives. Typical solvents used are ethylene carbonate (EC), diethyl carbonate (DEC) and
dimethyl carbonate (DMC). The Li-salt commercially used today is lithium
hexafluorophosphate, LiPF6. A number of different additives are used to achieve various
properties, e.g. flame retardants, voltage stabilizers and additives intended to increase life
time. The electrolyte and particularly the additives are each cell manufacturer’s secret and
very rarely disclosed. Lithium metal itself is very reactive, however, the lithium is in form of
Li+ and intercalated in electrodes, which is a much more stable state, with little free lithium
metal as a result of e.g. aging effects, overcharge or overcurrent during low temperatures.
A Li-ion cell must be kept within a certain range of temperature, voltage and current in order
to be stable. In case these limits are exceeded the result might be any or a combination of
these effects: swelling of the cell due to increased gassing/pressure, release of these gases by
cell venting which can occur relatively slowly or rapidly (dissembling or even an explosion)
and a fire might start. The type of abuse situation and the Li-ion cell chemistry and cell
design affect the cell reaction. In case of an excessive internal cell temperature, a thermal
runaway can occur. A thermal runaway is a rapid temperature increase, where the heat
generation is greater than the heat dissipation to the cell surrounding. The onset temperature
of the runaway depends on the cell chemistry, and for a typical cobalt cell it starts at
relatively moderate temperatures, 120-150 °C [8]. The first step in a typical thermal runaway
is the breakdown of SEI (solid electrolyte interface) layer, followed by a reaction between
electrolyte and anode which is exothermal which further accelerates the process and
5
increases the temperature enabling the third step of the reaction between electrolyte and
cathode, which is even more exothermal. The reactions can be sustained by its own oxygen
whereas different cathode materials release different amounts of oxygen. The LFP chemistry
is considered as the most thermally stable cathode material available at the market today
with no oxygen release at those temperatures [8-11]. The thermal response of a LFP cell is
thereby dominated by the electrolyte and anode.
In case of mechanical abuse, e.g. deformation and penetration, internal short circuits are
created inside the cell which thereby increases the cell temperature. An internal short circuit
can also originate from particle contamination or from dendritic bridges formed during
cycling (discharge/charging) of the cell. Forming of a dendritic bridge used to be a problem
earlier but is nowadays a relatively small problem. However, cell failures in the field, “field
failures”, are often seen as internal short circuits, with a low probability on cell level, less
than 1 ppm [5,12]. Electrical abuse situations like overcharge, overdischarge and external
short circuit can also cause problems. In case of external heating abuse, e.g. a fire close by or
a Li-ion battery of a mobile phone lying in a car window a sunny day, a thermal runaway can
also be initiated.
In order to evaluate cell response in case of abuse situations, abuse testing can be used.
United Nations has a test manual [13] for transportation demands of Li-ion batteries
classifying them as dangerous goods and specifies test that the cells and batteries needs to
undergo before they can be transported in resting state. In addition UNECE released its
addendum 99 to regulation No. R100 [14] including safety tests for battery used on wheeled
vehicles, tests that included cycling of the batteries within certain temperature ranges etc that
a vehicle might be exposed to. There are several international standards for abuse testing
[15-17], many of which have been updated recently. The abuse tests standards for Li-ion is
however, not yet complete, e.g. regarding toxic fluoride emissions. Besides, with the fast Li-
ion technology development there is also a natural process of updates to follow the
technology progress and abuse tests standards are thereby likely to continually be updated
for at least some time.
Li-ion cells and battery systems containing multiple cells are equipped with various safety
mechanisms [18-23]. Cylindrical cells have e.g. a safety vent, which, if it is properly
designed and fully functional, can protect the cell from explosion, by releasing excessive cell
pressure before critical pressure levels have been build-up. In case of pouch prismatic cells
which have soft packaging (coffee bags) explosion risks due to high pressure are not likely
due to the weak packaging.
6
The released gases contain a complex mixture of possible components, which vary with the
abuse situation, e.g. if the cell is on fire or not. The gases can be both flammable and toxic.
Vaporized solvents are typically released together with e.g. CO, CO2, H2 [24-26]. The
fluorine content, from the Li-salt and also from possible use of some binders (e.g. PVdF), is
a source for the formation of toxic fluorine compounds. Hydrogen fluoride (HF) is very toxic
[27] and has gained most interest so far. Phosphorous oxyfluoride, POF3, and phosphorus
pentafluoride, PF5, are two other gases that may be emitted [28-30]. The toxicity of POF3 is
unknown but it can potentially be more toxic than HF as is the case for its chlorine analog,
HCl/POCl3 [31]. Besides HF, POF3 and PF5 other complex components can be formed [32-
34].
The assessment of the overall safety of a battery with Li-ion cells is complex and determined
by many factors; cell chemistry, cell design, battery system design, cooling system, safety
mechanisms, mechanical deformation protection, etc. Abuse testing is a valuable tool to
evaluate safety characteristics under a broad variety of situations. This licentiate thesis
demonstrates this and gives insight into the safety issues with Li-ion batteries based on these
tests.
2 PAPER I: ARE ELECTRIC VEHICLES SAFER THAN
COMBUSTION ENGINE VEHICLES?
The aim of Paper I is to discuss the safety of an electrified vehicle, e.g. EV and PHEV,
compared to a vehicle with only a combustion engine for gasoline or diesel. The paper gives
a general introduction and description about battery systems, battery types, different hazards
associated with electrified vehicles and some incidents that have occurred as well as outlooks
for the future.
METHOD
In form of an e-book chapter that is updated regularly (living document) based on new
research findings and technology development.
MAIN FINDINGS
• Electrified vehicles have the potential to be safer than combustion engine vehicles,
simply due to that they are not carrying or carrying less amount of flammable
gasoline/diesel, which will remove/lower the risk for fire and explosions.
• New risks might be introduced by electric vehicles

7
• New technologies can always mean new unknown risks which might take time to
learn to handle.
• The electrical hazard in electric vehicle is low with correct handling.
• Too few electrified vehicles are yet on the roads today to have any reliable statistics
of accidents/incidents.
3 PAPER II: ENERGY STORAGE SYSTEM SAFETY IN
ELECTRIFIED VEHICLES
The aim of Paper II is to study the thermal runaway response of commercial Li-ion cell with
the physical cell size of type 18650, i.e. 18 mm in diameter and 65 mm long. External
heating is used to initiate a thermal runaway since safety devices such as PTC and CID
inside the cells cannot protect from this type of abuse. Commercial 18650 Li-ion cells from
Samsung, Sanyo and K2 Energy were tested. The cells from Samsung and Sanyo had cobalt
based cathodes and are typically used in laptop computers, while the cell from K2 Energy
has a LFP cathode.
METHOD
The cells were fully charged (100% SOC) and heated up in a thermostated oven. The cells
were tested one at the time, fastened on a brick which was centrally placed in the oven. The
air in the oven was circulated with its built-in fan in order to achieve a uniform temperature
around the cell. The cell surface temperature was measured with four type K thermocouples.
The oven was set on 300 °C with continuous heating and was not stopped until the effect of
the thermal runaway had completely finished.
MAIN FINDINGS
• The thermal runaway from Samsung and Sanyo cells with cobalt based cathodes
showed similar thermal reactions, with a temperature rise of 18-25 °C/sec.
• The LFP cell from K2 Energy had a thermal runaway but it was significantly less
energetic compared to the cells from Samsung and Sanyo, with temperature rise of
0.6 °C/sec.
• The thermal runaway temperatures for all cells were around 200 °C, see Figure 1.

8
Figure 1 Temperature development for three 18650 lithium-ion cells during external heating test.
4 PAPER III: ABUSE BY EXTERNAL HEATING, OVERCHARGE AND SHORT CIRCUITING OF
COMMERCIAL LITHIUM-ION BATTERY CELLS
The aim of Paper III is to study cell response of four types of commercial Li-ion cells under
three types of abuse; external heating, overcharge and short circuit. The focus is on LFP cells
from EiG and European Battery. 18650 Samsung laptop cells are also studied but during
external heating only, since their safety devices (e.g. PTC, CID) would stop overcharge and
short circuit situations making them non-interesting for this study.
METHOD
The external heating abuse tests are conducted using the oven and procedure discussed in
paper II, with the exception that both a continuous and a step-wise temperature increase was
used. For the step-wise increase, the oven temperature was first set to 80 °C and thereafter
increased in steps of 10 °C every 15 min until either any thermal runaway had occurred or
the maximum temperature of the oven (300 °C) was reached. Cells were fully charged
(100% SOC) prior to the tests.
The overcharge abuse tests started with fully charged cells which were then charged beyond
their limits. For the EiG power cell a current of 10 C-rate (70A) was used and for the
0 20 40 60 80 1000
100
200
300
400
500
600
700
800
Time (min)
Ave
rage
cel
l sur
face
tem
pera
ture
( o C
)
Samsung
SanyoK2 Energy

9
European Battery energy cell a current of 2 C-rate (90A) was used. Cell voltage, current and
temperature (by several type K thermocouples) were measured with 1 Hz.
The short circuit abuse tests were conducted using 50 mm2 copper cables and a high current
contactor enabling a low resistance short circuit. The current was measured by a current core
and the cell surface temperatures measured with several type K thermocouples.
MAIN FINDINGS
• The external heating of the 18650 laptop cell resulted in a rapid thermal runaway,
with a rate of temperature increase close to 5000 °C/min, a pressure wave, squirting
of ignited cell materials and immediate fire.
• The corresponding energy release from of 300 kg battery pack in an electric vehicle
build by the 18650 cells would be approximately 70 MJ, corresponding to the
combustion of 2 litre of gasoline. However, our results are up to six times lower than
that of other studies.
• LFP cells are less energetic than cobalt based cells. However, variations between
LFP cells from different cell manufacturers as well as between different cell design
versions from the same manufacturer were found.
• For the 7 Ah LPF cell from EiG, it was found that the newer cell design have a
significantly lower, close to undetectable, thermal runaway peak compared to an
older cell design, see Figure 2. Even though both cell designs use the safest currently
available commercial cathode material, LFP, this shows that the development for
safer Li-ion cells is still improving but also underlines that the cathode material is
only one of the important components for safety assessment.
• Overcharge of LFP cells resulted in relatively low temperatures, less than 80 °C was
measured, which is lower than the thermal runaway onset temperature. One LFP cell
did however unexpectedly catch fire during the overcharge, see Figure 3. This fire
event was not repeated in the following three tests. This highlights the possibility of
field failures of batteries, in that there is a probability for these things to happen.
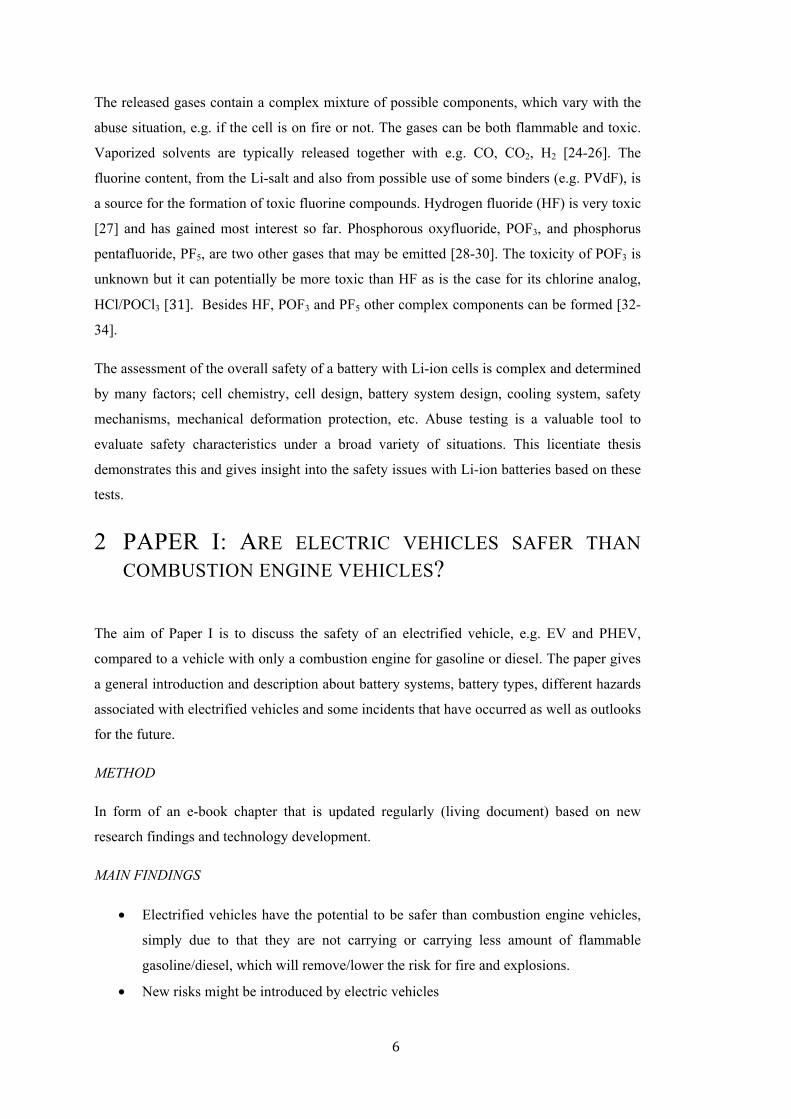
• The short circuit currents of a single Li-ion cell can be high, around 1000 A was
measured, see Figure 4.

10
Figure 2 Temperature development during external heating of EiG cells of newer and older cell design.
Figure 3 One of the overcharge test, by 2 C-rate (90A), of a European Batteries cell resulted in a fire.
11
Figure 4 Short circuit of EiG cell of newer design (dashed lines) and EiG of older design (solid lines).
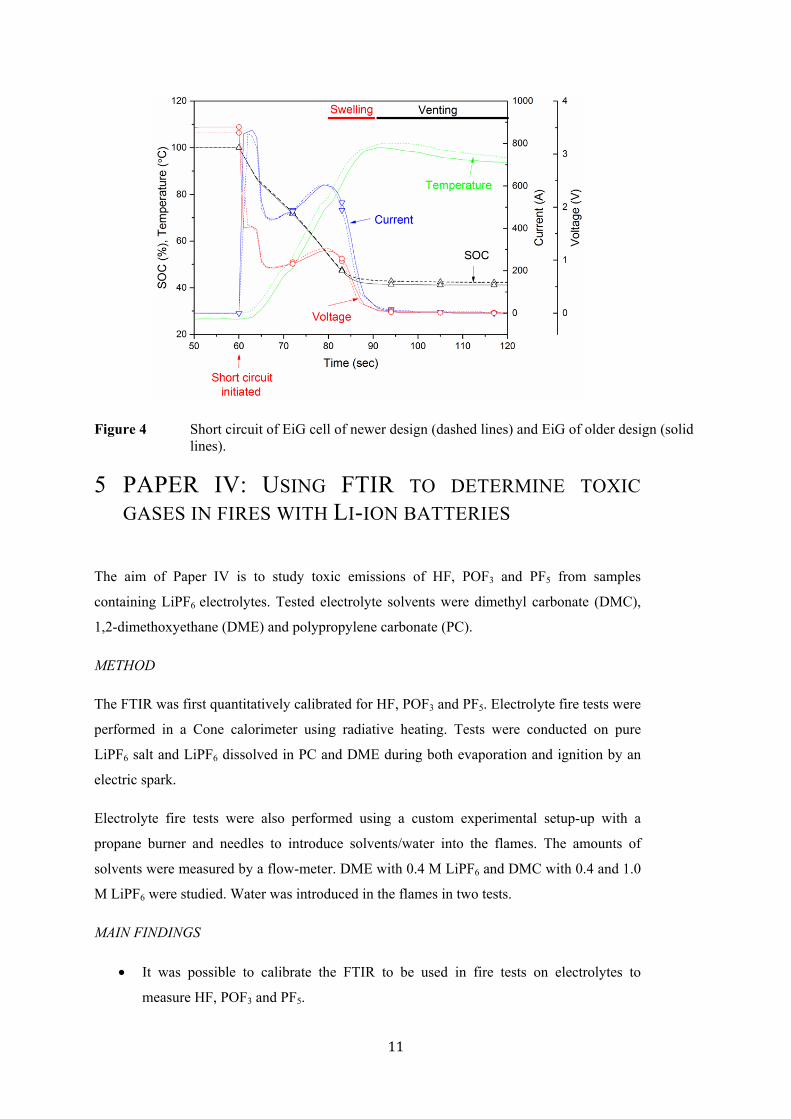
5 PAPER IV: USING FTIR TO DETERMINE TOXIC
GASES IN FIRES WITH LI-ION BATTERIES
The aim of Paper IV is to study toxic emissions of HF, POF3 and PF5 from samples
containing LiPF6 electrolytes. Tested electrolyte solvents were dimethyl carbonate (DMC),
1,2-dimethoxyethane (DME) and polypropylene carbonate (PC).
METHOD
The FTIR was first quantitatively calibrated for HF, POF3 and PF5. Electrolyte fire tests were
performed in a Cone calorimeter using radiative heating. Tests were conducted on pure
LiPF6 salt and LiPF6 dissolved in PC and DME during both evaporation and ignition by an
electric spark.
Electrolyte fire tests were also performed using a custom experimental setup-up with a
propane burner and needles to introduce solvents/water into the flames. The amounts of
solvents were measured by a flow-meter. DME with 0.4 M LiPF6 and DMC with 0.4 and 1.0
M LiPF6 were studied. Water was introduced in the flames in two tests.
MAIN FINDINGS
• It was possible to calibrate the FTIR to be used in fire tests on electrolytes to
measure HF, POF3 and PF5.

12
• HF and POF3 emissions were measured from LiPF6 and the solvents PC, DME and
DMC, e.g. see Figure 5 and Figure 6.
• PF5 is highly reactive and thereby difficult to calibrate and no PF5 was found in the
fire tests.
• POF3 is produced with a concentration of approximately 5-40% of the HF
concentration.
• Some of the spectral peaks found correspond to unknown substances.
Figure 5 Heat release rate (HRR) and HF concentration during burning of 1 M DMC injected
as a spray (18 ml/min) into a 4 kW propane burner during two minutes.
Figure 6 Concentrations of HF and POF3 during burning of 1 M DMC injected as a spray (18 ml/min) into a 4 kW propane burner during two minutes.

13
6 PAPER V: CHARACTERISTICS OF LITHIUM-ION
BATTERIES DURING FIRE TESTS
The aim of Paper V is to study the fire characteristics and gas emissions of Li-ion batteries in
case of an external fire. The heat release rate (HRR), total heat release (THR), battery
temperature and voltage were measured. The production of toxic emissions was measured in
real-time. Hydrogen fluoride (HF) was quantitatively detectable while phosphorous
oxyfluoride (POF3) was not detectable in this setup, but was probably present in the released
emissions.
Seven tests were performed of 3 battery types; EiG 7 Ah, K2 Energy and conventional
Lenovo laptop battery packs. The study included SOC levels of 100%, 50% and 0% for EiG
cells as well as one test where water mist was applied in order to study possible influence on
emissions.
METHOD
The tests were performed using the measurement and gas collection system of a Single
Burning Item (SBI) apparatus. The battery was placed on a wire grating and a 15 kW
propane burner beneath was used. Five EiG cells were tested at the time, fastened together
with steel wire. The nine cells from K2 Energy were placed inside a box with steel net as
protection from potential projectiles. The two laptop battery packs were also enclosed by a
steel net in order to avoid projectiles.
The HRR and THR were measured using the oxygen consumption method corrected for
CO2. The O2 was measured by a paramagnetic analyser and CO2 by a non-dispersive infrared
(NDIR) sensor. The toxic gas emissions were measured in real-time (one spectra every 12
seconds) by Fourier transform infrared spectroscopy (FTIR) and by post analysis of any
fluorine contained in the FTIR primary filter. The temperature and cell voltage of the mid
cell of the EiG 5-cell pack were measured with 1 Hz.
MAIN FINDINGS
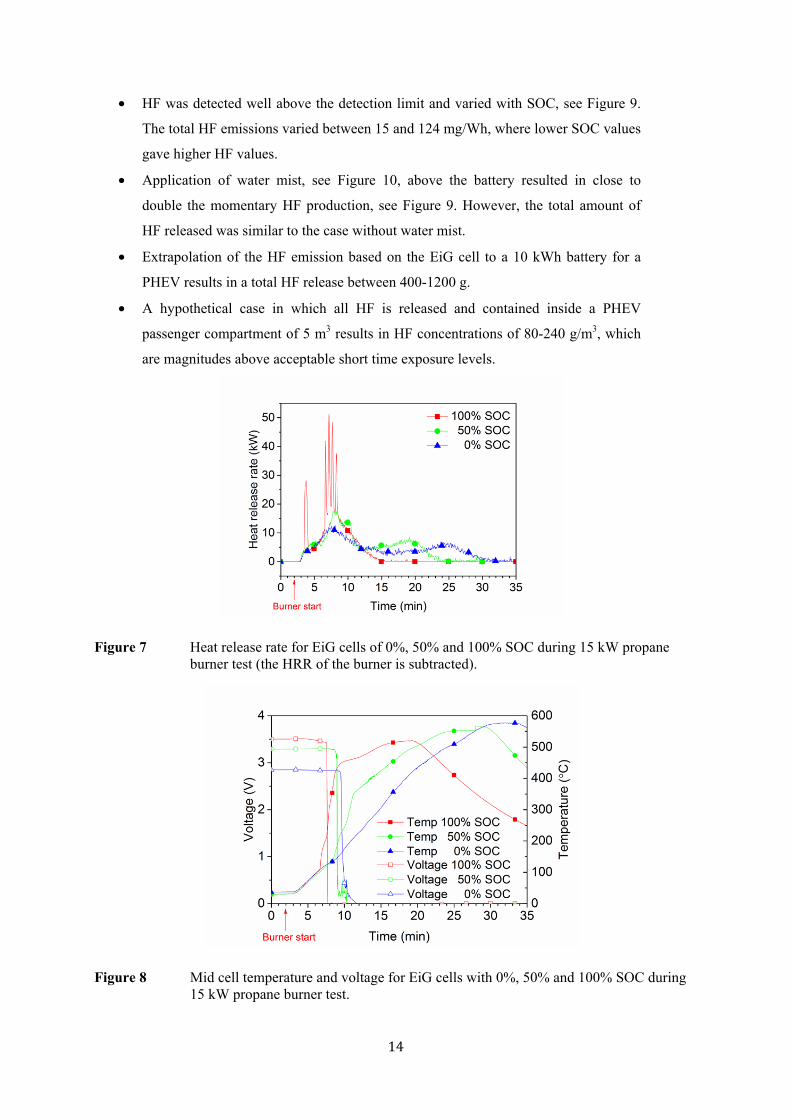
• Cells with 100% SOC are significantly more reactive than cells with lower SOC
values and showed energetic outbursts, see Figure 7 and Figure 8.
• The HRR peak values varied between 13 and 57 kW for batteries with
approximately 100 Wh energy capacity.
• Emissions of POF3 and PF5 were not detected but should have been present
according to the theory. POF3 emissions were probably below the detection limit.
14
• HF was detected well above the detection limit and varied with SOC, see Figure 9.
The total HF emissions varied between 15 and 124 mg/Wh, where lower SOC values
gave higher HF values.
• Application of water mist, see Figure 10, above the battery resulted in close to
double the momentary HF production, see Figure 9. However, the total amount of
HF released was similar to the case without water mist.
• Extrapolation of the HF emission based on the EiG cell to a 10 kWh battery for a
PHEV results in a total HF release between 400-1200 g.
• A hypothetical case in which all HF is released and contained inside a PHEV
passenger compartment of 5 m3 results in HF concentrations of 80-240 g/m3, which
are magnitudes above acceptable short time exposure levels.
Figure 7 Heat release rate for EiG cells of 0%, 50% and 100% SOC during 15 kW propane burner test (the HRR of the burner is subtracted).
Figure 8 Mid cell temperature and voltage for EiG cells with 0%, 50% and 100% SOC during 15 kW propane burner test.

15
Figure 9 HF mass flow for EiG cells with different SOC (indicated by % in figure legend) in tests 1-5.
Figure 10 Water concentrations measured in test 1-3. The increased water level in test 3 due to
water mist application is clearly seen
7 CONCLUSIONS
Abuse testing is used to evaluate the safety characteristics beyond the design parameters.
Different Li-ion cell design and chemistry give diverse reactions to abuse, where LFP is
significantly less energetic than cobalt based cells. LFP cells which are considered as the
safest Li-ion battery chemistry available today can still catch fire, as shown in one of the
overcharge tests.

16
State of charge impacts the reaction response during the fire tests and the heat release rate is
higher with higher SOC values. When a Li-ion cell is short circuited, large currents of e.g.
1000 A can be found. Overcharging tests utilising 2 C-rate and 10 C-rate of LFP cells
resulted in swelled cells with gas released but relative low temperatures, below the onset of
thermal runaway.
Toxic gas emissions of HF and POF3 pose a possible critical risk for Li-ion batteries and
especially for large Li-ion battery systems. POF3 is in our limited study found to be produced
with about 5-40% of the HF production. The toxicity of POF3 is unknown but it is possibly
even more toxic than HF. It was not possible to draw any clear conclusions on the impact of
water as an extinguishing medium in these limited studies but a temporarily increased HF
production rate was indicated at the application of water mist, however, further studies are
required to make any firm conclusions.
Extrapolation of the total HF emissions from cell-testing to a 10 kWh battery pack, typically
used in a PHEV, results in 400 – 1200 g HF that could be released. This might pose a serious
threat to humans near a car fire. A hypothetical case in which all HF is released and
contained in a 5 m2 passenger cabin give HF concentrations that are orders of magnitude
over the acceptable short term exposure levels. Further studies are needed also in this case.
8 REFERENCES [1] Government Offices of Sweden, ”En sammanhållen klimat- och energipolitik”, Regeringens
proposition 2008/09:162, 2008. [2] A. K. Padhi, K. S. Nanjundaswarmy, J. B. Goodenough, J. Electrochem. Soc., 144, 1188, 1997. [3] G. Girishkumar, B. McCloskey, AC Luntz, S. Swanson, W. Wilcke, J. of Phys. Chem. Letters,
1(14), 2193–2203, 2010. [4] B. Smith, “Chevrolet Volt Battery Incident Overview Report”, National Highway Traffic Safety
Administration (NHTSA), DOT HS 811 573, Washington, 2012. [5] D. Lisbona, T. Snee, Process safety and environmental protection, 89, 434-442, 2011. [6] C. Mikolajczak, M. Kahn, K. White, R. T. Long, “Lithium-ion batteries hazard and use
assessment”, Fire Protection Research Foundation, Quincy, MA, USA, Doc no 1100034.000 A0F0 0711 CM01, 2011.
[7] http://edition.cnn.com/2013/07/12/world/europe/uk-heathrow-airplane-fire/, 2014-06-30. [8] D. Doughty, E. P. Roth, The Electrochem. Soc. Interface, summer 2012, 37-44, 2012. [9] K. Zaghib, J. Dubé, A. Dallaire, K. Galoustov, A. Guerfi, M. Ramanathan, A. Benmayza, J.
Prakash, A. Mauger, C. M Julien, “Lithium-ion cell components and their effect on high-power battery safety”, Chapter 19 in Lithium-Ion Batteries: Advances and Applications, edited by G. Pistoia, Elsevier, Amsterdam, The Netherlands, p. 437, 2014.
[10] G. Chen, T. J. Richardson, J. of the Electrochem. Soc., 156 (9), A756, 2009. [11] G. Chen, T. J. Richardson, J. of Power Sources, 195, 1221, 2010. [12] Q. Wang, P. Ping, X. Zhao, G. Chu, J. Sun, C. Chen, J. of Power Sources, 208, 210, 2012. [13] UNT / UN Manual of Tests and Criteria, Part III, Sub-Section 38.3 for lithium-ion batteries,
firth edition, United Nations, 2009.

17
[14] Addendum 99: Regulation No. 100, Revision 2, E/ECE/324/Rev.2/Add.99/Rev.2, E/ECE/TRANS/505/Rev.2/Add.99/Rev.2, United Nations, 2013.
[15] D. H. Doughty, C. C. Crafts, “FreedomCAR electrical energy storage system abuse test manual for electric and hybrid electric vehicle applications”, Sandia report SAND2005-3123, Sandia National Laboratories, USA, 2006.
[16] UL 1642, UL Standard for safety Lithium Batteries, Fifth Edition, Underwriters Laboratories, Inc., 2012.
[17] D. Doughty, “SAE J2464 Electric and hybrid electric vehicle rechargeable energy storage system (RESS) safety and abuse testing procedure”, SAE Technical Paper 2010-01-1077, doi:10.4271/2010-01-1077, 2010.
[18] P. G. Balakrishnan, R. Ramesh, T. P. Kumar, J. of Power Sources, 155, 401, 2006. [19] J. Jeevarajan, “Safety of commercial lithium-ion cells and batteries” In: G. Pistoia (ed) Lithium-
Ion Batteries Advances and Applications, Elsevier, Amsterdam, The Netherlands, p. 387, 2014. [20] Z. Zhang, P. Ramadass, W. Fang, “Safety of lithium-ion batteries” In: G. Pistoia (ed) Lithium-
Ion Batteries Advances and Applications, Elsevier, Amsterdam, The Netherlands, p. 409, 2014. [21] K. Zaghib, J. Dubé, A. Dallaire, K. Galoustov, A. Guerfi, M. Ramanathan, A. Benmayza, J.
Prakash, A. Mauger, C. Julien, “Lithium-ion cell components and their effect on high-power battery safety” In: G. Pistoia (ed) Lithium-Ion Batteries Advances and Applications, Elsevier, Amsterdam, The Netherlands, p. 437, 2014.
[22] S. S. Zhang, J. of Power Sources, 162, 1379, 2006. [23] G. Nagasubramanian, K. Fenton, Electrochimica Acta, 101, 3, 2013. [24] T. Ohsaki, T. Kishi, T. Kuboki, N. Takami, N. Shimura, Y. Sato, M. Sekino, J. of Power
Source, 146, 97-100, 2005. [25] E. P. Roth, C. J. Orendorff, The Electrochem. Soc. Interface, summer 2012, 45, 2012 [26] E.P. Roth, ECS Transactions 11 (19) 19-41, 2008. [27] Documentation for Immediately Dangerous To Life or Health Concentrations (IDLHs) for
Hydrogen fluoride (as F), The National Institute for Occupational Safety and Health (NOISH), USA, 1994.
[28] H. Yang, G. V. Zhuang, P. N. Ross Jr, J. of Power Sources 161, 573-579, 2006. [29] T. Kawamura, S. Okada, J.-i. Yamaki, J. of Power Sources 156, 547-554, 2006. [30] P. Andersson, P. Blomqvist, A. Lorén, F. Larsson, “Investigation of fire emissions from Li-ion
batteries”, SP Report 2013:5, SP Technical Research Institute of Sweden, Boras, Sweden, ISBN 978-91-87461-00-2, 2013.
[31] A. Middelman, “Hygiensiska gränsvärden AFS 2011:18”, Hygieniska gränsvärden Arbetsmiljöverkets föreskrifter och allmänna råd om hygieniska gränsvärden, ISBN 978-91-7930-559-8, ISSN 1650-3163, Swedish Work Environment Authority, Sweden, 2011.
[32] A. Hammami, N. Raymond, M. Armand, Nature 424, 635-636 , 2003. [33] C. L. Campion, W. Li, W. B. Euler, B. L. Lucht, B. Ravdel, J. F. DiCarlo, R. Gitzendanner, K.
M. Abraham, Electrochem. and Solid-State Letters, 7 (7) A194-A197, 2004. [34] C. L. Campion, W. Li, B. Lucht, J. of the Electrochem. Soc., 152 (12), A2327-A2334, 2005.


Paper I


33
4
ARE ELECTRIC VEHICLES SAFER THAN COMBUSTION ENGINE VEHICLES?Fredrik Larsson
Department of Applied Physics, Chalmers University of Technology*
SP Technical Research Institute of Sweden**
Petra Andersson
SP Technical Research Institute of Sweden***
Bengt-Erik Mellander
Department of Applied Physics, Chalmers University of Technology*
* Division of Solid State Physics ** Division of Electronics *** Division of Fire Chapter reviewers: Fredrik Hedenus, Physical Resource Theory, Energy and Environment, and Pontus Wallgren, Design & Human Factors, Product and Production Development, Chalmers
INTRODUCTION
Replacing conventional vehicles using internal combustion engines with electri-
fied vehicles (EV) is a challenge in many respects. Introduction of new technical
solutions, especially those produced for a mass market, may substantially change
and possibly increase the risks associated with the products. On the other hand,
electric vehicles have other clear advantages concerning safety as they do not
carry conventional fuels onboard such as petrol or diesel, both of which are flam-
mable and toxic. Without a combustion engine onboard, the risks of fire and explo-
sion are thus minimized. Therefore, the introduction of electric vehicles promises a
transition to a clean, non-polluting, healthy and safe means of transportation (see
also Chapter 6 on life cycle environmental impact).
While there is a potential for electric vehicles to be safer than conventional ones
we still need to consider what other risks this technological transition will bring as
the risks associated with conventional vehicles are well known to most people and
thus easily dealt with in daily life. What risks are associated with a large onboard
chemical energy storage? Will the hazardous traction voltage of the electrical
34
system pose a danger to the passengers or to rescue personnel in case of an
accident? How can eventual risks be diminished in traffic, when vehicles are
parked and maintained? All these aspects and more need to be considered when
designing the vehicle.
Safety issues for electric vehicles considered here include mainly battery powered
vehicles, vehicles which have the battery as the only means to store energy (BEVs)
or range extended vehicles where the battery is still the main source of energy but
an extended range can be obtained using a combustion engine, for example plug-
in hybrid vehicles (PHEVs). Another type of electric vehicle is the fuel cell powered
car, using hydrogen gas as fuel. In this case, safety aspects mainly concern the
safe handling and storage of hydrogen. While EVs are on the market in rapidly
increasing numbers today, the fuel cell car has not reached true commercial intro-
duction yet. Compared to conventional fuels hydrogen has both advantages and
disadvantages, but again the risks are different to those we are familiar with and
other safety practices are needed. We will, however, not include fuel cell safety
issues in this chapter.
Lithium-ion (Li-ion) batteries have high energy and power densities that make it
possible to build BEVs and PHEVs with acceptable electric driving range with zero
tail pipe emissions. This type of battery has therefore become the preferred choice
for manufacturers of these types of vehicles. In this chapter we focus primarily on
the lithium-ion battery while other battery types are discussed more briefly. Other
technologies for energy storage, e.g. flywheels, compressed air and supercapaci-
tors might be used in future electric vehicles. Presently, they are used to a very
limited extent and are therefore not included.
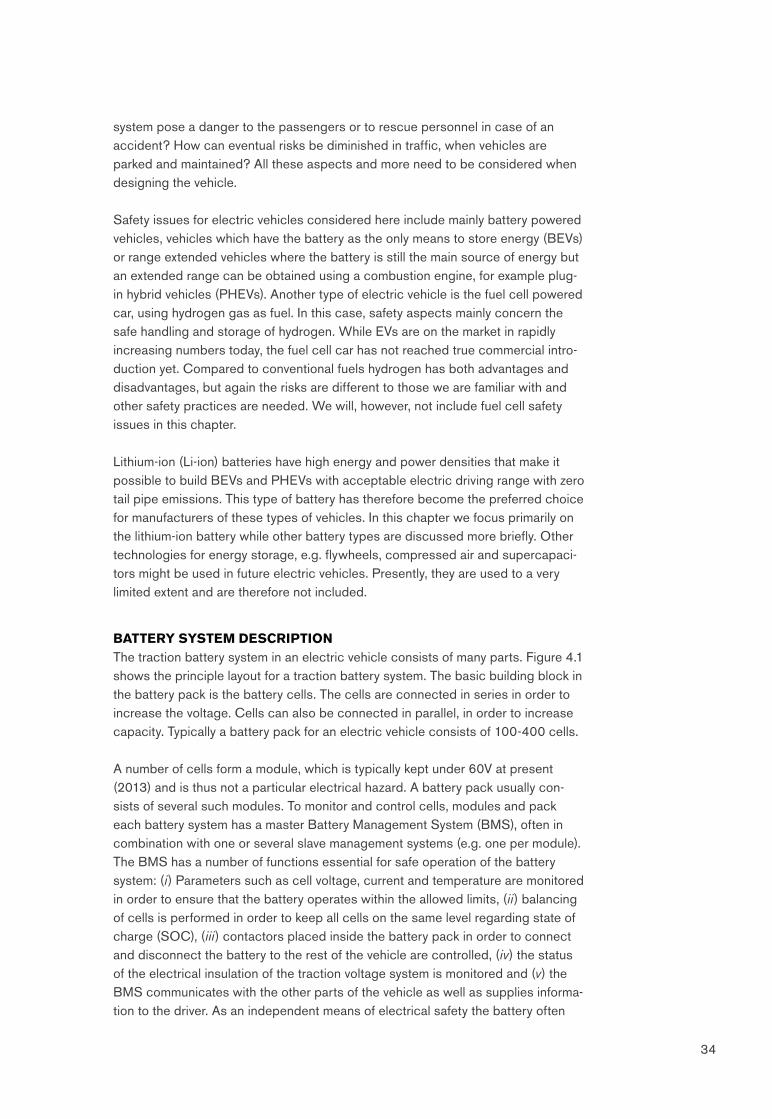
BATTERY SYSTEM DESCRIPTION
The traction battery system in an electric vehicle consists of many parts. Figure 4.1
shows the principle layout for a traction battery system. The basic building block in
the battery pack is the battery cells. The cells are connected in series in order to
increase the voltage. Cells can also be connected in parallel, in order to increase
capacity. Typically a battery pack for an electric vehicle consists of 100-400 cells.
A number of cells form a module, which is typically kept under 60V at present
(2013) and is thus not a particular electrical hazard. A battery pack usually con-
sists of several such modules. To monitor and control cells, modules and pack
each battery system has a master Battery Management System (BMS), often in
combination with one or several slave management systems (e.g. one per module).
The BMS has a number of functions essential for safe operation of the battery
system: (i) Parameters such as cell voltage, current and temperature are monitored
in order to ensure that the battery operates within the allowed limits, (ii) balancing
of cells is performed in order to keep all cells on the same level regarding state of
charge (SOC), (iii) contactors placed inside the battery pack in order to connect
and disconnect the battery to the rest of the vehicle are controlled, (iv) the status
of the electrical insulation of the traction voltage system is monitored and (v) the
BMS communicates with the other parts of the vehicle as well as supplies informa-
tion to the driver. As an independent means of electrical safety the battery often

35
has one or several fuses, for short-circuit protection. Furthermore, the thermal
management system of the battery could both heat and cool the cells in order to
maintain a temperature within an efficient and safe temperature range. A mechani-
cal housing, the battery box, is used to enclose and protect the battery pack. It has
several functions and a suitable tightness-class.
Tractionbattery pack
Thermalmanagement
system
Cells Modules
Mechanicalhousing
Short-circuitprotection
(fuse)
HV Connect/Disconnect(contactors)
Batterymanagement
system (BMS)
+ –
12V battery
Figur 4.1 The traction battery system overview.
Typically the battery pack uses an external 12V supply from the vehicle’s 12V-bat-
tery, e.g. a conventional lead-acid battery. The 12V supply is used to power up the
BMS and to close the contactors. In principle, the battery could supply its own
12V by an internal DC/DC converter but an external supply is a simple solution
that is commonly used.
BATTERY TYPES
Lead-acid batteries (PbA) have been used for more than 150 years and are still
produced in large quantities as 12 V and 24 V vehicle batteries. There are several
types, e.g. free ventilated or recombination cells (e.g. AGM, GEL). Compared to
Nickel-metal-hydride and Li-ion batteries, they have lower power and energy densi-
ties and a significantly shorter cycle lifetime. Lead-acid batteries also require a
long charging time, typically 10 hours. Since this should be seen as a fully mature
technology it has been cost optimized. Due to its high weight and large volume
it is not a real option for PHEVs or EVs, even though it was used experimentally
in EVs during the 1990s. Presently lead-acid batteries are considered only for
micro-hybrid electric vehicles (start and stop techniques). The safety concerns are
small and related mainly to the risk of hydrogen gas production during operation.
Hydrogen gas can potentially ignite and explode but the buoyancy of hydrogen gas
makes it relatively easy to ventilate the battery in order to avoid the formation of

36
an ignitable mixture with air. Since lead acid batteries is a mature technology the
battery design is very well developed to avoid these problems.
Nickel-metal-hydride batteries (NiMH) are presently dominating the HEV-market;
they are used in the Toyota Prius for instance. NiMH offers significantly improved
energy and power densities compared to lead-acid batteries. Further, it offers a
high cycle life time and safety concerns are small. They do not, however, have the
same energy storage capacity as Li-ion batteries.
Lithium-ion is the dominant battery technology today for PHEVs and EVs due to
its high energy and power densities, combined with a long life time. The safety
concerns are however larger than for NiMH and lead-acid batteries. This is basi-
cally due to the chemistries used for these cells but the large size of the battery
systems needed for these types of vehicles also makes the consequences of a
malfunction potentially more serious. We will therefore devote most of this chapter
to describe safety aspects of Li-ion batteries.
A lithium-ion cell consists essentially of anode, electrolyte, separator and cathode.
The lithium ion is shuttled back and forth between the anode and cathode through
the electrolyte. Even though a large number of different lithium-ion chemistries
are possible there are today (2013) only a few lithium-ion chemistries that are
used commercially. The anode and cathode are intercalated lithium compounds.
Typically the anode is based on graphite, lithium titanate oxide (LTO) can also be
used. The cathode is composed of lithium cobalt oxide (the most common type for
small consumer cells), mixed oxides (manganese, nickel, cobalt, and aluminum) or
phosphates (mainly iron-phosphate). The electrolyte typically consists of organic
solvents, lithium salt and additives. The exact composition differs between the
manufacturers and is usually a commercial secret, especially regarding the
additives. The separator is a porous polymer where the pores are filled with the
electrolyte; its primary function is to avoid direct contact between anode and
cathode. In some cases the separator may also have the function of shutting down
the ion transport in case of overheating.
The risks involved with the use of lithium-ion batteries are closely related to the
chemistries used, the design of cell and system, the handling of the battery when
in use and the quality of the production. The choice of cell chemistry is, in turn,
determined by the demands regarding energy and power density, cost and safety
for the specific application. Small size lithium-ion batteries have been used for
more than a decade in consumer products, such as laptop computers and mobile
phones. During this time, battery fire incidents have been reported in laptops,
iPods, cargo planes and electric vehicles.1 However, the conditions and require-
ments for lithium-ion batteries in automotive applications are different and more
demanding than those for consumer electronics. Lithium-ion cells for the automo-
tive industry are, for example, characterized by increased quality, safety and life
time compared to that of small consumer cells, and generally use more advanced
materials with higher degree of purity.
1 Wang, Q., Ping, P., Zhao, X., Chu, G., Sun, J., and Chen, C., “Thermal runaway caused fire and explosion of lithium ion battery”, Journal of Power Sources, 208 (2012) 210-214.
37
Lithium-ion batteries have many advantages but the window of stability is relatively
small (both regarding temperature and voltage). The cells must therefore be
monitored and controlled by the BMS. Overheating may cause a severe malfunc-
tion; if the temperature exceeds typically 120-150 °C, exothermal reactions within
the cell can start. The exothermal reactions will increase the temperature further,
which can trigger additional exothermal reactions. If the overall cell reaction cre-
ates a rapid temperature increase, it could result in a so called thermal runaway. A
thermal runaway consists usually of one or a combination of the following events:
rapid gas release, electrolyte leakage, fire, rapid disassembling/explosion.
The reason for the initial overheating may be an external short-circuit, overcharge,
over-discharge, deformation of the battery by external forces, external heating or
an internal short-circuit. The latter may be caused by dendrite growth, unwanted
particles in the cell etc. If the overheating spreads to adjacent cells a large part of
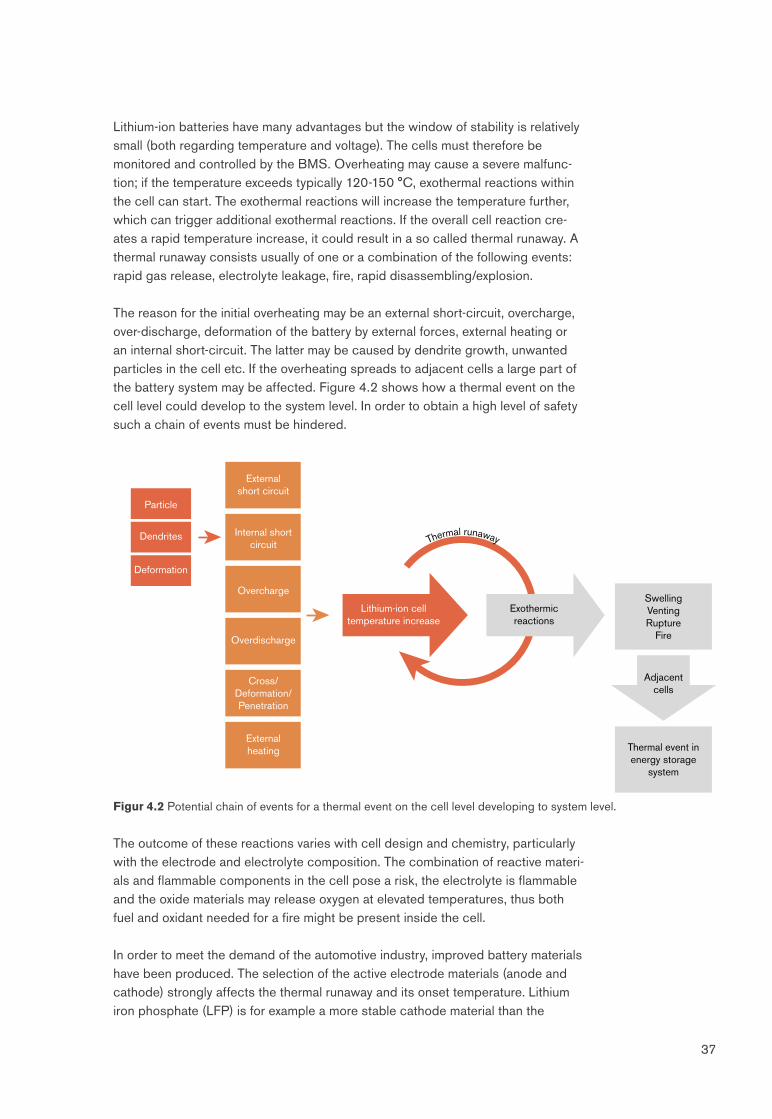
the battery system may be affected. Figure 4.2 shows how a thermal event on the
cell level could develop to the system level. In order to obtain a high level of safety
such a chain of events must be hindered.
Thermal runaway
SwellingVentingRupture
Fire
Thermal event in energy storage
system
Adjacentcells
External short circuit
Overdischarge
Overcharge
Externalheating
Cross/ Deformation/ Penetration
Internal short circuit
Particle
Dendrites
Deformation
Lithium-ion cell temperature increase
Exothermicreactions
Figur 4.2 Potential chain of events for a thermal event on the cell level developing to system level.
The outcome of these reactions varies with cell design and chemistry, particularly
with the electrode and electrolyte composition. The combination of reactive materi-
als and flammable components in the cell pose a risk, the electrolyte is flammable
and the oxide materials may release oxygen at elevated temperatures, thus both
fuel and oxidant needed for a fire might be present inside the cell.
In order to meet the demand of the automotive industry, improved battery materials
have been produced. The selection of the active electrode materials (anode and
cathode) strongly affects the thermal runaway and its onset temperature. Lithium
iron phosphate (LFP) is for example a more stable cathode material than the

38
cobalt-based lithium oxides that are commonly used in consumer Li-ion batteries.
Other electrode materials, for example mixed oxides with cobalt in combination
with other metals (e.g. Ni, Mn, Al), have been developed in order to improve safety
and other aspects (e.g. life time, cost, energy and power densities).2
The electrolyte composition and its additives, e.g. flame retardants, redox shuttles
and gas release controllers, are also very important for the overall safety of the
battery. The organic solvents involved, e.g. ethylene carbonate (EC) and dimethyl
carbonate (DMC) are volatile and flammable. The mechanical packaging, cylindri-
cal, soft or hard prismatic can or pouch-prismatic, also affects the cell behavior
during a thermal event. For example, a cylindrical can cell could build up a much
higher pressure than a pouch cell.
There are both pros and cons associated with each type of cell packaging. For
example, with a cylindrical cell it can be easier to control the venting direction but
higher internal cell pressure build up can be potentially more dangerous. Thus,
there are a number of safety mechanisms that can be included into a lithium-ion
cell construction by its manufacturer depending both on the chemistry and physi-
cal design of the battery.
It takes a long time to develop new battery technologies, typically more than
20 years. Potential future battery storage technologies is a very active field
of research and one of the most interesting future battery technologies is the
lithium-air battery, which has a huge potential compared to Li-ion batteries, e.g.
the energy density is projected to be more than 10 times that of Li-ion batteries.
There are, however, several challenges to be solved for the lithium-air technology,
e.g. regarding life time and safety. One safety concern is how to prevent air from
reaching the free lithium-metal. Li-air batteries are, however, not likely to be com-
mercialized within at least 20-30 years.3
VOLTAGES, CURRENTS AND ELECTRICAL HAZARDS
An electrified vehicle still contains electrical energy in the battery when it is shut-
down and parked. The manufacturer has constructed the vehicle in such a way
that the hazardous traction voltage is kept inside the battery pack and insulated
from the rest of the vehicle. In other words, all parts except the inside of the battery
system can be considered as voltage free (provided there are no electrical insula-
tion failures). It is important to understand that also an “empty” battery, meaning
fully discharged, 0% SOC, still has a considerable voltage. For an electric vehicle
this is still to be considered as a hazardous voltage. The definition of hazardous
voltage is that it is potentially dangerous for humans, and it is usually stated as >
60 VDC (although this limit varies in different countries).
Vehicles with internal combustion engines have had a remarkable increase in
vehicle safety during the last 10-20 years. Active safety is now starting to be
introduced in some cars, e.g. lane departure warnings. The passive safety, e.g.
2 Wang, Y., Jiang, J., Dahn, J., “The reactivity of delithiated Li(Ni1/3Co1/3Mn1/3)O2, Li(Ni0.8Co0.15Al0.05)O2 or LiCoO2 with non-aqueous electrolyte”, Electrochemistry Communications, 9 (2007) 2534-2540.
3 G. Girishkumar, B. McCloskey, AC Luntz, S. Swanson, W. Wilcke “Lithium- air battery: Promise and challenges” Journal of Physical Chemistry Letters 2010, Vol. 1(14), p. 2193–2203.

39
crash protection, has evolved greatly over the years with e.g. the NCAP testing.
Computer simulations and crash tests have fostered the development of crash
deformation structures significantly and increased crash and collision protection.
Electrified vehicles are likely to have the same level of passive and active safety
as conventional vehicles. In order to ensure this, the safety techniques must be
adapted for this new technology, e.g. during a crash, crash detection sensors
inside the vehicle, also used for activation of airbags, can disconnect the traction
voltage from the battery before the crash is complete. This means, that even if
the electrical insulation of the traction voltage, containing the hazardous voltage,
would be damaged, this voltage will be turned off. Of course, in severe crashes,
there is always a risk that this might not be the case.
Presently (2013), car manufacturers crash protect the battery pack so that no
short-circuit may occur in its electronics and that no lithium-ion cell can be
deformed during pre-defined crash scenarios. In principle, this is done by putting
the battery inside a crash protected box. This adds weight, volume and costs. In
the future, it is likely that the battery pack instead becomes a part of the crash
structure. Battery packs of today can handle some small deformation; this is a
matter of design, which today varies depending on cell chemistry, cell design
and packaging. In the future, it is likely to have safer lithium-ion cells and battery
systems which could to a higher level stand a deformation. In that case the battery
can to a larger extent by used in the vehicle’s crash structure. The deformation pro-
tection design criteria are given by load-cases. This means that for a severe crash,
which is outside the design criteria, a deformation which is larger than expected
can occur. It is unrealistic and just not possible to design the crash protection for
all types of extreme collisions.
The electrical drive train is made safe by several means. In general the battery cells
presently used are in general very safe since judicious choice of Li-ion technology
ensures that an unsafe lithium-ion cell would not be chosen. The voltage of each
lithium-ion cell is in general monitored and balanced with respect to the other
cells. This requires quite advanced electronics and electro-components such as
fuses and contactors are used in the battery pack. The electronic parts (electrical
components, processors, circuit-boards etc.) of the battery pack are similar to the
parts used in conventional vehicles by a large part of the industry. In case of errors
in the electronics or sensor failures an unsafe situation could occur. However, the
manufacturers work with functional safety (e.g. ISO26262) in order to minimize
these risks.
The battery safety is ensured by the manufacturer by adding layer by layer of
safety, schematically shown in Figure 4.3. Deformation of the battery cell can
result in a thermal event. Therefore the battery is usually placed outside the defor-
mation zone. For a passenger car, this generally results in a battery placement
inside or beneath the passenger compartment.

40
Mechanical integrity and crash deformation protection
Monitoring and controll (BMS)
Battery voltage disconnect (contactors)
Short-circuit protection (fuse)
Cell design & packaging
Cell chemistry
Figur 4.3 An example of battery safety layer by layer.
The components and traction voltage cables carrying a high voltage are usually
very well insulated and protected. The risk that a human, e.g. driver, passenger,
rescue personnel or firefighter, would be exposed to an electrical shock is in
general very low. The traction battery has a so called floating ground, meaning
that there is no electrical connection between the traction battery poles and the
vehicle chassis ground. The 12V/24V vehicle battery on the other hand (for both
conventional ICE vehicles and EVs) uses the vehicle chassis ground as the current
return path to the negative 12V/24V pole. The principle of the floating ground and
the current path of the traction battery are shown in Figure 4.4.
Cells in series
PositiveContactor
Traction battery pack
Vehicle chassis ground
Electrified vehicle
Fuse
NegativeContactor
BatteryMinus
BatteryPlus
Tra
cti
on
Vo
lta
ge
Figur 4.4 Traction battery pack current path and the floating ground principle. If there are no insulation fault(s), there
are no electrical connections between vehicle chassis ground and the battery poles.
Both DC (direct current) and AC (alternating current) voltages are present in EVs
(see also Chapter 3). The DC voltage comes from the traction battery and the AC
voltage is used by the power electronics and electric motor. Both pose a danger
for humans in case of an electric shock caused by either a direct touch of the bat-
tery poles, or indirectly by touching the metal chassis. In order for such exposure

41
to occur, two insulation faults are required (one at each pole of the battery) and
the victim must touch metallic parts with the different potentials at the same time.
Figure 4.5 shows the principle of a double insulation fault.
Cells in series
PositiveContactor
Traction battery pack
Vehicle chassis ground
Electrified vehicle
Fuse
NegativeContactor
BatteryMinus
BatteryPlus
Tra
cti
on
Vo
ltag
eIsolation fault at negative pole, a corresponding resistance Rneg
Isolation fault at positive pole, a corresponding resistance Rpos
Figur 4.5 Principle figure that shows a double insulation fault. This means one insulation fault at the plus and one
at the minus pole. They are shown as two resistances, Rpos and Rneg, connected to ground. This creates a current
path between battery plus and battery minus.
The vehicle chassis ground is usually constructed to electrically act as one pole
of the 12/24 V system by having most metal parts connected to each other. In
the situation of a double insulation fault there will be a short-circuit through the
chassis. Since the current takes the easiest path (i.e., the conducting path with the
lowest resistance), the human body will hardly be affected by touching the chassis
ground. On the other hand, there could be a potential risk for service personnel
repairing a damaged electric vehicle, since they can, during disassembly, have
two chassis ground, one with the negative battery potential (minus) and the other
with positive battery potential (plus). There are however, protection means for this,
e.g. insulation measurements, electrically insulated gloves (typically marked for
safe use up to 1000V), and knowledgeable maintenance staff should be able to
minimize this risk.
It could be mentioned that hazardous voltages, both DC and AC, inside the com-
ponents in an EV, sometimes are referred to as “high voltage”. From the automak-
ers perspective, this term conveniently separates the 12/24V system (“low volt-
age”) and the 300-600 V system (“high voltage”) for the electric drivetrain and the
traction battery, However, to name the hazardous traction voltage as “high voltage”
is somewhat misleading since there is already a definition and a long time tradition
to use the term “high voltage” within the mains (electricity grid), for voltages over
1000 VAC or over 1500 VDC. The term “HV” is actually in automotive industry
sometimes interpreted as “hazardous voltage” (instead of “high voltage”).

42
FIRES, GASES AND EMISSIONS
The energy stored in the battery in an electric vehicle is essentially released once
you connect the two poles while the energy in a conventional vehicle requires the
fuel to be mixed with air at the right proportion and pressure and then the gas
mixture needs to be ignited by a spark or by exposure to high temperatures; the
spark could for example be created by the starter engine. The higher voltages and
currents used in an electric vehicle may be a risk for fires and lithium-ion batteries
pose a special risk as the electrolyte is combustible, with properties similar to
gasoline or LPG. Furthermore, the battery might progress into thermal runaway as
described previously. One of the safety mechanisms used in these cells to prevent
a more severe incident to occur is venting. The gases released in a venting situ-
ation are, however, highly toxic and flammable. In particular, a venting cell would
release hydrogen fluoride (HF) which is highly toxic. Venting would also release
many other fluorinated substances that have a potential of being toxic, but the
toxicity of these has not yet been publically investigated.
If a fire starts, many of these substances might be consumed in the fire but the
knowledge in this field is still limited and more research is needed regarding
evolved gases from battery fires. HF is a gas that evolves in many different types of
fires. Recently INERIS in France set two different electric vehicles and two similar
conventional ICE vehicles on fire and measured the heat release rate during the
fire and also gases evolved including HF. They found that the heat release rate was
of the same order of magnitude, independent of vehicle type. High concentrations
of HF were emitted in the beginning of the fire for all four vehicles. This might have
been caused by the air-conditioning system. Some HF also evolved later in the
fire for EVs, but the concentration was less than that of the first spike of HF and
distributed over a longer time period.4
Anecdotal evidence exists that electric vehicles burn fiercely and that the fire is dif-
ficult to extinguish. The INERIS experiment does not confirm this burning behavior
but the fire was started by a gas burner in one of the seats in these experiments.
Other means of starting the fire might give another result but there are at present a
very limited number of investigations, if any, available on this topic.
Extinguishment of a fire is an area where there still are questions to be answered.
The advice from manufacturers is often to let the vehicle burn or to use water or
sand. Letting the vehicle burn is not a viable option in e.g. a garage, a ferry or in
a tunnel. Research for fire-fighters has until now mainly focused on extrication
of people from crashed cars and not on extinguishment. In general, water is an
excellent extinguishing medium that has a very high extinguishing power per mass.
However, when it comes to potential live electric parts the advice is often to avoid
using water. Research is therefore needed on how to attack a fire in a battery.
Would it be safe to use water both in terms of the risk of electric shock and when
it comes to gases evolved? Should other methods be used to respond to a fire?
In addition a fire in the battery system might be difficult to reach. It is only just
recently that a first extinguishing study was available. This study was conducted by
4 A. Lecocq, M. Bertana, B. Truchot and G. Marlair “Comparison of the Fire Consequences of an Electric Vehicle and an Internal Combustion Engine Vehicle” Proceedings of FIVE 2012, Chicago, 27-28 September 2012

43
DEKRA in Germany where batteries were extinguished using water and different
additives.5 They conclude that more water was needed for the EV fires than for
vehicles with conventional internal combustion engines.
The EV users would like to be able to charge their vehicle fast in some situations,
similar to filling fuel into a conventional vehicle, or at least have a significantly
shorter charging time than that of overnight charging. Systems for fast charging
are therefore under development. Fast charging requires high currents and one
would therefore intuitively associate this with larger fire risks. The high current
would result in a higher risk of overheating or other malfunctions in the charging
station or in the vehicle itself and thus careful design is important. These risks are
well known and when the number of fast charging stations will grow actions will be
taken to minimize associated risks.
INCIDENTS
Despite the manufacturers efforts to produce safe batteries some events have
occurred that have reached media attention. One of the major media events in
June 2011 was the fire that started in a GM Chevrolet Volt car three weeks after a
crash test. The incident was thoroughly investigated by NHTSA and the chain of
events was reproduced. The reason was found to be that the cooling media had
leaked over the battery and then dried; leaving crystals that finally short-circuited
the battery through the metallic belt around it. Changes have since been made to
the design, e.g. to avoid leakage of cooling media.
Another event that has drawn some media attention is the fires that occurred after
hurricane Sandy hit the Atlantic coast in the New York area in November 2012.
At the harbor of Newark, New Jersey, thousands of parked vehicles were flooded.
The cars were brand new shipped in from abroad. The water wave that followed
Sandy immersed the parked vehicles in 1.5-2.5 meters of seawater during several
hours. It has been reported that sixteen Fisker Karma PHEVs and a few Toyota
Prius HEV and PHEV burned. Unconfirmed statements from Fisker and Toyota
blame the fires on short-circuits in the 12V vehicle electronics. NHTSA and Fisker
have started an investigation to find the cause of the fires. To be submersed in
1.5-2.5 meter deep seawater for several hours is a very severe test for an electrical
system in general which can only be met with IP68 class or equal water-tightness
level. Seawater is a good electrical conductor and can cause short-circuits, for
both low voltage (e.g. 12/24V vehicle voltage) systems and for the traction voltage
in electrified vehicles.
Apart from these events there are some other events that have not reached media
interest. Focus on battery safety has to a large extent been on the cells as such
and much progress has been made in this respect. The traction voltage parts of
the system are also subject to many protection steps in many cases. It is impor-
tant, however, to take into account that the cells are part of a large system with a
lot of electronics that needs to be functioning in a harsh environment as vehicles
are subject to many different situations.
5 Electric car batteries ‘at least as safe as combustion cars’ (2012)

44
OUTLOOKS FOR THE FUTURE
Safety issues are of major concern in any introduction of a new product into the
market as negative publicity might have a negative impact of general public’s
perception of a product and the products potential to succeed. Key aspects here
are to design safe products and be very open about events that have occurred as
ample correct information is the best way to avoid rumors. One threat to a safe
introduction could be home-converted vehicles as these, with their limited budget,
would have difficulties reaching the same high safety levels as commercially built
vehicles.
Lithium-ion batteries for automotive use have shown an increased safety regard-
ing fire and explosion through e.g. improved electrode and electrolyte materials.
Therefore, the focus of lithium-ion safety research has moved increasingly towards
the safety aspects associated with released gases and smoke, as well as other
electrical aspects.
The choice of material for future batteries is a fundamental issue including possi-
ble scarcity problems. Further, the choice of different additives to obtain sufficient
safety, e.g. flame retardants, or other necessary battery characteristics can result
in life-cycle issues which will be untenable. New technologies are necessary which
will no doubt pose new risks which will need to be addressed.
The number of EVs on the road is still low so reliable statistical studies of incidents
and accidents are not possible yet, anyhow, the numbers are increasing steadily
and with that also the possibility to conduct different safety studies as the price
per vehicle is lowered and the vehicles are commercially available and not only
leased etc. It is therefore likely that we will see an increasing number of studies on
different safety aspects that still need to be resolved which will foster the develop-
ment of safer EVs.

Paper II

Second International Conference on Fires in Vehicles, September 27-28, 2012, Chicago, USA
303
Energy storage system safety in electrified vehicles
Fredrik Larsson1,2 and Bengt-Erik Mellander2 1SP Technical Research Institute of Sweden AB, Borås, Sweden
2Applied Physics, Chalmers University of Technology, Göteborg, Sweden ABSTRACT The environmental challenges with CO2 emissions and a diminishing oil reserve drive the need of a broad introduction of electrified vehicles. The relatively new lithium-ion battery technology offers batteries with increased energy and power densities. Li-ion technology requires a monitoring system since its safety window is lower than many other battery technologies. In an energy storage system for electrified vehicles safety aspects thus have to be taken into serious consideration. In this paper fire as a consequence of malfunction or abuse of the energy storage system is discussed. KEYWORDS: energy storage system, electrified vehicle, lithium-ion, battery, safety, thermal runaway, fire INTRODUCTION An electrified vehicle has a traction system which can be either pure electric or a combination of electric and some other source (e.g. fossil fuel). New battery technologies, e.g. lithium-ion, makes it possible to build electric vehicles (EV) and plug-in hybrid vehicles (PHEV) with acceptable driving range with zero emissions. The Li-ion cells offer high energy and power densities and are constructed with advanced materials. There are however, still aspects to consider for these new technologies and electrified vehicles. A drawback is that the window of stability is relatively small (both regarding temperature and voltage region) and the lithium-ion cell materials are volatile and flammable. Safety is thus an important issue due to the combination of the reactive nature of the cell materials and the presence of hazardous voltages in the vehicle. LITHIUM-ION BASICS AND THERMAL EVENTS Lithium-ion cell technologies have been used for more than 10 years in consumer products, such as laptop computers and mobile phones. During the years, there have been fire incidents with these batteries. The last 5 years, reports have been made regarding battery fire incidents in e.g. laptops, iPods, cargo planes and electric vehicles [1]. Lithium-ion cells consists of different layers, essentially; anode, separator, cathode and electrolyte. The electrolyte consists of organic solvents, lithium salt and additives. The electrolyte recipe is every cell manufacturer’s secret, especially regarding the additives. The organic solvents, e.g. ethylene carbonate (EC) and dimethyl carbonate (DMC) are flammable. Lithium is a reactive metal while the lithium-ion is more stable. Lithium metal can however be formed during normal and abusive use. Under abuse or malfunction conditions, the lithium-ion cell temperature can increase. If the temperature reaches typically 120-150 C, exothermic reactions within the cell starts. The exothermic reactions will further increase the temperature, which could start additional exothermal reactions. If the overall cell reaction creates a rapid temperature increase, it could result in a so called thermal runaway, which could consist of one of or a combination of the following; rapid gas release, electrolyte leakage, fire, rapid disassembling/explosion. Figure 1 shows an overview of the potential chain of events for a thermal runaway. On the left side in the figure, the sources of a cell temperature increase are shown. Furthermore, one cell could affect the

Second International Conference on Fires in Vehicles, September 27-28, 2012, Chicago, USA
304
adjacent cells. In a worst-case scenario the thermal events from one of several cells could spread and affect the complete energy storage system.
Figure 1. Potential chain of events for a thermal event on the cell level developing to system level. LI-ION FOR AUTOMOTIVE USE The conditions and requirements put on lithium-ion batteries in automotive applications are different from those in consumer electronics. Basically, Li-ion batteries for consumer products do not meet the needs of the automotive industry. The safety aspects, which are discussed in this paper, are just one on many aspects which must be considered in a different perspective. In order to meet the demand of the automotive industry, new lithium-ion battery materials have been developed. Lithium iron phosphate (LFP) is a more stable cathode material than the mainly cobalt-based lithium oxides that are commonly used in consumer Li-ion batteries. Researchers has also developed other electrode materials, for example mixed cobalt with other materials (e.g. Ni, Mn, Al) in order to improve safety and other aspects (e.g. life time, energy and power densities) [2]. The cell design, both chemical and mechanical, affects safety. The cell manufacturer can influence the electrolyte composition and its additives [3], e.g. flame retardants, redox shuttles and gas release controller. The selection of the active electrode materials (anode and cathode) also affects the thermal runaway and its onset temperature. The mechanical packaging, e.g. cylindrical, soft or hard prismatic can or pouch prismatic, also affects the cell behavior during a thermal event. For example, a cylindrical cell could build up a much higher pressure than a pouch cell. There can be both positive and negative aspects on each cell packaging. For example, with a cylindrical cell it can be easier to control the venting direction. There are thus a number of safety mechanisms that can be included into a lithium-ion cell construction, by its manufacturer [4]. Lithium-ion batteries for automotive use have shown an increased safety regarding fire and explosion. Therefore, the focus of the lithium-ion safety have drawn more and more towards the safety aspects of released gases and smoke, as well as other electrical aspects, e.g. electromagnetic compatibility (EMC). EXPERIMENTAL In order to experimentally study thermal runaways in lithium-ion cells three cells of size 18650 were thermally abused in a thermostated oven. Two of the cells were standard laptop batteries from Samsung and Sanyo with unknown cathode composition, most likely cobalt mixed oxides. The third

Second International Conference on Fires in Vehicles, September 27-28, 2012, Chicago, USA
305
18650 cell was manufactured by K2 Energy and had a lithium iron phosphate (LFP) cathode. The cell was fastened on a brick and centrally placed inside the oven. The oven was equipped with a fan system to circulate the air to achieve a uniform temperature. The cells were tested one at a time with continuous heating from ambient temperature up to the onset of thermal runaway or to max 300 C, without any ramping or stops. Prior to the test, the cells were fully charged to 100% SOC according to each manufacturer’s charging instructions. Each cell was equipped with four thermocouples, placed uniformly with two sensors on the top and two sensors on the bottom of the cell. Figure 2 shows the average cell surface temperature for the three tested cell types.
Figure 2. Temperature development for three 18650 lithium-ion cells during thermal abuse tests. All cells vented and got into thermal runaway. The cells from Samsung and Sanyo with the cobalt mixed oxide showed a very rapid temperature increase at the onset of thermal runaway. The LFP based cell from K2 Energy also entered thermal runaway but with a more modest temperature increase. Both Samsung and Sanyo cells started to burn during the thermal runaway while the K2 Energy cell did not burn. Table 1 shows basic cell data and extracted thermal runaway results where the rise time is the time between the onset and peak temperature of the runaway. The temperature rise is the difference between onset and peak temperatures of the runaway and the temperature rise rate is the ratio between temperature rise and rise time. As seen from the results the cell with the LFP cathode demonstrates a more safety performance than the laptop cells with a lower temperature rise rate and no fire. Table 1. Basic data for tested cells and extracted results from the thermal runaway.
0 1000 2000 3000 4000 50000
100
200
300
400
500
600
700
800
Time / sec
Ave
rage
cel
l sur
face
tem
pera
ture
/ de
gC
SamsungSanyoK2 Energy
Cell type
Cell data Thermal runaway results Nom
voltage (V)
Nom capacity
(Ah)
Onset temperature
( C)
Temperature rise ( C)
Rise time (sec)
Temperature rise rate ( C/sec)
Samsung ICR18650-24F 3.6 2.4 227 503 20 25.2
Sanyo UR18650F 3.7 2.2 198 477 26 18.3
K2 Energy LFP18650E 3.2 1.25 213 91 157 0.6

Second International Conference on Fires in Vehicles, September 27-28, 2012, Chicago, USA
306
LITHIUM-ION BATTERY FIRE DEVELOPMENT When discussing fire in an energy storage system, two main fire types should be considered. The first type is the reaction within the lithium-ion cell material itself, that is, reactions between electrolyte and electrodes. The special properties in this case are; an accelerated process due to exothermic reactions and self-supply of oxygen due to oxygen released by the reactions itself. Therefore, this fire is difficult to control and extinguish. In theory, the thermal runaway reactions could be stopped by cooling the cell below the onset temperature of the reaction. In practice, as seen in Figure 2, the temperature development is so rapid that simultaneous cooling is difficult to achieve after the onset of the thermal runaway, a more viable option is to make sure that the onset temperature is not reached. The second type is a more traditional fire, that is, a fire which requires oxygen from its surroundings. It could be fires in e.g. plastics, cables and housing inside the energy storage system as well as in parts of the cell. Free electrolyte from cells or fire in plastic insulation and separator on a cell-level may be part of this type of fire. Furthermore, a fire of the first type, involving a thermal runaway inside a cell could start a fire of the second type, and vice versa. The design of the energy storage system is important in order to make it possible to stop or retard additional cells from going into thermal runaway. As always with batteries, adding additional safety is a compromise that adds negative consequences, e.g. adds weight, volume and costs to the system. However, the access of fire fighting media to be applied on the cell surfaces inside an energy storage system is usually very limited due to the packaging design of energy storage systems and electrified vehicles. A lithium-ion cell which undergoes thermal runaway or other severe conditions (e.g. overtemperature) will react with swelling and could release gases, smoke and particles. The gases released during cell venting are flammable and could thereby be ignited by a spark in the vicinity. Regarding the electrified vehicle and the integration on the energy storage systems as well as the hazardous voltage systems in the vehicle, the design for crash safety is vital. THE OVERALL SAFETY OF THE ENERGY STORAGE SYSTEM The overall safety of a complete electric vehicle and energy storage system will not only be a function of the cell safety but also of many other parameters on the system level. The battery management system (BMS) is very important in order to e.g. monitor and prohibit critical situations, alerting the driver in case of a thermal event, activate potential available counter-actions and controlling the shut-down procedure of the system, which should be constructed under consideration of the complete safety of the electrified vehicle. The cooling system and the mechanical housing and structures are other important parameters. The positioning of the cells within the battery pack is also essential, and should e.g. consider cell venting properties. In order to obtain a safe system, all components and its properties must be considered. One of the key design parameters to understand when designing an energy storage system for electrified vehicles are the mechanisms for spreading of gases, smoke, fire and heat from components (e.g. battery cells) to battery system and to the complete electrified vehicle. ACKNOWLEDGEMENTS The authors would like to thank the support from Swedish Energy Agency and the FFI-program. REFERENCES 1. Wang, Q., Ping, P., Zhao, X., Chu, G., Sun, J., and Chen, C., "Thermal runaway caused fire and explosion of lithium ion battery", Journal of Power Sources, 208 (2012) 210-214. 2. Marom, R., Amalraj, S.F., Leifer, N., Jacob, D. and Aurbach, D., "A review of advanced and practical lithium battery materials", Journal of Materials Chemistry, 2011, 21, 9938. 3. Zhang, S.S. "A review on electrolyte additives for lithium-ion batteries", Journal of Power Sources, 162 (2006) 1379–1394. 4. Balakrishnan, P.G., Ramesh, R., Prem Kumar, T.P., "Safety mechanisms in lithium-ion batteries", Journal of Power Sources, 155 (2006) 401-414.

Paper III

Journal of The Electrochemical Society, 161 (10) A1611-A1617 (2014) A16110013-4651/2014/161(10)/A1611/7/$31.00 © The Electrochemical Society
Abuse by External Heating, Overcharge and Short Circuitingof Commercial Lithium-Ion Battery CellsFredrik Larssona,b,z and Bengt-Erik Mellandera
aDepartment of Applied Physics, Chalmers University of Technology, Goteborg SE-412 96, SwedenbSP Technical Research Institute of Sweden, Boras SE-501 15, Sweden
Lithium-ion batteries offer great energy and power densities but the thermal stability is an issue of concern compared to otherbattery technologies. In this study different types of abuse testing have been performed in order to compare the battery safety fordifferent types of commercial lithium-ion battery cells. The results show large differences in abuse response for different cells.Exposed to external heating laptop cells with cobalt based cathode developed a thermal runaway resulting in pressure release, fireand temperatures over 700◦C. Lithium iron phosphate (LFP) is known to be a very thermally stable cathode material and LFP-cellsshowed a significantly lower thermal response, a thermal runaway could, however, be detected for some of the cells in the externalheating test. The overcharge tests of LFP-cells were in most cases uneventful but in one case the test resulted in a violent fire. Theshort circuit tests showed modest temperature increases of the cells in spite of high currents peaking at around 1000 A. Although thedevelopment of safer lithium-ion battery cells has been successful thermal runaway events may still occur under extreme conditions.© 2014 The Electrochemical Society. [DOI: 10.1149/2.0311410jes] All rights reserved.
Manuscript submitted April 28, 2014; revised manuscript received June 4, 2014. Published July 11, 2014.
The high energy and power density of lithium-ion batteries havemade them the preferred type of battery for battery electric vehiclesas well as for plug-in hybrid electric vehicles. Lithium-ion batterieshave many advantages but the reactive, volatile and flammable mate-rials present in the battery are a concern and may be a threat to safety.Lithium-ion batteries are produced in large quantities, mainly for smallconsumer products such as cellular telephones and other portable elec-tronic devices. Using them in electric vehicles poses another situationsince the large size of the battery as well as the environmental condi-tions that the battery is exposed to in terms of temperature, vibrationsetc have an influence on the safety. In addition, requirements such aslong life time and the possibility for a fast recharge of the battery callsfor other demands on the cells. All these aspects have an effect onthe safety of the vehicle, including the safety for people inside andoutside the vehicle, for service personnel involved in maintenance andof rescue personnel in case of an accident.
Lithium-ion batteries have a limited window of stability regardingtemperature and voltage. Overheating may start exothermal reactionsthat release even more heat which in turn can lead to an acceleratedprocess called a thermal runaway. A thermal runaway can be dev-astating if it spreads to a complete battery system, releasing largeamounts of energy. Such a process could start due to overcharge,overdischarge, mechanical deformation, external heating or an exter-nal or internal short circuit, see Figure 1. The heat generated by anyof these events may start exothermal reactions in the battery that inturn could lead to cell venting, fire or explosion.
These risks are well known1–8 and are not only associated with theheat and high temperatures that may develop, the emission of harmfulor poisonous gases also pose a danger that has been emphasized inliterature,9,10 but also other gases which can be flammable may beemitted.11–13 The reactions during overheating are typically due to thedecomposition of the solid electrolyte interphase (SEI) layer, anodeand cathode as well as electrolyte decomposition and combustion.5,14
These reactions are exothermal. In addition to this separator melt-ing, an endotherm event, may occur. Oxygen may be released at thepositive electrode during decomposition; this oxygen can provide theoxidant for the combustion of the electrolyte. Large efforts have beenspent on improving the safety of Li-ion cells, e.g. by replacing thecobalt based electrode by lithium iron phosphate15 which is morethermally stable and has long life time and high power density butlower energy density.16 Another common practice for commercialcells is to use a number of additives to the electrolytes to improvesafety, e.g. including fire retarders.17–20
Incidents involving lithium-ion batteries have been reported insmall as well as large battery systems, see for example Wang et al.21
zE-mail: [email protected]
and Mikolajczak et al.22 Abuse tests of batteries are therefore of primeimportance in order to evaluate and improve the level of safety forthese types of battery systems. In this article results from abuse testsof commercial Li-ion batteries of different type, chemistry and sizeare presented to illustrate the problems that may arise under abnormaloperating conditions.
Experimental
Four types of commercial cells were tested; a Samsung 18650-cell,i.e. a cylindrical cell 18 mm in diameter and 65 mm long, typicallyused in laptops; two EiG cells of pouch-type with lithium iron phos-phate (LiFePO4) cathode, and a carbon-based anode (a newer andan older cell design); a European Batteries cell of pouch-type withlithium iron phosphate cathode and graphite anode. A summary ofthe cell specifications is provided in Table I. The EiG cells were op-timized for power application while the European Batteries cell aswell as the laptop cell was optimized for energy applications. All cellswere fully charged, 100% State of Charge (SOC), according to themanufacturer’s instructions.
Three types of abuse tests were performed; external heating, over-charge and short circuit tests. All measurements were performed ina similar but not identical condition as described in international teststandards for batteries such as FreedomCAR23 or SAE J2464.24 Cellsof different sizes, packaging, chemistries and manufacturers weretested. Most tests were repeated in order to account for the variationsbetween individual cells. The tests presented in this paper are a selec-tion of representative examples of these tests. For the Samsung 18650cell only results from external heating tests are presented since over-charge and short circuit tests would not be of interest due the built-incell protection mechanisms in the cell.
External heating test.— In the external heating test, the cells wereheated to excessive temperatures in order to examine their thermalstability. This test is sometimes referred to as thermal ramp test. Thetested cell was placed inside a thermostatically controlled oven, BinderFED 115. The oven has a microprocessor control and a PT 100 temper-ature sensor for internal regulation of oven temperature. The oven’sinternal fan was set on full speed in order to circulate the oven airto obtain a uniform temperature around the tested lithium-ion cell.The cells were placed on one or two bricks in the center of the ovenand tested one at a time, see Figure 2. For the pouch cells the oventemperature was first set to 80◦C and thereafter increased in steps of10◦C every 15 min until either any thermal runaway had occurred orto the maximum temperature of the oven (300◦C). For the 18650 cellthe oven was set to the maximum temperature (300◦C) with continu-ous maximum heating. Both heading procedures were relatively slow.
) unless CC License in place (see abstract). ecsdl.org/site/terms_use address. Redistribution subject to ECS terms of use (see 129.16.69.49Downloaded on 2014-07-12 to IP

A1612 Journal of The Electrochemical Society, 161 (10) A1611-A1617 (2014)
SwellingVentingRupture
Fire
Externalshort circuitInternal
short circuit
Overcharge
Externalheating
Cross/Deformation/Penetration
Overdischarge
Particle
Dendrites
Deformation
Lithium-ion celltemperature increase
Exothermicreactions
Adjacentcells
Thermal event inbattery system
Thermalrunaway
Figure 1. Lithium-ion thermal runaway overview from cell event to potential system event.
Table I. Basic data of tested cells.
Cell type Cell packaging Nominal voltage (V) Nominal capacity (Ah)
Samsung ICR18650–24F Cylindrical 3.6 2.4EiG ePLB-F007H In article referred as “older design” Pouch 3.2 7EiG ePLB-F007A In article referred as “newer design” Pouch 3.2 7European Batteries EBattery 45 Ah v1.4 Pouch 3.2 45
With the continuous heating method it took around 90 min for theoven to reach 200◦C.
The cell voltage and the cell surface temperature were measuredwith a sample rate of 1 Hz with a data logger, Pico Technology ADC-24. There were up to five type K thermocouples evenly distributedon both sides of the cell’s surface and one additional thermocouplemeasuring the oven temperature.
Overcharge test.— In the overcharge test, the lithium-ion cellswere abused by being charged beyond their limits. The charger waslimited to the preset maximum current of each experiment and up tomax 15.3 V. The 7 Ah EiG cell was charged with 70 A (correspondingto 10 C-rate) considering that the cell is optimized for power applica-
Figure 2. Photo of oven set up, showing a cylindrical 18650 cell fastened ontoa brick with steel wire.
tions while the 45 Ah European Batteries cell was overcharged with90 A (corresponding to 2 C-rate) due to its optimization for energyapplications. The cell surface temperature was measured with fivetype K thermocouples; one of the sensors was directly attached tothe cell surface while four were so called plate-thermometers, thatis a thermocouple attached to a 10 × 10 cm metal plate. The plate-thermometers were distributed around the cell, one directly under thecell, the others placed with an air gap from the cell. The current wasmeasured using a current shunt (accuracy 0.5%). Cell voltage, currentand temperature were measured with a sample rate of 1 Hz with a datalogger, Pico Technology ADC-24.
Short-circuit test.— EiG and European Batteries cells were shortcircuited using 50 mm2 copper cables and a high current contactor,Telemecanique LC1F630, with a low internal resistance of 40 μ�.The short circuit current was measured by a current core, Hitec 6000ETopacc 1.0, which can measure currents up to 6000 A. The cell sur-face temperature was measured with eighteen type K thermocouplesequally distributed on both sides of the cell surface. The cell voltage,current and temperature were measured at 1 Hz using two data log-gers, Pico Technology ADC-24 and Fluke Hydra Series II, as well asby a Tektronix TDS 3034 oscilloscope.
Results
External heating test.— Figure 3 shows the results of an externalheating test on the 18650 cell. At 220◦C, a very rapid temperatureincrease occurs when the cell catches fire and a pressure wave is ob-served. The maximum average temperature at the cell surface reaches743◦C which is higher than the melting temperature of aluminum,660◦C. The maximum cell surface temperature measured by a sin-gle sensor was 775◦C, the temperature of the cell interior was thusprobably even higher. Based on the average surface temperature in-crease, the corresponding energy released from the thermal runaway
) unless CC License in place (see abstract). ecsdl.org/site/terms_use address. Redistribution subject to ECS terms of use (see 129.16.69.49Downloaded on 2014-07-12 to IP

Journal of The Electrochemical Society, 161 (10) A1611-A1617 (2014) A1613
0 20 40 60 800
200
400
600
800
Tem
pera
ture
[°C
]
Time [min]
Cell temperature Oven temperature
0
1
2
3
4
Cell voltage
Cel
l vol
tage
[V]
Figure 3. Temperature and cell voltage development during external heatingof a Samsung 18650 cell.
can be roughly estimated since the cell is likely to be under adiabaticconditions during the short duration of the thermal runaway, approxi-mately 20 seconds. The specific heat capacity of a complete cell variesbetween cylindrical and pouch cell packaging and is also dependenton size, energy/power optimization etc. In the estimations we use anapproximate value of 700 J/kg◦C based on published values for dif-ferent cell types.5,25–29 Using the measured temperature increase of523◦C the energy released can be estimated to 15.6 kJ (4.33 Wh). Thecalculated released energy is thus about half of that of the electricalenergy available in the cell, 8.64 Wh. It may also be noted that justprior to the runaway, burning electrolyte is squirting out of the cellseen in Figure 4, which releases energy which is not included in theabove value for the energy release calculation. Figure 5 shows thederivative of the average cell surface temperature; the figure showsthat the thermal runaway temperature is 220◦C and that the rate oftemperature increase is very high, initially close to 5000◦C/min.
Cells with lithium iron phosphate (LFP) cathode have an enhancedthermal safety compared to cells with cobalt oxide based cathode.Figure 6 shows the results for two LFP-cells during external heating.The old cell design shows a clear but relatively small thermal runawayevent while the new cell design shows no obvious signs of thermal run-away. Actually, a minor exothermic event, hardly visible in Figure 6,can be detected in the same temperature region as the thermal run-away in the old cell design also for the new cell design. The chemicaland/or physical changes in the cell design are not known or studied inthis report. Complementary experiments where the temperature wascontinuously increased also resulted in a similar behavior as that inFigure 6. The time to reach the thermal runaway temperature wasapproximately 90 minutes for the test using continuous heating andapproximately 200 minutes for the test using temperature-ramping.
Figure 4. Samsung 18650 cell at the beginning of thermal runaway releasingignited material.
219,5 220,0 220,5
0
1000
2000
3000
4000
5000
Tem
pera
ture
rat
e [°
C/m
in]
Oven temperature [°C]
Figure 5. The rate of the cell surface temperature for the Samsung 18650 cellin the temperature region of the thermal runaway peak.
0 50 100 150 200 2500
50
100
150
200
250
Tem
pera
ture
[°C
]
Time [min]
Older design Newer design Oven
Figure 6. Temperature development during external heating of EiG newer andolder cell design.
Figure 7 shows the results of the European Batteries cell duringexternal heating. A moderate thermal runaway is detected also for thisLFP-cell, with temperatures reaching well above 300◦C. The runawaytemperature was 183◦C within ± 1◦C for these cells, this value is closeto the value observed for the older design EiG cell, 189◦C. The run-away temperature was thus somewhat lower than for the laptop-typecell. The energy released at the detected thermal runaway estimatedusing the same method and specific heat capacity value as for theSamsung cell above is also much smaller than for the laptop cell.While the ratio of energy released to the electric energy stored in thefully charged battery is of the order of 50% for the laptop battery it is
0 50 100 150 200 250 3000
100
200
300
400
Tem
pera
ture
[°C
]
Time [min]
Cell Oven
Figure 7. Temperature development during external heating of European Bat-teries cell.
) unless CC License in place (see abstract). ecsdl.org/site/terms_use address. Redistribution subject to ECS terms of use (see 129.16.69.49Downloaded on 2014-07-12 to IP

A1614 Journal of The Electrochemical Society, 161 (10) A1611-A1617 (2014)
0 5 10 15-10
0
10
20
30
40
50
60
70
80
Temp
Cur
ren
[A],
Vol
tage
[V],
Tem
pera
ture
[°C
]
Time [min]
Current Voltage
90
100
110
120
130
140
SOC
SO
C [%
]
Figure 8. Overcharge of EiG cell of newer design.
between 10 and 30% for the LFP-type cells that showed a thermal run-away. The rates of temperature increase at the thermal runaway for theLFP-cells were 500◦C/min for European Battery cell and 60◦C/minfor EiG older design while the rate was not detectable for EiG newerdesign. The 18650 cell lost 30% of its weight in the external heatingtests while the LFP cells lost between 16–26%, the EiG new designhad the lowest weight loss of 16%.
Overcharge test.— Figure 8 shows the result from an overchargetest of the EiG cell of newer design. The cell surface temperaturereached a moderate temperature of 70◦C. An almost negligible weightloss was measured, probably due to minor venting of electrolyte.The overcharge test for one of the European Batteries cells is shownin Figure 9. After approximately 5 minutes of charging at a stateof charge level of 115%, the cell suddenly caught fire, as seen inFigure 10. The temperature reached 855◦C for a sensor placed in thecenter of the top surface of the cell. During the fire, the top layer ofthe cell was blown away so the cell temperature presented in Figure9 may include the temperature of the flames and does not reflect thecell temperature after this event.
The overcharge test on the European Batteries cells was repeatedthree more times without any occurrence of fire and Figure 11 showsthe results of one of the repeated tests. The surface temperature reacheda maximum of 79◦C, a value comparable to that of the EiG cell. Itmay be noted that all overcharged cells were swollen with a thicknessincrease after the test ranging from 350 to 850% of the initial thickness.
Short-circuit test.— The results from short circuit tests for EiGcells of both newer and older design are shown in Figure 12. Therewere no significant differences between the two types of cells. Be-
0 5 10 15
0
20
40
60
80
100
120
140
SOC Current Voltage
Cur
rent
[A],
Vol
tage
[V],
SO
C [%
]
Time [min]
0
200
400
600
800
Temp
Tem
pera
ture
[°C
]
Figure 9. Overcharge of a European Batteries cell resulted in fire, in this casethe charger was manually stopped at 9.5 min due to the fire.
Figure 10. Overcharge of a European Batteries cell resulted in fire.
0 5 10 15
0
20
40
60
80
100
Cur
rent
[A],
Vol
tage
[V],
Tem
pera
ture
[°C
]
Time [min]
Current Voltage Temp
90
100
110
120
SOC
SO
C [%
]
Figure 11. Overcharge of a European Batteries cell that did not result in afire.
tween 20 and 30 seconds after the start of the short circuit the cellswelled up quickly. The following 2 minutes the cell vented (withno visual smoke) and swelling decreased considerably. The follow-ing 5 minutes the cell contracted further to a thickness close to thatof the untested cell. The peak current reached almost 900 A whichcorresponds to a discharge rate of 128C. The maximum cell surface
-10 0 10 20 30 40 50 6020
40
60
80
100
120
Temperature
Tem
pera
ture
[°C
], S
OC
[%]
Time [sec]
SOC
Swelling Venting
0
200
400
600
800
1000
Current Cur
rent
[A]
0
1
2
3
4
Voltage
Vol
tage
[V]
Figure 12. Short circuit of EiG cell of newer design (dashed lines) and EiGof older design (solid lines).
) unless CC License in place (see abstract). ecsdl.org/site/terms_use address. Redistribution subject to ECS terms of use (see 129.16.69.49Downloaded on 2014-07-12 to IP

Journal of The Electrochemical Society, 161 (10) A1611-A1617 (2014) A1615
Figure 13. Short circuit of European Batteries cell, photo (left) showing the flame and smoke from the burnt off positive terminal tab, the photo (right) after thetest shows the burnt off tab.
temperature was about 100◦C and both types of cells were dischargedto about 43% SOC.
In the short circuit test of the European Batteries cell the positivetab of the cell burnt off, which stopped the short circuit current, seeFigure 13. The current just before this event was 1084 A and due tothe very short time for the short circuit the cell temperature and SOCchanged very little, less than 6◦C and 4% respectively.
Discussion
When the Samsung 18650 laptop cell was exposed to external heat,the open circuit voltage remained stable until about 135◦C, measuredon the cell surface, as seen in Figure 3, then it falls abruptly. The melt-ing points of typical shutdown separator materials, polyethylene andpolypropylene, are about 130 and 165◦C, the measured values are thusreasonably close to these values, where the final voltage drop occurs atabout 158◦C. The difference may be due to a delay in the temperaturemeasurement due to the slow heat transfer in the interior of the cell.The runaway temperature, 220◦C, and the temperature increase duringthe thermal runaway, 532◦C, is in the same order as reported in ourprevious study.30 The rate of temperature increase in the initial phaseof the thermal runaway is extremely high, close to 5000◦C/min. Jhu etal.28 found for a similar cell a peak value of about 37000◦C/min with amore sensitive technique, and in another study by Jhu et al.29 temperaterates beyond 70000◦C/min were found. The state of charge can havea strong influence on the cell behavior during abuse situations andthe influence may vary with different types of abuse. Jhu et al.28,29 andDoughty et al.17 showed that lower SOC gives lower energy releaseduring external heating.
A comparison of the results of the external heating tests for the18650 laptop cell (Figure 3) and the LFP-cells (Figure 6 and Figure 7)shows that the behavior is much less dramatic for the LFP-cells. Twoof the three LFP-cells still go into thermal runaway but the energyreleased is much less than that from a cell with cobalt-based cathode.This is well-known from other studies2,13,20,31–36 and attributed to thestability of the olivine structure of LiFePO4. The electrode influenceon the thermal stability of a LFP-cell is therefore dominated by theanode material. Swelling and venting occurred for all pouch-type cellswhile the laptop cell vented with a rapid release of gas, accompaniedby a pressure wave and immediately followed by fire.
The runaway temperature for the LFP-cells was lower than forthe laptop cell, 189◦C for the EiG older design and 183◦C for theEuropean Batteries cell. The thermal runway in the external heatingtest for the new design of EiG is significantly reduced compared tothat of the older design. It may be noted that the EiG cell is designed
to target electrified vehicles in the automotive sector and is currentlyin use there. The rates of temperate increase at runaway differ con-siderably for the different cells; 5000◦C/min for the Samsung laptopcell, 500◦C/min for European Battery cell and 60◦C/min for EiG olderdesign. This highlights the large differences for Li-ion cells and par-ticularly underlines the importance of thermal stability.
Cell venting is an important safety factor to protect a Li-ion batteryfrom reaching too high pressure, especially in the case of cylindrical orhard prismatic cell packaging. In fact, cell manufacturers may includeso called shutdown additives in the electrolyte in order to activatecell venting at a pre-designed stage by gas generation from poly-merizing of the additive molecules, before the cell reaches extremeconditions.20 Upon heating of a cell, ventilation is also unavoidablesince the electrolyte typically consists of a Li-salt dissolved in volatileorganic solvents. Even in cases when fire or explosion does not oc-cur, emitted flammable and toxic gas can be a serious problem asmentioned in the introduction.
Abuse by overcharging and external heating adds energy to thesystem due to the input of electric power or heat, while in a short cir-cuit test no energy is added to the cell. Therefore, the overcharge andexternal heating test can theoretically be seen as a more severe abusedue to the addition of external energy to the cell. In the overchargetests presented the additional charged energy is between 20–30% interms of battery capacity. The energy released in the external heatingtests presented in this paper is calculated based on the change of thecell surface temperature and are of the order of 50% or less of the elec-trical energy within the cell. Those values do not represent the total en-ergy release and neither the possible maximum energy release duringthe most severe abuse situations when the cell materials are allowed tofully combust. During the external heating, part of the electrolyte, andparticularly low boiling components (e.g. dimethyl carbonate), canevaporate due to venting and cell opening. However, some electrolyteis still present since thermal runaway does occur. For example, for the18650 cell, electrolyte is squirting out of the cell prior to the thermalrunaway as seen in Figure 4, releasing energy which is not included inthe calculations. Besides, several other parameters also affect the re-sults e.g. abuse test methods, cell chemistry, capacity size, cell designand cell venting characteristics. Values typically found in the liter-ature show a released energy of 2–3 times the electrical energy.1,38
The results presented in this article are lower presumably due tothe reasons discussed above. However, the energy release, 15.6 kJ,of the thermal runaway for the 18650 cell in the external heating testcan be compared to 19.2 kJ measured for a similar 18650 cell.28
10 C-rate overcharge tests of the EiG newer design did not re-sult in a thermal runaway and the peak surface temperature reached
) unless CC License in place (see abstract). ecsdl.org/site/terms_use address. Redistribution subject to ECS terms of use (see 129.16.69.49Downloaded on 2014-07-12 to IP

A1616 Journal of The Electrochemical Society, 161 (10) A1611-A1617 (2014)
a moderate 79◦C. A similar result was obtained for one of the Euro-pean Batteries cells, seen in Figure 11. However, one of the EuropeanBatteries cells that was overcharged ignited with a resulting fire. Thisbehavior was not reproduced in three other tests. Excluding the ignitedcell, no thermal runaway could be detected even though all cells wereheavily affected by large swelling and venting. Hund and Ingersoll38
studied 1 C-rate overcharge of LiFeBatt 10 Ah LFP cells which re-sulted in a significantly higher temperature of 160◦C but no fire orsparks. He et al.39 used 2 Ah LFP cells and found a temperature peakof 90◦C without fire during 1 C-rate overcharging. The incident of thefire in our test is interesting but we can only speculate on the reason.It could be a bad cell due to errors in the manufacturing process orinduced by some small variety in the test setup. An event like this inthe field could be referred to as a field failure, but field failures rarelyhappens on cell-level, the probability is typically less than 1 ppm.21,22
For an overcharge situation to occur in a battery system a failure ofthe Battery Management System (BMS) is required allowing the cellto be charged above it limits. Secondly, as we have seen above, thecell itself does not necessarily go into thermal runaway because itis overcharged. Studies have, however, shown that LFP-cells have asmaller margin with respect to the amount of overcharged capacitycompared to other common Li-chemistries, although the exothermalresponse for LFP is significantly lower.2
The tested large-sized LFP pouch automotive cells have low inter-nal resistance, enabling high short circuit currents known from otherstudies.40 The short circuit current of the EiG cells was close to 900 A,corresponding to a 128 C-rate. These cells are power optimized andcapable of delivering 20–30 C-rate in normal use. The short circuitcurrent for the six times larger capacity European Batteries cell isclose to 1100 A, i.e. a 24 C-rate. The European Batteries cell is en-ergy optimized and made to deliver up to 4 C-rate in normal use. Thecell voltage seen in Figure 12 drops quickly due to the short circuit,but does not reach 0 V instantly even if it is a hard short circuit withlow connection resistance. The current curve in Figure 12 quicklyrises and then falls to about half the value and then increases again.This behavior could be explained by the fact that the extreme currentcannot be sustained due to limitations of the transport process of thelithium ion in the cell resulting in a current drop, while the cell isquickly heated due to the ohmic losses. The increased temperaturefinally enables a higher transportation of lithium ions resulting in anincreased current. The time frame for these phases is less than 30 sec-onds as seen in Figure 12. No thermal runaway is observed, howeverthe cell temperature increases fast during a short period of time.
The short circuit test of the European Batteries cell resulted in thatthe positive terminal tab burnt off as seen in Figure 13 which stoppedthe short circuit. In one perspective this can potentially be seen aspositive for the safety since the tab functioned as a “fuse” that stoppedthe short circuit at an early stage. However the flame can be a potentialsource of ignition of e.g. vented and flammable battery gases or othereasily ignitable materials inside a battery system.
Lithium-ion cells can be equipped with a variety of reversibleand irreversible safety mechanisms.41 The 18650 cells typically haveprotection for short circuit, by the use of for example CID (currentinterrupture device) and PTC (positive temperature coefficient), thelatter causing the cell resistance to increase rapidly at increased tem-perature reducing the current going through the cell. Many of thesesafety mechanisms were developed specifically for the Li-ion con-sumer battery. The use of Li-ion batteries in other applications suchas within automotive give rise to more and different demands on thesafety as well as other aspects, e.g. cost, life time, energy and powerdensity. The environmental conditions in automotive applications aredifferent to those in consumer products; vibrations, extreme temper-atures and varying humidity can be challenging. The risks involvedin case of electric vehicle crash deformations must also be taken intoconsideration. In the automotive industry large capacity cells are re-quired and typically hundreds of these are connected in series. Safetymechanisms within the cell used in commercial Li-ion battery systemsdo not always give the same protection in e.g. automotive applications.A first example is the shutdown separator which can give an increased
safety for some cell abuse situations. However, the use of shutdownseparators in a large battery pack with higher voltage due to hundredsof cells connected in series might not give the same safety due toe.g. voltage breakdown of the separator.42,43 A second example is thePTC which has a relative low voltage tolerance in cell-strings, po-tentially as low as 30 V, which can result in spontaneous ignition incase of overvoltage.44 Besides the safety concern the PTC also addparasitic resistance in a large battery pack. A third example is theCID which cannot offer the same safety in case of higher voltagesystems.44
The battery module design as well as the rate of energy release andthe total energy release from a thermal runaway in one cell determinesif neighboring cells are effected or not. From a safety perspective itis essential to minimize the probability for a thermal event to occurbut also to minimize the consequences of such an event and preventdamage to neighboring cells, avoiding the potential propagation of athermal runaway from cell to system-level as shown in Figure 1.
Conclusions
The abuse tests conducted on various types of Li-ion cells givevaluable information regarding diverse aspects of the cell safety. Risksassociated with thermal runaway situations; fire, smoke and gas emis-sions are especially important for the use of Li-ion batteries in au-tomotive applications. The external heating test of the 18650 laptopcell resulted in a rapid thermal runaway accompanied with a pressurewave and immediate fire. In large battery packs using multiple cellsin series and/or parallel the effect of a propagation scenario in thusa concern. Safer chemistries like the LFP-cells are in general signif-icantly less energetic. Nevertheless our results show that LFP-cellscan still go into a thermal runaway event even though the tested LFPcells showed various results. During external heating up to 300◦C aLFP-cell with a newer design did not show any substantial thermalrunaway while older design LFP cells showed a moderate thermalrunaway. Overcharge of the newer designed LFP-cell did not result inthermal runaway either. However, overcharge of another LFP pouchcell did result in a fire, even if that event could not be reproduced inthis study.
The energy released during a thermal runaway based on the resultsreported above for a 18650 cobalt-based cell can be used to estimatehow much energy may be released in a thermal runaway of a 300 kgbattery system for an electric vehicle. The answer is perhaps somewhatsurprising, the calculation shows that the energy released could be inthe order of 70 MJ, corresponding to the combustion of about 2 litersof gasoline. However, our estimate is low, as described above, andusing the highest value reported earlier one can expect a value up tosix times that calculated here. This is still considering the battery typethat has the largest energy release while other more safe chemistries,e.g. LFP will have lower values. The presented results thus showthat although the safety aspects of Li-ion batteries are still a concern,the safety is improving with safer chemical components and designimprovements.
Acknowledgments
The authors thank the Swedish Energy Agency and the FFI-program for its support.
References
1. G. G. Eshetu, S. Grugeon, S. Laurelle, S. Boyanov, A. Lecocq, J.-P. Bertrand, andG. Marlair, Phys. Chem. Chem. Phys., 15, 9145 (2013).
2. D. Doughty and E. P. Roth, The Electrochem. Soc. Interface: summer 2012, 37(2012).
3. E. P. Roth and C. J. Orendorff, The Electrochem. Soc. Interface: summer 2012, 45(2012).
4. D. Lisbona and T. Snee, Process Safety and Environmental Protection, 89, 434 (2011).5. R. Spotnitz and J. Franklin, J. of Power Sources, 113, 81 (2003).6. P. Biensan, B. Simon, J. P. Peres, A. de Guibert, M. Broussely, J. M. Bodet, and
F. Perton, J. of Power Sources, 81–82, 906 (1999).
) unless CC License in place (see abstract). ecsdl.org/site/terms_use address. Redistribution subject to ECS terms of use (see 129.16.69.49Downloaded on 2014-07-12 to IP

Journal of The Electrochemical Society, 161 (10) A1611-A1617 (2014) A1617
7. F. Larsson, P. Andersson and B.-E. Mellander, “Are electric vehicles safer thancombustion engine vehicles?”, Chapter 4 in Systems perspectives on Electromobility,edited by B. Sanden, Chalmers University of Technology, Goteborg, Sweden, ISBN978-91-980973-1-3, p. 31 (2013).
8. Z. J. Zhang, P. Ramadass, and W. Fang, “Safety of lithium-ion batteries”, Chapter 18in Lithium-Ion Batteries: Advances and Applications, edited by G. Pistoia, Elsevier,Amsterdam, The Netherlands, p. 409 (2014).
9. A. Hammami, N. Raymond, and M. Armand, Nature, 424, 635 (2003).10. H. Yang, G. V. Zhuang, and P. N. Ross Jr, J. of Power Sources, 161, 573 (2006).11. T. Ohsaki, T. Kishi, T. Kuboki, N. Takami, N. Shimura, Y. Sato, M. Sekino, and
A. Satoh, J. of Power Sources, 146, 97 (2005).12. D. P. Abraham, E. P. Roth, R. Kostecki, K. McCarthy, S. MacLaren, and
D. H. Doughty, J. of Power Sources, 161, 648 (2006).13. E. P. Roth, ECS Trans., 11(19), 19 (2008).14. C. Arbizzani, G. Gabrielli, and M. Mastragostino, J. of Power Sources, 196, 4801
(2011).15. A. K. Padhi, K. S. Nanjundaswarmy, and J. B. Goodenough, J. Electrochem. Soc.,
144, 1188 (1997).16. K. Zaghib, A. Guerfi, P. Hovington, A. Vijh, M. Trudeau, A. Mauger,
J. B. Goodenough, and C. M. Julien, J. of Power Sources, 232, 357 (2013).17. D. H. Doughty, E. P. Roth, C. C. Craft, G. Nagasubramanian, G. Henriksen, and
K. Amine, J. of Power Sources, 146, 116 (2005).18. S. S. Zhang, J. of Power Sources, 162, 1379 (2006).19. G. Nagasubramanian and K. Fenton, Electrochimica Acta, 101, 3 (2013).20. K. Zaghib, J. Dube, A. Dallaire, K. Galoustov, A. Guerfi, M. Ramanathan,
A. Benmayza, J. Prakash, A. Mauger, and C. M Julien, “Lithium-ion cell compo-nents and their effect on high-power battery safety”, Chapter 19 in Lithium-IonBatteries: Advances and Applications, edited by G. Pistoia, Elsevier, Amsterdam,The Netherlands, p. 437 (2014).
21. Q. Wang, P. Ping, X. Zhao, G. Chu, J. Sun, and C. Chen, J. of Power Sources, 208,210 (2012).
22. C. Mikolajczak, M. Kahn, K. White, and R. T. Long, “Lithium-ion batteries hazardand use assessment”, Fire Protection Research Foundation, Quincy, MA, USA, Docno 1100034.000 A0F0 0711 CM01 (2011).
23. D. H. Doughty and C. C. Crafts, “FreedomCAR electrical energy storage systemabuse test manual for electric and hybrid electric vehicle applications”, Sandia reportSAND2005-3123, Sandia National Laboratories, USA (2006).
24. D. Doughty, “SAE J2464 Electric and hybrid electric vehicle rechargeable energystorage system (RESS) safety and abuse testing procedure”, SAE Technical Paper2010-01-1077, (2010).
25. L. Fan, J. M. Khodadadi, and A. A. Pesaran, J. of Power Sources, 238, 301(2013).
26. J. Yi, U. S. Kim, C. B. Shin, T. Han, and S. Park, J. of the Electrochem. Soc., 160(3),A437 (2013).
27. W. Wu, X. Xiao, and X. Huang, Electrochimica Acta 83, 227 (2012).28. C.-Y. Jhu, Y.-W. Wang, C.-Y. Wen, C.-C. Chiang, and C.-M. Shu, J. Therm. Anal.
Calorim., 106, 159 (2011).29. C.-Y. Jhu, Y.-W. Wang, C.-M. Shu, J.-C. Chang, and H.-C. Wu, J. of Hazardous
Materials, 192, 99 (2011).30. F. Larsson and B.-E. Mellander, Conference proceedings of Fires in vehicles (FIVE)
2012, edited by P. Andersson and B. Sundstrom, SP Technical Research Institute ofSweden, Sweden, p. 303 (2012).
31. M. Takahaski, S. Tobishima, K. Takei, and Y. Sakurai, Solid State Ionics, 148, 283(2002).
32. A. Yamada, S. C. Chung, and K. Hinokuma, J. of the Electrochem. Soc., 148(3), A224(2001).
33. H. Joachin, T. D. Kaun, K. Zaghib, and J. Prakash, J. of the Electrochem. Soc., 156(6),A401 (2009).
34. K. Zaghib, J. Dube, A. Dallaire, K. Galoustov, A. Guerfi, M. Ramanathan,A. Benmayza, J. Prakash, A. Mauger, and C. M. Julien, J. of Power Sources, 219, 36(2012).
35. G. Chen and T. J. Richardson, J. of the Electrochem. Soc., 156(9), A756(2009).
36. G. Chen and T. J. Richardson, J. of Power Sources, 195, 1221 (2010).37. E. P. Roth, “Lithium ion cell and battery safety”, Tutorials E in Conference pro-
ceedings in Advanced Automotive Battery Conference (AABC), AABC Europe 2011,Mainz, Germany (2011).
38. T. D. Hund and D. Ingersoll, “Selected test results from the LiFeBatt iron phosphateLi-ion battery”, Sandia report SAND2008–5583, Sandia National Laboratories, USA(2008).
39. Y.-B He, G.-W. Ling, Z.-Y. Tang, Q.-S. Song, Q.-H. Yang, W. Chen, W. Lv, Y.-J. Su,and Q. Xu, J. Solid State Electrochem., 14, 751 (2010).
40. F. V. Conte, P. Gollob, and H. Lacher, World Electric Vehicle J., 3, 1 (2009).41. P. G. Balakrishnan, R. Ramesh, and T. P. Kumar, J. of Power Sources, 155, 401
(2006).42. E. P. Roth, D. H. Doughty, and D. L. Pile, J. of Power Sources, 174, 579 (2007).43. C. J. Orendorff, The Electrochem. Soc. Interface: summer 2012, 61 (2012).44. J. Jeevarajan, “Safety of commercial lithium-ion cells and batteries”, Chapter 17 in
Lithium-Ion Batteries: Advances and Applications, edited by G. Pistoia, Elsevier,Amsterdam, The Netherlands, p. 387 (2014).
) unless CC License in place (see abstract). ecsdl.org/site/terms_use address. Redistribution subject to ECS terms of use (see 129.16.69.49Downloaded on 2014-07-12 to IP


Paper IV


Using FTIR to determine toxic gases in fires with Li-ion
batteries
Abstract
Batteries and in particular Li-ion batteries are seen as an alternative to fossil fuels in the automotive
sector. Li-ion has however some safety issues including possible emissions of toxic fluorine
containing compounds during fire and other situations. This paper demonstrates the possibilities to use
the Fourier Transfer Infrared Technique to access these gases. The study is conducted in the Cone
Calorimeter on different solvents used in Li-ion batteries. The measurements show that, apart from HF
with a known high toxicity, also POF3 is emitted. The toxicity of POF3 is not yet established but has
the potential of being very toxic.
Petra Anderssona,*
, Per Blomqvista, Anders Loren
a, Fredrik Larsson
a,b
aSP Technical Research Institute of Sweden, Brinellgatan 4, SE-501 15 Borås, Sweden
bDepartment of Applied Physics, Chalmers University of Technology, SE-412 96 Göteborg, Sweden
*Corresponding author: [email protected]
Introduction
Batteries are used in more and more applications and are seen as an important alternative to
fossil fuels as energy carrier in the automotive sector. Several types of batteries are used today
and more are developed over time. One of the most common types of batteries today is
lithium-ion (Li-ion) batteries due to their high energy and power densities. Li-ion batteries
have, however, some safety drawbacks with their organic based flammable electrolyte.
Compared to many other battery technologies, Li-ion batteries also have a smaller
temperature and voltage region of stability. Outside this region, Li-ion batteries can undergo a
thermal runaway resulting in gassing and fire, and potentially even explosion [1,2]. A thermal
runaway can be the result if a Li-ion cell is exposed to increased temperatures, i.e.
temperatures of 120-150 C [3]. Other types of abusive conditions, e.g. overcharge or
deformation can also result in venting of gasses and thermal runaway reactions.
The electrolyte of a Li-ion cell contains a lithium salt, organic solvents (e.g. ethylene
carbonate (EC), diethyl carbonate (DEC), dimethyl carbonate (DMC)) and a number of
additives. The far most used Li-salt today is hexafluorophosphate (LiPF6) due to its attractive
performance despite its moderate thermal stability and fluorine content. The fluorine content
can under abusive conditions emit fluorine containing compounds, e.g. hydrogen fluoride
(HF). Other gases that can pose a danger include the chemical species in the oxidation and
thermal breakdown of the initial LiPF6 salt solution. Most likely phosphorus pentafluoride
(PF5), phosphorous oxyfluoride (POF3) and HF are of greatest concern but also the fluorinated
phosphoric acids [4] can be of interest since they will give HF and phosphoric acid (H3PO4)
when completely reacted with water. Overheating in a Li-ion battery cell can also result in
formation of toxic fluoro-organic compounds [5]. The toxicity of all these gases is not fully
established. The Swedish Work Environment Authority has exposure limits for total fluorides,
HF and phosphoric acid but lacks data for the rest of the substances [6].
The NGVi for total fluorides are 2 mg/m
3 and HF has a TGV
ii of 2 ppm. NIOSH (National
Institute for Occupational Safety and Health, USA) states that HF has a IDLH (Immediately
Dangerous to Life and Health) value of 30 ppm. No exposure limits are given for PF5 and
POF3, however, their chlorine analogues, PCl5 and POCl3, have NGV values of 0.1 ppm. The
toxicity might, however, differ between the chlorine and fluorine species and there is no
general rule like “fluorine is always more toxic”. But, still, the limits are low and gases
evolved from battery fires are certainly of great concern to both the fire fighters, people close
to a Li-ion battery in e.g. electric vehicles or in the close vicinity of the fire. Other gases
emitted from electrolytes, especially under non-fire conditions include e.g. H2, CO, CH4,
C2H6 [7, 8, 9], this paper focuses however on the fluorinated species.
The HF formation in the decomposition of the LiPF6-based electrolytes under heated but non-
fire conditions is complex [10, 11, 12]. When heated in a dry and inert environment LiPF6
decomposes to lithiumfluoride (LiF) as solid and phosphorouspentafluoride (PF5) as gas [13]
LiPF6 → LiF + PF5 (1)
In contact with moisture/water PF5 reacts to form phosphorous oxyfluoride and hydrogen
fluoride [13]
PF5 + H2O → POF3 + 2HF (2)
LiPF6 is highly susceptible to hydrolysis by even trace amounts of moisture [14]. When
heated in moisture/water LiPF6 can directly form LiF, POF3 and HF [13].
LiPF6 + H2O → LiF + POF3 + 2HF (3)
PF5 also react with HF to form hexafluorophosphoric acid (HPF6) [15]:
PF5 + HF → HPF6 (4)
Phosphorous oxyfluoride (POF3) can react to form several fluorinated phosphoric acids,
monofluorophosphoric acid (H2PO3F), difluor-phosphoric acid (HPO2F2) hexafluorphosphoric
acid (HPF6), and phosphoric acid (H3PO4) [4]. The fluorinated phosphoric acids can react
with water and yield HF and form phosphoric acid as a final product [4]:
(5)
Of these gases it is HF, PF5 and POF3 that are of most interest due to their toxicity and
potential toxicity and in particular is it interesting to know if and to what extent these three
substances are emitted in fire situations. Further the possible effect of different burning
conditions and fuel composition on the amount of gases produced is of interest together with
if the addition of water, like in an extinguishing situation, would change the amounts
produced.
i ”Nivågränsvärde” Mean value threshold in a working environment
ii ”Takgränsvärde” Maximum allowed concentration in a working environment

There is only limited information available on PF5 and POF3 measurement methods. Possible
techniques for this were sought for in the literature and it was soon concluded that a possible
solution was to use the FTIR (Fourier Transform Infra-Red) technique as all three gases have
absorbance in the infrared spectra while no information was found on e.g. suitable florescence
wavelength for these species. There is only limited information available on determination of
PF5 and POF3 in gas phase. This study focused on FTIR methodology since it has the
advantage of detection of several substances simultaneously without interfering with the
chemical equilibria in the gas phase. Wet chemical methodologies followed by
chromatography and suitable detection were ruled out due to uncertain kinetics and equilibria.
Both PF5 and POF3 are reactive and few measurements have been performed on these gases in
the literature. Yang, Zhuang and Ross [13] report measurements of these gases conducted
using TGA (Thermal Gravimetry Analysis) and FTIR (Fourier Transform Infra-Red) on pure
LiPF6 salt and salt solved in EC, DMC, PC (polypropylene carbonate), and EMC (ethyl
methyl carbonate). Recently Eshetu et.al. [16] published a study on the different solvents used
in the electrolytes without the salt with a focus on Heat Release Rate (HRR) from the
different solvents and also toxicity of the combustion gases from the solvents. However as no
LiPF6-salt was included in these tests the toxicity was similar to most organic solvents. A
recent study by Ribiere et. al. [17] has been performed on pouch cells in the Fire Propagation
or Tewarson apparatus where FTIR was used to measure toxic gases including HF but other
fluorinated gases were not evaluated.
This paper presents experiments conducted in the cone calorimeter where HRR [18] was
measured together with gases emitted including HF, POF3 and PF5 in order to investigate
possible influence of the burning conditions, fuel composition and water addition on the
amounts of HF, POF3 and PF5 produced The measurements were conducted using the FTIR
technique and a first step in the study was to demonstrate the suitability of the FTIR technique
to be used for measurements of these substances in fire situations. To this end the FTIR
equipment was first calibrated for HF, POF3 and PF5. Then, tests were conducted on pure salt
and LiPF6 salt solved in different electrolyte solvents at various concentrations. The solvents
included in this study were Dimethyl carbonate (DMC) and Dimethoxyethane (DME) and
Polypropylene carbonate (PC). The solutions were introduced to a propane flame as a spray at
different flow rates or onto a metal plate in the flame in order to achieve different burning
conditions and fuel composition.
FTIR instrumentation and calibration
The measurement system used consisted of an FTIR spectrometer, a gas cell, sampling lines,
filters for removing particulates before the gas cell and a pump that continuously drew sample
gas through the cell. The system is specified in Table 1.

Table 1 Specification of the FTIR measurement system.
Instrumentation Specification
Spectrometer Thermo Scientific Antaris IGS analyzer (Nicolet)
Spectrometer parameters Resolution: 0.5 cm-1
Spectral range: 4800 cm-1
– 650 cm-1
Scans/spectrum: 10
Time/spectrum: 12 seconds
Detector: MCT
Gas cell Volume: 0.2 litres
Path length: 2.0 m
Temperature: 180°C
Cell pressure: 650 Torr
Primary filter M&C ceramic filter heated to 180 °C
Secondary filter M&C sintered steel filter heated to 180°C
Sampling tubing 4/6 mm diameter PTFE tubing heated to 180°C. The
length of the tubing was 1.5 m + 2.5 m
Pump Sampling flow: 3.5 l/min
The FTIR used had a calibration for a number of components when delivered from factory.
These components included e.g. CO2, CO and HF. It was seen that the factory calibration for
HF was not sufficiently accurate for the intended use of the instrument and the instrument was
recalibrated to include more spectral information and a wider concentration range i.e. include
the full spectral band of HF and a concentration range from 18 ppm to 1245 ppm. The
calibration of HF was made using a dynamic dilution system where a water solution of HF
was injected into a heated stream of nitrogen.
The quantification limit (LOQ) for HF with the recalibrated FTIR was determined to 2 ppm.
In addition was the FTIR calibrated for PF5 and POF3. Calibration gas mixtures were prepared
for this purpose by dilution of PF5 (99%, ABCR) and POF3 (99%, ABCR) in nitrogen
atmosphere using gasbags (Flexfoil, SKC). Extra effort was put into pre-conditioning the bags
so they were free of water adsorbed to the walls. This was necessary to be able to prepare the
highly reactive PF5 mixture.
Tests were conducted to record the spectral bands of POF3 as a basis for calibration of the
FTIR. An important part of the calibration work was further to investigate the stability of
POF3. The spectral range of interest of POF3 (116 ppm) is shown in Figure 1; several
distinctive absorption bands can be seen.

Figure 1 Spectral bands of POF3.
Three spectral bands are shown centred around the wavenumbers 871 cm-1
(P-F symmetrical
stretch), 991 cm-1
(P-F asymmetrical stretch) and 1416 cm-1
(P-O stretch). The two latter
vibrations are the strongest. The spectral information of POF3 is summarized in Table 2.
Table 2 Spectral band positions for POF3.
Band position
(cm-1
)
Absorptivity*
(abs/ppm.m)
Type of band [13]
1416 0.0014 P-O stretch
991 0.0014 P-F asymmetrical stretch
871 0.00025 P-F symmetrical stretch
* Calculated from a spectrum of 100 ppm POF3 (650 Torr, 180 °C).
A quantitative calibration was made for POF3 using flushed gas bags where known volumes
of POF3 gas were injected into a known volume of nitrogen gas. The concentrations produced
for the calibration were: 25 ppm, 100 ppm, 200 ppm, 300 ppm and 416 ppm. Spectral regions
around 871 cm-1
and 1416 cm-1
were used for a CLS (classical least squares) calibration and
water was included as an interfering component. The calibration was linear and a regression
yielded a 0.98 R2 fit. The quantification limit (LOQ) for POF3 was calculated to 6 ppm.
The stability of POF3 at both room temperature and at an elevated temperature was
investigated. It was important to have this information to know that the calibration mixtures
prepared in gas bags were stable and to see if any significant decomposition would take place
in the heated sampling and measurement system. The investigation showed that POF3 is very
stable at room temperature in a gas bag diluted with N2, which makes it possible to prepare
quantitative calibration standards. Figure 2 shows the spectra of ~200 ppm POF3 from two
different gas bags, stored for 8 and 33 minutes respectively at room temperature before
measurement. Any decomposition at room temperature could not be detected from this test.

The half-life for POF3 in N2 at 170 °Ciii was about 15 minutes according to the measurements
shown in Figure 3, which means that there is no significant self-decomposition taking place in
the measurement system during the ~10 s response time of the FTIR measurement set-up.
Figure 2 Spectra of ~200 ppm POF3 measured in two separate Flexfoil bags at 8 min
and 33 min after preparation.
Figure 3 Series of spectra of 41 ppm POF3 kept at 170°C in the FTIR gas cell for
different times (0, 8 and 31 minutes).
To prepare PF5 standard gas blends for calibration it was found that the gas bags used needed
to be dried by flushing with N2 in order to remove any remaining water as otherwise no
iii
The investigation of decomposition at an elevated temperature was made with a cell temperature of 170 °C
which was slightly lower compared to the standard cell temperature of 180 °C.

significant spectral bands apart from those of POF3 and HF could be seen. This is explained
by that the PF5 added to the bag was hydrolysed even by the small amounts of water that was
present in the bag, to form the decomposition products POF3 and HF. The bags were
subsequently thoroughly dried before adding PF5.
By using flushed bags it was possible to locate the spectral bands of PF5 [13]. The interesting
spectral range for PF5 of nominally 200 ppm PF5 in N2 is presented in Figure 4 with the
interesting bands of 1027, 1071, 956 and 946 cm-1
. As seen in Figure 4 bands from POF3
(1416, 991 and 871 cm-1
) are also seen despite careful flushing of the bag. PF5 has two
stretching modes according to Yang et al. [13]. These are most probably the bands at 1017
cm-1
and 946 cm-1
. The remaining two bands found, 1027 cm-1
and 956 cm-1
, must thus
originate from unidentified decomposition products of PF5. The bands are listed in Table 3.
Figure 4 Spectral bands of PF5 and decomposition products from 200 ppm PF5 in N2.
Decomposition occurred although the Flexfoil bag was flushed with dry N2
prior to standard preparation.
Table 3 Spectral band positions found from PF5 and decomposition products.
Band position (cm-1
) Type of band
1017 PF5: PF stretching [13]
946 PF5: PF stretching [13]
1027 Band from unknown decomposition product
956 Band from unknown decomposition product
1416 POF3: P-O stretch
991 POF3: P-F asymmetric stretch
871 POF3: P-F symmetric stretch
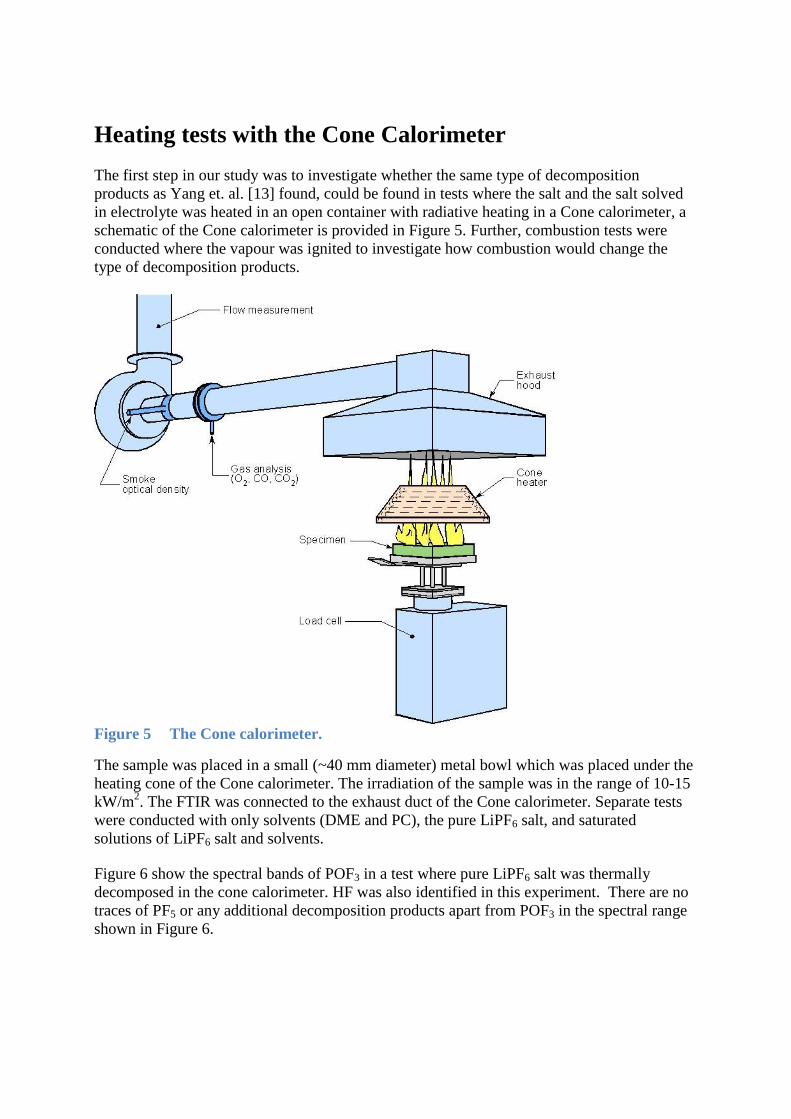
Heating tests with the Cone Calorimeter
The first step in our study was to investigate whether the same type of decomposition
products as Yang et. al. [13] found, could be found in tests where the salt and the salt solved
in electrolyte was heated in an open container with radiative heating in a Cone calorimeter, a
schematic of the Cone calorimeter is provided in Figure 5. Further, combustion tests were
conducted where the vapour was ignited to investigate how combustion would change the
type of decomposition products.
Figure 5 The Cone calorimeter.
The sample was placed in a small (~40 mm diameter) metal bowl which was placed under the
heating cone of the Cone calorimeter. The irradiation of the sample was in the range of 10-15
kW/m2. The FTIR was connected to the exhaust duct of the Cone calorimeter. Separate tests
were conducted with only solvents (DME and PC), the pure LiPF6 salt, and saturated
solutions of LiPF6 salt and solvents.
Figure 6 show the spectral bands of POF3 in a test where pure LiPF6 salt was thermally
decomposed in the cone calorimeter. HF was also identified in this experiment. There are no
traces of PF5 or any additional decomposition products apart from POF3 in the spectral range
shown in Figure 6.

Figure 6 Spectral bands of decomposition products from pure Lithium hexafluoride
(LiPF6) in an evaporation test with the Cone calorimeter.
A spectrum from an evaporation experiment with a saturated solution of LiPF6 salt in PC is
shown in Figure 7. Overlaid in this figure is a spectrum from an evaporation tests with pure
PC. The spectral band from the solvent is shown around 1100 cm-1
together with the three
bands of POF3 at 871 cm-1
, 991 cm-1
and 1416 cm-1
demonstrating the clear identification of
the different substances in the evaporation experiment.
Figure 7 Spectrum from evaporation test with LiPF6 mixed in Polypropylene
carbonate (PC) with overlaid spectrum from evaporation of pure PC.
Similarly Figure 8 shows a spectrum from an evaporation test with a saturated solution of
LiPF6 salt in DME together with an overlaid spectrum from an evaporation experiment with

pure DME. Also here the spectral band from the solvent is seen around 1100 cm-1
together
with the three bands of POF3 at 871 cm-1
, 991 cm-1
and 1416 cm-1
.
Figure 8 Spectrum from evaporation test with LiPF6 mixed in Dimethoxyethane
(DME) solid line overlaid by spectrum of DME only (dotted line).
Tests were also conducted where saturated solutions of LiPF6 salt in DME, were ignited by
the electric spark igniter in the Cone calorimeter. In these tests the same level of external
radiative heat flow was used as for the evaporation tests discussed above (10-15 kW/m2). A
series of spectra (overlaid) are shown in Figure 9 from the tests with LiPF6 salt in DME. One
can clearly see the characteristic spectral features of POF3 during the period of combustion (2-
95 s). Also HF was seen in the spectrum during this period (not shown in Figure 9). The
spectral band from the solvent is shown only in the first spectrum and in the spectrum from 67
s. The combustion efficiency must have decreased at this time but extinction was not recorded
until 95 s. Figure 10 shows the spectrum from 54 s with a spectrum of DME from an
evaporation test overlaid. Interesting is the two additional peaks, one at 1027 cm-1
and one at
1034 cm-1
, which do not originate from POF3 and most probably not from DME. The peak at
1027 cm-1
was also found in the calibration tests with PF5 where PF5 was partly decomposed
(see Figure 4).

Figure 9 Series of spectra from fire test with LiPF6 mixed in Dimethoxyethane (DME).
Spectra measured at 5 s, 42 s, 54 s and 67 s after start of heat exposure.
Ignition at 2 s after start. Flame-out at 95 s.
Figure 10 Spectra from the fire test with LiPF6 mixed in DME at 54 s from start of test.
Overlaid by spectra from evaporation test with DME (solid line).
Figure 11 shows a series of spectra (overlaid) from tests with LiPF6 salt in PC. The spectral
bands of POF3 (the band at 991 cm-1
can be clearly seen in the figure) were seen in the spectra
during the period of combustion (71-170 s). Also HF was seen as in the spectra during this
period (not shown). The spectral band from the solvent is clearly shown in the spectra before
ignition.

Figure 11 Series of spectra from fire test with LiPF6 mixed in Polypropylene carbonate
(PC). Spectra measured at 53 s (solid line, before combustion), 103 s (during
combustion), 116 s (during combustion) and 162 s (during combustion) after
start of heat exposure. Ignition at 71 s after start. Flame-out at 170 s.
Figure 12 Spectrum from the fire test with LiPF6 mixed in PC at 128 s from start of test
(dotted line). Overlaid by spectrum from evaporation test with PC (solid
line).
Figure 12 shows the spectrum collected at 128 s into the combustion test with LiPF6 salt in
PC. A spectrum of pure PC has been overlaid. Also here one can see the two additional peaks
which do not originate from POF3, one at 1027 cm-1
and one at 1034 cm-1
.

The combustion tests with electrolyte solvents of LiPF6 salt showed that HF and also POF3
are present in the combustion effluents, while PF5 is not present. Further, unidentified spectral
absorption bands indicate the presence of an additional, possibly fluorine containing,
decomposition product. The identification of the origin of the unidentified absorption peaks
would be important to fully understand the decomposition of LiPF6. The presence of POF3 is
an important finding as this emission can be important to includes in a toxicity evaluation of
the fire effluents.
Burner tests with electrolyte
An experimental set-up, with a simple diffusion propane burner with the possibility to
introduce solvent/salt solutions and water into the flame trough needles, was designed in order
to be able to vary the salt/solvent concentration and combustion conditions in the test flames.
This was done in order to investigate possible effects on toxic gas production from varying
combustion conditions and from water used as extinguishing media.
The needle solution was chosen in order to produce a spray into the propane flame to make
sure that the total amount of solvent/salt introduced was combusted. The propane burner was
a very simple one, about 2 cm in diameter and holes were drilled in the side about 0.5 cm
below the rim to introduce the needles, a picture of the burner is provided in Figure 13.
Figure 13 Picture of burner.
The amount of propane inserted was controlled by a variable area flow-meter. The amount of
electrolyte inserted was controlled by two HPLC pumps. In the cases where salt was included,
the solutions had been prepared before introduction into the HPLC pumps. Solutions of LiPF6
(99 %, Sigma-Aldrich) were prepared by dilution in dimethylcarbonate (DMC, 99% Sigma-
Aldrich) and 1,2-dimethoxy ethane (DME, 99% Sigma-Aldrich). The DMC solutions were
1.0 M and 0.4 M respectively and the DME solution was 0.4 M.
The HRR from the combustion was measured by using Oxygen Consumption Calorimetry on
the effluents quantitatively collected in the Cone calorimeter hood. FTIR measurements were
made in all tests. Tests were conducted with different propane/solvent ratio. Also the way the
solvent and salt were introduced into the flame was varied (either through the needle into the
flame or onto a metal plate in the flame) and the amount of salt was varied. A photo of the set-
up with the metal plate is available in Figure 14.

Figure 14 Photo of test where the electrolyte is introduced onto a metal plate in the
flame.
Some tests were conducted where water was introduced into the flame. The duration of these
tests was however, limited because despite careful design of needles that were custom made
for this study we encountered problems with creating a stable spray for long periods of time.
An example of test results using the spray into the flame is presented in Figure 15 and Figure
16 where 18 ml/min with 0.4 M salt solved in DME was introduced in the flame as a spray
during 2.5 minutes. A full set of test results is available in Andersson et al [19]. In Figure 15
the HRR is presented on the left hand axis together with the HF concentration in the smoke
duct on the right hand axis. The HRR curve includes the HRR from the propane flame also,
the timing for the introduction of the electrolyte spray is clearly seen as the HRR increases
sharply. In Figure 16 from the same test, HF concentration in the smoke duct is presented on
the left hand side and the POF3 concentration in the duct on the right hand side axis.
When studying the graphs it is important to remember that the concentrations presented are
concentrations in the exhaust duct. These depend on the gas flow in the exhaust duct and the
amount of salt and electrolyte introduced into the flame. They should not be considered as the
concentration in the vicinity of a burning Li-ion battery in an electrified vehicle but are only
presented here as concentrations in order to evaluate changes in amount produced due to
changes in flame composition etc.

Figure 15 HRR and HF concentration in a test where 18 ml/min with 0.4 M salt solved
in DME was introduced in the flame during 2.5 minutes.
Figure 16 HF and POF3 concentration as a function of time in a test where 18 ml/min
with 0.4 M salt solved in DME was introduced in the flame during 2.5
minutes.
Similar curves for a test where 18 ml/min of 1 M salt in DMC was introduced into the flame
as a spray during two minutes are shown in Figure 17 and Figure 18. As seen the results are
similar to the case with 0.4 M salt in DME as presented in Figure 15 and Figure 16, i.e. the
spray introduction is clearly seen as a sharp increase in the HRR and the HF and POF3
concentration increases with a slight delay. A difference is however seen in the HF/POF3
ratio.

Figure 17 HRR and HF concentration during a test where 18 ml/min of 1 M salt solved
in DMC was injected as a spray during two minutes.
Figure 18 HF and POF3 concentration as a function of time for a test where 18 ml/min
of 1 M salt solved in DMC was injected as a spray during two minutes.
The tests using the spray introduced into the burner all showed that the HRR was increased
immediately upon injection of the electrolyte while it seems that the HF and POF3
concentration increased somewhat delayed. This is caused by the 12 s integrating time of the
FTIR analysis equipment and could also be due to delays in the filter and sampling system
and to some extent to the delays in the pump system for introducing the salt and solvent.
An example of a result from a test where DMC and salt was introduced into the flame in a
much slower pace, i.e. 1.8 ml/min during 5 minutes is given in Figure 19. In this case the
electrolyte flow had to be inserted onto a metal plate in the flame as it was not possible to get
a spray at this low rate. As only a small amount of electrolyte was introduced into the flame
no change in HRR could be observed. Still both HF and POF3 were detected. The time delay

here is significant; this is due to the long transportation time through the pump system with
this small pump flow. Also the delay in HF concentration due to delay in the sampling system
is more pronounced here as the amount of HF produced is much lower due to the lower rate of
electrolyte introduction.
Figure 19 HF and POF3 measurements from a test where 1.8 ml/min of 1M salt solved
in DMC was introduced onto a metal plate in the flame.
The tests conducted are summarized in Table 4 together with the HF/POF3 ratio. As seen in
the table the FTIR measurements showed that both HF and POF3 were always present in the
combustion effluents when electrolytes were burning. The measured concentration of HF was
always significantly higher than the measured POF3 concentration.
Table 4 Tests conducted.
Test Type Flow
(ml/min)
Salt Propane
HRR
Electrolyte
HRR
HF/POF3
ratio
Test #
in [19]
A Needle 18 0.4 M in
DME
4 kW 6 kW 53 12
B Needle 18 1 M in
DMC
4 kW 4 kW 14 10
C Needle 18 1 M in
DMC
4 kW 4 kW 20 13
D Metal plate 1.8 1 M in
DMC
4 kW 8 15
E Needle 15 1 M in
DMC
5 kW 3 kW 23 22
F Needle 15 0.4 M in
DMC
3.2 kW 2.5 kW 20 23
G Needle 15 1 M in
DMC
5 kW 3.3 kW 12 25
H Needle,
water spray
15 1 M in
DMC
5 kW 3 kW 8 26
I Needle,
water spray
15 1 M in
DMC
5 kW 2 kW 16 26

Despite careful design of needles it was difficult to obtain a stable spray. The needles were
clogged in many cases and tests had to be interrupted. In some cases the measured HRR was
lower than anticipated indicating that the flow through the pump was lower than anticipated
or that not complete combustion of the electrolyte occurred due to that some electrolyte was
released as a beam rather than a spray. Table 4 gives some insights into the uncertainties
involved in these measurements e.g. by studying test B and C which repeats the same
conditions and results in a HF/POF3 ratio of 14 and 20 respectively. A similar variation is
seen between test E and G with a HF/POF3 ratio of 23 and 12 respectively.
Studying test B, E and G one sees that test E and G with a larger propane/electrolyte ratio
resulted in a HF/PO3 ratio of 23 and 12 respectively while the ratio was 14 for test B, i.e.
varying the propane/electrolyte ratio does not affect the HF/POF3 ratio.
The test E and G range of 12-23 covers to some extent the results from test H and I where
water was sprayed into the flame for some period during the test which resulted in a HF/POF3
ratio of 8 and 16 respectively. The results from test H are shown in Figure 20 where water
was sprayed into the propane/electrolyte flame during time 3 minutes until 3:45. As seen it
seems that the water injection causes the POF3 to increase. The same ratio is also kept initially
when the electrolyte injection was stopped and water was let trough the pump and needle in
order to clean the needle from time 5 minutes until 7 minutes. However looking into Figure
21 for test I no such effect can be observed and thus it is not possible to make any conclusions
concerning the water influence on the fluorinated species generated even if the ratio seems to
be on the lower side of the HF/POF3 ratio measured in the without water case. The reason for
the limited effect of the water spray can be the fact that the water sprayed into the flame was
limited compared to the amount of water already present due to the combustion products from
the propane and electrolyte as seen from the water vapour measurement from the FTIR
presented as a dotted line in Figure 20 and Figure 21.
Figure 20 HF and POF3 concentration for the electrolyte injection during time 2
minutes until 3 minutes 40 and water cleaning of the system during time 5

minutes until 7 minutes. Water was sprayed into the propane/electrolyte
flame from time 3 minutes until 3 minutes 40.
Figure 21 HF and POF3 concentration for the electrolyte injection during time 9
minutes until 10 minutes 30s. Water was sprayed from time 9 minutes 50
until 10 minutes 30.
A notable difference is however seen between Test A and the other tests. In Test A 0.4 Molar
DME was used while DMC was used in all other tests. The HF/POF3 ratio is 53 in Test A
while it differs between 8 and 23 for the other tests. The 53 ratio is especially interesting in
the light of Test F where the HF/POF3 ratio is 20 for a 0.4 Molar DMC solution. Eshetu et. al.
[16] indicate that the toxicity of the combustion gases depends on the solvents used when
studying unburned hydrocarbons, aldehydes and soot in oxygen lean conditions, i.e. linear
carbonate esters results in less toxic gases than cyclic carbonates. Both DMC and DME are
linear which gives thus no guidance in this matter, in addition did Eshetu et al [16] not study
fluorinated compounds but only the solvents without any salt. DME and DMC differs
however significantly when it comes to Heat of combustion where DME has a much higher
heat of combustion of almost 28 kJ/g compared to DMC of about 14.6 kJ/g. Also the
solubility of the salt differs significantly between DME and DMC.
All tests showed that the POF3 seems to appear a bit earlier than HF, this was especially
apparent in Test D where the electrolyte/salt solution was introduced onto a metal plate at a
low flow rate in the flame. It is known that losses of HF occur in the measurement system and
especially in the sampling filter [20]. The effect is most significant at measurements of low
concentrations as the proportion captured in the filter in such cases is high compared to the
total amount HF sampled through the filter. An effect of HF-losses in the filter is an initial
increased response time (until the sampling system is saturated) that can be significant
especially in measurements of low concentrations. Selected filters used in the measurements
were analysed for total fluorine content. The analysis results showed that the amounts lost in
the filter were low, normally around 5 % on weight basis.
Conclusions
The study conducted here is limited. In addition, it was not possible to vary all parameters to
an as large extent as planned for due to difficulties with creating a stable spray. Further was it
difficult to assess some of the variations as the time delays particularly for the HF was
significant. Still some important findings were made.
The work presented shows that it is possible to use FTIR to measure HF and POF3 in real time
in Li-ion electrolyte experiments with and without combustion. The detection limit for the
equipment used here was found to be 2 ppm for HF and 6 ppm for POF3.
Both HF and POF3 were detected in all experiments. It is an important finding that POF3 is
emitted together with HF also from combustion as this can increase the toxicity of the fire
effluents. The amount of POF3 is shown to be significant, 5-40 % of the HF emissions on a
weight basis and demonstrates the importance of finding the toxicity parameters for this
substance. The toxicity of POF3 is not known but halogen analogues (POCl3) similar to POF3
are highly toxic, more toxic than their corresponding acid (HCl). More information is needed
to resolve this issue especially as POF3 can be emitted under other cell venting situations and
not only fires.
PF5 could not be detected in any of the tests. The reason for this is probably the high reactivity
of this specie. This was demonstrated by the difficulty to produce a calibration gas mixture for
PF5.
Given the uncertainties involved in the tests it was not possible to determine any impact on
gases produced depending on combustion parameters such as solvent/propane ratio,
concentration of salt or the way the salt/solvent was introduced into the flame.
A possible difference was however seen in HF/POF3 ratio depending on solvent used. This
shows that also the solvent might have an impact on the amount of substances emitted in a fire
situation. Eshetu et al [16] suggested an evaluation scheme for different solvents considering
combustion behaviour and other properties such as viscosity. Considering the combustion
parameters DME would be a poor choice. This evaluation scheme does not include
fluorinated compound toxicity however. Given the toxicity of HF and possibly also POF3, a
replacement for the LiPF6 salt is important to improve the safety for Li-ion batteries which is
also concluded by Ribiere et al [17].
Acknowledgments
The authors gratefully acknowledge the Swedish Fire Research Board and the Swedish
Energy Agency for the financial support.
References
1. Wang Q, Ping P, Zhoi X, Chu G, Sun J, Chen C. Thermal runaway caused fire and
explosion of lithium ion battery. Journal of Power Sources 2012; 208: 210-214.

2. Lisbona D, Snee T. A review of hazards associated with primary lithium and lithium-ion
batteries, Process safety and environmental protection 2011; 89: 434-442.
3. Doughty D, Roth P, A general discussion of Li ion battery safety. The Electrochemical
Society Interface, 2012: 37-44.
4. Kirk-Othmer Encyclopedia of Chemical Technology, John Wiley & Sons, 1994, 11.
5. Hammami A, Raymond N, Armand M. Runaway risk of forming toxic compounds,
Nature 2003; 424, 635-636.
6. Hygiensiska gränsvärden AFS 2011:18, Hygieniska gränsvärden Arbetsmiljöverkets
föreskrifter och allmänna råd om hygieniska gränsvärden, ISBN 978-91-7930-559-8,
ISSN 1650-3163, Swedish Work Environment Authority, Sweden, 2011.
7. Ohsaki T, Kishi T, Kuboki T, Takami N, Shimura N, Sato Y, Sekino M, Satoh A.
Overcharge reaction of lithium-ion batteries, Journal of Power Source 2005; 146: 97-
100.
8. Abraham DP, Roth P, Kostecki E, McCarthy K, MacLaren S, Doughty D, Diagnostic
examination of thermally abused high-power lithium-ion cells, Journal of Power Sources
2006;161: 648-657.
9. Roth P. Thermal response and flammability of Li-ion cells for HEV and PHEV
applications, SAE Int. J. Passen. Cars – Mech. Syst, 2008, volume 1, issue 1.
10. Campion CL, Li W, Lucht B. Thermal decomposition of LiPF6-based electrolytes in
lithium-ion batteries. Journal of the Electrochemical Society 2005; 152 (12): A2327-
A2334.
11. Yang H, Shen XD. Dynamic TGA-FTIR studies on the thermal stability of
lithium/graphite with electrolyte in lithium-ion cell. Journal of Power Sources 2007;167:
515-519.
12. Lux SF, Lucas IT, Pollak E, Passerini S, Winter M, Kostecki R. The mechanism of HF
formation in LiPF6 based organic carbonate electrolyte. Electrochemistry
Communications 2012; 4: 47-50.
13. Yang, H., Zhuang, G. V. and Ross, P. N. Jr, “Thermal Stability of LiPF6 salt and Li-ion
battery electrolytes containting LiPF6, Journal of Power sources 161 (2006) 573-579.
14. Wang QS, Sun JH, Chu GQ, Yao XL, Chen CH. Effect of LiPF6 on the thermal
behaviors of four organic solvents for lithium ion batteries. Journal of Thermal Analysis
and Calorimetry, 2007; 89: 1: 245-250.
15. Teng XG, Li FQ, Ma PH, Ren QD, Li SY. Study on thermal decomposition of lithium
hexafluorophosphate by TG–FT-IR coupling method. Thermochimica Acta, 2005; 436:
30-34.
16. Eshetu,G.G., Grugeon, S., Laruelle, S., Boyanov, S., Lecocq, A., Bertrand, J-P., Marlair,
G., In-depth safety-focused analysis of solvents used in electrolytes for large scale
lithium ion batteries”, Phys.Chem. Chem. Phys., 2013; 15: 9145
17. Ribière, P., Grugeon, S., Morcrette, M., Boyanov, S., Laruelle, S., Marlair G., Energy
Environ. Sci., 5 (2012) 5271-5280.
18. ISO 5660:2002 Reaction-to-fire-tests – Heat release, smoke production and mass loss rate
– Part 1: Heat release rate (cone calorimeter method)
19. P. Andersson, P. Blomqvist, A. Lorén, F. Larsson, Investigation of fire emissions from
Li-ion batteries, SP Report 2013:5, SP Technical Research Institute of Sweden, Boras,
Sweden, ISBN 978-91-87461-00-2, 2013.
20. ISO 19702:2006, Toxicity testing of fire effluents -- Guidance for analysis of gases and
vapours in fire effluents using FTIR gas analysis


Paper V


Characteristics of Lithium-ion batteries during fire tests
Fredrik Larssona,b,*
, Petra Andersson a, Per Blomqvist
a, Anders Lorén
a and Bengt-Erik Mellander
b
aSP Technical Research Institute of Sweden, Brinellgatan 4, SE-501 15 Borås, Sweden
bDepartment of Applied Physics, Chalmers University of Technology, SE-412 96 Göteborg, Sweden
*Corresponding author: Tel.: +46 10 5165928; fax: +46 33 125038
E-mail address: [email protected]
Abstract
Commercial lithium-ion battery cells are exposed to a controlled propane fire in order to evaluate heat release rate
(HRR), emission of toxic gases as well as cell temperature and voltage under this type of abuse. The study includes
six abuse tests on cells having lithium-iron phosphate (LFP) cathodes and, as a comparison, one test on conventional
laptop battery packs with cobalt based cathode. The influence of different state of charge (SOC) is investigated and a
limited study of the effect of water mist application is also performed. The total heat release (THR) per battery
energy capacity are determined to be 28-75 kJ/Wh and the maximum HRR values to 110-490 W/Wh. Hydrogen
fluoride (HF) is found in the released gases for all tests but no traceable amounts of phosphorous oxyfluoride (POF3)
or phosphorus pentafluoride (PF5) are detected. An extrapolation of expected HF emissions for a typical automotive
10 kWh battery pack exposed to fire gives a release of 400-1200 g HF. If released in a confined environment such
emissions of HF may results in unacceptable exposure levels.
Keywords: Lithium ion, battery, hydrogen fluoride, phosphorous oxyfluoride, heat release rate, fire
1. Introduction
Lithium-ion batteries are widely used since they offer great benefits compared to many other battery technologies.
Advantages such as high energy and power density, long life time and the possibility of fast charging make them
attractive for consumer products and electrified vehicles. Nevertheless Li-ion batteries contain reactive and
flammable materials, therefore safety issues are a concern and a number of incidents involving Li-ion batteries have
been reported over the last couple of years [1-4]. Overheating of the batteries may result in exothermal reactions and
lead to a thermal runaway with excessive amounts of heat, gas emissions, fire and potentially explosion/rapid
dissembling [1,5-6]. Even in case there is no thermal runaway, a heated battery can still vent flammable and toxic
gases. Examples of toxic gases that may originate from such events are hydrogen fluoride, HF, and phosphorous
oxyfluoride, POF3. The toxicity of HF is quite well known [7] since it is formed during several chemical
decomposition processes and fires but the toxicity of the POF3 is currently unknown. Actually, the toxicity of POF3
might act with other poisoning mechanisms than just by formation of three equivalents of HF. Therefore, critical
limits of exposure might be lower for POF3 than for HF as in the chlorine analogue POCl3/HCl [8]. The origin of the
fluorine compounds is primarily the battery electrolyte but emissions can also come from the binder (e.g. PVdF) of
the active electrode materials. The electrolyte usually contains flammable organic solvents some of which are
volatile at modest temperatures (below 100 C) and the commonly used Li-salt, lithium hexafluorophosphate, LiPF6,
has a limited thermal stability upon heating. The decomposition of LiPF6 can be described, according to Yang et al.
[9] and Kawamura et al. [10], by:
LiPF6 LiF + PF5 (1)
PF5 + H2O POF3 + 2HF (2)
LiPF6 + H2O LiF + POF3 + 2HF (3)

POF3 + H2O POF2(OH) + HF (4)
When LiPF6 is heated in a dry and inert atmosphere it decomposes to lithium fluoride, LiF, which is a solid
compound at temperatures below 845°C and phosphorus pentafluoride, PF5, which is a gas and a strong Lewis acid,
see eq. (1). In the presence of water/moisture PF5 produces POF3, and HF (eq. (2)). LiPF6 can also react directly with
water/moisture to form LiF, POF3 and HF according to eq. (3). In fact, LiPF6 is highly susceptible to hydrolysis by
even trace amounts of moisture [11]. Furthermore, Kawamura et al. [10] suggested that POF3 could react with water
and form POF2(OH) and HF according to eq. (4).
The decomposition of electrolytes containing LiPF6 forming HF is complex and has mainly been studied at ambient
temperature and during heating (but not in situations where there is a fire) [12-19]. Besides emissions containing
fluorine and vaporized solvents, a Li-ion cell can also emit other gases, e.g. H2, CO, CO2, CH4, C2H6 and C2H4 [20-
22]. Gases can actually be emitted from batteries under several types of abuse conditions such as overheating,
overcharge [23], short circuit, fires etc. A few studies are published on heat release rate (HRR) and emissions of
toxic gases from Li-ion batteries in fire conditions. Ribière et al. [24] used a Tewarson fire calorimeter to study the
HRR and toxic gases from commercial 2.9 Wh pouch cells with LiMn2O4 (LMO) cathode and graphite anode and
found e.g. that the total HF release was higher for lower state of charge (SOC) values. Eshetu et al. [25] studied fire
properties and toxicity for commonly used Li-ion battery electrolytes but without Li-salt and thus without the
possibility to produce HF.
This paper presents results from fire tests of commercially available Li-ion battery cells. Parameters such as heat
release rate, cell voltage and surface temperature are measured as well as HF and POF3 emissions. The influence of
application of water is examined to a limited extent by introducing water mist into the flames.
2. Experimental
The tests were conducted using the measurement and gas collection system of a Single Burning Item (SBI)
apparatus, that is normally used for classification of building materials according to the European Classification
scheme EN13823 [26]. The experimental setup is shown in Fig 1. The cells/batteries were placed on a wire grating
(large gratings about 4 cm x 10 cm) as seen in Fig 2. A propane burner was placed underneath the cells/batteries and
was ignited two minutes after the start of the test. The HRR of the burner alone was approximately 15 kW. Abuse
tests were performed on 7 Ah EiG LFP pouch cells, 3.2 Ah K2 LFP cylindrical cells, and on 16.8 Ah Lenovo laptop
battery packs, see Table 1.
Fig. 1. Schematic illustration over experimental setup.

Fig. 2. The 5-cells pack of EiG cells placed on a wire grating.
Test 1-5 used commercially available pouch cells with lithium-iron phosphate (LFP), LiFePO4, cathode and carbon
based anode. Each test consisted of five cells that were mechanically fastened together with steel wire (0.8 mm
diameter). The terminal tabs of the cells were cut for all cells but the mid one (the third cell), for which the cell
voltage was measured. On both sides of the third cell type K thermocouples were centrally attached measuring the
cell surface temperature. Temperature values presented in this paper are the average of these thermocouple readings.
The temperature and cell voltage was measured with a sample rate of 1 Hz using a data logger, Pico Technology
ADC-24. In test 3, water mist was manually applied as a spray into the flames above the battery to study any
influence from additional water on the composition of the gas emissions. In test 6, nine K2 26650-cells, i.e.
cylindrical cells 26 mm in diameter and 65 mm long, were placed standing up next to each other inside a box. The
box had side walls made of non-combustible silica board and steel net at the bottom and top. It was used as a safety
precaution to avoid possible projectiles. In test 7, two identical laptop battery packs were used and placed inside a
steel net and fastened on the wire grating.
Table 1
Test objects.
Test
No. Battery type
No. of
cells
Nominal
capacity (Ah)
Weight
(g) Test condition
1 EiG ePLB-F007A 5 35 1 227.9 100% SOC
2 EiG ePLB-F007A 5 35 1 229.7 100% SOC
3 EiG ePLB-F007A 5 35 1 229.3 100% SOC + water mist
4 EiG ePLB-F007A 5 35 1 228.6 0% SOC
5 EiG ePLB-F007A 5 35 1 227.6 50% SOC
6 K2 LFP26650EV 9 28.8 734.8 100% SOC
7 Lenovo laptop battery packs 12* 33.6 639.0 100% SOC
* Two laptop battery packs were used at the same time, each with 6 cells.
The cells in test 1-6 were set to the selected SOC-level, according to Table 1, by a charge/discharge procedure using
an ordinary laboratory power aggregate and a Digatron battery test equipment. The two laptop battery packs in test 7
were fully charged using a laptop computer. All batteries were unused but had different calendar aging. The EiG
cells were approximate 2-3 years old, the K2 cells were approximate 1-2 years old and the laptop battery pack was
less than 6 months old.
The laptop battery packs in test 7 differ from the other test objects. First, they consist of not only the cells but also
electrical connectors, plastic housing and electronic circuits. Secondly, they have cobalt based cell chemistry with a

higher cell voltage, 3.7 V vs 3.2 V for the LFP-cells. Thirdly, in each battery pack, 3 cells are electrically connected
in series increasing the voltage to 11.1 V.
All tests were video recorded. The tests were performed during two days and in the beginning of each day a blank
test was conducted in order to be able to subtract the burner influence on the HRR values and to make a blank for the
gas analysis. The burner was active for a varying duration in the different tests, between 17-32 minutes, i.e. as long
as a heat release contribution from the battery was still present. The fire emissions from the test object were collected
in a ventilation duct. In test 1-2 a duct flow of 0.6 m3/s was used but in order to increase emission concentrations in
the ventilation the duct flow was decreased to 0.4 m3/s in test 3-7.
A Servomex 4100 Gas purity analyser was used to measure the oxygen content of the flow by a paramagnetic
analyzer and CO and CO2 were determined by a non-dispersive infrared sensor (NDIR). The HRR was calculated
using the method of oxygen consumption and was corrected for CO2 [26]. A part of the flow in the ventilation duct
was extracted for on-line FTIR analysis. This sub-flow was extracted through an 8.5 m sampling PTFE hose, heated
to 180 C, using a pump (3.5 L/min) located after the FTIR measurement cell. The sampled gas is passed through a
primary filter (M&C ceramic filter, heated to 180 C) before the heated hose and thought a second filter (M&C
sintered steel filter, heated to 180 C) before the FTIR. After each test the primary filter was chemically analyzed for
fluoride content since it is known that HF may be partly adsorbed by this type of filter [27]. The fluoride adsorbed by
the filter was determined by method B.1 (b) of the SS-ISO 19702:2006 Annex B standard, where the filter is leached
in water in an ultrasonic bath for at least 10 min. Thereafter the fluoride content in the water is measured by ion
chromatography with a conductive detector. The amount of HF is calculated by assuming that all fluoride ions
present in the filter derives from HF. The concentration of the emitted gas was measured by Fourier transform
infrared spectroscopy (FTIR) using a Thermo Scientific Antaris IGS analyzer (Nicolet) with a gas cell. The spectral
resolution of the FTIR was 0.5 cm-1
. The gas cell was of 0.2 L, had a path length of 2.0 m, a cell pressure of 86.7 kPa
was maintained and the cell was heated to 180C. Each spectrum used 10 scans which gave a new spectrum every 12
seconds. There is a natural time delay between the gas measurement of the SBI and the FTIR in the measurement
setup. The HRR and FTIR results presented in this paper were therefore time synchronized by overlaying of CO2
measurements from the FTIR and the NDIR.
FTIR is a suitable technique to measure the concentrations of HF and POF3 in the emitted fire gases. The FTIR was
calibrated for a number of compounds, e.g. HF, when delivered from the supplier. However, it was found that the HF
calibration was not accurate enough so it was recalibrated, see Andersson et al. [28] for a detailed description of the
calibration procedure. The FTIR was also calibrated for POF3. PF5 could only be qualitatively determined by its
spectral signature [28] but no traces of PF5 could be found in the fire tests probably due to that the PF5 is highly
reactive. The detection limits were 2 ppm for HF and 6 ppm for POF3. The spectral bands used for Classical Least
Square (CLS) type quantification of HF and POF3 are stated in Table 2.
Table 2
The spectral bands used for HF and POF3.
Spectral bands (cm-1
) Type of band
HF
4203-4202 HF R-branch stretching mode [29]
4175-4172 HF R-branch stretching mode [29]
POF3
1418-1413 P-O stretching mode [9]
874-868 P-F symmetric stretching mode [9]

3. Results and discussion
The HRR results for the EiG battery cells with 0%, 50% and 100% SOC are shown in Fig. 3. High SOC values give
high HRR peaks and the temperature and voltage measurements in Fig. 4 confirm that cells with high SOC value
give a more reactive response, with rapid temperature increase and earlier voltage breakdown. Studies using other
techniques confirm our results that battery cells with higher SOC are more thermally reactive, using e.g.; fire
calorimeter [24], accelerating-rate calorimetry (ARC) [5] and VSP2 adiabatic calorimeter [30]. The HRR from the
nine K2 cells in test 6 and the two complete laptop battery packs in test 7 can be seen in Fig. 5. The laptop pack
includes the plastic box and have Li-ion cells with the more reactive cobalt based cathode, while the K2 cells (as well
as the EiG cells) have LFP cathodes which are known to be significantly more stable [5,31-34]. The higher HRR
values for the laptop cells are thus expected.
Fig. 3. Heat release rate for EiG cells with 0%, 50% and 100% SOC.
Fig. 4. Mid cell temperature and voltage for EiG with 0%, 50% and 100% SOC.

Fig. 5. Heat release rate for K2 cells (test 6) and laptop battery packs (test 7).
Outbursts from fully charged cells (100% SOC) of EiG, K2 and laptop packs were visually observed, see Fig. 6 for a
typical example. The outbursts originate from ignition of the rapid gas release from a cell upon opening due to
excessive cell pressure and correspond to the sharp spikes in the HRR curves, see Fig. 3 and Fig. 5. In most cases,
one HRR-spike could be detected for each individual cell. For EiG cells with 50% and 0% SOC no spikes were
observed in the HRR curves, instead two broad maxima were found. The orientation of the cells on the wire grating
varied due the different packaging types (pouch, cylindrical, complete battery pack) which might have influenced the
results. However, tests 1-5 used the same cell type and setup. The results of tests 6-7 can be seen as examples of
possible events for these types of cells.
Fig. 6. Outbursts from EiG 100% SOC (test 1).
The fire test on EiG cells with 100% SOC was repeated two times (tests 1-2) without water mist application and one
time (test 3) with water mist applied approximately 6.5 minutes after burner start. Fig. 7 shows HRR, HF emission
rate, voltage and temperature for the mid cell, in test 2. Rapidly propagating flames released from the battery cells
were visually observed five times during the test and denoted outbursts, marked in Fig. 7, and coincided with the five
spikes in the HRR curve. The hydrogen fluoride concentration showed a rapid increase at the end of the HRR peak
and the HF maximum plateau was reached just after the HRR spikes. The delay between HF production and HRR is
not due to gas transport time since it is compensaded by CO2 syncronisation, the reason is due to delay times in the
sampling system. As expected, the temperature of the mid cell showed a steep increase connected to the HRR peaks,
the outbursts and the voltage breakdown. The maximum temperature reached in this measurement was 521 C. Test
1 and test 2 show similar values and behavior, the variation between the tests is due to the nature of the fire
characteristics.

Fig. 7. Results for EiG 100% SOC (test 2).
Fig. 8 shows test 3 where 100% SOC EiG cells were tested with water mist application. Most of the results of the
tests with and without water mist are similar, but the maximum HF concentration recorded at the time of applying
the water mist into the flames is approximately twice as high as that in tests 1-2. However, the total amount of
measured HF from FTIR and absorbed by the primary filter is of the same order for all tests 1-3. The water mist was
certainly not the only source of water in this experiment, in addition to water existing in the atmosphere water is
produced by the combustion process. In the general case of combustion of hydrocarbons water is produced:
CnHm + (m/4+n)O2 nCO2 + (m/2)H2O (5)
and in the oxidation of ethylene carbonate (EC), C3H4O3, a commonly used Li-ion solvent, water is thus produced
according to:
2C3H4O3 + 5O2 6CO2 + 4H2O (6)
When propane, C3H8, is combusted, 1 mol of propane produces 4 mol of water according to eq. (5). In test 1-3 the 15
kW propane burner was active during 17 minutes and given the heat of combustion of propane, 2044 kJ/mol, the
amount of water produced from the burner can be calculated to be approximately 550 g.
Fig. 8. Results for EiG 100% SOC with water mist (test 3).

The water concentration in the exhaust duct was measured by the FTIR, see Fig. 9 for the results of test 1-3. The
water concentration shown for test 3 is scaled (factor 0.4/0.6) due to the lower duct flow in order to allow a
comparison with the measured values of test 1-2. The outbursts result in an increased water concentration and the
effects on the measured water concentration from the applied water mist is also clearly seen. Calculated from the
measured data, the mass of the added water mist was around 400 g while around 350 g water was released due to the
combustion of battery materials. The water in the duct flow from ambient air was around 1500 g for test 3 and 2300
g in test 1-2 (due to higher duct flow rate). The time of the water mist application was relatively short and the water
mist was applied in the reaction zone, thus the impact from this source of water was potentially high which is also
seen in Fig. 9. The amounts of water from ambient air were large but the impact should have been low since only
part of the air flow passed the reaction zone above the battery and no effect on the HF concentration was observed
due to the higher ambient water content in the duct flow in test 1-2 compared to test 3. Fig. 10 shows the correlation
between HF production and water concentration for test 3. No HF production directly associated with the outbursts
can be seen but the application of water mist seems to influence the HF production. However, the added water mist
only temporarily increased the emission of HF but did not change the total amount of HF produced. Anyhow, only
one test with water mist application was performed and the correlation between the water mist application and the
increased HF peak production could possibly depend on other factors than the additional water introduced by the
water mist.
Fig. 11 shows the measured production rate of HF for all EiG tests. For 0-50% SOC the peaks are broadened
compared to the peaks for the 100% SOC cells and the total amount of measured HF is about double that of the
100% SOC cells. Detailed results from all the tests can be found in Table 3. Total yields in mg/g are calculated as
total amount of HF divided per weight loss of the batteries. In test 7 the weight loss also included the burning of pack
materials, e.g. plastic housing. Total yields in mg/Wh are calculated as total amount HF in mg divided by total
energy capacity, Wh, of the batteries for each test. Whichever of these yield values that are used, the EiG cells with
0% or 50% SOC showed the highest HF values. The measured data indicate a relationship between SOC and the
total released HF emissions, with increased total amounts of HF emission for lower SOC. Ribière et al. [24] found
somewhat similar results by studying single cells with 100%, 50% and 0% SOC, showing an increasing total amount
of HF emissions for decreasing SOC value. The reason for this is unknown and an investigation of the relationship
would require further studies. The HF concentrations measured were in all cases well above the detection limit but
no significant amounts of POF3 could be detected in any of the tests. FTIR measurements on samples of similar
electrolytes with LiPF6 in a cone calorimeter have shown the production of POF3 to be in the order of 1/20 of the HF
production [28]. The detection limit of POF3 in the FTIR measurements is 3 times higher than for HF, thus there
could have been POF3 present during the measurements which has not been detectable.
Fig. 9. Water concentrations measured in test 1-3. The increased water level in test 3 due to water mist application is
clearly seen.

Fig. 10. HF mass flow and water concentration for test 3.
Fig. 11. HF mass flow for EiG cells with different SOC (indicated by % in figure legend) in tests 1-5.
Table 3
Detailed results of heat release rate, energy release, hydrogen fluoride emissions for test 1-7.
Test
No.
Weight
loss
(g)
Max
heat
release
(kW)
Total
heat
release
(kJ)
Hydrogen fluoride
Max
production
rate (g/s)
Total amounts
from FTIR
(g)
Total amounts
from filter
(g)
Total
amounts
(g)
Total
yields
(mg/g)
Total
yields
(mg/Wh)
1 346 55 7731 0.0088 3.2 1.7 4.9 14 44
2 342 51 7526 0.0077 3.9 2.4 6.3 18 56
3 341 49 8095 0.0154 4.2 1.5 5.7 17 51
4 353 13 8314 0.0102 9.7 1.6 11.3 32 100
5 354 17 8452 0.0164 12.0 1.9 13.9 39 120
6 145 29 2766 0.0029 1.2 1.0 2.2 15 24
7 258 57 3470 0.0011 Not detected 1.9 1.9 7.3 15
The HRR values presented in this paper are calculated using the oxygen consumption method. This technique is well
accepted and used in fire calorimetry measurements. For the case of battery fires, the technique might however have
some limitations since it will not account for energy liberated by Joule heating through electrical discharge, e.g.
internal short circuits in a cell due to melted separator. Ribière et al. [24] estimates the error to be max 10% and
thereby claim the oxygen consumption method to the usable. Besides the issue with Joule heating, the Li-ion battery
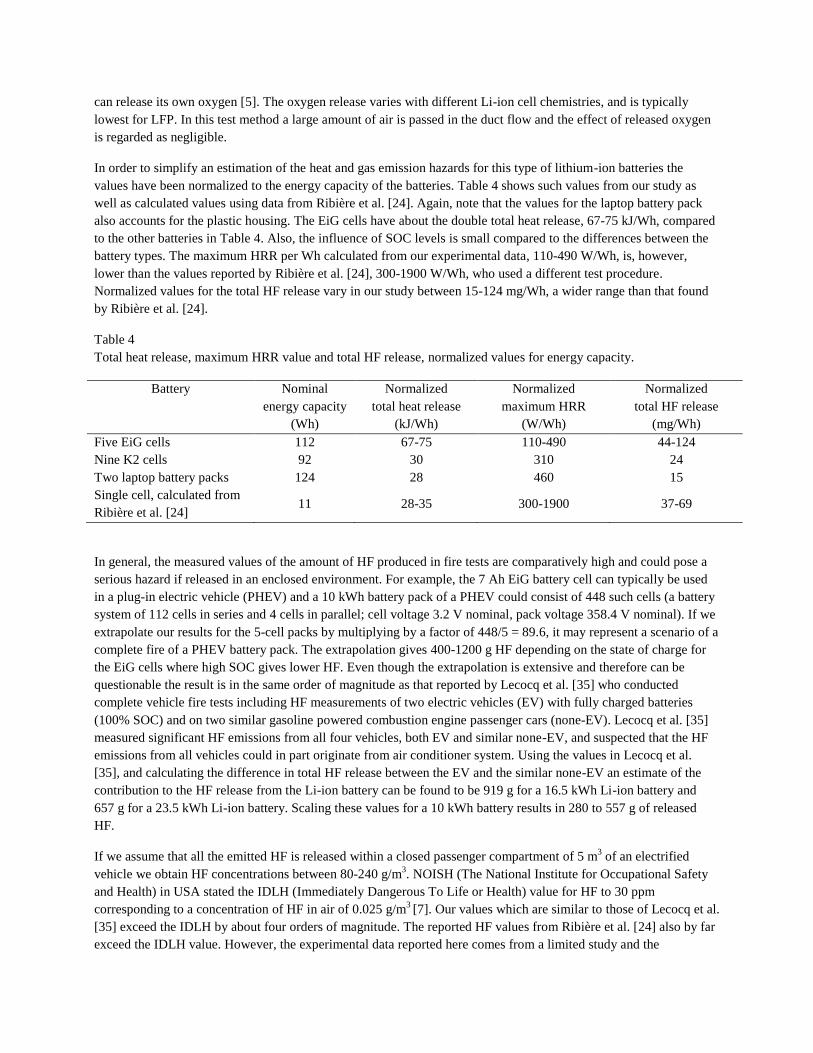
can release its own oxygen [5]. The oxygen release varies with different Li-ion cell chemistries, and is typically
lowest for LFP. In this test method a large amount of air is passed in the duct flow and the effect of released oxygen
is regarded as negligible.
In order to simplify an estimation of the heat and gas emission hazards for this type of lithium-ion batteries the
values have been normalized to the energy capacity of the batteries. Table 4 shows such values from our study as
well as calculated values using data from Ribière et al. [24]. Again, note that the values for the laptop battery pack
also accounts for the plastic housing. The EiG cells have about the double total heat release, 67-75 kJ/Wh, compared
to the other batteries in Table 4. Also, the influence of SOC levels is small compared to the differences between the
battery types. The maximum HRR per Wh calculated from our experimental data, 110-490 W/Wh, is, however,
lower than the values reported by Ribière et al. [24], 300-1900 W/Wh, who used a different test procedure.
Normalized values for the total HF release vary in our study between 15-124 mg/Wh, a wider range than that found
by Ribière et al. [24].
Table 4
Total heat release, maximum HRR value and total HF release, normalized values for energy capacity.
Battery Nominal
energy capacity
(Wh)
Normalized
total heat release
(kJ/Wh)
Normalized
maximum HRR
(W/Wh)
Normalized
total HF release
(mg/Wh)
Five EiG cells 112 67-75 110-490 44-124
Nine K2 cells 92 30 310 24
Two laptop battery packs 124 28 460 15
Single cell, calculated from
Ribière et al. [24] 11 28-35 300-1900 37-69
In general, the measured values of the amount of HF produced in fire tests are comparatively high and could pose a
serious hazard if released in an enclosed environment. For example, the 7 Ah EiG battery cell can typically be used
in a plug-in electric vehicle (PHEV) and a 10 kWh battery pack of a PHEV could consist of 448 such cells (a battery
system of 112 cells in series and 4 cells in parallel; cell voltage 3.2 V nominal, pack voltage 358.4 V nominal). If we
extrapolate our results for the 5-cell packs by multiplying by a factor of 448/5 = 89.6, it may represent a scenario of a
complete fire of a PHEV battery pack. The extrapolation gives 400-1200 g HF depending on the state of charge for
the EiG cells where high SOC gives lower HF. Even though the extrapolation is extensive and therefore can be
questionable the result is in the same order of magnitude as that reported by Lecocq et al. [35] who conducted
complete vehicle fire tests including HF measurements of two electric vehicles (EV) with fully charged batteries
(100% SOC) and on two similar gasoline powered combustion engine passenger cars (none-EV). Lecocq et al. [35]
measured significant HF emissions from all four vehicles, both EV and similar none-EV, and suspected that the HF
emissions from all vehicles could in part originate from air conditioner system. Using the values in Lecocq et al.
[35], and calculating the difference in total HF release between the EV and the similar none-EV an estimate of the
contribution to the HF release from the Li-ion battery can be found to be 919 g for a 16.5 kWh Li-ion battery and
657 g for a 23.5 kWh Li-ion battery. Scaling these values for a 10 kWh battery results in 280 to 557 g of released
HF.
If we assume that all the emitted HF is released within a closed passenger compartment of 5 m3 of an electrified
vehicle we obtain HF concentrations between 80-240 g/m3. NOISH (The National Institute for Occupational Safety
and Health) in USA stated the IDLH (Immediately Dangerous To Life or Health) value for HF to 30 ppm
corresponding to a concentration of HF in air of 0.025 g/m3 [7]. Our values which are similar to those of Lecocq et al.
[35] exceed the IDLH by about four orders of magnitude. The reported HF values from Ribière et al. [24] also by far
exceed the IDLH value. However, the experimental data reported here comes from a limited study and the

calculation assumes a somewhat extreme theoretical situation which differs from real fire situations, i.e. all HF is
emitted and trapped in the compartment and that the passenger stays in the compartment. Anyhow, even if the
emission occurs in a much larger volume, e.g. in a garage, the HF levels can still be very high. The reported HF
values thus indicate that a critical situation might occur in the case of a thermal event in a Li-ion battery pack.
Although we could not directly detect the presence of POF3, it may also be present in considerable amounts since
indications are that HF and POF3 is produced with a ratio of about 1:20 [28].
4. Conclusions
The tests show that lithium-ion battery cells exposed to fire are significantly more reactive at 100% SOC than at
lower SOC values and energetic outbursts were observed. The HRR peak values thus varied in a rather wide range,
between 13-57 kW for batteries with approximately 100 Wh energy capacity. The normalized total heat release per
energy capacity was 28-75 kJ/Wh and the normalized maximum HRR values were 110-490 W/Wh.
The amount of HF released varied between 15-124 mg/Wh. Lower SOC values gave higher amounts of HF.
Extrapolation of data shows that the potential HF release from a 10 kWh PHEV battery is in the range 400-1200 g
HF. If this amount of HF would be released inside a passenger compartment of 5 m3 the HF concentration would be
80-240 g/m3, that is magnitudes higher than acceptable short time exposure levels. Besides HF, there may also be
significant emissions of POF3, a compound which might be more toxic than HF. Although these estimates are based
on an extrapolation and can be regarded as a hypothetical case it highlights the risks associated with toxic emissions
at battery fires and the need to find replacements for the fluorine content in the Li-salt and binder used in Li-ion
battery cells. The influence of additional water in form of water mist seemed to increase the HF emissions
momentarily, however the total HF release was the same. Further studies of the relationship between water and HF
emissions in fires are needed in order to thoroughly evaluate potential risks related to the use of water as firefighting
medium in electric vehicle fires.
Acknowledgements
The authors gratefully acknowledge the Swedish Energy Agency and the FFI-program as well as the Swedish Fire
Research Board for financial support. Several persons at SP Fire Technology are acknowledged for their contribution
to this work, including Lars Pettersson and Magnus Samuelsson.
References
1. Z. J. Zhang, P. Ramadass, W. Fang, Safety of lithium-ion batteries, in: G. Pistoia (Ed), Lithium-Ion
Batteries Advances and Applications, Elsevier, Amsterdam, 2014, pp. 409-435.
2. Q. Wang, P. Ping, X. Zhao, G. Chu, J. Sun, C. Chen, J. of Power Sources, 208 (2012) 210-214.
3. D. Lisbona, T. Snee, , Process safety and environmental protection, 89 (2011) 434-442.
4. http://edition.cnn.com/2014/01/14/travel/787-dreamliner/, 2014-05-13
5. D. Doughty, E. P. Roth, The Electrochem. Soc. Interface, summer 2012, 2012 37-44.
6. F. Larsson, P. Andersson, B.-E. Mellander, Are electric vehicles safer than combustion engine vehicles?, in:
B. Sandén, P. Wallgren (Eds.), Systems perspectives on Electromobility, Chalmers University of
Technology, Goteborg, ISBN 978-91-980973-9-9, 2014, pp. 33-44.
7. Documentation for Immediately Dangerous To Life or Health Concentrations (IDLHs) for Hydrogen
fluoride (as F), The National Institute for Occupational Safety and Health (NOISH), USA, May 1994,
http://www.cdc.gov/niosh/idlh/7664393.html.
8. Middelman, Hygiensiska gränsvärden AFS 2011:18, Hygieniska gränsvärden Arbetsmiljöverkets
föreskrifter och allmänna råd om hygieniska gränsvärden, ISBN 978-91-7930-559-8, ISSN 1650-3163,
Swedish Work Environment Authority, Sweden, 2011.
9. H. Yang, G. V. Zhuang, P. N. Ross Jr, J. of Power Sources 161 (2006) 573-579.

10. T. Kawamura, S. Okada, J.-i. Yamaki, J. of Power Sources 156 (2006) 547-554.
11. Q.-S. Wang, J.-H. Sun, G.-Q. Chu, X.-L. Yao, C.H. Chen, J. of Thermal Analysis and Calorimetry, 89
(2007) 1, 245-250.
12. C. G. Barlow, Electrochem. and Solid-State Letters, 2 (8) (1999) 362-364.
13. S. E. Sloop, J. B. Kerr, K. Kinoshita, J. of Power Sources, 119-121 (2003) 330-337.
14. C. L. Campion, W. Li, W. B. Euler, B. L. Lucht, B. Ravdel, J. F. DiCarlo, R. Gitzendanner, K. M.
Abraham, Electrochem. and Solid-State Letters, 7 (7) (2004) A194-A197.
15. C. L. Campion, W. Li, B. L. Lucht, J. of the Electrochem. Soc. 152 (12) (2005) A2327-A2334.
16. S. F. Lux, I. T. Lucas, E. Pollak, S. Passerini, M. Winter, R. Kostecki, Electrochem. Communications 14
(2012) 47-50.
17. H. Yang, X.-D. Shen, J. of Power Sources 167 (2007) 515-519.
18. M. D. S. Lekgoathi, B. M. Vilakazi, J. B. Wagener, J. P. Le Roux, D. Moolman, J. of Fluorine Chemistry,
149 (2013) 53-56.
19. Hammami, N. Raymond, M. Armand, Nature 424 (2003) 635-636.
20. T. Ohsaki, T. Kishi, T. Kuboki, N. Takami, N. Shimura, Y. Sato, M. Sekino, A. Satoh, J. of Power Sources
146 (2005) 97-100.
21. E. P. Roth, C. J. Orendorff, The Electrochem. Soc. Interface, summer 2012. 2012 45-49.
22. D. P. Abraham, E. P. Roth, R. Kostecki, K. McCarthy, S. MacLaren, D. H. Dought, J. of Power Sources 161
(2006) 648-657.
23. M. D. Chatelain, T. E. Adams, Proceedings of the Power Sources Conference, 42 (2006) 87-89.
24. P. Ribière, S. Grugeon, M. Morcrette, S. Boyanov, S. Laruelle, G. Marlair, Energy Environ. Sci., 5 (2012)
5271-5280.
25. G. G. Eshetu, S. Grugeon, S. Laruelle, S. Boyanov, A. Lecocq, J.-P. Bertrand, G. Marlair, Phys. Chem.
Chem. Phys. 15 (2013) 9145-9155.
26. EN 13823:2010, Reaction to fire tests for building products – Building products excluding floorings
exposed to the thermal attack by a single burning item, European Committee for Standardization, Brussels,
2010.
27. ISO 19702:2006, Toxicity testing of fire effluents -- Guidance for analysis of gases and vapours in fire
effluents using FTIR gas analysis, International Organization for Standardization, Geneva, 2006.
28. P. Andersson, P. Blomqvist, A. Lorén, F. Larsson, Investigation of fire emissions from Li-ion batteries, SP
Report 2013:5, SP Technical Research Institute of Sweden, Boras, Sweden, ISBN 978-91-87461-00-2,
2013.
29. J. M. Hollas, Modern Spectroscopy, 3ed., John Wiley & Sons, Chichester, 1996.
30. C.-Y. Jhu, Y.-W. Wang, C.-M. Shu, J.-C. Chang, H.-C. Wu, J. of Hazardous Materials, 192 (2011) 99-107.
31. H. Joachin, T. D. Kaun, K. Zaghib, J. Prakash, J. of the Electrochem. Soc., 156 (6) (2009), A401-A406
32. G. Chen, T. J. Richardson, J. of The Electrochem. Soc., 156 (9) (2009) A756-A762.
33. G. Chen and T. J. Richardson, J. of Power Sources, 195 (201) 1221-1224.
34. K. Zaghib, J. Dubé, A. Dallaire, K. Galoustov, A. Guerfi, M. Ramanathan, A. Benmayza, J. Prakash, A.
Mauger and C. M. Julien, J. of Power Sources, 219 (2012) 36-44.
35. Lecocq, M. Bertana, B. Truchot, G. Marlair, Conference proceedings of Fires in vehicles (FIVE) 2012,
edited by P. Andersson, B. Sundström, SP Technical Research Institute of Sweden, Borås, Sweden, 2012,
pp. 183-193.