Assessment of Retirement System Reform Options€¦ · PFM recommends a hybrid retirement plan as...
76
State of Tennessee Tennessee Consolidated Retirement System (TCRS) Reform Options February 22, 2013 Prepared for: Tennessee Treasury Department David H. Lillard, Jr., State Treasurer State of Tennessee 530 Oak Court Drive, Suite 160 Memphis, TN 38117 901 682 8356 Two Logan Square, Suite 1600 18 th & Arch Streets Philadelphia, PA 19103-2770 215 557 6100 www.pfm.com
Transcript of Assessment of Retirement System Reform Options€¦ · PFM recommends a hybrid retirement plan as...
State of Tennessee
Tennessee Consolidated Retirement System (TCRS)
Reform Options
February 22, 2013
Prepared for:
Tennessee Treasury Department David H. Lillard, Jr., State Treasurer
State of Tennessee
530 Oak Court Drive, Suite 160 Memphis, TN 38117
901 682 8356
Two Logan Square, Suite 1600 18th & Arch Streets
Philadelphia, PA 19103-2770 215 557 6100
www.pfm.com

THIS PAGE INTENTIONALLY LEFT BLANK

Table of Contents
Executive Summary ....................................................................................................................... Page 5
TCRS Overview ............................................................................................................................. Page 10
National Trends and Benchmarks ............................................................................................... Page 17
TCRS Reform Options .................................................................................................................. Page 24
Recommended Approach ............................................................................................................ Page 32
Appendices
Appendix A – Defined Benefit Comparison Tables ............................................................... Page 37
Appendix B – Hybrid DB-DC Comparison Tables .................................................................. Page 50
Appendix C – Cash Balance Comparison Tables ................................................................... Page 61
Appendix D – Defined Contribution Comparison Tables ...................................................... Page 63
Appendix E – Recent Reform Highlights ............................................................................... Page 65
Appendix F – Retiree Payroll by County ................................................................................ Page 74
Appendix G – Retiree Income Replacement Ratios .............................................................. Page 76

Executive Summary

Executive Summary
Page | 5
The Tennessee State Treasurer engaged Public Financial Management, Inc. (PFM) to assist in developing and analyzing potential retirement benefit reform options for newly hired state employees and teachers participating in the Tennessee Consolidated Retirement System (TCRS). This evaluation has been initiated in the context of a continuing multi-year low earnings environment in sectors of the investment markets, escalating pension costs, growing unfunded liabilities, new regulatory and accounting requirements, and widespread retirement reform across the nation.
In an effort to address these challenges for Tennessee, the State Treasurer sought to explore potential benefit redesign options that would continue to provide future state employees and teachers with sufficient and secure income in retirement while helping to control growth in employer retirement benefit costs and unfunded liabilities on a sustainable basis. Since the new benefit plan provisions would only apply to state employees and teachers who are hired after a specified future date, employees currently on the payroll and retirees would not be affected.
Current TCRS Structure and Condition
The following points highlight key findings from PFM’s review of the current structure and condition of the TCRS (for further discussion, see pages 10 to 15).
1. All state employees, K-12 public school teachers, and most higher education employees must participate in the defined benefit (DB) pension plan administered by TCRS. Higher education employees who are exempt from the provisions of the Fair Labor Standards Act (generally supervisory or instructional personnel) are now the only employee group given the option of participating in either a pure defined contribution (DC) plan, or the DB pension.
2. Tennessee’s blended funding ratio of the state and teacher plans combined per the July 1, 2011 actuarial valuation of 92.1% is substantially ahead of the 75.8% average among the largest public retirement systems nationally, reflecting the State’s historically conservative practices, and the fact that every Governor and General Assembly since 1972 have fully funded the annual Actuarial Required Contribution (ARC).
3. Nonetheless, as of July 1, 2011, the State’s unfunded actuarial accrued liability (UAAL) was approximately $1.55 billion for state employees and approximately $1.03 billion for teachers for a total UAAL of approximately $2.58 billion. On a fair market value basis, the unfunded accrued liability was approximately $2.52 billion for the state employee plan and approximately $2.55 billion for the teacher plan as of July 1, 2011 for a total market value unfunded liability of approximately $5.07 billion.
4. The Plan continues to be negatively impacted by annual earnings below the actuarial assumed return of 7.5% on a 15 year rolling average basis since 2008 to the present. This trend continued for the fiscal year ended June 30, 2012 with an annual investment return of 5.6%. The 2012 return added an estimated additional $203 million for state employees and $320 million for teachers – $523 million in total – to the actuarial unfunded liabilities of the Plan.
5. Improved life expectancy has also contributed to increasing unfunded actuarial liabilities, as most pension systems nationally, including the TCRS, are paying benefits for more years than projected in past actuarial valuations. From 1970 to 2011, U.S. life expectancy at birth increased by nearly eight (8) years, and life expectancy at age 65 increased by more than four (4) years (to 84.2 years).
Executive Summary
Page | 6
6. Overall, for the ten year period from FY2003 through FY2012, employer contributions to the TCRS nearly tripled, increasing from $264.3 million to $731.4 million for state employees, teachers, and higher education employees.
7. In June 2012, the Governmental Accounting Standards Board (GASB) adopted two statements, GASB 67 and GASB 68, intended to improve the accounting and financial reporting of state and local government pension plans. The effect of these changes is that beginning in Fiscal Year 2015, Tennessee is required to include its net pension liability as a balance sheet liability in the State’s Consolidated Annual Financial Report (CAFR). Applying that standard to the actuarial valuation as of July 1, 2011, the state’s net pension liability recorded in the CAFR would have been an estimated $1.74 billion. Since this standard also applies to local governments beginning in Fiscal Year 2015, the aggregate estimated amount local governments would have recorded was $800 million for general employees plus an additional $1.42 billion for teachers of Local Education Agencies.
8. Currently, Tennessee’s General Obligation debt is rated Aaa (highest rating available) with a stable outlook by Moody’s, AAA (highest rating available) with a stable outlook by Fitch, and AA+ with a positive outlook by Standard and Poor’s. Maintaining these strong ratings is important in order to ensure continued access to the capital markets at the lowest possible interest costs. Also, credit rating agencies have stated that unfunded pension liabilities will be a specific consideration in evaluating the credit rating of states.
State Retirement System Comparisons
The following are general findings from PFM’s comparison of TCRS with other state pension plans (for further discussion, see pages 17 to 22):
1. From 2009 through 2012, 45 of 50 states enacted significant pension reforms for broad groups of state employees in an effort to address long-term funding pressures.
2. Most states, like Tennessee, continue to offer a DB plan as their primary option. As of July 1, 2012, 42 of the 51 systems (including the District of Columbia) surveyed by PFM provided a DB plan as a primary retirement option for state employees.
3. Among such DB plans, Tennessee is the only state that requires no employee contribution for newly hired state employees (teachers in Tennessee contribute 5% of payroll).
4. Even among existing employee groups hired prior to the recent wave of pension reforms, it is typical for state employees to contribute toward their retirement benefit. PFM’s review identified Tennessee as one of only six state retirement systems with a large group of employees that do not require employee contributions.
5. The TCRS normal retirement eligibility criteria are also somewhat more generous than other state retirement systems. Tennessee currently allows state employees to retire at age 60 with 5 years of service or at any age with 30 years of service. Many jurisdictions have increased retirement ages to more closely align with Social Security Normal Retirement Age. It is common to see ages 62, 65, 67, or “Rule of” requirements in other states.
Executive Summary
Page | 7
6. Of the 35 systems that participate in Social Security with a DB pension (excluding Tennessee), 17 have benefit multipliers of 2% or greater for state employees, while 18 have multipliers that are less than 2%, but greater than Tennessee’s 1.575% rate.
Options for TCRS Reform and Recommended Approach
PFM was tasked with assessing and analyzing a range of pension reform options for Tennessee, including: modifying key provisions of the current defined benefit (DB) pension plan; creating a pure defined contribution (DC) plan; or establishing a hybrid DB-DC or a cash balance plan. The team was guided by several key goals and objectives identified by the State Treasurer and staff, including:
1. The new plan provisions would apply to new hires only after a specified future date, and would not affect retirees. Thus, state employees and teachers currently on the payroll and those already retired would not be affected;
2. The new plan should provide state employees and teachers a sufficient and sustainable benefit for a dignified retirement through a combination of TCRS benefits (both DB and DC plans), social security, and personal savings;
3. Long-term solvency of the retirement system must be ensured so that current retirees and future retirees can rely on secure retirement benefits;
4. The new benefit should be established to control costs and reduce the employer’s exposure to risk and unfunded liabilities, in order to sustain TCRS employer contributions at affordable levels for the State and its taxpayers; and,
5. Comprehensive pension reform for future hires for the large classes of employees (state employees, higher education employees, and teachers) should be paralleled with comparable reforms for smaller classes of employees, including state judges, law enforcement, and elected members of the General Assembly.
PFM recommends a hybrid retirement plan as best meeting the State’s goals and objectives, balancing the range of factors evaluated. A suggested structure for this new plan is summarized below (see page 32 for further discussion).
DB Component
1. The pension benefit multiplier would be reduced to 1.0% per year of service from the current 1.575% per year of service (1.8375% above the Social Security Integration Level) – ensuring a base level of guaranteed retirement income, while reducing the State’s exposure to market and actuarial risk.
2. A cap would be established on the defined benefit pension benefits (recommended at $80,000 annually, indexed to CPI).
3. The unreduced normal retirement eligibility requirement would be increased to age 65 with 5 years of service or the rule of 90 (when age plus years of service equal or exceed the sum of 90) to better align with national retirement system reforms and increasing longevity.
4. If the employer’s contribution exceeds 4% of payroll or if unfunded liabilities exceed an established target level, then specified cost controls would be implemented prospectively (and

Executive Summary
Page | 8
not affect previous accruals) until the target contribution level and target level of unfunded liabilities are achieved. Cost controls, in the order of their implementation, would include: transferring funds from a Contribution Fluctuation Reserve established in the DB plan; reducing cost of living increases; shifting a portion of employer contributions into the DB plan instead of planned allocation to the DC plan; increasing employee contributions by 1%; reducing the annual benefit accrual to active members; and, if necessary, freezing future accrual of service credit.
5. All state employees and teachers would be required to contribute 5% of payroll to the DB component consistent with national trends, creating more balanced cost-sharing. The State’s projected contribution to this DB component would be targeted at 4% of payroll, with additional employer contributions planned for the DC component as outlined below.
DC Component
1. Employees would be automatically enrolled in the DC plan with an employee contribution of 2% of salary to encourage greater individual retirement savings, although employees would have the ability to “opt out” of making contributions.
2. The State would contribute an additional target employer contribution of 5% to the DC account. These employer contributions would vest immediately.
3. All or a part of the employer DC contribution could be diverted prospectively to the DB plan if the actuarial employer contribution for the DB plan grows in excess of a targeted 4% of payroll, with a maximum employer contribution set at 9%, thereby limiting cost risk for the taxpayers.
Through the adoption of such changes, Tennessee can maintain its strong position of managing one of the healthiest retirement systems in the nation, continue to provide a competitive and dignified benefit for career public employees, and manage its exposure to market risk, actuarial risk and unfunded liabilities.
TCRS Overview

TCRS Overview
Page | 10
The Tennessee Consolidated Retirement System (TCRS) consists of state employees, K-12 teachers and most higher education employees. The TCRS also includes employees of 488 political subdivisions and instrumentalities that have elected to participate in the consolidated system. As of June 30, 2012 there were 210,493 active members participating in the TCRS – comprised of 73,449 teachers, 58,864 state employees and judges, and 78,180 members enrolled through participating political subdivisions.1 In addition to these active members, as of June 30, 2012, the system had 122,499 beneficiaries on the retirement rolls. 2 The annual retired payroll as of that date was $1.76 billion. It is estimated that approximately 92% of the retired payroll or approximately $1.63 billion is paid to Tennessee residents. A table showing the retired payroll amount by county is included in Appendix F. For most TCRS participants – including state employees and teachers – the plan provides a defined benefit (DB) pension at retirement when eligibility criteria are met. Under such a DB structure, retirement systems will typically set aside assets to provide for future payments, funding the plan on an actuarial basis determined to be sound for ensuring long-term sustainability. Higher education employees are eligible to elect to participate in either the defined benefit pension plan or in an alternate 401(a) defined contribution plan, known as the Optional Retirement Program (ORP). As of the most recent TCRS actuarial valuation on July 1, 2011, the state employee and teacher plans were 92.1% funded in the aggregate. Across its different employee groups, TCRS was 88.3% funded for state employees, 94.7% funded for teachers, and 89.2% funded across participating political subdivisions. Compared to many pension systems nationally, this represents a relatively sound position. Although such comparisons are somewhat imprecise given differences in actuarial methods and assumptions, Tennessee’s 92.1% funded ratio is substantially ahead of the 75.8%3 average ratio among the largest public retirement systems nationally. The Pew Center on the States, which has conducted several evaluations of state pension systems, recently ranked Tennessee as a “solid performer” with respect to its current pension funding practices, a distinction received by only 10 other states.4 This comparatively healthy funding ratio relative to other state retirement systems largely reflects Tennessee’s conservative financial practices and prudent funding policies evidenced by the fact that every Governor and General Assembly since 1972 have fully funded the annual Actuarial Required Contribution (ARC). Nonetheless, the severe and prolonged deterioration of U.S. and international markets in the 2000’s, the continuing low earnings environment in sectors of the investment markets, combined with the pressures of an aging population and retirement of the “baby boomer” generation, have created a significant, underfunded TCRS obligation: On an actuarial basis:
1. As of 2011, the State’s unfunded actuarial accrued liability (UAAL) was approximately $1.55 billion for state employees.
2. The UAAL for teachers would add an additional $1.03 billion in unfunded obligations.
3. The UAAL for political subdivisions adds $799.1 million in unfunded obligations. 5 1 TCRS, Comprehensive Annual Financial Report, June 30, 2012. 2 Ibid. 3 The Public Fund Survey, Summary of Findings for FY 2011, November 2012. 4 The Pew Center on the States, The Widening Gap Update, June 2012. 5 TCRS, Actuarial Valuation Report, July 1, 2011.
TCRS Overview
Page | 11
On an actuarial basis, total TCRS unfunded liabilities as of July 1, 2011 are $3.38 billion for the entire plan. On a market value basis:
1. As of 2011, the State’s unfunded actuarial accrued liability (UAAL) was approximately $2.52 billion for state employees.
2. The UAAL for teachers was $2.55 billion in unfunded obligations
3. The UAAL for political subdivisions adds $1.34 billion in unfunded obligations.6
On a market value basis, total TCRS unfunded liabilities as of July 1, 2011 are $6.41 billion for the entire plan. Relative to a total state operating budget of $32.3 billion7 in FY2013 (comprised of approximately $14.2 billion in state tax revenue, $13.1 billion in federal funds, and $5.0 billion from other sources), the magnitude of these unfunded TCRS pension liabilities clearly merits concern and attention. Over the ten year period measured from FY2003 through FY2012, addressing these funding challenges has required rapidly growing public employer contributions. Over this ten year period, employer contributions to the TCRS nearly tripled, increasing from $264.3 million to $731.4 million for state employees, teachers, and higher education employees.8 The State’s contributions as a percent of payroll follow a similar trajectory measured over this same ten year time period. From FY2003 to FY2012, the State’s contributions increased from 7.3% of payroll in FY2003 to 15.03% in FY2012 for state and higher education employees. For teachers, the total employer cost as a percentage of payroll also increased substantially, rising from 3.4% in FY2003 to 8.88% in FY2012.9 The increase in employer contributions can be largely attributed to the low earnings environment occurring this century, with fixed income earnings at historical lows and two significant declines in the equities market. During 2009, domestic stocks lost nearly 30% of their value and international stocks lost more than 40%. The TCRS continues to be negatively impacted by annual earnings below the actuarial assumed return of 7.5% on a 15 year rolling average basis since 2008. This trend continued for the fiscal year ended June 30, 2012 with an annual investment return of 5.6% as shown in the following table. The 2012 return added an estimated additional $203 million for state employees and $320 million for teachers – $523 million in total – to the actuarial unfunded liabilities of the Plan.
6 TCRS, Actuarial Valuation Report, July 1, 2011. 7 State of Tennessee, FY2012-2013 Annual Budget, January 2012. 8 TCRS, Comprehensive Annual Financial Report, June 30, 2012. 9 Ibid.

TCRS Overview
Page | 12
If the recent low earnings environment continues for a number of years, the impact on future employer contribution rate is reflected in the following chart:
The Tennessee Treasury Department has attempted to mitigate the impact of the low earnings environment in the financial markets by diversifying the TCRS portfolio into higher yielding asset classes such as international emerging markets, expansion of the real estate portfolio, expanding private equity investments, and beginning a securities lending program. The employer contribution rates in TCRS are determined using a 7.5% actuarial earnings assumption. Lowering the earnings assumption from 7.5% to 7.25% will substantially increase both employer costs
8.9% 9.1% 8.7% 8.4% 8.4% 8.3%
7.2%
6.0% 5.9% 6.3%
5.6%
0.0%
1.0%
2.0%
3.0%
4.0%
5.0%
6.0%
7.0%
8.0%
9.0%
10.0%
2002 2003 2004 2005 2006 2007 2008 2009 2010 2011 2012
TCRS Rolling 15-Year Annual Returns
15.1% 15.5% 16.0% 16.5% 15.5% 14.5% 14.0%
10.6% 10.6% 10.3% 10.2%
0%
5%
10%
15%
20%
25%
2011 2013 2015 2017 2019 2021 2023 2025 2027 2029 2031
TCRS - Contribution Rate Projections for State Employees Current Plan Design - Level ($) USL Amortization with Periodic Reset
Data and Assets as of June 30, 2011
5.0% Future Returns7.5% Future Returns10.0% Future Returns
Source: Tennessee Treasury Department (Data through June 30, 2012)
Source: TCRS Actuary, Bryan, Pendleton, Swats & McAllister, LLC

TCRS Overview
Page | 13
and plan liabilities. In recent years, some pension systems nationally have lowered assumed earnings rates in recognition of the low earnings environment. Prior to making such adjustments, many of these plans historically used less conservative, higher investment return assumptions than already in place with the TCRS. Improvements in life expectancy beyond past actuarial assumptions have also contributed to growth in unfunded actuarial liabilities in many pension systems nationally. While such increasing longevity is a positive development overall, it does lead to more years of benefit payments – with significantly higher long-term costs – than historically projected. From 1970 to 2011, U.S. life expectancy at birth increased by nearly eight (8) years from 70.8 to 78.7, and life expectancy at age 65 increased by more than four (4) years from 80.2 to 84.2 years.10
The TCRS funding challenges currently faced by the State will soon be brought into sharper focus by recent actions of the Governmental Accounting Standards Board (GASB). In June 2012, GASB adopted two statements, GASB 67 and GASB 68, intended to improve the accounting and financial reporting of state and local government pension plans.11 According to GASB, these new standards were designed to increase the transparency and comparability of pension reporting data across jurisdictions, resulting in a more complete representation of the full magnitude of pension liabilities. As a result of these changes, beginning in Fiscal Year 2015, Tennessee will be required to include the State’s net pension liability as an entry in the liabilities section of the state’s Consolidated Annual Financial Report (CAFR). Current accounting standards require that governments only report their unfunded liabilities as footnotes in financial statements. Based on the TCRS actuarial valuation as of July 1, 2011, had the new GASB standards already been in effect, the State’s net pension liability would have added an estimated $1.74 billion to Tennessee’s reported CAFR liabilities. As of July 1, 2011, the aggregate State general obligation bond/commercial paper liabilities without the net pension liability were $1.89 billion. Accordingly, the GASB requirement to include net pension liability on the balance sheet, if applied at July 1, 2011, would have nearly doubled the long term liabilities of Tennessee shown on its balance sheet – with an increase of 92%. It is anticipated that GASB will require unfunded Other Post Employment Benefit (OPEB) liabilities, primarily associated with retiree healthcare, to be recorded in a similar manner as pension unfunded liabilities in the future, although no formal, new OPEB standards have yet been released. The new GASB standards will also apply to local governments beginning in Fiscal Year 2015. As of July 1, 2011, the aggregate estimated amount TCRS participants would record was approximately $800 million for local government plans and an additional $1.42 billion for Local Education Agency portions of the teacher plan. Credit rating agencies, including both Moody’s Investors Service and Standard & Poor’s, have also taken steps to standardize pension reporting across jurisdictions in response to the increasing pressure placed on state and local government finances due to growing retiree benefit costs. In July 2012, for example, Moody’s issued a request for comment regarding a proposed change to their pension evaluation methodology entitled Adjustment to US State and Local Government Reported Pension Data. The proposed adjustments included, among multiple modifications, that pension liabilities would be compared based on the market value of assets rather than the actuarial value of assets, and that 10 Centers for Disease Control and Prevention, National Center for Health Statistics, Preliminary Data for 2011, October 2012. 11 GASB 67 and 68, “Financial Reporting for Pension Plans” and “Accounting and Financial Reporting for Pensions”, June 2012.

TCRS Overview
Page | 14
liabilities would be calculated using a high-grade long-term corporate bond index discount rate rather than the pension plan’s long-term investment assumption. The result would be that Moody’s would determine and report pension liabilities at a level that would be significantly greater than reflected in most pension plan actuarial reports and financial statements. While the impacts of these changes are not expected to result in widespread downgrades across the state and local government sector, they likely will lead to added pressures from the investment community and the general public. Currently, Tennessee’s General Obligation debt is rated Aaa (highest rating available) with a stable outlook by Moody’s, AAA by Fitch, and AA+ by Standard and Poor’s.12 Maintaining these strong ratings is important in order to ensure continued access to the capital markets at affordable rates. The importance for the State to address pension funding pressures over the long-term is enhanced by the added focus that credit rating agencies will be placing on pension obligations. The major features of the TCRS retirement plans for current state employees and teachers are summarized in the table below. It should be noted that TCRS members also participate in the federal Social Security program, such that these benefits are in addition to those afforded under Social Security.
State employees and Teachers (Group I)
Law Enforcement (Group I)
Judges (Group IV)
Higher Education (ORP)
Employee Contribution*
State employees: 0% Teachers: 5% 0% 0.5% up to SSWB
2% above SSWB 0%
Vesting 5 years 5 years 8 years Immediate
Normal Retirement Eligibility
Age 60 w/ 5 YOS or 30 Years of Service (YOS)
at any age
Age 55 w/ 25 YOS or age 60
Age 60 w/ 8 YOS or age 55 with 24 YOS
Not applicable as the ORP is a defined contribution plan
Average Final Compensation (AFC)
5 highest consecutive years
5 highest consecutive years
5 highest consecutive years Not applicable
Benefit Formula*
1.575% of AFC up to the SSIL x YOS plus 1.8375% of AFC in excess of the SSIL x
YOS
1.575% of AFC up to the SSIL x YOS plus 1.8375% of AFC in excess of the SSIL x
YOS In addition, a bridge benefit of 0.75% of AFC x YOS as Public Safety Officer until
reaching age 62
2.5% of AFC x YOS
Final account balance depends on investment
performance
Employer contributes 10% up to SSWB; 11%
above the SSWB
*SSWB = Social Security Wage Base ($110,100 in 2012) *SSIL = Social Security Integration Level ($61,800 in 2012)
In addition to a TCRS pension, employees of the State of Tennessee are eligible to participate on a voluntary basis in two tax-deferred retirement plans, specifically a 457 and a 401(k) plan. These investment vehicles allow state employees to accumulate personal savings on a tax-deferred basis up to the annual limitations established by the Internal Revenue Code as a supplement to their defined benefit. Tennessee provides a matching contribution up to $50 per month ($600 annually) for those
12 Most recent ratings available by Moody’s Investor Services, Standard & Poor’s Rating Services, and Fitch Ratings.
TCRS Overview
Page | 15
employees who enroll in the optional 401(k). Both the 457 and 401(k) provide employees access to a number of managed and index-based investment funds including target retirement date funds and a Self-Directed Brokerage Account (SDBA). The State of Tennessee, through the Department of Finance and Administration, also offers retirees other post-employment benefits (OPEB), including a subsidized retiree medical program. In an effort to address ongoing pension funding challenges, Tennessee adopted substantial reforms in 2012 for TCRS participating political subdivisions. These non-compulsory reforms provided local governments the flexibility to craft a retirement plan that was affordable, sustainable, and provided retirees with a sufficient income in retirement. These reforms did not apply to state employees, K-12 teachers, or higher education employees. Under the law, local governments were allowed to remain in their current plan or to select from two new plan options that include some element of a DB plan. All of these plans also include provisions to retain the authority to modify benefits, employee contributions, and other plan terms on a prospective basis for employees hired after July 1, 2012. In addition, local governments were provided the alternative to elect to participate in the defined contribution plans of the State under legislation that was adopted in 2010. Thus, the four options available for local governments include:
1. Contributory Defined Benefit (original plan): Local governments were given the option of requiring new hires to contribute 0%, 2.5%, or 5.0% of pay to the plan. In addition, local governments were able to select a plan with and without a post-retirement cost-of-living adjustment (COLA).
2. Modified Defined Benefit Option: In addition to the features included in the contributory option above, local governments were able to reduce the benefit multiplier from 1.575% to 1.4%, increase the normal retirement eligibility from age 60 or 30 years of service to age 65 or the rule of 90 (achieved when age + YOS equal 90), and cap the annual pension benefit at $80,000 per year.
3. Hybrid Defined Benefit/Defined Contribution Option: Local governments were also given the ability to offer new hires a hybrid plan that combined elements of a defined benefit plan with a lower benefit multiplier (1%) plus a defined contribution account. Local governments were given the option of using the State’s 401(k) plan or procuring a DC plan from other third party sources of their choice. Employers were limited to making a 7% contribution to the DC account.
4. Defined Contribution Option: Under this option, local governments were given the ability to provide their employees with a defined contribution plan as a primary retirement vehicle. This plan granted local governments the flexibility to design any benefit and contribution level they deemed appropriate (subject to IRS limitations).Local governments may participate in the state’s DC plan or use a plan from a third party.
As the next step in ensuring the stability and affordability of the TCRS, this report focuses on options for benefit reform for state employees.
National Trends and Benchmarks

National Trends and Benchmarks
Page | 17
According to data published by the National Conference of State Legislatures (NCSL), 45 of 50 states enacted significant pension reforms for broad groups of state employees in an effort to address long-term funding pressures from 2009 through 2012 alone, and many of these states made changes to pension plans in more than one year. See the illustration on this page. Tennessee is one of only 5 states that did not enact significant pension reforms for state employees and/or teachers during this period. While Tennessee did not implement pension reform during this time period for state employees, it did enact substantial optional reforms for participating political subdivisions as outlined earlier in this report. Other states, such as Alaska and Kentucky, enacted pension reforms in years prior to those tabulated by the NCSL. Alaska, for example, established a defined contribution plan for its employees in 2005, while Kentucky made changes to its COLA provision in 2004 and benefit multipliers for new hires in 2008.13 In the wake of the Great Recession many states enacted the practical pension reforms that were easiest to achieve and provided the greatest short-term budgetary relief. One of the most common changes among state systems was to increase employee contributions. A report issued by the National Association of State Retirement Administrators (NASRA) found that a majority of states increased the required employee contribution from 2009 through 2012. Data published by NASRA found that almost all state employees today are required to share in the cost of their defined benefit pension plan14, a statistic that is highly consistent with the findings derived from PFM’s Survey of State Retirement Systems. Other common changes include eliminating post-retirement COLAs, reducing benefit multipliers, and increasing retirement eligibility requirements for new hires. From 2009 through 2012:
1. 30 states increased employee contributions; 2. 31 states increased the age and/or service requirements for normal retirement; 3. 21 states made changes to post-retirement cost-of-living adjustments; and, 4. 15 states reduced benefit multipliers.15
Current Employees Even among historical benefit tiers, it is common for state employees to contribute toward their retirement benefit. Based on PFM’s review of state retirement systems, only five (5) states were
13 Pew Center on the States, Kentucky’s Pension Challenge: Opportunities for Real Reform, August 2012. 14 NASRA Issue Brief, Employee Contributions to Public Pension Funds, January 2013 15 Data compiled by PFM from various sources published by the National Conference of State Legislatures for state civilian employees and teachers. [http://www.ncsl.org]

National Trends and Benchmarks
Page | 18
identified as having a large group of current state employees (likely to still be in active employment) hired into still-existing tiers that do not require employee contributions.
• Arkansas: Employees hired prior to 6/30/2005 are not required to contribute toward their defined benefit pension.
• Missouri: Employees hired prior to 1/1/2011 are not required to contribute toward their defined benefit pension.
• New York: Tier III and IV employees (hired 7/1976 – 12/2009) are required to contribute 3% for 10 years, then 0% thereafter.
• Oregon: Employees hired prior 8/28/2003 enrolled in the Tier 1/Tier 2 defined benefit plan are not required to contribute toward their pension.
• Utah: Employees hired prior to 7/1/2011 participate in the State’s closed defined benefit plan (Tier 1), and are not required to contribute.
Many states have enacted reforms to increase or require for the first time employees to contribute toward the cost of their benefit. Of the 30 states identified as increasing or establishing employee contributions for state civilian employees and teachers in recent years, 23 states applied the increase to current employees as well as new hires. The remaining seven (7) states increased contributions for new hires only, effectively creating a separate contributory tier.
Several states in recent years have moved toward providing a hybrid retirement plan, which combines elements of a reduced pension with a defined contribution account. As of July 1, 2012, there were a total of nine states offering a hybrid DB-DC plan (mandatory or optional) to broad groups of public employees, including Georgia, Michigan (teachers), Rhode Island, Utah, and Virginia (prospectively).16 In 2012, both Kansas and Louisiana adopted legislation to move new hires into cash balance plans (with future effective dates), a unique type of hybrid further detailed later within this report. This trend of reform is expected to continue into 2013 and beyond as governments contend with retiree cost benefit pressures. For example, the neighboring State of Kentucky is actively considering a comprehensive mix of reforms, and state legislators in Illinois recently introduced HB 6258 to be considered in 2013 that would make substantial reforms to the Teachers’ Retirement System.
16 Virginia’s hybrid DB-DC plan is effective for employees hired after 1/1/2014 (included in total).

National Trends and Benchmarks
Page | 19
Benchmark Findings As part of assessing the potential for TCRS reform, Public Financial Management compared the current major plan design features of the 50 state retirement systems and the District of Columbia. All data captured was as of July 1, 2012, unless otherwise noted. In the U.S. private industry, according to the Bureau of Labor Statistics, the percentage of full-time workers in medium and large private establishments participating in traditional defined benefit pensions has decreased steadily over the past quarter century from 63% in 1988 to 28% in 2012 as shown in the chart below. Many of those employees with continued coverage are now in frozen DB plans.17
A 2012 report by Towers Watson found that a majority of Fortune 100 companies offer their employees a defined contribution plan only, and that 19 of the Fortune 100 companies offer a hybrid plan (typically, cash balance). From 1985 through today, the number of Fortune 100 companies offering their employees a traditional defined benefit pension plan decreased from 89 to 11.18 The following summary, along with more detailed information included in the Appendices, was derived primarily from documents published on retirement system websites. PFM gathered and reviewed key pension plan documents, such as comprehensive annual financial reports, actuarial valuation reports, statutes, and employee handbooks. Where information was unavailable or unclear, PFM sought clarification from state retirement system administrators and staff via telephone and/or e-mail. Many of the retirement systems included in the analysis have multiple benefit tiers based on an employee’s date of hire. Where multiple tiers are present, PFM captured the plan design offered to new hires. As such, the data may not reflect the retirement plan available to the largest group of employees at the time of this report, but it does reflect any recent reforms and each state’s current approach going forward. Highlights of recent state-level retirement system reforms are included in Appendix E for reference.
17 U.S. Bureau of Labor Statistics, Employee Benefits Survey, 1988-2012. 18Towers Watson, Retirement Plan Types of Fortune 100 Companies in 2012, October 2012.
63% 56%
50%
33% 30% 28%
0%
10%
20%
30%
40%
50%
60%
70%
1988 1993 1997 2000 2010 2012
% of Private Industry Employees Participating in Defined Benefit Pension Plans, 1988-2012
National Trends and Benchmarks
Page | 20
At a high level, the following are key findings from this benchmarking research:
1. Most states, like Tennessee, continue to offer a DB plan as their primary option for state employees. As of July 1, 2012, 42 of the 51 systems (including Tennessee) surveyed provided a DB plan as a primary retirement option for state employees.
2. Among such DB plans, the TCRS is the only plan that requires no employee contribution for newly hired participating state employees (teachers participating in TCRS already contribute 5%).
3. The TCRS normal retirement eligibility criteria are also somewhat more generous than other state retirement systems. Tennessee currently allows state employees to retire at age 60 with 5 years of service or at any age with 30 years of service. Many jurisdictions have increased retirement ages to closer align with Social Security Normal Retirement Age. It is common to see ages 62, 65, 67, or “Rule of” requirements in other states.
4. Tennessee does have a more conservative, lower benefit multiplier. Of the 35 systems that participate in Social Security (excluding Tennessee), 17 have benefit multipliers of 2% or greater for state employees, while 18 have multipliers that are less than 2% assuming the normal retirement criteria is met, but greater than Tennessee’s 1.575% rate.
5. The TCRS vesting period, basis for average final compensation, and cost-of-living adjustment provisions are generally aligned with the benefits offered in other state retirement systems, although practices vary widely.
To compare the plan features on a consistent basis with the TCRS, the benchmarking summary that follows focuses on comparisons to other state systems that provide a defined benefit pension plan as a primary retirement vehicle (either optional or mandatory). For states that offer a hybrid DB-DC, cash balance, or a defined contribution plan as a primary benefit, summaries of the major plan features are included in Appendices B, C, and D respectively. In this section of the report, the findings shown reflect the plan available for state employees. In some cases, as in Tennessee, plans for teachers covered under state retirement systems may vary somewhat in structure – and benefits for law enforcement and the judiciary are typically also distinct, given the unique characteristics of such careers. General summaries and detailed comparison charts for teacher, law enforcement, and judicial plans may be found in Appendix A. While the benchmarking data to follow allows one to compare the individual features of defined benefit plans across jurisdictions, one must also consider the interplay of these features and the overall resulting benefit. For Tennessee, the total retirement benefit also includes a voluntary defined contribution plan with limited employer match. The diversity of the defined benefit plan designs offered by state retirement systems and the number of retirement formulas adds to the complexity of these comparisons. Of the 42 states found to offer their own state employees a defined benefit pension plan on an optional or mandatory basis, Tennessee was the only state without a requirement for new employees to contribute toward the cost of their benefit. The average employee contribution was 6.1% of payroll among other defined benefit plans for employees that participate in Social Security, such as Tennessee state and higher education employees and K-12 teachers (employee contributions averaged 9.5% of payroll among those without Social Security).

National Trends and Benchmarks
Page | 21
Across other major provisions, the benefits provided by TCRS are generally consistent with state systems nationally, although other systems have tended to increase retirement ages in recent years, while the TCRS has not yet taken this step. Comparing benefit multipliers can be imprecise as there may be several components to the actual calculation. Tennessee, for example, uses a dual-multiplier for earnings above and below the Social Security Integration Level. Many other states also use more than one multiplier to determine the benefit level at retirement.
Tennessee Benchmarking Results (excluding TN)
Employee Contributions 0% 6.1% average (w/Social Security)
9.5% average (w/o Social Security)
Vesting 5 years <5 years: 3 of 41 systems (7.1%)
5 years: 19 of 41 systems (46.3%) >5 years: 19 of 41 systems (46.3%)
Normal Retirement Eligibility (Age/YOS)
60/5; any/30
Given multiple and diverse retirement eligibility criteria averaging is imprecise. In recent years, many jurisdictions have increased
retirement ages to closer align with Social Security Normal Retirement Age. It is common to see ages 62, 65, or 67 or “Rule
of” requirements in other systems.
Benefit Formula
1.575% of AFC up to the SSIL x YOS + 1.8375% of
AFC in excess of the SSIL x YOS
Given multiple and diverse benefit formulas averaging is imprecise. Of the 35 systems that participate in Social Security, 17 have
benefit multipliers of 2% or greater for state employees, while 18 have multipliers that are less than 2%.
Average Final Compensation (AFC)
5 years <5 years: 21 of 42 systems (51.2%) 5 years: 18 of 42 systems (43.9%) >5 years: 2 of 42 systems (4.9%)
COLA Provision Linked to CPI; 3% maximum
23 of 41 systems provide automatic COLAs, many that are linked to CPI and/or capped. Others provide COLAs on an ad hoc basis.
Some systems in recent years have suspended COLAs until attainment of a target funding level.
As noted previously, PFM excluded states for the preceding summary that do not offer a defined benefit pension as a primary retirement vehicle from these general benchmarking summaries, as variations in plan design structures would have skewed the results. Highlights of these alternative plan designs, however, are summarized in the Appendix. At the same time, PFM’s analysis did include those plans that have an optional defined benefit plan – even if employees may elect to participate in some other plan type altogether. Public employees generally elect to participate in a defined benefit retirement plan when more than one plan type is available, as shown in the table below for general state employees.

National Trends and Benchmarks
Page | 22
Optional Plans - New Hire Elections in CY201019 DB Plan DC Plan Hybrid
Colorado PERA 88% 12% -- Florida RS 75% 25% -- Montana PERA 97% 3% -- North Dakota PERS 98% 2% -- Ohio PERS 95% 4% 1% South Carolina RS 82% 18% --
Accordingly, employers should consider the extent to which the availability of a defined benefit plan contributes to a potential hire’s interest in a career in public service, and whether or not elimination of that benefit will hinder recruitment efforts. Of note, the answer to this question may vary across different occupational categories (e.g., law enforcement vs. general government, for which the prevailing practices among competing employers may vary) and also across generational cohorts, as further outlined in the subsequent section of this report.
19 Olleman, Mark and Ilana Boivie. Decisions, Decisions: Retirement Plan Choices for Public Employees and Employers, National Institute on Retirement Security/Milliman, Inc., September 2011

TCRS Reform Options

TCRS Reform Options
Page | 24
PFM participated in a series of working sessions with State Treasurer David Lillard and senior staff in 2012 in an effort to redesign the retirement benefits available through the TCRS for new employees in Tennessee. The primary discussions focused on those reform options that could be introduced for new employees only. In evaluating reform options, the team was guided by several key goals and objectives identified by the State Treasurer and staff. These goals included:
1. The new plan benefit provisions would apply to new hires only after a specified future date, and would not affect retirees. Thus, state employees and teachers currently on the payroll and those already retired would not be affected;
2. The plan should provide state employees and teachers a sufficient and sustainable benefit for a dignified retirement through a combination of TCRS benefits (both DB and DC plans), social security, and personal savings;
3. Long-term solvency of the retirement system must be ensured so that current retirees and future retirees can rely on secure retirement benefits; and,
4. The new benefit should control costs and reduce the employer’s exposure to risk and unfunded liabilities, in order to sustain TCRS employer contributions at affordable levels for the State and its taxpayers.
In the context of these goals, PFM was tasked with helping to assess and analyze a number of alternative approaches to the redesign of the benefit provisions offered state employees through the TCRS. Within this process, PFM identified a range of options for the State of Tennessee’s consideration, analyzed the pros and cons of plan design alternatives, and assessed the potential that each would have on the overall goals and objectives outlined above. The major reform approaches considered included:
1. Modifying key provisions of the current defined benefit pension plan;
2. Creating a pure defined contribution plan; or,
3. Creating a hybrid DB-DC plan. For each of these reform options, short-term savings are projected to be nominal, as the impact of plan redesign will in the initial years apply to relatively few newly hired employees. Savings will emerge incrementally, however, as more employees are hired into new plan designs that are structured to have lower employer costs. While a meaningful reduction in the State’s unfunded pension liabilities will take time to achieve, reform of future retirement benefits is critical for ensuring the system’s long-range sustainability for retirees and the State. Modified Defined Benefit Pension Under this reform option, the State would modify the current defined benefit pension plan for new employees. Potential reforms under this approach could include, but would not be limited to increasing employee contributions, raising retirement eligibility ages, reducing benefit multipliers, suspending or eliminating post-retirement COLAs, and other modifications as deemed necessary for new hires.
TCRS Reform Options
Page | 25
There would be minimal transition issues with establishing a modified defined benefit pension plan for new employees. In general, the system would add an additional benefit tier, one for current employees and another for employees hired after the effective date of the enabling legislation. While this approach would help to reduce the State’s normal cost for new hires, the State would maintain substantial exposure to investment and other actuarial risks. With a modified defined benefit plan, the potential exists for the system to develop unfunded liabilities notwithstanding the benefit modifications. In turn, these unfunded liabilities could add to the State’s long-term burdens from both a credit rating and balance sheet perspective. Positive Factors:
1. Establishment of a cost share for non-contributory state employees as part of DB modifications would improve the overall affordability of the pension benefit and give employees a “stake” in the system.
2. Defined benefit pension plans may contribute to favorable recruitment and retention of employees, particularly when the State is competing against other public employers with similar plans.
3. There would be minimal administrative burdens on the State if reform is limited to adjusting the existing defined benefit plan, and the overall complexity of the benefit plan for employees would also remain consistent with the status quo.
Negative Factors:
1. Investment and actuarial risk stays entirely with the employer.
2. Unfunded liabilities, which GASB will require to be included as a liability on the State’s balance sheet by Fiscal Year 2015, will likely remain at elevated levels.
3. Even with employee contributions and modified benefits, continued reliance on a DB plan will risk further growth in long-term employer costs and the potential for unfunded liabilities, with inherent volatility in funding requirements.
Defined Contribution Plan Only three of the surveyed jurisdictions – Alaska, Michigan, and Washington, DC – require state civilian employees to participate in a defined contribution plan. Several other states offer an optional defined contribution plan (Colorado, Florida, Montana, North Dakota, Ohio, South Carolina, and Utah), although they tend to have lower take-up rates. Two states, Nebraska and West Virginia, actually moved away from providing a defined contribution plan in recent years to state employees and teachers respectively (see “Case Study” for additional detail on this shift away from DC retirement plans). Positive Factors:
1. A defined contribution plan would stabilize the State’s cost for new hires as a fixed percentage of salary with the potential for slight variations based on how the employer matching contributions are structured, if any.
TCRS Reform Options
Page | 26
2. A defined contribution plan will eliminate all investment risk for the employer, shifting the entire burden to employees. A pure defined contribution plan, by definition, eliminates the accrual of unfunded liabilities for new hires, although the State would still face sizable liabilities associated with its closed defined benefit plan.
3. The portability feature of defined contribution plans may enhance the attractiveness of a career in state service for some potential employees, although the impact of this feature is likely to vary across different employee groups. For Millennial workers who may have non-traditional employment patterns (i.e., shorter-tenures across more employers), this benefit may be particularly attractive at the time of recruitment. Another area where a defined contribution or hybrid plan may be beneficial is with the recruiting of mid-career professionals with specific skill sets. In some situations, a defined contribution or hybrid plan may also be attractive to recruits with specialized skills who are recruited to public service, but do not anticipate devoting the balance of their career to this endeavor.
4. Administrative burdens on the State to administer a pure DC plan would likely be manageable, as the voluntary DC plan and record-keeper are already in place.
Negative Factors:
1. While the portability of a DC plan may be attractive for some employees during recruitment, this same characteristic may also weaken the incentive for retention relative to a traditional DB plan. In a 2012 report on Retirement Plan Changes and Employer Motivations, Towers Watson found that 42.1% of companies that continue to offer defined benefit plans cite that such plans are “beneficial for retention of valuable current employees” as a top reason for offering such a benefit, the most frequent rationale cited.
2. A defined contribution plan has a finite, yet unknown time horizon for each plan participant. As a result, timing and investment environment will drive decisions good or bad. These decisions may have an impact on the predictability of the benefit available for employees in retirement.
It has been the experience of the optional Tennessee Deferred Compensation Plan that most participants do not generally change their investment options nor do they actively manage their investment accounts.
3. Members in a DC plan, many of whom have little experience in the market, will be faced with the challenging task of directing their own investments. In simple terms, a defined contribution plan participant’s benefit is determined by the level of contributions made (employee and employer) and the rate of return on investments. The rate of return is a factor of overall market performance and the employee’s selected asset allocation and investment strategy. Multiple studies indicate that employees directing their own investments often earn lower rates of return than professionally managed defined benefit plans.
a. An April 2011 report by Towers Watson found that the asset-weighted median rates of return in defined benefit plans outperformed defined contribution plans by an average of 1.03% as measured from 1995 through 2008.
b. Larger defined benefit plans outperformed 401(k) counterparts by an even greater amount – 1.27% as measured from 1995 through 2008.
TCRS Reform Options
Page | 27
c. In 2008 (the most recent single year available), although both defined benefit and defined contribution plans experienced significant declines in total assets, defined benefit plans outperformed defined contribution plans by 2.68%, highlighting the ability of defined benefit plans to better withstand a bear market.20
d. While the State can structure a defined contribution plan to partially insulate members from the impact of poor investment decisions (e.g., by limiting the number of investment options, restricting the amount of assets that may be deposited into a self-directed brokerage account, and/or by monitoring the costs and fees associated with investment options), the State will nonetheless need to commit more resources to educational programs to ensure an appropriate level of member understanding.
4. Losses in individual accounts, as experienced during the most recent recession, may substantially reduce the benefit available for employees nearing retirement and/or alter normal retirement patterns – creating individual hardships and, in some cases, creating pressure on the employer to provide relief.
5. Mutual funds and other investment options commonly found in 401(k) plans assess fees that can vary by the type of investment and whether or not the accounts are actively managed or index based. Professionally managed assets in a defined benefit plan are pooled and, as such, tend to have lower administrative and investment costs, resulting in higher net returns.21 The cost of investment management of the TCRS defined benefit plan is less than 10 basis points22 which is extremely favorable relative to the cost of typical mutual fund investment expense.
20 Towers Watson, Defined Benefit vs. 401(k) Investment Returns: The 2006-2008 Update, December 2009 21 NASRA Issue Brief: State Hybrid Retirement Plans. November 2011 22 Tennessee Treasury Department
Case Study: Nebraska and West Virginia Shift Away From Defined Contribution Plans
Two states, Nebraska and West Virginia, have moved away from offering defined contribution plans in recent years. Both states cited the investment performance of its members as a key factor in making the switch. • In 2003, the State of Nebraska moved all state civilian employees from a defined
contribution retirement plan into a cash balance hybrid after studies conducted by the retirement system’s actuary determined that the defined contribution plan did not on average provide a sufficient income replacement ratio in retirement.
• Teachers in West Virginia hired from 1991 to 2005 were only eligible for a defined contribution plan. In 2005, the State re-opened the defined benefit plan to new hires and closed the defined contribution plan. At various times over the years, the State has given West Virginia teachers in the defined contribution plan the option of moving back into the defined benefit plan. As of July 1, 2011, just 11% of active teachers continue to participate in the defined contribution plan.
TCRS Reform Options
Page | 28
Hybrid Retirement Plan Several states in recent years have moved toward providing a hybrid retirement plan, a shift away from the traditional defined benefit pension that has been the historical norm. Under this alternative approach, the retirement benefit combines elements of a reduced defined benefit (DB) pension with an individually directed defined contribution account. As of July 1, 2012, there were a total of nine states offering a hybrid DB-DC plan (mandatory or optional) to broad groups of public employees, including Georgia, Michigan (teachers), Rhode Island, Utah, and Virginia (prospectively).23 Federal government employees also have access to a hybrid type retirement benefit. Under the federal model, employees are eligible for a pension with a benefit multiplier ranging from 1.0% to 1.1% (varying by years of service) and are automatically enrolled in the Thrift Savings Plan, a type of defined contribution account with an employer match. As part of the 2012 optional reforms for local governments in Tennessee, the TCRS also now offers participating political subdivisions a hybrid retirement plan. This plan, which closely mirrors those available to employees in other states with hybrid DB-DC plans, provides a 1.0% benefit multiplier and gives the employer flexibility to craft a defined contribution component tailored to their needs. Additional plan design details for each of the surveyed systems with a hybrid DB-DC plan are included in Appendix B. One of the greatest strengths of a hybrid plan is simply that it balances the inherent advantages and weaknesses of pure DB and DC plans. With a hybrid plan, an employer is able to combine the favorable elements of each plan design, manage to an acceptable level of cost uncertainty, and rebalance the distribution of investment risk. Positive Factors:
1. The DB component gives the employer the ability to invest a portion of total funds over a longer horizon (greater than any one individual can invest in a DC account), taking advantage of more investment options, increased buying power, and potential for greater returns, while continuing to provide a base level of income in retirement that is guaranteed and less susceptible to market conditions.
2. The DC component incudes the employee in sharing investment risk, while providing individuals with the option to control their asset portfolio according to their own risk appetite and investment preferences.
3. With less reliance on the defined benefit component, the magnitude of the potential for growth in unfunded pension liabilities would be substantially curtailed.
4. The defined benefit component may be a key contributor to favorable recruitment and retention of some employees. At the same time, the portability feature of the defined contribution component may be seen as a positive factor for some other employees (again, varying by employee).
5. While there would be some additional administrative burdens on the State to manage both the defined benefit plan and the modified 401(k) or 401(a) plan, the level of added complexity for
23 Virginia’s hybrid DB-DC plan is effective for employees hired after 1/1/2014 (included in total).

TCRS Reform Options
Page | 29
the employer would be manageable given the current capabilities of TCRS staff and the availability of similar retirement plans already in place with outsourced administration.
Negative Factors:
1. A portion of the investment and other actuarial risk remains with the employer (less than would be present in a pure DB plan, but more risk than found in a DC plan).
2. As a result, even with a reduced defined benefit component, the potential exists (albeit mitigated) for unfunded liabilities relative to a pure DC approach. The recommendation for a modified hybrid plan for Tennessee state and higher education employees and teachers would not have a significant risk of unfunded liabilities because of cost control provisions more fully discussed on page 35 of this report.
3. There would be an additional layer of complexity for members in understanding the hybrid benefit structure and in making favorable investment decisions. The State would likely be called on to invest in enhanced, ongoing educational programs to help ensure the quality of investment decisions by individual members.
As an alternative “hybrid” approach to address ongoing pension funding pressures, several jurisdictions have turned to cash balance plans. In 2012, both Kansas and Louisiana24 adopted legislation to move new hires into these types of plans (with future effective dates). Nebraska was the only other state identified as of July 1, 2012, to already provide state employees with this type of retirement plan. Cash balance plans are a unique type of hybrid that combines elements of a defined contribution and defined benefit pension plan, although they differ significantly from a standard hybrid DB-DC model. Under the cash balance approach, all contributions (employee and employer) are credited and tracked on an individual basis. Each year, or as frequently provided by the plan, the contributions to the account are credited with some level of guaranteed interest. Nebraska currently credits contributions with the greater of 5% or the federal mid-term rate plus 1.5%. Louisiana, once the plan is effective, will provide individual accounts with an annual interest rate equal to 1% less than the actuarially determined rate of return. The investment risk mostly remains with the employer in a cash balance plan. Although contributions are tracked on an individual basis, the assets are invested by the system in aggregate. Employees do not decide how to invest the assets in their account. In the event of investment loss, cash balance plans still require that an employee be credited with the guaranteed interest rate. While Louisiana has mitigated its investment risk exposure by linking its guaranteed rate to the actuarial rate of return, it would not debit individual accounts should the system as a whole post a loss in any given year. On retirement, members are eligible to select from several payout options based on the final value of their cash balance account inclusive of all employee and employer contributions and the compounded annual guaranteed interest credits. These options can include lump sum distributions or annuity payments with various optional enhancements (survivor benefits, COLAs, etc.).
24 A Louisiana district court overturned the cash balance plan as unconstitutional in January 2013 on grounds that it did not meet the constitutionally required two-thirds majority vote in the State Legislature. An appeal is pending.

TCRS Reform Options
Page | 30
While these plans have some attractive characteristics, they are more complex than the other options considered. In addition, this type of a plan would substantially increase the administrative burdens placed on the TCRS relative to the long-term employer savings provided and potential for reduction in unfunded liabilities. These plans also leave employers with contingent liabilities that can be difficult for key stakeholders to understand, and offer little more to enhance retirement income security than the hybrid DB-DC structure if implemented with reasonable employer and employee contributions. Further, the recordkeeping for such formulaic hybrids would entail additional costs and efforts for TCRS personnel, as well as considerable additional actuarial expenses. A summary of the features of the three state-level cash balance plan are included in Appendix C for reference.
Recommended Approach

Recommended Approach
Page | 32
Of the alternatives evaluated, discussed with staff, and considered independently, PFM recommends a hybrid retirement plan as best meeting the State’s goals and objectives. A hybrid system effectively balances the income-security benefits of a pension with the flexible cost-sharing and risk-sharing features of a defined contribution plan. PFM has concluded that the TCRS system will be able to service the new approach, and that the State’s current 457 and 401(k) plan record-keeper is capable of supporting the new defined contribution elements. PFM further recommends that any new plan design include statutory language to enable the State to formally reserve the right to modify retirement plan terms on a prospective basis. This approach for new hires would be consistent with federal pension law under the Employee Retirement Income Security Act (ERISA) which protects accrued vested benefits but permits plans to be frozen or modified prospectively. The State of Tennessee took a similar approach when enacting reforms for political subdivisions. Public Chapter 939, Acts of 2012, contained language that would allow political subdivisions to, “freeze, suspend or modify benefits, employee contributions, plan terms and design prospectively” for new hires.25 The fundamental goal of a hybrid plan is to require employees and employers to share in the investment risks and costs equitably. A reasonable benefit multiplier in the pension component will assure a base level of guaranteed lifetime income, the remainder of which would be provided by the DC component, Social Security, and other personal savings. It is recommended that the combined employer and employee contribution to the defined contribution account be at least 5% of salary in order to achieve a sufficient level of replacement income. As an additional guiding principle, it is important that the State structure the plan so that no employee is relying on the reduced DB pension component as their sole source of retirement income. Please refer to Appendix G for an analysis of potential pension replacement income under the recommended hybrid approach. In addition, it is recommended that the benefit formula for other employee groups be adjusted in a similar manner as the new plan described for state employees and teachers, with these groups also requiring an employee contribution. The employer contribution made to the Optional Retirement Plan (ORP) for higher education employees should be reduced accordingly. The benefit formula for Judges and General Assembly members should also be reduced in a direct proportion to the decrease recommended for the new state and teacher plan. Given the distinct career patterns for these groups, however, it is recommended that the eligibility conditions for retirement not be affected for Judges and General Assembly members. In addition, the benefit formula for public safety employees covered by mandatory retirement should be the same as that for general state employees. Again because of distinct career requirements, eligibility conditions for retirement need not be changed for public safety positions.
25 State of Tennessee, Senate Bill No. 3216 of 2012.

Recommended Approach
Page | 33
The following table highlights the major features of the defined benefit component of the recommended hybrid plan:
Defined Benefit Component
Proposed Plan Rationale
Employee Contribution 5%
• Sharing of cost gives employees a “stake” in the system
• Improves overall affordability for the taxpayer
Employer Contribution
9% combined DB + DC contribution. Maximum of 5% contribution to the DC account, based on an actuarial target of 4% for
the DB component normal cost
• Establishment of a maximum combined employer contribution across the DB and DC components will allow the State to contain total pension costs
Benefit Formula 1.0% of AFC x YOS
• Multiplier of 1.0% is consistent with other state-level hybrid retirement systems, as well as the TCRS option for local employers
• Based on analysis of income replacement ratios, a multiplier of 1.0% helps to ensure DB component provides an appropriate base level of guaranteed income in retirement
• Reducing the defined benefit from current levels would lower the State’s exposure to investment and actuarial risk
Normal Retirement Age
65 with 5 years of service; Rule of 90 (when age +
years of service equal 90)
• An increased retirement age and service requirements is consistent with national state-level trends and demographic/life expectancy changes
• Addition of a “Rule of 90” provision will allow those with long tenure to still exit service without a benefit reduction
• Increased normal retirement eligibility will directly improve the affordability of pension benefits for the State, and can indirectly reduce OPEB costs/liability
Other
Cap Benefit at $80,000 maximum, indexed to CPI; No major changes recommended to other
DB features
• Ensures reasonableness of taxpayer-funded benefits
Recommended Approach
Page | 34
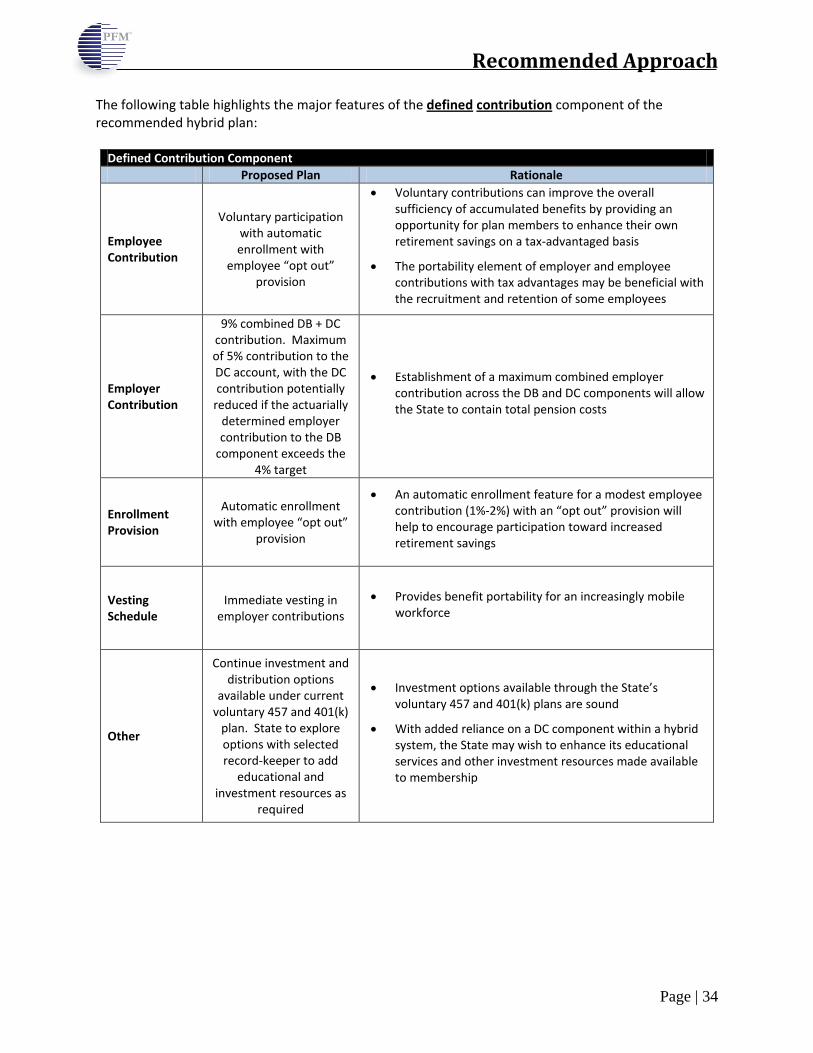
The following table highlights the major features of the defined contribution component of the recommended hybrid plan:
Defined Contribution Component Proposed Plan Rationale
Employee Contribution
Voluntary participation with automatic enrollment with
employee “opt out” provision
• Voluntary contributions can improve the overall sufficiency of accumulated benefits by providing an opportunity for plan members to enhance their own retirement savings on a tax-advantaged basis
• The portability element of employer and employee contributions with tax advantages may be beneficial with the recruitment and retention of some employees
Employer Contribution
9% combined DB + DC contribution. Maximum of 5% contribution to the DC account, with the DC contribution potentially
reduced if the actuarially determined employer contribution to the DB
component exceeds the 4% target
• Establishment of a maximum combined employer contribution across the DB and DC components will allow the State to contain total pension costs
Enrollment Provision
Automatic enrollment with employee “opt out”
provision
• An automatic enrollment feature for a modest employee contribution (1%-2%) with an “opt out” provision will help to encourage participation toward increased retirement savings
Vesting Schedule
Immediate vesting in employer contributions
• Provides benefit portability for an increasingly mobile workforce
Other
Continue investment and distribution options
available under current voluntary 457 and 401(k)
plan. State to explore options with selected record-keeper to add
educational and investment resources as
required
• Investment options available through the State’s voluntary 457 and 401(k) plans are sound
• With added reliance on a DC component within a hybrid system, the State may wish to enhance its educational services and other investment resources made available to membership
Recommended Approach
Page | 35
Employer Mechanisms to Control Costs and Unfunded Liabilities In a further effort to control employer costs and mitigate the potential for growth in unfunded liabilities, PFM recommends that the State establish “symmetry” within the plan’s allocation of risk – such that employees would share in any corrective actions required in the event that actuarial projections are not met due to another severe market downturn or other adverse factor(s). As outlined in the preceding tables, the primary mechanism proposed to help achieve such symmetry would be the establishment of a maximum employer contribution rate for the combined DB and DC components – for example, 9%. Within this overall parameter, the maximum employer DC contribution would be 5%, and the DB contribution would be actuarially set with a target of 4%. As a further safeguard, the State could explore establishment of an actuarial fluctuation reserve to assist in controlling volatility related to investment earnings, unfunded liabilities, and employer contributions. Within this overall approach, it would also be important to establish and/or codify the general actuarial methodologies and other key assumptions that will be used to determine annual employer costs in order to prevent manipulation from year to year. In the event that the actuarial valuation requires the employer DB contribution to exceed 4% (for a combined DB plus target DC rate that would potentially exceed 9%), the State would retain the authority to control the employer cost in the following manner:
1. Use the actuarial fluctuation reserve;
2. Reduce or suspend post-retirement cost-of-living adjustments (COLA);
3. Shift some or all of DC employer contributions to DB plan;
4. Increase employee contributions to the DB plan by 1%;
5. Reduce future service accrual multipliers (below 1.0% per year of service);
6. Freeze plan benefits. With GASB statement 68 requiring unfunded pension liabilities to be recorded as a long-term obligation in the employer’s financial statements rather than as an off balance sheet liability, there will be a heightened awareness of a government’s unfunded liabilities by such groups as governmental employees, taxpayers, government officials, governmental elected officials, debt rating agencies, and purchasers of governmental bonds/debt. These safeguards outlined above will help to minimize any negative financial impact that an unfunded liability would have on a governmental entity, whether it is the state or a local government. Given financial market place and economic volatility over time, it would be virtually impossible to design a defined benefit plan where unfunded liabilities will never occur. However, controls, as set out above, can be installed to maintain the unfunded liability at a reasonable and manageable level. Overall, the hybrid model as outlined would help to mitigate the growth in employer retirement benefit costs, share an acceptable level of investment risk between the State and employees, and continue to provide the opportunity for career Tennessee employees to enjoy a dignified and secure retirement.

Appendix A

Appendix A
Page | 37
Civilian State Employees, Defined Benefit Plans • 41 of 50 surveyed systems (excluding Tennessee) offered state employees a defined benefit
pension plan on an optional or mandatory basis.
• Summary of Findings: Of the 42 states found to offer their own state employees a defined benefit pension plan on an optional or mandatory basis, Tennessee was the only state without a requirement for new employees to contribute toward the cost of their benefit. The average employee contribution was 6.1% of payroll among other defined benefit plans for employees that participate in Social Security, such as Tennessee state and higher education employees and K-12 teachers (employee contributions averaged 9.5% of payroll among those without Social Security).
Across other major provisions, the benefits provided by TCRS are generally consistent with other state systems, though these systems have tended to increase retirement ages in recent years, while the TCRS has not. Comparing benefit multipliers can be imprecise as there may be several components to the actual calculation. Tennessee, for example, uses a dual-multiplier for earnings above and below the Social Security Integration Level. Many other states also use more than one multiplier to determine the benefit level at retirement.
Tennessee Benchmarking Results (excluding TN)
Employee Contributions 0% 6.1% average (w/Social Security)
9.5% average (w/o Social Security)
Vesting 5 years <5 years: 3 of 41 systems (7.1%)
5 years: 19 of 41 systems (46.3%) >5 years: 19 of 41 systems (46.3%)
Normal Retirement Eligibility (Age/YOS)
60/5; any/30
Given multiple and diverse retirement eligibility criteria averaging is imprecise. In recent years, many jurisdictions have increased
retirement ages to closer align with Social Security Normal Retirement Age. It is common to see ages 62, 65, or 67 or “Rule
of” requirements in other systems.
Benefit Formula
1.575% of AFC up to the SSIL x YOS + 1.8375% of AFC in excess of the SSIL
x YOS
Given multiple and diverse benefit formulas averaging is imprecise. Of the 35 systems that participate in Social Security,
17 have benefit multipliers of 2% or greater for state employees, while 18 have multipliers that are less than 2%.
Average Final Compensation (AFC)
5 years <5 years: 21 of 42 systems (51.2%) 5 years: 18 of 42 systems (43.9%) >5 years: 2 of 42 systems (4.9%)
COLA Provision
Linked to CPI; 3% maximum
23 of 41 systems provide automatic COLAs, many that are linked to CPI and/or capped. Others provide COLAs on an ad hoc basis.
Some systems in recent years have suspended COLAs until attainment of a target funding level.
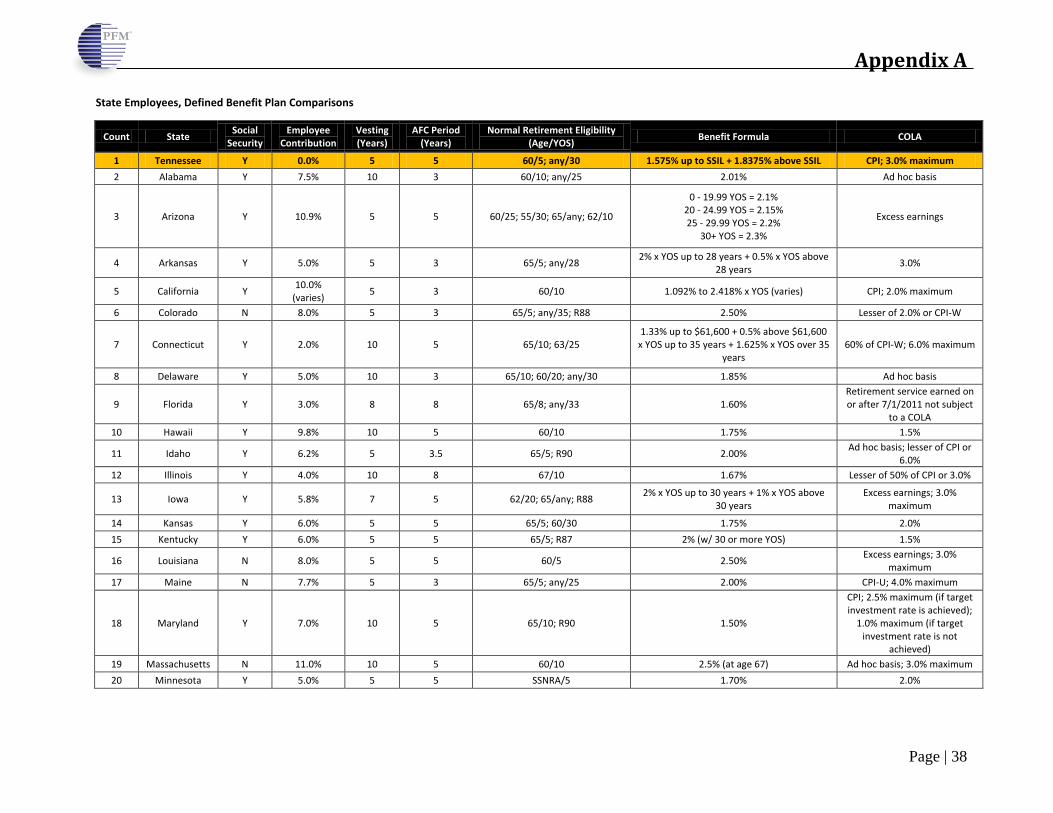
Appendix A
Page | 38
State Employees, Defined Benefit Plan Comparisons
Count State Social Security
Employee Contribution
Vesting (Years)
AFC Period (Years)
Normal Retirement Eligibility (Age/YOS) Benefit Formula COLA
1 Tennessee Y 0.0% 5 5 60/5; any/30 1.575% up to SSIL + 1.8375% above SSIL CPI; 3.0% maximum 2 Alabama Y 7.5% 10 3 60/10; any/25 2.01% Ad hoc basis
3 Arizona Y 10.9% 5 5 60/25; 55/30; 65/any; 62/10
0 - 19.99 YOS = 2.1% 20 - 24.99 YOS = 2.15% 25 - 29.99 YOS = 2.2%
30+ YOS = 2.3%
Excess earnings
4 Arkansas Y 5.0% 5 3 65/5; any/28 2% x YOS up to 28 years + 0.5% x YOS above 28 years 3.0%
5 California Y 10.0% (varies) 5 3 60/10 1.092% to 2.418% x YOS (varies) CPI; 2.0% maximum
6 Colorado N 8.0% 5 3 65/5; any/35; R88 2.50% Lesser of 2.0% or CPI-W
7 Connecticut Y 2.0% 10 5 65/10; 63/25 1.33% up to $61,600 + 0.5% above $61,600
x YOS up to 35 years + 1.625% x YOS over 35 years
60% of CPI-W; 6.0% maximum
8 Delaware Y 5.0% 10 3 65/10; 60/20; any/30 1.85% Ad hoc basis
9 Florida Y 3.0% 8 8 65/8; any/33 1.60% Retirement service earned on or after 7/1/2011 not subject
to a COLA 10 Hawaii Y 9.8% 10 5 60/10 1.75% 1.5%
11 Idaho Y 6.2% 5 3.5 65/5; R90 2.00% Ad hoc basis; lesser of CPI or 6.0%
12 Illinois Y 4.0% 10 8 67/10 1.67% Lesser of 50% of CPI or 3.0%
13 Iowa Y 5.8% 7 5 62/20; 65/any; R88 2% x YOS up to 30 years + 1% x YOS above 30 years
Excess earnings; 3.0% maximum
14 Kansas Y 6.0% 5 5 65/5; 60/30 1.75% 2.0% 15 Kentucky Y 6.0% 5 5 65/5; R87 2% (w/ 30 or more YOS) 1.5%
16 Louisiana N 8.0% 5 5 60/5 2.50% Excess earnings; 3.0% maximum
17 Maine N 7.7% 5 3 65/5; any/25 2.00% CPI-U; 4.0% maximum
18 Maryland Y 7.0% 10 5 65/10; R90 1.50%
CPI; 2.5% maximum (if target investment rate is achieved);
1.0% maximum (if target investment rate is not
achieved) 19 Massachusetts N 11.0% 10 5 60/10 2.5% (at age 67) Ad hoc basis; 3.0% maximum 20 Minnesota Y 5.0% 5 5 SSNRA/5 1.70% 2.0%
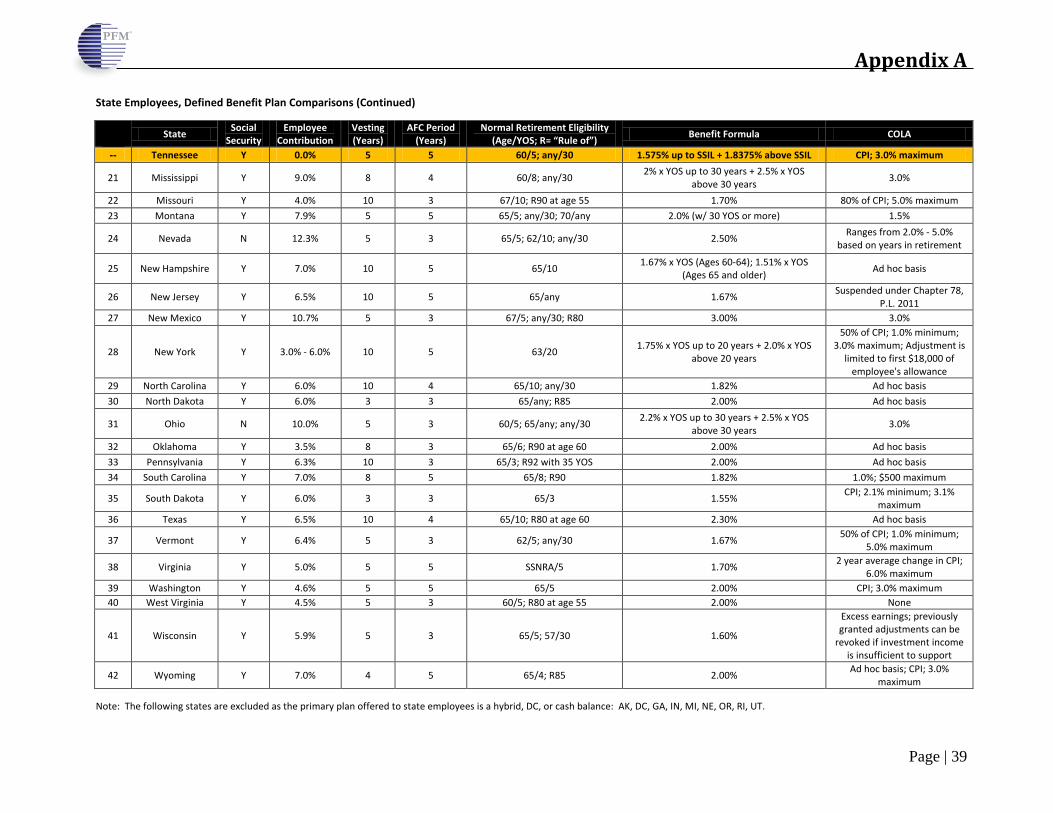
Appendix A
Page | 39
State Employees, Defined Benefit Plan Comparisons (Continued)
State Social Security
Employee Contribution
Vesting (Years)
AFC Period (Years)
Normal Retirement Eligibility (Age/YOS; R= “Rule of”) Benefit Formula COLA
-- Tennessee Y 0.0% 5 5 60/5; any/30 1.575% up to SSIL + 1.8375% above SSIL CPI; 3.0% maximum
21 Mississippi Y 9.0% 8 4 60/8; any/30 2% x YOS up to 30 years + 2.5% x YOS above 30 years 3.0%
22 Missouri Y 4.0% 10 3 67/10; R90 at age 55 1.70% 80% of CPI; 5.0% maximum 23 Montana Y 7.9% 5 5 65/5; any/30; 70/any 2.0% (w/ 30 YOS or more) 1.5%
24 Nevada N 12.3% 5 3 65/5; 62/10; any/30 2.50% Ranges from 2.0% - 5.0% based on years in retirement
25 New Hampshire Y 7.0% 10 5 65/10 1.67% x YOS (Ages 60-64); 1.51% x YOS (Ages 65 and older) Ad hoc basis
26 New Jersey Y 6.5% 10 5 65/any 1.67% Suspended under Chapter 78, P.L. 2011
27 New Mexico Y 10.7% 5 3 67/5; any/30; R80 3.00% 3.0%
28 New York Y 3.0% - 6.0% 10 5 63/20 1.75% x YOS up to 20 years + 2.0% x YOS above 20 years
50% of CPI; 1.0% minimum; 3.0% maximum; Adjustment is
limited to first $18,000 of employee's allowance
29 North Carolina Y 6.0% 10 4 65/10; any/30 1.82% Ad hoc basis 30 North Dakota Y 6.0% 3 3 65/any; R85 2.00% Ad hoc basis
31 Ohio N 10.0% 5 3 60/5; 65/any; any/30 2.2% x YOS up to 30 years + 2.5% x YOS above 30 years 3.0%
32 Oklahoma Y 3.5% 8 3 65/6; R90 at age 60 2.00% Ad hoc basis 33 Pennsylvania Y 6.3% 10 3 65/3; R92 with 35 YOS 2.00% Ad hoc basis 34 South Carolina Y 7.0% 8 5 65/8; R90 1.82% 1.0%; $500 maximum
35 South Dakota Y 6.0% 3 3 65/3 1.55% CPI; 2.1% minimum; 3.1% maximum
36 Texas Y 6.5% 10 4 65/10; R80 at age 60 2.30% Ad hoc basis
37 Vermont Y 6.4% 5 3 62/5; any/30 1.67% 50% of CPI; 1.0% minimum; 5.0% maximum
38 Virginia Y 5.0% 5 5 SSNRA/5 1.70% 2 year average change in CPI; 6.0% maximum
39 Washington Y 4.6% 5 5 65/5 2.00% CPI; 3.0% maximum 40 West Virginia Y 4.5% 5 3 60/5; R80 at age 55 2.00% None
41 Wisconsin Y 5.9% 5 3 65/5; 57/30 1.60%
Excess earnings; previously granted adjustments can be
revoked if investment income is insufficient to support
42 Wyoming Y 7.0% 4 5 65/4; R85 2.00% Ad hoc basis; CPI; 3.0% maximum
Note: The following states are excluded as the primary plan offered to state employees is a hybrid, DC, or cash balance: AK, DC, GA, IN, MI, NE, OR, RI, UT.

Appendix A
Page | 40
Teachers, Defined Benefit Plans • 44 of 50 surveyed systems (excluding Tennessee) offered teachers a defined benefit pension plan
on an optional or mandatory basis.
• Summary of Findings: Most states, like Tennessee, offer teachers and state employees a very similar benefit in retirement. In Tennessee, as mentioned previously, the only difference is that teachers contribute 5% of their pay while state employees do not. Even still, the contribution that teachers make in Tennessee is lower than the average among other state systems participating in Social Security (6.7%). In general, K-12 teachers in Tennessee receive a similar benefit relative to teachers in other state retirement systems.
Tennessee Benchmarking Results (excluding TN)
Employee Contributions 5% 6.7% average (w/Social Security)
9.2% average (w/o Social Security)
Vesting 5 years <5 years: 3 of 43 systems (6.8%)
5 years: 24 of 44 systems (54.5%) >5 years: 17 of 44 systems (38.6%)
Normal Retirement Eligibility (Age/YOS)
60/5; any/30
Given multiple and diverse formulas averaging is imprecise. In recent years, many jurisdictions have increased retirement ages to closer align with Social Security Normal Retirement Age. It is common to see ages 62, 65, or 67 or “Rule of” requirements in
other systems.
Benefit Formula
1.575% of AFC up to the SSIL x YOS + 1.8375% of AFC in excess of the SSIL
x YOS
Given multiple and diverse benefit formulas averaging is imprecise. While Tennessee’s formula is not overly generous, it is among the mainstream of other systems that participate in Social Security. Of the 32 systems that participate in Social Security, 16
have benefit multipliers of 2% or greater for state employees, while 16 have multipliers that are less than 2%.
Average Final Compensation (AFC)
5 years <5 years: 21 of 44 systems (47.7%) 5 years: 21 of 44 systems (47.7%) >5 years: 2 of 44 systems (4.5%)
COLA Provision
Linked to CPI; 3% maximum
24 of 44 systems provide automatic COLAs, many that are linked to CPI and/or capped. Others provide COLAs on an ad hoc basis.
Some systems in recent years have suspended COLAs until attainment of a target funding level.

Appendix A
Page | 41
Teachers, Defined Benefit Plan Comparisons
State Social Security
Employee Contribution
Vesting (Years)
AFC Period (Years)
Normal Retirement Eligibility (Age/YOS; R= “Rule of”) Benefit Formula COLA
1 Tennessee Y 5.0% 5 5 60/5; any/30 1.575% up to SSIL + 1.8375% above SSIL CPI; 3.0% maximum
2 Alabama Y 7.5% 10 3 60/10; any/25 2.01% Ad hoc basis
3 Arizona Y 11.1% 5 5 60/25; 55/30; 65/any; 62/10
0 - 19.99 YOS = 2.1% 20 - 24.99 YOS = 2.15% 25 - 29.99 YOS = 2.20%
30+ YOS = 2.30%
Excess earnings
4 Arkansas Y 6.0% 5 3 65/5; any/28 2.15% Ad hoc basis 5 California N 8.0% 5 3 60/5 2.0% at age 60 2.0% 6 Colorado N 8.0% 5 3 65/5; any/35; R88 2.50% Lesser of CPI-W or 2.0%
7 Connecticut N 6.0% 10 3 60/20; any/35 2.00% Linked to Social Security COLA; 6% maximum; 1.5% maximum if fund returns less than 8.5%
8 Delaware Y 5.0% 10 3 65/10; 60/20; any/30 1.85% Ad hoc basis 9 DC Y 8.0% 5 3 60/20; any/30; 62/5 2.00% CPI; 3.0% maximum
10 Florida Y 3.0% 8 8 65/8; any/33 1.60% Retirement service earned on or after 7/1/2011 not subject
to a COLA 11 Georgia Y 5.5% 10 2 60/10; any/30 2.00% Ad hoc basis; CPI 12 Hawaii Y 9.8% 10 5 60/10 1.75% 1.5%
13 Idaho Y 6.2% 5 3.5 65/5; R90 2.00% Ad hoc basis; lesser of CPI or 6.0%
14 Illinois N 9.4% 10 8 67/10 2.20% Lesser of 50% of CPI or 3.0%
15 Iowa Y 5.8% 7 5 62/20; 65/any; R88 2.0% x YOS up to 30 years + 1.0% x YOS above 30 years
Excess earnings; 3.0% maximum
16 Kansas Y 6.0% 5 5 65/5; 60/30 1.75% 2.0% 17 Kentucky N 9.1% 5 5 60/5; any/27 3.0% with 30+ YOS 1.5%
18 Louisiana N 8.0% 5 5 60/5; any/20 2.50% Excess earnings and plan funded level; 3.0% maximum
19 Maine N 7.7% 5 3 65/5; any/25 2.00% CPI-U; 4.0% maximum
20 Maryland Y 7.0% 10 5 65/10; R90 1.50%
CPI; 2.5% maximum (if target investment rate is achieved);
1.0% maximum (if target investment rate is not
achieved) 21 Massachusetts N 11.0% 10 5 60/10 2.5% with 25 YOS Ad hoc basis; 3.0% maximum
22 Minnesota Y 6.5% 3 5 Social Security Age/5 1.90% 2.0%; 2.5% when market value of fund reaches 90% funding
23 Mississippi Y 9.0% 8 4 60/8; any/30 2% x YOS up to 30 years + 2.5% x YOS above 30 years 3.0%

Appendix A
Page | 42
Teachers, Defined Benefit Plan Comparisons (Continued)
State Social Security
Employee Contribution
Vesting (Years)
AFC Period (Years)
Normal Retirement Eligibility (Age/YOS; R= “Rule of”) Benefit Formula COLA
-- Tennessee Y 5.0% 5 5 60/5; any/30 1.575% up to SSIL + 1.8375% above SSIL CPI; 3.0% maximum
24 Missouri N 14.5% 5 3 60/5; any/30; R80 2.50% CPI; 5.0% maximum 25 Montana Y 7.2% 5 3 60/5; any/25 1.67% 1.5% 26 Nebraska Y 9.8% 5 3 65/5; R85 at age 55 2.00% CPI-U; 2.5% maximum
27 Nevada N 12.3% 5 3 65/5; any/30; 62/10 2.50% Ranges from 2.0% - 5.0%
28 New Hampshire Y 7.0% 10 5 65/10 1.67% x YOS (Ages 60-64); 1.51% x YOS (Ages 65 and older) Ad hoc basis
29 New Jersey Y 6.5% 10 5 65/any 1.67% Suspended 30 New Mexico Y 9.4% 5 5 67/5; any/30; R80 2.35% CPI; 4.0% maximum
31 New York Y 3.0% - 6.0% 10 5 63/20 1.75% x YOS (1-20) + 2.0% x YOS (20+)
50% of CPI; 1.0% minimum; 3.0% maximum; Adjustment is
limited to first $18,000 of employee's allowance
32 North Carolina Y 6.0% 10 4 65/10; any/30 1.82% Ad hoc basis 33 North Dakota Y 9.8% 5 5 65/any; R85 2.00% Ad hoc basis
34 Ohio N 10.0% 5 3 60/5; 55/25; any/30 2.2% x YOS (1-30) + 2.5% (31) + 0.1% each year thereafter 3.0%
35 Oklahoma Y 7.0% 5 5 65/any; R90 at age 60 2.00% Ad hoc basis 36 Pennsylvania Y 7.5% 10 3 65/3, R92 with 35 YOS 2.00% Ad hoc basis 37 South Carolina Y 7.0% 8 5 65/8; R90 1.82% 1.0%; $500 maximum
38 South Dakota Y 6.0% 3 3 65/3 1.55% CPI; 2.1% minimum; 3.1% maximum
39 Texas N 6.4% 5 5 65/5; R80 2.30% Ad hoc basis
40 Vermont Y 5.0% 5 3 62/5; any/30 1.67% 50% of CPI; 1.0% minimum; 5.0% maximum
41 Virginia Y 5.0% 5 5 Social Security Age/5 1.70% 2 year average change in CPI; 6.0% maximum
42 Washington Y 4.7% 5 5 65/5 2.00% CPI; 3.0% maximum 43 West Virginia Y 6.0% 5 5 60/5; any/35; 55/30 2.00% None
44 Wisconsin Y 5.9% 5 3 65/5; 57/30 1.60%
Excess earnings; previously granted adjustments can be
revoked if investment income is insufficient to support
45 Wyoming Y 7.0% 4 5 65/4; R85 2.00% Ad hoc basis; CPI; 3.0% maximum
Note: The following states are excluded as the primary plan offered is hybrid, DC, or cash balance: AK, IN, MI, OR, RI, UT

Appendix A
Page | 43
Law Enforcement, Defined Benefit Plans • 45 of 49 surveyed systems (excluding Tennessee) offered law enforcement or state highway patrol
Officers a defined benefit pension plan on an optional or mandatory basis. Hawaii was excluded from the analysis as they were identified to not have an equivalent state law enforcement agency.
• Summary of Findings: In general, law enforcement and other public safety positions tend to have lower retirement ages and higher benefit multipliers than state employees due to the nature of the work being performed. In Tennessee, law enforcement are eligible to retire at age 55 with 25 years of service with an enhanced benefit multiplier until attainment of age of 62 (additional 0.75%). Only three of the 45 systems offering law enforcement a defined benefit pension (excluding Tennessee) did not require newly hired law enforcement to contribute toward their pension as of July 1, 2012, including Arkansas, Michigan, and Missouri. Michigan, however, is phasing in a 2% employee contribution for current law enforcement (1% effective October 1, 2012 + 1% effective October 1, 2013) and will require new hires to enroll in a hybrid DB-DC plan with a 4% employee contribution.
Tennessee Benchmarking Results (excluding TN)
Employee Contributions 0% 6.1% average (w/Social Security)
9.8% average (w/o Social Security)
Vesting 5 years <5 years: 2 of 45 systems (7.1%)
5 years: 22 of 45 systems (47.6%) >5 years: 21 of 45 systems (45.2%)
Normal Retirement Eligibility (Age/YOS)
55/25 without an early reduction penalty or
60/5; any/30
Given multiple and diverse formulas averaging is imprecise. It is not uncommon for public safety positions to have a retirement
formula that allows for an unreduced retirement with 25 years of service. Tennessee’s retirement age is similar to that offered
other law enforcement.
Benefit Formula
1.575% of AFC up to the SSIL x YOS + 1.8375% of AFC in excess of the SSIL
x YOS
Law enforcement also receive a “bridge” benefit of 0.75% of AFC per year
of service as a Public Safety Officer until
reaching age 62.
Given multiple and diverse benefit formulas averaging is imprecise. PFM identified just three states that have a benefit similar to Tennessee’s “bridge” benefit (all participate in Social
Security):
Arkansas: 2.475% + 0.513% until age 62 Missouri: 1.7% + 0.8% until age 62
Virginia: 1.85% + $1,038 per month until SSNRA
13 of the 14 remaining states that participate in Social Security have a benefit multiplier of 2.0% or more
Average Final Compensation (AFC)
5 years <5 years: 32 of 45 systems (71.1%) 5 years: 11 of 45 systems (24.4%) >5 years: 2 of 45 systems (4.4%)
COLA Provision
Linked to CPI; 3% maximum
26 of 46 systems provide automatic COLAs, many that are linked to CPI and/or capped. Others provide COLAs on an ad hoc basis.
Some systems in recent years have suspended COLAs until attainment of a target funding level.

Appendix A
Page | 44
Law Enforcement, Defined Benefit Plan Comparisons
State Social Security
Employee Contribution
Vesting (Years)
AFC Period (Years)
Normal Retirement Eligibility (Age/YOS; R= “Rule of”) Benefit Formula COLA
1 Tennessee Y 0.0% 5 5 55/25 1.575% up to SSIL + 1.8375%above SSIL + 0.75% until age 62 CPI; 3.0% maximum
2 Alabama N 10.0% 10 5 56/10; any/25 2.38% Ad hoc basis 3 Arizona Y 9.6% 5 5 52.5/25; any/25 2.50% Excess earnings 4 Arkansas Y 0.0% 5 4 any/30; 65/5 2.475% + 0.513% until age 62 3.0% 5 California N 10.0% 10 3 55/5 3.00% CPI; 2% max 6 Colorado N 10.0% 5 3 65/any; 55/20; 50/25; any/30 2.50% Lesser of CPI-W or 2.0%
7 Connecticut Y 5.0% 10 5 50/20; any/25 2.5% x YOS (1-20) + 2.0% x YOS (20+) CPI; 7.5% maximum
8 Delaware N 7.0% 10 3 62/10; any/20; R75 2.5% x YOS (1-20) + 3.5% x YOS (20+) Ad hoc basis
9 DC N 8.0% 5 3 any/25 2.50% CPI; No stated maximum
10 Florida Y 3.0% 8 8 60/8; any/30 3.00% Retirement service earned on or after 7/1/2011 not subject
to a COLA 11 Idaho Y 7.7% 5 3.5 50/30; 60/5; R80 2.30% Ad hoc basis 12 Illinois N 12.5% 10 8 60/20 3.00% CPI; Lesser of 1/2 CPI or 3%
13 Indiana N 6.0% 5 3 any/25 50% of AFC with 25 YOS + Additional
benefit for years in excess of 25 (ranging from 5-8%) up to 70% maximum
Ad hoc basis
14 Iowa N 9.4% 4 3 55/22 2.75% COLA linked to pay increase for equivalent rank
15 Kansas N 7.0% 15 3 50/25; 55/20; 60/15 2.50% None 16 Kentucky Y 8.0% 5 3 any/20; 55/5; 2.50% 1.5%; 17 Louisiana N 8.5% 25 3 50/10; any/25 3.33% Ad hoc basis 18 Maine N 8.7% 5 3 any/25 2.00% CPI; 4% max
19 Maryland N 8.0% 10 5 50/any; any/25 2.55%
CPI; 2.5% maximum (if target investment rate is achieved);
1.0% maximum (if target investment rate is not
achieved)
20 Massachusetts N 12.0% 10 1 any/20; 65/any; 55/10 50% of AFC with 20 YOS + 2.5% per year in excess of 20 YOS Ad hoc basis; 3.0% maximum
21 Michigan N 0.0% 10 2 any/25 60% of AFC 2%: $500 maximum 22 Minnesota N 12.4% 5 5 55/any 3.00% 1.50% 23 Mississippi Y 7.3% 5 4 55/5; any/25 2.50% 3.00%
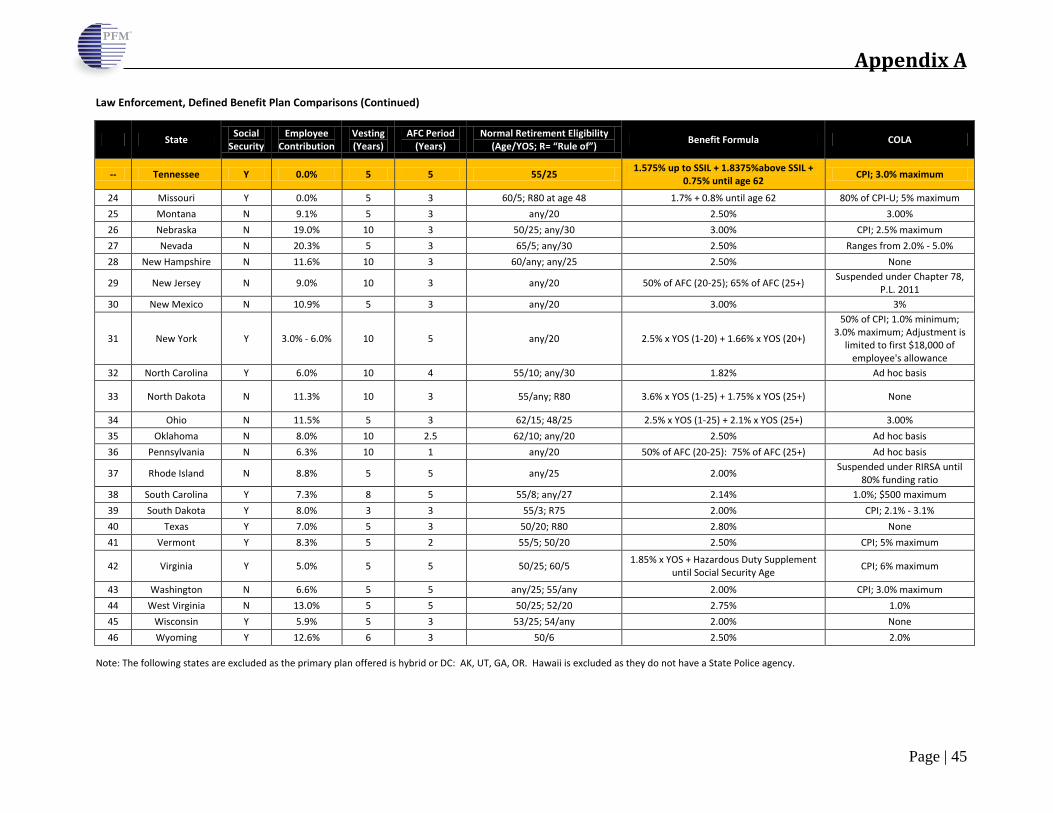
Appendix A
Page | 45
Law Enforcement, Defined Benefit Plan Comparisons (Continued)
State Social Security
Employee Contribution
Vesting (Years)
AFC Period (Years)
Normal Retirement Eligibility (Age/YOS; R= “Rule of”) Benefit Formula COLA
-- Tennessee Y 0.0% 5 5 55/25 1.575% up to SSIL + 1.8375%above SSIL + 0.75% until age 62 CPI; 3.0% maximum
24 Missouri Y 0.0% 5 3 60/5; R80 at age 48 1.7% + 0.8% until age 62 80% of CPI-U; 5% maximum 25 Montana N 9.1% 5 3 any/20 2.50% 3.00% 26 Nebraska N 19.0% 10 3 50/25; any/30 3.00% CPI; 2.5% maximum 27 Nevada N 20.3% 5 3 65/5; any/30 2.50% Ranges from 2.0% - 5.0% 28 New Hampshire N 11.6% 10 3 60/any; any/25 2.50% None
29 New Jersey N 9.0% 10 3 any/20 50% of AFC (20-25); 65% of AFC (25+) Suspended under Chapter 78, P.L. 2011
30 New Mexico N 10.9% 5 3 any/20 3.00% 3%
31 New York Y 3.0% - 6.0% 10 5 any/20 2.5% x YOS (1-20) + 1.66% x YOS (20+)
50% of CPI; 1.0% minimum; 3.0% maximum; Adjustment is
limited to first $18,000 of employee's allowance
32 North Carolina Y 6.0% 10 4 55/10; any/30 1.82% Ad hoc basis
33 North Dakota N 11.3% 10 3 55/any; R80 3.6% x YOS (1-25) + 1.75% x YOS (25+) None
34 Ohio N 11.5% 5 3 62/15; 48/25 2.5% x YOS (1-25) + 2.1% x YOS (25+) 3.00% 35 Oklahoma N 8.0% 10 2.5 62/10; any/20 2.50% Ad hoc basis 36 Pennsylvania N 6.3% 10 1 any/20 50% of AFC (20-25): 75% of AFC (25+) Ad hoc basis
37 Rhode Island N 8.8% 5 5 any/25 2.00% Suspended under RIRSA until 80% funding ratio
38 South Carolina Y 7.3% 8 5 55/8; any/27 2.14% 1.0%; $500 maximum 39 South Dakota Y 8.0% 3 3 55/3; R75 2.00% CPI; 2.1% - 3.1% 40 Texas Y 7.0% 5 3 50/20; R80 2.80% None 41 Vermont Y 8.3% 5 2 55/5; 50/20 2.50% CPI; 5% maximum
42 Virginia Y 5.0% 5 5 50/25; 60/5 1.85% x YOS + Hazardous Duty Supplement until Social Security Age CPI; 6% maximum
43 Washington N 6.6% 5 5 any/25; 55/any 2.00% CPI; 3.0% maximum 44 West Virginia N 13.0% 5 5 50/25; 52/20 2.75% 1.0% 45 Wisconsin Y 5.9% 5 3 53/25; 54/any 2.00% None 46 Wyoming Y 12.6% 6 3 50/6 2.50% 2.0%
Note: The following states are excluded as the primary plan offered is hybrid or DC: AK, UT, GA, OR. Hawaii is excluded as they do not have a State Police agency.
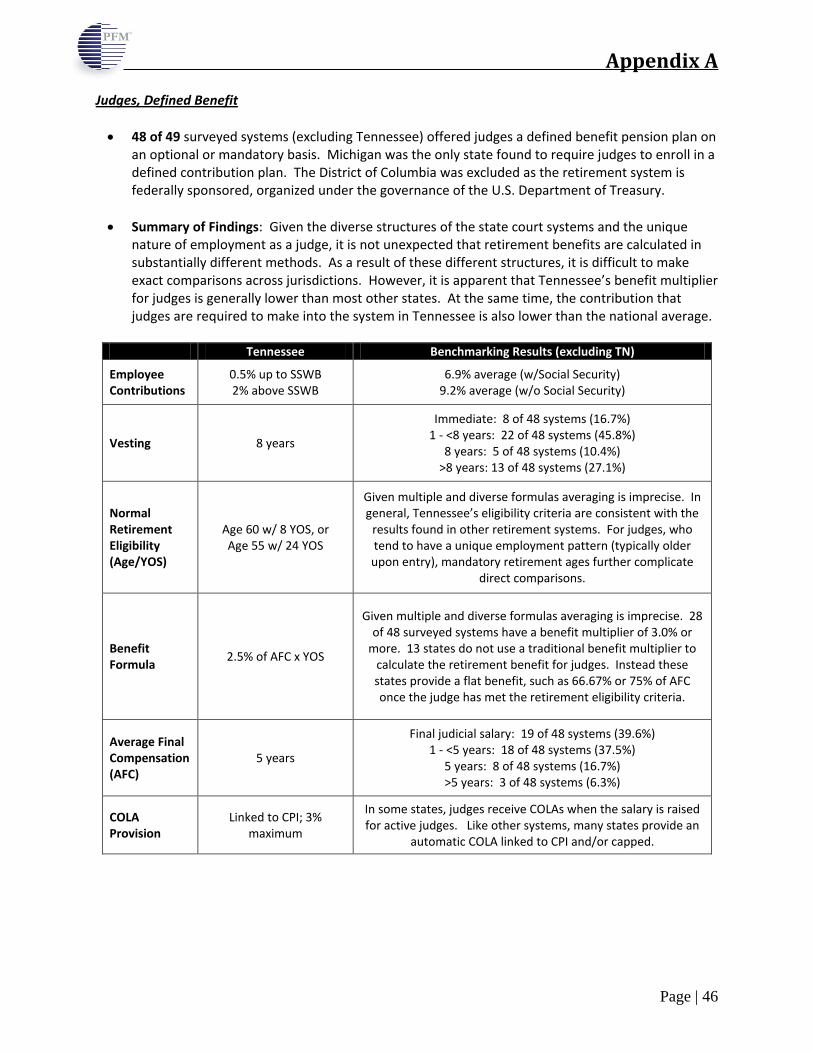
Appendix A
Page | 46
Judges, Defined Benefit • 48 of 49 surveyed systems (excluding Tennessee) offered judges a defined benefit pension plan on
an optional or mandatory basis. Michigan was the only state found to require judges to enroll in a defined contribution plan. The District of Columbia was excluded as the retirement system is federally sponsored, organized under the governance of the U.S. Department of Treasury.
• Summary of Findings: Given the diverse structures of the state court systems and the unique nature of employment as a judge, it is not unexpected that retirement benefits are calculated in substantially different methods. As a result of these different structures, it is difficult to make exact comparisons across jurisdictions. However, it is apparent that Tennessee’s benefit multiplier for judges is generally lower than most other states. At the same time, the contribution that judges are required to make into the system in Tennessee is also lower than the national average.
Tennessee Benchmarking Results (excluding TN)
Employee Contributions
0.5% up to SSWB 2% above SSWB
6.9% average (w/Social Security) 9.2% average (w/o Social Security)
Vesting 8 years
Immediate: 8 of 48 systems (16.7%) 1 - <8 years: 22 of 48 systems (45.8%)
8 years: 5 of 48 systems (10.4%) >8 years: 13 of 48 systems (27.1%)
Normal Retirement Eligibility (Age/YOS)
Age 60 w/ 8 YOS, or Age 55 w/ 24 YOS
Given multiple and diverse formulas averaging is imprecise. In general, Tennessee’s eligibility criteria are consistent with the
results found in other retirement systems. For judges, who tend to have a unique employment pattern (typically older upon entry), mandatory retirement ages further complicate
direct comparisons.
Benefit Formula 2.5% of AFC x YOS
Given multiple and diverse formulas averaging is imprecise. 28 of 48 surveyed systems have a benefit multiplier of 3.0% or
more. 13 states do not use a traditional benefit multiplier to calculate the retirement benefit for judges. Instead these states provide a flat benefit, such as 66.67% or 75% of AFC once the judge has met the retirement eligibility criteria.
Average Final Compensation (AFC)
5 years
Final judicial salary: 19 of 48 systems (39.6%) 1 - <5 years: 18 of 48 systems (37.5%)
5 years: 8 of 48 systems (16.7%) >5 years: 3 of 48 systems (6.3%)
COLA Provision
Linked to CPI; 3% maximum
In some states, judges receive COLAs when the salary is raised for active judges. Like other systems, many states provide an
automatic COLA linked to CPI and/or capped.

Appendix A
Page | 47
Judges, Defined Benefit Plan Comparisons
State Social Security
Employee Contribution
Vesting (Years)
AFC Period (Years)
Normal Retirement Eligibility (Age/YOS; R= “Rule of”) Benefit Formula COLA
1 Tennessee Y .5% <SSWB 2% >SSWB 8 5 60/8; 55/24 2.50% CPI; 3.0% Maximum
2 Alabama Y 8.5% 10 Judicial salary 70/10; 65/12; 62/15; 61/16; 60/17; any/25 75% of AFC Ad hoc basis
3 Alaska N 7.0% 5 Judicial salary 60/5 5.00% Tied to judicial salary increases
4 Arizona N 11.5% Immediate Judicial salary 65/5; 62/10 3.00% Excess earnings
5 Arkansas Y 5.0% Immediate Judicial salary 65/8 3.20% 3.0%
6 California N 8.0% 5 Judicial salary 65/20; 70/5 3.75% CPI; 3% Maximum
7 Colorado N 8.0% 5 Judicial salary 65/any 2.50% Not available
8 Connecticut N 5.0% 10 Judicial salary 65/any; any/20 66.67% of AFC CPI; 3% maximum
9 Delaware Y 3.0% 12 3 62/12; any/22 4.16% x YOS (1-12) + 2.08% x YOS (13-24) Ad hoc basis
10 Florida Y 3.0% 8 8 65/8; any/33 3.30% Retirement service earned on or after 7/1/2011 not subject to a
COLA
11 Georgia Y 7.5% 10 Judicial salary 60/16 66.67% of AFC + 1% for each year of
service over 16 years, not to exceed 24 years
Not available
12 Hawaii Y 9.8% 10 5 55/5 3.50% 1.50% 13 Idaho Y 7.7% 4 Judicial salary 65/4; any/20 5% x YOS (1-10) + 2.5% x YOS (10+) CPI; No Maximum
14 Illinois N 11.0% Immediate 8 67/8 3.00% 3%
15 Indiana Y 6.0% 8 Judicial salary 65/8; R85 60% of AFC with 22 YOS or more Tied to judicial salary increases
16 Iowa Y 9.4% 4 3 50/20; 65/4 3.25% Ad hoc basis
17 Kansas Y 6.0% Immediate 3 62/10; R85; 65/1 3.50% None
18 Kentucky Y 6.0% 8 5 65/any; 60/25 2.75% 1.50%
19 Louisiana N 13.0% 5 5 60/5 3.50% Excess earnings and plan funded level
20 Maine N 7.7% 5 3 any/25; 65/5; 70/any 3.00% Suspended through 2013
21 Maryland Y 6.0% Immediate Judicial salary 60/any 66.67% of AFC w/ 16 YOS Tied to judicial salary increases
22 Massachusetts N 10.0% 10 Judicial salary 65/15 75% of AFC Not available
23 Minnesota Y 8.0% 5 5 65/5 3.20% 2.00%
24 Mississippi Y 9.0% 8 4 60/8; any/30 2% x YOS (1-30) + 2.5% x YOS (30+) 3.00%
25 Missouri Y 4.0% Immediate Judicial salary 62/20; 67/12 50% of AFC 80% of CPI up to 5%
26 Montana Y 7.0% 5 15 60/5 3.33% x YOS (1-15) + 1.785% x YOS (15+) 3.00%

Appendix A
Page | 48
Judges, Defined Benefit Plan Comparisons (Continued)
State Social Security
Employee Contribution
Vesting (Years)
AFC Period (Years)
Normal Retirement Eligibility (Age/YOS; R= “Rule of”) Benefit Formula COLA
-- Tennessee Y 0.5% <SSWB 2% >SSWB 8 5 60/8; 55/24 2.50% CPI; 3.0% Maximum
27 Nebraska Y 9.0% Immediate 3 65/any 3.50% CPI; 2.5% maximum 28 Nevada Y 0.0% 5 3 65/5; any/30; 60/10 3.41% Ranges 2.0% - 5.0%
29 New Hampshire N 10.0% Immediate Judicial salary 60/15; 65/10; 70/7
65/10 = 75% of AFC 70/7 = 45% of AFC + 10% per YOS above 7
60/15 = 70% of AFC + 1% per YOS above 15 Ad hoc basis
30 New Jersey Y 12.0% 10 Judicial salary 70/10; 65-69/15; 60-64/20 75% of AFC Suspended 31 New Mexico Y 9.0% 5 Judicial salary 55/16; 64/5 3.75% 3.00%
32 New York Y 3.0% - 6.0% 10 5 63/20 1.75% x YOS (1-20) + 2.0% x YOS (20+)
50% of CPI; 1.0% minimum; 3.0% maximum; Adjustment is limited to first $18,000 of
employee's allowance 33 North Carolina Y 6.0% 10 4 65/10; 50/24 3.02% Ad hoc basis
34 North Dakota Y 6.0% 5 3 65/5; R85 3.5% x YOS (1-10) + 2.8% x YOS (11-20) + 1.25% (20+ YOS) Ad hoc basis
35 Ohio N 10.0% 5 3 60/5; 65/any; any/30 2.2% x YOS up to 30 + 2.5% x YOS above 30 3.00% 36 Oklahoma Y 8.0% 8 3 60/10; 65/8; R80 4.00% Not available 37 Oregon Y 0.0% 5 3 60/5 3.75% x YOS up to 16 + 2% x YOS above 16 2.00% 38 Pennsylvania Y 6.3% 5 3 60/5; any/35 4% x YOS (1-10) + 3% x YOS (10+) Ad hoc basis 39 Rhode Island Y 12.0% 10 5 65/20; 70/15 80% of AFC Suspended
40 South Carolina Y 10.0% 10 Judicial salary 70/15; 65/20; any/25 71.3% of AFC + 2.67% x YOS above 25 Tied to judicial salary increases
41 South Dakota Y 9.0% 3 3 65/3 3.33% x YOS (1-15) + 2.0% x YOS (15+) CPI and funded status 42 Texas Y 6.0% 10 Judicial salary 65/12; any/20; 65/10 50% of AFC Ad hoc basis
43 Utah Y 0.0% 6 2 62/10; 70/6; any/25 5% x YOS (1-10 years); 2.25% x YOS (10-20 years); 1% x YOS (21+ years) CPI; 4% maximum
44 Vermont Y 6.4% 5 Judicial salary 55/5; any/30 3.33% x YOS CPI; 5% maximum
45 Virginia Y 5.0% 5 5 60/30; 65/5 1.5% x YOS (if appointed before age 45);
2.0% x YOS (if appointed 45-54); 2.5% x YOS (if appointed 55+)
CPI; 6% maximum
46 Washington Y 13.6% 5 5 60/5 3.5% x YOS CPI; 3% maximum 47 West Virginia Y 10.5% 14 3 65/16; Any/24 75% of AFC Ad hoc basis 48 Wisconsin Y 7.1% 5 3 62/5 2% x YOS or 70% of AFC Not available
49 Wyoming Y 9.2% 4 3 60/20; 65/4; 70/any 4% x YOS (1-5); 3% x YOS (6-15); 2% x YOS (16-20); 1% x YOS (21+) CPI; 3% maximum
Note: Michigan was excluded as they offer new judges a DC plan. Washington, DC was excluded as pension benefits are provided through the U.S. Treasury Department.

Appendix B

Appendix B
Page | 50
Hybrid Retirement Plans
State: GeorgiaPlan Type: Hybrid DB-DC
OverviewPlan Name Georgia State Employees' Pension and Savings Plan (GSEPS)Eligibility State employees hired on or after 1/1/2009 (State Police if different)Social Security Participation YesMandatory or Optional Mandatory
Defined Benefit ComponentEmployee Contribution 1.25%Vesting 10 yearsNormal Retirement Eligibility (age/YOS) 60/10; any/30 (State Police: 55/10; any/30)
Benefit Formula1.0% of AFC x YOS (Board may increase multiplier to a maximum of 2.0% if General Assembly appropriates funds for this specific purpose per Chapter 757 of 2008
Average Final Compensation (AFC) Average of highest 24 consecutive monthsCOLA Ad hoc basis
Disability BenefitAt least 15 years of service and be under age 60 to be eligible; 1% of highest average salary x YOS
Symmetry Provision None
Defined Contribution ComponentPlan Type 401(k)Employee Contributions VoluntaryEnrollment Provision Employee is automatically enrolled at hire with 1% employee contributionOpt Out Provision Employee must complete form to opt out of DC planEmployer Matching Contribution 100% match on first 1% EE contribution; 50% match on next 4% EE contributionMaximum Employer Contribution 3%Vesting in ER contribution Graded vesting schedule
Vesting Detail20% after 1 year; 40% after 2 years; 60% after 3 years; 80% after 4 years; 100% after 5 years
Investment Options
Employees may invest in Lifecycle Funds (based on target retirement date) that represent 5 asset classes; Automatically rebalanced quarterly to become more conservative as employee approaches retirement
At their own option employees may invest in one or more of the state's 12 core investments (index funds and actively managed funds) representing various asset categories. Under this option, employees determine their own asset allocation among the available plans and are responsible for "rebalancing" as they near retirement
Employees may also invest in the Self-Directed Brokerage Account that gives employees maximum flexibility and access to most stocks and bonds and more than 8,000 mutual funds. The Self-Directed Brokerage Account is offered through Hewitt Financial Services
DC plan withdrawal options Rollover, annuity, lump sum, partial lump sum, installments
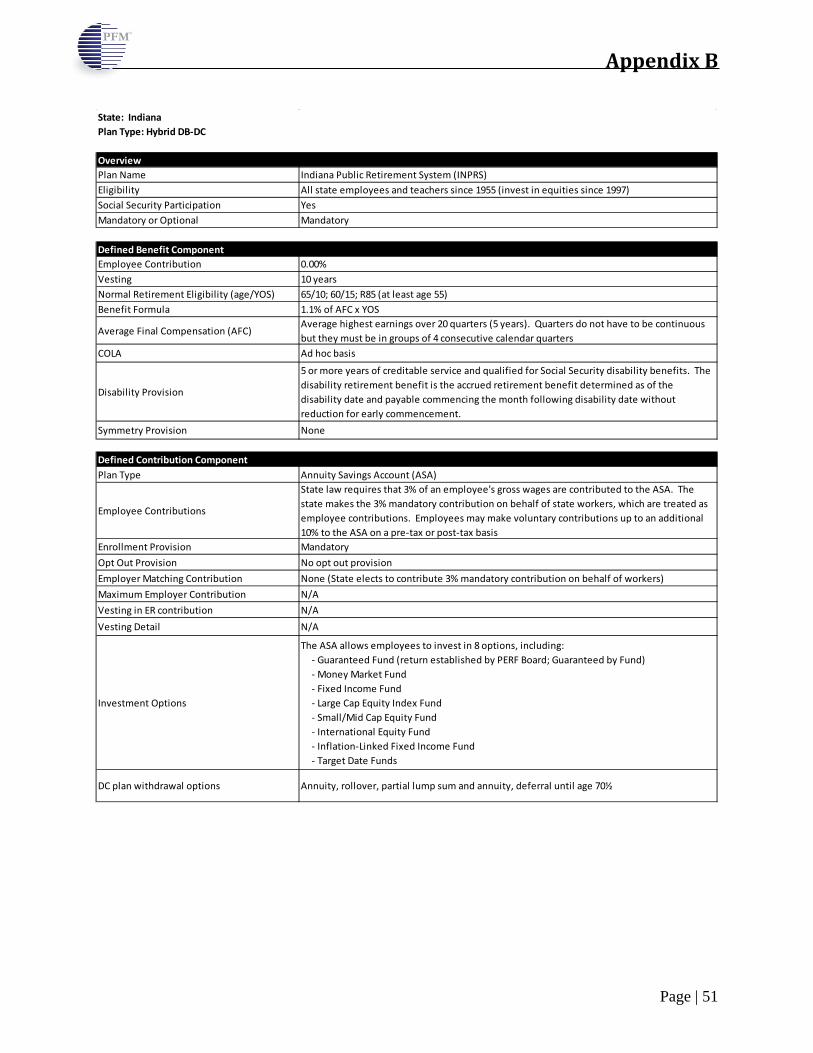
Appendix B
Page | 51
State: IndianaPlan Type: Hybrid DB-DC
OverviewPlan Name Indiana Public Retirement System (INPRS)Eligibility All state employees and teachers since 1955 (invest in equities since 1997)Social Security Participation YesMandatory or Optional Mandatory
Defined Benefit ComponentEmployee Contribution 0.00%Vesting 10 yearsNormal Retirement Eligibility (age/YOS) 65/10; 60/15; R85 (at least age 55)Benefit Formula 1.1% of AFC x YOS
Average Final Compensation (AFC)Average highest earnings over 20 quarters (5 years). Quarters do not have to be continuous but they must be in groups of 4 consecutive calendar quarters
COLA Ad hoc basis
Disability Provision
5 or more years of creditable service and qualified for Social Security disability benefits. The disability retirement benefit is the accrued retirement benefit determined as of the disability date and payable commencing the month following disability date without reduction for early commencement.
Symmetry Provision None
Defined Contribution ComponentPlan Type Annuity Savings Account (ASA)
Employee Contributions
State law requires that 3% of an employee's gross wages are contributed to the ASA. The state makes the 3% mandatory contribution on behalf of state workers, which are treated as employee contributions. Employees may make voluntary contributions up to an additional 10% to the ASA on a pre-tax or post-tax basis
Enrollment Provision MandatoryOpt Out Provision No opt out provisionEmployer Matching Contribution None (State elects to contribute 3% mandatory contribution on behalf of workers)Maximum Employer Contribution N/AVesting in ER contribution N/AVesting Detail N/A
Investment Options
The ASA allows employees to invest in 8 options, including: - Guaranteed Fund (return established by PERF Board; Guaranteed by Fund) - Money Market Fund - Fixed Income Fund - Large Cap Equity Index Fund - Small/Mid Cap Equity Fund - International Equity Fund - Inflation-Linked Fixed Income Fund - Target Date Funds
DC plan withdrawal options Annuity, rollover, partial lump sum and annuity, deferral until age 70½

Appendix B
Page | 52
Note: Michigan State Police hired after October 2012 will be enrolled in a hybrid retirement plan. Non-law enforcement state employees already participate in a defined contribution plan.
State: MichiganPlan Type: Optional Hybrid DB-DC
OverviewPlan Name Michigan Public School Employees Retirement SystemEligibility Teachers hired after 7/1/2010Social Security Participation YesMandatory or Optional Optional for teachers hired after 9/4/2012 (choice of hybrid or DC only)
Defined Benefit Component
Employee Contribution
Varies by earnings:$0 - $5,000: 3.0%$5,000.01 - $15,000: 3.6%$15,000.01 and up: 6.4%
Vesting 10 yearsNormal Retirement Eligibility (age/YOS) 60/10Benefit Formula 1.5% of AFC x YOSAverage Final Compensation (AFC) Average of highest 5 consecutive years
COLA Automatic 3% increase annually
Disability Provision
A duty disability retirement is calculated by multiplying your years of service times 1.5 percent times your final average compensation. Service credit of at least 10 YOS to calculate a duty disability pension, even if you have not worked for the public school system that long.
Symmetry Provision None
Defined Contribution ComponentPlan Type Employee contributions are invested in a 457 plan; Employer contributions in a 401(k)
Employee ContributionsEmployee is automatically enrolled at hire with a 2% contribution; Employee may elect to make additional voluntary contributions
Enrollment Provision OptionalOpt Out Provision Employee must complete form to opt out of DC planEmployer Matching Contribution Employer matches 50% of Employee contributions up to a maximum of 1%Maximum Employer Contribution 1%Vesting in ER contribution GradedVesting Detail After 2 years: 50%; After 3 years: 75%; After 4 years: 100%
Investment Options
Employees may invest in target retirement date funds (automatically rebalanced as employee approaches retirement age), index funds, and actively managed fund options
Employees may also invest in a Self-Managed Account (SMA). The SMA is a brokerage account that gives access to most individual stocks, bonds, certificates of deposit (CDs), exchange-traded funds (ETFs), and more than 10,000 different mutual funds (all for an additional fee and at your own risk).
DC plan withdrawal options Lump sum, consolidation from other plans, direct rollover to an IRA, periodic distribution

Appendix B
Page | 53
State: OhioPlan Type: Optional Hybrid DB-DC; referred to as "Combined Plan"
OverviewPlan Name Ohio Public Employees' Retirement System (OPERS)Eligibility All state employees and teachers hired since 2003Social Security Participation NoMandatory or Optional Optional
Defined Benefit ComponentEmployee Contribution 0.00%Vesting 5 yearsNormal Retirement Eligibility (age/YOS) 55/25; any/30; 60/5Benefit Formula 1.0% of AFC x YOS up to 30 years + 1.25% x YOS above 30 yearsAverage Final Compensation (AFC) Average of highest 3 yearsCOLA Automatic; 3% of original pension amount annually
Disability Provision
Participants in the Combined Plan must have at least 5 years of service credit. Disability allowance is based on the AFC and years of service with OPERS, with no early retirement reductions, but cannot be less than 45% or exceed 60% of AFC. In the revised plan, the disability benefit ends when the employee reaches age 65 (varies by age at time of disability) and converts to service pension (2.2% of AFC x contributing & disability YOS, not to exceed 45%)
Symmetry Provision None
Defined Contribution ComponentPlan Type 401(a)
Employee Contributions10% employee contribution (less administrative fee) is deposited into the employees individual defined contribution account
Enrollment Provision Mandatory (though participation in hybrid plan is optional)Opt Out Provision No opt out provision (though participation in hybrid plan is optional)Employer Matching Contribution No employer matching contributionMaximum Employer Contribution N/AVesting in ER contribution N/AVesting Detail N/A
Investment Options
OPERS offers 10 target date funds that are professionally managed with automatic asset allocations based on expected date of retirement. The target date funds also provide "rebalancing" of the portfolio as the individual approaches retirement
OPERS also allows employees to build their own portfolio with 6 core investment funds, ranging from low-risk to growth oriented, higher risk options
OPERS also offers a mutual fund-only Self-Directed Brokerage Account (SDBA), through Charles Schwab's Personal Choice Retirement Account. A maximum of 50% of a members portfolio is allowed to be invested through this brokerage, though the plan will not rebalance if investments grow to exceed 50% of a participants total assets
DC plan withdrawal options Annuity, including partial lump sum option plan; deferral until age 70½
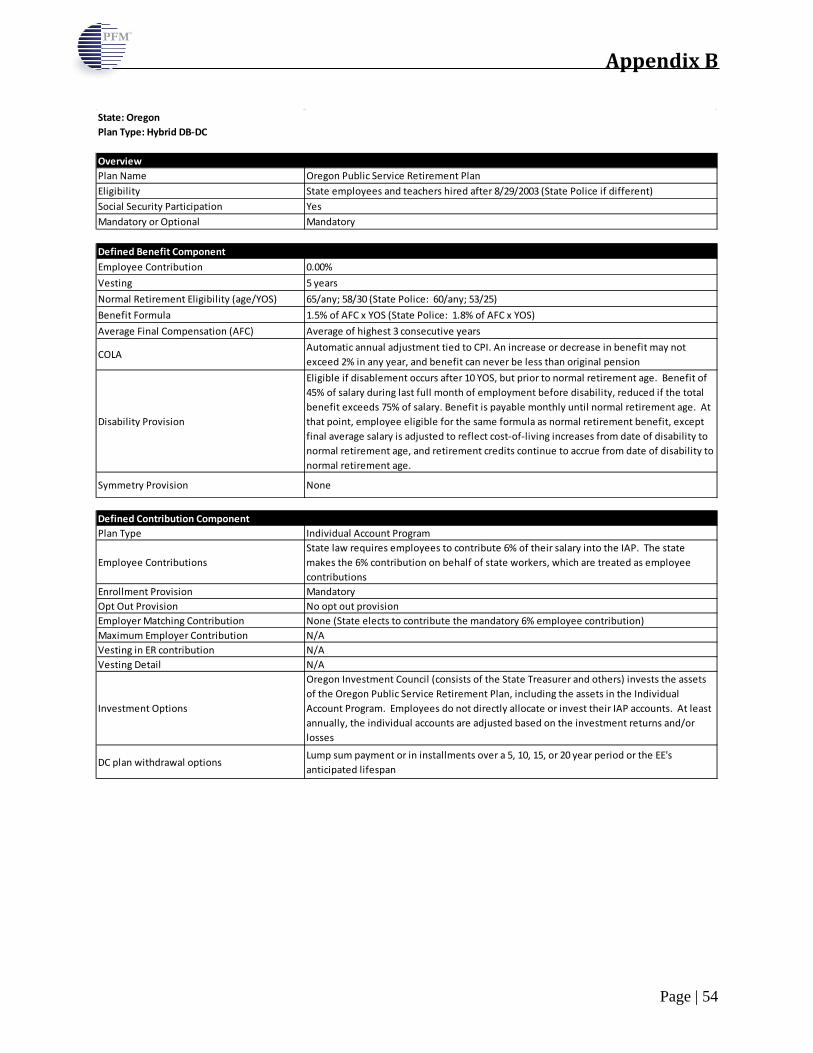
Appendix B
Page | 54
State: OregonPlan Type: Hybrid DB-DC
OverviewPlan Name Oregon Public Service Retirement PlanEligibility State employees and teachers hired after 8/29/2003 (State Police if different)Social Security Participation YesMandatory or Optional Mandatory
Defined Benefit ComponentEmployee Contribution 0.00%Vesting 5 yearsNormal Retirement Eligibility (age/YOS) 65/any; 58/30 (State Police: 60/any; 53/25)Benefit Formula 1.5% of AFC x YOS (State Police: 1.8% of AFC x YOS)Average Final Compensation (AFC) Average of highest 3 consecutive years
COLAAutomatic annual adjustment tied to CPI. An increase or decrease in benefit may not exceed 2% in any year, and benefit can never be less than original pension
Disability Provision
Eligible if disablement occurs after 10 YOS, but prior to normal retirement age. Benefit of 45% of salary during last full month of employment before disability, reduced if the total benefit exceeds 75% of salary. Benefit is payable monthly until normal retirement age. At that point, employee eligible for the same formula as normal retirement benefit, except final average salary is adjusted to reflect cost-of-living increases from date of disability to normal retirement age, and retirement credits continue to accrue from date of disability to normal retirement age.
Symmetry Provision None
Defined Contribution ComponentPlan Type Individual Account Program
Employee ContributionsState law requires employees to contribute 6% of their salary into the IAP. The state makes the 6% contribution on behalf of state workers, which are treated as employee contributions
Enrollment Provision MandatoryOpt Out Provision No opt out provisionEmployer Matching Contribution None (State elects to contribute the mandatory 6% employee contribution)Maximum Employer Contribution N/AVesting in ER contribution N/AVesting Detail N/A
Investment Options
Oregon Investment Council (consists of the State Treasurer and others) invests the assets of the Oregon Public Service Retirement Plan, including the assets in the Individual Account Program. Employees do not directly allocate or invest their IAP accounts. At least annually, the individual accounts are adjusted based on the investment returns and/or losses
DC plan withdrawal optionsLump sum payment or in installments over a 5, 10, 15, or 20 year period or the EE's anticipated lifespan
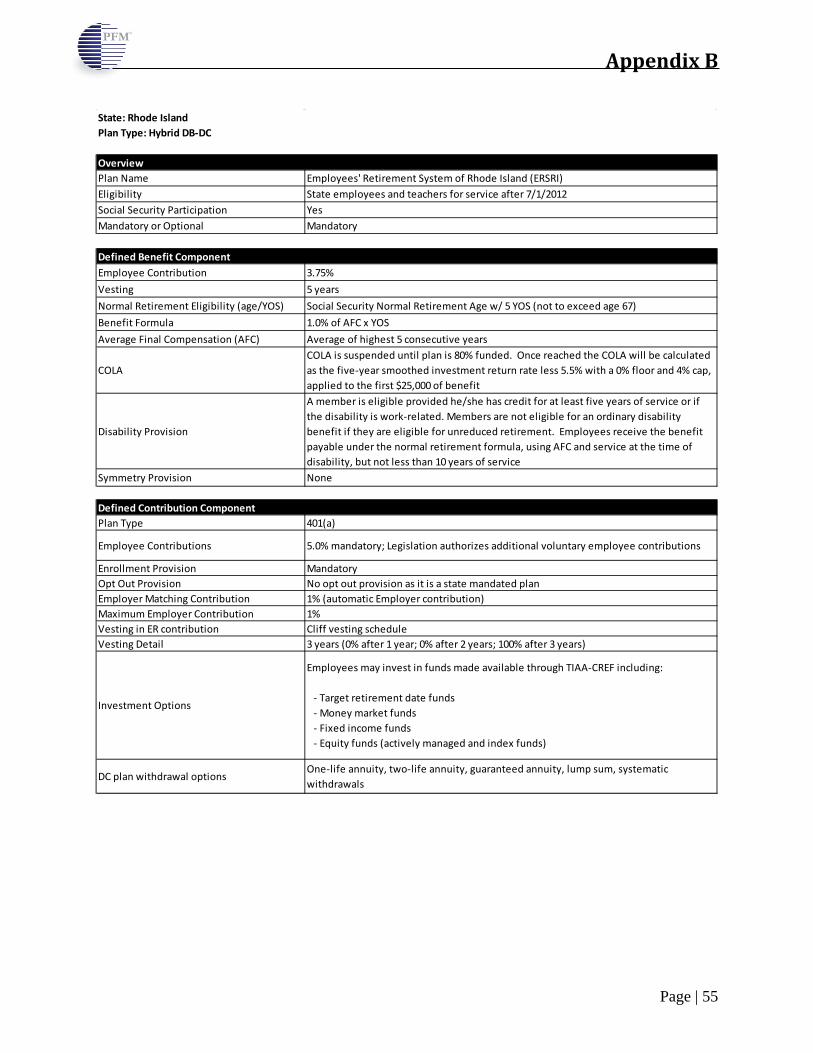
Appendix B
Page | 55
State: Rhode IslandPlan Type: Hybrid DB-DC
OverviewPlan Name Employees' Retirement System of Rhode Island (ERSRI)Eligibility State employees and teachers for service after 7/1/2012Social Security Participation YesMandatory or Optional Mandatory
Defined Benefit ComponentEmployee Contribution 3.75%Vesting 5 yearsNormal Retirement Eligibility (age/YOS) Social Security Normal Retirement Age w/ 5 YOS (not to exceed age 67)Benefit Formula 1.0% of AFC x YOSAverage Final Compensation (AFC) Average of highest 5 consecutive years
COLACOLA is suspended until plan is 80% funded. Once reached the COLA will be calculated as the five-year smoothed investment return rate less 5.5% with a 0% floor and 4% cap, applied to the first $25,000 of benefit
Disability Provision
A member is eligible provided he/she has credit for at least five years of service or if the disability is work-related. Members are not eligible for an ordinary disability benefit if they are eligible for unreduced retirement. Employees receive the benefit payable under the normal retirement formula, using AFC and service at the time of disability, but not less than 10 years of service
Symmetry Provision None
Defined Contribution ComponentPlan Type 401(a)
Employee Contributions 5.0% mandatory; Legislation authorizes additional voluntary employee contributions
Enrollment Provision MandatoryOpt Out Provision No opt out provision as it is a state mandated planEmployer Matching Contribution 1% (automatic Employer contribution)Maximum Employer Contribution 1%Vesting in ER contribution Cliff vesting scheduleVesting Detail 3 years (0% after 1 year; 0% after 2 years; 100% after 3 years)
Investment Options
Employees may invest in funds made available through TIAA-CREF including:
- Target retirement date funds - Money market funds - Fixed income funds - Equity funds (actively managed and index funds)
DC plan withdrawal optionsOne-life annuity, two-life annuity, guaranteed annuity, lump sum, systematic withdrawals
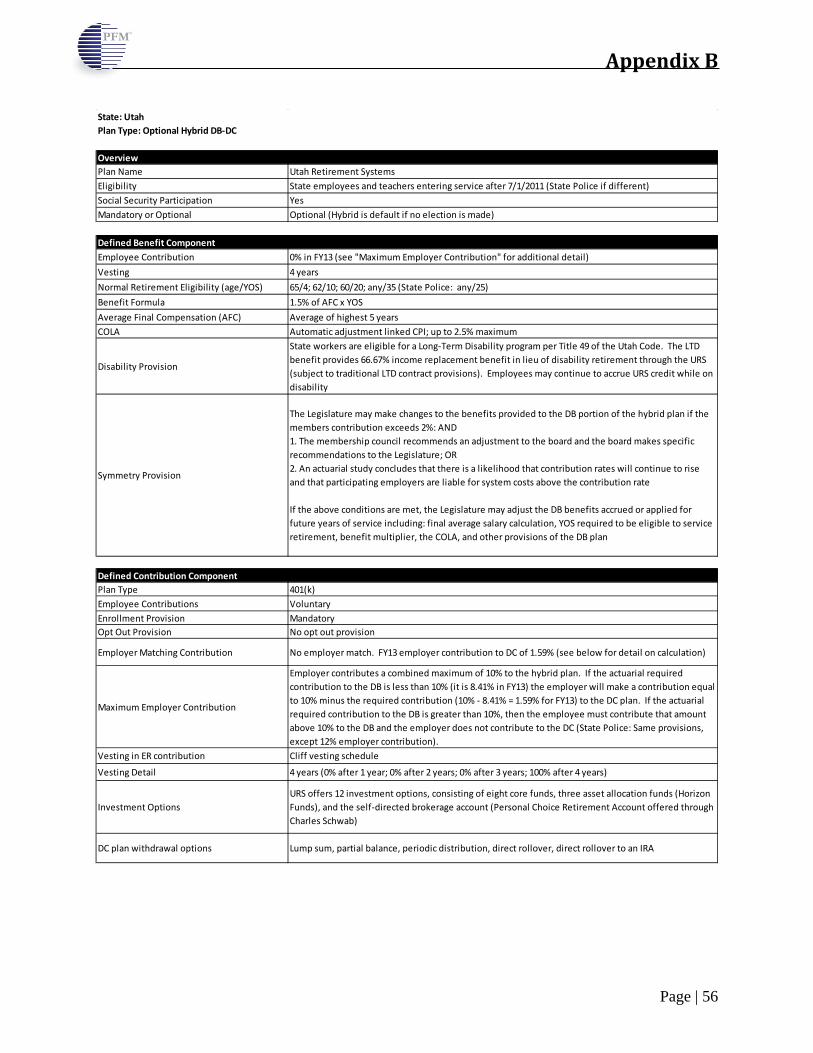
Appendix B
Page | 56
State: UtahPlan Type: Optional Hybrid DB-DC
OverviewPlan Name Utah Retirement SystemsEligibility State employees and teachers entering service after 7/1/2011 (State Police if different)Social Security Participation YesMandatory or Optional Optional (Hybrid is default if no election is made)
Defined Benefit ComponentEmployee Contribution 0% in FY13 (see "Maximum Employer Contribution" for additional detail)Vesting 4 yearsNormal Retirement Eligibility (age/YOS) 65/4; 62/10; 60/20; any/35 (State Police: any/25)Benefit Formula 1.5% of AFC x YOSAverage Final Compensation (AFC) Average of highest 5 yearsCOLA Automatic adjustment linked CPI; up to 2.5% maximum
Disability Provision
State workers are eligible for a Long-Term Disability program per Title 49 of the Utah Code. The LTD benefit provides 66.67% income replacement benefit in lieu of disability retirement through the URS (subject to traditional LTD contract provisions). Employees may continue to accrue URS credit while on disability
Symmetry Provision
The Legislature may make changes to the benefits provided to the DB portion of the hybrid plan if the members contribution exceeds 2%: AND1. The membership council recommends an adjustment to the board and the board makes specific recommendations to the Legislature; OR2. An actuarial study concludes that there is a likelihood that contribution rates will continue to rise and that participating employers are liable for system costs above the contribution rate
If the above conditions are met, the Legislature may adjust the DB benefits accrued or applied for future years of service including: final average salary calculation, YOS required to be eligible to service retirement, benefit multiplier, the COLA, and other provisions of the DB plan
Defined Contribution ComponentPlan Type 401(k)Employee Contributions VoluntaryEnrollment Provision MandatoryOpt Out Provision No opt out provision
Employer Matching Contribution No employer match. FY13 employer contribution to DC of 1.59% (see below for detail on calculation)
Maximum Employer Contribution
Employer contributes a combined maximum of 10% to the hybrid plan. If the actuarial required contribution to the DB is less than 10% (it is 8.41% in FY13) the employer will make a contribution equal to 10% minus the required contribution (10% - 8.41% = 1.59% for FY13) to the DC plan. If the actuarial required contribution to the DB is greater than 10%, then the employee must contribute that amount above 10% to the DB and the employer does not contribute to the DC (State Police: Same provisions, except 12% employer contribution).
Vesting in ER contribution Cliff vesting schedule
Vesting Detail 4 years (0% after 1 year; 0% after 2 years; 0% after 3 years; 100% after 4 years)
Investment OptionsURS offers 12 investment options, consisting of eight core funds, three asset allocation funds (Horizon Funds), and the self-directed brokerage account (Personal Choice Retirement Account offered through Charles Schwab)
DC plan withdrawal options Lump sum, partial balance, periodic distribution, direct rollover, direct rollover to an IRA

Appendix B
Page | 57
State: VirginiaPlan Type: Hybrid DB-DC
OverviewPlan Name Virginia Retirement SystemEligibility State employees and teachers hired after 1/1/2014Social Security Participation YesMandatory or Optional Mandatory
Defined Benefit ComponentEmployee Contribution 4.00%Vesting 5 yearsNormal Retirement Eligibility (age/YOS) SSNRA/5Benefit Formula 1.0% of AFC x YOSAverage Final Compensation (AFC) Average of highest 5 consecutive years
COLAAutomatic annual adjustment tied to CPI; Maximum of 3% COLA calculated as 100% of first 2% CPI growth plus 50% of next 2% CPI growth
Disability ProvisionLong-Term Disability provided through the Virginia Sickness and Disability Program. Disabled employees eligible for replacement of 60% of income, during which time they continue to accrue VRS service credit.
Symmetry Provision None
Defined Contribution ComponentPlan Type 401(a)Employee Contributions 1.0% mandatory / up to 4.0% voluntaryEnrollment Provision MandatoryOpt Out Provision None
Employer Matching ContributionThe employer matches the 1.0% mandatory employee contribution. In addition, the employer matches the first 1.0% of voluntary employee contributions at 100%, and the next 3.0% of voluntary employee contributions at 50%
Maximum Employer Contribution 4%Vesting in ER contribution GradedVesting Detail 50% after 2 years; 75% after 3 years; 100% after 4 years
Investment OptionsDetails on investment options under new hybrid plan not published as of 10/30/2012 (implementation not until 1/1/2014)
DC plan withdrawal optionsDetails on withdrawal option under new hybrid plan not published as of 10/30/2012 (implementation not until 1/1/2014)
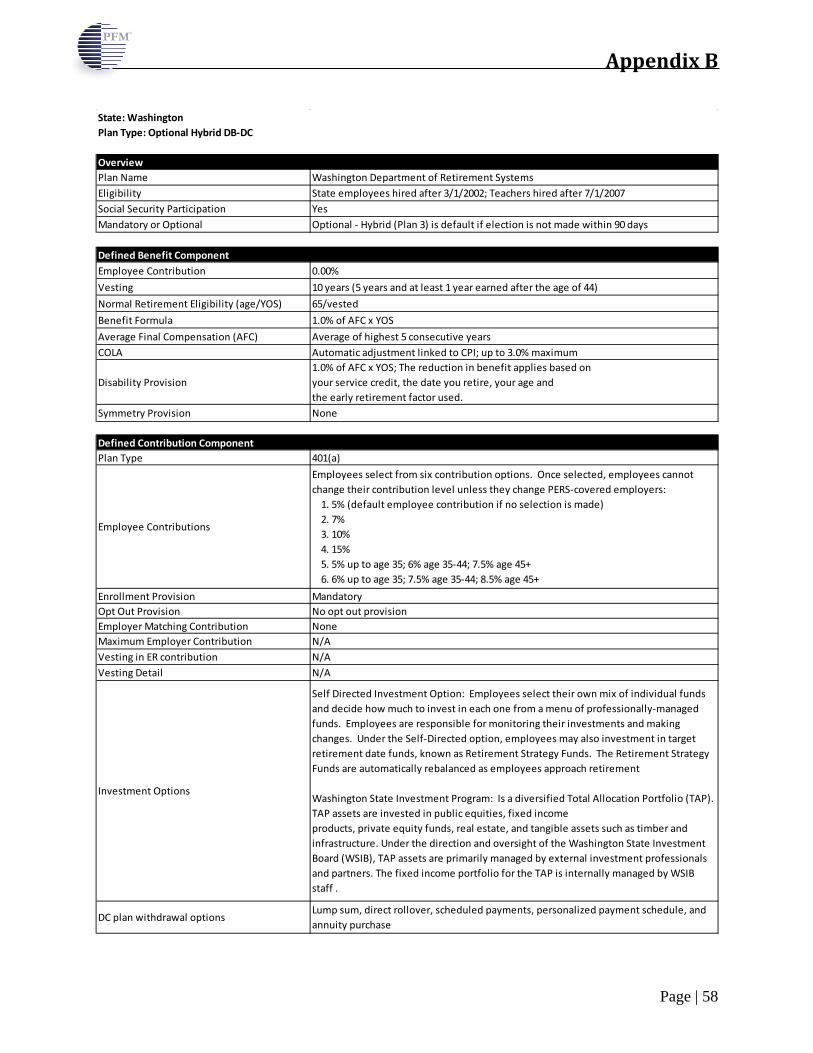
Appendix B
Page | 58
State: WashingtonPlan Type: Optional Hybrid DB-DC
OverviewPlan Name Washington Department of Retirement SystemsEligibility State employees hired after 3/1/2002; Teachers hired after 7/1/2007Social Security Participation YesMandatory or Optional Optional - Hybrid (Plan 3) is default if election is not made within 90 days
Defined Benefit ComponentEmployee Contribution 0.00%Vesting 10 years (5 years and at least 1 year earned after the age of 44)Normal Retirement Eligibility (age/YOS) 65/vestedBenefit Formula 1.0% of AFC x YOSAverage Final Compensation (AFC) Average of highest 5 consecutive yearsCOLA Automatic adjustment linked to CPI; up to 3.0% maximum
Disability Provision1.0% of AFC x YOS; The reduction in benefit applies based onyour service credit, the date you retire, your age andthe early retirement factor used.
Symmetry Provision None
Defined Contribution ComponentPlan Type 401(a)
Employee Contributions
Employees select from six contribution options. Once selected, employees cannot change their contribution level unless they change PERS-covered employers: 1. 5% (default employee contribution if no selection is made) 2. 7% 3. 10% 4. 15% 5. 5% up to age 35; 6% age 35-44; 7.5% age 45+ 6. 6% up to age 35; 7.5% age 35-44; 8.5% age 45+
Enrollment Provision MandatoryOpt Out Provision No opt out provisionEmployer Matching Contribution NoneMaximum Employer Contribution N/AVesting in ER contribution N/AVesting Detail N/A
Investment Options
Self Directed Investment Option: Employees select their own mix of individual funds and decide how much to invest in each one from a menu of professionally-managed funds. Employees are responsible for monitoring their investments and making changes. Under the Self-Directed option, employees may also investment in target retirement date funds, known as Retirement Strategy Funds. The Retirement Strategy Funds are automatically rebalanced as employees approach retirement
Washington State Investment Program: Is a diversified Total Allocation Portfolio (TAP). TAP assets are invested in public equities, fixed incomeproducts, private equity funds, real estate, and tangible assets such as timber and infrastructure. Under the direction and oversight of the Washington State Investment Board (WSIB), TAP assets are primarily managed by external investment professionals and partners. The fixed income portfolio for the TAP is internally managed by WSIB staff .
DC plan withdrawal optionsLump sum, direct rollover, scheduled payments, personalized payment schedule, and annuity purchase

Appendix B
Page | 59
State: Federal Government Workers, All LocationsPlan Type: Hybrid DB-DC
OverviewPlan Name Federal Employees Retirement SystemEligibility Federal civilian employees hired on or after 1/1/1987Social Security Participation YesMandatory or Optional Mandatory
Defined Benefit ComponentEmployee Contribution 3.10%Vesting 5 yearsNormal Retirement Eligibility (age/YOS) 62/5; 60/20; 57/30 (if born 1970 or later)
Benefit FormulaUnder age 62 or Age 62 w/ less than 20 YOS: 1.0% of AFC x YOSAge 62 or older w/ 20 or more YOS: 1.1% of AFC x YOS
Average Final Compensation (AFC) Average of highest 3 consecutive years
COLAFERS members: If the increase in the CPI is 2% or less, the COLA is equal to the CPI increase. If the CPI increase is more than 2% but no more than 3%, the COLA is 2%. If the CPI increase is more than 3%, the adjustment is 1% less than the CPI increase
Disability Provision
If under age 62 and not eligible for voluntary immediate retirement, 60% of AFC minus social security benefits for the first 12 months. After 12 months, the benefit reduces to 40% of AFC minus 60% of social security benefit. At age 62, the annuity is recomputed using an amount that essentially represents the annuity the employee would have received had they continued working until eligible for normal retirement.
Symmetry Provision None
Defined Contribution ComponentPlan Type Thrift Savings PlanEmployee Contributions Employees may contribute on a voluntary basis
Enrollment Provision MandatoryOpt Out Provision None
Employer Matching Contribution1% automatic contribution; 100% match on next 3% employee voluntary contribution; 50% match on next 2% employee voluntary contribution
Maximum Employer Contribution 5%Vesting in ER contribution Cliff vestingVesting Detail 3 years (0% after 1 year; 0% after 2 years; 100% after 3 years)
Investment Options
The TSP has a selection of individual and lifecycle funds that offer broad market diversification. Employee can choose to have retirement dollars invested in everything from a short-term U.S. Treasury security to index funds comprised of domestic and international stocks.
DC plan withdrawal optionsPartial withdrawal, level-amount monthly withdrawals, various guaranteed lifetime annuities

Appendix C

Appendix C
Page | 61
Cash Balance Plans
Kansas Louisiana Nebraska Applicability State Employees and Teachers State Employees and Teachers State Employees Mandatory or Optional Mandatory Mandatory Mandatory
Social Security Y N Y
Vesting 5 years 5 years 3 years Employee Contributions 6.0% 8.0% 4.8%
Employer Contributions
Employer contributions are made on a quarterly basis:
< 5 YOS: 3%
5 to < 12 YOS: 4% 12 to < 24 YOS: 5%
24+ YOS: 6%
Each member account will receive an employer contribution of 4% annually, for a total contribution of 12% of pay (employer
+ employee)
The state matches employee contributions at 156%, for a total state contribution of
7.49%
Guaranteed Interest Credit
Effective January 1, 2015, the interest credits will be 5.25% per year
The retirement board may provide an
additional interest credit up to 4% if the funding ratio of the system is 80% or
greater. To calculate the additional interest credit, the board may provide the lesser of
4% or the system funded ratio multiplied by the systems rate of return in excess of 8%
(rate of return must be greater than 10% for additional credit to apply)
Accounts shall earn interest at a rate equal to the system's actuarial rate of return as
determined in the system's actuarial valuation, less 1%
In no case shall the balance in the employee's account be debited for
investment losses
The interest credit rate is defined in state statute as the greater of 5%, or the federal
mid-term rate plus 1.5%. If the federal mid-term rate falls below 3.5%, the employee is
guaranteed 5% interest per year
The federal mid-term rate is based on the average market yield on outstanding obligations of the United States with
maturities of at least 3 years, but no more than 9 years
Kansas: Cash balance plan mandatory for employees hired after January 1, 2015 (Chapter 171, Laws of 2012). Louisiana: Cash balance plan mandatory for employees hired after July 1, 2013 (Chapter 483 Laws of 2012). In January 2013, a Louisiana district court overturned the cash balance plan as unconstitutional. An appeal of this decision is pending.

Appendix D
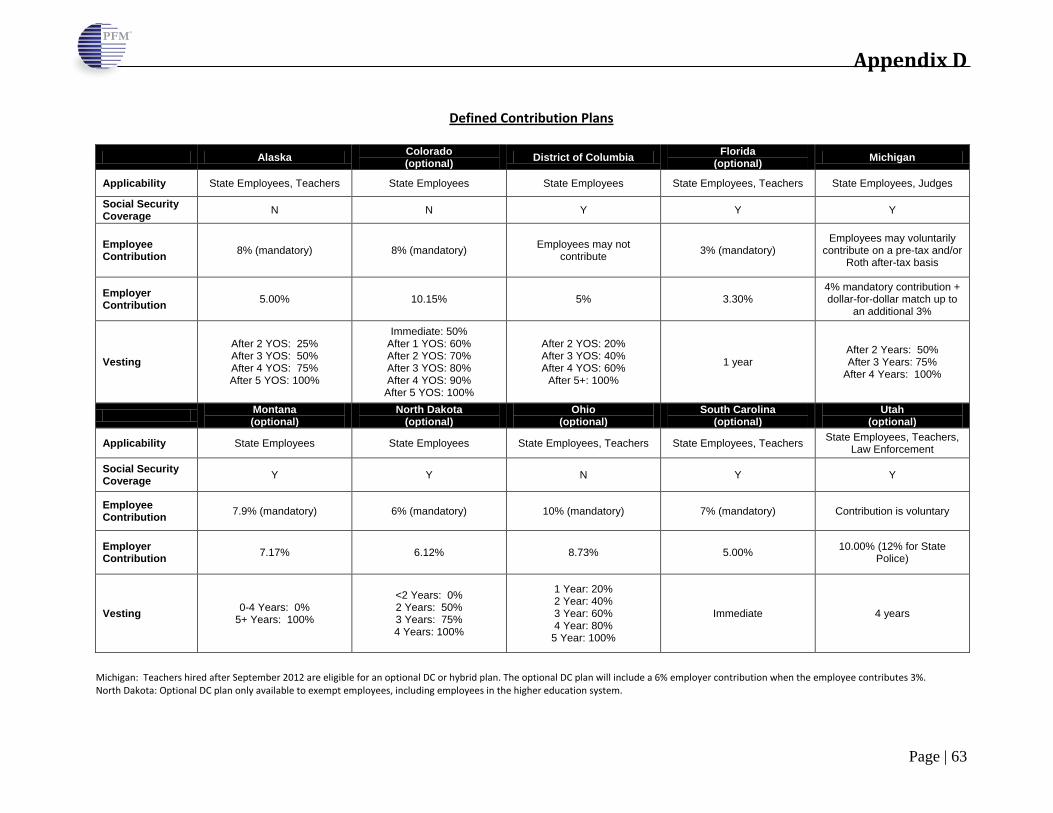
Appendix D
Page | 63
Defined Contribution Plans
Alaska Colorado (optional) District of Columbia Florida
(optional) Michigan
Applicability State Employees, Teachers State Employees State Employees State Employees, Teachers State Employees, Judges
Social Security Coverage N N Y Y Y
Employee Contribution 8% (mandatory) 8% (mandatory) Employees may not
contribute 3% (mandatory) Employees may voluntarily
contribute on a pre-tax and/or Roth after-tax basis
Employer Contribution 5.00% 10.15% 5% 3.30%
4% mandatory contribution + dollar-for-dollar match up to
an additional 3%
Vesting After 2 YOS: 25% After 3 YOS: 50% After 4 YOS: 75% After 5 YOS: 100%
Immediate: 50% After 1 YOS: 60% After 2 YOS: 70% After 3 YOS: 80% After 4 YOS: 90% After 5 YOS: 100%
After 2 YOS: 20% After 3 YOS: 40% After 4 YOS: 60%
After 5+: 100%
1 year After 2 Years: 50% After 3 Years: 75%
After 4 Years: 100%
Montana (optional)
North Dakota (optional)
Ohio (optional)
South Carolina (optional)
Utah (optional)
Applicability State Employees State Employees State Employees, Teachers State Employees, Teachers State Employees, Teachers, Law Enforcement
Social Security Coverage Y Y N Y Y
Employee Contribution 7.9% (mandatory) 6% (mandatory) 10% (mandatory) 7% (mandatory) Contribution is voluntary
Employer Contribution 7.17% 6.12% 8.73% 5.00% 10.00% (12% for State
Police)
Vesting 0-4 Years: 0% 5+ Years: 100%
<2 Years: 0% 2 Years: 50% 3 Years: 75% 4 Years: 100%
1 Year: 20% 2 Year: 40% 3 Year: 60% 4 Year: 80%
5 Year: 100%
Immediate 4 years
Michigan: Teachers hired after September 2012 are eligible for an optional DC or hybrid plan. The optional DC plan will include a 6% employer contribution when the employee contributes 3%. North Dakota: Optional DC plan only available to exempt employees, including employees in the higher education system.

Appendix E

Appendix E
Page | 65
Highlights of Recent Retirement System Reforms The following highlights of recent state level retirement reforms, while not exhaustive, provide a broad overview of the widespread actions that have taken place to address long-term pension funding pressures. While each state’s unique set of fiscal circumstances and legal and regulatory environment play a role in shaping the type of reform enacted, it is clear that state legislatures across the country recognize retirement benefit costs as a growing area of concern. California: In September 2012, the California State Legislature adopted A.B. 340 – known as the Public Employees’ Pension Reform Act (PEPRA) – to significantly reform the defined benefit plans offered through the California Public Employees’ Retirement System and the California State Teachers’ Retirement System. Under PEPRA, state employees, teachers, and employees of participating local governments hired after January 1, 2013, will be subject to the following key provisions:
• Requires all employees to contribute 50% of the normal cost of their pension benefit.
• Caps the compensation used to calculate the retirement benefit for all new members at the Social Security wage base ($113,700 in 2013). The cap will be adjusted annually based on changes in the Consumer Price Index for all Urban Consumers.
• Requires that the average final compensation be defined for new employees as the highest average compensation over a 3-year period based on regular, recurring pay (up from single highest year for many employees; limited to Social Security wage base as noted above).
• Requires newly hired non-safety state and local government employees and teachers to participate in a new benefit tier with a reduced multiplier and a higher normal retirement age (2% at age 62).
• Requires newly hired safety employees to enroll in one of three new tiers with a reduced multiplier and a higher normal retirement age relative to current employees. PEPRA requires that new safety members be provided with the new formula that is closest to the formula offered to current members of the same classification (2% at age 57; 2.5% at age 57, or 2.7% at age 57).
Georgia: Since January 1, 2009, state employees and public safety employees have been required to participate in the Georgia State Employees’ Pension and Savings Plan (SB 328 of 2008), a hybrid retirement system that provides employees with a defined benefit pension with a lower benefit multiplier and a defined contribution account. Under the State’s hybrid plan:
• Employees contribute 1.25% of salary toward the defined benefit component and receive 1% of final average compensation per year of service with an unreduced retirement.
• Employees are automatically enrolled in the 401(k) account with a 1% employee contribution. Employees may elect to opt out of the defined contribution plan entirely or to increase their contributions per IRS limits. The State provides a matching contribution up to 3% of salary.
Kansas: In 2012 the State of Kansas enacted significant reforms to the Kansas Public Employees’ Retirement System (KPERS) for current and future employees (HB 2333).

Appendix E
Page | 66
• Under the reforms adopted, current employees, pending IRS approval, will be permitted to continue their contribution rate of 4% and be subject to a reduced benefit multiplier of 1.4% for future service (down from 1.75%) or increase their contribution to 6% and receive a multiplier of 1.85% per year of service.
• The reforms implemented for future employees are much more significant. The new law will require KPERS to establish a cash balance plan, that while considered a defined benefit plan includes elements of a defined contribution as well, for future state employees, teachers, and local government employees hired after January 1, 2015.
Louisiana: In 2012 the State of Louisiana also took action to implement structural changes to the Louisiana State Employees’ Retirement System (HB 61). Under the new law state employees and teachers hired after July 1, 2013, will be required to participate in a cash balance plan. In January 2013, a Louisiana district court, declared the cash balance plan unconstitutional on grounds that its passage required a two-thirds majority vote (70 total votes in favor) in the State Legislature. An appeal of the decision is pending. Michigan: In September 2012, the State of Michigan enacted retirement reforms for teachers participating in the Public School Employees’ Retirement System (HB 1040).
• Under the law, newly hired teachers will have the option to participate in a defined contribution plan or in the hybrid plan that has been the primary retirement options for teachers hired since July 1, 2010.
• Employees hired before July 1, 2010, participating in the defined benefit plan, would have the option to increase their contribution in order to maintain a benefit multiplier of 1.5% or continue at their current contribution level and be subject to a reduced multiplier of 1.25%.
• The law also eliminated the current retiree medical program for new employees and replaced it with a defined contribution model with matching employer contributions up to 2%. These funds are deposited into a 401(k) type account to be used to offset the purchase of future retiree medical benefits.
• Also in Michigan, state police officers beginning with the 123rd Trooper Recruit class (graduated in October 2012), will be required to participate in a hybrid plan that combines elements of a reduced defined benefit pension with a defined contribution account. Other reforms for new hires agreed to by the Michigan State Police Troopers Association will eliminate the Deferred Retirement Option Program (DROP), eliminate the automatic post-retirement COLA, and replace the current retiree health benefit plan with a 2% employer matching contribution to a 401(k) type account (same reforms as enacted for State Employees).
New York: The State of New York created a new defined benefit tier for employees hired after April 1, 2012, known as Tier VI (Chapter 18, Laws of 2012). Under this new tier employee contributions will vary based on an employee’s salary, ranging from a low of 3% for employees earning less than $45,000 up to 6% for employees earning $100,000 or more. The new tier also includes the following general plan design changes:
• Increased the normal retirement age to 63 (up from 62 for most employees).

Appendix E
Page | 67
• Increased average final salary calculation from the highest 3 year average to the highest 5 year average.
• Reduced benefit multipliers. Rhode Island: The Rhode Island Retirement Security Act of 2011 (RIRSA) made significant changes to the retirement benefits for current and newly hired state employees, teachers, and local government workers. For most employees, RIRSA created a hybrid retirement plan that combines elements of a reduced pension benefit with a defined contribution account. Judges and state police were able to continue their defined benefit pensions though they were affected by other provisions under RIRSA.
• Under the new hybrid plan, state employees are required to contribute 3.75% of salary toward the DB component and will receive a benefit multiplier of 1% per year of service upon normal retirement.
• State employees are also required to contribute 5% of salary toward the DC component and receive a 1% employer matching contribution.
• For all workers – state, teachers, local government, judges, and state police – the post-retirement COLA provisions were suspended until the system attains a funding ratio of 80%. Once the funding level is achieved, COLAs will be provided on the first $25,000 of pension benefit only, tied to the investment performance of the fund with a 0% floor and a 4% cap.
South Carolina: Act 278 of the Laws of 2012 (HB 4967) enacted the following retirement benefit reforms for state employees in South Carolina participating in the defined benefit plan:
• Increased current and new hire contributions from 6.5% to 8.0% of salary in ½ percent increments beginning July 1, 2012 (final increase effective July 1, 2014).
• Increased calculation for average final compensation from the highest 3 year to highest 5 year average.
• Increased normal service retirement eligibility to age 65 with 8 years of service or when age + YOS = 90 and increased the vesting period from 5 to 8 years of service.
• Imposed a $500 cap on post-retirement cost-of-living adjustments.
• It should be noted that state, public school, and higher education employees are eligible to participate in an optional defined contribution plan (State Optional Retirement Plan).
Utah: The State Legislature in Utah enacted pension reforms in the 2011 legislative session (SB 308) that applied to state employees. Under the reforms, employees in Utah hired after July 1, 2011, are considered Tier 2 employees and have the option to participate in either a hybrid plan or in a defined contribution plan. The hybrid plan is the default option for those new hires not making an election within the required enrollment period.
• For non-public safety employees electing the defined contribution plan option, the State contributes 10% into the employees DC account. Employees may elect to make additional contribution on a voluntary basis.
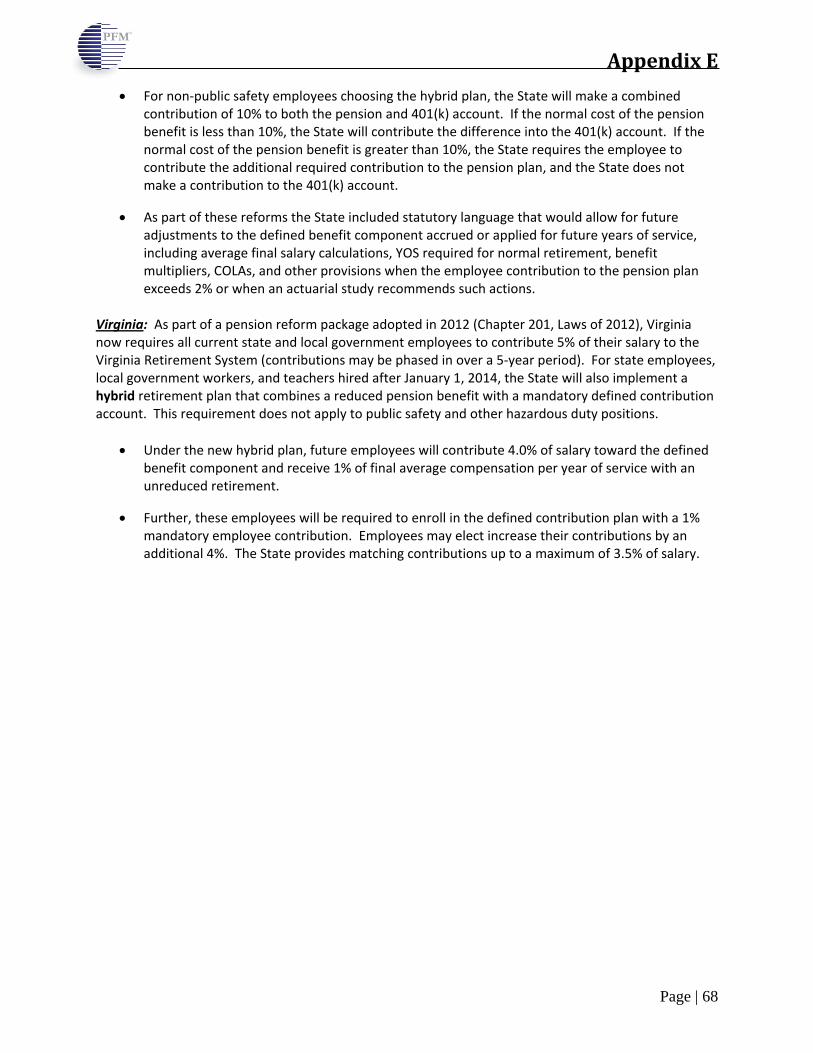
Appendix E
Page | 68
• For non-public safety employees choosing the hybrid plan, the State will make a combined contribution of 10% to both the pension and 401(k) account. If the normal cost of the pension benefit is less than 10%, the State will contribute the difference into the 401(k) account. If the normal cost of the pension benefit is greater than 10%, the State requires the employee to contribute the additional required contribution to the pension plan, and the State does not make a contribution to the 401(k) account.
• As part of these reforms the State included statutory language that would allow for future adjustments to the defined benefit component accrued or applied for future years of service, including average final salary calculations, YOS required for normal retirement, benefit multipliers, COLAs, and other provisions when the employee contribution to the pension plan exceeds 2% or when an actuarial study recommends such actions.
Virginia: As part of a pension reform package adopted in 2012 (Chapter 201, Laws of 2012), Virginia now requires all current state and local government employees to contribute 5% of their salary to the Virginia Retirement System (contributions may be phased in over a 5-year period). For state employees, local government workers, and teachers hired after January 1, 2014, the State will also implement a hybrid retirement plan that combines a reduced pension benefit with a mandatory defined contribution account. This requirement does not apply to public safety and other hazardous duty positions.
• Under the new hybrid plan, future employees will contribute 4.0% of salary toward the defined benefit component and receive 1% of final average compensation per year of service with an unreduced retirement.
• Further, these employees will be required to enroll in the defined contribution plan with a 1% mandatory employee contribution. Employees may elect increase their contributions by an additional 4%. The State provides matching contributions up to a maximum of 3.5% of salary.

Appendix E
Page | 69
Highlights of States Increasing Employee Contributions for Current Employees26 Alabama: The State of Alabama created a new benefit tier for employees hired after 1/1/2013 that has a lower employee contribution (6%) and a reduced benefit plan design (reduced multiplier and increased retirement eligibility criteria). The State increased employee contributions for Tier 1 members (hired prior to 1/1/2013) from 5% to 7.5% effective 10/1/2012.
Florida: On 7/1/2011 all state employees (current and new hires) participating in the Florida Retirement System were required to contribute 3% of their salary towards their pension benefit. Prior to enactment of the reform legislation, state employees were not required to contribute. In a 4-3 decision, the Florida State Supreme Court recently upheld the state law requiring contributions for current employees.
Maryland: As part of a broad package of pension reform for state employees, the State of Maryland increased the employee contribution for current and newly hired state civilian employees and teachers from 5% to 7% of salary effective 7/1/2011.
Michigan: Reforms adopted in Michigan in 2012 will require teachers hired prior to 7/1/2010 (current employees) to contribute 7% of salary, up from a range of 3% - 6.4% depending on salary and hire date. Teachers hired prior to 7/1/2010 may elect to continue their contributions at their current levels but would be subject to a reduced benefit multiplier (1.25% down from 1.5%).
In 2011, Michigan also adopted HB 4701, that required employees hired prior to 3/1/1997 participating in the closed defined benefit pension plan to contribute 4% of pay (up from 0%) or transfer into the defined contribution plan. Employees hired after 3/1/1997 already are required to participate in a defined contribution plan.
New Jersey: In addition to broad pension reforms for state employees, Chapter 78 of 2011 increased the employee pension contribution rate for all employee tiers (current and new hires) from 5.5% to 6.5%. The reform legislation will further increase the contribution rate for all employees by an additional 1% (7.5% total employee contribution) in equal increments through July 1, 2018.
South Carolina: Act 278 of 2012 (HB 4967) will increase employee contributions for both current and new hires from 7.0% to 7.5% on 7/1/2013, and to 8.0% on 7/1/2014. The reform legislation will also grant the retirement board the ability to increase employee and employer contributions in future years based on the actuarial valuation, so long as the increase does not result in a differential between the employer and employee contribution rate in excess of 2.9% (the state will contribute 10.9% by 7/1/2014).
Virginia: As part of a broad package of reform legislation, the Commonwealth of Virginia required employees participating in the Virginia Retirement System hired prior to 7/1/2010 (Plan 1) to contribute 5% of salary effective 7/1/2011, up from 0%. Employees hired after 7/1/2010 participating in VRS Plan 2 were already required to contribute 5% toward their pension benefit.
26 NASRA Issue Brief: Employee Contributions to Public Pension Funds, January 2013.

Appendix E
Page | 70
State Employees Covered
Recent change to establish or increase
contribution? Date of change Employee contribution (%) latest tier Employee contribution (%) older tiers
Alabama Civilians Yes 10/1/2012 Tier II (Hired on or after 1/1/2013): 6% Tier I (Hired prior to 1/1/2013): 7.5%
Alaska Civilians, Peace Officers No N/A Defined Contribution Tier IV (Hired on or after
6/30/2006): 8% Tier I, Tier II, Tier III (Hired before July 1, 2006):
6.75%
Arizona Civilians, Teachers Yes Future
implementation date: 7/1/2013
All employees pay the same contribution rate (no tiers): 11.3%
All employees pay the same contribution rate (no tiers): 11.3%
Arkansas Civilians No N/A Contributory Plan: Employees hired on or after 6/30/2005 contribute 5%
Non Contributory plan: Employees hired between 1/1/1978 and 6/30/2005 contribute 0%.
California Civilians Yes Future
implementation date: 7/1/2013
Employees will be required to pay at least 50% of the normal costs of their pension plans. New and current
rates vary by bargaining unit.
Employees will be required to pay at least 50% of the normal costs of their pension plans. New and current
rates vary by bargaining unit
Colorado Civilians, Judges, State Troopers,
Teachers
Yes (Temporary 2.5% increase in FY2012) N/A 8% (All Other Groups) 10% (State Troopers) 8% (All Other Groups) 10% (State Troopers)
Connecticut Civilians No N/A Tier III (Hired Post 7/1/2011): 2% Tier IIA (hired 7/1/1997 - 7/1/2011): 2%
Delaware Civilians Yes 1/1/2012 Post-1/1/2012 hires: 5% of compensation above $6,000
Pre-1/1/2012 hires: 3% of compensation above $6,000
DC Civilians No N/A Employees hired on or after 10/1/1987 participate in the City's 401(a) Defined Contribution Plan: 0%
Employees hired before 10/1/1987 are covered by the Civil Service Retirement System (U.S. Federal
Employee Pension Plan). CSRS covered employees contribute 7, 7 1/2 or 8 percent of pay to CSRS.
Florida Civilians Yes 7/1/2011 3% 3%
Georgia Civilians No N/A 1.25% (Hybrid) Old Plan (prior to 7/1/1982): 1.25% + .25% for GTLI New Plan (7/1/1982 - 1/1/2009): 1.25% + .25% for
GTLI Hawaii Civilians Yes 7/1/2012 9.8% 7.8%
Idaho Civilians, Teachers No N/A Civilians: 6.23% Public Safety: 7.69%
Civilians: 6.23% Public Safety: 7.69%
Illinois Civilians, Public Safety No N/A
Civilians: 4% w/SS; 8% w/o SS Alternative (Public Safety): 8.5% w/SS; 12.5% w/o
SS
Civilians: 4% w/SS; 8% w/o SS Alternative (Public Safety): 8.5% w/SS; 12.5% w/o SS
Indiana Civilians No N/A Hybrid Plan: Defined Benefit amount: 0%, Defined Contribution amount: 3%
Hybrid Plan: Defined Benefit amount: 0%, Defined Contribution amount: 3%
Iowa Civilians Yes 7/1/2012 5.78% 5.78%
Kansas Civilians, Teachers Yes
Future implementation
years: 2014, 2015
Tier 2 (Hired on or after 7/1/2009): 6% Tier 1 (Hired before 7/1/2009): 4%
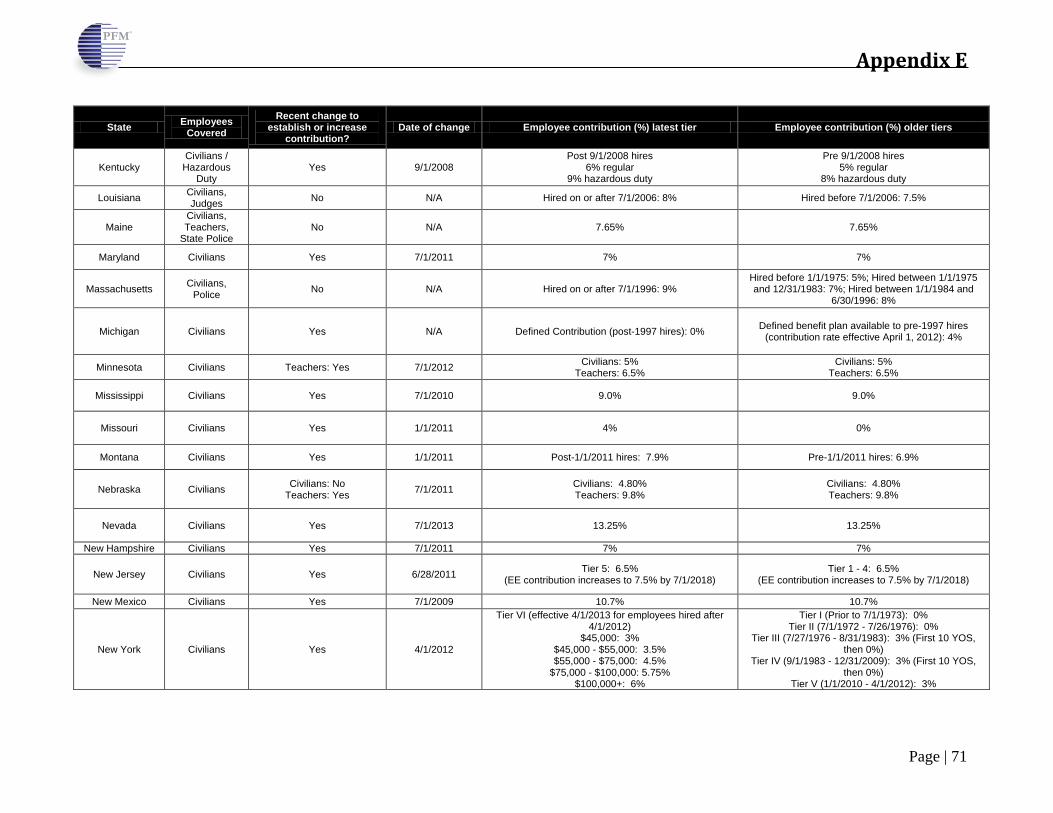
Appendix E
Page | 71
State Employees Covered
Recent change to establish or increase
contribution? Date of change Employee contribution (%) latest tier Employee contribution (%) older tiers
Kentucky Civilians /
Hazardous Duty
Yes 9/1/2008 Post 9/1/2008 hires
6% regular 9% hazardous duty
Pre 9/1/2008 hires 5% regular
8% hazardous duty
Louisiana Civilians, Judges No N/A Hired on or after 7/1/2006: 8% Hired before 7/1/2006: 7.5%
Maine Civilians, Teachers,
State Police No N/A 7.65% 7.65%
Maryland Civilians Yes 7/1/2011 7% 7%
Massachusetts Civilians, Police No N/A Hired on or after 7/1/1996: 9%
Hired before 1/1/1975: 5%; Hired between 1/1/1975 and 12/31/1983: 7%; Hired between 1/1/1984 and
6/30/1996: 8%
Michigan Civilians Yes N/A Defined Contribution (post-1997 hires): 0% Defined benefit plan available to pre-1997 hires (contribution rate effective April 1, 2012): 4%
Minnesota Civilians Teachers: Yes 7/1/2012 Civilians: 5% Teachers: 6.5%
Civilians: 5% Teachers: 6.5%
Mississippi Civilians Yes 7/1/2010 9.0% 9.0%
Missouri Civilians Yes 1/1/2011 4% 0%
Montana Civilians Yes 1/1/2011 Post-1/1/2011 hires: 7.9% Pre-1/1/2011 hires: 6.9%
Nebraska Civilians Civilians: No Teachers: Yes 7/1/2011 Civilians: 4.80%
Teachers: 9.8% Civilians: 4.80% Teachers: 9.8%
Nevada Civilians Yes 7/1/2013 13.25% 13.25%
New Hampshire Civilians Yes 7/1/2011 7% 7%
New Jersey Civilians Yes 6/28/2011 Tier 5: 6.5% (EE contribution increases to 7.5% by 7/1/2018)
Tier 1 - 4: 6.5% (EE contribution increases to 7.5% by 7/1/2018)
New Mexico Civilians Yes 7/1/2009 10.7% 10.7%
New York Civilians Yes 4/1/2012
Tier VI (effective 4/1/2013 for employees hired after 4/1/2012)
$45,000: 3% $45,000 - $55,000: 3.5% $55,000 - $75,000: 4.5%
$75,000 - $100,000: 5.75% $100,000+: 6%
Tier I (Prior to 7/1/1973): 0% Tier II (7/1/1972 - 7/26/1976): 0%
Tier III (7/27/1976 - 8/31/1983): 3% (First 10 YOS, then 0%)
Tier IV (9/1/1983 - 12/31/2009): 3% (First 10 YOS, then 0%)
Tier V (1/1/2010 - 4/1/2012): 3%
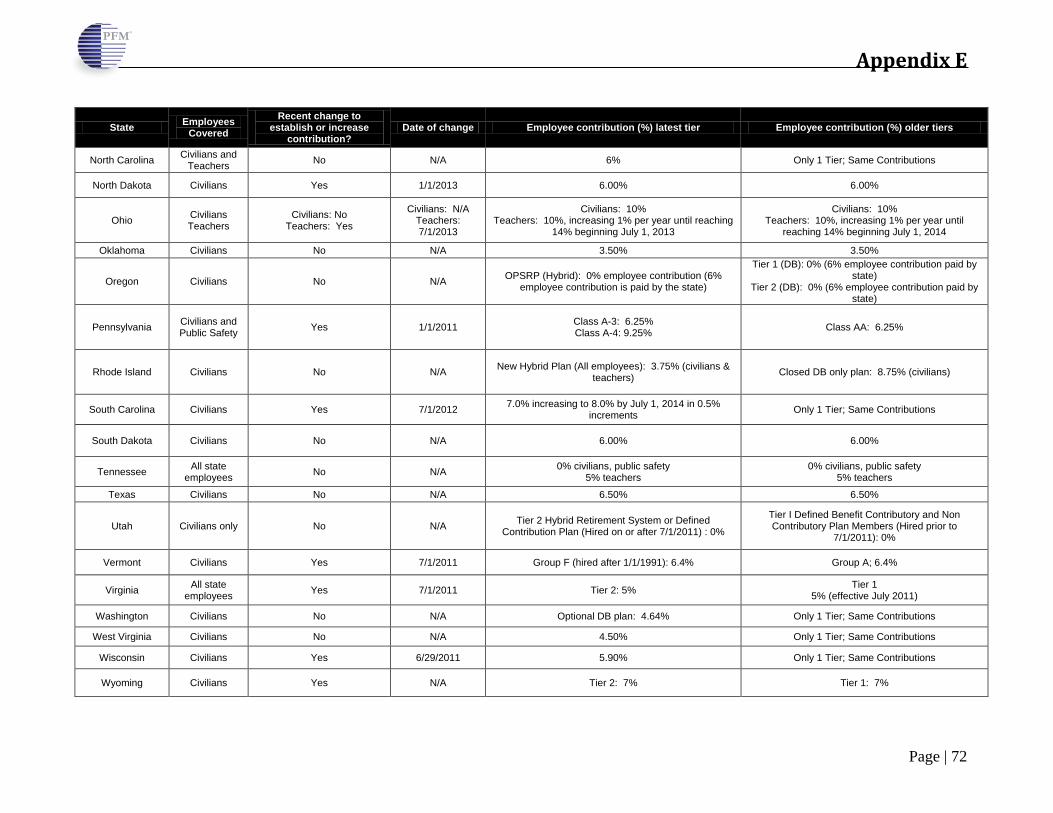
Appendix E
Page | 72
State Employees Covered
Recent change to establish or increase
contribution? Date of change Employee contribution (%) latest tier Employee contribution (%) older tiers
North Carolina Civilians and Teachers No N/A 6% Only 1 Tier; Same Contributions
North Dakota Civilians Yes 1/1/2013 6.00% 6.00%
Ohio Civilians Teachers
Civilians: No Teachers: Yes
Civilians: N/A Teachers: 7/1/2013
Civilians: 10% Teachers: 10%, increasing 1% per year until reaching
14% beginning July 1, 2013
Civilians: 10% Teachers: 10%, increasing 1% per year until
reaching 14% beginning July 1, 2014
Oklahoma Civilians No N/A 3.50% 3.50%
Oregon Civilians No N/A OPSRP (Hybrid): 0% employee contribution (6% employee contribution is paid by the state)
Tier 1 (DB): 0% (6% employee contribution paid by state)
Tier 2 (DB): 0% (6% employee contribution paid by state)
Pennsylvania Civilians and Public Safety Yes 1/1/2011 Class A-3: 6.25%
Class A-4: 9.25% Class AA: 6.25%
Rhode Island Civilians No N/A New Hybrid Plan (All employees): 3.75% (civilians & teachers) Closed DB only plan: 8.75% (civilians)
South Carolina Civilians Yes 7/1/2012 7.0% increasing to 8.0% by July 1, 2014 in 0.5% increments Only 1 Tier; Same Contributions
South Dakota Civilians No N/A 6.00% 6.00%
Tennessee All state employees No N/A 0% civilians, public safety
5% teachers 0% civilians, public safety
5% teachers
Texas Civilians No N/A 6.50% 6.50%
Utah Civilians only No N/A Tier 2 Hybrid Retirement System or Defined Contribution Plan (Hired on or after 7/1/2011) : 0%
Tier I Defined Benefit Contributory and Non Contributory Plan Members (Hired prior to
7/1/2011): 0%
Vermont Civilians Yes 7/1/2011 Group F (hired after 1/1/1991): 6.4% Group A; 6.4%
Virginia All state employees Yes 7/1/2011 Tier 2: 5% Tier 1
5% (effective July 2011)
Washington Civilians No N/A Optional DB plan: 4.64% Only 1 Tier; Same Contributions
West Virginia Civilians No N/A 4.50% Only 1 Tier; Same Contributions
Wisconsin Civilians Yes 6/29/2011 5.90% Only 1 Tier; Same Contributions
Wyoming Civilians Yes N/A Tier 2: 7% Tier 1: 7%

Appendix F

Appendix F
Page | 74
Retiree Payroll by Tennessee County Retirement benefits play a significant role in the general economy of Tennessee. It is estimated that $1.63 billion of the $1.76 billion annual retiree payroll is paid to Tennessee residents (92% of total).
TN County Population (2010)
Payments by County TN County Population
(2010) Payments by
County Anderson 75,129 $22,840,729 Lawrence 41,869 10,899,687 Bedford 45,058 9,182,063 Lewis 12,161 2,904,411 Benton 16,489 3,949,919 Lincoln 33,361 8,121,594 Bledsoe 12,876 4,415,934 Loudon 48,556 12,891,977 Blount 123,010 40,262,298 Macon 22,248 3,681,990 Bradley 98,963 21,832,270 Madison 98,294 37,860,282 Campbell 40,716 11,065,004 Marion 28,237 3,888,244 Cannon 13,801 3,797,145 Marshall 30,617 7,327,468 Carroll 28,522 8,524,774 Maury 80,956 18,138,841 Carter 57,424 16,792,250 McMinn 52,266 11,882,327 Cheatham 39,105 9,693,279 McNairy 26,075 6,359,913 Chester 17,131 4,470,359 Meigs 11,753 3,848,892 Claiborne 32,213 8,487,907 Monroe 44,519 8,230,417 Clay 7,861 1,468,530 Montgomery 172,331 34,729,003 Cocke 35,662 8,209,034 Moore 6,362 1,091,290 Coffee 52,796 14,804,450 Morgan 21,987 5,644,366 Crockett 14,586 4,363,725 Obion 31,807 9,914,819 Cumberland 56,053 10,538,441 Overton 22,083 5,581,693 Davidson 626,681 143,835,800 Perry 7,915 2,925,244 Decatur 11,757 3,509,294 Pickett 5,077 1,184,787 Dekalb 18,723 3,999,645 Polk 16,825 3,676,518 Dickson 49,666 13,646,229 Putnam 72,321 30,634,409 Dyer 38,335 9,606,577 Rhea 31,809 6,949,757 Fayette 38,413 9,871,146 Roane 54,181 17,895,789 Fentress 17,959 4,740,465 Robertson 66,283 16,111,267 Franklin 41,052 9,305,768 Rutherford 262,604 54,609,766 Gibson 49,683 16,525,946 Scott 22,228 4,994,575 Giles 29,485 6,325,038 Sequatchie 14,112 4,997,396 Grainger 22,657 4,752,945 Sevier 89,889 16,964,700 Greene 68,831 26,919,642 Shelby 927,644 223,618,503 Grundy 13,703 4,041,385 Smith 19,166 4,300,852 Hamblen 62,544 20,053,811 Stewart 13,324 3,166,303 Hamilton 336,463 83,627,046 Sullivan 156,823 51,496,367 Hancock 6,819 1,800,693 Sumner 160,645 37,334,169 Hardeman 27,253 12,116,110 Tipton 61,081 12,054,740 Hardin 26,026 6,855,416 Trousdale 7,870 1,813,238 Hawkins 56,833 12,474,056 Unicoi 18,313 4,958,250 Haywood 18,787 7,367,645 Union 19,109 3,122,923 Henderson 27,769 6,015,251 Van Buren 5,548 1,632,542 Henry 32,330 10,228,008 Warren 39,839 10,930,042 Hickman 24,690 5,605,984 Washington 122,979 48,241,483 Houston 8,426 1,460,470 Wayne 17,021 3,882,074 Humphreys 18,538 4,992,766 Weakley 35,021 12,305,722 Jackson 11,638 1,927,987 White 25,841 6,940,226 Jefferson 51,407 13,512,258 Williamson 183,182 40,783,832 Johnson 18,244 4,046,710 Wilson 113,993 26,835,665 Knox 432,226 113,922,274 Total In-State $1,626,721,834 Lake 7,832 2,599,420 Total Out-of-State $137,335,823 Lauderdale 27,815 $8,979,584 Total Payments $1,764,057,657 Source: Tennessee Treasury Department, Retiree Payments for FY2012.

Appendix G

Appendix G
Page | 76
Retirement Income Replacement Ratios
The following table reflects a hypothetical retirement income replacement ratio under the proposed hybrid plan structure for an individual retiring with a $30,000, $50,000, and $70,000 average final salary. The actual funds available for withdrawal in the defined contribution components (labeled as “DC Annuity”) will vary based on employee contributions, asset allocation decisions, and general market performance. Key Assumptions:
• Gross replacement income based on 35 years of service for state employee retiring at age 65 • DB Formula: 1% of AFC times years of service • DC Annuity: 5% employer (ER) plus 2% employee (EE) contribution (total of 7% contribution)
assuming 4% historical annual salary growth • DC Annuity: 6% annual earnings assumption • DC Annuity: 4% discount factor • Income Replacement Ratio Estimates: Final salary is $32,400 for a $30,000 AFC; $54,000 for a
$50,000 AFC, and $75,600 for a $70,000 AFC • Social Security: Reflects 75% of current formula
$30,000 AFC $50,000 AFC $70,000 AFC
Benefit % Benefit % Benefit %
DC Annuity @ 5% ER Contribution Level $6,342 19.6% $10,569 19.6% $14,797 19.6%
DC Annuity @ 2% EE Contribution Level $2,537 7.8% $4,228 7.8% $5,919 7.8%
TCRS Defined Benefit Component $10,500 32.4% $17,500 32.4% $24,500 32.4%
Social Security $10,260 31.7% $14,562 27.0% $17,568 23.2%
Total Retirement Income Replacement $29,864 91.5% $47,327 86.8% $62,802 83.0%
Source: Tennessee Treasury Department, Retiree Payments for FY2012.