Assessment of Propfan Propulsion Systems ForReduced Environmental Impact
138
Assessment of Propfan Propulsion Systems for Reduced Environmental Impact by Andreas Peters Diplom-Ingenieur, RWTH Aachen University (2007) Submitted to the Department of Aeronautics and Astronautics in partial fulfillment of the requirements for the degree of Master of Science in Aeronautics and Astronautics at the MASSACHUSETTS INSTITUTE OF TECHNOLOGY January 2010 c Massachusetts Institute of Technology 2010. All rights reserved. Author .............................................................. Department of Aeronautics and Astronautics January 29, 2010 Certified by .......................................................... Zolt´ an S. Spakovszky H. N. Slater Associate Professor Thesis Supervisor Accepted by ......................................................... Eytan H. Modiano Associate Professor of Aeronautics and Astronautics Chair, Committee on Graduate Students
description
Open Rotor Research
Transcript of Assessment of Propfan Propulsion Systems ForReduced Environmental Impact
Assessment of Propfan Propulsion Systems for
Reduced Environmental Impact
by
Andreas Peters
Diplom-Ingenieur, RWTH Aachen University (2007)
Submitted to the Department of Aeronautics and Astronauticsin partial fulfillment of the requirements for the degree of
Master of Science in Aeronautics and Astronautics
at the
MASSACHUSETTS INSTITUTE OF TECHNOLOGY
January 2010
c© Massachusetts Institute of Technology 2010. All rights reserved.
Author . . . . . . . . . . . . . . . . . . . . . . . . . . . . . . . . . . . . . . . . . . . . . . . . . . . . . . . . . . . . . .Department of Aeronautics and Astronautics
January 29, 2010
Certified by. . . . . . . . . . . . . . . . . . . . . . . . . . . . . . . . . . . . . . . . . . . . . . . . . . . . . . . . . .Zoltan S. Spakovszky
H. N. Slater Associate ProfessorThesis Supervisor
Accepted by . . . . . . . . . . . . . . . . . . . . . . . . . . . . . . . . . . . . . . . . . . . . . . . . . . . . . . . . .Eytan H. Modiano
Associate Professor of Aeronautics and AstronauticsChair, Committee on Graduate Students

2

Assessment of Propfan Propulsion Systems for Reduced
Environmental Impact
by
Andreas Peters
Submitted to the Department of Aeronautics and Astronauticson January 29, 2010, in partial fulfillment of the requirements for the degree of
Master of Science in Aeronautics and Astronautics
Abstract
Current aircraft engine designs tend towards higher bypass ratio, low-speed fan designs for improvedfuel burn, reduced emissions and noise. Alternative propulsion concepts include counter-rotatingpropfans (CRPs) which have been investigated intensively in the 1970s and 1980s and demonstratedsignificant reductions in fuel burn. Currently, propfans are being studied again due to their inherentnoise challenge and the potential for reduced environmental impact. A newly developed, integratednoise and performance assessment methodology for advanced propfan powered aircraft configura-tions is introduced. The approach is based on first principles and combines a coupled aircraft andpropulsion system performance analysis with 3-D unsteady, full-wheel CRP CFD computations andaero-acoustic simulations. Special emphasis is put on computing CRP interaction tones. The methodis capable of dealing with parametric studies and exploring noise reduction technologies.
An aircraft performance and mission analysis was first conducted on a candidate CRP poweredconfiguration. In addition, a comparable aircraft with advanced turbofan engines was defined forperformance and noise comparisons. Guided by data available in the literature, a detailed aerody-namic design of a pusher CRP was carried out using vortex-lattice methods and 3-D steady RANScomputations of the counter-rotating stage. Full-wheel unsteady 3-D RANS simulations were thenused to determine the time varying blade surface pressures and unsteady flow features necessary todefine the acoustic source terms. A frequency domain approach based on Goldstein’s formulationof the acoustic analogy for moving media and Hanson’s single rotor noise method was extended tocounter-rotating configurations. The far field noise predictions were compared to experimental dataand demonstrated good agreement between the computed and measured interaction tones. The un-derlying noise source mechanisms due to front-rotor wake interaction, aft-rotor upstream influence,hub-endwall secondary flows and front-rotor tip-vortices were dissected and quantified. Based onthis investigation, the CRP was re-designed for reduced noise incorporating a clipped rear-rotorand an increased rotor-rotor spacing to reduce upstream influence, tip-vortex, and wake interac-tion effects. Maintaining the thrust and propulsive efficiency at takeoff conditions, the noise wascalculated for both designs. At the interaction tone frequencies, the re-designed CRP exhibited anaverage reduction of 7.25 dB in mean SPL computed over the forward and aft polar angle arcs. Onthe engine/aircraft system level, the re-designed CRP demonstrated a reduction of 9.2 EPNdB and8.6 EPNdB at the FAR 36 flyover and sideline observer locations, respectively. The results suggestthat advanced open rotor designs can possibly meet Stage 4 noise requirements.
Thesis Supervisor: Zoltan S. SpakovszkyTitle: H. N. Slater Associate Professor
3

4
Acknowledgments
First and most importantly, I would like to thank my advisor Professor Zoltan
Spakovszky for giving me the opportunity to join the MIT Gas Turbine Laboratory. I
am very grateful for his guidance, encouragement, and invaluable advice throughout
my graduate studies at MIT and for making this project a great learning experience.
This thesis was made possible and supported by Pratt & Whitney under the
supervision of Dr. Jayant Sabnis. At Pratt & Whitney, I wish to first thank Dr.
Sabnis, Dr. Bruce Morin and Dr. Wes Lord for their support, insight, and the many
very helpful discussions. The help of Robert Bengtson and Naushir Bala in aircraft
and engine cycle assessment are gratefully acknowledged. At United Technologies
Research Center, I am most thankful to Dr. Dan Shannon for his input and helpful
feedback on the CRP acoustic assessment.
At MIT, I am greatly indebted to Professor Mark Drela for his help with the
baseline CRP design and his patience in answering my questions about his vortex
lattice codes RVL and RAXAN. At Numeca USA, I would like to thank Roque Lopez
and Dr. Alain Demeulenaere for their patient assistance with FINE/Turbo.
I am most thankful to my fellow graduate student Andrew March for his help
with low-speed aircraft performance calculations. A special thanks to my labmate
Jeff Defoe for his extraordinary efforts in solving network and computer problems. In
addition, I could always count on Jeff when I had questions about acoustics. I am
particularly thankful to my officemate Jon Everitt for the frequent discussions about
the subtleties of working with FINE/Turbo. I am greatly indebted to Bjorn, David,
Francois, and Ryan in the “glass office” for their encouragement at all times. I would
also like to thank Alex, Georg, George, Leo, Shinji, Sho, Stevan, and Tanya for their
friendship and for making the GTL a great place to work.
Finally, I wish to thank my parents for their love, support, and advice throughout
my education. All my love goes to Anneli. MIT would have been far more challenging
without her continuous encouragement and understanding.
5

6
Contents
1 Introduction 23
1.1 Background and Previous Work . . . . . . . . . . . . . . . . . . . . . 23
1.2 Research Questions . . . . . . . . . . . . . . . . . . . . . . . . . . . . 26
1.3 Technical Roadmap . . . . . . . . . . . . . . . . . . . . . . . . . . . . 27
1.4 Thesis Contributions . . . . . . . . . . . . . . . . . . . . . . . . . . . 29
2 Integrated Aircraft Performance and Noise Assessment Methodol-
ogy 31
2.1 Mission Analysis . . . . . . . . . . . . . . . . . . . . . . . . . . . . . 33
2.2 Engine Analysis . . . . . . . . . . . . . . . . . . . . . . . . . . . . . . 35
2.3 Low Speed Performance Analysis . . . . . . . . . . . . . . . . . . . . 36
2.4 Noise Audit . . . . . . . . . . . . . . . . . . . . . . . . . . . . . . . . 37
2.4.1 Airframe Noise . . . . . . . . . . . . . . . . . . . . . . . . . . 38
2.4.2 Engine Core Noise . . . . . . . . . . . . . . . . . . . . . . . . 39
2.4.3 Turbofan Powered Aircraft: Fan and Jet Noise . . . . . . . . . 40
2.4.4 Propfan Powered Aircraft: CRP Noise . . . . . . . . . . . . . 41
2.4.5 Propagation Effects . . . . . . . . . . . . . . . . . . . . . . . . 42
2.4.6 Post-Processing for FAR 36 Noise Assessment . . . . . . . . . 42
2.4.7 Summary . . . . . . . . . . . . . . . . . . . . . . . . . . . . . 43
3 Concept Aircraft Definitions 45
3.1 Datum Turbofan Powered Aircraft . . . . . . . . . . . . . . . . . . . 45
3.1.1 Mission and Airframe Definition . . . . . . . . . . . . . . . . . 46
7
3.1.2 Definition of Datum Turbofan Engine . . . . . . . . . . . . . . 46
3.1.3 Datum Turbofan Aircraft Aerodynamic and Acoustic Perfor-
mance . . . . . . . . . . . . . . . . . . . . . . . . . . . . . . . 47
3.1.4 Weight Breakdown . . . . . . . . . . . . . . . . . . . . . . . . 48
3.1.5 High Speed Aerodynamic Performance . . . . . . . . . . . . . 50
3.1.6 Low Speed Aerodynamic Performance . . . . . . . . . . . . . 50
3.1.7 Noise Assessment . . . . . . . . . . . . . . . . . . . . . . . . . 51
3.2 Baseline CRP Powered Aircraft . . . . . . . . . . . . . . . . . . . . . 53
3.2.1 Modifications to Baseline Airframe . . . . . . . . . . . . . . . 53
3.2.2 Baseline CRP Aerodynamic Design . . . . . . . . . . . . . . . 55
3.2.3 Baseline CRP Engine . . . . . . . . . . . . . . . . . . . . . . . 62
4 CRP Noise Estimation Methodology 65
4.1 Interaction Tone Noise Source Mechanisms . . . . . . . . . . . . . . . 66
4.2 CRP Noise Estimation Method . . . . . . . . . . . . . . . . . . . . . 69
4.2.1 Outline of Approach . . . . . . . . . . . . . . . . . . . . . . . 70
4.3 Development Method . . . . . . . . . . . . . . . . . . . . . . . . . . . 71
4.3.1 Governing Equations for Single Rotor Noise . . . . . . . . . . 71
4.3.2 Extension to Counter-Rotating Configurations . . . . . . . . . 74
4.4 Aerodynamic Analysis . . . . . . . . . . . . . . . . . . . . . . . . . . 77
4.4.1 CFD Tool Description . . . . . . . . . . . . . . . . . . . . . . 78
4.4.2 CRP Grid Generation . . . . . . . . . . . . . . . . . . . . . . 79
4.4.3 Computational Procedure . . . . . . . . . . . . . . . . . . . . 81
4.4.4 Steady Computations to Initialize Unsteady Simulations and
Grid Convergence . . . . . . . . . . . . . . . . . . . . . . . . . 83
4.4.5 Unsteady Computations . . . . . . . . . . . . . . . . . . . . . 84
4.4.6 General Guidelines for CFD Approach . . . . . . . . . . . . . 89
4.5 CRP Noise Method Validation . . . . . . . . . . . . . . . . . . . . . . 91
5 CRP Acoustic Assessment 97
5.1 Dissection of Baseline CRP Noise Mechanisms . . . . . . . . . . . . . 97
8

5.2 Advanced CRP Design for Reduced Noise . . . . . . . . . . . . . . . 102
5.2.1 Design Approach . . . . . . . . . . . . . . . . . . . . . . . . . 102
5.2.2 Acoustic Performance for Advanced Design CRP . . . . . . . 105
5.2.3 Summary of Results . . . . . . . . . . . . . . . . . . . . . . . 109
6 System Level Noise Assessment 113
6.1 Low-Speed Aerodynamic Performance . . . . . . . . . . . . . . . . . . 113
6.2 Acoustic Performance of CRP Powered Aircraft . . . . . . . . . . . . 115
6.3 Flyover Noise Assessment . . . . . . . . . . . . . . . . . . . . . . . . 118
6.4 Sideline Noise Assessment . . . . . . . . . . . . . . . . . . . . . . . . 121
7 Summary and Conclusions 125
7.1 Summary . . . . . . . . . . . . . . . . . . . . . . . . . . . . . . . . . 125
7.2 Key Contributions . . . . . . . . . . . . . . . . . . . . . . . . . . . . 127
7.3 Future Work . . . . . . . . . . . . . . . . . . . . . . . . . . . . . . . . 128
A Baseline Airframe Definition 129
B CRP Noise Code User Manual 131
B.1 File Structure . . . . . . . . . . . . . . . . . . . . . . . . . . . . . . . 131
9

10
List of Figures
1-1 GE UDF flight test on MD-80 in 1988 (left) and PW/HS/Allison 578-
DX flight test on MD-80 in 1989 (right) . . . . . . . . . . . . . . . . . 24
2-1 Integrated aircraft performance and noise assessment methodology for
turbofan and propfan configurations . . . . . . . . . . . . . . . . . . . 32
2-2 Noise assessment framework . . . . . . . . . . . . . . . . . . . . . . . 37
3-1 Concept aircraft definitions: Datum turbofan aircraft (left) and base-
line CRP aircraft (right) configurations (sketches not to scale) . . . . 48
3-2 Analysis of the datum turbofan aircraft aerodynamic performance at
a) h = 25, 000 ft, M = 0.78 and b) h = 35, 000 ft, M = 0.78 . . . . . 50
3-3 Total and component acoustic performance of datum turbofan aircraft
at FAR 36 observer locations . . . . . . . . . . . . . . . . . . . . . . . 52
3-4 Actuator disk and control volume analysis approach . . . . . . . . . . 56
3-5 Specific work done by each rotor and entire CRP for ηad = 82.5 % and
m2/m1 = 1.1 . . . . . . . . . . . . . . . . . . . . . . . . . . . . . . . 57
3-6 Influence of mass flow ratio m2/m1 on tangential velocity downstream
of front and rear rotor for ηad = 82.5 % . . . . . . . . . . . . . . . . . 59
3-7 Baseline CRP design . . . . . . . . . . . . . . . . . . . . . . . . . . . 61
4-1 Baseline CRP density distribution at mid-span . . . . . . . . . . . . . 67
4-2 Baseline CRP density distribution at x/D1 = 0.12 . . . . . . . . . . . 68
4-3 Baseline CRP blade-tip vortex system: front-rotor tip-vortices interact
with rear rotor . . . . . . . . . . . . . . . . . . . . . . . . . . . . . . 68
11

4-4 Baseline CRP entropy distribution near hub (10 % span) . . . . . . . 69
4-5 CRP noise estimation methodology . . . . . . . . . . . . . . . . . . . 76
4-6 Grid 1: Original baseline CRP grid-block topology . . . . . . . . . . . 80
4-7 Grid 2: Improved baseline CRP grid-block topology . . . . . . . . . . 80
4-8 Grid 2: Close-up of rotor meshes at mid-span . . . . . . . . . . . . . 81
4-9 Baseline CRP density distribution at x/D1 = 0.12 for grid 1 (left) and
grid 2 (right) . . . . . . . . . . . . . . . . . . . . . . . . . . . . . . . 83
4-10 Baseline CRP radial distribution of mass-averaged stagnation pressure
for medium and fine grid levels . . . . . . . . . . . . . . . . . . . . . 85
4-11 Surface pressure distribution on the baseline CRP front-rotor blades
for medium and fine grid levels . . . . . . . . . . . . . . . . . . . . . 86
4-12 Front-rotor baseline CRP pressure coefficient at two radial stations for
medium and fine grid levels . . . . . . . . . . . . . . . . . . . . . . . 86
4-13 Baseline CRP entropy distribution near hub (10 % span) for CFD
computational setup case 1 (left), case 2 (center), and case 3 (right) . 88
4-14 Baseline CRP spectrum at 85◦ polar angle from the inlet centerline . 92
4-15 Baseline CRP spectrum at 113◦ polar angle from the inlet centerline . 92
4-16 Baseline CRP front-rotor harmonic at frequency BPF1 . . . . . . . . 93
4-17 Baseline CRP rear-rotor harmonic at frequency BPF2 . . . . . . . . . 93
4-18 Baseline CRP interaction tone level at frequency BPF1 +BPF2 . . . 94
4-19 Baseline CRP interaction tone level at frequency 2 ·BPF1 +BPF2 . 94
4-20 Baseline CRP interaction tone level at frequency BPF1 + 2 ·BPF2 . 95
5-1 Distribution of section lift coefficient on front rotor, M = 0.25 . . . . 99
5-2 Distribution of sectional lift coefficient on rear rotor, M = 0.25 . . . . 99
5-3 Dissection of baseline CRP noise mechanisms for interaction toneBPF1+
BPF2, M = 0.25 . . . . . . . . . . . . . . . . . . . . . . . . . . . . . 100
5-4 Dissection of baseline CRP noise mechanisms for interaction tone 2 ·
BPF1 +BPF2, M = 0.25 . . . . . . . . . . . . . . . . . . . . . . . . 100
12

5-5 Dissection of baseline CRP noise mechanisms for interaction toneBPF1+
2 ·BPF2, M = 0.25 . . . . . . . . . . . . . . . . . . . . . . . . . . . . 100
5-6 Baseline CRP noise mechanism contributors to first six interaction
tones (percentages based on p′2 averaged over forward and aft polar
arcs), M = 0.25 . . . . . . . . . . . . . . . . . . . . . . . . . . . . . . 102
5-7 Advanced design CRP radial grid topology . . . . . . . . . . . . . . . 105
5-8 Advanced design CRP geometry and near-field density distribution . 106
5-9 Comparison of baseline and advanced design CRP directivity at inter-
action tone frequency BPF1 +BPF2, M = 0.25 . . . . . . . . . . . . 106
5-10 Comparison of baseline and advanced design CRP directivity at inter-
action tone frequency 2 ·BPF1 +BPF2, M = 0.25 . . . . . . . . . . 107
5-11 Comparison of baseline and advanced design CRP directivity at inter-
action tone frequency BPF1 + 2 ·BPF2, M = 0.25 . . . . . . . . . . 107
5-12 Advanced design CRP noise mechanism contributors to first six inter-
action tones (percentages based on p′2 averaged over forward and aft
polar arcs), M = 0.25 . . . . . . . . . . . . . . . . . . . . . . . . . . . 109
5-13 Relative change in mean SPL for advanced design CRP compared to
baseline CRP . . . . . . . . . . . . . . . . . . . . . . . . . . . . . . . 110
6-1 Takeoff performance of investigated aircraft configurations: a) altitude,
b) Mach number, and c) thrust lapse . . . . . . . . . . . . . . . . . . 114
6-2 Tone-Corrected Perceived Noise Level at FAR 36 flyover receiver location119
6-3 EPNL breakdown at FAR 36 flyover receiver location . . . . . . . . . 121
6-4 Tone-Corrected Perceived Noise Level at FAR 36 sideline receiver location123
6-5 EPNL breakdown at FAR 36 sideline receiver location . . . . . . . . . 124
B-1 Overview of CRP noise code structure . . . . . . . . . . . . . . . . . 132
13

14

List of Tables
3.1 Overall baseline aircraft characteristics and mission requirements . . . 46
3.2 Datum turbofan engine characteristics at cruise design point compared
to CFM56-7B20 characteristics (extracted from [1]) . . . . . . . . . . 47
3.3 Datum turbofan aircraft weight breakdown: Component weights com-
puted in FLOPS and relative error of calculated results to data pro-
vided by the industry partner . . . . . . . . . . . . . . . . . . . . . . 49
3.4 Datum turbofan aircraft low speed performance assessment . . . . . . 51
3.5 Total datum turbofan aircraft EPNL in EPNdB . . . . . . . . . . . . 51
3.6 Weight changes for the baseline CRP powered aircraft relative to the
datum turbofan aircraft configuration . . . . . . . . . . . . . . . . . . 54
3.7 Model scale baseline CRP characteristics and operating conditions (ex-
tracted from [2]) . . . . . . . . . . . . . . . . . . . . . . . . . . . . . 55
3.8 Model scale baseline CRP cruise performance for ηad = 82.5 % and
m2/m1 = 1.1 . . . . . . . . . . . . . . . . . . . . . . . . . . . . . . . 60
3.9 Computed model scale takeoff performance compared to data from
literature [2] . . . . . . . . . . . . . . . . . . . . . . . . . . . . . . . . 61
3.10 Full scale baseline CRP characteristics and takeoff operating condition
details . . . . . . . . . . . . . . . . . . . . . . . . . . . . . . . . . . . 62
4.1 Characteristics of meshes used in grid convergence study . . . . . . . 82
4.2 Characteristics of grid and time step sensitivity study . . . . . . . . . 87
5.1 Radial extent of contributing source mechanisms . . . . . . . . . . . . 98
15

5.2 Model scale advanced CRP configuration and takeoff operating param-
eters . . . . . . . . . . . . . . . . . . . . . . . . . . . . . . . . . . . . 104
6.1 Full scale baseline and advanced design CRP configuration and takeoff
operating point characteristics . . . . . . . . . . . . . . . . . . . . . . 115
6.2 Total EPNL in EPNdB at FAR 36 flyover location . . . . . . . . . . . 121
6.3 Total EPNL in EPNdB at FAR 36 sideline location . . . . . . . . . . 122
7.1 Change in total EPNL in EPNdB relative to datum turbofan powered
aircraft . . . . . . . . . . . . . . . . . . . . . . . . . . . . . . . . . . . 126
A.1 Baseline airframe definition - wing and fuselage (in ft) . . . . . . . . . 129
A.2 Baseline airframe definition - horizontal and vertical tail (in ft) . . . . 130
16

Nomenclature
Abbreviations
CFD Computational Fluid Dynamics
CRP Counter-Rotating Propfan
CRPNEC Counter-Rotating Propfan Noise Estimation Code
EDET Empirical Drag Estimation Technique
EPNL Effective Perceived Noise Level (EPNdB)
ESDU IHS ESDU Engineering Service
FAA Federal Aviation Administration
FAR Federal Aviation Regulations
FINE/Turbo Flow INtegrated Environment for Turbomachinery Flows
FLOPS Flight Optimization System
GasTurb Gas Turbine Performance Simulation Software
HPT High Pressure Turbine
ICAC Initial Cruise Altitude Capability
ICAO International Civil Aviation Organization
ISA International Standard Atmosphere
LPC Low-Pressure Compressor
LPT Low-Pressure Turbine
MFW Maximum Fuel Weight
MEW Manufacturer’s Empty Weight
MLW Maximum Landing Weight
MTOW Maximum Takeoff Weight
17
MTOGW Maximum Takeoff Gross Weight
MZFW Maximum Zero Fuel Weight
NASA National Aeronautics and Space Administration
NLH Non-Linear Harmonic Method
OASPL OverAll Sound Pressure Level
OEW Operating Empty Weight
PNLT Tone-Corrected Perceived Noise Level (dB)
RANS Reynolds Average Navier-Stokes
RAXAN Rotor AXisymmetric ANalysis
ROC Rate of Climb
RVL Rotor Vortex Lattice
SAE Society of Automotive Engineers
SFC Specific Fuel Consumption
SL Sea Level
SPL Sound Pressure Level
SRP Single-Rotating Propfan
Roman Symbols
A blade area (m2)
A number of angular positions per revolution (-)
B blade count (-)
BPF blade passing frequency (Hz)
c speed of sound (m/s)
c blade chord (m)
cl sectional lift coefficient (-)
cp specific heat at constant pressure (J/kg)
CD drag coefficient (-)
CL lift coefficient (-)
18

CP power coefficient (-)
CT thrust coefficient (-)
D diameter (m)
f frequency (Hz)
Fi force per unit area on blade surface normalized by ambient pressure (-)
Fi,µ,ν discrete loading element in coordinate direction i, normalized by r2tip (-)
h altitude (m,ft)
h enthalpy (J/kgK)
J advance ratio (-)
k loading harmonic order (-)
km wavenumber (-)
m,n harmonic of blade passing frequency (-)
m mass flow (kg/s)
M Mach number (-)
MN Mach number normal to blade surface (-)
Mtip tip Mach number (-)
N rotational speed (1/s)
p static pressure (Pa)
p′ acoustic pressure disturbance (Pa)
pL acoustic pressure disturbance due to dipole sources (Pa)
pt stagnation pressure (Pa)
pT acoustic pressure disturbance due to monopole sources (Pa)
P power (W)
PLm loading noise at harmonic m normalized by ambient pressure (-)
PTm thickness noise at harmonic m normalized by ambient pressure (-)
Q torque (Nm)
r radius (m)
rhub hub radius (m)
rtip tip radius (m)
S amplitude radius normalized by blade tip radius (-)
19

SF scaling factor (-)
∆toutput time step at which unsteady pressure data is recorded in CFD simulations (s)
t time (s)
T static temperature (K)
T thrust (N)
T time limit for acoustic analogy integrals (s)
T period of rotor revolution (s)
Tt stagnation temperature (K)
VN velocity normal to blade surface (m/s)
Vtip rotor tip speed (m/s)
Vx axial velocity (m/s)
Vµ,ν discrete form of thickness source term, normalized by r2tip (-)
Vθ tangential velocity (m/s)
x observer coordinates, x, y, z, normalized by blade tip radius (-)
x/D1 rotor-rotor axial spacing (-)
y source coordinates, x0, y0, z0, normalized by blade tip radius (-)
Greek Symbols
β blade angle setting at 75 % span, measured from tangential direction (◦)
ηad adiabatic efficiency (-)
ηprop propulsive efficiency (-)
ϕ sweep (◦)
φS tangential source coordinate (rad)
φref blade position reference angle (rad)
φ0 tangential blade element coordinate in source integration (rad)
γ specific heat ratio (-)
π stagnation pressure ratio (-)
θ polar directivity angle (◦)
20

Θ torque split (-)
ρ density (kg/m3)
σ phase radius normalized by blade tip radius (-)
τ stagnation temperature ratio (-)
ω angular velocity (rad/s)
Ψ stage loading (-)
Subscripts
a location upstream of front rotor in baseline CRP design
b location between front and rear rotors in baseline CRP design
c location downstream of rear rotor in baseline CRP design
e exit condition in baseline CRP design control volume analysis
cruise cruise operating condition
CRP CRP engine
fan turbofan engine
FS full scale
LP engine core component on low-pressure spool
max maximum quantity
min minimum quantity
MS model scale
steady steady quantity
TO takeoff operating condition
0 free stream quantity
1 front rotor
2 rear rotor
µ index for counting source elements in radial direction
ν index for counting source elements in chordwise direction
21

22
Chapter 1
Introduction
1.1 Background and Previous Work
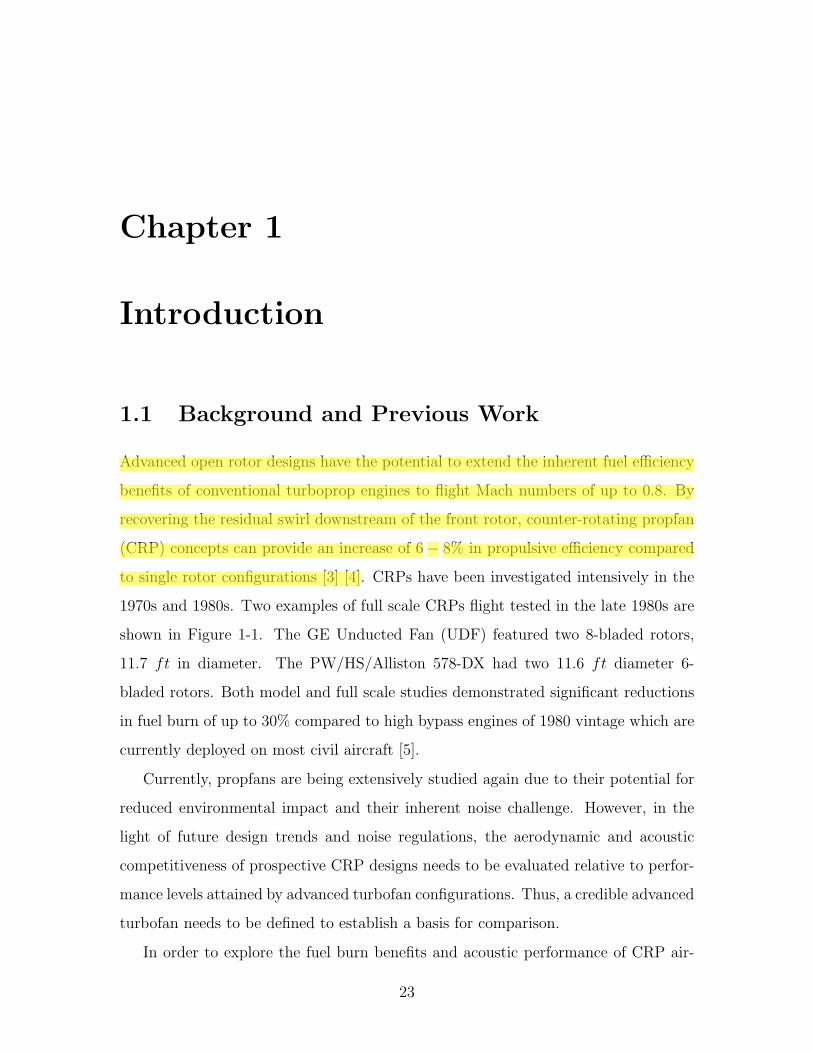
Advanced open rotor designs have the potential to extend the inherent fuel efficiency
benefits of conventional turboprop engines to flight Mach numbers of up to 0.8. By
recovering the residual swirl downstream of the front rotor, counter-rotating propfan
(CRP) concepts can provide an increase of 6− 8% in propulsive efficiency compared
to single rotor configurations [3] [4]. CRPs have been investigated intensively in the
1970s and 1980s. Two examples of full scale CRPs flight tested in the late 1980s are
shown in Figure 1-1. The GE Unducted Fan (UDF) featured two 8-bladed rotors,
11.7 ft in diameter. The PW/HS/Alliston 578-DX had two 11.6 ft diameter 6-
bladed rotors. Both model and full scale studies demonstrated significant reductions
in fuel burn of up to 30% compared to high bypass engines of 1980 vintage which are
currently deployed on most civil aircraft [5].
Currently, propfans are being extensively studied again due to their potential for
reduced environmental impact and their inherent noise challenge. However, in the
light of future design trends and noise regulations, the aerodynamic and acoustic
competitiveness of prospective CRP designs needs to be evaluated relative to perfor-
mance levels attained by advanced turbofan configurations. Thus, a credible advanced
turbofan needs to be defined to establish a basis for comparison.
In order to explore the fuel burn benefits and acoustic performance of CRP air-
23
Mondy
Highlight

Figure 1-1: GE UDF flight test on MD-80 in 1988 (left) and PW/HS/Allison 578-DXflight test on MD-80 in 1989 (right)
craft configurations, an integrated noise and performance assessment methodology is
required and developed in this thesis. Existing methods are used for aircraft mission
and engine cycle analysis, noise prediction of engine core and airframe sources, and
for the aerodynamic propfan design and performance assessment. A new approach to
estimate CRP noise is developed based on Hanson’s single rotor noise theory [6].
Various approaches have previously been undertaken to predict CRP noise and a
summary can be found in [7]. Based on his helicoidal surface theory for propellers
[8], Hanson developed one of the first analytical models for CRP noise prediction
[9]. In this approach, the sources were placed on the propeller advance surface which
made the precise treatment of blade geometric details and non-uniform inflow effects
challenging [6].
With the recent advances in numerical methods for aerodynamic and aeroacoustic
analyses, hybrid methods based on coupling CFD (Computational Fluid Dynamics)
and CAA (Computational Aeroacoustics) have also been pursued [10] [11] [12]. How-
ever, CAA methods are expensive in CPU time and memory requirements due to
the high mesh densities required to accurately resolve acoustic pressure disturbances.
Therefore, carrying out parametric studies in the CRP design phase using coupled
CFD/CAA approaches is generally not yet feasible.
Analytical frequency approaches for single rotor [6] and counter-rotating propfan
noise [9] require the a priori determination of unsteady blade surface pressures to
define the acoustic source terms. In the past, difficulties in obtaining the aerodynamic
24
data have led to inaccurate noise results [6] but the emergence of CFD now provides
the capability to estimate the unsteady blade loading.
In the present work, a new frequency domain approach for CRP noise estimation is
developed by extending Hanson’s single rotor noise approach [6] to counter-rotating
configurations. In contrast to the helicoidal surface theory, sources are placed on
the blade surfaces assuming the source data (surface pressure data and geometry) is
available from an external calculation. High-fidelity full-wheel 3-D RANS simulations
using the commercially available CFD tool Numeca FINE/Turbo are demonstrated
to successfully generate the required surface pressure information. One of the main
advantages of the developed CRP noise approach is the low computation time re-
quirement allowing the method to be used for detailed parametric studies.
One of the primary concerns in developing a viable CRP engine design is the noise
impact of open rotors, in terms of both in-flight cabin noise and takeoff/approach
community noise. At cruise, thickness and loading noise are the key noise sources and
the rotor-alone tones dominate the CRP spectrum. At the low-speed FAR 36 noise
certification conditions during takeoff and approach, rotor-rotor interaction noise due
to aerodynamic interference effects tends to dominate the noise signature [13]. The
current work focuses on the investigation of CRP interaction tones in order to explore
what characteristics and attributes are needed in a CRP design to meet future noise
regulations.
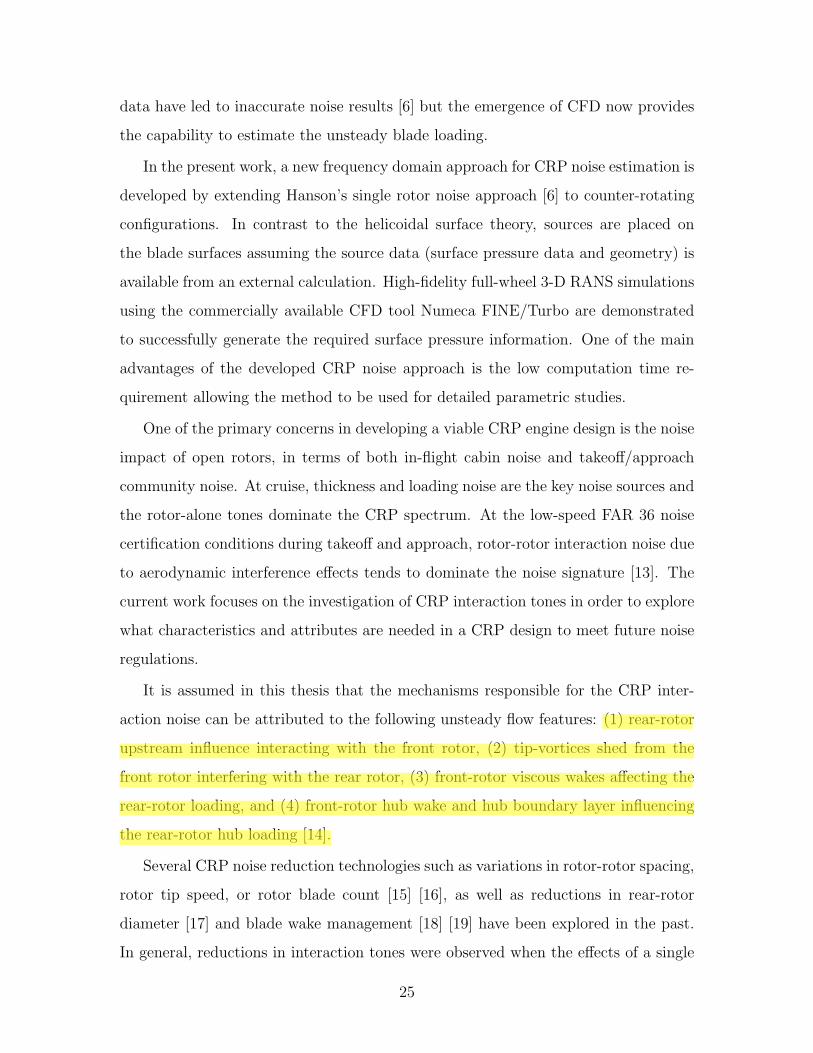
It is assumed in this thesis that the mechanisms responsible for the CRP inter-
action noise can be attributed to the following unsteady flow features: (1) rear-rotor
upstream influence interacting with the front rotor, (2) tip-vortices shed from the
front rotor interfering with the rear rotor, (3) front-rotor viscous wakes affecting the
rear-rotor loading, and (4) front-rotor hub wake and hub boundary layer influencing
the rear-rotor hub loading [14].
Several CRP noise reduction technologies such as variations in rotor-rotor spacing,
rotor tip speed, or rotor blade count [15] [16], as well as reductions in rear-rotor
diameter [17] and blade wake management [18] [19] have been explored in the past.
In general, reductions in interaction tones were observed when the effects of a single
25
Mondy
Highlight

noise reduction technology were investigated. For example, Janardan et al. [15]
reported a 10 dB reduction in the summed interaction tone levels at the takeoff
condition over a large range of polar emission angles when increasing the rotor-rotor
spacing of a model scale CRP with 9 front- and 8 clipped rear-rotor blades by 40 %.
However, a detailed experimental or computational evaluation of the effectiveness of
the different CRP noise reduction technologies starting with the dissection of the
above noise source mechanisms has not been carried out to date. The CRP noise
estimation method developed in this thesis is used to quantify the influence of the
underlying CRP noise mechanisms on interaction noise. Based on the results, the
acoustic benefits of selected CRP noise mitigation concepts are investigated.
1.2 Research Questions
For CRPs to be a viable alternative to advanced high bypass ratio, low fan pressure
ratio turbofan engine designs, both their aerodynamic and acoustic performance must
be improved. The research described in this thesis is focused on establishing an inte-
grated performance and noise assessment methodology for advanced propfan powered
aircraft configurations. The methodology is applied to carefully defined CRP aircraft
arrangements to answer the following research questions:
1. Since the CRP acoustic signature is tone noise dominated, are open rotors
a viable alternative to high bypass ratio turbofans given the stringent noise
certification requirements?
2. Based on the insight gained by dissecting and quantifying the relative impor-
tance of the source noise mechanisms responsible for CRP interaction noise,
what are the characteristics and enabling noise mitigation technologies required
to design a quiet propfan propulsion system?
3. Implementing advanced CRP noise reduction concepts, what are the trade-offs
between acoustic and aerodynamic performance? What level of noise reduction
can be achieved by implementing advanced source noise mitigation concepts?
26
The goal of this work is to quantify the potential acoustic benefits which can be
achieved by implementing CRP noise reduction technologies on a consistent aircraft
mission basis relative to advanced turbofan aircraft configurations. The success cri-
terion is to demonstrate that CRPs of advanced design can achieve significant noise
reductions while maintaining or improving aerodynamic performance.
1.3 Technical Roadmap
The objectives are to dissect and quantify the impact of the aerodynamic mecha-
nisms responsible for CRP interaction tone noise and to design an advanced CRP
configuration for improved acoustic performance with no penalties in aerodynamic
performance. The following conceptual were carried out to answer the research ques-
tions stated above.
The first step is to establish an integrated aerodynamic and acoustic performance
analysis methodology. The methodology is not limited to CRP powered aircraft con-
figurations but is capable of also dealing with turbofan arrangements such that CRP
performance results can be compared to advanced turbofan performance levels on a
consistent mission basis. The overall performance and noise assessment framework
consists of four major modules: mission analysis, propulsion system analysis, low
speed performance assessment, and noise estimation.
The second step is to define the concept aircraft configurations. First, given a
3, 500 nm mission, a baseline aircraft configuration powered by a datum high bypass
ratio, low fan pressure ratio turbofan was defined and used to validate the methods
incorporated in the overall methodology. Next, based on the datum turbofan powered
airframe, a baseline CRP arrangement was designed1.
The integration of the CRPs necessitated modifications of the turbofan powered
baseline airframe including a rearward shift of main wing and landing gear due to sta-
bility constraints and fuselage weight penalties due to structural reinforcements and
1Certification challenges such as blade containment are acknowledged but not taken into accountin the present analysis.
27

cabin noise insulation. The baseline CRP gas turbine cycle was based on the datum
turbofan and the CRP was sized to meet the thrust requirement at takeoff/top-of-
climb. The development of the baseline CRP geometry was guided by data available
in the literature [2] and the detailed aerodynamic design was finalized to match re-
ported takeoff performance characteristics using single and dual rotor vortex-lattice
methods.
The major challenge in developing the overall aerodynamic and acoustic perfor-
mance assessment methodology is the assessment of the noise generated by the prop-
fan rotor blades. Coupled CFD/CAA methods are too computationally expensive
to carry out parametric studies exploring the benefits of CRP noise reduction tech-
nologies thus a first-principles based approach is preferred. Since the accuracy of the
proposed frequency domain method is controlled by the accuracy of computing the
aerodynamic interaction, a high-fidelity CFD approach is required. To estimate the
CRP noise, the third step of the technical roadmap is to establish a frequency do-
main approach based on Hanson’s single rotor noise method. The derived CRP noise
method was validated by comparing the baseline CRP noise results to measured data
available for the same CRP configuration albeit with differences in the exact details
of the blade profiles.
In order to accurately capture the aerodynamic interaction between the CRP blade
rows and to determine the unsteady blade surface pressures necessary to define the
acoustic source terms, the fourth step is to establish a high-fidelity CFD method. To
this end, a full-wheel 3-D unsteady RANS approach was implemented. A meshing
strategy was developed with the aim on minimizing computational costs. Detailed
grid convergence and time step studies were carried out to ensure that underlying
CRP flow features (front-rotor tip-vortices and viscous wakes, rear-rotor upstream
influence, and hub wake and boundary layer) are adequately resolved.
The CRP noise method derived in this thesis allows to analyze the influence of
the noise source mechanisms inherent to CRP applications. In order to determine the
required characteristics and define necessary design features of a quiet CRP configu-
ration, the noise source mechanisms were dissected and their respective impacts were
28

quantified for the baseline CRP definition. Based on the results of this noise source
investigation, the baseline CRP was re-designed for reduced noise incorporating CRP
source noise mitigation concepts. The aerodynamic performance was maintained in
the re-design. The resulting advanced design CRP was again assessed for noise and
the achieved interaction tone reductions were quantified.
Finally, noise results at the FAR 36 observer locations are presented on the aircraft
system level for the baseline CRP and advanced design CRP aircraft configuration.
The CRP noise levels were compared to the datum turbofan powered aircraft in order
to evaluate the relative acoustic performance and determine what noise levels can be
achieved with an advanced open rotor design.
1.4 Thesis Contributions
A multidisciplinary integrated noise and performance assessment capability was es-
tablished to evaluate the acoustic and aerodynamic performance of advanced CRP
designs on the aircraft/engine system level. A frequency domain method based on
extending Hanson’s single rotor noise approach to counter-rotating propfan configu-
ration was implemented to assess the CRP noise levels. The approach was coupled
with high-fidelity full-wheel 3-D unsteady RANS simulations to capture the underly-
ing CRP noise source mechanisms and to determine the time-varying blade surface
pressures necessary to define the acoustic source terms. The method is capable of
exploring source mitigation concepts and conducting parametric studies
A detailed quantitative assessment of the underlying noise source mechanisms
was conducted for a baseline CRP design guided by data available in the literature.
The results indicate that although certain interaction tones are dominated by related
mechanisms, in order to achieve significant interaction tone noise reductions, all noise
source mechanisms need to be addressed. The acoustic performance assessment of a
re-designed CRP incorporating advanced source mitigation concepts suggests that it
is possible to meet Chapter 4 noise limits with advanced open rotor designs2.
2Subsonic transport category large aircraft certified after January 1, 2006, must demonstrate
29

noise levels no greater than the Stage 4 noise limit prescribed in section B36.5 of the FAR 36 noisestandards [20].
30
Chapter 2
Integrated Aircraft Performance
and Noise Assessment
Methodology
An overview of the integrated aircraft performance and noise assessment framework
is depicted in Figure 2-1. The methodology consists of four major modules and is
capable of assessing both turbofan and propfan powered aircraft configurations.
The overall framework begins with the mission analysis. After defining the mis-
sion to be studied, the aircraft planform and the propulsion system are selected. A
weights and balance assessment is performed first. The mission and aircraft data
are inputs to the second module of the overall framework, the analysis of the engine.
The most important parameters fed into this module are the thrust and power re-
quirements at takeoff/top-of-climb, and at the cruise design point. A suitable engine
capable of meeting the required thrust values is defined and the engine cycle analysis
is performed. The resulting engine definition is passed back to the mission assessment
module to obtain updated weights, balance and performance results. This process is
iterated until an aircraft/propulsion system is determined which meets the mission
requirements. The performance data of the selected aircraft is input to the take-
off and approach performance analysis module, the third major part of the overall
methodology. The low speed drag polars are computed and takeoff and approach
31

Framework for Propfan/Aircraft Design & Analysis
MissionPropulsion System
Planform
Structure
Weight & Balance
Drag Estimation
EPNL, OASPL Contours
Low SpeedPerformanceAnalysis (FLOPS)
Certification / Regulations
Approach Trajectory
Design Goal?
Fail
Finished
PassTakeoff Rotation/Climb Aerodynamics
Mission Check
Mission (FLOPS)
Fuel Burn Assessment
Engine Definition
Thrust/Power Requirement
CRP Design
Engine Analysis (RVL/RAXAN, GasTurb, FINE/Turbo)
Turbofan Definition
Cycle Analysis
CRP: CRP Noise Estimation
Noise Estimation (extended ESDU, CRP noise code)Engine Core
Noise Estimation
Turbofan: Fan/Jet Noise Estimation
Airframe Noise
Estimation
Propagation Effects
Unsteady Loading
Figure 2-1: Integrated aircraft performance and noise assessment methodology forturbofan and propfan configurations
32

trajectories are obtained following the FAA regulations specified in [21].
The last module of the overall methodology is the aircraft/propulsion system
noise estimation. The results of the analyses above are used as inputs: the aircraft
structural definition is required for the airframe noise estimation, various engine cycle
parameters and the unsteady blade loading in the case of a CRP powered aircraft are
needed for the engine noise calculations, and the takeoff and approach trajectories
are required to compute propagation effects. Finally, the overall framework provides
fuel burn results in terms of SFC and noise results in terms of EPNL and OASPL
contours.
The methodology developed in this thesis can be used to quantify the acoustic
benefits of advanced CRP noise reduction technologies (e.g. increased rotor-rotor
axial spacing, reduced rear rotor diameter, or differential tip speeds) on the prop-
fan/aircraft system level. Moreover, the methodology allows to investigate the effects
of noise reduction technologies on the aerodynamic performance of CRP powered
aircraft. The following sections deal with the details of the aforementioned modules
starting with the mission analysis.
2.1 Mission Analysis
In the mission analysis module, the airframe, engine type, and engine/airframe in-
tegration parameters are specified. The component weights are calculated and a de-
tailed mission performance analysis is performed using NASA’s Flight Optimization
Software FLOPS [22]. FLOPS is a multidisciplinary system for the conceptual and
preliminary design and evaluation of advanced aircraft concepts and is composed of
nine primary modules: weights, aerodynamics, engine cycle analysis, propulsion data
scaling and interpolation, mission performance, takeoff and landing, noise footprint,
cost analysis, and program control.
The developed methodology depicted in Figure 2-1 primarily uses FLOPS’ weights,
aerodynamics, mission performance, and takeoff and landing modules. The engine
cycle analysis and noise estimation approaches implemented in FLOPS are dated
33

1994 and 1981, respectively. The developed methodology is required to be capable
of assessing high bypass ratio, low fan pressure ratio turbofan designs. However, the
correlations included in the FLOPS methods are not always applicable to advanced
turbofan configurations. Therefore, higher-fidelity methods were applied for engine
analysis and noise assessment as outlined in Sections 2.2 and 2.4, respectively.
The weights module uses empirical relationships to predict the weight of each
item. The input parameters consist of the airframe dimensions. The main wing ge-
ometry can be input in more detail in terms of the airfoil characteristics at several
spanwise stations. The propulsion system weight is based on the engine thrust rating.
The fidelity of the propulsion system weight prediction can be increased by specifying
further engine parameters such as nacelle dimensions. In addition, any component
weight estimation results from external assessments can be included in the calcula-
tions. The FLOPS weight module was validated using a datum turbofan aircraft
configuration and the results are presented in Section 3.1.
A modified version of the Empirical Drag Estimation Technique (EDET) [23] is
applied for the aerodynamic performance assessment. Modifications include smooth-
ing of the drag polars and more representative Reynolds number calculations [22].
The aerodynamic performance calculations in FLOPS were also validated using an
advanced turbofan aircraft configuration with the results described in detail in Chap-
ter 3.1.
The calculated weight and aerodynamic data are used in the mission analysis
module to compute the aircraft mission performance. As outlined in the next section,
the required engine data is computed using the cycle analysis tool GasTurb, and
vortex-lattice and 3-D RANS calculations in the case of a propfan powered aircraft
configurations.
Takeoff, climb, cruise, and descent segments are included in the mission simula-
tions. The mission fuel assessment includes calculations of fuel reserves to account
for flight to an alternate airport and a specified hold segment as required by the FAA.
Iteratively, FLOPS provides performance data for each specified segment including
detailed fuel burn results.
34
2.2 Engine Analysis
For a given mission, the thrust requirements at takeoff/top-of-climb and cruise deter-
mined in FLOPS are input into the engine analysis module. The cycle analysis for
the specified turbofan or CRP gas generator is performed in GasTurb 11 [24]. Gas-
Turb allows to compute the cycle parameters at both design and off-design conditions.
The design point cycle analysis is used to evaluate the fuel burn. At off-design condi-
tions during takeoff and approach, the cycle analysis provides the engine parameters
required for the noise assessment as described in Section 2.4.
In the case of a CRP powered aircraft, the aerodynamic design of the prop-
fan is carried out at the low-speed takeoff condition using the single and dual ro-
tor vortex-lattice methods, Rotor Vortex Lattice (RVL) and Rotor AXisymmetric
ANalysis (RAXAN) [25] as outlined in Section 3.2. At both takeoff and approach,
RVL/RAXAN calculations are performed to iteratively find the optimum operat-
ing conditions meeting the thrust requirements obtained in FLOPS. In addition,
RVL/RAXAN simulations yield the shaft power to be provided by the CRP gas
generator.
RVL/RAXAN does not account for compressibility effects and therefore cannot
be used at cruise. 3-D steady RANS simulations are required to conduct CRP per-
formance studies at cruise. However, in order to optimize the CRP at cruise for
propulsive efficiency, parametric studies including tip speed and blade angle setting
variations are necessary. Due to data processing and CPU time limitations, detailed
parametric studies using 3-D RANS computations are challenging. Thus, the cruise
optimization of the CRP configuration could not be performed within the scope of
this research but can be carried out in the future.
The focus of the CFD simulations is on noise assessment. In order to determine
the time varying blade surface pressures required for the CRP acoustic analysis, full
wheel unsteady 3-D RANS simulations of the counter-rotating stage are performed
using Numeca FINE/Turbo [26]. The CRP noise assessment and CFD simulations
are described in detail in Chapter 4.
35

As illustrated in Figure 2-1, the engine parameters obtained in the engine cycle
analysis are used as inputs to the mission performance assessment in FLOPS. Itera-
tively, the engine/aircraft configuration characteristics required to meet the mission
constraints are determined.
2.3 Low Speed Performance Analysis
In the low speed performance analysis module, the takeoff and approach trajecto-
ries required for the noise audit are computed by combining an external low speed
drag polar method with the low speed aerodynamics assessment method included
in FLOPS. The low speed drag polar method is needed since FLOPS requires the
input of detailed lift and drag coefficient data at takeoff and landing to generate the
trajectories. The method implemented in this work was developed by March [27]
and calibrated using a combination of Boeing flight test data, NASA wind tunnel re-
sults, and an empirically-tuned Lockheed method. The method is generally capable
of predicting clean-configuration drag polars with about 1 % error while calculations
including deployment of high-lift devices have about 3 % error.
In addition to the takeoff and landing trajectories, the low speed performance
module in FLOPS computes the all-engine takeoff field length, the balanced field
length including one-engine-out takeoff and aborted takeoff, and the landing field
length. Moreover, the approach speed is calculated, and the second segment climb
gradient and the missed approach climb gradient are evaluated [22]. It is ensured that
all FAR 25 [21] requirements are met. If limited takeoff and landing field lengths are
prescribed, the flap and slat deflection angles are iteratively varied in the low speed
drag polar method until operating conditions are found such that the field length
conditions are satisfied.
36

Atmospheric Attenuation
Ground Reflections
LateralAttenuation
SPL(x,y,f,t)
EPNL Processing
EPNL at FAR 36 Observer Locations
Airframe Noise (ESDU):• Wing• Flaps, LE Slats• Horizontal/Vertical Tail• Landing Gear
Fan Noise (ESDU)
Jet Noise (Stone 2)
Fan Treatment (GE Method)
Airframe(FLOPS)
Aircraft Design
Engine Core(GasTurb)
Propulsion System Design
Noise Propagation from Aircraft to
Ground
DESIGN NOISE ESTIMATION PROPAGATION (ESDU) 1. Design airframe and propulsion system
2. Estimate noise emission3. Propagate noise to
ground4. FAR36 (EPNL)
Flight Simulation
FAR Points and Trajectory (FLOPS)
Turbofan
CRP Design(RVL/RAXAN)Blade Loading (FINE/Turbo)
LPC Noise (ESDU)
Combustor Noise (ESDU)
LPT Noise
CRP Noise Method
Figure 2-2: Noise assessment framework
2.4 Noise Audit
The takeoff and landing trajectories, airframe characteristics, engine cycle data, and
unsteady blade surface pressures in the case of a CRP configuration are required for
the noise assessment as shown in Figure 2-1. The main thrust of this thesis is focused
on the estimation of the noise generated from the CRP rotors and the development
of the CRP noise estimation approach is given in detail in Chapter 4. In addition, a
combination of existing analytical and empirical methods is used to compute the noise
from airframe, engine core sources, and fan in the case of a the acoustic assessment
of a turbofan configuration and to account for noise propagation effects to the FAR
36 certification locations.
An overview of the noise assessment module is presented in Figure 2-2. Using
data from FLOPS, GasTurb, and FINE/Turbo, the aircraft/propulsion system noise
estimation is subdivided into the evaluation of airframe noise, engine core noise, fan
and jet noise in the case of a turbofan powered aircraft, and rotor noise in the case
of a CRP powered configuration.
37
All noise calculations are carried out at ISA+10 ◦C day, 70 % humidity, zero wind,
and sea level conditions. The metric used for FAR 36 noise certification is the effective
perceived noise level (EPNL) [20]. It is computed from the instantaneous sound
pressure level in each of the 24 one-third octave bands for each 0.5 s increment along
the aircraft takeoff or landing trajectory. The sound pressure levels are converted
into perceived noise levels, based on noy, and corrected for tones and duration of
the sound to capture the effective perceived noise, in EPNdB, generated from the
aircraft/propulsion system configuration at each of the sideline, flyover, and approach
observer locations. In addition to EPNL calculations, which are based on the one-
third octave sound pressure levels, the method is capable of computing noise contours
in A-weighted overall sound pressure level (OASPL) for a given aircraft position
during takeoff or approach. The methods incorporated in the noise assessment module
are briefly described below.
2.4.1 Airframe Noise
The noise generated by the airframe is computed with ESDU’s airframe noise mod-
ule which uses semi-empirical methods proposed by Fink [28] and Zorumski [29]
with modifications to directivity and spectral functions based on recently available
data [30]. The method can be used to estimate airframe noise from the following
sources: main wing, flaps, leading edge slats, horizontal tail, vertical tail, and nose
and main landing gear1. The spectral and directivity characteristics of the these air-
frame sources were derived analytically or empirically, or were assumed similar to
sources of known characteristics [30]. Acoustic interaction between the components
is not accounted for. Required inputs include span and area data for the main wing,
tails, and flaps, as well as flap and slat deflection angles. Number and diameter of
nose and main landing gear wheels are needed along with strut lengths to compute
the landing gear noise.
1Most of the fluctuating lift and drag forces governing airframe noise are associated with thenoise from the wing, tail, and landing gear. The noise contribution from the fuselage is considerednegligible, even though the fuselage produces some lift.
38

2.4.2 Engine Core Noise
The engine core noise estimation is subdivided into noise generated from the low-
pressure compressor (LPC), the combustor, and the low-pressure turbine (LPT). The
noise from high pressure compressor and high pressure turbine is not accounted for,
as their contribution is negligible compared to the low-pressure components.
1. LPC Noise
The noise from the LPC is calculated using the fan/compressor noise module
in ESDU [31] which is based on Heidmann’s method [32] and is a modified
version of the Boeing-Ames procedure given in [33]. The noise radiated from
inlet and discharge duct is computed separately, in both cases broadband and
tone noise components are accounted for. In addition, multiple-pure-tone noise
or “buzz-saw” noise is calculated in the inlet duct when the relative tip speed
is supersonic. For multi-stage compressors, the final spectrum is obtained by
summing the sound energy from each stage. Blade row attenuation is included in
the calculations based on empirical data depending on the number of rotor and
stator blades in each stage. The method predicts the spectral shape, level and
free-field directivity. Corrections applied to the basic spectrum levels depend
on the presence or absence of inlet guide vanes, the rotor-rotor spacing, inlet
flow distortions during low speed ground-roll operations, and tone cut-off where
the fundamental tone is suppressed according to a criterion determined by the
number of rotor and stator blades and the value of the rotor tip Mach number.
The main input parameters required for the LPC noise estimation are the mass
flow rate, the stagnation temperature rise for each compressor stage, both design
and operating point values of the rotor tip relative inlet Mach number, and
certain fan geometry data (rotor-stator spacing and number of rotor and stator
blades for each blade). The required cycle parameters are computed in the
engine analysis module using GasTurb.
2. Combustor Noise
Combustor noise is computed using the combustor noise module in ESDU [34]
39

which was developed based on the semi-empirical method described in [35]. The
method accounts for noise of the combustion itself, propagating out of the en-
gine through the exhaust nozzle, and entropy noise, generated when the hot
turbulent products of the combustion process pass through the pressure gradi-
ents in the turbine stages downstream of the combustor. The mass flow rate
through the engine core, the stagnation pressure and temperature at the com-
bustor inlet and exit, and the stagnation temperature drop across the turbine
components are needed to assess the combustor noise.
3. LPT Noise
ESDU does not include a turbine noise estimation capability, thus a semi-
empirical method developed by Dunn and Peart [33] was implemented as pre-
sented in [36]. The input requirements consist of the mass flow rate, the static
and stagnation temperatures at the turbine exit, the rotor tip speed, as well
as the number of blades and the ratio of stator chord to stator-rotor spacing.
Applying this method to the advanced turbofan engine outlined in Section 3.1,
however, provided noise levels significantly higher than expected for an advanced
LPT design. The discrepancies are suggested to be due to the method not being
applicable to more recent turbine designs. In the light of these observations,
corrections were applied to the calculated LPT noise based on discussions with
the project industry partner.
2.4.3 Turbofan Powered Aircraft: Fan and Jet Noise
For a turbofan powered aircraft, fan and jet noise need to be estimated.
1. Fan Noise
The compressor noise module in ESDU is also applicable to fan blade rows,
thus the method described above was used for fan noise assessment with inputs
calculated from the cycle analysis. Multiple-pure-tone noise caused by blade-
to-blade variations is accounted for in the fan noise method.
The attenuation spectra due to acoustic treatment in the turbofan inlet and
40

aft fan duct are determined using an empirical method developed by Kontos et
al. [37]. Input requirements include the treatment length up- and downstream
of the fan, as well as the fan inlet radius and the aft fan duct height. The
computed attenuation spectra are then applied to the fan sound pressure levels
obtained using ESDU’s compressor noise module.
2. Jet Noise
The jet noise module incorporated in the noise audit methodology is capable
of dealing with single and coannular exhaust nozzles. A semi-empirical method
developed by Stone et al. [38] was implemented. For a dual stream jet, the
noise sources contributing to the overall jet noise are attributed to the following
mechanisms: (1) inner stream mixing noise (mid to high frequency noise) gen-
erated by the shear layer between primary and secondary jet stream, (2) outer
stream mixing noise (high frequency) due to small scale mixing near the nozzle
exit, and (3) merged mixing noise (lowest frequency) generated by the mixing of
coherent large scale turbulent jet structures with the ambient flow downstream
of the nozzle exit. In addition, a plug separation noise component (high fre-
quency) is present in nozzles with center plugs. The Stone jet noise method
includes all of the above noise source mechanisms. The method requires the
nozzle flow properties (core and bypass stream nozzle exit velocities, stagnation
temperatures, and mass flow rates) computed in GasTurb and the geometric
dimensions of the nozzle.
2.4.4 Propfan Powered Aircraft: CRP Noise
In the case of a CRP powered aircraft configuration, counter-rotating propfan noise
is computed using the CRP noise estimation method described in Chapter 4. The
frequency domain CRP noise method developed here requires the time-varying blade
surface pressure data computed using 3-D unsteady RANS simulations. Additional
required inputs are the CRP operating conditions during takeoff and approach. The
low-speed off-design data is determined using vortex-lattice methods and the low-
41
speed performance assessment module in FLOPS as outlined in Chapters 2.2 and 2.3,
respectively.
2.4.5 Propagation Effects
The above methods include spherical spreading effects. The sound pressure levels at
the observer decrease in intensity with the square of the propagation distance from
the source. However, sound pressure levels are further attenuated by atmospheric
molecular absorption. Atmospheric absorption varies linearly with distance and the
rate of attenuation depends on frequency and varies with ambient temperature, pres-
sure, and humidity. The attenuation due to atmospheric absorption is estimated using
atmospheric absorption method in ESDU [39]. In addition, the noise received by the
observer is influenced by ground reflection effects. Sound waves directly from the
source and sound waves reflected off the ground surface are simultaneously received
at the observer location. The emitted and reflected waves cause local constructive
and destructive interference. Ground reflection effects depend on frequency, the dis-
tance of the observer from the reflecting surface, and local ground impedance. The
influence of ground reflection on the noise received at the observer is evaluated using
the procedures described in [40] and [41].
2.4.6 Post-Processing for FAR 36 Noise Assessment
Using the airframe characteristics, engine cycle parameters, unsteady CRP blade
loading, and takeoff and approach trajectories as input data, the noise results from
the above sources are post-processed in Matlab and EPNL values are obtained at
the FAR 36 observer locations. However, in order to reduce computational cost,
only three off-design conditions are simulated to determine the required engine cycle
properties for the flyover and sideline observer locations: (1) at Mach 0.1, (2) when the
aircraft begins rotation, and (3) at cutback. The engine parameters are then assumed
to be approximately constant between two off-design conditions. Similarly, the cycle
properties are approximately constant during the final part of the approach trajectory
42

and the required engine parameters are computed only for the flight condition at
6, 560 ft ahead of the runway which corresponds to the aircraft being directly above
the approach observer position.
2.4.7 Summary
In summary, an integrated framework for the aerodynamic and acoustic performance
assessment of turbofan and propfan powered aircraft arrangements was established
in this chapter. Existing analytical and empirical methods were implemented for the
mission analysis, engine cycle assessment, low-speed performance calculations, and
the noise prediction of airframe, engine core, and fan sources. Corrections based on
trends observed in advanced engine designs were applied to the calculated turbine
noise results as the available method is not applicable to advanced turbine configura-
tions. The methods described in this chapter are necessary in order to assess aircraft
noise at the FAR 36 observer locations and the methods were validated using a given
turbofan powered aircraft definition as discussed in the next chapter. The overall
focus of this thesis is on the development of a high-fidelity CRP noise estimation
approach which is incorporated in the noise framework illustrated in Figure 2-2. The
developed CRP noise method is described in detail in Chapter 4.
43

44

Chapter 3
Concept Aircraft Definitions
Advanced open rotor designs are regarded as potential propulsion systems mostly for
future short- to medium-range narrow-body aircraft. A 737 size twin engine aircraft
was defined as a representative baseline configuration. The selected aircraft seats 150
passengers and has a range capability of 3, 500 nm at cruise Mach number 0.78. An
advanced high-bypass turbofan engine was chosen as the propulsion system. This
datum turbofan aircraft configuration was used to validate the overall methodology
and provides a basis for comparison for the CRP powered aircraft arrangements which
are the focus of this research. The definition of the datum turbofan/baseline airframe
configuration is described in detail in the first part of this chapter.
Powered by two aft fuselage pylon mounted pusher CRPs, a second aircraft based
on the airframe of the turbofan powered aicraft and for the same mission was defined
next and is denoted as the baseline CRP configuration throughout this thesis. The
design of the CRP engine and the modifications to the baseline airframe due to the
integration of the CRPs are outlined in the second part of this chapter.
3.1 Datum Turbofan Powered Aircraft
An overview of the mission and baseline airframe definitions is given first. Next, a
description of the datum turbofan engine is presented, followed by a summary of the
analysis of the datum turbofan aircraft aerodynamic and acoustic performance.
45
Mondy
Rectangle
Mondy
Rectangle
3.1.1 Mission and Airframe Definition
The baseline aircraft characteristics and mission requirements were defined in collab-
oration with the project industry partner. The mission specifications are summarized
in Table 3.1. Based on the tabulated requirements, a datum turbofan powered aircraft
configuration was defined and a detailed performance study and mission analysis was
conducted using the tools included in the integrated performance framework shown
in Figure 2-1.
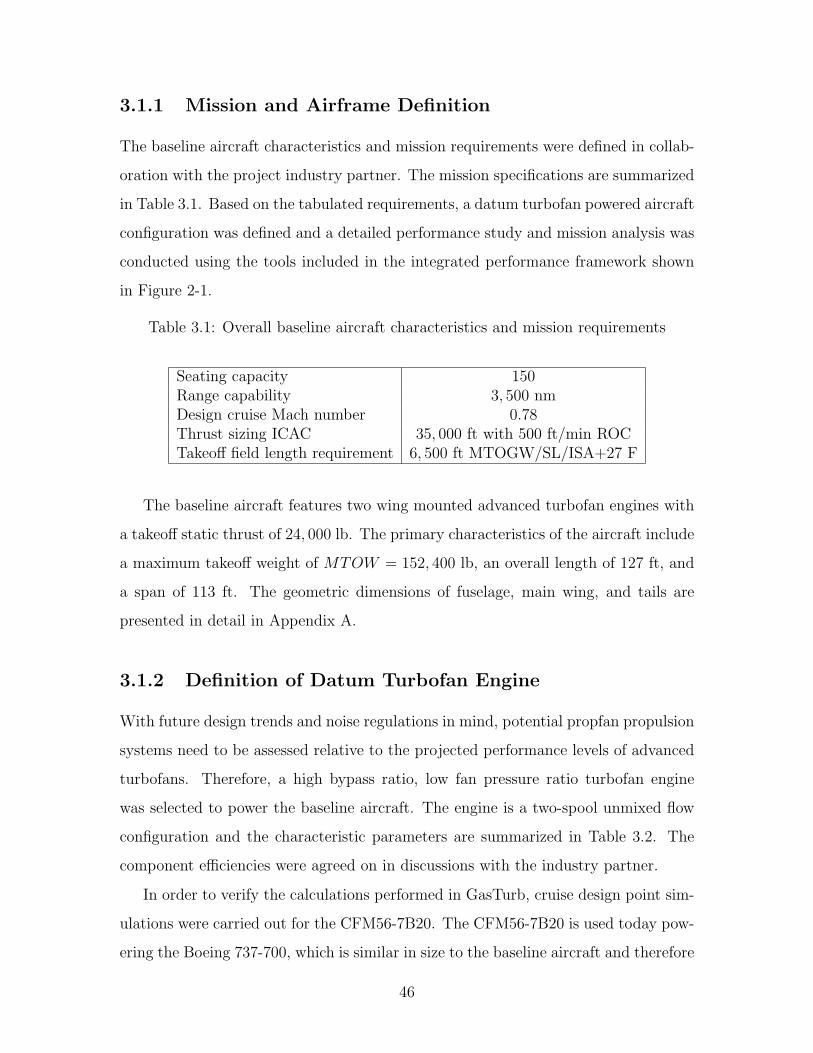
Table 3.1: Overall baseline aircraft characteristics and mission requirements
Seating capacity 150Range capability 3, 500 nmDesign cruise Mach number 0.78Thrust sizing ICAC 35, 000 ft with 500 ft/min ROCTakeoff field length requirement 6, 500 ft MTOGW/SL/ISA+27 F
The baseline aircraft features two wing mounted advanced turbofan engines with
a takeoff static thrust of 24, 000 lb. The primary characteristics of the aircraft include
a maximum takeoff weight of MTOW = 152, 400 lb, an overall length of 127 ft, and
a span of 113 ft. The geometric dimensions of fuselage, main wing, and tails are
presented in detail in Appendix A.
3.1.2 Definition of Datum Turbofan Engine
With future design trends and noise regulations in mind, potential propfan propulsion
systems need to be assessed relative to the projected performance levels of advanced
turbofans. Therefore, a high bypass ratio, low fan pressure ratio turbofan engine
was selected to power the baseline aircraft. The engine is a two-spool unmixed flow
configuration and the characteristic parameters are summarized in Table 3.2. The
component efficiencies were agreed on in discussions with the industry partner.
In order to verify the calculations performed in GasTurb, cruise design point sim-
ulations were carried out for the CFM56-7B20. The CFM56-7B20 is used today pow-
ering the Boeing 737-700, which is similar in size to the baseline aircraft and therefore
46

the generated thrust levels are similar to the selected datum turbofan performance.
The computed specific fuel consumption for the datum turbofan of advanced design
shows a reduction of 11 % compared to CFM56-7B20 as indicated in Table 3.2. Both
the computed datum turbofan and the calculated CFM56-7B20 performance and fuel
burn results were carefully checked for consistency with the industry partner.
Table 3.2: Datum turbofan engine characteristics at cruise design point compared toCFM56-7B20 characteristics (extracted from [1])
Datum Turbofan CFM56-7B20Bypass ratio 8.9 5.5Fan pressure ratio 1.49 1.65Overall pressure ratio 36.5 25.6Turbine inlet temperature 2, 770 R 2, 700 RThrust 4, 800 lb 4, 640 lbSpecific fuel consumption 0.536 lb lbh 0.603 lb lbh
As described in Chapter 2, design and off-design computations are performed in
GasTurb to determine the fuel burn and the cycle properties required for the noise
assessment. These calculations take into account the details of the internal air system
including the cooling air mass flows for the high pressure turbine (HPT), the nozzle
guide vanes, and the LPT. In addition, the simulations include a pre-defined overboard
bleed mass flow.
3.1.3 Datum Turbofan Aircraft Aerodynamic and Acoustic
Performance
The turbofan powered aircraft configuration is sketched on the left in Figure 3-1.
It should be noted that the dimensions are not drawn to scale. The results for the
weight breakdown, aerodynamic performance, and noise assessment are summarized
below.
47
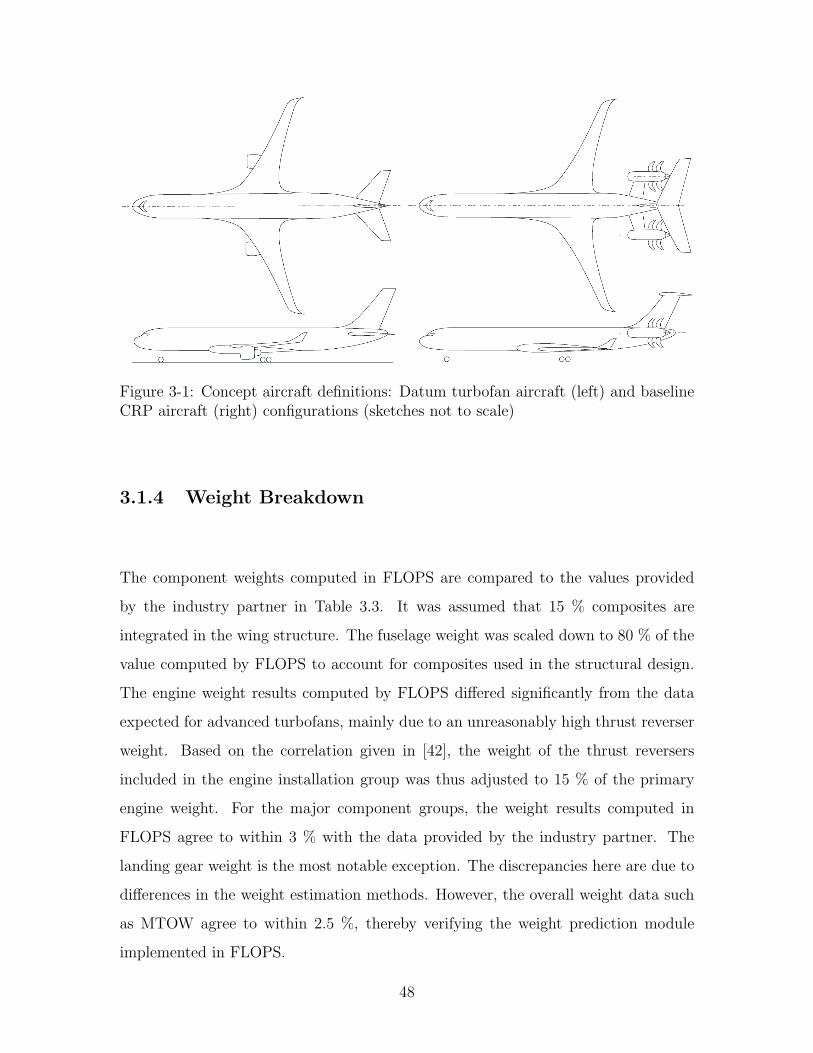
Figure 3-1: Concept aircraft definitions: Datum turbofan aircraft (left) and baselineCRP aircraft (right) configurations (sketches not to scale)
3.1.4 Weight Breakdown
The component weights computed in FLOPS are compared to the values provided
by the industry partner in Table 3.3. It was assumed that 15 % composites are
integrated in the wing structure. The fuselage weight was scaled down to 80 % of the
value computed by FLOPS to account for composites used in the structural design.
The engine weight results computed by FLOPS differed significantly from the data
expected for advanced turbofans, mainly due to an unreasonably high thrust reverser
weight. Based on the correlation given in [42], the weight of the thrust reversers
included in the engine installation group was thus adjusted to 15 % of the primary
engine weight. For the major component groups, the weight results computed in
FLOPS agree to within 3 % with the data provided by the industry partner. The
landing gear weight is the most notable exception. The discrepancies here are due to
differences in the weight estimation methods. However, the overall weight data such
as MTOW agree to within 2.5 %, thereby verifying the weight prediction module
implemented in FLOPS.
48

Table 3.3: Datum turbofan aircraft weight breakdown: Component weights computedin FLOPS and relative error of calculated results to data provided by the industrypartner
Component Computed Relative Error toBreakdown Weight in lb Industry Data in %
Airframe Structure 37, 900 2.75Wing 14, 300 0.29Fuselage 14, 900 −0.15Tails 3, 100 −12.07Landing gear 5, 600 33.72
Aircraft Systems 8, 100 1.64Electronic Systems 2, 700 -4.50
Electronics 2, 200 −1.79Instruments 500 −15.17
Engine Installation 8, 200 0.16Primary engine 7, 200 0.42Wing installation 1, 000 −1.67
Furnishings and Equipment 11, 900 -0.76Manufacturer’s Empty Weight (MEW) 77, 000 0.54Operating Empty Weight (OEW) 84, 200 0.51Maximum Zero Fuel Weight (MZFW)) 123, 800 0.49Maximum Payload Weight 19, 600 0.45Maximum Takeoff Weight (MTOW) 155, 500 2.03Maximum Landing Weight (MLW) 133, 800 2.46
49

0.1 0.3 0.5 0.7 0.90.015
0.025
0.035
0.045
0.055
0.065
CL [−]
CD [−
]
a) h = 25,000 ft, M = 0.78
Benchmark DataFLOPS
0.1 0.3 0.5 0.7 0.90.015
0.025
0.035
0.045
0.055
0.065
CL [−]
CD [−
]
b) h = 35,000 ft, M = 0.78
Benchmark DataFLOPS
Figure 3-2: Analysis of the datum turbofan aircraft aerodynamic performance at a)h = 25, 000 ft, M = 0.78 and b) h = 35, 000 ft, M = 0.78
3.1.5 High Speed Aerodynamic Performance
To validate the aerodynamic performance analysis performed in FLOPS, high speed
drag polar results were compared to data provided by the industry partner. The drag
polars are presented for two flight conditions at cruise Mach number 0.78 in Figure
3-2 a) and b). Good agreement is observed for the lift coefficient range relevant for
cruise conditions (0.4 < CL < 0.55). The discrepancies for CL < 0.4 are due to the
drag estimation technique implemented in FLOPS not being applicable to flight at
low lift coefficients [23]. Overall, drag polars were compared for altitudes in the range
of 1, 000 ft< h < 40, 000 ft and Mach numbers 0.4 < M < 0.8. For all investigated
flight conditions the results showed similar behavior to the trends observed in Figure
3-2.
3.1.6 Low Speed Aerodynamic Performance
Using the low speed drag polar method presented in Chapter 2.3, the low speed
performance of the datum turbofan aircraft was analyzed. The takeoff and landing
field lengths are mostly controlled by the flap and slat settings. The flap and slat
50
angles were iteratively varied until the mission requirements were met (maximum
FAR 25 takeoff and landing field lengths ≤ 6, 500 ft). The final flap and slat settings
and the resulting takeoff and landing field lengths for the datum turbofan aircraft
configuration are tabulated in Table 3.4.
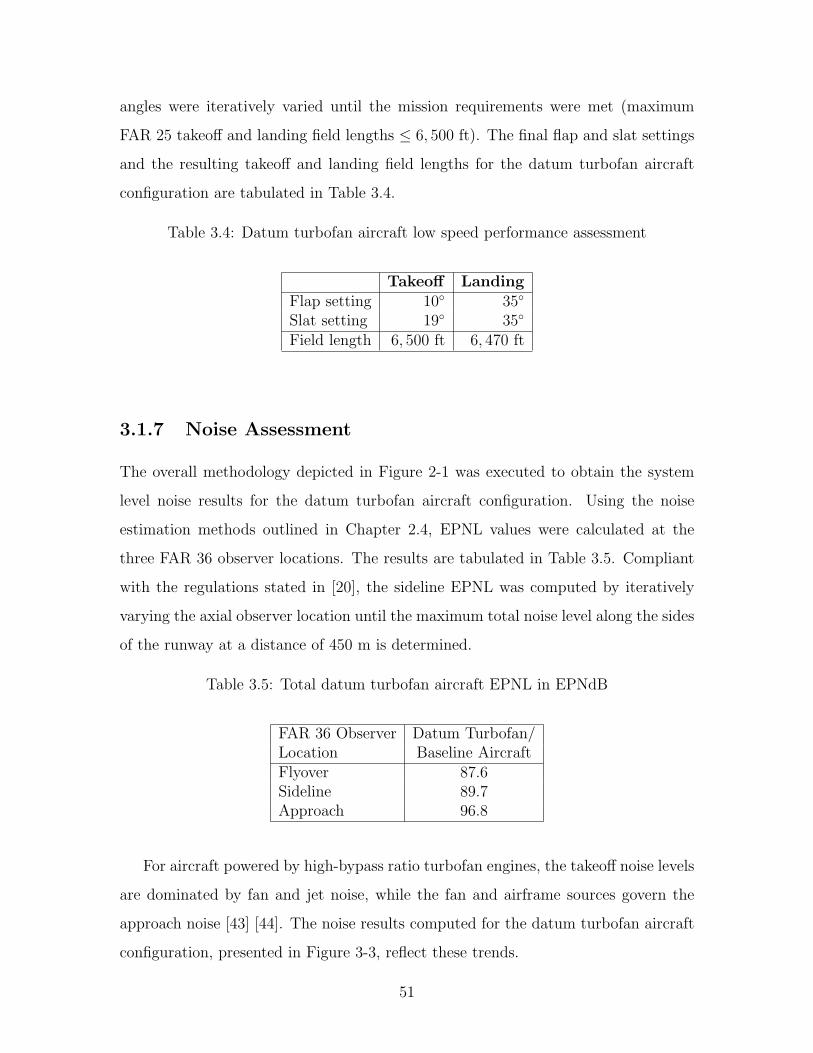
Table 3.4: Datum turbofan aircraft low speed performance assessment
Takeoff LandingFlap setting 10◦ 35◦
Slat setting 19◦ 35◦
Field length 6, 500 ft 6, 470 ft
3.1.7 Noise Assessment
The overall methodology depicted in Figure 2-1 was executed to obtain the system
level noise results for the datum turbofan aircraft configuration. Using the noise
estimation methods outlined in Chapter 2.4, EPNL values were calculated at the
three FAR 36 observer locations. The results are tabulated in Table 3.5. Compliant
with the regulations stated in [20], the sideline EPNL was computed by iteratively
varying the axial observer location until the maximum total noise level along the sides
of the runway at a distance of 450 m is determined.
Table 3.5: Total datum turbofan aircraft EPNL in EPNdB
FAR 36 Observer Datum Turbofan/Location Baseline AircraftFlyover 87.6Sideline 89.7Approach 96.8
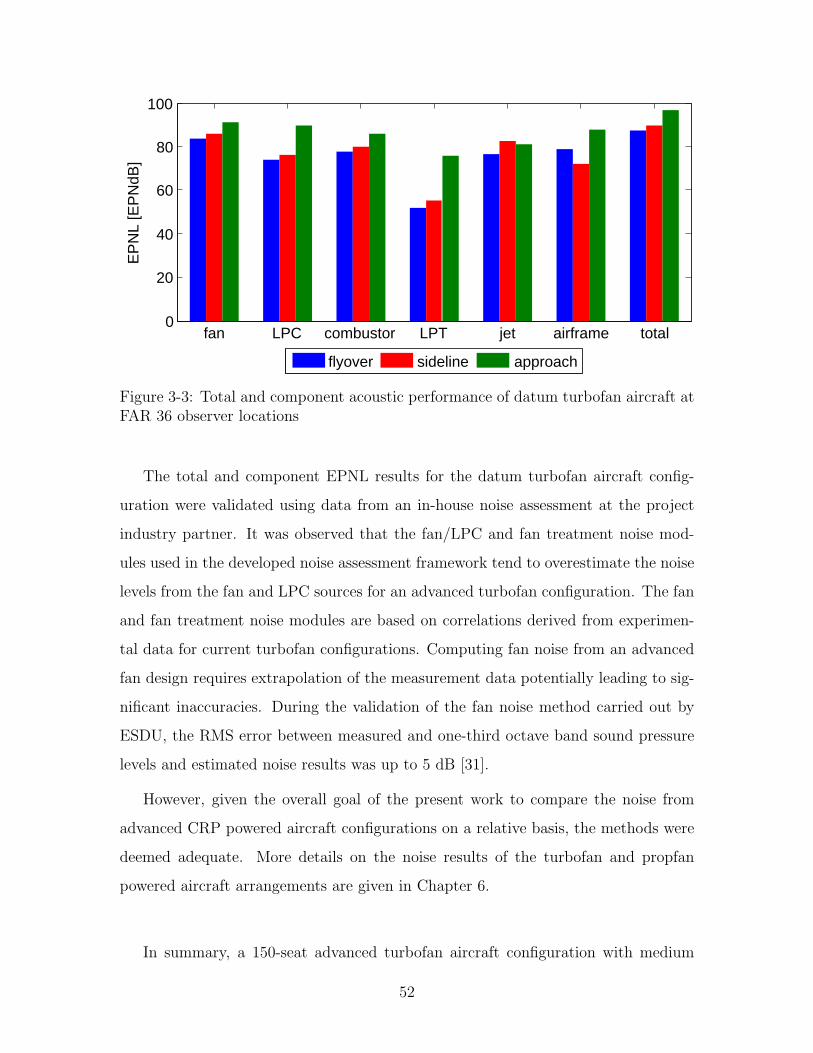
For aircraft powered by high-bypass ratio turbofan engines, the takeoff noise levels
are dominated by fan and jet noise, while the fan and airframe sources govern the
approach noise [43] [44]. The noise results computed for the datum turbofan aircraft
configuration, presented in Figure 3-3, reflect these trends.
51
fan LPC combustor LPT jet airframe total0
20
40
60
80
100
EP
NL
[EP
NdB
]
flyover sideline approach
Figure 3-3: Total and component acoustic performance of datum turbofan aircraft atFAR 36 observer locations
The total and component EPNL results for the datum turbofan aircraft config-
uration were validated using data from an in-house noise assessment at the project
industry partner. It was observed that the fan/LPC and fan treatment noise mod-
ules used in the developed noise assessment framework tend to overestimate the noise
levels from the fan and LPC sources for an advanced turbofan configuration. The fan
and fan treatment noise modules are based on correlations derived from experimen-
tal data for current turbofan configurations. Computing fan noise from an advanced
fan design requires extrapolation of the measurement data potentially leading to sig-
nificant inaccuracies. During the validation of the fan noise method carried out by
ESDU, the RMS error between measured and one-third octave band sound pressure
levels and estimated noise results was up to 5 dB [31].
However, given the overall goal of the present work to compare the noise from
advanced CRP powered aircraft configurations on a relative basis, the methods were
deemed adequate. More details on the noise results of the turbofan and propfan
powered aircraft arrangements are given in Chapter 6.
In summary, a 150-seat advanced turbofan aircraft configuration with medium
52

range capability was developed. The overall aerodynamic and acoustic performance
assessment methodology was executed for this datum turbofan aircraft and the results
were used to validate the implemented methods.
3.2 Baseline CRP Powered Aircraft
The baseline CRP powered aircraft was defined based on the airframe of the datum
turbofan aircraft and for the mission specified in Table 3.1. The CRPs are in aft
fuselage pylon mounted pusher configuration as sketched on the right in Figure 3-
1. The modifications due to the integration of the CRPs into the baseline airframe
presented above are summarized first. Next, a detailed discussion of the baseline CRP
aerodynamic design is given followed by the description of the engine.
3.2.1 Modifications to Baseline Airframe
The integration of the CRPs necessitated modifications to the baseline airframe.
These included a rearward shift of the main wing and landing gear to meet static
stability requirements. In addition, the component weight breakdown and the overall
aircraft weights were significantly affected due to the installation of the CRP propul-
sion system.
The weight changes relative to the datum turbofan aircraft are summarized in
Table 3.6. Propfan blades, gearbox, and larger pylons resulted in a propulsion system
weight increase compared to the datum turbofan engine. The assumptions for the
propulsion system weight are based on findings presented in an investigation by Gold-
smith [45], which concerns the feasibility of a propfan propulsion system relative to a
turbofan based propulsion system for the Douglas DC-9 Super 80. The study presents
detailed component weight and aerodynamic and acoustic performance comparisons
with the baseline turbofan aircraft for three propfan arrangements (the propfans are
single-rotating, 13.8 ft in diameter). The results were used estimate the weights of
the baseline CRP rotors (12.5 ft in diameter, see Section 3.2.2) and nacelle as well as
the fuselage weight penalty due structural reinforcements to support the CRP engine
53

Table 3.6: Weight changes for the baseline CRP powered aircraft relative to thedatum turbofan aircraft configuration
Component Weight Change
Propulsion system (per engine)Gearbox +500 lbPylon and nacelle +1, 500 lbCRP core and propfan relative +550 lbto primary turbofan engine
FuselageNoise insulation +800 lbStructural reinforcements +1, 500 lb
Landing gear +300 lbVertical tail +200 lbMission fuel −2, 900 lb
MTOW +5, 000 lb
mounting structure.
For an aft fuselage pylon mounted propfan configuration, the study by Goldsmith
suggests an increase of 1, 000 lb in primary engine weight per engine (engine core,
propfan blades, gearbox) relative to the baseline turbofan arrangement. In this thesis,
it was assumed that some weight benefit can be reached due to the advances in mate-
rials since the 1981 single-rotating propfan study by Goldsmith. It was determined in
discussions with the industry partner that an increase of 1, 050 lb in primary engine
weight is adequate even though the current study concerns counter-rotating prop-
fans instead of single-rotating configurations. Furthermore, for the aft fuselage pylon
mounted propfan aircraft arrangement, the study by Goldsmith indicates a 4, 600 lb
increase in the total weight of nacelle, mounting structure, and fuselage structural
reinforcements relative to the baseline turbofan configuration. In the present work,
a similar increase of 4, 500 lb was assumed, of which 3, 000 lb are attributed to the
pylon and nacelle weight, and 1, 500 lb are attributed to the reinforcements required
in the fuselage structure.
In addition to propulsion system weight changes, fuselage weight penalties due to
cabin noise insulation needed to be accounted for. Two approaches were investigated:
1) Insulating the entire fuselage with a trim insulation material in use in current
54

aircraft [46], or 2) insulating only the aft fuselage structure near the CRP engines
with trim panels of 1980 vintage used in the study by Goldsmith [45]. The resulting
weight penalties were approximately 800 lb in both cases. Consequently, this value
was assumed for the fuselage weight increase due to cabin insulation.
The mission fuel requirement was significantly reduced due to the propulsive ef-
ficiency and fuel burn benefit of the baseline CRP aircraft compared to the datum
turbofan. As a result of the tabulated weight changes, the maximum takeoff weight
for the baseline CRP aircraft increased by 5, 000 lb.
3.2.2 Baseline CRP Aerodynamic Design
The baseline CRP design was guided by data available in the literature [2] regarding
an experimental performance study of a model scale CRP D = 0.56 m in diameter.
Selected configuration characteristics and cruise and takeoff operating condition de-
tails are provided in [2] and are summarized in Table 3.7. Advance ratio and thrust
coefficient are defined as J = V0/ (ND) and CT = T/ (ρ0N2D4), respectively, where
V0 is the flight speed, T is the thrust, and ρ0 is the free stream density1.
Table 3.7: Model scale baseline CRP characteristics and operating conditions (ex-tracted from [2])
Model Characteristics Front RearDiameter D (m) 0.56 0.56Blade count B (-) 10 8Hub-to-tip ratio rhub/rtip (-) 0.4 0.4Sweep ϕ (◦) 40 40rotor-rotor axial spacing x/D1 (-) 0.224
Operating Conditions Cruise TakeoffMach number M0 (-) 0.78 0.26Altitude h (m) 10, 670 Sea levelRotational speed (rpm) 6, 665 6, 665Advance ratio J (-) 3.90 1.43Thrust coefficient CT (-) 1.10 1.17
1Throughout this thesis, advance ratio and thrust coefficient are defined using the average shaftspeed N = (N1 + N2) and average rotor diameter D = (D1 + D2) /2, where subscripts 1 and 2denote the front and rear rotor, respectively.
55
Mondy
Rectangle
Mondy
Highlight

0
Pusher CRP Design
Vx,e
Vx,0
Vx,p
TA1 A1,e
Ap
A0
p0
p0
pa
Vx,0
pcpb
Vx,p
Vx2,e
mass flow entrained between rotors
Figure 3-4: Actuator disk and control volume analysis approach
In addition to the tabulated data, the radial distribution of the stagnation pressure
ratio π (r) = pt (r) /pt,0 across the CRP is presented in [2] for the cruise operating
condition. The given stagnation pressure radial distribution served as the starting
point of the baseline CRP design. The main objective was to establish a credible
CRP geometry while minimizing the exit swirl and matching the given performance
data. The design approach steps and main assumptions are described below:
1. Based on the given stagnation pressure ratio π (r) and an assumed adiabatic effi-
ciency ηad, the stagnation temperature ratio across the CRP, τ (r) = Tt (r) /Tt,0,
is computed using the definition of adiabatic efficiency,
ηad =πγ−1γ
τ − 1, (3.1)
where γ = 1.4 is the ratio of specific heats.
2. The remaining analysis required a control volume approach which is sketched
in Figure 3-4. In the approach, the CRP rotors are modeled as simple actuator
disks2. Assuming that additional mass flow is entrained through the rear rotor,
2The actuator disk approach was used to compute the flow velocity across the rotors. Incom-pressible flow is assumed in this approach. The remaining control volume analysis, however, wascarried out assuming compressible flow. Upon completing the model scale baseline CRP design, asteady CFD simulation was carried out. The density change across the two rotors was determinedas approximately 3.0 %. Thus, assuming incompressible flow and constant axial velocity across therotors was appropriate in the current analysis.
56
Mondy
Highlight
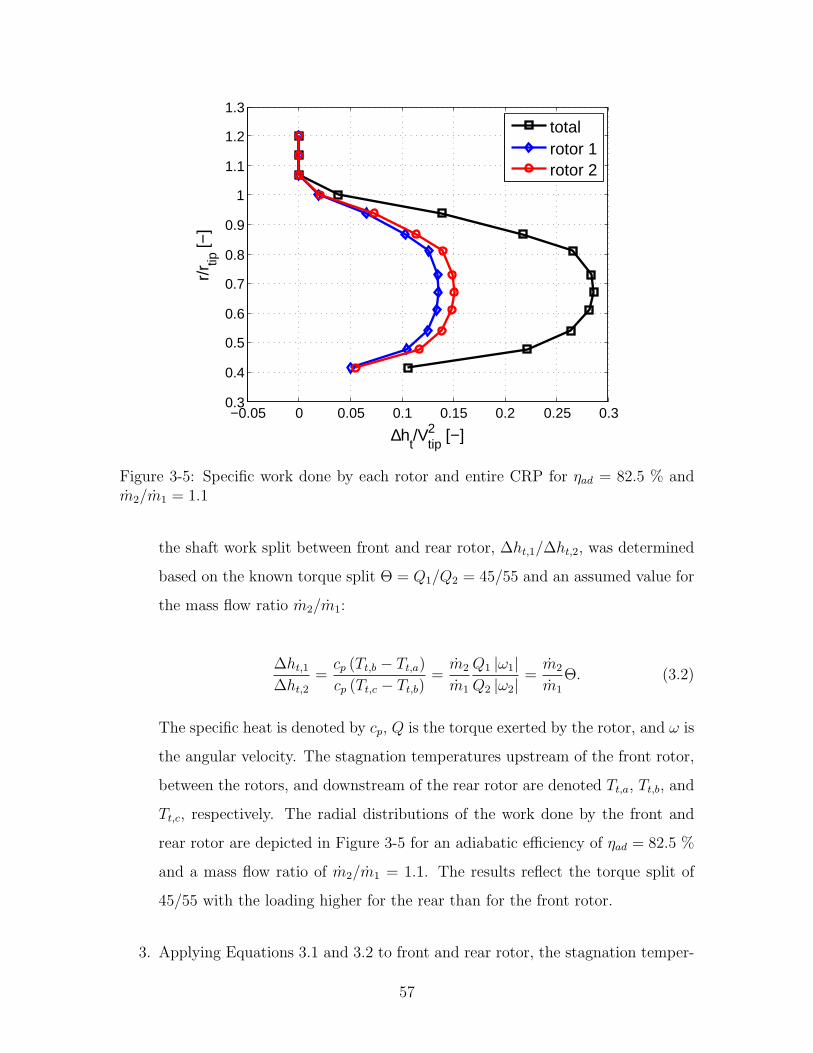
−0.05 0 0.05 0.1 0.15 0.2 0.25 0.30.3
0.4
0.5
0.6
0.7
0.8
0.9
1
1.1
1.2
1.3
r/r tip
[−]
∆ht/V
tip2 [−]
totalrotor 1rotor 2
Figure 3-5: Specific work done by each rotor and entire CRP for ηad = 82.5 % andm2/m1 = 1.1
the shaft work split between front and rear rotor, ∆ht,1/∆ht,2, was determined
based on the known torque split Θ = Q1/Q2 = 45/55 and an assumed value for
the mass flow ratio m2/m1:
∆ht,1∆ht,2
=cp (Tt,b − Tt,a)cp (Tt,c − Tt,b)
=m2
m1
Q1 |ω1|Q2 |ω2|
=m2
m1
Θ. (3.2)
The specific heat is denoted by cp, Q is the torque exerted by the rotor, and ω is
the angular velocity. The stagnation temperatures upstream of the front rotor,
between the rotors, and downstream of the rear rotor are denoted Tt,a, Tt,b, and
Tt,c, respectively. The radial distributions of the work done by the front and
rear rotor are depicted in Figure 3-5 for an adiabatic efficiency of ηad = 82.5 %
and a mass flow ratio of m2/m1 = 1.1. The results reflect the torque split of
45/55 with the loading higher for the rear than for the front rotor.
3. Applying Equations 3.1 and 3.2 to front and rear rotor, the stagnation temper-
57
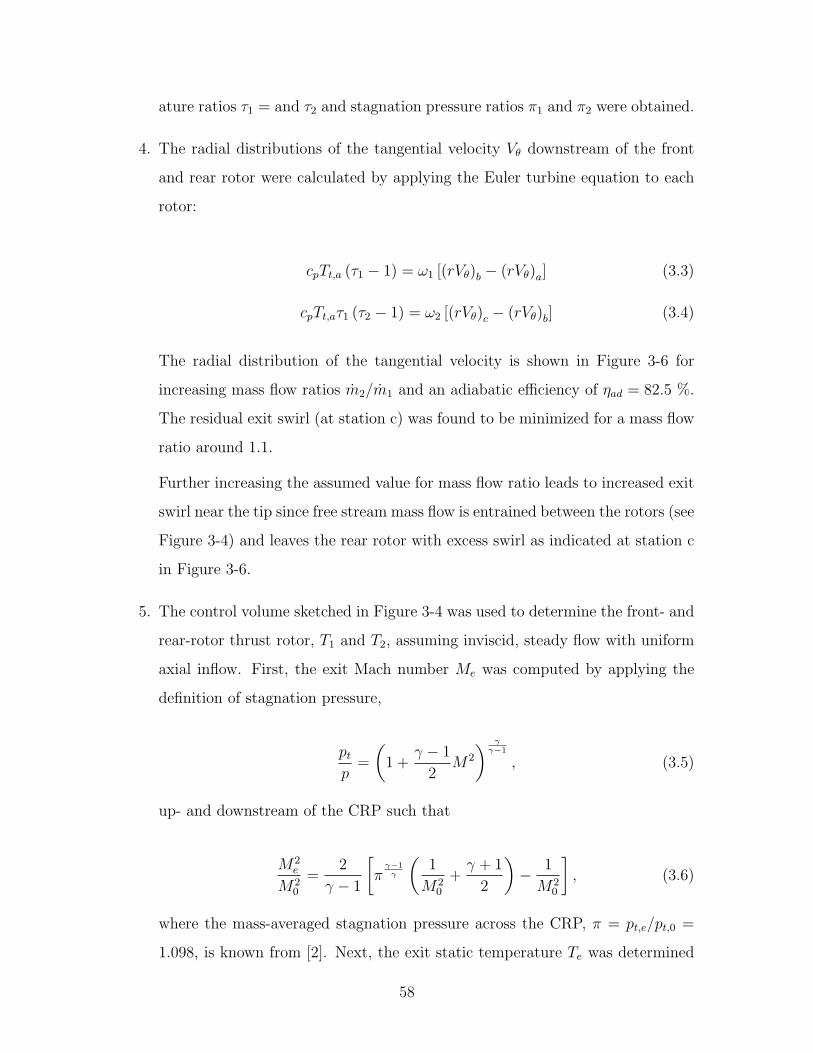
ature ratios τ1 = and τ2 and stagnation pressure ratios π1 and π2 were obtained.
4. The radial distributions of the tangential velocity Vθ downstream of the front
and rear rotor were calculated by applying the Euler turbine equation to each
rotor:
cpTt,a (τ1 − 1) = ω1 [(rVθ)b − (rVθ)a] (3.3)
cpTt,aτ1 (τ2 − 1) = ω2 [(rVθ)c − (rVθ)b] (3.4)
The radial distribution of the tangential velocity is shown in Figure 3-6 for
increasing mass flow ratios m2/m1 and an adiabatic efficiency of ηad = 82.5 %.
The residual exit swirl (at station c) was found to be minimized for a mass flow
ratio around 1.1.
Further increasing the assumed value for mass flow ratio leads to increased exit
swirl near the tip since free stream mass flow is entrained between the rotors (see
Figure 3-4) and leaves the rear rotor with excess swirl as indicated at station c
in Figure 3-6.
5. The control volume sketched in Figure 3-4 was used to determine the front- and
rear-rotor thrust rotor, T1 and T2, assuming inviscid, steady flow with uniform
axial inflow. First, the exit Mach number Me was computed by applying the
definition of stagnation pressure,
ptp
=
(1 +
γ − 1
2M2
) γγ−1
, (3.5)
up- and downstream of the CRP such that
M2e
M20
=2
γ − 1
[πγ−1γ
(1
M20
+γ + 1
2
)− 1
M20
], (3.6)
where the mass-averaged stagnation pressure across the CRP, π = pt,e/pt,0 =
1.098, is known from [2]. Next, the exit static temperature Te was determined
58

−0.1 −0.05 0 0.05 0.1 0.15 0.2 0.250.3
0.4
0.5
0.6
0.7
0.8
0.9
1
1.1
1.2
1.3
r/r tip
[−]
Vθ/Vx,0 [−]
mass flow ratio = 1.0mass flow ratio = 1.1mass flow ratio = 1.2mass flow ratio = 1.3
station b
mass flowratio
mass flowratio
station c
Figure 3-6: Influence of mass flow ratio m2/m1 on tangential velocity downstream offront and rear rotor for ηad = 82.5 %
based on the exit Mach number and the mass-averaged stagnation temperature
ratio τ = Tt,e/Tt,0. With the exit static temperature determined, the exit axial
velocity Vx,e was computed. From actuator disk theory, the axial velocity at the
propfan rotors can be assumed as
Vx,a = Vx,b = Vx,c =Vx,e − Vx,0
2. (3.7)
Finally, imposing radial equilibrium,
∂p (r)
∂r= ρ
V 2θ (r)
r, (3.8)
the radial distributions of static pressure downstream of the front and rear rotor
were determined by integration. With this, the front- and rear-rotor thrust
coefficients can be computed.
6. The assumed values for adiabatic efficiency and entrained mass flow were iter-
59
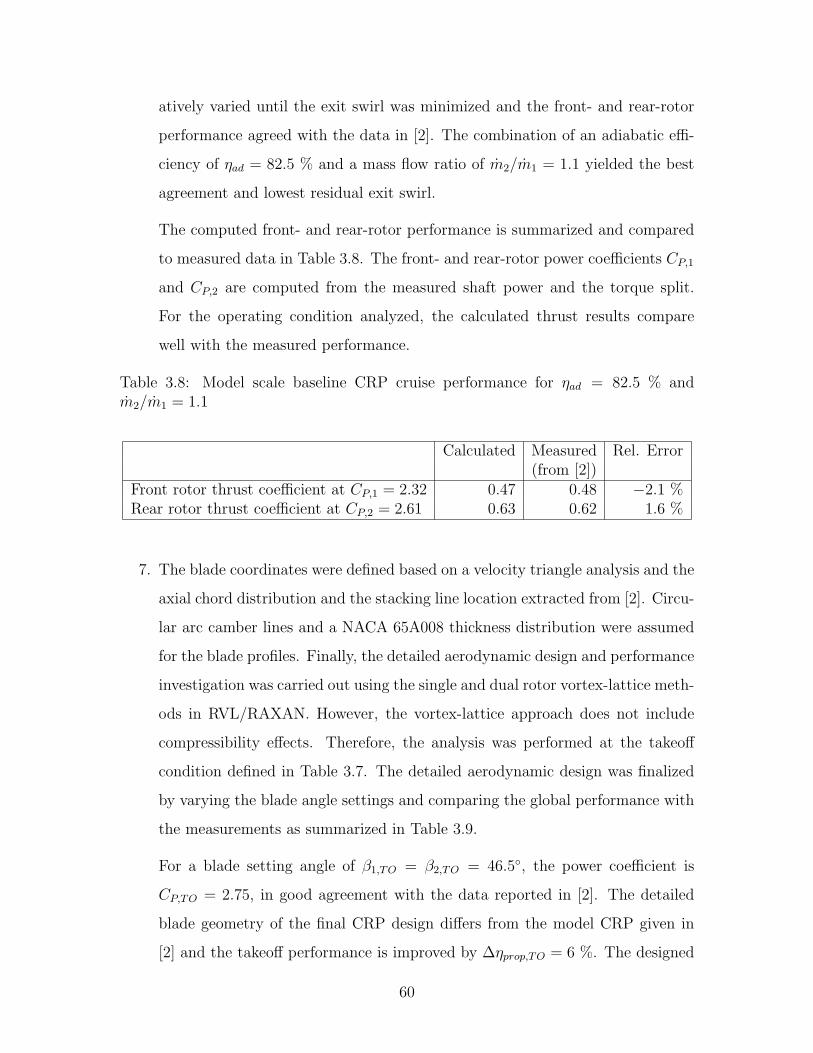
atively varied until the exit swirl was minimized and the front- and rear-rotor
performance agreed with the data in [2]. The combination of an adiabatic effi-
ciency of ηad = 82.5 % and a mass flow ratio of m2/m1 = 1.1 yielded the best
agreement and lowest residual exit swirl.
The computed front- and rear-rotor performance is summarized and compared
to measured data in Table 3.8. The front- and rear-rotor power coefficients CP,1
and CP,2 are computed from the measured shaft power and the torque split.
For the operating condition analyzed, the calculated thrust results compare
well with the measured performance.
Table 3.8: Model scale baseline CRP cruise performance for ηad = 82.5 % andm2/m1 = 1.1
Calculated Measured Rel. Error(from [2])
Front rotor thrust coefficient at CP,1 = 2.32 0.47 0.48 −2.1 %Rear rotor thrust coefficient at CP,2 = 2.61 0.63 0.62 1.6 %
7. The blade coordinates were defined based on a velocity triangle analysis and the
axial chord distribution and the stacking line location extracted from [2]. Circu-
lar arc camber lines and a NACA 65A008 thickness distribution were assumed
for the blade profiles. Finally, the detailed aerodynamic design and performance
investigation was carried out using the single and dual rotor vortex-lattice meth-
ods in RVL/RAXAN. However, the vortex-lattice approach does not include
compressibility effects. Therefore, the analysis was performed at the takeoff
condition defined in Table 3.7. The detailed aerodynamic design was finalized
by varying the blade angle settings and comparing the global performance with
the measurements as summarized in Table 3.9.
For a blade setting angle of β1,TO = β2,TO = 46.5◦, the power coefficient is
CP,TO = 2.75, in good agreement with the data reported in [2]. The detailed
blade geometry of the final CRP design differs from the model CRP given in
[2] and the takeoff performance is improved by ∆ηprop,TO = 6 %. The designed
60
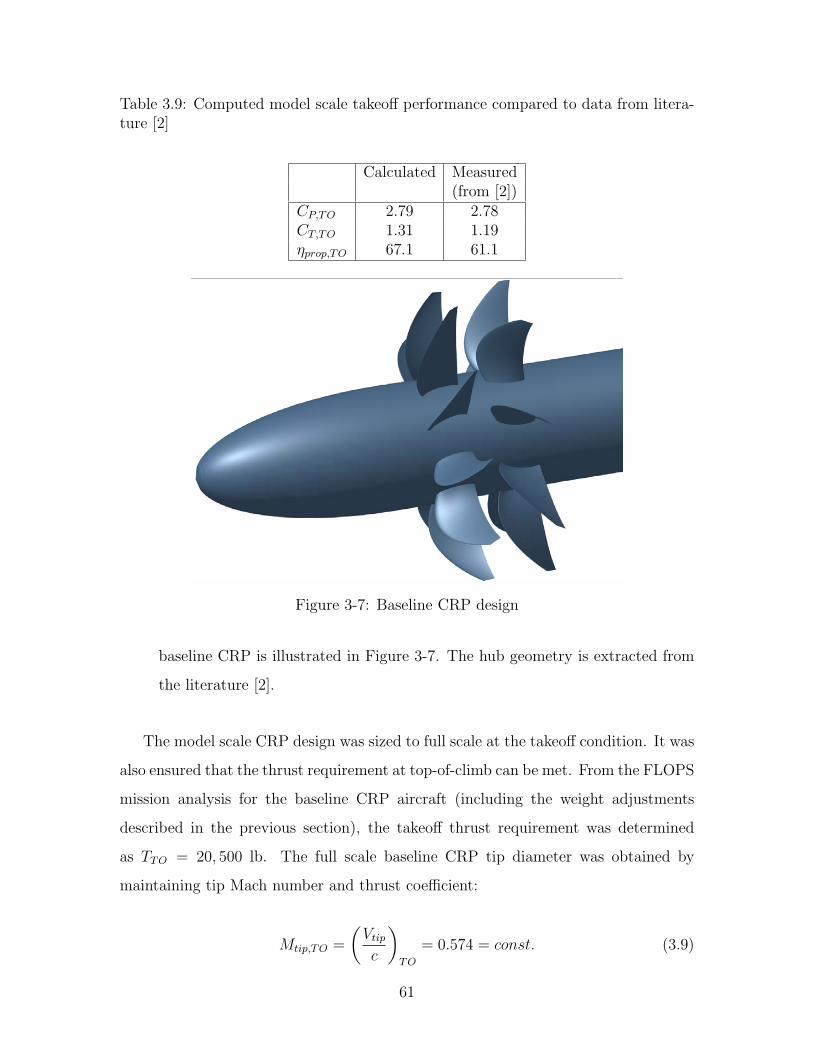
Table 3.9: Computed model scale takeoff performance compared to data from litera-ture [2]
Calculated Measured(from [2])
CP,TO 2.79 2.78CT,TO 1.31 1.19ηprop,TO 67.1 61.1
1
Figure 3-7: Baseline CRP design
baseline CRP is illustrated in Figure 3-7. The hub geometry is extracted from
the literature [2].
The model scale CRP design was sized to full scale at the takeoff condition. It was
also ensured that the thrust requirement at top-of-climb can be met. From the FLOPS
mission analysis for the baseline CRP aircraft (including the weight adjustments
described in the previous section), the takeoff thrust requirement was determined
as TTO = 20, 500 lb. The full scale baseline CRP tip diameter was obtained by
maintaining tip Mach number and thrust coefficient:
Mtip,TO =
(Vtipc
)TO
= 0.574 = const. (3.9)
61

CT,TO =
(T
ρN2D4
)TO
= 1.31 = const. (3.10)
In Equation 3.9, c denotes the speed of sound. Equations 3.9 and 3.10 were solved
for the rotational speed and rotor diameter while constraining the full scale CRP to
equal tip speeds and diameters as in the model scale design. The resulting full scale
baseline CRP characteristics and operating conditions at takeoff are summarized in
Table 3.10.
Table 3.10: Full scale baseline CRP characteristics and takeoff operating conditiondetails
Model Characteristics Front RearDiameter D (m) 3.81 3.81Blade count B (-) 10 8Hub-to-tip ratio rhub/rtip (-) 0.4 0.4Sweep ϕ (◦) 40 40rotor-rotor axial spacing x/D1 (-) 0.224
Operating Conditions TakeoffMach number M0 (-) 0.26Altitude h (m) Sea levelRotational speed (rpm) 934Advance ratio J (-) 1.43Thrust coefficient CT (-) 1.31
3.2.3 Baseline CRP Engine
The baseline CRP gas turbine cycle is based on the datum turbofan. The low-pressure
turbine drives the propfan rotors through a gearbox a with gear ratio of 8 : 1, similar to
the gearbox featured in the 1989 PW/HS/Allison 578-DX propfan propulsion system
(gear ratio 8.3 : 1) [47].
The selected gear ratio resulted in a high speed low-pressure spool with NLP,CRP =
7, 872 rpm. The datum turbofan low-pressure spool operates at NLP,fan = 3, 800 rpm,
therefore the size of the engine core needed to be reduced for the baseline CRP
configuration.
The full scale CRP power requirement was computed in RVL/RAXAN as PCRP =
62

12.1 MW. The datum turbofan power requirement determined in GasTurb was slightly
higher at Pfan = 13.0 MW. For the CRP engine layout, a two-spool turboshaft engine
with LPC was selected. The required CRP core mass flow was determined from the
low-pressure spool power balance.
Assuming an LPT stage loading of ΨLPT,CRP = 2.0 and adding an additional
stage compared to the turbofan engine core layout to alleviate the relatively high
turbine blade loading, the mean LPT radius for the CRP engine core was re-sized
to rm,LPT,CRP = 0.204 m, a 55 % reduction compared to the datum turbofan LPT
radius. Similarly, the mean LPC radius for the CRP engine was determined assuming
an LPC stage loading of ΨLPC,CRP = 0.3 as rm,LPC,CRP = 0.268 m, a 45 % reduction
relative to the datum turbofan LPC radius.
The high-pressure component design and the engine cycle parameters such as
component efficiencies, pressure ratios, and stagnation temperatures were not changed
compared to the datum turbofan engine core. The CRP engine cycle was closed for
the cruise design point condition using GasTurb. At the cutback and approach off-
design conditions, a reduction of the low-pressure spool speed was required to match
the reduced CRP shaft power requirements.
To summarize, based on the airframe of the datum turbofan powered aircraft, a
baseline CRP aircraft in aft fuselage pylon mounted pusher configuration was devel-
oped. The new aircraft arrangement includes modifications to the baseline airframe
due to the integration of the CRP engines. The CRP rotors were designed based on
model data given in the literature and the CRP engine core was re-sized based on the
datum turbofan core characteristics.
63

64

Chapter 4
CRP Noise Estimation
Methodology
In order to assess the acoustic performance of CRP powered aircraft arrangements, a
CRP noise estimation method is developed in this chapter. The method is integrated
in the noise module of the overall performance assessment framework shown in Figure
2-1.
The main focus of this work is on the estimation of CRP interaction tone noise.
In order to accurately determine CRP interaction noise, the aerodynamic interfer-
ence between the CRP rotors needs to be determined using a high-fidelity approach
because inaccuracies in capturing the underlying source mechanisms directly influ-
ence the fidelity of the computed noise levels. The underlying mechanisms, which are
hypothesized to be responsible for CRP interaction noise, are outlined first.
A frequency domain approach is chosen based on Hanson’s single rotor noise
method. The approach allows the quantitative dissection of the CRP noise mech-
anisms and the implementation of advanced source mitigation concepts. 3-D un-
steady RANS computations are demonstrated to successfully capture the underlying
mechanisms and determine the time-varying blade surface pressures necessary for the
definition of the acoustic source terms. The CRP noise estimation approach and the
derivation of the working equations are presented in the second and third parts of
this Chapter, respectively.
65

Finally, the established CRP noise method is executed for the model scale baseline
CRP defined in the previous chapter. The computed noise results are compared to
acoustic measurement data available for the baseline CRP configurations. The exact
blade profile details of the baseline CRP differ from the model CRP used in the
experiments. However, the geometric details are not thought to significantly influence
the noise generation and the comparison between computed and measured noise shows
good agreement, thereby validating the developed CRP noise estimation method.
4.1 Interaction Tone Noise Source Mechanisms
It is assumed here, that the aerodynamic mechanisms producing CRP interaction
noise can be attributed to the following effects:
1. Pressure fields due to rear-rotor upstream influence interacting with the front
rotor.
2. Tip-vortices shed from the front rotor affecting the rear-rotor blade loading.
3. Front-rotor wakes interfering with the rear rotor.
4. Front-rotor hub wakes and hub boundary layer influencing the rear-rotor hub
loading.
Each of the above mechanisms introduces unsteadiness in the rotor blade loading
which in turn affects CRP interaction noise. To illustrate the aerodynamic features
responsible for the CRP noise mechanisms, results from a full-wheel 3-D RANS cal-
culation for the baseline CRP configuration at the takeoff condition (M = 0.25) are
briefly outlined first. The takeoff operating point is simulated because it is the con-
dition relevant for FAR 36 noise measurements. A detailed discussion of the noise
assessment at the FAR 36 certification locations is found in Chapter 6.
The rear-rotor potential field directly influences the front-rotor loading. The flow
field around the CRP blades for a radial cut at mid-span is shown in Figure 4-1. The
66
Mondy
Rectangle

Figure 4-1: Baseline CRP density distribution at mid-span
baseline CRP is operated at equal tip speeds such that a front-rotor blade interacts
2B2 = 16 times with the potential field of a rear-rotor blade during one revolution.
The second noise source mechanism investigated is the interaction of the front-
rotor tip-vortices, represented as low density regions in Figure 4-2. The vortex system
is shown in Figure 4-3 highlighting the helical motion and convection of the tip-
vortices through the interface between the front- and rear-rotor reference frames and
interacting with the rear rotor.
The interaction of the front-rotor wakes and the hub wake and endwall boundary
layer with the rear rotor represent the third and fourth noise source mechanisms,
respectively. The viscous wakes are depicted in Figure 4-4 near the hub at 10 %
span. Similar to the tip-vortex noise source mechanism, a rear-rotor blade interferes
2B1 = 20 times with the front-rotor tip-vortices and viscous wakes during one rotor
revolution. The thin secondary wake preceding the blade wake observed in Figure
4-4 is due the flow separation and reattachment on the blade suction surface near the
leading edge of the highly-cambered hub profile.
In order to accurately estimate CRP interaction noise, a careful numerical study
is required to ensure that all of the above aerodynamic source mechanisms are ade-
67

Figure 4-2: Baseline CRP density distribution at x/D1 = 0.12
Figure 4-3: Baseline CRP blade-tip vortex system: front-rotor tip-vortices interactwith rear rotor
68
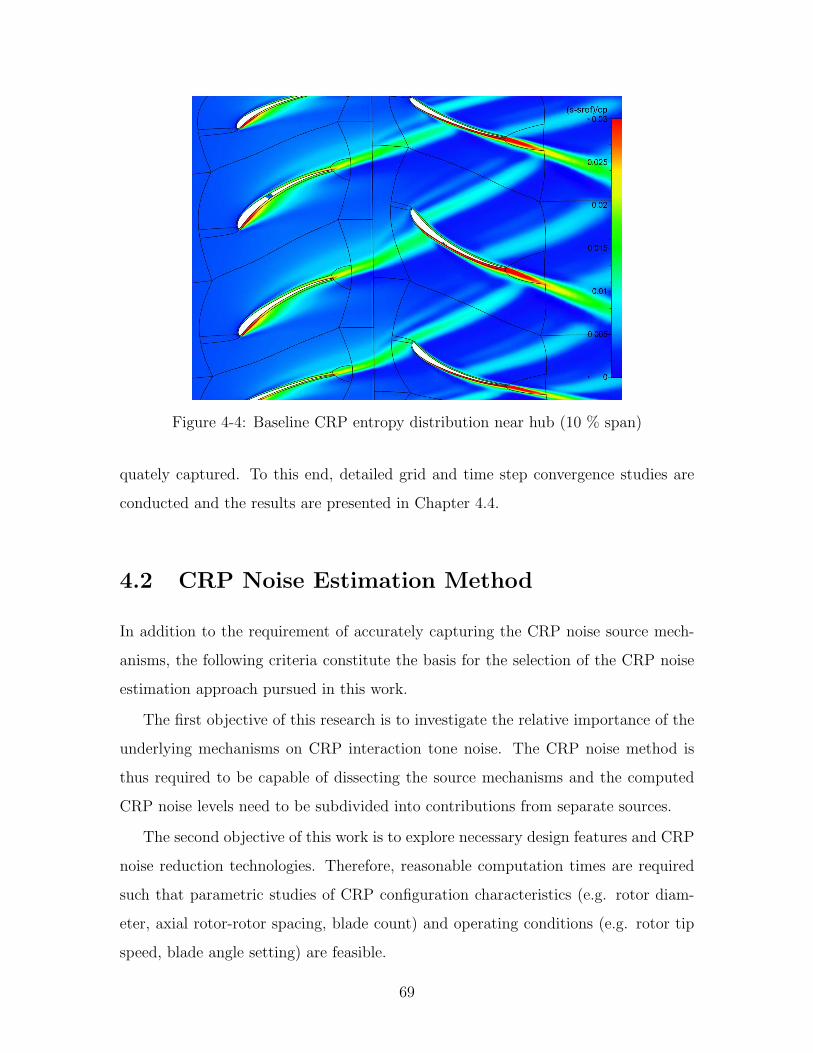
Figure 4-4: Baseline CRP entropy distribution near hub (10 % span)
quately captured. To this end, detailed grid and time step convergence studies are
conducted and the results are presented in Chapter 4.4.
4.2 CRP Noise Estimation Method
In addition to the requirement of accurately capturing the CRP noise source mech-
anisms, the following criteria constitute the basis for the selection of the CRP noise
estimation approach pursued in this work.
The first objective of this research is to investigate the relative importance of the
underlying mechanisms on CRP interaction tone noise. The CRP noise method is
thus required to be capable of dissecting the source mechanisms and the computed
CRP noise levels need to be subdivided into contributions from separate sources.
The second objective of this work is to explore necessary design features and CRP
noise reduction technologies. Therefore, reasonable computation times are required
such that parametric studies of CRP configuration characteristics (e.g. rotor diam-
eter, axial rotor-rotor spacing, blade count) and operating conditions (e.g. rotor tip
speed, blade angle setting) are feasible.
69

The third objective is to quantify CRP noise and noise variations between different
CRP configurations on a consistent aircraft mission basis. To this end, CRP noise
computations at the FAR 36 observer locations are needed which requires noise results
along the aircraft takeoff and approach trajectories. Thus, the CRP noise method
needs to be capable of dealing with varying observer positions and flight and operating
conditions at low computation times.
Finally, in order to compute CRP noise on the CRP engine/aircraft system level,
the noise method needs to be capable of accounting for non-uniform inflow due to
non-zero angle-of-attack and/or the presence of an upstream pylon.
4.2.1 Outline of Approach
Propfan noise estimation methods developed in the past include approaches in the
time [48] and frequency domain [6]. Recent advances in computational aerodynamics
and aeroacoustics have led to hybrid methods based on coupling CFD and CAA [10]
[11] [12]. However, in general, CAA approaches are expensive in computational time
and memory requirements due to the high grid densities needed to adequately resolve
the acoustic pressure disturbances. Therefore, CAA methods are generally not yet
viable for parametric studies in the propfan design phase.
In the light of the requirements for the CRP noise method described above and
the high computational costs of CAA methods, a frequency domain approach for
CRP noise was pursued in the present work based on extending Hanson’s single
rotor noise method [6] to counter-rotating configurations. The foundation of this
approach is Goldstein’s formulation of the acoustic analogy for moving media [49].
The acoustic interference between the rotors is captured as long as the aerodynamic
interaction is captured accurately. One of the main advantages of this approach is
the low computation time requirement allowing the method to be used for detailed
parametric studies.
Compliant with the specifications above, the method can be used to dissect and
quantify the effects of the different mechanisms responsible for CRP interaction noise
and is capable of dealing with CRP noise reduction technologies. In addition, non-
70

uniform inflow effects due to angle-of-attack or an upstream pylon can be accounted
for.
The theory requires the a priori determination of the unsteady blade surface pres-
sures to compute the acoustic source terms. A high-fidelity full-wheel 3-D RANS
approach capable of accurately capturing the noise source mechanisms is therefore
developed and used to generate the required surface pressure data.
4.3 Development Method
The CRP noise estimation method developed in this chapter is based on Goldstein’s
formulation of the acoustic analogy [49] and Hanson’s frequency domain method for
single rotor noise [6].
Thickness and loading noise sources are implemented in the CRP noise estimation
method. For thin blades, significant quadrupole noise radiation is a strictly transonic
phenomenon as for example reported by Hanson et al. [50]. The CRP blade designs
investigated in this work are highly swept and relative tip Mach numbers are below the
critical value of 0.85 at the low speed conditions considered here for noise assessment.
Therefore, quadrupole sources are currently not accounted for but can be included in
the methodology for future cruise noise calculations.
A brief description of the equations governing single-rotating propfan noise is
presented first. The derivation of the working equations is given next. Finally, the
modifications required to extend the SRP noise equations to CRP configurations are
discussed in detail.
4.3.1 Governing Equations for Single Rotor Noise
The Ffowcs-Williams and Hawkings acoustic analogy formulation generalized for a
moving medium can be written as
p′ (x, t) = −∫ T
−T
∫A(τ)
ρ0VNDG
DτdA (y) dτ +
∫ T
−T
∫A(τ)
Fi∂G
∂τdA (y) dτ, (4.1)
71
Mondy
Highlight
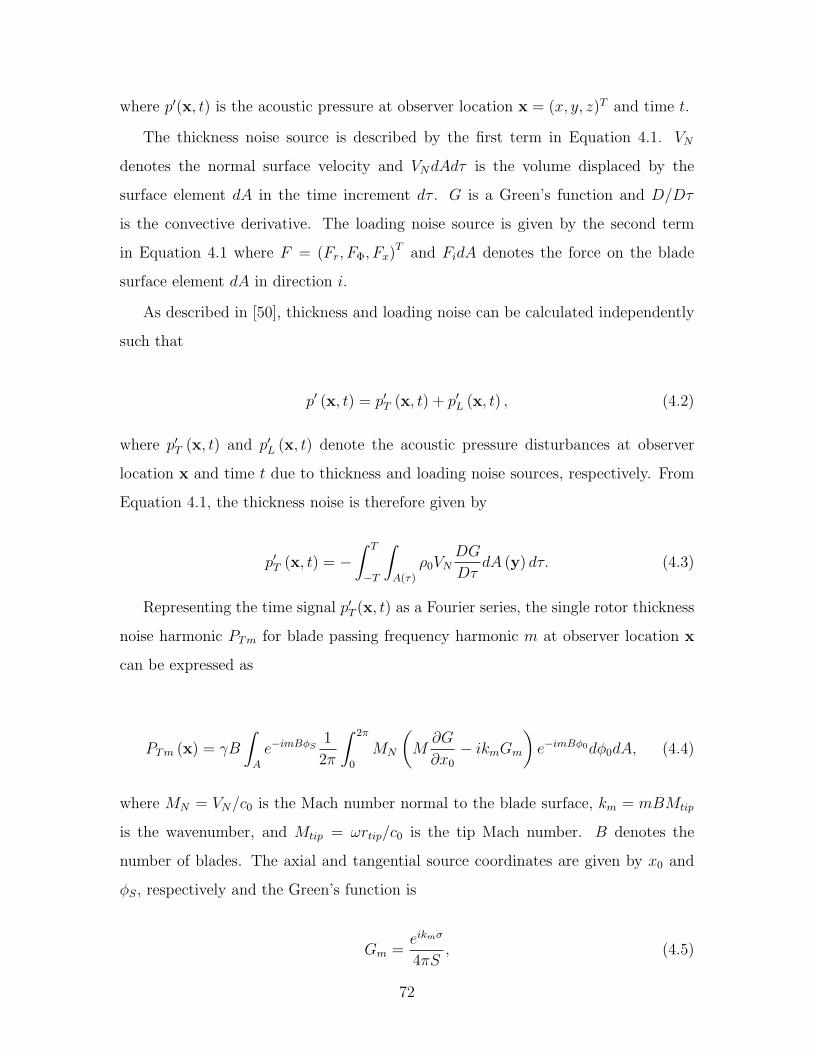
where p′(x, t) is the acoustic pressure at observer location x = (x, y, z)T and time t.
The thickness noise source is described by the first term in Equation 4.1. VN
denotes the normal surface velocity and VNdAdτ is the volume displaced by the
surface element dA in the time increment dτ . G is a Green’s function and D/Dτ
is the convective derivative. The loading noise source is given by the second term
in Equation 4.1 where F = (Fr, FΦ, Fx)T and FidA denotes the force on the blade
surface element dA in direction i.
As described in [50], thickness and loading noise can be calculated independently
such that
p′ (x, t) = p′T (x, t) + p′L (x, t) , (4.2)
where p′T (x, t) and p′L (x, t) denote the acoustic pressure disturbances at observer
location x and time t due to thickness and loading noise sources, respectively. From
Equation 4.1, the thickness noise is therefore given by
p′T (x, t) = −∫ T
−T
∫A(τ)
ρ0VNDG
DτdA (y) dτ. (4.3)
Representing the time signal p′T (x, t) as a Fourier series, the single rotor thickness
noise harmonic PTm for blade passing frequency harmonic m at observer location x
can be expressed as
PTm (x) = γB
∫A
e−imBφS1
2π
∫ 2π
0
MN
(M∂G
∂x0
− ikmGm
)e−imBφ0dφ0dA, (4.4)
where MN = VN/c0 is the Mach number normal to the blade surface, km = mBMtip
is the wavenumber, and Mtip = ωrtip/c0 is the tip Mach number. B denotes the
number of blades. The axial and tangential source coordinates are given by x0 and
φS, respectively and the Green’s function is
Gm =eikmσ
4πS, (4.5)
72

with the phase radius σ given by
σ =M (x− x0) + S
1−M2, (4.6)
and the amplitude radius S written as
S =√
(x− x0)2 + (1−M2)((y − y0)2 + (z − z0)2). (4.7)
Analogous to the thickness noise calculation, the single rotor loading noise har-
monic PLm can be written as
PLm (x) = B
∫A
e−imBφS1
2π
∫ 2π
0
Fi (φ0 − φS)∂Gm
∂yie−imBφ0dφ0dA, (4.8)
where the elements of the blade loading FidA are computed using 3-D unsteady RANS
simulations and the Green’s function derivatives are calculated analytically.
Equations 4.4 and 4.8 represent thickness and loading noise harmonics as contin-
uous integrals over the blade surface area. To calculate the noise harmonics, blade
geometry and surface pressure data are required from a CFD simulation and are thus
provided in 3-D grid format. Practical applications of equations 4.4 and 4.8 there-
fore involve dividing the blade surface area into discrete elements in the radial and
chordwise directions.
The radial and chordwise indices are denoted here by µ and ν, respectively. The
discretization of the area integrals is therefore represented by∫AdA →
∑µ,ν . The
fundamental thickness noise source element is MNdA. In discrete form, this thickness
source element is defined as
Vµ,ν = (MN∆A)µ,ν . (4.9)
The discretized form of the thickness noise harmonic can now be written as
PTm (x) = γB∑µ,ν
e−imBφS1
2π
∫ 2π
0
Vµ,ν
(M∂G
∂x0
− ikmGm
)e−imBφ0dφ0. (4.10)
73

Similarly, the fundamental loading source element in Equation 4.8 is FidA. The
discretized form of FidA is defined as
Fi,µ,ν = (Fi∆A)µ,ν . (4.11)
The discretized form of the loading noise harmonic can thus be represented as
PLm (x) = B∑µ,ν
e−imBφS1
2π
∫ 2π
0
Fi,µ,ν (φ0 − φS)∂Gm
∂yie−imBφ0dφ0. (4.12)
The formulations in Equations 4.10 and 4.12 are the working forms for SRP noise
estimation that were coded in Matlab along with the thickness and loading source
term calculations from the CFD data. This version of the noise code did not include
any modifications to Hanson’s theory. The code was verified using a test case of
a 6-bladed SRP 13 ft in diameter at cruise which is provided by Hanson [6]. The
working equations 4.10 and 4.12 are the basis from which the theory is extended for
CRP configurations. The necessary modifications are described next.
4.3.2 Extension to Counter-Rotating Configurations
As outlined in Section 1.1, it is assumed in this work that the mechanisms responsible
for CRP interaction noise can be categorized into rear-rotor upstream influence in-
teracting with the front rotor, front-rotor tip-vortices affecting the rear-rotor loading,
front-rotor viscous wakes interfering with the rear rotor, and front-rotor hub wake
and hub boundary layer influencing the rear-rotor hub loading. The unsteady inter-
action of the two rotors due to wake, tip-vortex and potential field effects is captured
in the aerodynamic calculations and reflected in the unsteady characteristics of the
blade surface pressures. Therefore, since the acoustic analogy requires the coupled
aerodynamic data, the acoustic interaction is inherently accounted for by carefully
superposing the noise fields from the two rotors as proposed by Hanson [9].
Thickness noise is produced at multiples of the blade passing frequency only such
74
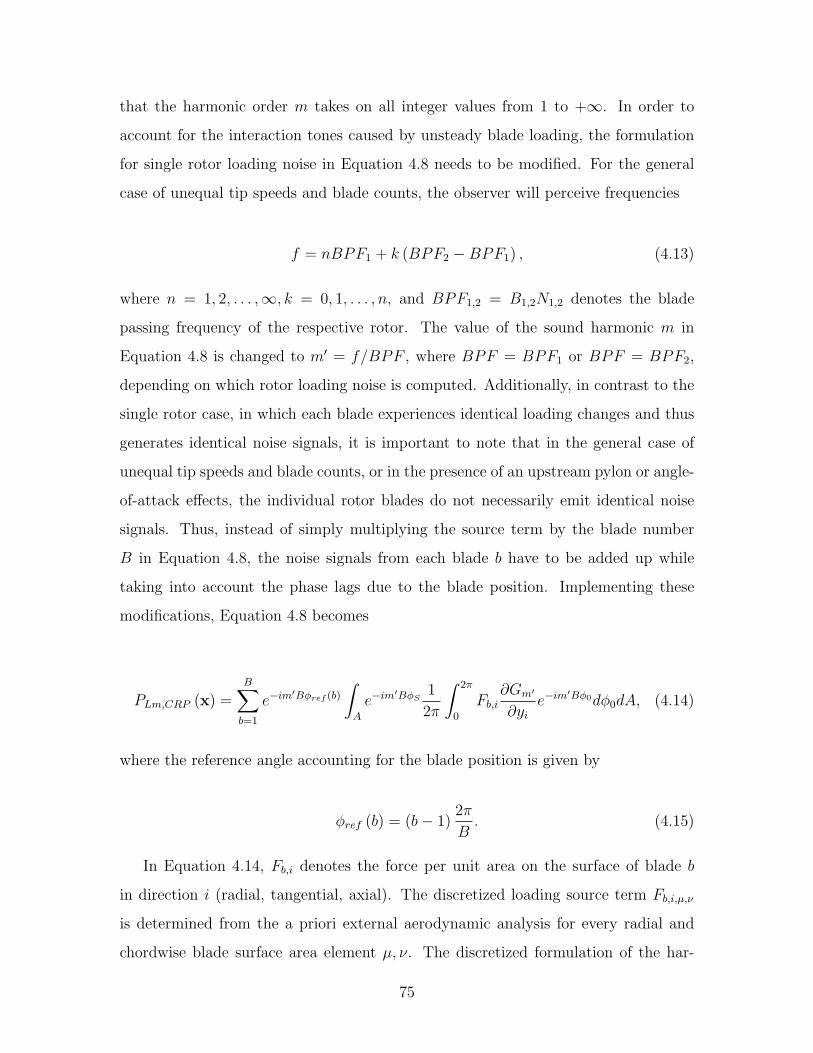
that the harmonic order m takes on all integer values from 1 to +∞. In order to
account for the interaction tones caused by unsteady blade loading, the formulation
for single rotor loading noise in Equation 4.8 needs to be modified. For the general
case of unequal tip speeds and blade counts, the observer will perceive frequencies
f = nBPF1 + k (BPF2 −BPF1) , (4.13)
where n = 1, 2, . . . ,∞, k = 0, 1, . . . , n, and BPF1,2 = B1,2N1,2 denotes the blade
passing frequency of the respective rotor. The value of the sound harmonic m in
Equation 4.8 is changed to m′ = f/BPF , where BPF = BPF1 or BPF = BPF2,
depending on which rotor loading noise is computed. Additionally, in contrast to the
single rotor case, in which each blade experiences identical loading changes and thus
generates identical noise signals, it is important to note that in the general case of
unequal tip speeds and blade counts, or in the presence of an upstream pylon or angle-
of-attack effects, the individual rotor blades do not necessarily emit identical noise
signals. Thus, instead of simply multiplying the source term by the blade number
B in Equation 4.8, the noise signals from each blade b have to be added up while
taking into account the phase lags due to the blade position. Implementing these
modifications, Equation 4.8 becomes
PLm,CRP (x) =B∑b=1
e−im′Bφref (b)
∫A
e−im′BφS
1
2π
∫ 2π
0
Fb,i∂Gm′
∂yie−im
′Bφ0dφ0dA, (4.14)
where the reference angle accounting for the blade position is given by
φref (b) = (b− 1)2π
B. (4.15)
In Equation 4.14, Fb,i denotes the force per unit area on the surface of blade b
in direction i (radial, tangential, axial). The discretized loading source term Fb,i,µ,ν
is determined from the a priori external aerodynamic analysis for every radial and
chordwise blade surface area element µ, ν. The discretized formulation of the har-
75

Blade geometry Pre-processing
3-D CFD
Thickness source components
Loading source components Fi
Propfan configuration and flight condition
Observer coordinates
Post-processing
Full CRP narrowband spectra, directivity, pressure signals
Unsteady loading due to aerodynamic interaction
Rotor 1 Rotor 2
Harmonic pressure coefficientsPm,1 = PmT,1 + PmL,1Pm,2 = PmT,2 + PmL,2
CRP thickness and loading noise radiation equations
Noise field superposition Rotor 1 + Rotor 2
Propfan configuration and flight condition
Figure 4-5: CRP noise estimation methodology
monic loading noise estimation for counter-rotating propfans becomes
PLm,CRP (x) =B∑b=1
e−im′Bφref (b)
∑µ,ν
e−im′BφS
1
2π
∫ 2π
0
Fb,i,µ,ν∂Gm′
∂yie−im
′Bφ0dφ0. (4.16)
To summarize, a conceptual outline of the established CRP noise estimation
method is depicted in Figure 4-5. Required inputs are the blade geometries of the two
rotors, the CRP configuration details (such as for example rotor-rotor axial spacing),
the operating conditions, and the observer coordinates relative to the CRP. Using
the unsteady blade loading data calculated externally (for example 3-D CFD), the
thickness and loading source components are computed. In order to obtain the full
CRP noise spectrum, the working formulations for thickness and loading noise in
Equations 4.10 and 4.16 are evaluated separately for each rotor. The noise fields are
then superposed to determine the CRP narrowband spectrum or acoustic pressure
signals.
76

The working formulation for the CRP harmonic loading noise was implemented
in Matlab to extend the SRP noise code based on Hanson’s theory to CRP configu-
rations. The resulting CRP noise method is modular such that thickness and loading
noise results can easily be separated to assess the relative importance of monopole and
dipole sources. In addition, the approach derived above allows to compute the source
terms in predefined radial or chordwise ranges. For example, in order to quantify the
CRP interaction noise impact of front-rotor tip-vortices interfering with the rear-rotor
blade tips, the loading noise can be computed by integrating over the dipole sources
in a limited radial range near the rear-rotor tip region only. This approach is pursued
in dissecting the CRP noise mechanisms and the results are discussed in Chapter 5.
A user manual providing detailed explanations of the Matlab code developed for the
CRP noise estimation is given in Appendix B.
4.4 Aerodynamic Analysis
In order to capture the aerodynamic interaction between the two rotors and to ob-
tain the time varying blade pressures, a high-fidelity approach involving 3-D RANS
simulations in Numeca FINE/Turbo was developed.
As the acoustic equations derived above are exact, the level of accuracy of the com-
puted noise results is governed by the fidelity of the aerodynamic analysis providing
the unsteady blade loading. It is therefore important to ensure that the mechanisms
responsible for CRP noise are accurately captured and resolved in the aerodynamic
computations.
The meshing strategy and challenges encountered in the grid generation are de-
scribed first. Next, the computational setup is outlined including the discussion of
steady results used to initialize the unsteady computations. In the case of the un-
steady calculations, careful grid and time step sensitivity studies were carried out and
in the final part of this section a set of general guidelines for the numerical setup is
given.
The blade surface pressure data obtained from the CFD calculations is Fourier
77

transformed to determine the loading harmonics required as inputs to the CRP noise
estimation method. In the absence of angular inflow or upstream pylon effects, the
rear-rotor upstream influence causes the loading on the front rotor to vary at frequen-
cies
fload,1 = kBPF1
(1 +
N2
N1
), (4.17)
where the loading harmonic k = 0, 1, 2, . . . ,∞. Similarly, the front-rotor viscous
wakes and tip-vortices lead to rear-rotor unsteady loading effects at frequencies
fload,2 = kBPF2
(1 +
N1
N2
). (4.18)
With the above, the loading waveform is reconstructed as part of the pre-processing
in the CRP noise method to determine the loading source components Fb,i in the CRP
loading noise calculation described in Equation 4.14.
4.4.1 CFD Tool Description
All 3-D RANS simulations were carried out using the commercially available soft-
ware package Numeca FINE/Turbo. FINE/Turbo includes tools for grid generation,
flow solving, and post-processing and is tailored originally tailored for internal flow
turbomachinery applications. During the course of this work, a meshing strategy for
open rotor designs including counter-rotating configurations was developed based on
FINE/Turbo’s approach for internal flow simulations.
The grid generation Autogrid and IGG enable the automated generation of CRP
grids. Meshes required for parametric studies including variations in blade count,
blade angle setting, or rotor-rotor axial spacing can be generated with little user
input. The flow solver Euranus is controlled in the graphical user interace FINE.
Euranus supports parallel computation on multiple processors and takes advantage
of the multigrid technique. Multiple sweeps between a fine mesh and coarsened grid
levels are performed within each iteration to reduce low frequency errors on coarse
grid levels and to accelerate convergence [51]. The flow solutions are processed in the
78

post-processing tool, CFView, using a graphical user interface or automated Python
scripts, or in the external post-processing tool Tecplot 360. A more detailed descrip-
tion of FINE/Turbo can be found in [26].
To the author’s knowledge, FINE/Turbo was applied to CRP configurations for
the first time during this research project which led to several challenges in the grid
generation and computational setup. Different grid topologies were investigated to
evaluate the resolution of the underlying CRP flow features. The two main grid
strategies are discussed next.
4.4.2 CRP Grid Generation
Multi-block structured hexahedral grids were used for the CRPs analyzed in this
work. To accurately resolve the front-rotor viscous wakes and tip-vortices, the meshes
between the two rotors and around the blade tips were generated with particular care.
Two meshing strategies were investigated. The first topology, denoted in the
following as grid 1, is depicted in Figure 4-6. The overall mesh consists of three
regions. The flow in the inlet and rotor 1 domains (regions I and II) is computed in the
front-rotor frame of reference. The flow in the rotor 2 domain (region III) is computed
in the rear-rotor reference frame. In radial direction, the overall domain is subdivided
into three layers: (1) the rotor passage including the grid around the rotor blades,
(2) the far field region with reduced grid density, and (3) a sub-domain connecting
the rotor passage and far field regions which are of distinct topologies. Non-matching
patch boundaries were applied at the radial sub-domains. These boundaries require
interpolation routines which are defined prior to a simulation.
As described in Section 4.4.5, it was found that non-matching boundaries can lead
to discontinuous flow solutions resulting in inadequate tip-vortex resolution. In the
light of these findings, the mesh was improved by extending the blade grid topology
all the way to the far field boundary to assure a continuous grid structure and to
eliminate all non-matching block patches at the interface between the rotor passage
and far field sub-domains. The topology of the improved grid, denoted in the following
as grid 2, is presented in Figure 4-7.
79
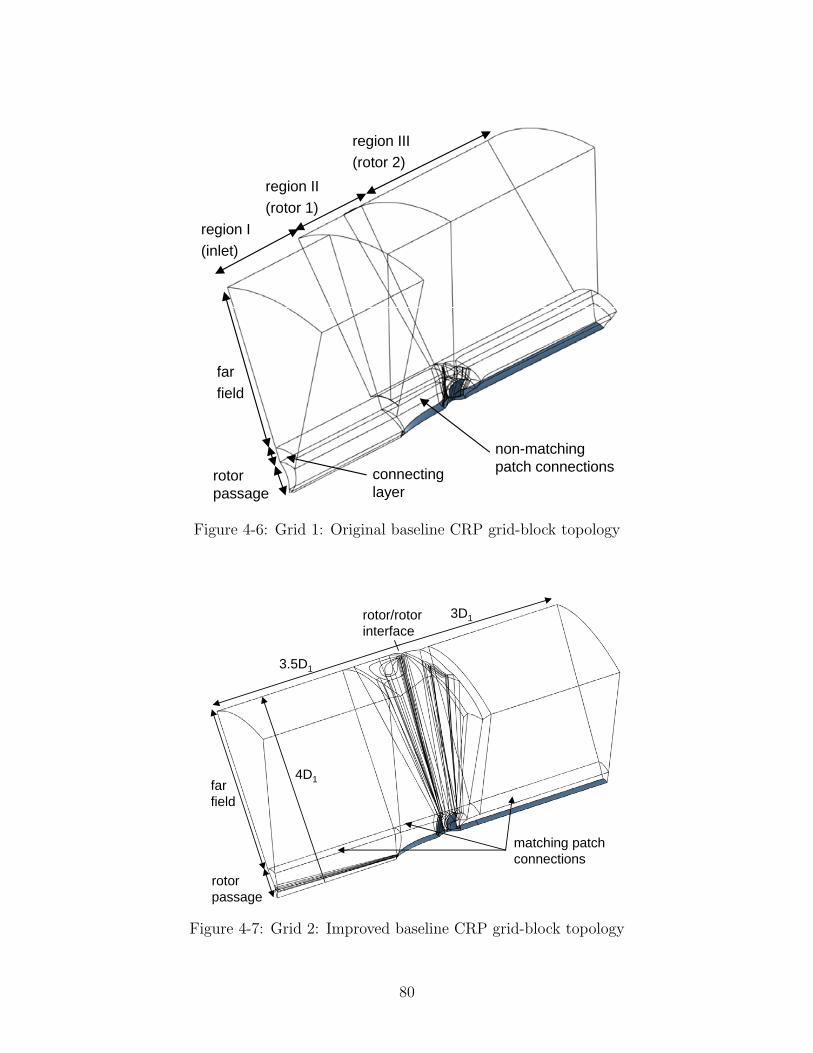
1
region I(inlet)
region II(rotor 1)
region III(rotor 2)
far field
rotorpassage
connectinglayer
non-matching patch connections
Figure 4-6: Grid 1: Original baseline CRP grid-block topology
matching patch connections
rotor passage
far field
4D1
3.5D1
3D1rotor/rotor interface
Figure 4-7: Grid 2: Improved baseline CRP grid-block topology
80

x/D1 = 0.224
front rotor stacking line
rear rotor stacking line
rotor-rotor interface
Figure 4-8: Grid 2: Close-up of rotor meshes at mid-span
At the interface between the two rotor relative frames, the radial node distribution
is continuous for both grid 1 and grid 2. The governing equations are solved in
the relative frame leading to high relative Mach numbers near the far field radial
boundary. This in turn can induce excessive artificial dissipation leading to non-
physical rotational flow in the far field regions. To avoid this, the far field radial
boundary was located at 4D1, far enough from the CRP domain to avoid interference
with the capture streamtubes.
The rotor meshes at mid-span are shown for the improved grid topology in Figure
4-8. The characteristics of grids 1 and 2 are summarized in Table 4.1. Based on the
grid 2 topology, all of the unsteady simulations used to obtain the time-dependent
blade loading for the CRP noise calculations were carried out in full-wheel configura-
tion featuring 16.5 million cells for the baseline CRP.
4.4.3 Computational Procedure
The first step towards determining the time-dependent pressure data involves setting
up and carrying out steady computations in order to initialize the unsteady simula-
tions and obtain aerodynamic performance results. The second step is to compute
81

Table 4.1: Characteristics of meshes used in grid convergence study
Grid 1 Grid 2
Topology (see Figures 4-6 and 4-7) original topology improved topologyGrid structure in patches
non matching continuousbetween radial sub-domains
Radial grid points34 71
per rotor passageGrid points in pitchwise direction
90 85across passage
Grid points on blade suction121 121
and pressure surfaceFull-wheel cell count 10.5 million 16.5 million
the surface pressures using full-wheel unsteady simulations.
Steady single-passage RANS simulations solving the viscous Reynolds Averaged
Navier-Stokes equations were performed first to determine grid convergence based on
stagnation pressure and blade surface pressure results.
The governing equations include an apparent stress term due to the fluctuating ve-
locity field, generally referred to as Reynolds stress. The Spalart-Allmaras turbulence
model was applied in all simulations to approximate the Reynolds stress terms.
In the case of the steady simulations used to initialize the unsteady computations,
a full non matching mixing plane was defined to transmit information at the interface
between the front- and rear-rotor reference frames. The mixing plane formulation is
a standard approach utilized in the computational analysis of turbomachinery appli-
cations. The details of the mixing plane approach are described in [26].
External boundary conditions were defined at the far field boundaries for all sim-
ulations. This type of boundary condition determines whether the flow is locally
entering or leaving the flow domain and is based on the Riemann invariants [26]. The
free stream values of pressure, temperature, velocity vector, and turbulent viscosity
are required inputs at external boundaries.
Low-speed operating conditions are required in the FAR 36 noise assessment.
Therefore, the results presented in the following are for the Mach 0.25 takeoff condi-
tion summarized in Table 3.7. Both the front- and rear-rotor blade angle setting is
82
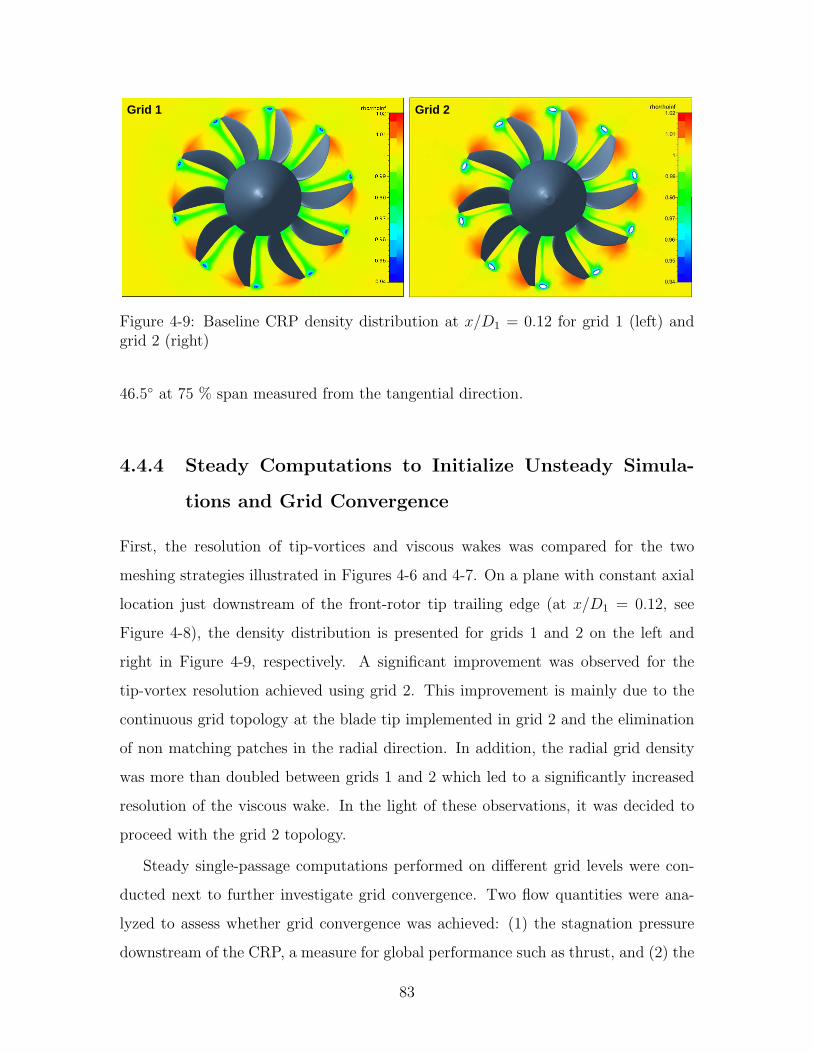
1
Grid 1 Grid 2
Figure 4-9: Baseline CRP density distribution at x/D1 = 0.12 for grid 1 (left) andgrid 2 (right)
46.5◦ at 75 % span measured from the tangential direction.
4.4.4 Steady Computations to Initialize Unsteady Simula-
tions and Grid Convergence
First, the resolution of tip-vortices and viscous wakes was compared for the two
meshing strategies illustrated in Figures 4-6 and 4-7. On a plane with constant axial
location just downstream of the front-rotor tip trailing edge (at x/D1 = 0.12, see
Figure 4-8), the density distribution is presented for grids 1 and 2 on the left and
right in Figure 4-9, respectively. A significant improvement was observed for the
tip-vortex resolution achieved using grid 2. This improvement is mainly due to the
continuous grid topology at the blade tip implemented in grid 2 and the elimination
of non matching patches in the radial direction. In addition, the radial grid density
was more than doubled between grids 1 and 2 which led to a significantly increased
resolution of the viscous wake. In the light of these observations, it was decided to
proceed with the grid 2 topology.
Steady single-passage computations performed on different grid levels were con-
ducted next to further investigate grid convergence. Two flow quantities were ana-
lyzed to assess whether grid convergence was achieved: (1) the stagnation pressure
downstream of the CRP, a measure for global performance such as thrust, and (2) the
83

static pressure on the blade surfaces as the determination of the surface pressure is
ultimately the main objective of the aerodynamic analyses conducted in this research.
The grid depicted in Figures 4-7 and 4-8 corresponds here to a medium density
mesh. Based in this mesh, a fine grid was obtained using FINE/Turbo’s multigrid
approach by doubling the cell count in every spatial direction. The single-passage
medium grid featured 1.25 million cells. Consequently, the fine mesh consisted of 10
million grid cells.
Mass-averaged stagnation pressure results are presented in Figure 4-10 for both
the medium and fine grids. The radial distribution of the stagnation pressure ratio
did not change significantly when increasing the mesh density beyond the medium
level. The measured stagnation pressure radial distribution at cruise is given for
reference since measured takeoff data was not available in [2]. It should be noted
that the details of the experimental CRP geometric design may be different from the
baseline CRP design used in the CFD simulations (see Section 3.2.2). However, the
level of the maximum stagnation pressure rise is similar as expected. For the takeoff
condition there is an inward shift of the location of the maximum stagnation pressure
ratio due to increased streamtube contraction compared to the cruise condition.
The front-rotor surface pressure distribution is illustrated for the medium and fine
grid levels in Figure 4-11. The surface pressure coefficient cp at two radial locations is
depicted in Figure 4-12 (x/c denotes the axial distance from leading to trailing edge
normalized by the blade chord c). Additional front- and rear-rotor radial stations
were investigated as well. It was observed that there is no significant change in the
surface pressure distribution when the mesh density is increased beyond the medium
grid level. Based on the stagnation and surface pressure results presented above, it
was determined that adequate flow resolution is achieved using the medium grid.
4.4.5 Unsteady Computations
Using the grid 2 topology, full-wheel unsteady simulations were carried out to study
the flow mechanisms responsible for CRP interaction noise and to determine the
time-varying blade pressures. Different computational setups were investigated and
84
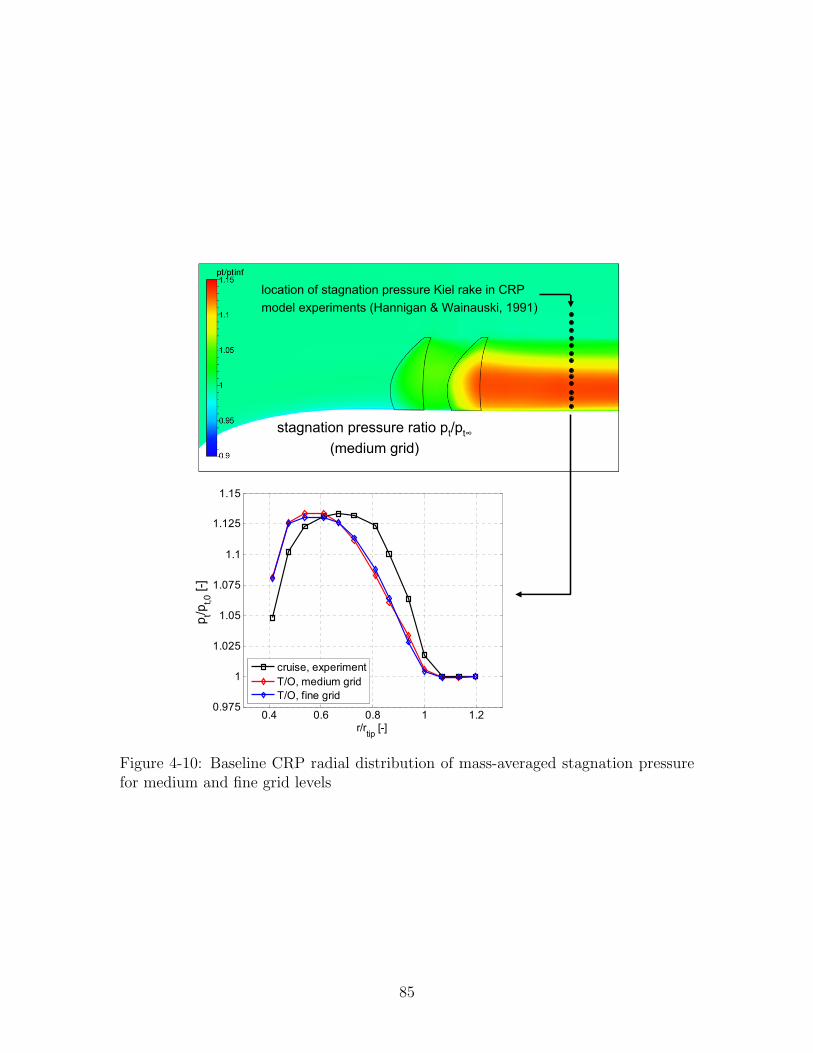
10.4 0.6 0.8 1 1.2
0.975
1
1.025
1.05
1.075
1.1
1.125
1.15
r/rtip [-]
p t/pt,0
[-]
cruise, experimentT/O, medium gridT/O, fine grid
location of stagnation pressure Kiel rake in CRPmodel experiments (Hannigan & Wainauski, 1991)
stagnation pressure ratio pt/pt∞
(medium grid)
Figure 4-10: Baseline CRP radial distribution of mass-averaged stagnation pressurefor medium and fine grid levels
85

1
cp cp
0 0.2 0.4 0.6 0.8 1
-15-10
-50
5
10
c p [-]
r/rtip = 0.6 medium grid
r/rtip = 0.6 fine grid
0 0.2 0.4 0.6 0.8 1
-15-10
-50
5
10
x/c [-]
c p [-]
r/rtip = 0.8 medium grid
r/rtip = 0.8 fine grid
Figure 4-11: Surface pressure distribution on the baseline CRP front-rotor blades formedium and fine grid levels
0 0.2 0.4 0.6 0.8 1
−15
−10
−5
0
5
10
c p [−]
r/rtip
= 0.6 medium grid
r/rtip
= 0.6 fine grid
0 0.2 0.4 0.6 0.8 1
−15
−10
−5
0
5
10
x/c [−]
c p [−]
r/rtip
= 0.8 medium grid
r/rtip
= 0.8 fine grid
Figure 4-12: Front-rotor baseline CRP pressure coefficient at two radial stations formedium and fine grid levels
86
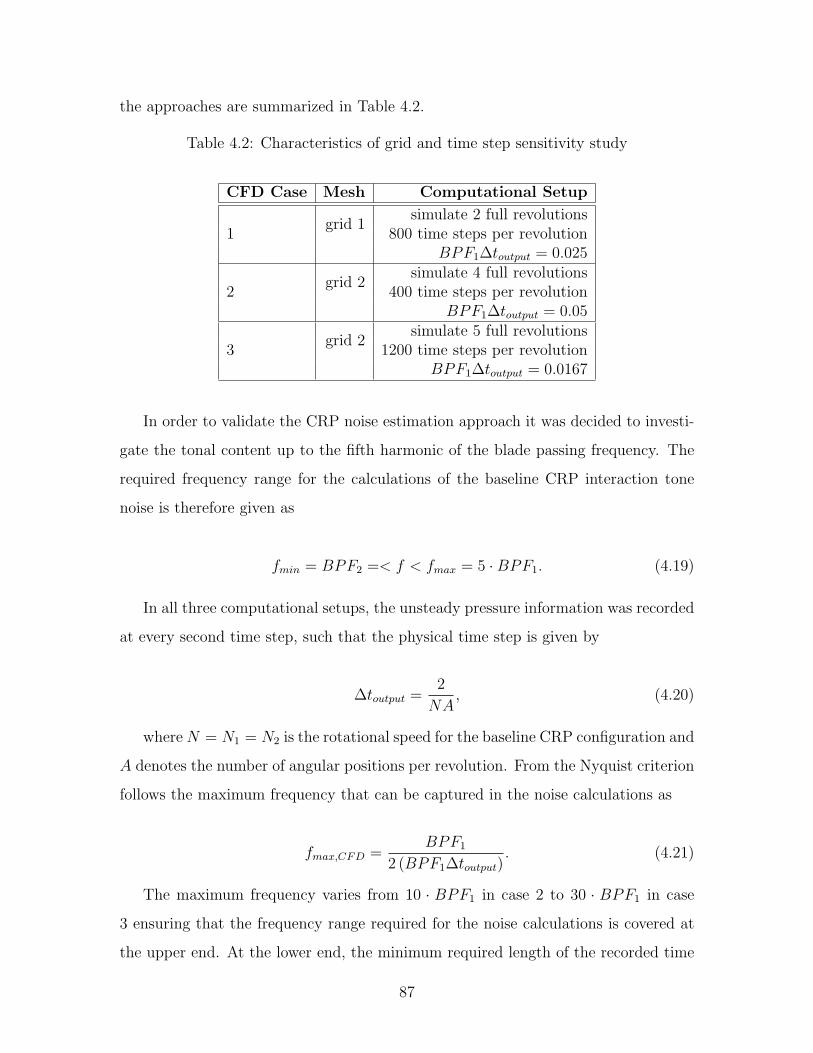
the approaches are summarized in Table 4.2.
Table 4.2: Characteristics of grid and time step sensitivity study
CFD Case Mesh Computational Setup
1grid 1
simulate 2 full revolutions800 time steps per revolution
BPF1∆toutput = 0.025
2grid 2
simulate 4 full revolutions400 time steps per revolution
BPF1∆toutput = 0.05
3grid 2
simulate 5 full revolutions1200 time steps per revolution
BPF1∆toutput = 0.0167
In order to validate the CRP noise estimation approach it was decided to investi-
gate the tonal content up to the fifth harmonic of the blade passing frequency. The
required frequency range for the calculations of the baseline CRP interaction tone
noise is therefore given as
fmin = BPF2 =< f < fmax = 5 ·BPF1. (4.19)
In all three computational setups, the unsteady pressure information was recorded
at every second time step, such that the physical time step is given by
∆toutput =2
NA, (4.20)
where N = N1 = N2 is the rotational speed for the baseline CRP configuration and
A denotes the number of angular positions per revolution. From the Nyquist criterion
follows the maximum frequency that can be captured in the noise calculations as
fmax,CFD =BPF1
2 (BPF1∆toutput). (4.21)
The maximum frequency varies from 10 · BPF1 in case 2 to 30 · BPF1 in case
3 ensuring that the frequency range required for the noise calculations is covered at
the upper end. At the lower end, the minimum required length of the recorded time
87

signal is given by
tmin,CFD =1
fmin=
1
BPF2
=T
8, (4.22)
where T = 1/N denotes the time period. By recording the unsteady blade surface
pressures for one full revolution, it is therefore assured that the lower end of the
frequency range required for the noise estimation is captured as well.
However, it was found that achieving accurate wake and tip-vortex resolution
downstream of the interface between the front-and rear-rotor domains is particularly
challenging. Both the level of mesh density in the sub-domains between the rotors
and the selection of the time step are critical in order to accurately capture wakes and
tip-vortices. The wake transfer across the rotor-rotor interface is shown in Figure 4-13
for the three computational setups tabulated in Table 4.2. The case 1 simulation used
grid 1 including the original meshing strategy with non-matching domain patches in
the radial direction. The case 2 and 3 computations used grid 2, shown in Figure 4-7.
1
Case 1 Case 2 Case 3
Interface between front- and rear-rotor reference frames
Figure 4-13: Baseline CRP entropy distribution near hub (10 % span) for CFD com-putational setup case 1 (left), case 2 (center), and case 3 (right)
Compared to case 1, the wake resolution downstream of the interface is reduced
in case 2. This reduction is attributed to the selection of the time step. Compared
to case 1, the radial grid density is doubled in case 2. However, the non-dimensional
time step BPF1∆t = BPF1 (NA) was reduced from 0.025 to 0.0125. Even though
the mesh density is increased and 4 full revolutions (up from 2 revolutions in case 1)
are simulated, there is increased diffusion of the wake downstream of the interface. In
88

addition, the wake structure is discontinuous at the interface. In the third computa-
tional setup, the non-dimensional time step was further reduced to BPF1∆t = 0.0083
and the results showed significant improvement in the wake resolution compared to
both cases 1 and 2. Similar observations were made at mid-span and close to the
blade tips.
In general, about 50, 000 iterations were required to reach a settled unsteady flow
solution. This usually meant simulating 2 full revolutions. No improvement in the
resolution of wakes and tip-vortices was observed when continuing the simulation at
constant time step beyond 2 revolutions.
The CFD method presented in this chapter can be extended to include non-
uniform inflow due to angle-of-attack effects or the influence of an upstream pylon.
One approach to account for an upstream pylon is to apply a user-defined velocity
profile at the inlet of the domain. A second computationally more expensive approach
is to extend the grid domain to include the pylon surface.
4.4.6 General Guidelines for CFD Approach
The meshing strategy and the results of the grid and time step sensitivity studies
presented above are summarized in the following set of general guidelines for the
numerical setup:
1. The grid generation requires special care in the sub-domains between the front
and rear rotor and near the blade tips such that high front-rotor viscous wake
and tip-vortex resolution is assured. Single-passage steady computations can
be used to investigate the tip-vortex and wake resolution upstream of the rotor-
rotor interface.
2. It is observed that radially extending the mesh topology around the blade up
to the far field boundary significantly improves tip-vortex resolution as discon-
tinuous grid structures near the blade tips are avoided.
3. In the full-wheel unsteady simulations, a high resolution of the wake across the
89

interface between the front- and rear-rotor domains is particularly challenging.
Both grid density and time step significantly affect the wake resolution.
In the pitchwise direction, approximately 90 grid points were found to give
sufficient wake resolution. In the radial direction, 71 grid points were included
in the rotor passage grid. However, the results of the grid sensitivity study
suggest that the wake transfer across the interface is particularly affected the
the radial cell density and the results can be improved by further increasing the
radial grid density, especially near mid-span. The axial mesh density is observed
to play a smaller role in resolving the CRP flow features. Approximately 120
grid cells are sufficient.
The choice of the physical time step and the required length of the recorded
pressure signal is controlled by the frequency range relevant for the noise cal-
culations. In order to capture the unsteadiness at the minimum required fre-
quency, usually the smaller of the two blade passing frequencies, a minimum
signal length of tmin = 1/fmin needs to be recorded. In general, it was found
that choosing a time step of BPF∆t = 0.008 yields the highest wake resolution
across the interface.
4. The far field mesh may be relatively coarse. However, if the mesh density is
not sufficient, high relative Mach numbers near the far field radial boundary
can induce excessive artificial dissipation leading to non-physical flow phenom-
ena in the far field regions. This can only be avoided by increasing the cell
count. Implementing far-field stationary sub-domains requiring a sliding inter-
face between the rotating rotor passage and the far field regions is not possible
in FINE/Turbo.
In axial and pitchwise direction, the far field mesh is constrained by the rotor
passage topology. Defining the far field outer boundary at 4D1, 60 radial grid
points were found to sufficiently prevent artificial dissipation. The location of
the far field boundary itself is controlled by the streamtube capture area at the
inlet to the domain. At the M = 0.25 takeoff condition, the steady simulations
90

suggest a streamtube capture area diameter of 1.2Dtip at the domain inlet.
However, at lower speeds, the capture area will significantly increase and the
far field boundary needs to be adjusted accordingly.
5. Simulating multiple revolutions at constant temporal resolution does not im-
prove the flow resolution. In general, completing two full revolutions was re-
quired to reach a settled unsteady flow solution. In addition, recording the
unsteady surface pressures for one full revolution is sufficient to capture the
minimum frequency to be captured in the noise calculations, which is the lower
of the first blade passing frequency harmonic of the two rotors. However, for full-
scale configurations with significantly lower blade passing frequencies, it should
be noted that multiple revolutions may be required to capture the interaction
tones with low frequency content.
4.5 CRP Noise Method Validation
In order to validate the CRP noise estimation method, acoustic measurements for
a CRP similar to a scale-model version of the baseline CRP were available. The
operating conditions and overall geometry such as hub-to-tip ratio, rotor-rotor axial
spacing, and sweep were identical. However, it is important to note that the details
of the blade geometry (camber, thickness, or stacking line distribution) were not
available from the literature and were not necessarily the same. In addition, the
measurements included a pylon upstream of the CRP whereas uniform inflow was
assumed in the computed baseline CRP noise results.
For axial microphone positions with polar angles θ = 85◦ and θ = 113◦, the
narrowband spectra are given in Figure 4-14 and 4-15, respectively. In general, the
first six interaction tones at frequencies BPF1 +BPF2, BPF1 + 2 ·BPF2, 2 ·BPF1 +
BPF2, BPF1 + 3 · BPF2, 3 · BPF1 + BPF2, and 2 · BPF1 + 2 · BPF2 are in good
agreement with the measured data marked by the green circles.
The predicted rotor-alone tones decrease with BPF harmonic order due to the
exponential decay in the Green’s function in Equation 4.5. A similar decrease of rotor-
91
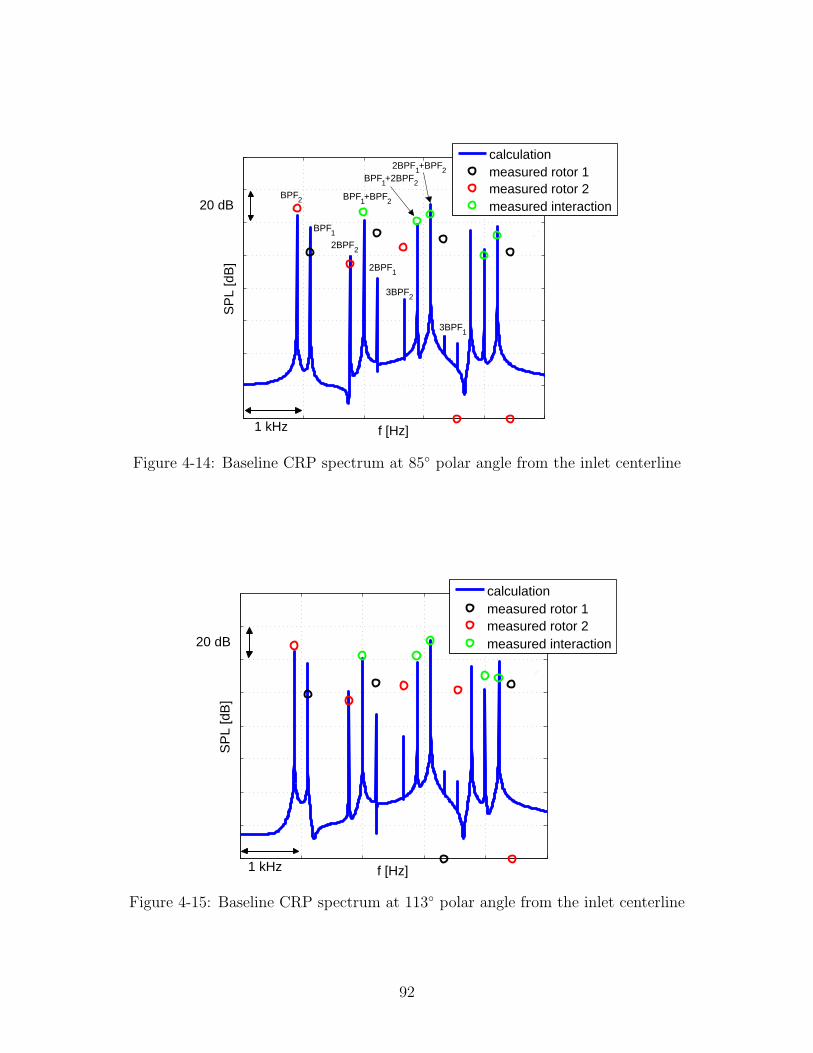
f [Hz]
SP
L [d
B]
calculationmeasured rotor 1measured rotor 2measured interaction
1 kHz
BPF2
BPF1
2BPF2
2BPF1
3BPF2
3BPF1
BPF1+BPF2
2BPF1+BPF2BPF1+2BPF2
20 dB
Figure 4-14: Baseline CRP spectrum at 85◦ polar angle from the inlet centerline
f [Hz]
SP
L [d
B]
calculationmeasured rotor 1measured rotor 2measured interaction
1 kHz
20 dB
Figure 4-15: Baseline CRP spectrum at 113◦ polar angle from the inlet centerline
92

0 30 60 90 120 150 180θ [deg]
SP
L [d
B]
BPF1
2BPF1 + 2BPF
2
measured BPF1
10 dB
Figure 4-16: Baseline CRP front-rotor harmonic at frequency BPF1
0 30 60 90 120 150 180θ [deg]
SP
L [d
B]
10 dB
Figure 4-17: Baseline CRP rear-rotor harmonic at frequency BPF2
alone tones with harmonic order is observed in [6], [52], and [53]. It is hypothesized
that the discrepancies between the measured (black and red circles) and calculated
rotor-alone tones are due to the strong influence of the upstream pylon present in the
experiments.
Polar directivity results for the first rotor-alone tone of front- and rear-rotor are
shown in Figures 4-16 and 4-17, respectively. In Figure 4-16, a typical calculated
interaction tone directivity is displayed additionally. The measured BPF1 results
resemble the interaction tone directivity and there are significant differences to the
computed results. These differences were thought to be primarily due to the interac-
tion with the upstream pylon. The rear-rotor first BPF harmonic is less affected by
the pylon effects and the computed results are in better agreement with the measured
data as shown in Figure 4-17. Similar conclusions were reached in investigations of
93
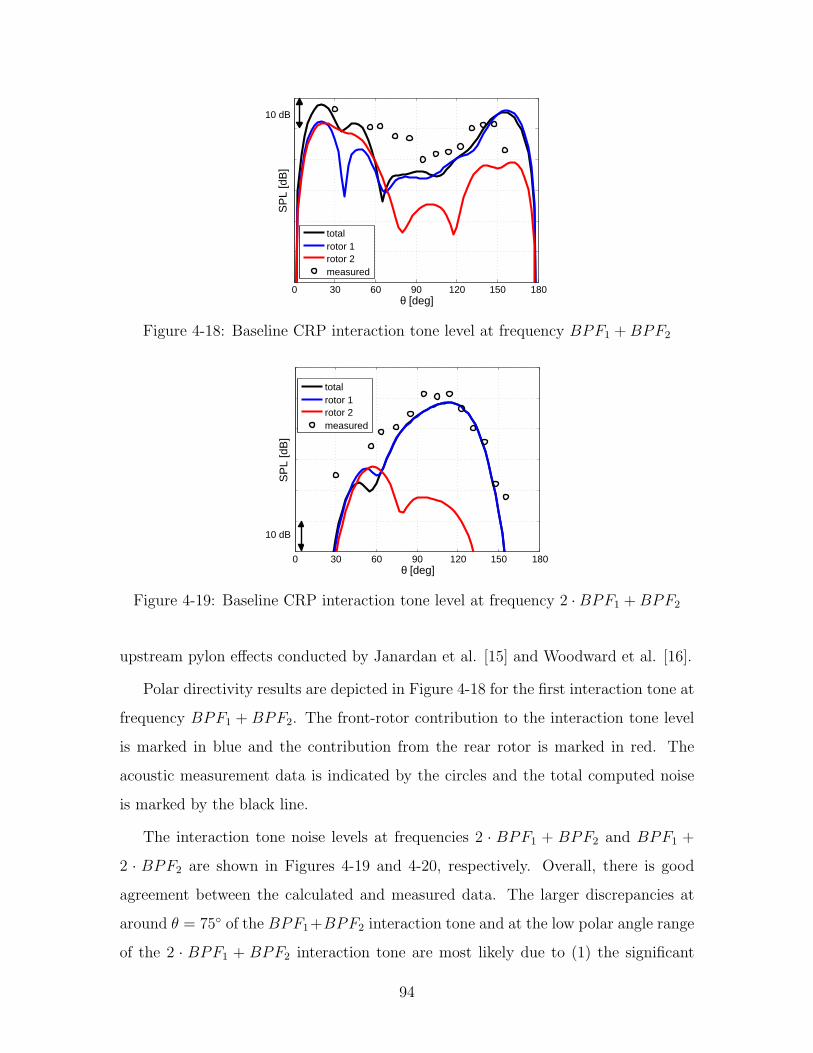
0 30 60 90 120 150 180θ [deg]
SP
L [d
B]
totalrotor 1rotor 2measured
10 dB
Figure 4-18: Baseline CRP interaction tone level at frequency BPF1 +BPF2
0 30 60 90 120 150 180θ [deg]
SP
L [d
B]
totalrotor 1rotor 2measured
10 dB
Figure 4-19: Baseline CRP interaction tone level at frequency 2 ·BPF1 +BPF2
upstream pylon effects conducted by Janardan et al. [15] and Woodward et al. [16].
Polar directivity results are depicted in Figure 4-18 for the first interaction tone at
frequency BPF1 + BPF2. The front-rotor contribution to the interaction tone level
is marked in blue and the contribution from the rear rotor is marked in red. The
acoustic measurement data is indicated by the circles and the total computed noise
is marked by the black line.
The interaction tone noise levels at frequencies 2 · BPF1 + BPF2 and BPF1 +
2 · BPF2 are shown in Figures 4-19 and 4-20, respectively. Overall, there is good
agreement between the calculated and measured data. The larger discrepancies at
around θ = 75◦ of the BPF1+BPF2 interaction tone and at the low polar angle range
of the 2 · BPF1 + BPF2 interaction tone are most likely due to (1) the significant
94
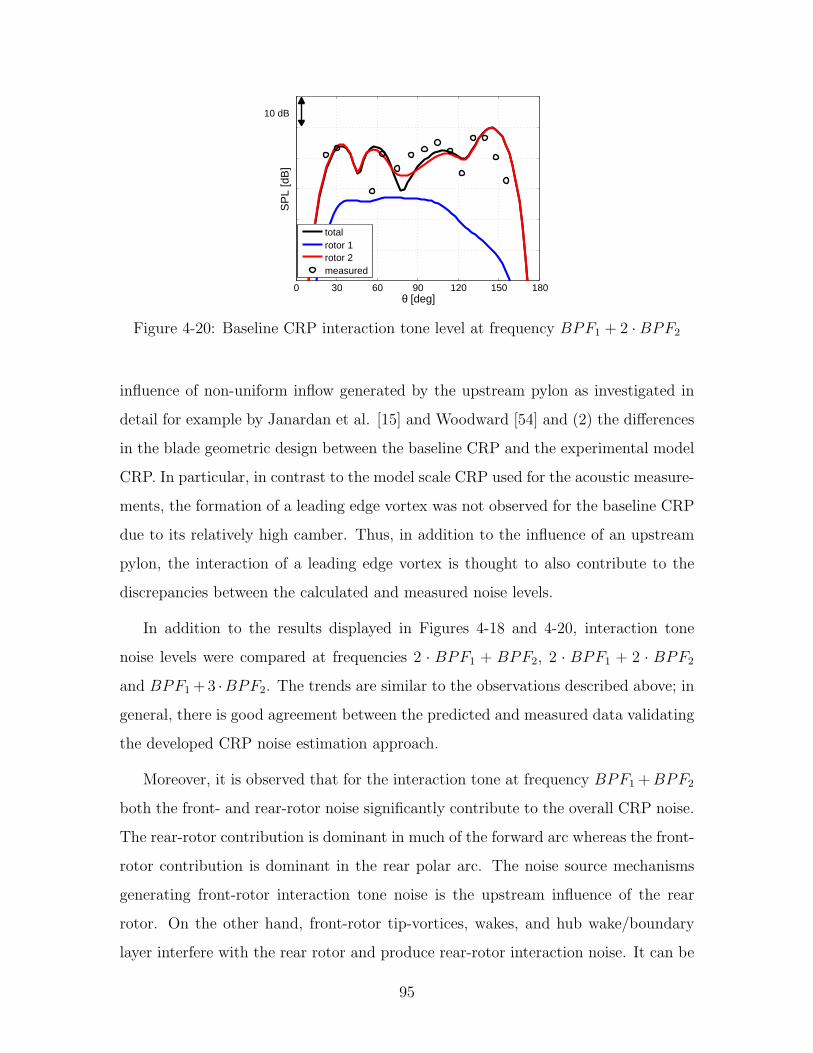
0 30 60 90 120 150 180θ [deg]
SP
L [d
B]
totalrotor 1rotor 2measured
10 dB
Figure 4-20: Baseline CRP interaction tone level at frequency BPF1 + 2 ·BPF2
influence of non-uniform inflow generated by the upstream pylon as investigated in
detail for example by Janardan et al. [15] and Woodward [54] and (2) the differences
in the blade geometric design between the baseline CRP and the experimental model
CRP. In particular, in contrast to the model scale CRP used for the acoustic measure-
ments, the formation of a leading edge vortex was not observed for the baseline CRP
due to its relatively high camber. Thus, in addition to the influence of an upstream
pylon, the interaction of a leading edge vortex is thought to also contribute to the
discrepancies between the calculated and measured noise levels.
In addition to the results displayed in Figures 4-18 and 4-20, interaction tone
noise levels were compared at frequencies 2 · BPF1 + BPF2, 2 · BPF1 + 2 · BPF2
and BPF1 + 3 ·BPF2. The trends are similar to the observations described above; in
general, there is good agreement between the predicted and measured data validating
the developed CRP noise estimation approach.
Moreover, it is observed that for the interaction tone at frequency BPF1 +BPF2
both the front- and rear-rotor noise significantly contribute to the overall CRP noise.
The rear-rotor contribution is dominant in much of the forward arc whereas the front-
rotor contribution is dominant in the rear polar arc. The noise source mechanisms
generating front-rotor interaction tone noise is the upstream influence of the rear
rotor. On the other hand, front-rotor tip-vortices, wakes, and hub wake/boundary
layer interfere with the rear rotor and produce rear-rotor interaction noise. It can be
95
seen in Figures 4-18 and 4-20 that the interaction tone at frequency 2 ·BPF1 +BPF2
is governed by the front-rotor contribution while the interaction tone at frequency
BPF1 +2 ·BPF2 is governed by the rear-rotor contribution. These trends are further
investigated in the next chapter where the four noise mechanisms assumed responsible
for CRP interaction noise are dissected and their impact is quantified.
In summary, a CRP noise estimation method based on Goldstein’s formulation
of the acoustic analogy for moving media and Hanson’s single rotor noise approach
extended to counter-rotating configurations was established and validated with ex-
perimental data. The method requires the a priori determination of the time-varying
blade surface pressures. Thus, a high-fidelity CFD approach was demonstrated to suc-
cessfully capture the underlying aerodynamic mechanisms and to compute the blade
loading data required for the definition of the acoustic source terms. The acoustic
performance assessment for advanced CRP configurations using the developed noise
method is discussed next.
96
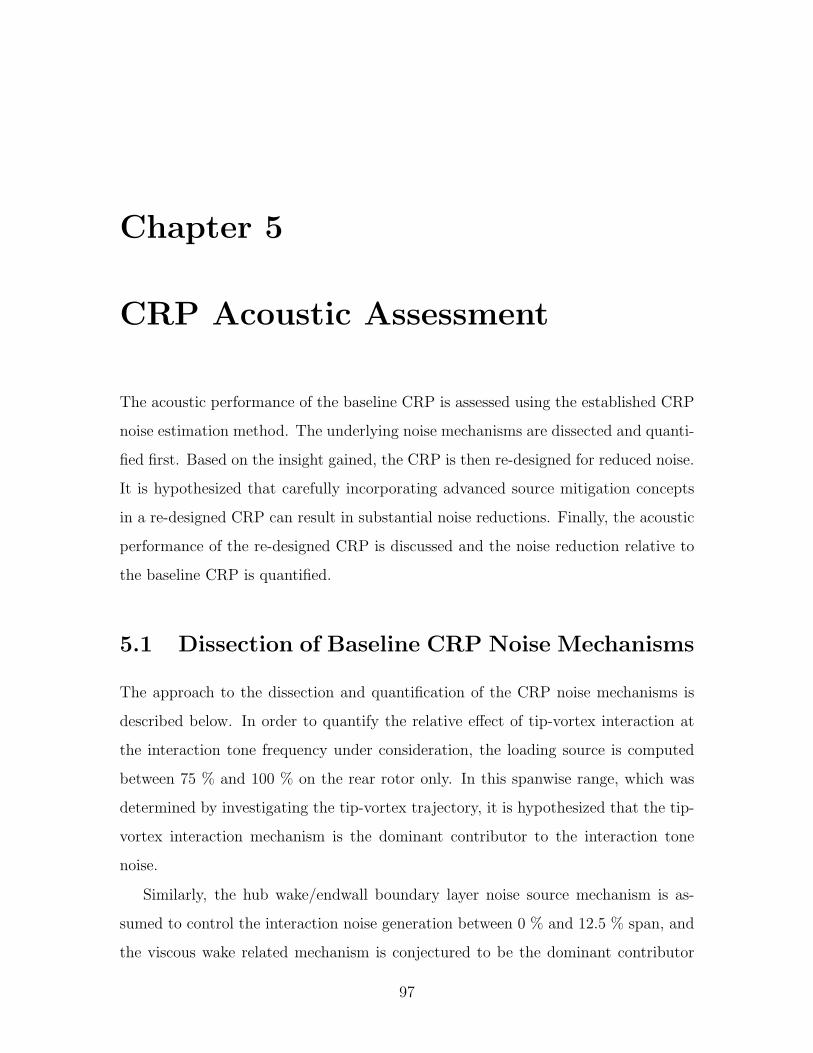
Chapter 5
CRP Acoustic Assessment
The acoustic performance of the baseline CRP is assessed using the established CRP
noise estimation method. The underlying noise mechanisms are dissected and quanti-
fied first. Based on the insight gained, the CRP is then re-designed for reduced noise.
It is hypothesized that carefully incorporating advanced source mitigation concepts
in a re-designed CRP can result in substantial noise reductions. Finally, the acoustic
performance of the re-designed CRP is discussed and the noise reduction relative to
the baseline CRP is quantified.
5.1 Dissection of Baseline CRP Noise Mechanisms
The approach to the dissection and quantification of the CRP noise mechanisms is
described below. In order to quantify the relative effect of tip-vortex interaction at
the interaction tone frequency under consideration, the loading source is computed
between 75 % and 100 % on the rear rotor only. In this spanwise range, which was
determined by investigating the tip-vortex trajectory, it is hypothesized that the tip-
vortex interaction mechanism is the dominant contributor to the interaction tone
noise.
Similarly, the hub wake/endwall boundary layer noise source mechanism is as-
sumed to control the interaction noise generation between 0 % and 12.5 % span, and
the viscous wake related mechanism is conjectured to be the dominant contributor
97

in the remaining spanwise range. The influence of the rear-rotor potential field is
calculated by accounting for the loading sources on the front rotor only. The noise
source dissection is summarized in Table 5.1.
Table 5.1: Radial extent of contributing source mechanisms
Noise Source Contributing SpanwiseMechanism Rotor Range
Upstream influence Front 0− 100 %Tip-vortex Rear 75− 100 %
Viscous wake Rear 12.5− 75 %Hub wake/endwall BL Rear 0− 12.5 %
The sectional loading distribution on the front rotor measured by the time-varying
lift coefficient cl is depicted in Figure 5-1. The lift coefficient is non-dimensionalized
by the steady sectional lift coefficient cl,steady. At mid-span, the front-rotor loading
variation is 14 % of the steady loading level due to the influence of the rear-rotor
potential field, which is illustrated in Figure 4-1. Near the tip at 95 % span, the
variation relative to the steady loading decreases to 8.5 % in amplitude due to the
reduced strength of the potential field on the rear-rotor. Additional spanwise sections
were investigated and it was found that rear-rotor upstream influence significantly
impacts the front-rotor loading over the entire spanwise range. Loading variations of
up to 15 % in amplitude relative to the steady loading level were observed.
The front-rotor tip-vortices and viscous wakes are depicted in Figures 4-3 and
4-4, respectvely. Near the tip, the rear-rotor loading is significantly affected by the
front-rotor tip-vortex, as illustrated in Figure 5-2. The variation reaches 12 % of the
steady loading level. At mid-span, the front-rotor viscous wakes cause the rear-rotor
loading to vary with an amplitude of approximately 4 %. In general, tip-vortex effects
were found to cause larger variations in loading than wake effects.
The relative contributions of each of the underlying mechanisms are depicted in
Figures 5-3, 5-4, and 5-5 by means of interaction tone directivities at frequencies
BPF1 +BPF2, 2 ·BPF1 +BPF2, and BPF1 + 2 ·BPF2, respectively.
For the first interaction tone, the noise level is dominated by a combination of
98
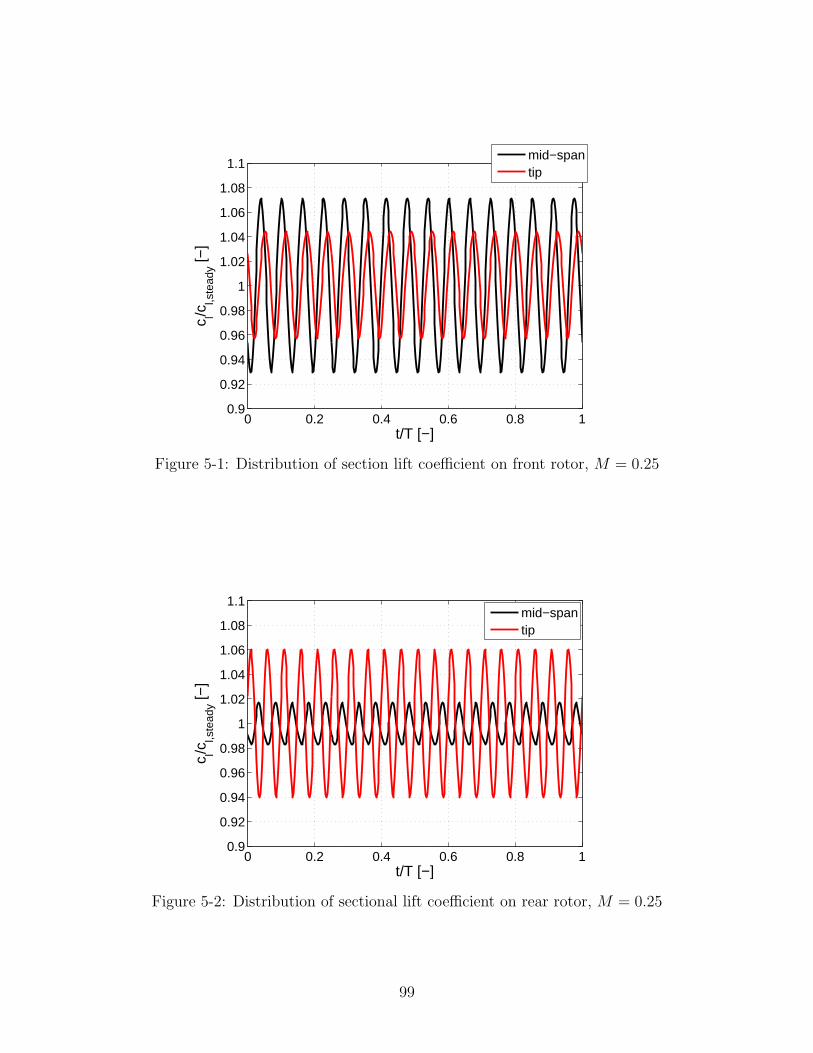
0 0.2 0.4 0.6 0.8 10.9
0.92
0.94
0.96
0.98
1
1.02
1.04
1.06
1.08
1.1
t/T [−]
c l/cl,s
tead
y [−]
mid−spantip
Figure 5-1: Distribution of section lift coefficient on front rotor, M = 0.25
0 0.2 0.4 0.6 0.8 10.9
0.92
0.94
0.96
0.98
1
1.02
1.04
1.06
1.08
1.1
t/T [−]
c l/cl,s
tead
y [−]
mid−spantip
Figure 5-2: Distribution of sectional lift coefficient on rear rotor, M = 0.25
99

0 30 60 90 120 150 180θ [deg]
SP
L [d
B]
upstream influencetip vortexviscous wakehub wake and BLtotal
10 dB
Figure 5-3: Dissection of baseline CRP noise mechanisms for interaction tone BPF1+BPF2, M = 0.25
0 30 60 90 120 150 180θ [deg]
SP
L [d
B]
upstream influencetip vortexviscous wakehub wake and BLtotal
10 dB
Figure 5-4: Dissection of baseline CRP noise mechanisms for interaction tone 2 ·BPF1 +BPF2, M = 0.25
0 30 60 90 120 150 180θ [deg]
SP
L [d
B]
upstream influencetip vortexviscous wakehub wake and BLtotal
10 dB
Figure 5-5: Dissection of baseline CRP noise mechanisms for interaction tone BPF1+2 ·BPF2, M = 0.25
100
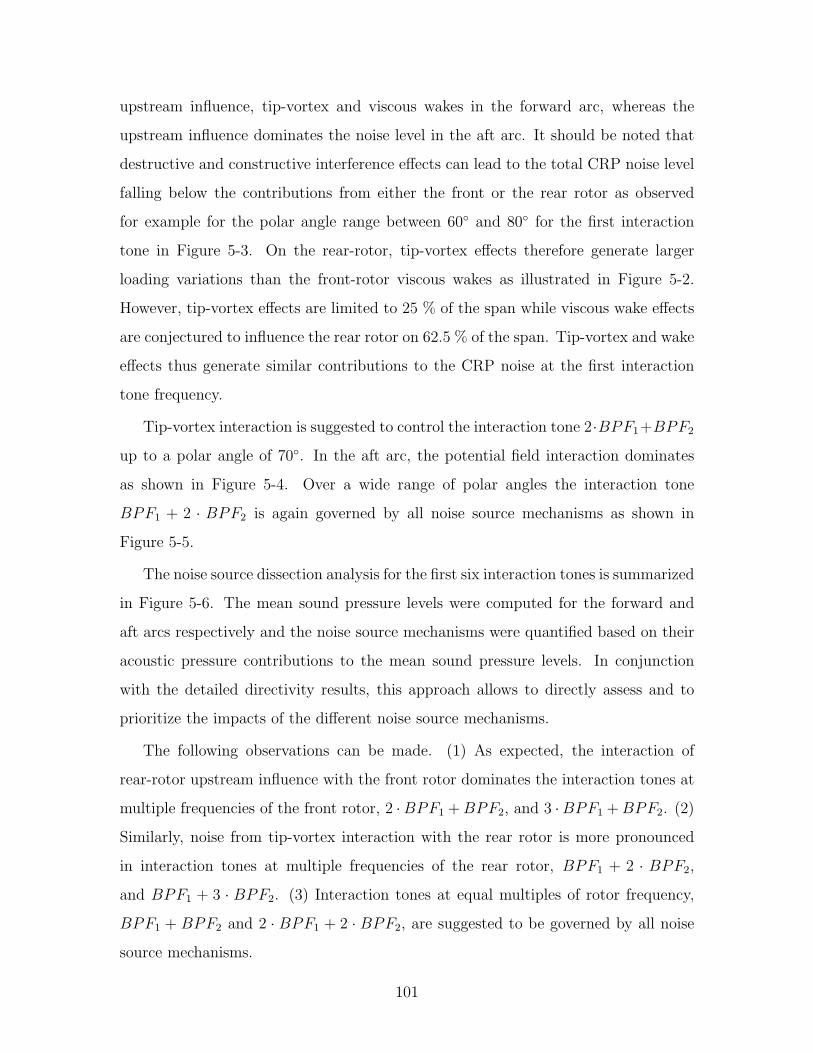
upstream influence, tip-vortex and viscous wakes in the forward arc, whereas the
upstream influence dominates the noise level in the aft arc. It should be noted that
destructive and constructive interference effects can lead to the total CRP noise level
falling below the contributions from either the front or the rear rotor as observed
for example for the polar angle range between 60◦ and 80◦ for the first interaction
tone in Figure 5-3. On the rear-rotor, tip-vortex effects therefore generate larger
loading variations than the front-rotor viscous wakes as illustrated in Figure 5-2.
However, tip-vortex effects are limited to 25 % of the span while viscous wake effects
are conjectured to influence the rear rotor on 62.5 % of the span. Tip-vortex and wake
effects thus generate similar contributions to the CRP noise at the first interaction
tone frequency.
Tip-vortex interaction is suggested to control the interaction tone 2·BPF1+BPF2
up to a polar angle of 70◦. In the aft arc, the potential field interaction dominates
as shown in Figure 5-4. Over a wide range of polar angles the interaction tone
BPF1 + 2 · BPF2 is again governed by all noise source mechanisms as shown in
Figure 5-5.
The noise source dissection analysis for the first six interaction tones is summarized
in Figure 5-6. The mean sound pressure levels were computed for the forward and
aft arcs respectively and the noise source mechanisms were quantified based on their
acoustic pressure contributions to the mean sound pressure levels. In conjunction
with the detailed directivity results, this approach allows to directly assess and to
prioritize the impacts of the different noise source mechanisms.
The following observations can be made. (1) As expected, the interaction of
rear-rotor upstream influence with the front rotor dominates the interaction tones at
multiple frequencies of the front rotor, 2 ·BPF1 +BPF2, and 3 ·BPF1 +BPF2. (2)
Similarly, noise from tip-vortex interaction with the rear rotor is more pronounced
in interaction tones at multiple frequencies of the rear rotor, BPF1 + 2 · BPF2,
and BPF1 + 3 · BPF2. (3) Interaction tones at equal multiples of rotor frequency,
BPF1 + BPF2 and 2 · BPF1 + 2 · BPF2, are suggested to be governed by all noise
source mechanisms.
101
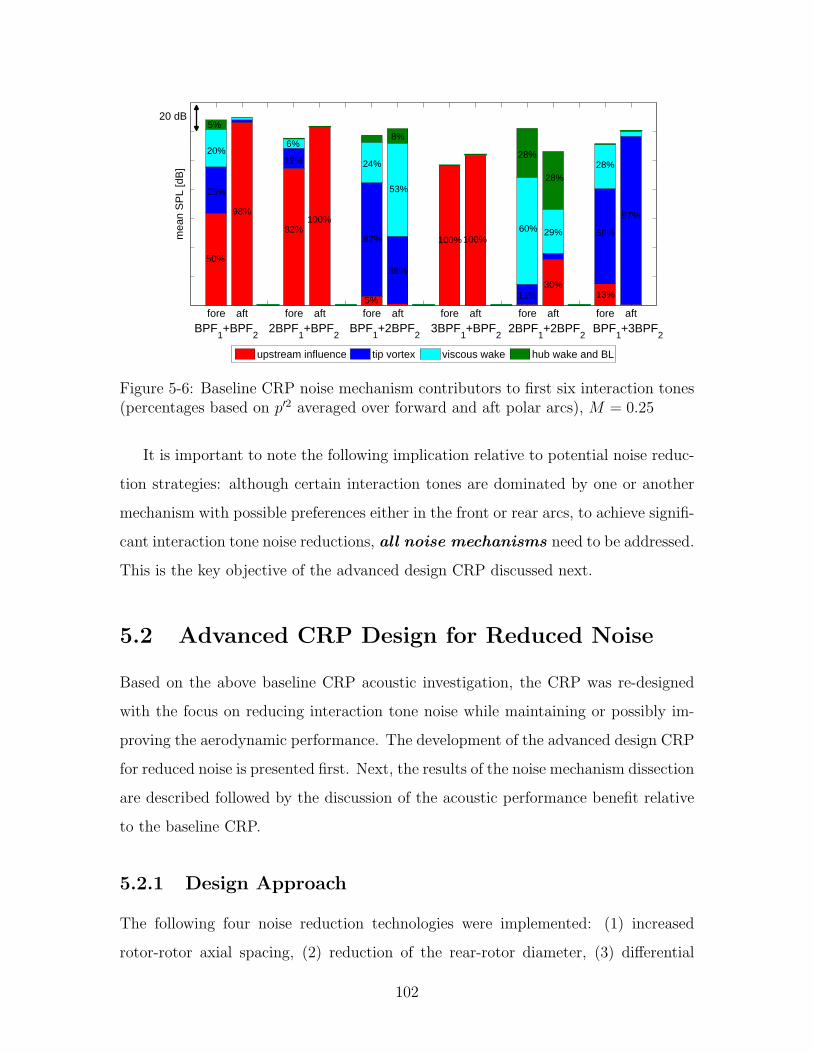
fore aft fore aft fore aft fore aft fore aft fore aft
mea
n S
PL
[dB
]
upstream influence tip vortex viscous wake hub wake and BL
5%
20%
25%
50%
98%
82%
6%
12%
100%
5%
67%
24%
53%
8%
38%
100% 100%
11%
28%
28%
29%
30%
59%
13%
28%
97%60%
BPF1+BPF
22BPF
1+BPF
2BPF
1+2BPF
23BPF
1+BPF
2BPF
1+3BPF
22BPF
1+2BPF
2
20 dB
Figure 5-6: Baseline CRP noise mechanism contributors to first six interaction tones(percentages based on p′2 averaged over forward and aft polar arcs), M = 0.25
It is important to note the following implication relative to potential noise reduc-
tion strategies: although certain interaction tones are dominated by one or another
mechanism with possible preferences either in the front or rear arcs, to achieve signifi-
cant interaction tone noise reductions, all noise mechanisms need to be addressed.
This is the key objective of the advanced design CRP discussed next.
5.2 Advanced CRP Design for Reduced Noise
Based on the above baseline CRP acoustic investigation, the CRP was re-designed
with the focus on reducing interaction tone noise while maintaining or possibly im-
proving the aerodynamic performance. The development of the advanced design CRP
for reduced noise is presented first. Next, the results of the noise mechanism dissection
are described followed by the discussion of the acoustic performance benefit relative
to the baseline CRP.
5.2.1 Design Approach
The following four noise reduction technologies were implemented: (1) increased
rotor-rotor axial spacing, (2) reduction of the rear-rotor diameter, (3) differential
102

tip speeds, and (4) blade count variations.
Increasing the axial spacing between the rotor results in an increased decay of
the front-rotor viscous wakes and tip-vortices reducing the interaction with the rear
rotor. In addition, the strength of the rear-rotor potential field near the front rotor is
significantly reduced. Therefore, it is hypothesized that increased rotor-rotor spacing
will mitigate several interaction tone mechanisms, in agreement with noise reductions
previously reported by for example Janardan et al. [15] and by Woodward et al. [17].
The rear-rotor diameter was also reduced to potentially eliminate the interaction
of the front-rotor tip-vortices [14]. For the baseline CRP, the core of the front-rotor
vortex interacts with the rear rotor at approximately 90 % span. Between 90 %
and 75 % span, the strength of the interaction of front-rotor tip-vortex with rear
rotor gradually decreases with increasing radial distance from the vortex core. At
75 % span, the interaction of the front-rotor viscous wakes outweighs the tip-vortex
influence. Thus, the rear rotor was clipped at 75 % span. To maintain the thrust level,
the loading on the remaining part of the blades needs to be increased for a clipped
rotor. This can be achieved either by increasing the blade angle setting or the tip
speed, or a combination thereof. In return, however, a higher rear-rotor blade loading
leads to an increased upstream influence, which can impair the acoustic benefits of
increased rotor-rotor axial spacing. Compared to the baseline CRP design, the thrust
and propulsive efficiency were maintained at the takeoff condition, which is relevant
for the noise assessment. In order to limit the loading increase on the rear rotor
while maintaining thrust, the number of blades was increased from 8 to 11. A model
scale version of the advanced CRP configuration is used for the acoustic assessment
and dissection of noise mechanisms such that the results can be compared to the
model scale baseline CRP data on a consistent basis. The model scale advanced CRP
configuration and the details of the takeoff operating conditions are given in Table
5.2.
Since the CRP configuration significantly changed compared to the baseline CRP,
the CFD simulations necessary for further aerodynamic and acoustic analysis of the
advanced CRP design required the generation of a modified full-wheel numerical grid.
103
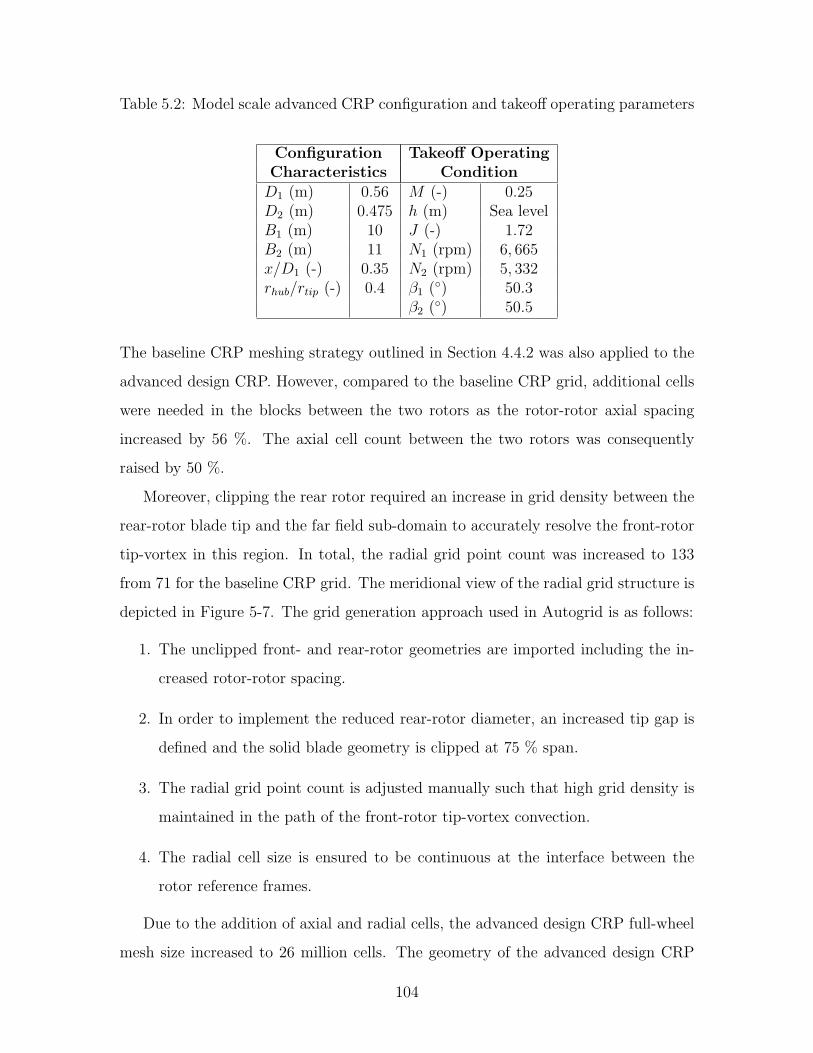
Table 5.2: Model scale advanced CRP configuration and takeoff operating parameters
Configuration Takeoff OperatingCharacteristics ConditionD1 (m) 0.56 M (-) 0.25D2 (m) 0.475 h (m) Sea levelB1 (m) 10 J (-) 1.72B2 (m) 11 N1 (rpm) 6, 665x/D1 (-) 0.35 N2 (rpm) 5, 332rhub/rtip (-) 0.4 β1 (◦) 50.3
β2 (◦) 50.5
The baseline CRP meshing strategy outlined in Section 4.4.2 was also applied to the
advanced design CRP. However, compared to the baseline CRP grid, additional cells
were needed in the blocks between the two rotors as the rotor-rotor axial spacing
increased by 56 %. The axial cell count between the two rotors was consequently
raised by 50 %.
Moreover, clipping the rear rotor required an increase in grid density between the
rear-rotor blade tip and the far field sub-domain to accurately resolve the front-rotor
tip-vortex in this region. In total, the radial grid point count was increased to 133
from 71 for the baseline CRP grid. The meridional view of the radial grid structure is
depicted in Figure 5-7. The grid generation approach used in Autogrid is as follows:
1. The unclipped front- and rear-rotor geometries are imported including the in-
creased rotor-rotor spacing.
2. In order to implement the reduced rear-rotor diameter, an increased tip gap is
defined and the solid blade geometry is clipped at 75 % span.
3. The radial grid point count is adjusted manually such that high grid density is
maintained in the path of the front-rotor tip-vortex convection.
4. The radial cell size is ensured to be continuous at the interface between the
rotor reference frames.
Due to the addition of axial and radial cells, the advanced design CRP full-wheel
mesh size increased to 26 million cells. The geometry of the advanced design CRP
104

1
75 % span
increased tip gap
133 grid points
(up from 71 for baseline CRP)
interface between rotor reference frames
Figure 5-7: Advanced design CRP radial grid topology
is presented in Figure 5-8 along with the near-field density distribution showing the
front- and rear-rotor tip-vortices as well as the rear-rotor viscous wake.
5.2.2 Acoustic Performance for Advanced Design CRP
For the advanced design CRP, the periodicity is 4T2 = 5T1, as the tip speed ratio
is N1/N2 = 1.25. Therefore, in order to capture all of the loading frequencies, it is
necessary to record the surface pressure for every blade over four rear-rotor revolutions
(equivalent to five front-rotor revolutions). Due to data processing and CPU time
limitations the remaining analysis is based on surface pressures recorded for 1.5 rear-
rotor revolutions after reaching quasi-periodic flow conditions.
The first three interaction tone directivities are compared for the baseline and
advanced design CRPs in Figures 5-9, 5-10, and 5-11. For all three interaction tone
frequencies, the noise levels are significantly reduced over a wide range of polar direc-
tivity angles. The advanced design CRP interaction tone levels do not approach zero
at low and high polar angles which is conjectured to be due to the influence of unequal
tip speeds. For equal tip speeds, there are substantial destructive interference effects
reducing the noise levels close to the axis of rotation.
At the first interaction tone frequency, BPF1 + BPF2, the maximum noise level
105
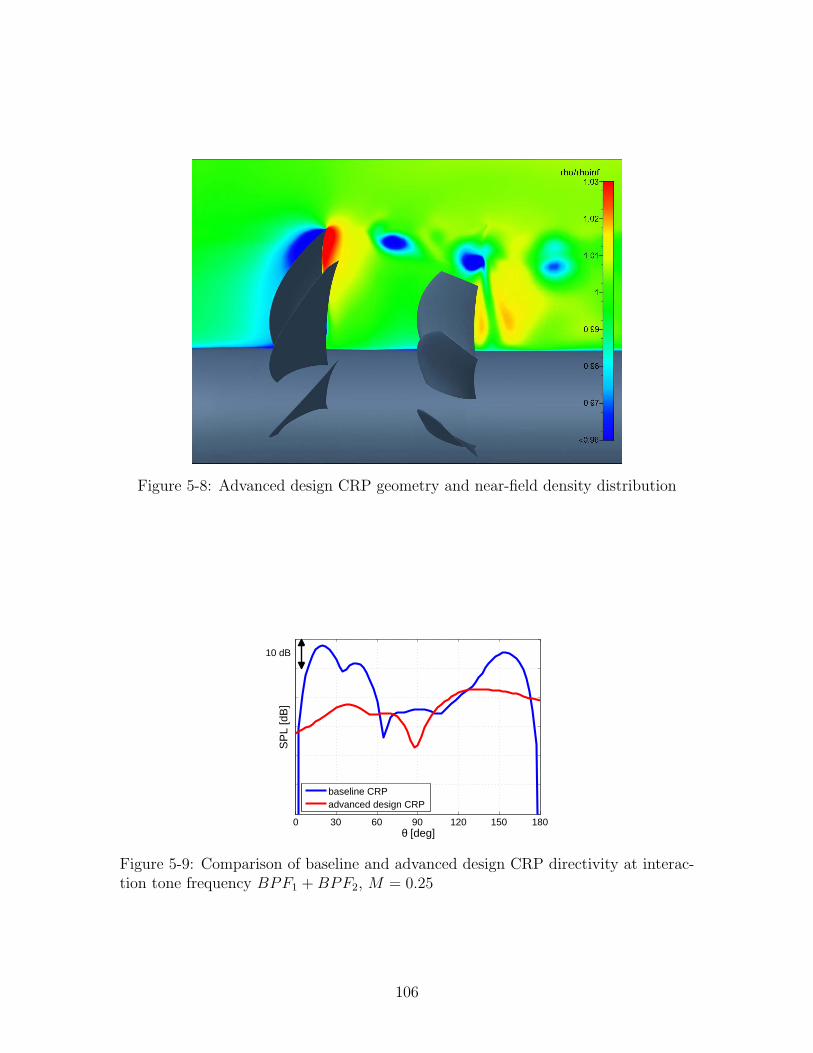
Figure 5-8: Advanced design CRP geometry and near-field density distribution
0 30 60 90 120 150 180θ [deg]
SP
L [d
B]
baseline CRPadvanced design CRP
10 dB
Figure 5-9: Comparison of baseline and advanced design CRP directivity at interac-tion tone frequency BPF1 +BPF2, M = 0.25
106

0 30 60 90 120 150 180θ [deg]
SP
L [d
B]
baseline CRPadvanced design CRP
10 dB
Figure 5-10: Comparison of baseline and advanced design CRP directivity at inter-action tone frequency 2 ·BPF1 +BPF2, M = 0.25
0 30 60 90 120 150 180θ [deg]
SP
L [d
B]
baseline CRPadvanced design CRP
10 dB
Figure 5-11: Comparison of baseline and advanced design CRP directivity at inter-action tone frequency BPF1 + 2 ·BPF2, M = 0.25
107

is reduced by 21 dB in the forward arc as illustrated in Figure 5-9. This reduction
is attributed to the decreased interaction of front-rotor tip-vortices and wakes with
the rear rotor, and the decreased interaction of the rear-rotor potential field with the
front rotor, as these mechanisms dominated the forward arc for the baseline CRP.
In the aft arc, the maximum noise level is reduced by 13 dB due to the decreased
strength of the rear-rotor upstream influence.
The maximum noise level at the second interaction tone frequency, 2 · BPF1 +
BPF2, shown in Figure 5-10, is reduced by 15 dB. For the baseline CRP, the second
interaction tone is governed by rear-rotor upstream influence over the entire polar
angle range. The reduction in potential field strength near the front rotor due to
increasing the rotor-rotor spacing by 56 % results in significant noise reductions at
interaction tone frequencies previously dominated by rear-rotor upstream influence.
At the third interaction tone frequency, BPF1 + 2 · BPF2, the maximum noise
level is reduced by approximately 10 dB in both the forward and aft arc as illustrated
in Figure 5-11. This reduction is attributed to the decreased interaction of front-rotor
tip-vortices and wakes with the rear rotor.
In general, the acoustic power is more evenly spread over the polar arc due to
unequal tip speed effects and the maximum noise levels in the forward and aft arcs
are reduced by up to 20 dB at the first three interaction tone frequencies.
The dissected CRP noise mechanisms are presented in Figure 5-12. Similar to the
baseline CRP case, the effects of the noise mechanisms are quantified by computing
the loading source terms for a spanwise section only. Based on analyzing the tip-vortex
trajectory it is assumed that the acoustic interaction of the front-rotor tip-vortex with
the rear-rotor blade tip is limited to 90 %−100 % of rear-rotor span. The front-rotor
viscous wakes affect the rear rotor over the 17 %− 90 % rear-rotor span range, while
the front-rotor hub wake influences the rear-rotor loading between 0 % and 17 %
span.
As expected, clipping the rear-rotor blade results in a significant reduction in tip-
vortex interaction as depicted in Figure 5-12. Viscous wake and upstream influence
effects now become the dominant noise source mechanisms as both the wake strength
108
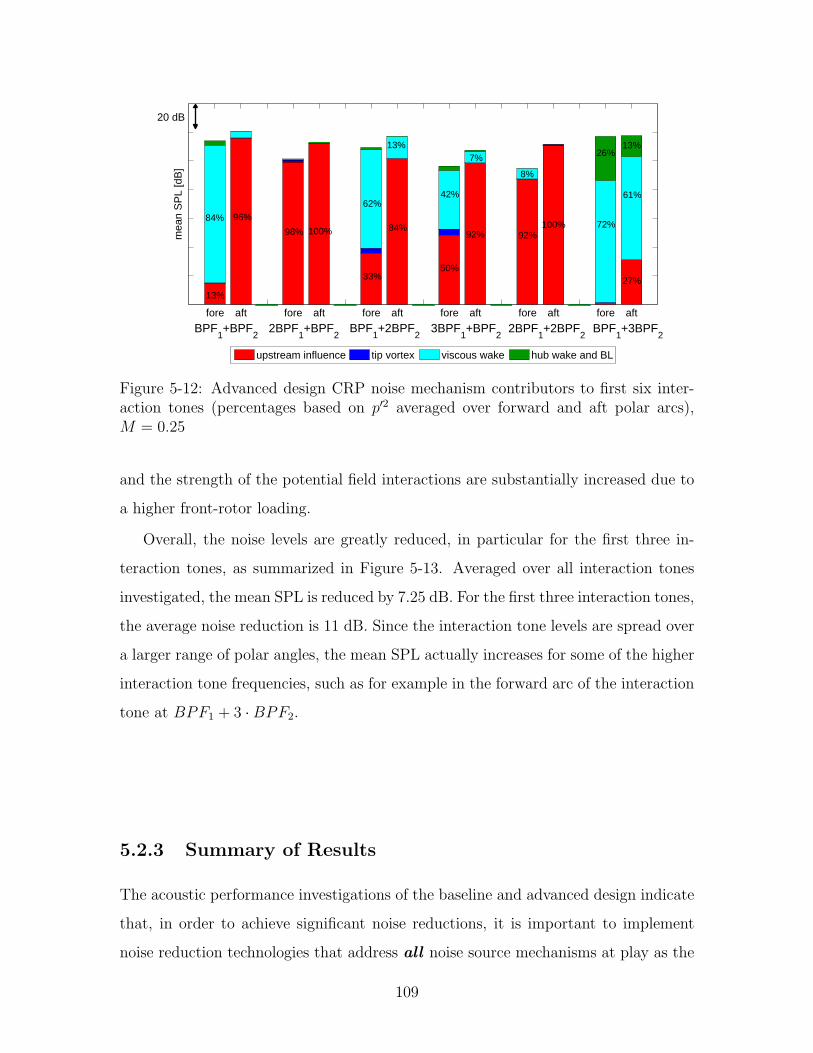
fore aft fore aft fore aft fore aft fore aft fore aft
mea
n S
PL
[dB
]
upstream influence tip vortex viscous wake hub wake and BL
72%
26%
61%
13%
13%
84% 96%
98% 100%
62%
33%
84%
42%
50%
92%
7%
8%
92%100%
13%
27%
BPF1+BPF
22BPF
1+BPF
2BPF
1+2BPF
23BPF
1+BPF
22BPF
1+2BPF
2BPF
1+3BPF
2
20 dB
Figure 5-12: Advanced design CRP noise mechanism contributors to first six inter-action tones (percentages based on p′2 averaged over forward and aft polar arcs),M = 0.25
and the strength of the potential field interactions are substantially increased due to
a higher front-rotor loading.
Overall, the noise levels are greatly reduced, in particular for the first three in-
teraction tones, as summarized in Figure 5-13. Averaged over all interaction tones
investigated, the mean SPL is reduced by 7.25 dB. For the first three interaction tones,
the average noise reduction is 11 dB. Since the interaction tone levels are spread over
a larger range of polar angles, the mean SPL actually increases for some of the higher
interaction tone frequencies, such as for example in the forward arc of the interaction
tone at BPF1 + 3 ·BPF2.
5.2.3 Summary of Results
The acoustic performance investigations of the baseline and advanced design indicate
that, in order to achieve significant noise reductions, it is important to implement
noise reduction technologies that address all noise source mechanisms at play as the
109
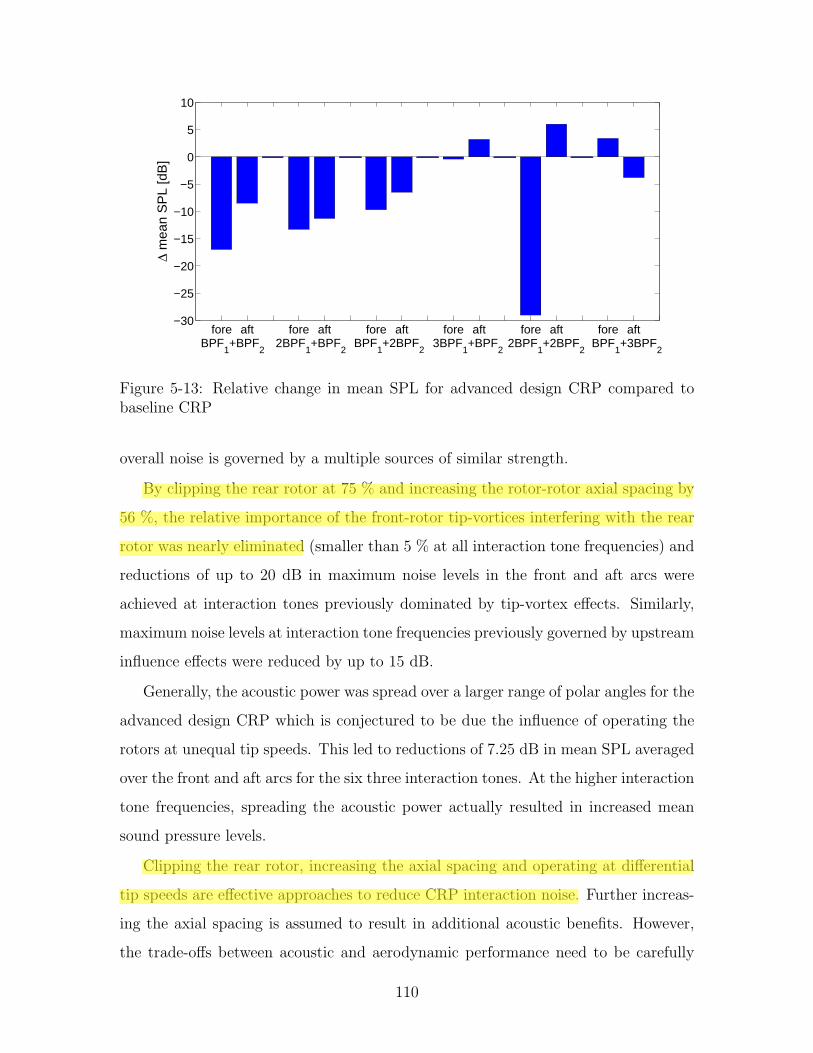
fore aft fore aft fore aft fore aft fore aft fore aft−30
−25
−20
−15
−10
−5
0
5
10
Δ m
ean
SP
L [d
B]
BPF1+BPF
22BPF
1+BPF
2BPF
1+2BPF
23BPF
1+BPF
22BPF
1+2BPF
2BPF
1+3BPF
2
Figure 5-13: Relative change in mean SPL for advanced design CRP compared tobaseline CRP
overall noise is governed by a multiple sources of similar strength.
By clipping the rear rotor at 75 % and increasing the rotor-rotor axial spacing by
56 %, the relative importance of the front-rotor tip-vortices interfering with the rear
rotor was nearly eliminated (smaller than 5 % at all interaction tone frequencies) and
reductions of up to 20 dB in maximum noise levels in the front and aft arcs were
achieved at interaction tones previously dominated by tip-vortex effects. Similarly,
maximum noise levels at interaction tone frequencies previously governed by upstream
influence effects were reduced by up to 15 dB.
Generally, the acoustic power was spread over a larger range of polar angles for the
advanced design CRP which is conjectured to be due the influence of operating the
rotors at unequal tip speeds. This led to reductions of 7.25 dB in mean SPL averaged
over the front and aft arcs for the six three interaction tones. At the higher interaction
tone frequencies, spreading the acoustic power actually resulted in increased mean
sound pressure levels.
Clipping the rear rotor, increasing the axial spacing and operating at differential
tip speeds are effective approaches to reduce CRP interaction noise. Further increas-
ing the axial spacing is assumed to result in additional acoustic benefits. However,
the trade-offs between acoustic and aerodynamic performance need to be carefully
110
Mondy
Highlight
Mondy
Highlight

investigated as the propulsion system weight and the amount of swirl recovered by
the rear rotor are negatively impacted by increasing the rotor-rotor spacing.
111

112

Chapter 6
System Level Noise Assessment
The previous chapter demonstrated that significant noise reductions can be achieved
by implementing source mitigation concepts targeting all of the underlying noise
source mechanisms. Using the overall integrated performance and noise assessment
methodology depicted in Figure 2-1, the acoustic performance of the baseline and
advanced design CRP aircraft arrangements is investigated on the system level next.
The noise levels from the CRP aircraft configurations are compared to the datum
turbofan powered aircraft in order to assess whether it is possible to achieve CRP
noise levels similar to those of an advanced turbofan powered aircraft.
6.1 Low-Speed Aerodynamic Performance
The low-speed performance computed in FLOPS up to an altitude of 3, 400 ft is pre-
sented in 6-1. In general, Mach number and altitude distribution along the trajectory
show similar trends. The thrust levels of the CRP configurations are increased along
the trajectory compared to the datum turbofan aircraft mainly due to the increased
takeoff weight.
Similar to the baseline CRP, the advanced design CRP was also sized to full scale
at the takeoff condition. Both designs feature the same front-rotor diameter and tip
speed but the rear-rotor characteristics differ as summarized in Table 6.1. Simulating
the advanced design CRP in RVL/RAXAN, it is ensured that the propulsive efficiency
113

0
2000
4000
h [ft
]
Datum TF A/CBaseline CRP A/CAdvanced Design CRP A/C
0
0.2
0.4
Ma
[−]
Datum TF A/CBaseline CRP A/CAdvanced Design CRP A/C
0 50 100 15020,000
30,000
40,000
50,000
t [sec]
Thr
ust [
lb]
Datum TF A/CBaseline CRP A/CAdvanced Design CRP A/C
a) Altitude
c) Thrust
b) Mach Number
Figure 6-1: Takeoff performance of investigated aircraft configurations: a) altitude,b) Mach number, and c) thrust lapse
is maintained.
Since the rear-rotor tip speed was reduced for the advanced design CRP, the
required planetary gearbox ratio between the low-pressure spool and the rear-rotor
shaft increased from 8 : 1 to 10.1 : 1. Compared to the baseline CRP, the loading
on the front-rotor blades is larger than the rear-rotor loading, which is reflected in a
reversal of the torque split. The larger torque is transferred through the planetary
gearbox carrier. As the carrier driven rotor must be located farthest away from the
engine core, the advanced CRP design is suggested to be more suitable for a tractor
configuration. Based on discussions with the industry partner, a 5 % increase in
the propulsion system weight was assumed in the mission and overall performance
analysis to account for the increased rotor-rotor spacing and the additional blades
of the rear rotor. Thus, the required thrust levels for the advanced design CRP are
slightly increased compared to the baseline CRP aircraft as illustrated in Figure 6-1.
In general, the takeoff trajectories are similar for all three aircraft configurations
114
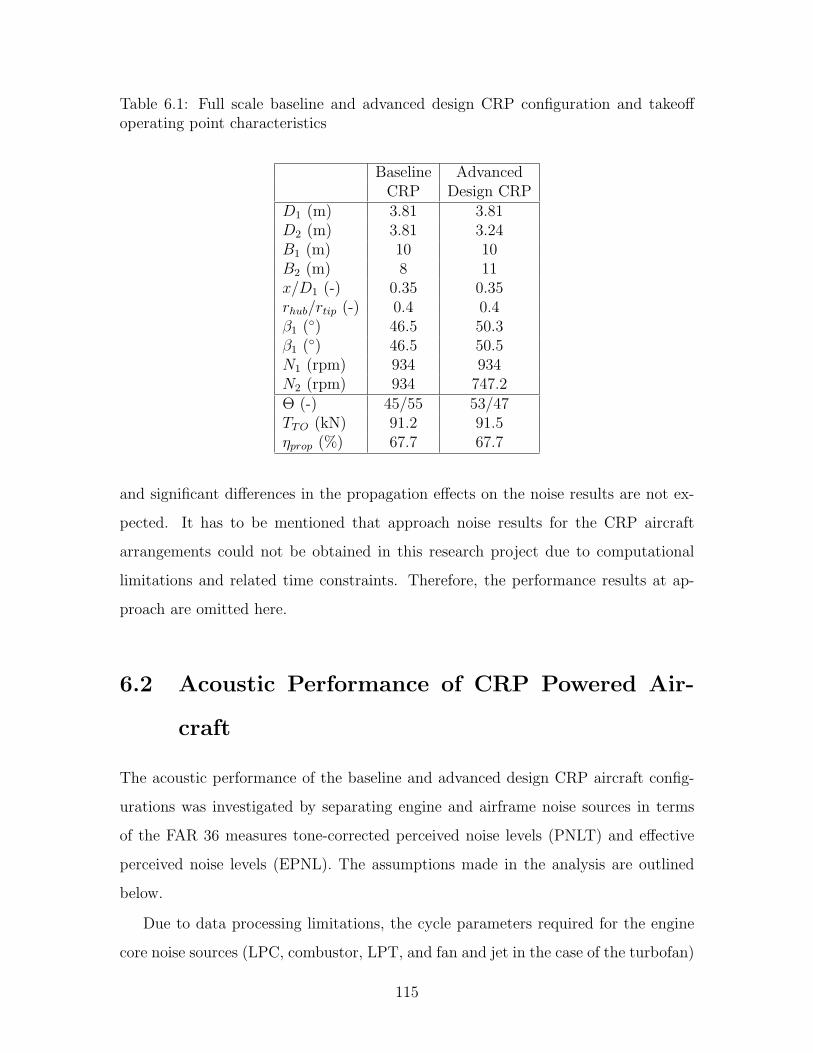
Table 6.1: Full scale baseline and advanced design CRP configuration and takeoffoperating point characteristics
Baseline AdvancedCRP Design CRP
D1 (m) 3.81 3.81D2 (m) 3.81 3.24B1 (m) 10 10B2 (m) 8 11x/D1 (-) 0.35 0.35rhub/rtip (-) 0.4 0.4β1 (◦) 46.5 50.3β1 (◦) 46.5 50.5N1 (rpm) 934 934N2 (rpm) 934 747.2Θ (-) 45/55 53/47TTO (kN) 91.2 91.5ηprop (%) 67.7 67.7
and significant differences in the propagation effects on the noise results are not ex-
pected. It has to be mentioned that approach noise results for the CRP aircraft
arrangements could not be obtained in this research project due to computational
limitations and related time constraints. Therefore, the performance results at ap-
proach are omitted here.
6.2 Acoustic Performance of CRP Powered Air-
craft
The acoustic performance of the baseline and advanced design CRP aircraft config-
urations was investigated by separating engine and airframe noise sources in terms
of the FAR 36 measures tone-corrected perceived noise levels (PNLT) and effective
perceived noise levels (EPNL). The assumptions made in the analysis are outlined
below.
Due to data processing limitations, the cycle parameters required for the engine
core noise sources (LPC, combustor, LPT, and fan and jet in the case of the turbofan)
115
Mondy
Rectangle
are computed for three operating conditions along the takeoff trajectory (at Mach 0.1,
when the aircraft begins rotation, and at cutback) and one operating condition on
the approach trajectory (at 6, 560 ft ahead of the runway) only. The cycle parameters
are assumed constant between the calculated operating conditions at takeoff and for
the entire approach trajectory.
From the engine cycle analysis for the takeoff condition, the maximum change
of the parameters influencing engine noise between the first and second computed
conditions (between M = 0.1 and the start of the aircraft rotation) is 5.5 % (for the
turbine inlet temperature). Similarly, the maximum change between the second and
third calculated conditions (between the start of the aircraft rotating and just before
cutback) is 6 % (for the core mass flow). Thus, assuming constant cycle parameters
will not considerably impact the engine noise levels at takeoff. At approach, the thrust
requirement and flight velocity are nearly constant until the aircraft touches down
and decelerates. The engine cycle parameter change by less than 2 % and assuming
constant cycle inputs is not believed to affect the engine noise levels at approach.
The unsteady blade loading was computed for the M = 0.25 takeoff condition only.
CFD simulations at cutback and approach operating conditions were not carried out
and the noise estimation at the FAR 36 observer location is omitted here but can be
performed in the future. In order to account for the noise benefit due to cutback,
a reduction of 2 PNdB was applied to the flyover and sideline PNLT results at the
location of cutback. This assumption is based on a preliminary noise analysis for
the baseline CRP using FINE/Turbo’s single passage non-linear harmonic (NLH)
method to determine the unsteady blade surface pressures. In this analysis, only the
first two loading harmonics could be captured leading to underestimated interaction
tones at the higher frequencies. A 2 PNdB reduction in CRP noise was observed at
cutback. Since the lower interaction tones generally govern the spectra at the low-
speed operating conditions, this reduction was considered to adequately represent the
cutback effect in the current full-wheel unsteady CFD based investigation.
In addition, compared to the M = 0.25 condition, the capture streamtube con-
traction is increased at lower takeoff speeds. Increased streamtube contraction affects
116
the path along which the front-rotor tip-vortices are convected. The surface pressure
results are thereby changed compared to the M = 0.25 condition which in turn influ-
ences the noise levels. This effect at lower takeoff speeds is not taken into account in
the current analysis.
Pylon and angle-of-attack effects are not included in the CFD analysis and any
aerodynamic interaction of non-uniform inflow with the CRP rotors is not captured.
The presence of an upstream pylon or angle-of-attack effects lead to unsteady blade
loading at the BPF harmonics which in turn influences the rotor-alone tone noise as
described in Chapter 4.5. As a result, the rotor-alone tones are underestimated in the
present analysis. However, the interaction tones generally dominate the CRP noise
spectra at the low-speed conditions [13]. Thus underestimating rotor-alone noise is
not believed to significantly affect overall CRP noise levels.
CFD simulations and CRP noise calculations were performed for the model scale
baseline and advanced design CRPs. The full-scale noise results are obtained by
acoustically scaling the model scale noise spectra. The sound pressure level is obtained
from
SPLFS = SPLMS + 20log(SF ), (6.1)
where the subscripts FS and MS denote full and model scale data, respectively. The
scaling factor is given by SF = DMS/DFS = 6.82. The frequencies of the full scale
noise spectrum are shifted according to
fFS = fMS/SF. (6.2)
Due to CPU time and memory capacity limitations, the model scale CRP tones were
determined up to the 22th harmonic order only, i.e. up to a maximum frequency
of fmax,MS = 22 · BPF1 = 24.44 kHz such that the maximum full scale frequency
included in the CRP noise estimation is fmax,FS = 3.58 kHz. Consequently, the
frequency range most strongly weighted in the conversion to perceived noisiness is
captured in the calculations.
The above assumptions and related limitations should be kept in mind in the
117
discussion of the noise results. However, the noise estimation is performed on a
consistent basis and the trends observed in the results can be used to assess the
potential noise reduction of CRP designs and related source noise mitigation concepts.
The noise results at the FAR 36 flyover and sideline observer locations are discussed
next.
6.3 Flyover Noise Assessment
Tone-corrected perceived noise levels are plotted over time at the flyover receiver from
the start of the takeoff roll in Figure 6-2. The PNLT source breakdown of the datum
turbofan powered aircraft presented on the top shows that the total noise is largely
governed by fan noise. In addition, airframe noise contributes significantly to the
overall noise in a short period after the thrust setting is cut back to 70 % of the
maximum thrust at 610 m.
In addition to operating at lower tip Mach numbers after cutback, the fan noise is
decreased further and subsequently increased sharply at about 95 s which corresponds
to the aircraft being located directly above the flyover observer location. This effect
is attributed to the shape of the fan noise directivity since fan noise is somewhat
shielded by the nacelle when the aircraft is directly above the observer location.
The flyover noise levels of the baseline CRP powered aircraft configuration are
displayed in Figure 6-2b. The overall noise level is dominated by the CRP sources.
The takeoff trajectory and the flap and slat settings are similar compared to the
datum turbofan aircraft configuration (see Figure 6-1) such that the airframe noise is
not significantly changed. The CRP engine core is smaller than the datum turbofan
core, thus LPC, combustor, and LPT noise are reduced. Since the jet noise method
is not applicable to the CRP engine as described in Section 2.4, the jet noise source
is not included in the CRP noise assessment. However, jet noise is not believed to
significantly increase the total noise level due to the low nozzle exit velocities (around
M = 0.1).
After the maximum noise levels are reached near the location at which the aircraft
118
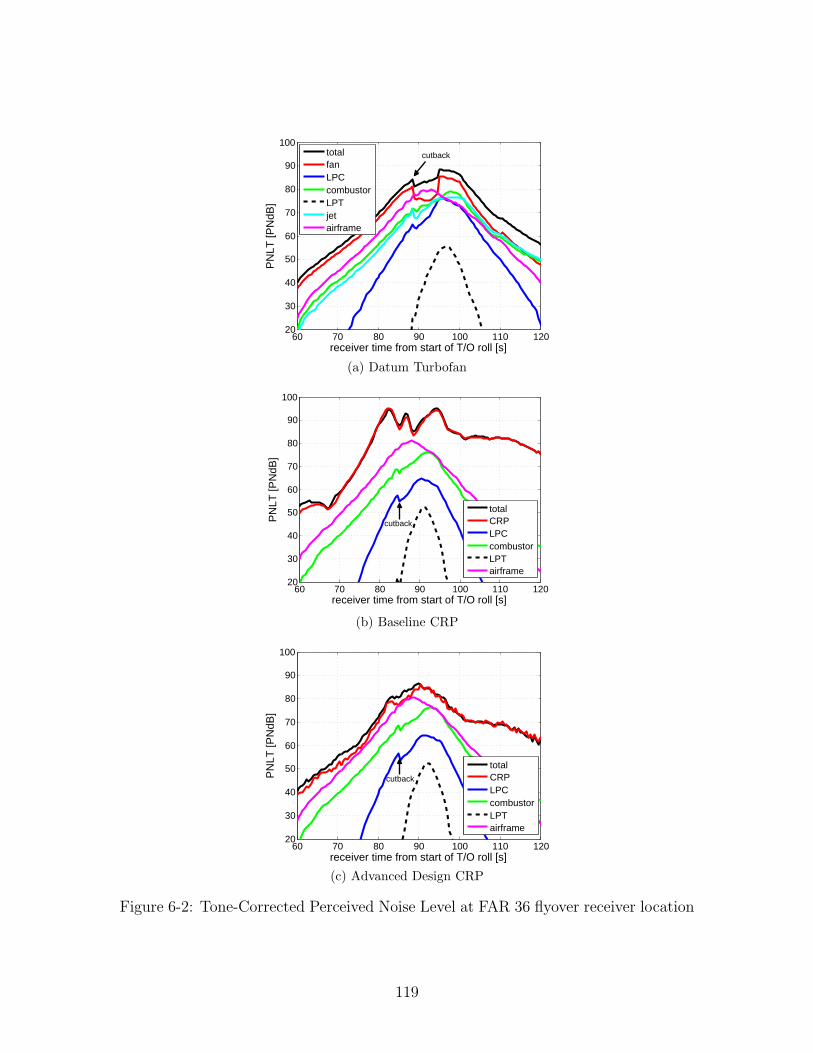
60 70 80 90 100 110 12020
30
40
50
60
70
80
90
100
receiver time from start of T/O roll [s]
PN
LT [P
NdB
]
totalfanLPCcombustorLPTjetairframe
cutback
(a) Datum Turbofan
60 70 80 90 100 110 12020
30
40
50
60
70
80
90
100
receiver time from start of T/O roll [s]
PN
LT [P
NdB
]
totalCRPLPCcombustorLPTairframe
cutback
(b) Baseline CRP
60 70 80 90 100 110 12020
30
40
50
60
70
80
90
100
receiver time from start of T/O roll [s]
PN
LT [P
NdB
]
totalCRPLPCcombustorLPTairframe
cutback
(c) Advanced Design CRP
Figure 6-2: Tone-Corrected Perceived Noise Level at FAR 36 flyover receiver location
119

passes the flyover axial position (at 95 s and h = 1, 850 ft), the rate of the decrease in
CRP noise (0.7 PNdB/s on average) is significantly lower than the fan noise decrease
(1.2 PNdB/s on average). In contrast to a turbofan powered aircraft, the noise from a
CRP aircraft configuration will thus be perceived over longer time periods. This effect
is attributed to the differences in fan and CRP directivities. The shroud around the
fan causes the generated noise to decrease more rapidly once the aircraft has passed
the observer location.
As illustrated in Figure 6-2c, implementing source mitigation concepts resulted
in a substantial reduction in CRP noise along the entire trajectory relative to the
baseline CRP. The maximum perceived noise level was reduced by approximately
9 PNdB by minimizing the influence of the front-rotor tip-vortex interaction with the
rear rotor and reducing the strength of the wake and upstream influence interference
effects. The small local variations in CRP noise are attributed to the interference
effects caused by operating the rotors at unequal tip speeds. The engine core is the
same as in the baseline CRP case and the distributions of LPC, combustor, and LPT
noise do not change.
The CRP is still the dominating noise source but the overall noise signature is
now similar to the datum turbofan powered noise levels. This indicates that CRPs
can achieve acoustic performance levels of advanced turbofan powered aircraft by
addressing the strength of CRP tip-vortex, wake, and upstream influence interaction
effects.
The above observations are summarized in the effective perceived noise levels
provided in Figure 6-3. CRP noise is clearly the dominant noise source in the baseline
CRP configuration but by implementing noise reduction technologies, the CRP noise
was reduced by 10.2 EPNdB. Since the noise from the remaining engine sources is
significantly decreased due to the reduction in core size, the total noise generated by
the advanced design CRP was reduced relative the the datum turbofan configuration.
The total EPNL values are tabulated in Table 6.2. Relative to the datum turbofan
aircraft configuration, the total noise of the baseline CRP aircraft arrangement was
6.6 EPNdB higher. In the case of the advanced design CRP, implementing noise
120

fan/CRP LPC combustor LPT jet airframe total0
20
40
60
80
100
EP
NL
[EP
NdB
]
turbofan baseline CRP advanced design CRP
Student Version of MATLAB
Figure 6-3: EPNL breakdown at FAR 36 flyover receiver location
reduction technologies led to a significant reduction in total noise (−9.2 EPNdB).
Table 6.2: Total EPNL in EPNdB at FAR 36 flyover location
Datum Baseline AdvancedTurbofan CRP Design CRPAircraft Aircraft Aircraft
Estimated 87.6 94.2 85.0Stage 4 91.2 91.5 91.5
In addition to the computed noise levels, the stage 4 noise limits are provided in
Table 6.2. The limits are slightly higher for the CRP aircraft arrangements due to
their increased takeoff weights. Overall, the results suggest that the baseline CRP
powered aircraft does not reach the stage 4 noise limits by a considerable margin
(2.7 EPNdB). On the other hand, the advanced design CRP was found to meet the
stage 4 noise restriction with a margin of 6.5 EPNdB at the flyover observer location.
6.4 Sideline Noise Assessment
Fan and jet noise govern the noise signature of the datum turbofan powered aircraft
as illustrated in Figure 6-4a. The aircraft passes the axial location of the sideline
121

Table 6.3: Total EPNL in EPNdB at FAR 36 sideline location
Datum Baseline AdvancedTurbofan CRP Design CRPAircraft Aircraft Aircraft
Estimated 89.7 94.1 85.5Stage 4 96.6 96.8 96.8
observer at about 69 s and the fan noise increases significantly as the shielding by the
nacelle is reduced.
With a relatively small rotor-rotor spacing and unclipped rear rotor, the maximum
total noise level of the baseline CRP aircraft configuration increased by 6.5 PNdB
relative to the turbofan powered aircraft as displayed in Figure 6-4b. Regarding
acoustic performance, the baseline CRP powered aircraft is not competitive compared
with advanced turbofan aircraft arrangements.
As illustrated in Figure 6-4c, increasing the rotor-rotor spacing and clipping the
rear rotor led to noise reductions of up to 15 PNdB along the entire trajectory. The
results indicate that the combination of reducing the strength of the potential field
and viscous wake interactions and minimizing the tip-vortex interactions is a suitable
and effective approach to achieve significant noise reductions in CRP noise.
The above observations are again summarized in the EPNL breakdown provided
in Figure 6-5. The observed trends are similar to those at the flyover observer loca-
tion. Effectively implementing source mitigation technologies led to a reduction of
10.2 EPNdB and indicated the acoustic competitiveness of advanced CRP configura-
tions relative to high bypass ratio, low fan pressure ratio turbofans.
The acoustics benefits of the advanced CRP design are combined with a smaller
engine compared to the datum turbofan engine. At the sideline observer location, this
led to total noise level reduction of 4.2 EPNdB as tabulated in Table 6.3. The results
suggest that Stage 4 noise limits are met by all three configurations investigated.
The margin is smallest for the baseline CRP aircraft (2.7 EPNdB) and largest for the
advanced design CRP (11.3 EPNdB).
It is important to note the following assumptions used in the above analysis: the
122

50 60 70 80 90 10020
30
40
50
60
70
80
90
100
receiver time from start of T/O roll [s]
PN
LT [P
NdB
]
totalfanLPCcombustorLPTjetairframe
cutback
(a) Datum Turbofan
50 60 70 80 90 10020
30
40
50
60
70
80
90
100
receiver time from start of T/O roll [s]
PN
LT [P
NdB
]
totalCRPLPCcombustorLPTairframe
cutback
(b) Baseline CRP
50 60 70 80 90 10020
30
40
50
60
70
80
90
100
receiver time from start of T/O roll [s]
PN
LT [P
NdB
]
totalCRPLPCcombustorLPTairframe
cutback
(c) Advanced Design CRP
Figure 6-4: Tone-Corrected Perceived Noise Level at FAR 36 sideline receiver location
123

fan/CRP LPC combustor LPT jet airframe total0
20
40
60
80
100
EP
NL
[EP
NdB
]
turbofan baseline CRP advanced design CRP
Student Version of MATLAB
Figure 6-5: EPNL breakdown at FAR 36 sideline receiver location
fan noise estimation method might not be applicable to advanced fan designs thereby
overestimating the generated noise levels. Pylon and angle-of-attack effects are not
included in the CRP noise estimation which leads to an underestimation of the rotor-
alone tones.
In summary, minimizing the tip-vortex interaction and decreasing the strength
of potential field and viscous wake interactions by reducing the rear-rotor diameter,
increasing the rotor-rotor spacing demonstrated noise reductions of up to 15 PNdB,
resulting in an acoustic benefit of around 10 EPNdB at both flyover and sideline
observer locations. Given the above assumptions, these benefits indicate that the
advanced design CRP can meet Stage 4 noise restrictions. The advanced CRP is the
result of a first design iteration with the objective to reduce noise. A second design
iteration is needed to assess cruise performance and fuel burn levels.
124
Chapter 7
Summary and Conclusions
The noise assessment of counter-rotating propfan (CRP) configurations was presented
in this thesis to evaluate what levels of acoustic performance can be achieved with
advanced CRP designs. The main results of the work are summarized below.
7.1 Summary
Given a 3, 500 nm mission at cruise Mach number 0.78, a baseline aircraft seating 150
passengers was developed featuring an advanced turbofan design with a bypass ratio
of 8.9 and a fan pressure ratio of 1.49. Guided by data available in the literature,
a baseline CRP configuration was defined next. The CRP noise mechanisms were
dissected and quantified and it was determined that substantial noise reductions could
only be achieved by implementing source mitigation concepts targeting all of the noise
source mechanisms.
The baseline CRP was subsequently re-designed for reduced noise. The rotor-
rotor axial spacing was increased by 56 % and the rear rotor was clipped at 75 %
span. The front-rotor tip-vortex interaction with the rear rotor was consequently
minized and the strength of rear-rotor upstream influence and front-rotor viscous
wake interaction effects was decreased. Based on a vortex-lattice analysis, the thrust
level was maintained by increasing the rear rotor blade count and allowing differential
tip speeds. Relative to the baseline CRP, the acoustic assessment of the advanced
125
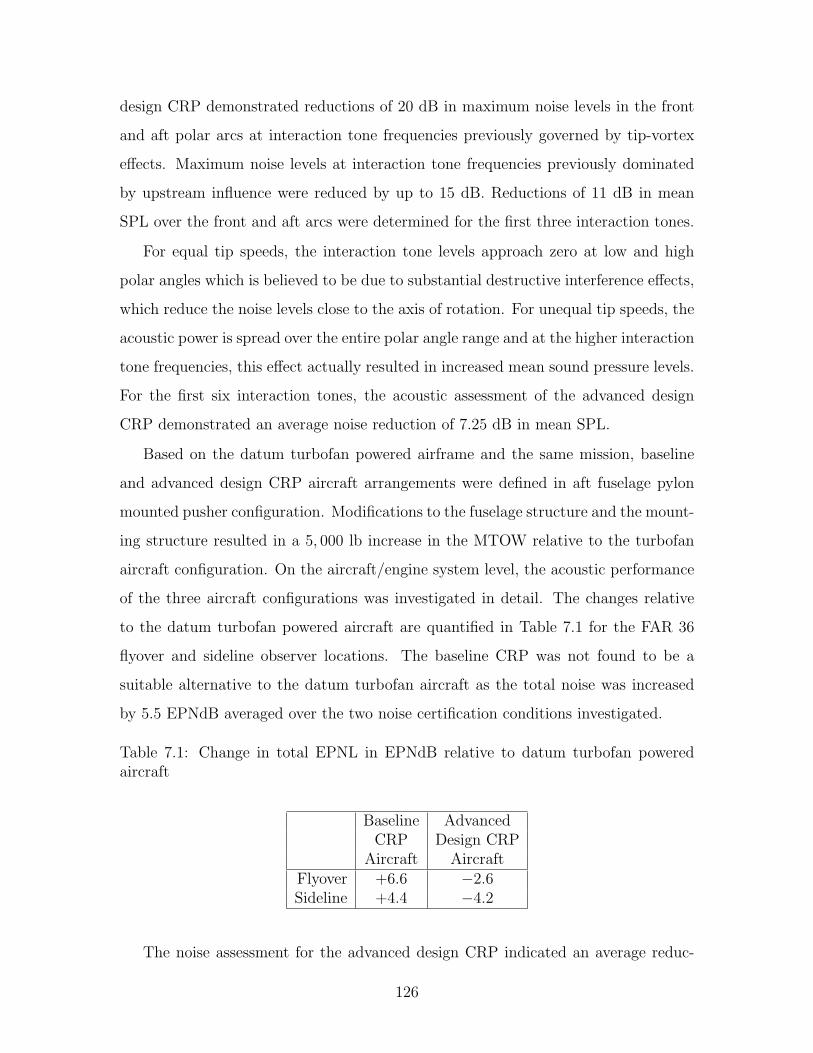
design CRP demonstrated reductions of 20 dB in maximum noise levels in the front
and aft polar arcs at interaction tone frequencies previously governed by tip-vortex
effects. Maximum noise levels at interaction tone frequencies previously dominated
by upstream influence were reduced by up to 15 dB. Reductions of 11 dB in mean
SPL over the front and aft arcs were determined for the first three interaction tones.
For equal tip speeds, the interaction tone levels approach zero at low and high
polar angles which is believed to be due to substantial destructive interference effects,
which reduce the noise levels close to the axis of rotation. For unequal tip speeds, the
acoustic power is spread over the entire polar angle range and at the higher interaction
tone frequencies, this effect actually resulted in increased mean sound pressure levels.
For the first six interaction tones, the acoustic assessment of the advanced design
CRP demonstrated an average noise reduction of 7.25 dB in mean SPL.
Based on the datum turbofan powered airframe and the same mission, baseline
and advanced design CRP aircraft arrangements were defined in aft fuselage pylon
mounted pusher configuration. Modifications to the fuselage structure and the mount-
ing structure resulted in a 5, 000 lb increase in the MTOW relative to the turbofan
aircraft configuration. On the aircraft/engine system level, the acoustic performance
of the three aircraft configurations was investigated in detail. The changes relative
to the datum turbofan powered aircraft are quantified in Table 7.1 for the FAR 36
flyover and sideline observer locations. The baseline CRP was not found to be a
suitable alternative to the datum turbofan aircraft as the total noise was increased
by 5.5 EPNdB averaged over the two noise certification conditions investigated.
Table 7.1: Change in total EPNL in EPNdB relative to datum turbofan poweredaircraft
Baseline AdvancedCRP Design CRP
Aircraft AircraftFlyover +6.6 −2.6Sideline +4.4 −4.2
The noise assessment for the advanced design CRP indicated an average reduc-
126

tion of 3.4 EPNdB relative to the datum turbofan aircraft. Increasing the rotor-rotor
spacing and reducing the rear-rotor diameter are demonstrated to be promising ap-
proaches towards the design of advanced CRPs for reduced noise. A detailed cruise
performance analysis of the advanced CRP is required in the future in order to ensure
the fuel burn competitiveness relative to advanced turbofans. In general, the results
suggest that Stage 4 noise limits can be met with advanced CRP designs provided
that tip-vortex, upstream influence, and viscous wake noise source mechanisms are
targeted by effectively implementing CRP noise reduction technologies.
7.2 Key Contributions
A multidisciplinary integrated acoustic and aerodynamic assessment capability was
established in order to investigate the fuel burn performance and noise challenges
associated with advanced propfan propulsion configurations on an aircraft/engine
system level. A key piece in the development of the methodology was to implement a
method to estimate CRP noise. To this end, a frequency domain approach based on
on the acoustic analogy and the extension of Hanson’s single rotor noise method [6]
to counter-rotating propfans was introduced and carefully validated. The CRP noise
estimation approach was coupled with high-fidelity full-wheel 3-D unsteady RANS
simulations to capture the underlying aerodynamic mechanisms responsible for CRP
interaction noise and to determine the time-varying blade surface pressures necessary
to define the acoustic source terms. The established method allows for parametric
studies and is capable of exploring noise reduction technologies.
Quantifying the relative importance of the CRP noise source mechanisms for the
baseline CRP demonstrated that all noise source mechanisms need to targeted in
order to achieve significant noise reductions. Minimizing the tip-vortex interaction
and reducing wake and upstream influence effects by increasing the axial spacing
between the rotors and decreasing the rear-rotor diameter yielded noise reductions
of 9.2 EPNdB and 8.6 EPNdB relative to the baseline CRP aircraft configuration at
the flyover and sideline observer locations, respectively. The acoustic assessment of
127
the advanced design CRP indicates that Stage 4 noise limits are met with a margin
of 8.9 EPNdB averaged over the flyover and sideline noise certification conditions.
7.3 Future Work
Further validation of the CRP noise estimation method should be conducted includ-
ing unequal tip speed conditions and simulations accounting for the presence of an
upstream pylon. In addition, the following recommendations for future work can be
made:
• Noise results for the CRP powered aircraft configurations should be obtained
at the approach condition using the CRP noise method in order to evaluate
whether the approach noise results agree with the trends observed at the FAR
36 flyover and sideline conditions.
• The unsteady blade surface pressures should be determined at additional op-
erating conditions along the takeoff trajectory to quantify the influence of in-
creased streamtube contraction on CRP interaction tone noise at speeds lower
than M = 0.25.
• The impact of non-uniform inflow on the CRP noise levels should be assessed.
The magnitude of the influence of angle-of-attack or upstream pylon effects on
CRP noise at the low-speed conditions during takeoff and approach should be
quantified.
• In the light of higher relative tip Mach numbers at cruise conditions, the influ-
ence of quadrupole noise source could be assessed and the competitiveness of
CRP designs regarding in-flight cabin noise should be evaluated.
• The aerodynamic performance of the CRP configurations should be assessed at
the cruise condition. The trade-offs between fuel burn and acoustic performance
should be further investigated and quantified.
128

Appendix A
Baseline Airframe Definition
Table A.1: Baseline airframe definition - wing and fuselage (in ft)
Wing FuselagePlanform area 1350.17 Length (overall) 127.10Exposed area 1072.28 Width (maximum) 13.00Trapezoid area 1169.67 Height (maximum) 14.00Wimpress area 1270.08Exp. trap. root chord 14.58 Nose length 16.49Sweep (outbd. qtr. chord) 24.00 Upsweep length 39.82Thickness/chord (avg.) 0.095 Upsweep height 14.63
Taper ratio (exp. trap) 0.337 Tail length 31.33Taper ratio (exposed) 0.247 Tail closure width 1.429Taper ratio (planform) 0.214 Tail closure height 1.429Dist. from nose. . . Tail-bulkhd. length 23.01
L.E./body junction 49.23 Main cabin length 90.00wing/body aero. ctr. 59.83 Tot. cab. floor area 1086.86Approx. overall C.G. 61.82 Tot. cab. lining area 2135.55
Unavail. belly length 79.71Geometric span 112.70 Belly x-sect. area 36.18Exposed span 99.70 Avail. belly volume 1714.20Structural span 121.13 Belly vol. efficiency 0.788Aspect ratio 10.00Outbd. fuel vol. (gallons) 4260.5Total. fuel vol. (gallons) 6144.0
129

Table A.2: Baseline airframe definition - horizontal and vertical tail (in ft)
Horizontal Tail Vertical TailHoriz. tail area 350.00 Vert. tail area 275.00Aspect ratio 4.50 Aspect ratio 1.80Sweep (qtr. chord) 30.00 Sweep (qtr. chord) 35.00
Span 39.69 Height 21.78Taper ratio 0.250 Taper ratio 0.300Centerline chord 14.11 Root chord (CXV) 19.02Dist. from nose. . . Dist. from nose. . .
L.E. root junct. 105.47 L.E. root junct. 97.80T.E. root junct. 119.58 T.E. root junct. 117.33T.E. tip 123.10 T.E. tip 122.81Aero. center 113.58 Aero. center 112.14
130

Appendix B
CRP Noise Code User Manual
The CRP noise estimation method described in Chapter 4 was implemented in a
Matlab code denoted CRPNEC. This appendix outlines the Matlab code to calcu-
late the noise spectrum of a CRP configuration at specified frequencies and observer
locations.
B.1 File Structure
The CRP noise estimation code consists of of five run scripts calling three functions.
An overview of the code structure is displayed in Figure B-1. The tasks performed
in each of the run scripts and functions are described in detail next.
CRPNEC main.m is the run script calling the functions to compute the acoustic source
terms from the geometry and and unsteady blade surface pressure data. In the
first part of the script, the input parameters for the CRP configuration (blade
count, diameter, rotor-rotor axial spacing), the flight and operating conditions
(ambient pressure and temperature, flight Mach number, and tip speeds) are
defined. In order to compute the acoustic source terms, the radial and chordwise
grid point counts of the mesh used in the CFD calculations are required. Finally,
the observer location needs to be specified in spherical coordinates relative to
the CRP position.
131
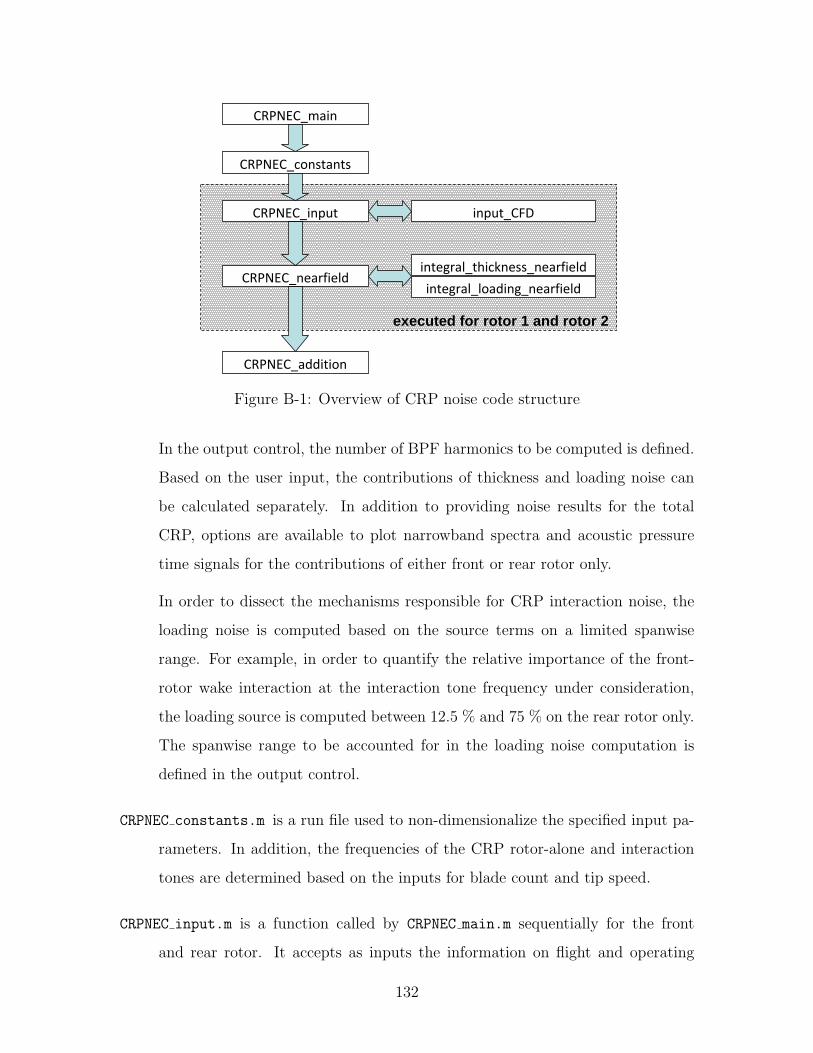
1
CRPNEC_main
CRPNEC_constants
CRPNEC_input input_CFD
CRPNEC_nearfieldintegral_thickness_nearfield
integral_loading_nearfield
CRPNEC_addition
executed for rotor 1 and rotor 2
Figure B-1: Overview of CRP noise code structure
In the output control, the number of BPF harmonics to be computed is defined.
Based on the user input, the contributions of thickness and loading noise can
be calculated separately. In addition to providing noise results for the total
CRP, options are available to plot narrowband spectra and acoustic pressure
time signals for the contributions of either front or rear rotor only.
In order to dissect the mechanisms responsible for CRP interaction noise, the
loading noise is computed based on the source terms on a limited spanwise
range. For example, in order to quantify the relative importance of the front-
rotor wake interaction at the interaction tone frequency under consideration,
the loading source is computed between 12.5 % and 75 % on the rear rotor only.
The spanwise range to be accounted for in the loading noise computation is
defined in the output control.
CRPNEC constants.m is a run file used to non-dimensionalize the specified input pa-
rameters. In addition, the frequencies of the CRP rotor-alone and interaction
tones are determined based on the inputs for blade count and tip speed.
CRPNEC input.m is a function called by CRPNEC main.m sequentially for the front
and rear rotor. It accepts as inputs the information on flight and operating
132
condition, and the data of CFD grid used to determine the time-dependent
blade surface pressures. Based on the rotor geometry and unsteady loading
data, it determines the source coordinates and the thickness and loading source
terms.
input CFD.m is a run file used to load the unsteady blade surface pressures. First, the
blade geometry and steady surface pressure information is read from external
data files in the subfolder full-wheel-loading for the pressure and suction
sides, respectively. The data files contain the coordinates (in m) and the steady
pressures as (p− p0) / (pt,0 − p0) for every grid point at constant radial sections
in chordwise direction from trailing edge to leading edge for the pressure side
and from leading edge to trailing edge for the suction side.
Similarly, the loading harmonics are read next from external data files listing
the coordinates and complex pressure harmonics for every grid point at con-
stant radial sections in chordwise direction. It should be noted that the loading
harmonics are required for each blade since they may differ from blade to blade
due to unequal tip speed or non-uniform inflow effects. The number of load-
ing harmonics considered in the determination of the acoustic source terms is
defined in CRPNEC main.m.
CRPNEC nearfield.m is a run file used to compute the thickness and loading noise
sound pressure levels at the CRP rotor-alone and interaction tone frequencies
for each rotor. The working equations implemented in the code are described
in Section 4.2. In addition, the thickness and loading acoustic pressure signals
are determined from the sound pressure level results.
integral thickness nearfield.m is a function called by CRPNEC nearfield.m for
the computation of the thickness noise integral from Equation 4.10. It accepts
the thickness source terms and the observer coordinates and outputs the solution
of the thickness integral for each grid point µ, ν.
integral loading nearfield.m is a function called by CRPNEC nearfield.m for the
133

computation of the loading noise integral from Equation 4.12. It accepts the
loading source terms and the observer coordinates and outputs the solution of
the loading integral for each grid point µ, ν.
CRPNEC addition.m is a run file used to superpose the noise fields from front and
rear rotor. It outputs and plots the total CRP noise in terms of narrowband
spectra and acoustic pressure signals. In addition, the front- and rear-rotor
contributions to the total CRP noise are dissected and quantified and the CRP
blade geometries are plotted.
Hanson’s notation is used for the variable names and references are made to the
equations presented in [6] wherever possible. The modifications required to extend
Hanson’s single rotor noise method to CRP configurations are clearly labeled in the
code.
134
Bibliography
[1] CFM International, “CFM56-7B Turbofan Engine Overview,”http://www.cfm56.com.
[2] T. Hannigan and H. Wainauski, “Wind Tunnel Results of Counter Rota-tion Prop-Fans Designed With Lifting Line and Euler Code Methods,” inAIAA/SAE/ASME/ASEE 27th Joint Propulsion Conference. AIAA 1991-2499,June 1991.
[3] R. Hager and D. Vrabel, “Advanced Turboprop Project,” NASA SP-495, Tech.Rep., 1988.
[4] W. Strack, G. Knip, A. Weisbrich, J. Godston, and E. Bradley, “Technology andBenefits of Aircraft Counter Rotation Propellers,” NASA TM-82983, Tech. Rep.,1982.
[5] J. Groeneweg and L. Bober, “NASA Advanced Propeller Research,” NASA TM-101361, Tech. Rep., 1988.
[6] D. B. Hanson and D. J. Parzych, “Theory for Noise of Propellers in AngularInflow with Parametric Studies and Experimental Verification,” NASA CR-4499,Tech. Rep., 1993.
[7] F. Metzger, “A Review of Propeller Noise Prediction Methodology: 1919-1994,”NASA CR-198156, Tech. Rep., 1995.
[8] D. Hanson, “Compressible Helicoidal Surface Theory for Propeller Aerodynamicsand Noise,” AIAA Journal, vol. 21, pp. 881–889, 1983.
[9] D. Hanson, “Noise of Counter-Rotation Propellers,” J. Aircraft, vol. 22, no. 7,pp. 609–617, 1985.
[10] A. Zachariadis and C. Hall, “Application of a Navier-Stokes Solver to the Studyof Open Rotor Aerodynamics,” in Proceedings of ASME Turbo Expo 2009.GT2009-59332, June 2009.
[11] C. Polacsek and R. Barrier, “Numerical Simulation of Counter-Rotating FanAeroacoustics,” in 13th AIAA/CEAS Aeroacoustics Conference. AIAA 2007-3680, May 2007.
135

[12] A. Stuermer and J. Yin, “Low-speed Aerodynamics and Aeroacoustics of CRORPropulsion Systems,” in 15th AIAA/CEAS Aeroacoustics Conference. AIAA2009-3134, May 2009.
[13] B. Magliozzi, D. Hanson, and R. Amiet, “Propeller and Propfan Noise,” inAeroacoustics of Flight Vehicles: Theory and Practice. Volume 1: Noise Sources.NASA, Langley Research Center, 1991, pp. 1–64.
[14] R. Majjigi, K. Uenishi, and P. Gliebe, “An Investigation of Counterrotating TipVortex Interaction,” NASA CR-185135, Tech. Rep., 1989.
[15] B. Janardan and P. Gliebe, “Acoustic Power Level Comparisons of Model-ScaleCounterrotating Unducted Fans,” in 29th Aerospace Sciences Meeting. AIAA1991-0595, January 1991.
[16] R. Woodward and C. Hughes, “Aeroacoustic Effects of Reduced Aft Tip Speed atConstant Thrust for a Model Counterrotation Turboprop at Takeoff Conditions,”in AlAA 13th Aeroacoustics Conference. AIAA 1990-3933, October 1990.
[17] R. Woodward and E. Gordon, “Noise of a Model Counterrotation Propellerwith Reduced Aft Rotor Diameter at Simulated Takeoff/Approach Conditions(F7/A3),” in AlAA 26th Aerospace Sciences Meeting. AIAA 1988-0263, January1988.
[18] J. Brookfield and I. Waitz, “Trailing-Edge Blowing for Reduction of Turboma-chinery Fan Noise,” J. Prop. Power, vol. 16, no. 1, pp. 57–64, 2000.
[19] R. Woodward, E. Fite, and G. Podboy, “Noise Benefits of Rotor Trailing EdgeBlowing for a Model Turbofan,” in 45th Aerospace Sciences Meeting and Exhibit.AIAA 2007-1241, January 2007.
[20] Federal Aviation Administration, “Federal Aviation Regulations Part 36 - NoiseStandards: Aircraft Type and Airworthiness Certification,” August 2002.
[21] Federal Aviation Administration, “Federal Aviation Regulations Part 25 - Air-worthiness Standards: Transport Category Airplanes,” August 2002.
[22] L. McCullers, “Aircraft Configuration Optimization Including Optimized FlightProfiles,” in Recent Experiences in Multidisciplinary Analysis and Optimization,Part 1. NASA, Langley Research Center, 1984.
[23] R. Feagin and W. Morrison, “Delta Method, An Empirical Drag Buildup Tech-nique,” NASA CR-151971, Tech. Rep., 1978.
[24] J. Kurzke, GasTurb 11 User Manual, 2007.
[25] M. Drela, RVL (Rotor Vortex Lattice) and RAXAN (Rotor Axisymmetric Anal-ysis) User Manuals, Massachusetts Institute of Technology, 2007.
136
[26] Numeca International, FINE/Turbo User Manual Version 8.2, Brussels, Bel-gium, 2009.
[27] A. March, “Influence of Low-Speed Aerodynamic Performance on Airport Com-munity Noise,” Master’s thesis, Massachusetts Institute of Technology, 2008.
[28] M. Fink, “Airframe Noise Prediction,” FAA-RD 77-29, Tech. Rep., 1977.
[29] M. Fink, “Aircraft Noise Prediction Program. Theoretical Manual,” NASA TM-83199 Part 2, Tech. Rep., 1982.
[30] ESDU, “Airframe Noise Prediction,” Item No. 90023, Tech. Rep., 1990.
[31] ESDU, “Prediction of Noise Generated by Fans and Compressors in Turbojetand Turbofan Engines,” Item No. 98008, Tech. Rep., 1998.
[32] M. Heidmann, “Interim Prediction Method for Fan and Compressor SourceNoise,” NASA TM X-71763, Tech. Rep., 1975.
[33] D. Dunn and N. Peart, “Aircraft Noise Source and Contour Estimation,” NASACR-114649, Tech. Rep., 1973.
[34] ESDU, “Prediction of Combustor Noise From Gas Turbine Engines,” Item No.05001, Tech. Rep., 2005.
[35] Society of Automotive Engineers, “Gas Turbine Jet Exhaust Noise Prediction,”ARP 876, Revision D, Tech. Rep., 1994.
[36] E. Krejsa and M. Valerino, “Interim Prediction Method for Turbine Noise,”NASA TM X-73566, Tech. Rep., 1976.
[37] K. Kontos, R. Kraft, and P. Gliebe, “Improved NASA-ANOPP Noise PredictionComputer Code for Advanced Subsonic Propulsion Systems. Volume 2: FanSuppression Model Development,” NASA CR-202309, Tech. Rep., 1996.
[38] J. Stone, E. Krejsa, and B. Clark, “Jet Noise Modeling for Coannular NozzlesIncluding the Effects of Chevrons ,” NASA CR-212522, Tech. Rep., 2003.
[39] ESDU, “Evaluation of the Attenuation of Sound by a Uniform Atmosphere,”Item No. 78002, Tech. Rep., 1977.
[40] ESDU, “The Correction of Measured Noise Spectra for the Effects of GroundReflection,” Item No. 94035, Tech. Rep., 1994.
[41] ESDU, “Estimation of Lateral Attenuation of Air-to-Ground Jet or TurbofanAircraft Noise in One-Third Octave Bands,” Item No. 82027, Tech. Rep., 1982.
[42] J. Roskam, “Component Weight Estimation,” in Airplane Design, 1989.
[43] J. Kerrebrock, Aircraft Engines and Gas Turbines, 2nd ed. The MIT Press,1992.
137
[44] ESDU, “An Introduction to Aircraft Noise,” Item No. 02020, Tech. Rep., 2002.
[45] I. Goldsmith, “A Study to Define the Research and Technology Requirements forAdvanced Turbo/Propfan Transport Aircraft,” NASA CR-166138, Tech. Rep.,1981.
[46] ESDU, “Noise Transmission into Aircraft Cabins,” Item No. 07001, Tech. Rep.,2007.
[47] D. Chapman, R. Fleury, and D. Smith, “Testing of the 578-DX Propfan Propul-sion System,” in AIAA/SAE/ASME/ASEE 25th Joint Propulsion Conference.AIAA 1989-2581, July 1989.
[48] F. Farassat, “Acoustic Analysis of Propfan,” NASA CR-162312, Tech. Rep.,1979.
[49] M. Goldstein, “Unified Approach to Aerodynamic Sound Generation in the Pres-ence of Solid Boundaries,” J. Acoustic Soc. Am., vol. 56, pp. 497–509, 1974.
[50] D. Hanson and M. Fink, “The Importance of Quadrupole Sources in Predictionof Transonic Tip Speed Propeller Noise,” J. Sound Vibrat., vol. 62, no. 1, pp.19–38, 1979.
[51] W. Briggs, V. Henson, and S. McCormick, “A Multigrid Tutorial,” SIAM, 2000.
[52] V. Kouznetsov, V. Ganabov, K. L., and S. Makashov, “Acoustic Characteris-tics of Propfans,” in 15th AIAA Aeroacoustics Conference. AIAA 1993-4444,October 1993.
[53] R. Woodward and I. Loeffler, “Inflight Source Noise of an Advanced Full-ScaleSingle Rotation Propeller,” in 29th Aerospace Sciences Meeting. AIAA 1991-0594, January 1991.
[54] R. Woodward, “Noise of Simulated Installed Model Counterrotation Propeller atAngle-of-Attack and Takeoff/Approach Conditions,” in AlAA 28th AerospanceSciences Meeting. AIAA 1990-0283, January 1990.
138