Osteoporosis Management: Translating Research Into Optimal Fracture Protection
1
UNIVERSITY OF MEDICINE AND PHARMACY CRAIOVA PhD SCHOOL
AASSSSEESSSSMMEENNTT OOFF OOSSTTEEOOPPOORROOSSIISS AANNDD FFRRAACCTTUURREE RRIISSKK IINN PPAATTIIEENNTTSS WWIITTHH RRHHEEUUMMAATTOOIIDD
AARRTTHHRRIITTIISS
-ABSTRACT-
Scientific coordinator, Prof. Univ. Dr. Paulina Ciurea
PhD student, Ioana Râcă
CRAIOVA 2012

2
CUPRINS
Backround............................................................................................................3
State of knowledge..............................................................................................4
Methods...............................................................................................................9
Results.................................................................................................................10
Conclusions ........................................................................................................21
Selected references ............................................................................................22
Key words Rheumatoid arthritis, osteoporosis, Tscore, vertebral fractures, FRAX

3
BACKROUND
Rheumatoid arthritis (RA) is an inflammatory disease, that can be defined not only by
its debilitating phenotype, but also by its major economic impact, that affects aproximatley
1% of the population worlwide. RA is responsible for hoints destructions with a high risk of
functional impairment and disability in advanced disease.
Osteoporosis is the main extra-articular involvment, marked by an increased fracturar
risk, especially in vertebral sites. The special attention paid to vertebral fractures is due to
their consequences, as chronic back pain, thoracic kyphosis, functional impairment and
disability.
Main risk factors associated with the risk of vertebral fractures in patients with RA are
age, disability, long standing disease,disease activity score and medication. Quantifying the
fracture risk becomes therefore esential in identifying the correct patient subset in whom the
correct therapeutical measures are highly needed.
The World Health Organization Fracture Risk assessment Tool (FRAX) has been
developed to estimate a 10-year absolute risk of sustaining a hip fracture and other major
osteoporotic fractures (spine, forearmm, hip, shoulder). FRAX has been used in the
osteoporosis guidelines of the National Osteoporosis Foundation and in recent
recomendations for glucocorticoid-induced osteoporosis by the Amercian College of
Rheumatology.
The assessment of osteoporosis, fracturar risk, the incidence of vertebral fractures and
their relationship with the disease activity score and functional impairment contributes to a
correct preventive therapeutical and diagnostic aproach. Due to the high personal and societal
costs of osteoporosis, the condition remains a challenge to both public health and physicians.
4
STATE OF KNOWLEDGE
Osteoporosis-deffinition, classification
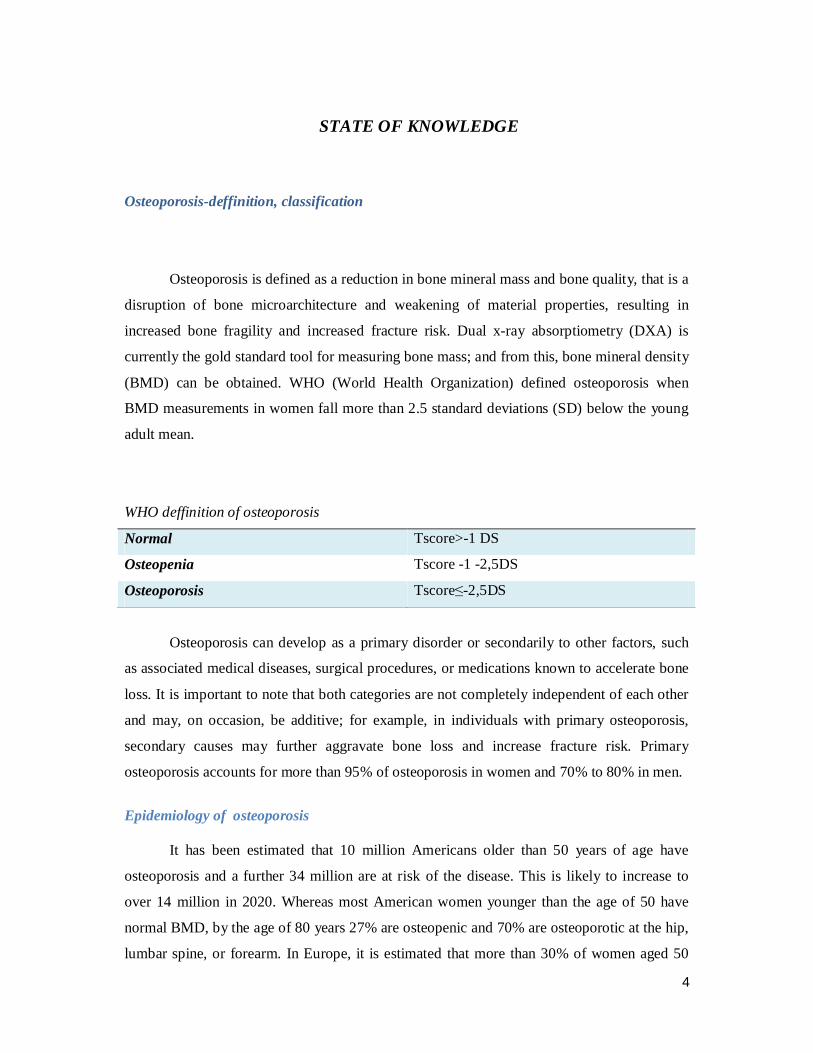
Osteoporosis is defined as a reduction in bone mineral mass and bone quality, that is a
disruption of bone microarchitecture and weakening of material properties, resulting in
increased bone fragility and increased fracture risk. Dual x-ray absorptiometry (DXA) is
currently the gold standard tool for measuring bone mass; and from this, bone mineral density
(BMD) can be obtained. WHO (World Health Organization) defined osteoporosis when
BMD measurements in women fall more than 2.5 standard deviations (SD) below the young
adult mean.
WHO deffinition of osteoporosis
Normal Tscore>-1 DS
Osteopenia Tscore -1 -2,5DS
Osteoporosis Tscore≤-2,5DS
Osteoporosis can develop as a primary disorder or secondarily to other factors, such
as associated medical diseases, surgical procedures, or medications known to accelerate bone
loss. It is important to note that both categories are not completely independent of each other
and may, on occasion, be additive; for example, in individuals with primary osteoporosis,
secondary causes may further aggravate bone loss and increase fracture risk. Primary
osteoporosis accounts for more than 95% of osteoporosis in women and 70% to 80% in men.
Epidemiology of osteoporosis
It has been estimated that 10 million Americans older than 50 years of age have
osteoporosis and a further 34 million are at risk of the disease. This is likely to increase to
over 14 million in 2020. Whereas most American women younger than the age of 50 have
normal BMD, by the age of 80 years 27% are osteopenic and 70% are osteoporotic at the hip,
lumbar spine, or forearm. In Europe, it is estimated that more than 30% of women aged 50
5
years or older have osteoporosis as defined by WHO criteria, with lifetime fracture incidence
rates in these women of 14%, 11% and 13% for hip, vertbral and distal forearm. The number
of osteoporotic fractures in Europe in 2000 was estimated at 3.79 milion. Osteoporosis cand
develop undetected until a fracture occurs. Any bone can be affected, but fractures of the hip
and spine are of special concern; hip fractures because they are nearly always result in
hospitalization and major surgery, leading to impaired mobility that can be prolonged or
permanent, an may even result in death, while vertebral fractures can lead to loss of wight,
severe back pain and deformity and are also associated with increased mortality.
Bone remodeling
Bone remodeling describes the process by which the resorption of old bone is
continuously replaced by the formation of new bone. The balance between the volume of
bone replaced during formation relative to that removed during resorption, when integrated
over a number of remodeling cycles, determines whether there is net loss or gain of bone
tissue at a particular skeletal site. Bone remodeling is accomplished by the osteoclasts and
osteoblasts, together with various accessory cell types, which in combination are referred to
as bone remodeling units (BRUs).
The first event in the cycle is activation. This occurs about 360 times an hour in the
normal adult. During activation, mononuclear osteoclast precursors, derived from circulating
monocytes or bone marrow macrophage precursors, meet on the bone surface and fuse to
form multinucleated osteoclasts. It is not clear why certain pieces of bone are “targeted” for
remodeling, but one hypothesis is that this is under the control of signaling from osteocytes.
The formation, activation, and activity of osteoclasts are all regulated by local cytokines such
as receptor activator of nuclear factor-κB ligand (RANKL), interleukins-1 and -6 (IL-1 and
IL-6), colony-stimulating factors (CSFs), and systemic hormones such as PTH, 1,25-
dihydroxyvitamin D3, and calcitonin. However, the ultimate regulation of osteoclastic
resorption is achieved by signaling through RANK, the cognate receptor for RANKL, which
is a member of the family of tumor necrosis factor ligands expressed on marrow stromal cells
and osteoblasts. The RANKL/RANK interaction promotes the differentiation of osteoclast
precursors and increases the activity and lifespan of mature osteoclasts. Osteoprotegerin
(OPG), a member of the superfamily of tumor necrosis factor receptors, is a decoy receptor
for RANKL. The binding of RANKL to OPG results in inhibition of the differentiation and
activity of osteoclasts.

6
The resorption phase is followed by the reversal phase. The osteoclasts and
mononucleated resorbing cells die by apoptosis and are replaced by osteoblasts as the cycle
progresses into the formation phase. Squads of osteoblasts track after osteoclasts as they
traverse the bone surface or tunnel through the cortex. On the bone surfaces, they refill the
trench with a new unit of lamellar bone, which is referred to as an osteon or, more commonly,
a packet.Within the cortex, the osteoblasts have to refill a tunnel and they do this by
depositing concentric lamellae, starting on the wall of the tunnel and working inward. As a
result, cross sections of cortical osteons, or haversian systems, are reminiscent of a cross
section of a tree trunk. During the formation phase of the remodeling cycle, osteoblasts are
buried in the matrix, becoming osteocytes. Although incarcerated in the matrix, the
osteocytes maintain intimate contact with one another, as well as with the cells on the bone
surface, by means of gap junctions between the cytoplasmic processes that extend through
canaliculi.
Clinical Presentation of Fractures
Fractures are the expression of failure of bone to resist fracturing, but the clinical
presentation differs between fractures.
Non-spine fractures: Almost all non-spine fractures are the result of trauma and are
easy to diagnose clinically. Fractures of long bones commonly result in acute pain with one
or more clinical signs of fracture (swelling, hematoma, deformation, local crepitations,
localized pain on pressure) and are easily confirmed radiographically.
In contrast to non-spine fractures, the clinical presentation of vertebral fractures is
variable. Radiographically evident vertebral fractures are the most common fractures in
women and men,but most morphometric vertebral fractures do not present as the acute signs
and symptoms of a fracture, are not the result of an overt trauma, and are therefore clinically
underdiagnosed. Of radiographically evident vertebral fractures only about one third are
diagnosed clinically. The reasons for the low rate of diagnosis are not fully understood but
may be related to the variable degree of preceding trauma, the variable degree of pain
intensity and duration,and the frequency of other causes of back pain in the population.
The prevalence of radiographic vertebral diformity increases with age; for example in
Europe the prevalence rises from 11.5% in women aged 50-54 years to 34.8% in women aged
75-79 years. Vertebral fractures most commonly occur at the jonction of the thoracic and

7
lumbar spines, and in the mid –thoracic area (T12-L1), and are associated with back pain,
kyphosis, and excess mortality.
Diagnosis of osteoporosis Dual-X-Ray absorbtiometry Investigation of bone quality has provided insight into the pathogenesis of
osteoporosis and a better understanding of the mechanism of action of medications used to
treat osteoporosis, but with the exception of bone turnover markers it is not yet possible to
measure these routinely in clinical practice. Microtomography (MICRO CT) and magnetic
resonance (MR) techniques that can discern individual trabeculae are being developed
commercially and may be available for clinical use in the next few years. For now, in the
absence of a fragility fracture, bone density is the best predictor of fracture risk.BMD testing
is a widely available clinical tool to diagnose osteoporosis. Dual-energy x-ray absorptiometry
(DXA) is used to diagnose osteoporosis or low bone mineral density (BMD), estimate the
future risk of fracture, and monitor changes in BMD over time.
A typical dual-energy x-ray absorptiometry (DXA) instrument consists of a padded
table on which the patient lies and a movable C-arm with an x-ray tube below the patient and
a detector above the patient. The x-ray tube generates photon beams of two different energy
levels, thus the term "dual-energy." A collimator below the table limits the scatter of the
photons and directs them toward the area of interest. Radiation exposure to the patient is very
small, usually of a similar magnitude to daily background radiation. Radiation scatter beyond
the edge of the DXA table is negligible. No shielding of the technologist or the room is
necessary. As a safety precaution, the technologist should typically not sit within three feet of
the table edge while the patient is being scanned.DXA measures bone mineral content (BMC,
in grams) and bone area (BA, in square centimeters), then calculates "areal" BMD in g/cm2
by dividing BMC by BA. T-score, the value used for diagnosis of osteoporosis, is calculated
by subtracting the mean BMD of a young-adult reference population from the patient's BMD
and dividing by the standard deviation (SD) of young-adult population. Z-score, used to
compare the patient's BMD to a population of peers, is calculated by subtracting the mean
BMD of an age-, ethnicity-, and sex-matched reference population from the patient's BMD
and dividing by the SD of the reference population. The mean BMD and SD of the reference
populations used for these calculations is a critical variable in the determination of T-scores
and Z-scores.

8
Recommendations by expert groups — In the United States and Canada, the
majority of groups recommend BMD assessment in postmenopausal women 65 years and
older regardless of risk factors. BMD screening recommendations for men and for women
younger than 65 years vary The United States Preventive Services Task Force (USPSTF)
found insufficient evidence to make a recommendation for screening men. The USPSTF
recommends BMD screening in women younger than 65 years whose fracture risk is equal to
or greater than that of a 65-year-old white woman who has no additional risk factors for
fracture. The USPSTF used the World Health Organization Fracture Risk Assessment
(FRAX) algorithm to select a threshold above which bone density testing is recommended.
Although this approach to bone density screening may have merit, the selected threshold (9.3
percent) was not subject to cost-effectiveness analysis nor validated in any patient population.
Other groups, such as the National Osteoporosis Foundation (NOF), the International Society
for Clinical Densitometry (ISCD), and the Endocrine Society, recommend BMD testing for
all men older than 70 years, and in men and women 50 to 70 years when risk factors are
present. The Canadian Osteoporosis Society recommends testing in men and women 50 to 64
years with clinical risk factors for fracture , whereas the American College of Physicians
recommends measurement of BMD in men who are at increased risk for osteoporosis
(including men >70 years of age) and are candidates for drug therapy.
In contrast, some European groups recommend BMD screening based upon risk
stratification, ie, the decision to measure BMD is based upon age-specific fracture probability
thresholds calculated using FRAX (without BMD information) or other risk assessment tool.
Only women and men with a fracture probability near an intervention threshold, in whom the
selective addition of BMD testing may result in intervention, are referred for BMD testing.
Radiological assessment of osteoporosis A number of semiquantitative methods for assessing vertebral fractures have been
developed, but only the genant method has been extensivly used in clinical drug trials and
epidemiological studies. In the Genant method, the severity of the fracture is assessed by
visual determination, wich involves determining the extent of the vertebral height reduction
and morphological changes, and differentiating the fracture from other non-fracture
deformities. Grades are assigned to each vertebra based on the approximate degree of height
reduction. This method does not link the type of deformity with the garding of the fracture.
The site used by this method is T4-L4.

9
METHODS
The aim of the study was defined by the assessment of osteoporosis and fracturar risk
in patients with rheumatoid arthritis and the relationship with the disease activity score and
functional impairment.
The objectives of the study are:
Evaluation of osteoporosis
Assessment of fracturar risk using FRAX algorithm
Assessment of disease activity score-DAS284v
Assessment of functional impairment-HAQ
Establishing the correlation of DAS284v with the presence of osteoporosis
Establishing the correlation of DAS284v with the fracturar risk
Establishing the correlations of HAQ with the presence of osteoporosis ant the
fractrar risk
Assessment of vertebral fractures and their correlation with the disease activity
score and functional impairment
The study was observational, prospective, using a number of 125 patients with RA,
diagnosed by ACRA chriteria, hospitalized in rheumatology clinic, Emergency County
Hospital Craiova, between october 2009-august 2010. We recorded the demographic and
characteristics. The intensity of the pain was assessed using the analog visual scale-VAS
form 0 to 100mm. Diseas activity was established using DAS score with 4 variables, with 28
joints. The functional impairment was assessed using HAQ score.
Bone mineral density was determined using DXA with a DPX-Alpha (Lunar-General
Electric) system and bone mass was estimated using Tscore.
Fracturar risk was assessed using FRAX algorithm, that identifies patients with a low
fracturar risk (<10%), moderate (10-20%) or high (>20%). Vertebral fractures were obtained
and classified using the Genant method.
Descriptive analysis according to different parameters, graphic representation and
Pearson correlation coefficient was perfomed usic GraphPad Prism 5.5.

10
RESULTS
Demographic
Most of the subjects (115; 92%) were female, with a sex ratio of 11.5; and the mean
age was 56.75 years (SD 7.69; CI 95% 55.39-58.11; median 56; min 42, max79). There were
no significant differences between the mean age in females (56.72±7.71years) or males
(57.10±7.91 years), p=0.88.
The mean weight was 67.72kg (SD 12.80; CI95% 65.55-70.08; median 67; limits 42-
105), the mean height 162.3cm (SD 6.54; CI 95% 161.1-163.4; median 162; limitS 149-181)
and the mean BMI 26.03 kg/m2 (SD 4.97; CI95% 25.15-26.91; median 26.10; limits 17-43),
results that show that this item is not a significant variable in our group of study.
Rgarding the smoking status, 40 patients are current smokers (32%), 15 patients
smoked in the past (12%) and 70 never smoked. Smoking negatively influences the bone
metabolism by a direct effect on osteoblasts, a premature menopause, a low calcium
absoption and accelerates estrogen metabolism. Smokin women have a low BMD, a high loss
of bone loss and an age of menopause with 2 years lower than the non-smoking ones.
Analysing the personal physiological history we identified a mean age of menopause
of 45.81 ani (SD 3.04; CI95% 45.23-46.40; median 46; limits 34-51). The mean duration of
menopause was 12.67 years (SD 8.55; CI95% 11.05-14.29; median 10; limits 0-35). The
results of previous studies showed that the bone loss starts before menopause, is increased in
the first 3-5 years and continues for the rest of the life.
Assessment of the inflammatory profile
In order to establish the inflammatory status we assessed the value of ESR, CRP and
fibrinogen.
The assessment of ESR, as one of the most sensitive and accesible inflammatory
markers showed a mean value of 27.85 mm (DS 17.02; IC 95% 24.85-30.85; median 22.50;
limits 6-75). 103 of the patients had a value over the normal. The mean value of CRP was
2.90mg/dl (DS 3.78; IC 95% 2.23-3.57; mediana 0.80; limits 0.20-12.70), with 91 (72.8%)
cases over the superior limit.

11
Assessment of the imunological profile
Rheumatoid factor is the most used marker in the diagnosis of RA, included in the
ACR chriteria, although is accepted the fact that has a low specificity and can be absent
mostly in the first 12 month of the disease. The mean value was 27.57UI/ml (DS 26.90; IC
95% 22.90-32.24; median 18; limits 6-128). The seropositivity was identified in 93 cases
included in the study group.
Anti-CCP antibodies have a high specificity (>95) and sensibility (80%) for
rheumatoid arthritis and are an useful marker for an early diagnostic. The mean value was
23.49 U/ml (DS 37.22; IC95% 16.90-30.07; median 11.20; limits 2.20-320), with 61 patients
having a positive value.
Assessment of disease activity score and the functional impairment
The mean value of DAS284v scores was de 4.78 (DS 1.028; median 4.70; minim
2.930, max 7.690; 95% IC 4.606-4.970) and the mean value of HAQ was 1.77 (DS 0.71;
median 1.75; min 0.63, max 3; 95% IC 1.648-1.903).
Assessment of osteoporosis
Bone mineral density was assessed both for lumbar spine and total hip and the bone
mass was quantified by T score. For 21.6% (27) cases, we identified a Tscore coresponding
to osteoporosis in both sites, for 38.5% (48) of the patients a Tscore under -2.5DS and for
32% (40%) osteopenia. The mean value of T score in lumbar spine was -1.63±1.31 (DS 1.05;
IC 95% -1.86-1.49) and for total hip 1.49±1.18 (DS 1.08 ; IC 95% -1.74 -1.36).
The mean values of Tscore in lumbar spine and total hip
N Mean 95% IC SD Median Min Max
T score L 125 -1.63 -1.85-1.48
1.31 -1.80 -3.93 1
T score hip 125 -1.49 -1.68-1.27
1.18 -1.64 -3.85 1.42
There were significant differences between the patients with osteoporosis and
osteopenia. Analysing the inflammatory status the differences were statistically significant
(ESR 37.52±2.74mm vs 21.78±1.85mm, p<0.0001; CRP: 4.06±0.60mg/dl vs 1.74±0.49,

12
p=0.0006; fibrinogen 395.2±14.41mg/dl vs 309±15.16mg/dl, p<0.001); the same results were
obtained for disease activity (DAS284v 5.59±0.12 vs 4.47±0.10, p<0.001) and functional
impairment (HAQ 2.33±0.54 vs 1.42±0.53, p=0.003).
The glucocortioid therapy, with an important role for the bone mineral density, was
identified in the history of 102 cases (81.6%). 59(47.2%) patients used GC therapy in the
moment of the inclusion and 68 patients had a GC therapy for more than 12 months (54.4%).
From the 102 cases with a history of GC therapy, 45 (41.11%) have a Tscore
coresponding to osteoporosis and 40 (16.66%) osteopenia. In patients with osteoporosis, GC
therapy was identified in the history for 46 patients, 40 have this therapy in the moment of
inclusion and 44 used GC for more than 12 months. In patients with osteopenia we identified
GC in the history for 77.5%, 30% use GC in the moment of inclusion and 42.5% used GC for
more than 12 months.
Regarding the disease activity score and Tscore, we established significant differences
between patients with a high activity disease (T score L -2.41, T total hip -2.31), compared
with the ones with a moderate disease activity (T score L -1.30, DS , T score șold total -1.11).
.
Mean value of Tscore-function of DAS
Tscore L Tscore total hip N Mean IC
95% DS Med Min Max Mean IC
95% DS Med Min Max
DAS<3.2 3 0.37 -0.68-
2.17
0.66 0.35 -0.2 1 0.56 -0.80-
1.72
0.79 0.45 -0.25 1.2
3.2≤DAS≤5.1
76 -1.30 -1.15-
1.09
0.90 -1.3 -3.2 1 -1.11 -1.33-
0.88
0.99 -1.09 -3.50 1.42
DAS>5.1 46 -2.41 -2.61-
2.17
0.79 -2.35 -3.9 -0.32 -2.31 -2.54-
2.08
0.78 -2.50 -3.85 -0.21
Assessment of fracturar risk
In order to assess the fracture risk we used the FRAX algorithm that showed a risk for
a hip fracture of 4.71±6.03% (min 0, max37%) and 11.96±8.18% (min 1.7%, max 46%) for a
major osteoporotic fracture.

13
Mean value of FRAX Mean IC 95% DS Median Min Max
FRAX-major osteoporotic fracture
(%)
11.96 10.51-13.41 8.18 9 1.7 46
FRAX-hip (%) 4.71 3.65-5.78 6.03 2.3 0 37
Rheumatoid arthritis is an independent risk factor in FRAX algorithm and the
presence of vertebral fractures in this condition was established in the most recent
study,cconducted by Solomon HD et al, that included over 45000 subjects selected form the
data base HealtCore Integrated form United States, with a history of RA and fractures. Using
FRAX, we showed a high fracturar risk both for total hip and for a major osteoporotic
fracture.
Fracturar risk and DAS284v FRAX hip FRAX –major osteoporotic fracture
N Mean IC
95%
DS Med Min Max Mean IC
95%
DS Med Min Max
DAS<3.2 3 0.3 0.3-0.9 0.42 0.15 0 0.9 3.5 0.27-6.8
2.05 2.85 2 6.5
3.2≤DAS≤5.1
76 2.69 1.79-3.59
3.94 1.45 0 24 9.5 8.07-10.94
6.27 7.6 1.7 35
DAS>5.1 46 8.34 6.18-10.01
7.29 6.2 0.2 37 16.53 13.83-19.23
9.10 14.5 4.5 46
DAS284v
FRAX >20
FRAX 10-2
0
FRAX<10
0
2
4
6
8
10
HAQ
FRAX <10
FRAX 10-20
FRAX >20
0
1
2
3
4

14
Disease activity score, functional impairment and the major osteoporotic risk Analysing the GC therapy and its impact on the fracturar risk we established:
GC therapy and FRAX-major osteoporotci fracture N FRAX<10
N=67 N(%)
FRAX 10-20 N=39 N (%)
FRAX>20 N=18 N (%)
GC 102 46 (67.16)
38 (97.43)
18 (100)
GC
in present
62 18 (26.86)
28 (71.79)
16 (88.88)
GC>12 months
68 42 (61.76)
31 (79.48)
17 (94.43)
Fracture history and FRAX-major osteoporotic farcture
N FRAX<10 N=67 N(%)
FRAX 10-20 N=39 N (%)
FRAX>20 N=18 N (%)
Parental fractures
9 2 (2.98) 2 (5.12) 5 (27.77)
Fractures in hsitory
29 5 (7.46) 12 (30.76)
12 (66.66)
Analysing the risk for a hip fracture, the disease activity score and the functional
impairment had different values.
DAS284v
FRAX<10%
FRAX 10-20
%
FRAX>20%
0
2
4
6
8
10HAQ
FRAX S<10%
FRAX S 10-20
%
FRAX S>20%
0
1
2
3
4
DAS284v/HAQ and FRAX-total hip
15
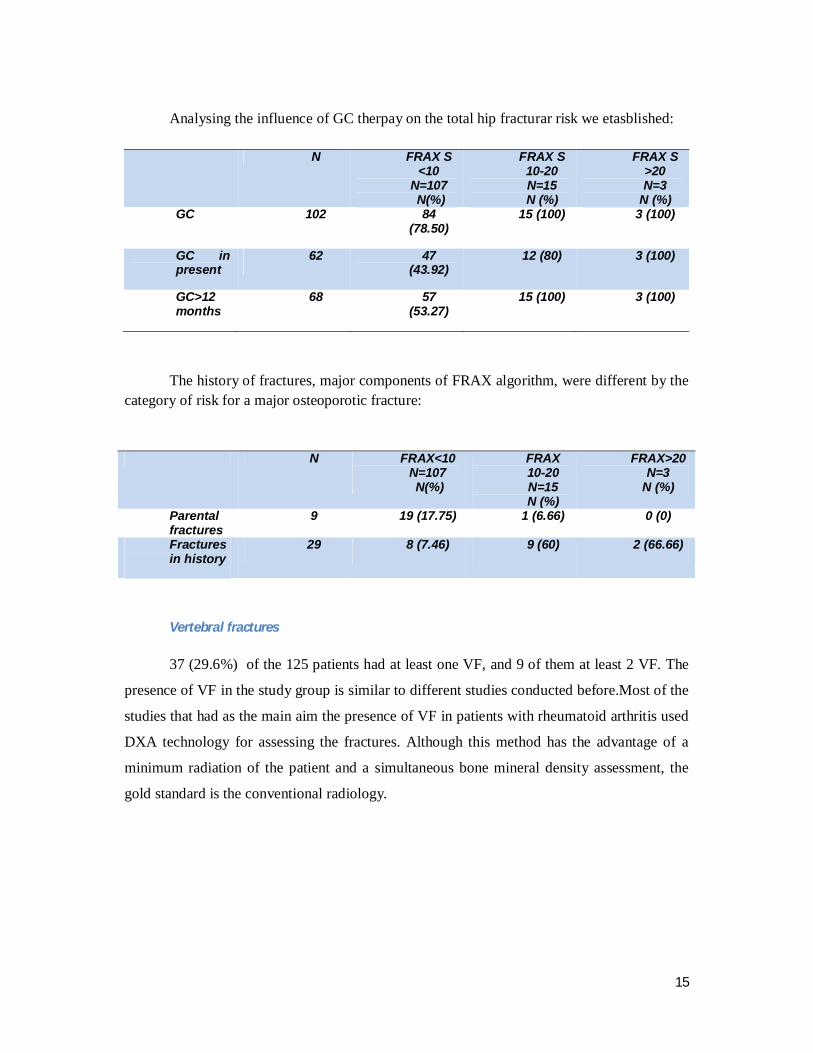
Analysing the influence of GC therpay on the total hip fracturar risk we etasblished:
N FRAX S
<10 N=107 N(%)
FRAX S 10-20 N=15 N (%)
FRAX S >20 N=3
N (%) GC 102 84
(78.50) 15 (100) 3 (100)
GC in present
62 47 (43.92)
12 (80) 3 (100)
GC>12 months
68 57 (53.27)
15 (100) 3 (100)
The history of fractures, major components of FRAX algorithm, were different by the
category of risk for a major osteoporotic fracture:
N FRAX<10
N=107 N(%)
FRAX 10-20 N=15 N (%)
FRAX>20 N=3
N (%)
Parental fractures
9 19 (17.75) 1 (6.66) 0 (0)
Fractures in history
29 8 (7.46) 9 (60) 2 (66.66)
Vertebral fractures
37 (29.6%) of the 125 patients had at least one VF, and 9 of them at least 2 VF. The
presence of VF in the study group is similar to different studies conducted before.Most of the
studies that had as the main aim the presence of VF in patients with rheumatoid arthritis used
DXA technology for assessing the fractures. Although this method has the advantage of a
minimum radiation of the patient and a simultaneous bone mineral density assessment, the
gold standard is the conventional radiology.

16
General characteristics of the patients with/without VF FV+, n=37 FV-, n=88 p
Age, mean (DS), years 58.11 (8.29) 56.24 (7.34) 0.208 Height, mean (DS), cm 160.8 (7.12) 162.8 (6.12) 0.12 Weight, mean(DS),kg 60.82 (11.89) 70.53 (12.19) <0.0001 BMI, mean(DS),kg/m2 23.84 (3.85) 0.0002
Disease duration, mean (DS),years
9.32 (3.87) 4.57 (2.58) <0.0001
FR positive, n (%) 34 (91.89%) 90 (90.90%) 0.005 CCP positive, n (%) 31 (83.78%) 71 (80.68%) 0.006 ESR, mean(DS), mm 39.4 (17.81) 23.48 (14.63) <0.0001
CRP, mean(DS),mg/dl 17.08 (13.62) 12.10 (12.77) 0.05 NAD, n 11.66 (3.4) 8.53 (2.54) <0.0001 NAT, n 3.27 (2.99) 1.18 (1.64) <0.0001
VAS, media (DS), mm 58.42 (12.85) 43.60 (12.55) <0.0001 DAS284v, media (DS) 5.57 (0.88) 4.46 (0.96) <0.0001
HAQ, mean (DS) 2.33 (0.56) 1.54 (0.64) <0.001 Tscore L, mean(DS) -2.51 (0.75) -1.32 (0.94) <0.0001
T score total hip, mean (DS)
-2.48 (0.69) -1.17 (0.97) <0.0001
FRAX hip, mean (DS) 9.6 (8.19) 2.74 (3.20) <0.0001 FRAX, mean (DS) 18.65 (9.85) 9.21 (5.31) <0.0001
Osteoporosis, n (%) 34 (91.89) 15 (17.04) <0.0001 GC in present, n(%) 33 (89.18) 30 (34.09) <0.0001 GC >12 month, n (%) 35 (94.59) 34 (38.63) <0.0001
GC, n (%) 36 (97.29) 67 (76.13) <0.0001
GC therapy, an important risk factor for bone loss and therefore for fracturar risk and
vertebral fractures, was present in the history of the patients with VF: 94.59% of the 37
patients with one VF had a GC therapy for more than 12 months, 89.18% have this treatment
in present and 97.29% in history.
Regarding the site of the fractures, we found 9 in each of T10, T12 și L1, 6 in T11 and
L2 and one in T8 and T9. Most of them-67.56% (25) were grade 1. The results are similar to
those established by two recent studies, one of them by Ghzlani et al, in 2010, that included
172 subjects, and the second one by Kvien TK et al, that enroled 229 patients.
Vertebral fractures by site and grade

17
From the 48 patients with osteoporosis, 29 had VF compared with 4 pateints from the
40 ones with osteopenia. The relative risk of the patients with osteoporosis, for developing a
VF was 6.64 (IC 95% 2.53-7.39) .
The prevalence of VF-Tscore
Regarding the disease activity score, from the 46 patients with a high activity disease,
54%(25) had at least one fracture, significantly different from the ones with a moderate
disease activity (15.78%).
DAS FV-
DAS FV +
0
2
4
6
8
10 p<0.0001
HAQ FV-
HAQ FV+0
1
2
3
4
The mean value of DAS284v/HAQ in patients with/without FV
Correlations between osteoporosis, fracturar risk and disease activity score
Analysing the correlation between DAS284v and Tscore L/total hip established a
strong correlation of the variables, with a coefficient of correlation of -0.67 for Tscore L and -
0.61 for T score in total hip, results sustained by linear regression, r2 =0.45 and 0.37.

18
DAS
2 4 6 8 10
-6
-4
-2
0
2
Tsco
reL
DAS
2 4 6 8 10
-6
-4
-2
0
2
Tsco
re s
old
tota
l
The regression line for T scoreL/total hip-DAS284v
The correlation of disease activity score and the risk of a major osteoporotic fracture
in the next 10 years was moderate, with a correlation coefficient of 0.459 (IC95% 0.308-0.587, p<0.0001), results shwed by linear regression too, r2 =0.21, and the risk for a hip fracture corelated also moderate, r=0.451 (IC95% 0.299-0.588, p<0.0001) r2 =0.20.
2 4 6 8 10-10
0
10
20
30
40
DAS
FRA
X S
0 2 4 6 8 100
10
20
30
40
50
DAS28 (4v)
FRAX
The regresion line of FRAX hip/major osteoporotci fracture -DAS284v RA is an independent risk factor in FRAX algorithm, the association of a fragility
fracture being exposed in a recent study, conducted by Solomon et al, that included over
45000 patients selected from the HealthCore Integrated database, in United States, with a
history of fracture and AR. Using FRAX algorithm we identified a high fracturar risk both for
a hip and for a major osteoporotic fracture in the next 10 years.
Correlations between osteoporosis, fracturar risk and HAQ The mean value of HAQ was 1.77 (DS 0.71; median 1.75; min 0.63, max 3; 95% IC
1.648-1.903). There were significant differences between patients with a low risk, a moderate one and a high risk of fracture.

19
Fracturar risk and HAQ HAQ FRAX<10
N=67
FRAX10-20%
N=39
FRAX>20%
N=18
Mean 1.494
1.998 2.387
DS 0.6566 0.6574
0.530
Min 0.63 0.63 1
Max 2.88 3 2.880
Median 1.350
2.130 2.500
IC 95% 1.334- 1.654
1.785- 2.211
2.123- 2.650
Analysing HAQ and BMD showed significant differences between the groups:.
The correlation of HAQ with the fracturar risk FRAX hip FRAX Tscore L Tscore hip coefficient of correlation
0.4831
0.4921
-0.7238
-0.5984
IC 95% 0.336- 0.607
0.3464 – 0.6147
-0.7980- -0.6280
-0.7005- -0.4725
R2 0.2334
0.2422
0.5239
0.3581
p < 0.0001
< 0.0001
< 0.0001
< 0.0001
HAQ
1 2 3 4-10
0
10
20
30
40
FRAX
S
HAQ
0 1 2 3 40
10
20
30
40
50
HAQ
FRAX
T
Regression line of FRAX total hip/lumbar spine-HAQ
Analysing the correlation between functional imairment and Tscore in lumbar spine
and total hip showed a strong correlation of the variables (-0.598 for total hip and -0.723 for
lumbar spine), statistical significant for both of them (p<0.0001).

20
HAQ
1 2 3 4
-6
-4
-2
0
2
Tsc
ore
L
HAQ
1 2 3 4
-6
-4
-2
0
2
Tsco
re s
old
tot
al
Regression line of Tscore total hip/lumbar spine-HAQ and Pearson coefficient
.
Correlation between vertebral fractures and disease activity score/functional impairment
The correlation between the incidence of VF and the significant items of AR showed
a Pearson coefficient of 0.482 for DAS284v and 0.487 for HAQ, with a p<0.0001.
The relationship between a severe disease activity and bone loss is due to the
overexpression of pro-inflammatory citokines, IL-6, TNF-α și IFN-γ. Regarding the
functional impairment, several studies show similar conclusions, the most recent being the
one published by Ghozlani et al in 2010.
Correlations between DAS284v, HAQ and VF DAS284v HAQ r 0.482 0.487 p <0.0001 <0.0001 IC95% 0.33-0.60 0.34-0.61 r2 0.233 0.237

21
CONCLUSIONS
• Our research was based on highly significant items as the assessment of BMD-a noninvasive, accessible and reliable method, that has a possitive correlation with the fracturar risk, established by the results of several multicentric studies worldwide
• The relevancy of the study arises from the necesity of an early diagnosis of osteoporosis, due to the fact that over 1/3 of the patients with AR and osteoporosis have at least one asymptomatic vertebral deformity, inducing a late therapuetic intervention
• Assessing the fracturar risk using FRAX algorithm becomes important in identifying the patients that need therapeutic approach
• Our results show that 40% of the patients with RA have osteoporosis and over 20% of them in both sites-lumbar spine and total hip, results that underline the necesity of an early diagnosis
• Analysing BMD and disease activity score, we found significant differences between patients with a high activity disease and a moderate activity disease, with a strong correlation of the variables
• Using FRAX algorithm we found a high 10 year risk both for a major osteoporotic and hip fracture
• Establishing the profile of vertebral fractures we found a significant percentage among the AR patients, fact that testifies the risk of functional impairment and disability, added to the underlying disability of the disease itself, in the absence of a quick therapeutic action
• The most frequent site of VF is T12-L1 coresponding to the results of our study • From the 46 patients with a high activity disease, 54% (25) had at least one VF,
statistical significant (p<0.0001) of the ones with a moderate activity disease • The functional imapirment score had a mean value of 2.33 for the patients with VF
and 1.54 for the patients with no VF. The correlation coefficient was 0.487, p<0001 • The use of GC, with an important role in bone mineral loss, was present in significant
percentage of the patients with osteoporosis • 95% of the patients with a high fracturar risk for a major fracture and all with a high
fracturar risk for a hip fracture had a hsitory of GC therapy • The rules of an accurate clinical decision in the managment of the patients with AR
and osteoporosis should include the assessment of bone loss and fractura risk using FRAX
• Our study shows that the patient with RA has an increased risk for a fragility fracture, directly related with the disease activity, facts that underlines the necesity of using FRAX algorithm
• In our study, RA is an independent risk factor for osteoporosis and vertebral fractures, with a negative dynamics of the fracturar events, induced by the severity of the diseases and the impairment of functional status

22
SELECTED REFERENCES
1. Consensus development conference: diagnosis, prophylaxis and treatment of osteoporosis. Am J Med. Jun 1993; 94(6):646-50
2. NIH Consensus Development Panel on Osteoporosis Prevention. Osteoporosis prevention, diagnosis and theraphy. JAMA2001:85:785-795
3. Hochberg M. Rheumatology, 5th Edition. 2011. 4. M. Ghazi & S. Kolta & K. Briot & J. Fechtenbaum & S. Paternotte & C. Roux.
Prevalence of vertebral fractures in patients with rheumatoid arthritis: revisiting the role of glucocorticoids. Osteoporos Int (2012) 23:581–587
5. Peris P, Monegal A, Martínez MA, et al. Bone mineral density evolution in young premenopausal women with idiopathic osteoporosis. Clin Rheumatol 2007; 26:958.
6. Genant HK, Engelke K, Fuerst T, et al. Noninvasive assessment of bone mineral and structure: state of the art. J Bone Miner Res 1996; 11:707.
7. Barret-Connor E, Siris ES, Wehren et al. Osteoporosis and fracture risk in women of different ethnic groups. Journal of Bone and Mineral Researc 2005: 20: 185-194.
8. Cooper C: Epidemiology of osteoporosis. Osteoporosis Int 1999; 9(Suppl 2):S2-S8.
9. Van Staa TP, Dennison EM, Leufkens HGM, Cooper C. Epidemiology of fractures in England and Wales. Bone 2001;29:517-522.
10. National Osteoporosis Foundation. http://www.nof.org/. Accessed October 26, 2005.
11. Seeman E, Delmas PD: Bone quality—the material and structural basis of bone strength and fragility. N Engl J Med 2006; 354:2250-2261.
12. Khosla S, Melton LJ 3rd, Riggs BL. The unitary model for estrogen deficiency and the pathogenesis of osteoporosis: is a revision needed? J Bone Miner Res 2011; 26:441.
13. Clowes JA, Riggs BL, Khlosa S et al. The role of the immune system in the pathophysiology of osteoporosis. Immunological reviews 2005; 208:207-10
14. Weinstein RS. Clinical practice. Glucocorticoid-induced bone disease. N Engl J Med 2011; 365:62.
15. Kanis JA, Johnell O, Oden A, et al. The use of multiple sites for the diagnosis of osteoporosis. Osteoporos Int 2006; 17:527
16. Kanis JA, McCloskey EV, Johansson H, et al. A reference standard for the description of osteoporosis. Bone 2008; 42:467.
17. The International Society for Clinical Densitometry. Official positions. www.iscd.org/Visitors/positions/OfficialPositionsText.cfm (Accessed on June 01, 2008).

23
18. NOF's New Clinician's Guide to Prevention and Treatment of Osteoporosis. http://www.nof.org/sites/default/files/pdfs/NOF_ClinicianGuide2009_v7.pdf (Accessed on January 10, 2011)
19. The Internationals Society for Clinical Densitometry Official Positions. www.iscd.org/Visitors/positions/OfficialPositionsText.cfm (Accessed on January 10, 2011)
20. American Association of Clinical Endocrinologists Medical Guidelines for Clinical Practice for the Diagnosis and Treatment of Postmenopausal Osteoporosis.http://www.aace.com/pub/pdf/guidelines/OsteoGuidelines2010.pdf (Accessed on January 10, 2011).
21. U.S. Preventive Services Task Force. Screening for Osteoporosis RecommendationStatement.http://www.uspreventiveservicestaskforce.org/uspstf10/osteoporosis/osteors.htm (Accessed on February 10, 2011).
22. American Academy of Family Physicians. Recommendations for clinical preventative services. http://www.aafp.org/exam.xml (Accessed on January 10, 2011) www.consensus.nih.gov (Accessed on January 10, 2011).
23. National Osteoporosis Guideline Group (NOGG). http://www.shef.ac.uk/NOGG/index.html (Accessed on June 29, 2011
24. Ivaska KK, Lenora J, Gerdhem P, et al. Serial assessment of serum bone metabolism markers identifies women with the highest rate of bone loss and osteoporosis risk. J Clin Endocrinol Metab 2008; 93:2622.
25. Bauer DC, Garnero P, Harrison SL, et al. Biochemical markers of bone turnover, hip bone loss, and fracture in older men: the MrOS study. J Bone Miner Res 2009; 24:2032
26. Ivaska KK, Lenora J, Gerdhem P, et al. Serial assessment of serum bone metabolism markers identifies women with the highest rate of bone loss and osteoporosis risk. J Clin Endocrinol Metab 2008; 93:2622.
27. National Osteoporosis Foundation : Physician's guide to prevention and treatment of osteoporosis. Washington, DC, NOF, 2005.
28. Kanis JA, Johnell O, Oden A, et al. FRAX and the assessment of fracture probability in men and women from the UK. Osteoporos Int 2008; 19:385.
29. WHO Fracture Risk Assessment Tool (FRAX). http://www.shef.ac.uk/FRAX (Accessed on June 05, 2012).
30. Kanis JA, Borgstrom F, De Laet C, et al. Assessment of fracture risk. Osteoporos Int 2005; 16:581.
31. Dawson-Hughes B, Tosteson AN, Melton 3rd LJ, et al: Implications of absolute fracture risk assessment for osteoporosis practice guidelines in the USA. Osteoporos Int 2008; 19:449-458
32. Van Staa TP, Geusens P, Bijlsma JWJ, Leufkens HGM, Cooper C. Clinical assessment of the long-term risk of fracture in patients with rheumatoid arthritis. Arthritis Rheum 2006;54:3104–12

24
33. Orstavik RE, Haugeberg G, Uhlig T, Mowinckel P, Falch JA, Halse JI et al (2004) Self reported non-vertebral fractures in rheumatoid arthritis and population based controls: incidence and relationship with bone mineral density and clinical variables. Ann Rheum Dis 63:177–182
34. Bultink I.E., Vis M., van der Horst-Bruinsma I.E., Lems W.F. 3.Inflammatory rheumatic disorders and bone. Curr Rheumatol Rep 2012; 14(3):224-230
35. Leistner D.M., Seeger F.H., Fischer A., Roxe T., Klotsche J., Iekushi K., et al. – Elevated Levels of the Mediator of Catabolic Bone Remodelling RANKL in the Bone Marrow Environment Link Chronic Heart Failure with Osteoporosis. Circ Heart Fail 2012
36. El Maghraoui A., Rezqi A., Mounach A., Achemlal L., Bezza A., Ghozlani I. Prevalence and risk factors of vertebral fractures in women with rheumatoid arthritis using vertebral fracture assessment. Rheumatology (Oxford) 2010; 49(7):1303-1310
37. Furuya T., Hosoi T., Saito S., Inoue E., Taniguchi A., Momohara S., et al. Fracture risk assessment and osteoporosis treatment disparities in 3,970 Japanese patients with rheumatoid arthritis. Clin Rheumatol 2011; 30(8):1105-1111
38. Cheng C.K., McDonald-Blumer H., Boire G., Pope J.E., Haraoui, B., Hitchon C.A., et al. Care gap in patients with early in flammatory arthritis with a high fracture risk identi fied using FRAX((R)). J Rheumatol 2010; 37(11):2221-222
39. Kim S.Y., Schneeweiss S., Liu J., Daniel G.W., Chang C.L., Garneau K., et al. Risk of osteoporotic fracture in a large population-based cohort of patients with rheumatoid arthritis. Arthritis Res Ther 2010; 12(4):R154
40. Weiss R.J., Wick M.C., Ackermann P.W., Montgomery S.M.Increased fracture risk in patients with rheumatic disorders and other inflammatory diseases -- a case-control study with 53,108 patients with fracture. Rheumatol 2010; 37(11):2247-225
41. Furuya T, Kotake S, Inoue E, Nanke Y, Yago T, Kobashigawa T, et al. Risk factors associated with incident clinical vertebral and nonvertebral fractures in Japanese women with rheumatoid arthritis: a prospective 54-month observational study. J Rheumatol 2007; 34(2):303-31
42. Orstavik RE, Haugeberg G, Uhlig T, Mowinckel P, Falch JA, Halse JI, Kvien T (2005) Incidence of vertebral deformities in 255 female rheumatoid arthritis patients measured by morphometric X-ray absorptiometry. Osteoporos Int 16:35–42
43. Vis M., Haavardsholm E.A., Boyesen P., Haugeberg G., Uhlig T., Hoff M., et al. High incidence of vertebral and non-vertebral fractures in the OSTRA cohort study: a 5-year follow-up study in postmenopausal women with rheumatoid arthritis. Osteoporos Int 2011; 22(9):2413-2419
44. Sinigaglia L., Nervetti A., Mela Q., Bianchi G., Del Puente A., Di Munno O., et al. A multicenter cross sectional study on bone mineral density in rheumatoid arthritis. Italian Study Group on Bone Mass in Rheumatoid Arthritis. J Rheumatol 2000; 27(11):2582-258
45. Haugeberg G., Orstavik R.E., Uhlig T., Falch J.A., Halse J.I., Kvien T.K. Bone loss in patients with rheumatoid arthritis: results from a population-based cohort of 366 patients followed up for two years . Arthritis Rheum 2002; 46(7):1720-1728.


![Osteoporosis For Health Professionals: Fracture Risk ... · * Fractures of proximal femur, vertebra [clinical], forearm, and proximal humerus . 10-year Risk Assessment for Women (CAROC](https://static.fdocuments.us/doc/165x107/5e3826cf5906e92c8a7887d0/osteoporosis-for-health-professionals-fracture-risk-fractures-of-proximal.jpg)