
Assessment of Opportunities in Agro-industries and ...
50
1 Assessment of Opportunities in Agro-industries and Investment Needed to Support Ugandan Trade-Based Food Security in the EAC Region and beyond Ezra Suruma, Noble Banadda, Dick Kamugasha, Gelvis Turyagyenda, Bernard Mulengani and Ivan Lule
Transcript of Assessment of Opportunities in Agro-industries and ...

1
Assessment of Opportunities in Agro-industries and Investment Needed to Support Ugandan Trade-Based Food Security in the EAC Region and
beyond
Ezra Suruma, Noble Banadda, Dick Kamugasha, Gelvis Turyagyenda, Bernard
Mulengani and Ivan Lule

2
Table of Contents
1.0 General Introduction 4
1.1 Purpose and Scope of the Report ................................................................................................... 7
1.1.1 Report Purpose ............................................................................................................................... 7
1.1.2 Scope of the Report ........................................................................................................................ 7
2.0 Smallholdings, food security and Market case 7
2.1 Within Uganda .................................................................................................................................... 9
2.2 Between Uganda and Kenya ........................................................................................................... 10
2.3 Between Uganda and Tanzania ...................................................................................................... 11
2.4 Between Uganda and South Sudan ................................................................................................ 11
2.5 Between Uganda and Rwanda ........................................................................................................ 11
2.6 Between Uganda and Democratic Republic of Congo .................................................................. 11
3.0 Pre-conditions for boarding the Agro-processing plane 12
3.1 Location, location and location ....................................................................................................... 12
3.1 Transportation Systems .................................................................................................................. 13
3.2 Customs Unions and Ports .............................................................................................................. 15
3.3 Energy Production ............................................................................................................................ 16
3.4 Enhanced availability of Agricultural Raw Materials .................................................................... 17
3.5 Enhanced Coordination within Commodity Value Chains ............................................................ 18
3.6 Implementation of Policies supporting Agro-processing industry Development ...................... 18
3.7 National Database on the Agro-processing Industry ................................................................... 19
4.0 Strategic landing of Agro-processing plane 19
4.1 Maize ................................................................................................................................................ 19
4.2 Cassava ................................................................................................................................................. 22
4.3 Bananas ................................................................................................................................................ 24
4.4 Beans ..................................................................................................................................................... 26
4.5 Meat ....................................................................................................................................................... 29
4.6 Milk ........................................................................................................................................................ 29
5.0 Strategy for Accelerated Development of the Agro-processing for Uganda 30
5.1 Investment Opportunities prioritization matrix 32
6.0 Beyond talk: Prioritized Agro-processing Spectrum 33
6.1 Maize .................................................................................................................................................... 33

3
6.1.1 Proposed Short-term interventions (Low-hanging ripe fruits) .............................................. 33
6.1.2 Proposed medium-term interventions (Low-hanging unripe fruits)..................................... 36
6.1.3 Proposed Long-term interventions (Growing new fruit trees) .............................................. 37
6.2 Cassava ................................................................................................................................................. 37
6.2.1 Proposed short-term interventions (Low-hanging ripe fruits) .............................................. 38
6.2.2 Proposed medium-term interventions (Low-hanging unripe fruits) ......................................... 39
6.2.3 Proposed Long-term interventions (Growing new fruit trees)..................................................... 40
6.3 “Golden” Bananas ................................................................................................................................ 41
6.3.1 Proposed Short-term Interventions (Low- hanging ripe fruits) .................................................. 41
6.3.2 Proposed Medium-term interventions (Low- hanging unripe fruits) .......................................... 41
6.3.3 Proposed Long-term Intervention (Growing new fruit trees) ...................................................... 42
6.4 Bean ...................................................................................................................................................... 44
6.4.1 Proposed Short Term Interventions (Low- hanging ripe fruits) .................................................. 44
6.4.2 Proposed Mediumiterm interventions (Low- hanging unripe fruits) .......................................... 45
6.4.3 Proposed Long-term intervention (Growing new fruit trees) ...................................................... 46
7. Our Survival: The Parish Model for the Implementation of Agro-processing Interventions 47
7.1. Funding source options for parish model development ................................................................. 49
7.2. Planning and Implementation Mechanism to favor agro-processing ........................................... 50

4
1.0 General Introduction
1) Agriculture contributes 25% of national GDP and employs 70% of the population in Uganda. The sector provides great avenues for economic growth and economic inclusion, particularly from
women and youth. Women make up 55% of the economically active population, contribute more than 75% of the total farm labour and over 90% to farm-level primary processing operations. Almost half (45%) of the heads of smallholder farming households are under the age of 40. Over
the last five years, Uganda’s population has grown 3.3% per annum while output in agriculture has grown at only 2% per annum. Countries such as Indonesia, Brazil, Turkey, Malaysia and
Thailand are dominating global food trade because of the high level of value addition processing of the food commodities they trade in the world market. Lessons from other countries indicate that it can be done.
2) By investing heavily in agro-industries and trade links, the UAE, a country covered by desert, with zero agricultural potential, is now ranked as one of the leading exporters of processed
agricultural products. This is because; an estimated 70% of the U.A.E's agricultural imports are re-exported after significant value addition processing to highly differentiated tertiary products. The evidence for this can be found in our local supermarkets in Uganda. The Malaysian Palm Oil
Export Explosion1 shows the impacts of dedication to commodity processing and trade.
3) At independence in 1957, Malaysia had the same per capita GDP as Ghana, US $ 350, and did not
grow oil palm. In the late 1960s it borrowed oil palm seedlings from the Congo or Nigeria and started to develop varieties to produce oil for specific markets and by early 1980s it had replaced
Nigeria as the leading exporter of palm oil in the world. The rest is history as they say.
4) Chile’s global dominance in the export of Salmon fish has resulted from unwavering focus on products demanded by the market2. In the mid-1980s, Chile researched markets for several
products and concluded that it had natural competitive advantages in commercial salmon farming. The key was that Chile had abundant freshwater lakes and saltwater fjords along the
country’s 6,435-kilometer Pacific coast which did not freeze during the winter, which means the salmon grow faster, reaching market weight at least six months earlier than they do in the world’s biggest producer Norway. A decision was taken to exploit this opportunity and now the
country exports more than $2 billion of salmon per year and is now the world’s second biggest supplier of the fish.
5) At policy level, this will require the government of Uganda to move towards strategies that achieve food self-sufficiency at household, parish, district, or even national level. Also, particular attention should be paid to increasing the purchasing power in the rural areas by supporting the
development of off-farm sub-sectors and to deliberately support a section of the rural population to move out of direct production of food staples. Uganda is one of the leading producers of
commodities such as plantains and bananas, maize, peas, Irish potatoes, Cassava, Sorghum, sweet potatoes, peas, millet, and dry beans. Most of these commodities are highly perishable and are grown by smallholder farmers making it difficult to put products on the market. In short, it
1 NAP 3 – Malaysian National Agricultural Policy (1983-2010) 2 Fundación Chile Staff (2005) 29 years Fostering Innovative Business Development
In Key Chilean Clusters. World Bank Satiago Chile

5
is a commendable strategy for Uganda to be self- reliant and food secure. It is because of this “sovereignty approach” to food security that even matured trading countries import less than
30% of their main food staples (Figure 1).
Figure 1: Percentage contribution of food imports by class to total food consumption. (Source: FAOSTAT, 2019)
6) If Uganda fails to address agro-processing in a logic manner, she shall continue with the fallacy
of composition where agriculture also employs majority of the population in Uganda and/or East
Africa but contributes less than 50 % to the GDP as shown in Figure 2.
Figure 2: contribution of agriculture to GDP and employment in East Africa
7) Most food commodities such as milk, beef and cassava have a short shelf life if not processed as
shown in Figure 3. In Uganda on average, more than 40 % of the food losses occur at post-harvest and processing levels3. At a regional level, only 28 %4 of the agricultural produce in the
3 FAO, 2019. Global food losses and food waste. Extent, causes and prevention. Study conducted for the International Congress.

6
EAC is processed. However, as it can be seen in Figure 3, the shelf life of many so-called perishable commodities can be increased to several year through processing enabling them to be
traded widely in space and time.
Figure 3: length of stable shelf life of milk, beef and cassava products.
4 Kilimo Trust, EAC, UNIDO and FAO, 2011. Report on regional workshop and policy dialogue. Development of Agro-industries and Agro-Enterprises in the EAC region.

7
1.1 Purpose and Scope of the Report
1.1.1 Report Purpose
8) The purpose of the report is to produce the evidence to Support the development of Agro-
processing of Food Staples in Uganda. The assessment will generate the evidence to show how
investment in agro- processing can facilitate development of value chains leading to increased production of staple food commodities in areas of high and medium potential for production. As
a direct result of this assignment, it is expected that Government of Uganda (GOU) shall strategically intervene to create a support programme for agro-processing at the core of which would be a dedicated “SME agro-processing incentive fund” and in line with NDP3 would be
timely and a step in the right direction. Existing funding programmes such as OWC have focused towards supporting primary production, and has tended to be inadequate for SMEs. Through this
strategy, tailor-made incentives packages aimed at meeting the needs of small and medium-sized agro-processing enterprises would be created as Uganda seeks to be food secure and self-reliant in the midst of COVID-19.
1.1.2 Scope of the Report
9) The report covers agro-processing capacities of strategic staple foods in Uganda, namely maize, bananas, cassava, beans, rice, milk, meat, polutry and fish that are critical for food security. In
executing this assignment, the team consulted a number of literature sources and also used experience in the agro-processing sector: These sources included the regional export promotion
boards, Grain Traders associations, Agricultural Advisory bodies, the Agricultural Research Organizations, National policy documents, farmers/farmer groups, traders/processors, input suppliers, Food and Agriculture Organization (FAO) literature, the internet sources for regional
trade organizations, completed and ongoing projects, feasibility studies reports on food processing, infrastructure development, industrialization and Agro-ecological zoning.
10) The report also presents strategic interventions and corresponding cost implications for value addition in Maize, maize, bananas, cassava, beans, rice, milk, meat, polutry and fish in short, medium and long term. The limited time could not allow for the coverage of the agro-processing
aspect of all the staple foods in Uganda. This report also emphasizes the need to adopt a value chain approach in the provision of government support for food staples in Uganda. In other
words, support to primary producers must be linked to downstream opportunities in agro-processing.
2.0 Smallholdings, food security and Market case
11) For a fact, the vast majority of farmers in Uganda are smallholder. Linking smallholders to commercial opportunities in Agro-processing has a potential of increasing farmers’ income through increased use of inputs and hence improved yield as well as through potential increase
in cultivated area. In addition, it can improve farmers’ livelihoods beyond simply increasing their income by:

8
a. Giving farmers predictable sources of income that better enable them to meet financial obligations, build savings and improve household resilience especially in COVID-19 era
b. Providing record that can help farmers to build credit histories and access formal sources of finance to grow or improve efficiencies on their smallholdings.
c. Increasing food security and dietary diversity, by enabling farmers to use income earned from farming to buy a broader set of more nutritious foods, will ripple through
d. This linkage of farmers and commercial agro-processing opportunities can take a variety of
forms with varying degrees of benefits and risks. However, focusing on food staples is a potential game change because that’s what the farmers have.
12) It is not a wise decision to invest financial and human resources in any adventure that is not
demanded by markets. Markets do not lie. Markets are a critical element of a value chain
because, without access to them, projects which depend on government spending which will lead to either failure or perpetual dependence on grant finance from GoU. As such, reliable markets
are the surest ways for targeted intervention for a clear time frame and timed exit. Therefore, investing in agro-processing without first understanding Uganda’s competitive advantage in food trade internally and in the region markets is not a good strategy. Figure 4 shows relative
importance of food staples in Uganda. Beans, sweet potatoes, bananas, maize and cassava were ranked as important for the large majority of Ugandans in that order. However, cassava as
opposed to sweet potatoes has more industrial value than sweet potatoes.
13) Cassava chips are commonly used for production of animal feeds domestically. Chips also account for the majority of cassava traded internationally, as they are a stable intermediary product that can be shipped and then converted to final products like starch and ethanol. High-
quality cassava flour (HQCF) is utilized largely as a composite flour for bread, biscuits, snacks and pasta. In a few instances HQCF is also used as a glue extender in the production of plywood,
when it is available at a lower cost than other flours.
14) Starch is used extensively in the food and beverage industry, including in the manufacture of culinary cubes, powdered drink products, and others. Starch is also utilized in the
pharmaceutical, textile, adhesives and paper/corrugated board industries. When processed further, native starch can be converted to modified starches like glucose (and related sugar
syrups maltose and fructose), sorbitol and dextrins. These products have countless uses across industries, including as sweeteners in the food & beverage industry and as other inputs for manufacture of personal care products like toothpaste, cosmetics, and medicines.
15) Ethanol is used largely in the spirit distilling industry. Its potable form, extra neutral alcohol (ENA), is blended with water and other flavors to make many alcoholic beverages. Ethanol can
also be used as a fuel, both for cooking and for blending with petrol in vehicles. Ethyl alcohol is used in the medical and industrial sectors as a sterilizer and in the pharmaceutical sector as an ingredient in certain medication formulas. That’s how important cassava is. Therefore, going
forward, investments in maize, bananas, cassava and beans are proposed.

9
Figure 4: Relative importance of food staples in Uganda. Source: Kilimo Trust, 2018.
2.1 Within Uganda
16) Ugandans eat 272.155 kilogrammes of Bananas per capita while Americans consume 12.247
kilogramme pounds of bananas per capita, now no wonder Uganda grows more bananas than any other country in Africa and is number two only to India in the production of bananas in the world. Uganda is also a net exporter of beans and the second largest producer of beans in Africa.
Average per capita bean consumption in Uganda is 22.41 kg/person/year. Per capita total maize consumption in Uganda is 28 kilogrammes while in Kenya, it is 125 kilogrammes a year. Per
capita consumption of cassava is 132 kg, accounting about 11% of the caloric intake in Uganda. Also, maize, beans, bananas and Cassava are among the most traded food commodities in Uganda. Table 1 shows framework for development objectives and target groups for future of
Post-Harvest Loss (PHL)-reduction interventions per the guidance ToRs of this assignment.
Table 1: Framework for development objectives and target groups for future of PHL-reduction interventions per the guidance ToRs of this assignment EVELOPMEN
Development
Objectives for
Smallholder
Producers
Prioritized
staples
Examples of PH
Interventions
Facilitation Conditions
Income enhancement:
Livelihood improvement
for (smallholder)
producers through more
income.
Achieved by:
• Reducing economic
losses by upgrading
value chains (e.g.,
• Maize
• Bananas
• Cassava
• Beans
To create a safer, better-
quality,
higher-value product
through the
adoption of:
• Improved knowledge
and
technologies,
including
• Training
and
education,
especially
in business
skills
• Credit
supplied by
microfinan
• Need coordinated
interventions
in whole-value
chain.
• Rationale based
on commercial
and competitive
advantage of
these staples.

10
Development
Objectives for
Smallholder
Producers
Prioritized
staples
Examples of PH
Interventions
Facilitation Conditions
higher value
markets, better
quality product).
• Reducing physical
losses by the
adoption of
improved
technologies and
approaches by
smallholders.
mechanization for
handling, drying,
processing and
storage
• Market information
systems
• Creation of marketing
groups
• Business fairs to link
chain
actors
• Private off-farm
storage and, where
feasible, WRS
• Inventory credit
schemes
ce to
enable
technology
adoption
• Agricultural
policy
improveme
nts to
support
markets
and the
application
of UNBS
grades and
standards
• Must be
shown to
improve
livelihoods.
Increased food
self-sufficiency:
A larger and more
reliable supply of maize,
cassava, bananas, beans
and zero need for
emergency purchases
and food aid.
Achieved by:
Reduced physical
losses by the adoption
of improved
technologies and
approaches by
smallholders.
• Maize
• Bananas
• Cassava
• Beans
To prevent waste and
deterioration
of the staples produced by
smallholders:
• Zero-cost storage
interventions
such as improved
hygiene and storage
through greater
knowledge, skills, and
awareness.
• Low-cost storage
interventions, such as
tarpaulins to aid in
drying maize, beans,
cassava hermetic
storage using plastic
sacks, improvements
to traditional stores,
and informed and
rational use of
protectants.
Training and
education
• Requires an
assessment of
loss and
potential loss
reduction before
implementation.
• Rationale based
on the
contribution to
food availability
or reducing need
for food aid.
• Must be shown
to improve
human welfare
T
OBJECTIV 2.2 Between Uganda and Kenya
17) Maize, beans, bananas, and oilseeds are the main primary agricultural commodities traded between Uganda and Kenya in that order. As early as a decade ago, the volume of both formal and informal trade in basic foodstuffs was estimated at a tune of US$ 200 million per year.
(EAGC, 2018/2019). Since many agricultural products command higher prices in Kenya, cross-border trade with Kenya is basically important to Uganda. Thus, for example, maize, rice flour,

11
sorghum, beans, pineapples, oranges and bananas are exported to Kenya, whereas, with the exception of small quantities of stone fruit, Kenya exports almost exclusively to Uganda,
processed food such as cooking oil, sugar, wheat flour and dairy products. The value of finished goods exported by Kenya to Uganda is greater than Uganda’s exports to Kenya.
18) The food security linkages between Kenya and Uganda are strong as Uganda has made the
expansion of food exports to neighboring countries an official part of its food security policy.
Maize and beans have been a focus of the export promotion efforts, while Kenya’s frequent deficits in both food staples have been well-recognized by traders and policy-makers in Uganda.
As several major production zones lie close to the Kenyan border, the largely unregistered trade takes place predominantly in areas close to the border. Though informal, this kind of trade is accepted and government agencies take little action against it. With regards to other food
products, Kenya recently imposed stricter quality standards in the dairy sector, which Ugandan producers and traders referred to as ‘protectionist measures’ that were imposed to protect the
relatively expensive Kenyan dairy industry.
2.3 Between Uganda and Tanzania
19) Beans, bananas and rice are the main staple foods traded between Uganda and Tanzania. Beans
and some bananas are exported to Uganda from Tanzania but the direction of trade can reverse depending on the season’s performance on either side of the border. Rice is mainly imported
from Tanzania, and remains the largest commodity traded between the two countries, mostly informally.
20) Both sides of the Uganda-Tanzania border experience similar and favorable agro-climatic conditions, conducive for ample food production with surpluses exported to Kenya and Rwanda.
There is limited trade within the border areas. Agricultural trade between Uganda and Tanzania is low compared to trade between Tanzania and Kenya, Zambia, Rwanda, Burundi, Democratic Republic of Congo, and Malawi.
2.4 Between Uganda and South Sudan
21) Maize, beans, bananas and cassava are the main staple foods traded between Uganda and South Sudan. Also oils, Milk products, potatoes, fruits and vegetables are traded in large volumes. The food trade is largely one way from Uganda to South Sudan.
2.5 Between Uganda and Rwanda
22) Maize, beans, Irish potatoes, bananas and oils are the main staple foods traded between Uganda and Rwanda. Also dairy products, Fruits and Vegetables are traded in large volumes between these two countries.
2.6 Between Uganda and Democratic Republic of Congo
23) Just as with Rwanda, Maize, beans, Irish potatoes, bananas and oils are the main staple foods traded between Uganda and DR Congo. Also Cassava, Fruits and Vegetables are traded in large volumes between these two countries.

12
24) Therefore, maize, beans, bananas and Cassava are the common denominator in local and regional trade in staple foods. Also these 4 staples are consumed in large quantities and are
among the best traded in Uganda. These are the commodities Uganda should prioritize and invest in as far as agro-processing is concerned.
3.0 Pre-conditions for boarding the Agro-processing plane
25) Agro-processing is a topic that cannot be discussed in isolation. Just as a boarding a plane, there
are number of documented pre-conditions to successful investment in agro-processing of food commodities (FAO, 1997; FAO, 2013), and these include: location of the agro-processing facility,
transport, availability of raw materials, proximity to growth domestic markets, efficient supply of labor, access to energy for agro-processing, and economies of scale, especially in inputs and production for agro-processing.
3.1 Location, location and location
26) Location is one of the most important pre-condition for successful agro-processing. Location
determines access to amenities, raw materials and markets. No matter how sophisticated the
operations are, the golden rule is that the agro-processing facility should be within 10 Km from the main raw materials supplier or supplies. Agro-processing facilities that spend more in
mobilizing raw materials and/or are far away from the market, they will certainly find it difficult to survive. Agro-processing facilities that gain greater access to the raw materials will have an
edge over those that have greater access to markets Ceteris Paribas as economists say. Agro-processors that get it right in accessing cheap and sustainable raw materials as well as markets smile all the way to the bank. As a matter of fact, an intelligent agro-processor would rather risk
financial resources invested in finished products over shorter distances than longer ones. In essence, the ultimate winners are the ones that get the location right. That’s why agro-
ecological zoning is very important. Figure 5 shows the location of agro processing industries and markets in Uganda and other EAC countries.

13
Figure 5: Location of agro processing industries and markets in EAC.
27) For Uganda, it can be noted that, save for the central region, there are no major agro-processing
industries in maize and rice. This is very important information as equitable national distribution
as far agro-processing capacity is concerned.
3.1 Transportation Systems
The NRM has improved the road infrastructure tremendously. Although there are a number of
ongoing and planned investments targeting the main highways, investment in feeder roads to major

14
production areas is urgently needed to efficiently move raw materials and products to/from agro-processing units with minimal losses. At regional level, completion of the two major transport
corridors (northern and central) in the EAC region not only ensures lowering of costs of doing business but also promotes regional trade competitiveness and integration. Already, 1,899Km of the
northern corridor and 3, 773km of the central corridor has been paved. Figure 6 illustrates the distribution of road, railway, ports and airports in EAC. It is very important that we look at a
regional outlook since Uganda is landlocked.
Figure 6: Major Transportation Infrastructure in East Africa (Roads, Railways, Ports and Airport).
28) Furthermore, the existing rail system, which would be a much cheaper transport option, is not efficiently used. For example, rail transport costs along the Northern corridor route are estimated

15
at $0.05 per ton-km, compared with USD 0.07-0.09 per ton-km for road transport (US International Trade commission, 2012). Despite the cost advantage, less than 4% of Northern
Corridor traffic moves by rail. This is mainly due to the delays, breakdowns, and service disruptions that make rail transport more unpredictable than roadways. The situation is further
aggravated by isolated operations of national rail networks and the use of different gauges in the sub-region. Therefore, the rehabilitation and expansion of rail networks is urgently needed to effectively use the existing national rail networks to support development of agro-industry.
Already there efforts by regional governments to expand the railway network. For example, LAPSSET project in Kenya and Tanzania also announced the construction of Mwabani port and
Railway corridor (Mwaporc) estimated cost USD 32 billion in Tanga region. The railway will connect the Indian Ocean to Uganda and DRC.
29) Development of the air transport system is inevitable to enhance competitiveness of agro-industry sector. Air freight continues to be an essential mode of transport for time sensitive
goods (especially horticultural, milk, meat and fish) and will play a growing role in developing exports for landlocked countries like Uganda. However, air freight volumes are comparatively low because of poor airport infrastructure and high air freight rates. Inbound airfreight rates are
higher, sometimes reaching as much as USD 4.9/kg compared to USD 3/Kg in North America, US$ 3.5/Kg for South America, USD 2.5/Kg for Asia Pacific and USD 1.75/Kg for Europe, thus
reducing the types of goods transported by air. Out of the 378 airports in the EAC region, less than 10% have paved runways.
30) Kenya accounts for the largest share of EAC’s air freight cargo volume with multiple firms
offering cold facilities at major air ports though limited. The major regional airline, Kenya Airways, is investing millions of dollars in air freighters to better serve these markets. In addition, Uganda recently launched a 20 year civil aviation master plan that will see expansion
and upgrading of Entebbe international airport and other airports like Gulu, Arua and Kasese airports. In Hoima, Kabaale airport is on track with almost 60% civil works done. For agro-
processing to benefit from such plans, investments in construction of cold storage facilities at airports and liberalization of air transport to provide better quality and competitively priced air services is paramount to facilitate movement of perishable food staples.
3.2 Customs Unions and Ports
31) Access to growth markets for agro-processed industrial products is a key driver of investment in the agro-industry. In addition to enhancing the efficiency of the transport system, harmonizing
customs procedures5 and increasing port-handling capacity are key enablers to market access; a case in a point are the sugar from Uganda to Tanzania and the milk and cement from Uganda to Kenya.
32) Furthermore, though there has been significant increase in port handling facilities and trade
facilitation over the years, more investment is still needed to reduce general cargo traffic and charges for the region to be competitive. For example, the East African Business Council
5
This includes the following: (i) Improving pre-shipment inspection and facilitating customs clearance, (ii) Streamlining registration and
documentation requirements, (iii) Improving port and harbour operations and well as the handling procedures on these facilities.

16
estimated that custom delays have been costing truck drivers 45,000 lost days and an extra USD 2 million in bribes paid to customs officials to speed up the process. In addition, road blocks and
delays at weigh bridges lead to loss of 126,749 working days and US7.9 million in payments. Compared to other countries, a trader in Mauritius spends 14 days and USD 737 to complete
export formalities while the same trader will need twice as much time and will pay about 3 times the cost of the same shipment in East Africa (US International Trade Commission, 2017).
33) The on-going efforts to develop different ports in the region like Mombasa, Dar-es-Salaam, Bagamoyo, Mwambwani and Lamu Ports, and major cross border points are important steps in
the right direction. The developments are focusing on digitization of the clearing process, modernization of weighing of cargo, automatic clearing processes using a single window system, and establishment of one-stop centers (posts) which will eventually reduce delays. These
improvements will reduce freight costs by an estimated USD 40 per ton in the northern corridor and USD 25 per ton in the central corridor, increasing trade within the EAC by 15%.
Furthermore, already partial implementation of open single border post at Malaba (Kenya-Uganda) has reduced clearance times to 7 hrs down from 2 days in 2008 (US international trade Commission, 2017).
3.3 Energy Production
34) Energy plays a critical role in the development of a country and is essential in economic growth
and overall distribution of economic services. Uganda seems to have sorted the Power shortage power for this can be a significant infrastructural hindrance agro-processing growth and competitiveness. The average power cost per unit in the EAC region is much higher— by almost
USD 0.20/kWh compared to South Asia (USD 0.04/kWh) and East Asia (USD 0.07/kWh) (AfDB, 2014). With this scale of commendable progress in power generation, it is hoped that the unit
cost in Uganda will decrease significantly enough to increase efficiency and competitiveness of the agro-industry in the region. Additional investment would also be required for establishment of power transmission lines extended to areas were agro-processing can potentially be best
carried out (major agricultural production zones). Figure 7 shows the Power Grid, Planned lines and Generation Stations.

17
Figure 7: Power Grid, Planned lines and Generation Stations.
3.4 Enhanced availability of Agricultural Raw Materials
35) Most food agro-processing industries in Uganda operate below installed capacity. For example,
maize processing plants operate at 23-56%, dairy plants operate at 35-50%, fish plants operate
18
at 35-45%, meat processing at 20-25% and rice mills operate at 57%. This is partly due to insufficient and seasonal supply of raw materials (in quality and quantity) and post-harvest
losses. Agricultural production in Uganda is dominated by scattered small scale producers who account for over 80% of agricultural produce. Low yields due to limited use of improved
technologies, low mechanization, low irrigation use all characterize the region’s processors’ raw materials availability to firms operating agro-industry enterprises. Although past investments in agriculture have concentrated more on-improved production especially the release of superior
varieties, adoption by small holder farmers has remained low.
36) Market changes driven by factors such as urbanization, food standards and new urban consumption patterns have created new market intermediaries and various value-chain interactions. These high-value dynamic markets require smallholder farmers to perform more
reliably.
37) A review of agricultural commodities in Uganda with the highest potential for increasing agricultural productivity to feed into agro-processing, based on the yield gap between what
smallholder farmers are producing in comparison to on-farm research yields, shows that maize, beans, cassava, bananas and plantains, and Irish potatoes provide the best opportunities for
Uganda.
38) Market driven investments in boosting productivity especially adoption of new technologies, use
of Good Agricultural Practices (GAPs)and postharvest handling will go a long way in reducing the inefficiencies cause by low capacity utilization of agro-processors. Therefore, investments in
production of fertilizers in the region, development of irrigation schemes, mechanization of agriculture and investment in marketing, storage and processing infrastructure at farm level is vital for transformation of agro-industry in Uganda.
3.5 Enhanced Coordination within Commodity Value Chains
39) Value chain development is necessary not only for timely, consistent and effective conveyance of
factors and products along the production- consumption nexus but also to assure equal
distribution of value added among actors. Currently there is a log jam whereby processors in Uganda are complaining of inadequate and poor-quality raw materials at the same time
producers with quality produce cannot find market for their produce. Also, staple foods are largely underdeveloped and unstructured, which limits access of these commodities to high value
niche markets within and outside Uganda.
40) The development and/or upgrading of national value chains requires deliberate investment in
both “hard” (i.e., roads, rail, energy, etc.) and “soft” infrastructure (i.e., facilitating policies, procedures, institutions, good governance and political stability). There is therefore an urgent
need to develop and upgrade national commodity value chains in order to improve Uganda’s competitiveness for enhanced participation in global markets.
3.6 Implementation of Policies supporting Agro-processing industry Development
19
41) A number of policies have been developed in Uganda and the region that should support development of the agro-industry sub-sector. For instance, at regional level, there are five policy
documents targeting agribusiness and agro-industry development. These include the EAC Protocol, EAC Agricultural and Rural Development Policy, CAADP Pillar II Framework, EAC Food
Security Action Plan and EAC Industrial Policy. In addition, a number policies exist at national level. What remains is mainly the implementation such policies, which is mostly hampered by budgetary limitations, rather complex constellations of mandated national level institutions to
domesticated and cause consensus or buy in, as well as weak implementation capacity especially in supervision, monitoring, and performance accountability.
3.7 National Database on the Agro-processing Industry
42) One of the biggest challenges faced by agro-processing development and agriculture in general is the lack of a well-coordinated, organized database of synthesized information on national value
chains. This same challenge has been cited by potential investors in agro-industry development. Even where data may exist, it is still scattered and not analyzed to produce products that would guide investment decisions by both public and private sector investors. This also makes it hard
for financial institutions who need such information to make decisions on medium to long term financing options/products. Such a regional database would allow generation of models that can
be used to predict the future of the agro-processing industry. There are a few databases to build on, e.g. the UNIDO industrial database which provides information on number of establishments,
number of employees, wages, output and demand. However, it requires continuous updating and expansion to capture more indicators including statistics on support sectors to agro-processing industry and localization.
43) Uganda Industrial Research Institute (UIRI) and Uganda Investment Authority (UIA) made an
effort to develop national database on agro-processing, however, these efforts were not sustained thus they lack the latest information on the sector. Consequently, information in Uganda is in the hands of private consultants/teams that earn a living out of it. In some cases
even, people formerly entrusted with data and information for public good use it for personal gain.
4.0 Strategic landing of Agro-processing plane
44) Like for a plane, strategic selection of focal areas is paramount to the success of the agro-processing sector in Uganda. Nobody lands a plane anywhere anytime.
4.1 Maize
45) Maize is the second largest crop cultivated in the country as measured by production volume,
trailing only plantains. The production system is dominated by peasant farmers, with 75% of the country’s output grown on plots of land that are between 0.2-0.5 hectares. With two separate growing seasons and vast stretches of fertile land, Uganda has some advantages over its regional
peers in the production segment of the chain. Processing in the formal sector is concentrated in Kampala. Maize can be consumed in several forms: green maize roasted or boiled, steamed products,
porridges, beverages, bread, and snacks. The main actors in the maize value chain are input

20
providers, farmers, traders/aggregators, processors (mills) and downstream participants in activities such as retail, food manufacturing, brewing, and animal production. The primary
actors, along with their position in the maize value chain in Uganda are identified in Figure 8.
Figure 8: The Maize Value Chain.
46) Major challenges in this segment of the chain are misaligned motivations and the lack of coordination and communication between downstream and upstream actors, which obscures
market signals about the value of high-quality maize. With traders not reliably differentiating outputs, farmers have little incentive to invest in expensive inputs. The farmers’ lack of liquidity
sometimes makes them more willing to sell informal traders at lower prices, while traders’ inadequate quality differentiation impairs the processors who attempt to sell to Kenyan markets that demand premium maize. Another significant constraint is the poor storage facilities that
exacerbate the issue of postharvest loss. Depending on the estimate, Ugandan farmers sacrifice between 22-30% of their maize crop to post-harvest loss. While that is less than the 32% global
average on agricultural products, it still represents a higher share of the total production volume that is consumed in domestic or export markets. Moisture content is a significant factor in post-harvest loss. EAC standards require that maize is dried to 13.5% in order to be exported, but
interviews with stakeholders indicated that Ugandan maize is often harvested with moisture content of 20-25%. Poor drying and storage facilities ensure the kernels cannot reach that
threshold and are susceptible to fungal infections and mildew. Dry mills are the dominant milling technology in Uganda and primarily yield three outputs: No. 1 maize flour; No. 2 maize flour; and
maize bran.
47) Aligning production and agro-processing in a sense that exploits Uganda’s strengths is crucial for the success for the region. In other words linking production to agro-processing capabilities
is critical to minimize idle equipment and machinery, reducing post-harvest losses, and creating decent employment. Figure 9 summarizes the existing milling capacities versus the maize
produced in Kenya, Tanzania and Uganda in 2018.

21
Figure 9: Comparison of installed capacity and annual production.
48) It is interesting to note that the milling capacity/year for maize is almost the same as the total annual production. This is both as a result of the importance attached to maize as the leading
staple commodity in the EAC Region and the advanced adoption of hammer mills for SMEs. It is also an indication of the importance of the size of the market of an agricultural product in driving the development and investment in the agro-industry required to produce such a product. The
“missing” Micro Scale Enterprise (MSE) Figure 10 shows that the installed capacity for processing cereals and perhaps other commodities is skewed towards small scale enterprises. There is also
a significant proportion of the installed capacity that is in the form of large scale. The MSE are missing from the picture and this is a major reason for the under-developed agro-industry sector.
Figure 10: Sizes of installed capacity and rate of utilization in selected case studies.
22
4.2 Cassava
49) Cassava is a starchy root crop that can be stored across multiple years underground. It is
typically harvested on an annual or biannual basis in tropical and subtropical areas. It is widely consumed across Uganda. It is the most important source of calories. Cassava is one of the
primary food security crop in Uganda due to its storability that allows considerable flexibility across weeks and seasons as to when it is harvested and thus the ability to provide calories on small farms in key deficit periods. It is also resistance to drought and disease, and tolerant to
poor soils. In Africa, Nigeria is the main African exporter in the global trade in dried cassava products. In 2016, it exported well over 600,000 tons of dried cassava products, more than
doubling exports from 2014, the first year of significant trading in that commodity, following signature of an agreement with China in 2013 (FAOSTAT, 2017).
50) Latin America has an advanced cassava food industry led by Brazil and processes several
industrial cassava derivatives. The Asian countries are the most advanced in processing non-food cassava derivatives. The bulk of cassava products outside Africa is not consumed directly as food.
Most of it is for industrial purposes and feeds. Asia, and especially Thailand and Vietnam, are the dominant competitors with respect to global Cassava markets. Thailand is the world’s largest exporter of cassava products; overall, it accounted for 75 percent of global exports of dried
cassava products by value in 2016 (FAOSTAT). Thailand exports cassava chips (about 60 percent of Thai cassava exports by volume), cassava native starch, and modified starch. The latter two
categories are for food and drink, paper, textiles, cosmetics and medical products (Chuasuwan 2017). Thailand’s earnings from the export of cassava products reached nearly US$2.9 billion in
2016, having grown at about 15 percent annually since 2010. Thailand processes 40 percent of production into starch for both domestic and export markets. Vietnam exported US$1.5 billion in cassava products in 2015. Uganda can also do it.
51) In Vietnam, the government has played a similarly strong role in developing the industry and promoting access to export markets. Vietnam is now the second largest exporter of cassava
products, with a growth rate of 39 percent per annum in the value of exports between 2008 and 2012 (Dalberg et al. 2015). The Cassava Processing plant, Bukona Agro Processors Ltd in Nwoya District in Uganda has invested over UGX 12 billion in the local economy to process Cassava into
bio-ethanol and cooking fuels. Injecting in more working capital and taking charging of the finances is a good strategy for Uganda as we industrialize Northern Uganda and capture the
Markets in Eastern DRC and South Sudan. Bukona Agro Processors Ltd is chemical producing plant with installed capacity to produce 45,000 liters of spirits per day. By spirits, we mean cooking fuels and ethanol. Also, as a byproduct, they have also capacity to produce animal
feeds and cooking stoves. Figure 11 shows the level of development of the cassava value chain.

23
Figure 11: Cassava value chain.
52) End-uses of cassava range from basic subsistence consumption to the various industrial uses introduced. This report proposes a spectrum that begins with subsistence consumption, grows into agro-processing commercialization, and peaks at industrialization, as outlined in Figure 12.
Figure 12: Spectrum of cassava end-uses.
53) In many countries, cassava and certain basic by-products (including traditional foods) have begun to be traded as commercial goods. Products include dried cassava chips and semi-formally
processed traditional food products (which can be packaged/branded). Cassava chips as a more stable intermediary producthave myriad uses, and the global market for cassava primarily trades
in chips. Domestically, chips are often sold to animal feed processors. As the leading importer

24
of cassava chips, China primarily uses the product to produce bio-ethanol. Industrial cassava includes formal and large-scale processing into high-quality cassava flour, starch & its
derivatives, and ethanol. These products have many end-uses across sectors, though food & beverage is the largest source of demand for such products.
54) The spectrum in Figure 13 can be used to understand the illustrative current status of development in cassava producing countries. Uganda falls closest to pure subsistence consumption due to very limited formal or industrial uses of cassava. Ghana’s cassava sector
shows slightly more agro-commercialization, though supply volumes are still quite low, while Nigeria has a number of commercial and industrial cassava businesses functioning sustainably.
Thailand and Vietnam both fall at the industrial end of the spectrum, as both countries produce almost exclusively for industrial use and do not commonly eat cassava as a basic food product.
Figure 13: Country status along the subsistence-industrialization spectrum.
4.3 Bananas
55) Cooking bananas are an important starchy food and cash crop in Uganda. About 24% of all agricultural households are engaged in banana production. Communities from central, eastern,
western and south-western Uganda have mostly relied on bananas for over 150 years. Compared to other important crops in the country, banana occupies the biggest proportion of utilized
agricultural land - about 1.4 million hectares or 38% of the total utilized land. Generally, the four most commonly grown varieties are Kibuzi, Mbwazirume, Musakala and Nakitembe. Other varieties grown include: Entukura, Mbululu, Enzirabushera, Muvubo, Enjagata, and Entukura.
56) The banana (Matooke) industry in Uganda is important both for provision of food and income to a wide range of actors. Like many developing countries in Africa, agricultural value chains in
Uganda are largely underdeveloped. The banana value chain is among the main agricultural

25
value chains in Uganda; it is characterized by a long chain of actors making the trading system inefficient. Brokers and small scale traders are the main market access points for farmers and
they often offer low prices). As such, banana producers have limited bargaining power since they sell their produce individually- each selling a few bunches at a time. Nonetheless, farmers have
unexploited opportunities including the adoption of improved banana varieties and agricultural inputs such as fertilizers.
57) The underdeveloped level of the banana value chain in Uganda is primarily attributable to its
complex nature, which has contributed to interconnectivity challenges that ultimately lead to minimal long-term relationships between the various actors. As a result, the relationship
between the chain actors is based on mistrust and exploitative attitudes, thereby yielding minimal benefits for some actors. This situation is further complicated by the short shelf life of fresh bananas, which contributes to huge losses in value chain activities beyond the farm gate.
This necessitates the adoption of upgrading strategies in the value chain.
58) Banana is a unique perennial single harvest plant. Its visible part, the pseudostem and leaves
dies after it bears fruit to make way for the young budding plant (suckers) to rejuvenate from the rhizome. The harvesting of the fruit in plantation requires the decapitation of the whole plant so that the young suckers can replace the mother plant and these cycles can continue for
unlimited generations. Generally, banana by-products include the pseudostem, leaves, inflorescence, fruit stalk (floral stalk/rachis), rhizome and peels. Most of these by-products may
serve as an undervalued commodity with a limited commercial value, application and in some cases, it is considered as an agricultural waste. The pseudostem and leaves are commonly left to
rot in farms to replenish some of the nutrients in the soil.
59) The banana value chain mainly comprises of producers, rural assemblers, wholesalers, rural and urban retailers and consumers as depicted in Figure 14.
Figure 14: Banana value chain.

26
4.4 Beans
60) In the East African Community Region, Uganda is ranked second to Tanzania in the production
of common beans (Phaseolus Vulgaris). Beans provide 25% of the total dietary calorie intake and 45% of the protein intake in Uganda. Beans are grown in two planting seasons: i) March to June
season; and the ii) September to November season with the highest output with 59% of all the beans in Uganda being produced during this season. There are very few bean processors in the country. These processors utilize about 1% of the total dry beans to process bean flour. Most
producers have farming as their main source of livelihood and together with their families; they contribute most of the labour force at this level. Activities at this stage are mainly not
disaggregated by gender. Women do most of the weeding and harvesting while men are involved in land preparation, fertilizers and pesticide application and marketing.
61) Given the importance of beans, it is necessary to understand what the situation of the bean sub-sector in the country is in terms of production, marketing and consumption and also map the
different actors in the bean value chain. The bean value chain consists of input suppliers, producers, villager assemblers/middlemen, traders, processors and consumers. The producers sell approximately 69% of the beans to village collectors and brokers and 5% to institutional
buyers like schools and WFP. The remaining 26% is retained for home consumptions and seed. Village collectors then sell all their beans to traders which include big traders in major trading
towns. Thereafter, the big traders transport the beans to mass markets, institutional buyers, urban traders or exporters. Urban traders then sell to institutions or export to Kenya, South
Sudan, Rwanda, DRC and Burundi. Bean grain and Bean seed Value Chains
62) The first step of the functional analysis is mapping of the actors in the dry bean value chain. In
this section, we present the value chain maps of bean grain and bean seed. Figure 15 is a map of the key micro-level actors of the bean grain value chain. These are the input suppliers, producers, assemblers, processors, traders and consumers. Bean consumption is through three
channels of households, institutions and regional trade.

27
Figure 15: Bean value chain core processes.
63) The bean seed production starts with research through development of new bean varieties at NARO-Namulonge. The new variety is then multiplied by a few selected multipliers and seed
companies before it is commercially availed to market. During the multiplication, rejects of seed (planting materials that do not conform to set standards during multiplication) from seed companies are sold to bean wholesalers from where they join the beans grain value chain. The
linkages are presented in Figure 16.

28
Figure 16: Map of core processes of bean seed value chain.
Employment in the Bean Value Chain
64) This section discusses the various sources of employment in the value chain. It should be recalled
that labour is a value addition input because it’s not consumed in different processes of the bean
value chain. Generally, employment in bean value chain varies from stage to stage with both gender as casual or salaried employees (Figure 17).
Figure 17: Levels of employment along the bean value chain.

29
65) Bean processors are yet to improve their processing technology to modern efficient machinery. This could be associated with the high investment capital required to upgrade coupled with a
‘thin’ market for value added bean products. These weaknesses notwithstanding, there is a growing market for processed beans. Few bean processors in the chain pose an opportunity for
new entrants at this stage of the value chain. With increasing urbanization coupled with awareness on healthy eating, it is expected that bean preference will increase. The implication of urbanization and a high number of working class is that, people will have less time to boil beans
which take long and would instead turn to processed beans and bean products.
4.5 Meat
66) Processing of livestock into meat products is very limited in the region and is often limited to slaughter. This is because of the very limited development of the value chain as a result of little
or non-existent commercial production by pastoralist who are the main suppliers of livestock for meat. Therefore, despite the fact that livestock raising is practiced by the majority of people and
nearly the entire population of the areas with the highest poverty and food insecurity levels, marketed meat products contributes very little to the GDP. From the market side, livestock products are affected by probably the stringiest non-tariff barriers in the world market.
67) In general most (85%) processing of beef and small ruminants meat is conducted by owned slaughter slabs, abattoirs, and rarely slaughter houses close to the areas of consumption in rural
trading centres, towns and cities. Therefore, most of the transportation from production area to the market area, of especially beef cattle is “on-hooves”. There is limited processing by large
scale slaughter and meat packing factories. Slaughter slabs are linked to butcheries which then sell directly to consumers. There are 31 modern slaughter houses in the EAC Region. The main secondary agro-processing for meat, is in the production of sausages, canned meat and minced
meat. Secondary meat processing in the EAC region is still in its infancy stage. Uganda produces 106,000 MT/year of beef carcass and has installed capacity of 594,000 MT/year. Basically, there is
488,000 MT/year as shortage capacity.
4.6 Milk
68) Although Uganda’s milk processing capacity has increased four-fold over the past decade, most dairy processors operate below installed capacity, with the exception of JESA Farm whose
business model replies on trust-based relation with milk suppliers. Industry-level capacity utilization oscillates between 40-60% between the lean and peak production seasons, implying an upward push on the per-litre processing cost especially in the dry season. Despite the end of
state-controlled processing, the dairy industry is still highly concentrated; the top three processors control 83% of the national installed capacity, and there are just 14 processors for the
whole country.
69) Supermarket retailers consider dairy a key product line and market a range of dairy products manufactured by local and regional dairy processors: pasteurized milk, UHT milk, powdered milk,
yogurt, and cheese. Despite the challenges in Uganda’s dairy industry, the country has been identified as one of the 20 ‘Markets of the Future’ that will offer the most opportunities for
consumer goods companies. As of 2020, the dairy processing sector had grown to 19 dairy processors producing UHT, pasteurized milk, butter, ghee, yoghurt, ice cream, cheese and

30
whipping cream. However, some of them have gone out of business for several reasons. Table 2 shows the current (2010) processing capacities of major dairy processors in Uganda.
Table 2: Major dairy Plants and Mini dairies in Uganda.
No. Name of Company Location Installed
Capacity
(Lts/day)
Current
Production
(Lts/day)
Utilization
Capacity
(%)
1 Sameer Agriculture & Livestock Ltd Kampala 448,200 201,690 45
2 Jesa Farm Dairy Busunju 30,000 25,000 77
3 White Nile Dairy Jinja 6,000 779.1 13
4 GBK Dairy Products (U) Ltd Mbarara 56,000 15,000 27
5 DairiBoard (U) Ltd Mbarara 40,000 0 0
6 Birunga Dairy Kisoro 40,800 30,000 74
7 Teso Fresh Dairy Soroti 3,200 145 5
8 Maddo Dairies Ltd Masaka 1,301 344 26
9 Gouda Gold Kampala 15,000 170 1
10 Paramount Dairies Ltd Mbarara 3,000 604 20
11 Nirma Dairy Entebbe 10,000 344.9 3
12 Amagra Foods Ltd Kampala 26,000 76.2 0.3
13 Nile Valley International Foods Ltd Mbarara 40,000 1500 4
14 Kaisa Fresh Milk Kamuli 2,920 0
0
15 Uganda Industrial Research Institute Kampala 2,920 0 0
16 Country Taste Mbarara 9,125 0 0
17 Amos Dairies Kiruhura 400,000 300,000 75
18 Vital Tomosi Dairy Limited Kiruhura 100,000 50,000 50
19 Mega milk Kampala 20,000 15,000 75
Total 1,264,466 281,453.20 51.1
5.0 Strategy for Accelerated Development of the Agro-processing for Uganda
70) The investment strategy proposed is developed based on the following factors and/or contexts in the Uganda agro-industry sub-sector:
a) Leveraging others investment in the sub-sector to date is a smart choice: over the years there has been considerable investment in the agro-industry sub-sector. Any initiative to stimulate further investment needs to explore opportunities for leveraging these existing
investments, so as to maximize the returns (financial or social). Increased predictability of returns for the agriculture can potentially attract more investors into the sub-sector.
b) A commodity-based approach to agro-processing development of the is equal a great
strategy. This shapes the entry points of interventions targeting accelerated agro-industry

31
development in Uganda, by seeking to first address the opportunities and constraints at commodity level and then leveraging others’ investments to intervene in areas which cut
across the different commodity value chains.
c) Utilization of national market opportunities takes priority over export markets in the short-medium term: because the long term intention of upgrading the agro-industrial base of Uganda, so as to compete more favorably in the global markets from more technologically
advanced products, ultimately the growth and development trajectory of the agro-industry sub-sector will be anchored to growth opportunities in export markets. However, to build the
capacity of the sub-sector towards this, it is a precondition that the national market opportunities are fully exploited as a means to develop a more inclusive sub-sector, but also provide the time and opportunity to build the overall competitiveness of the agro-industries
and agro-enterprises. A commodity-based national market first approach has the following advantages:
i. It provides the best market for agro-processing products from food staple commodity value chains
ii. Developing the technology and skills base to compete globally will take time, given the
nature of agro-processing firms in Uganda (most are small scale), iii. There is need to balance national and regional food security goals, with the promotion of
export markets for agro- processing products, which requires time for such trade-offs to pay off, and
iv. Potential investors can choose from a narrower set of more predictable investment choices with the priority commodities, and more systematically invest targeting clearer and verifiable returns and/or impacts
d) Investment in the agro-processing industry sub-sector requires simultaneous investment in
the priority commodities, as well as investment in the cross-cutting areas that are important for all the priority commodities. This provides a considerably wide set of investment choices for potential investors, which is another pre-requisite for crowding in more investors.
71) The proposed strategy for Uganda is as follows:
a) In the short-medium term, focus on priority commodities of namely, maize, bananas, cassava and beans where Uganda has inherent comparative advantages, and develop
competitive agro-processing products targeting growth market opportunities within the national and regional markets, while contributing to the food and nutrition security of the
consumers, and
b) In the medium-long term, invest in upgrading the agro-processing industrial base to produce
more technologically advanced and globally competitive products, which provide higher rates of return, while contributing to greater economic development Uganda, through spillover
effects in other sectors6 and sub-sectors7 closely linked to agro-processing.
6
Sectors like manufacturing, services, and industry.

32
5.1 Investment Opportunities prioritization matrix
72) Investment opportunities identified can be grouped in to the following areas:
a) Post-harvest related investment opportunities: these focus mainly on the primary handling
and basic processing of maize, bananas, cassava and beans. These investment
opportunities also include those in agro-logistics, which can also be utilized in trade of other commodities.
b) Product preservation and/or primary processing: these focus on bananas and cassava because enzymic reactions make them deteriorate quickly. Traditionally, bananas and
cassava experience the highest post-harvest losses.
c) Secondary processing investment opportunities: these are for maize, bananas, cassava and beans, such that they can compete with similar products imported in to Uganda.
73) Table 3 summarizes the ripe and low hanging fruits that are ready for take-off in the agro-processing sector.
Table 3: Ripe and low hanging fruits that are ready for take-off in the agro-processing sector.
S/N High Value and low hanging fruits in Demand
Agro-processing Sub-sector in line with Strategic Objectives of NDP III
Raw Materials
1 Cooking Oils free of cholesterol
Food processing Maize
2 Breakfast Cereals Cereal processing
3 Aflatoxins Free animal feeds and mineral supplements
Livestock processing
4 Low Sugar Dextrose Health Maize/Cassava 5 Starch Brewing/ Textile/Pharmaceuticals/
Food Processing/ Paper Making/ Toothpaste
6 Low Sugar Dextrose Health
7 High quality cassava flour Food processing (bread, pastries, cookies, and biscuits)/ Health /pharmaceuticals
Cassava
8 Bio-ethanol Energy and Environment
9 Cooking Fuels Energy and Environment
10 Banana powder used in Baby milk formulations; milk
shakes
Food processing Bananas
11 Banana Juice Food processing/ Health
12 Hand Made Paper Packaging
7
Sub-sectors already identified as having strong potential to contribute to industrial growth and competitiveness of the
region like: Fertilisers and agro-chemicals, agro-machinery, packaging, leather, bio-fuels, and machine tools.

33
S/N High Value and low hanging
fruits in Demand
Agro-processing Sub-sector in line
with Strategic Objectives of NDP III
Raw Materials
13 Puree Food processing/ Baby foods
14 Baking flour/Composite flour Food processing 15 Fresh vacuum sealed
matooke
16 Charcoal Briquettes
17 Beer
18 Wine
19 Banana Crisps
20 Pancakes
21 Canned Beans Food processing/ Health Beans
22 Bean Starch Noodles
23 Drum-dried beans
24 Bean powders and flours
6.0 Beyond talk: Prioritized Agro-processing Spectrum
6.1 Maize
74) Although Uganda is the EAC’s third largest maize producer after Tanzania and Kenya, it is one of the major food baskets in the region. Uganda has the highest maize yield in the region and it is a frequent exporter of maize to neighboring countries (Kenya, Tanzania, Sudan, Rwanda,
Burundi, DRC) and as far as to the Horn of Africa (Somalia). It is the only country in East Africa that runs a surplus maize balance sheet as maize consumption is fairly low in comparison to
alternative food staples like bananas, cassava and sweet potatoes. Uganda produces close to 2.5 MT of maize per year and has two planting seasons (UBOS, 2011).
75) Therefore, although Uganda produces surplus maize, it is unable to sell in bulk due to lack of adequate storage. For instance, Uganda’s eastern neighbor, Kenya, has chronic maize shortage
of not less than 400,000 MT per year. However, Kenya rarely imports from Uganda because the latter cannot supply adequate quantities within the quality and time requirements of the importer. The strategic vision for Uganda therefore is to be the regional leader in production and
supply of high-quality maize and maize products that meet international standards. The mission is to invest in technologies that increase production and minimize post-harvest losses in maize
producing areas. The goal is to leverage Uganda’s comparative advantage in maize production to be a competitive regional producer and supplier of high quality and safe maize.
6.1.1 Proposed Short-term interventions (Low-hanging ripe fruits)
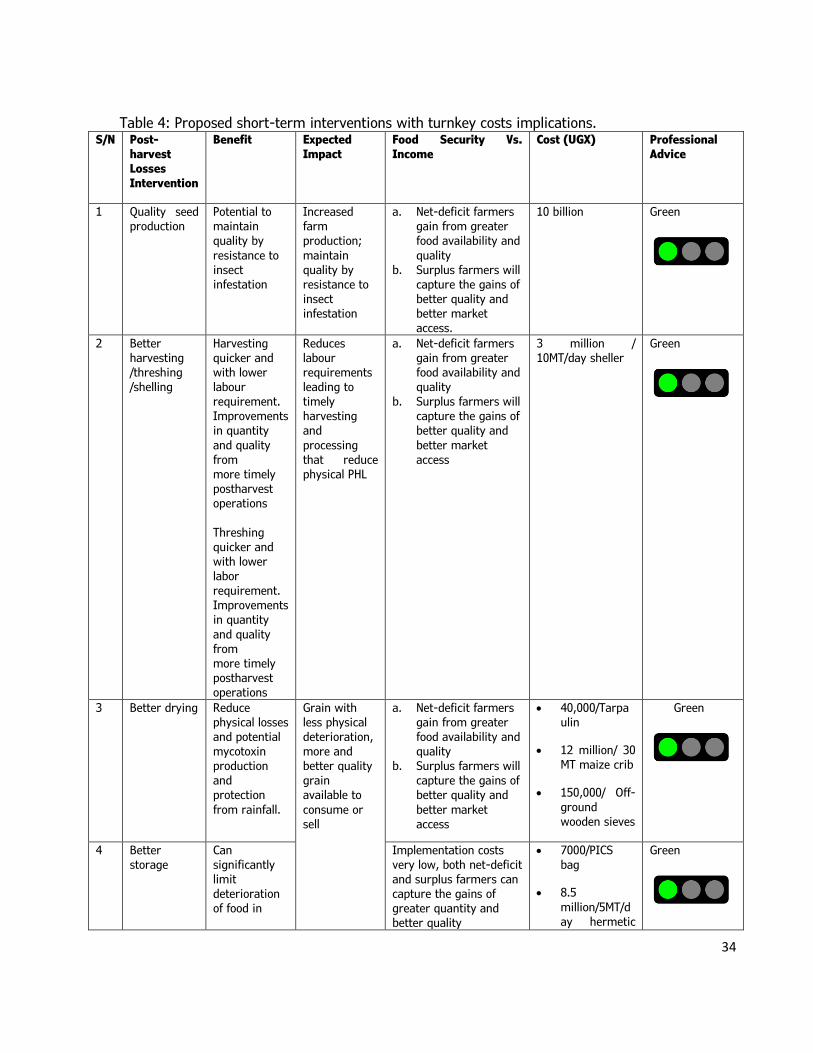
76) Table 4 the proposed short term interventions with Turnkey cost implications. Cost estimates
are ex-works and land acquisition. GOU could first prioritize short terms interventions in maize in the immediate and roll out measures for cassava, bananas and beans later. Afterall, most of PHL interventions will be applicable to cassava and beans.
34
Table 4: Proposed short-term interventions with turnkey costs implications.
S/N Post-harvest Losses Intervention
Benefit Expected Impact
Food Security Vs. Income
Cost (UGX) Professional Advice
1 Quality seed production
Potential to maintain quality by
resistance to insect infestation
Increased farm production;
maintain quality by resistance to insect infestation
a. Net-deficit farmers gain from greater food availability and
quality b. Surplus farmers will
capture the gains of better quality and better market access.
10 billion Green
2 Better harvesting /threshing /shelling
Harvesting quicker and with lower labour requirement. Improvements in quantity
and quality from more timely postharvest operations
Threshing quicker and with lower
labor requirement. Improvements in quantity
and quality from more timely postharvest operations
Reduces labour requirements leading to timely harvesting and
processing that reduce physical PHL
a. Net-deficit farmers gain from greater food availability and quality
b. Surplus farmers will capture the gains of better quality and
better market access
3 million / 10MT/day sheller
Green
3 Better drying Reduce physical losses and potential mycotoxin production and protection
from rainfall.
Grain with less physical deterioration, more and better quality grain available to
consume or sell
a. Net-deficit farmers gain from greater food availability and quality
b. Surplus farmers will capture the gains of better quality and
better market access
• 40,000/Tarpaulin
• 12 million/ 30 MT maize crib
• 150,000/ Off-
ground wooden sieves
Green
4 Better storage
Can significantly limit deterioration of food in
Implementation costs very low, both net-deficit and surplus farmers can capture the gains of greater quantity and better quality
• 7000/PICS bag
• 8.5
million/5MT/day hermetic
Green

35
S/N Post-
harvest Losses
Intervention
Benefit Expected
Impact
Food Security Vs.
Income
Cost (UGX) Professional
Advice
storage. cocoon
5 Collective storage
Can significantly limit deterioration
of food in storage
Efficiency gains from group investment in
more effective storage methods. Grain with less physical deterioration,
more and
better-quality grain available to consume or to sell
Net-deficit farmers gain from greater food availability and quality
• 7000/PICS bag
• 8.5 million/5 MT/day hermetic cocoon
• 5 million/Fired
brick storage
• 1.8 million/Plastic silo
Green
6 Moisture
Monitoring
Inform
decision on postharvest operation
Moisture
Control to control fungi growth; reduction in food contamination
Net-deficit farmers gain
from greater food availability and quality
0.5
million/moisture meter
Green
7 Collective marketing
Aggregate small-scale
production to make
economic sense
Efficiency gains from
group action to aggregate,
move, and sell grain. Improved opportunities to sell grain, improved
prices
a. Net-deficit farmers unable to
participate. b. Surplus farmers
gain through greater market access
Orange – takes time
8 Market information
Inform pricing and price negotiations
Grain sold at highest available market price or bought
at lowest
price Improved opportunities to gain better livelihoods from the
market
a. Net-deficit farmers gain when they have to purchase food
b. Surplus farmers
gain at time of sale
100 million/Market information system
Orange – takes time
9 Inventory Access to credit
Financing available at
a. Net-deficit farmers unable to
Orange -takes

36
S/N Post-
harvest Losses
Intervention
Benefit Expected
Impact
Food Security Vs.
Income
Cost (UGX) Professional
Advice
credit village level to improve
livelihoods from grain production, and upgrade to technologies and
approaches that reduce PHL
participate b. Surplus farmers
gain from greater liquidity
time
10 Warehouse receipts
Motivate for quality
Increased demand for grain of better quality, creating marketing opportunities
for producer group and better livelihoods from grain production.
The minimum
deposit is 10 tons of maize.
a. Net-deficit farmers unable to participate
b. Surplus farmers gain from increased sales of better quality grain
Orange- takes time
6.1.2 Proposed medium-term interventions (Low-hanging unripe fruits)
77) Table 5 shows the proposed medium-term interventions with turnkey cost implications. Cost estimates ex-works and land acquisition.
Table 5: proposed medium term interventions with cost turn implications. S/N Technology Benefits Cost (UGX) Professional
Advice
1 Combine roller
mill, hammer
mill and metal
separator
technologies
• Finer grind and quality flour
achieved
• Less power consumption
• Miller control on the resultant
particle size of the grinded
ingredient enhanced
• Purer flour (with less impurities)
obtained
60 million /1MT
mill/day
Green

37
2 Starch
processing plant
Add value to Ugandan maize and
Initiate starch production in the
country
2 billion/ 10 MT
plant/day
Orange – first
organize Post
harvest handling
3 Improved maize
silage
technologies
• Provide climate resilient animal
feeds to mixed farmers
• Reduce on biowaste arising from
harvested or destroyed maize
fields.
0.5
billion/1T/plant/day
Green
6.1.3 Proposed Long-term interventions (Growing new fruit trees)
78) Table 6 shows the proposed long-term interventions with turnkey cost implications. Cost
estimates do not include civil works and land acquisition.
Table 6: proposed long-term interventions with turn cost implications. S/N Technology Benefits Cost (UGX) Professional
Advice
1 Cornflakes (Flour
mix, extruding,
expansion, drying
& roasting,
blistering, sugar
coating
(flavoring),
roasting &
cooling)
• Unlock maize potential
• Link farmers to niche
markets
• Pay a premium of quality
maize
5 billion/150Kg/hr
Output
Orange – first
organize Post
harvest handling
Currently, there are very few players that relate with the proposed long-term interventions. This is
partly due to the sophiscation of the science and technology that is involved. There is therefore a
need to develop industrial prototypes for the process lines in the interim.
6.2 Cassava
79) Although cassava is widely grown in Uganda, there is lack of adequate cassava to meet both domestic and industrial demand. The strategic vision for the cassava value chain, therefore, is to
transform cassava from a subsistence famine reserve food into a commercial crop that contributes significantly to agro-industry and agribusiness development in Uganda. The mission
is to attract public and private sector investment in the cassava value chain for wealth and employment creation for value chain actors. The goal is to enhance the contribution of cassava to sustainable food security, income generation and economic development of Uganda.

38
6.2.1 Proposed short-term interventions (Low-hanging ripe fruits)
80) Table 7 the proposed short-term interventions with turnkey cost implications. Cost estimates ex- works and land acquisition.
Table 7: Proposed short term interventions with turnkey costs implications.
S/N Post-harvest Losses Intervention
Benefit Expected Impact
Food Security Vs. Income
Cost (UGX) Professional Advice
1 Seed multiplication
Potential to maintain quality and sustain production for
industrial intervention
Increased farm production
a. Net-deficit farmers gain from greater food availability and quality
b. Surplus farmers will capture the
gains of better quality and better market access
8 billion Green
2 Better harvesting
Harvesting quicker and
with lower labour requirement. Improvements in quantity and quality from
more timely postharvest
operations Improvements in quantity and quality
from more timely postharvest operations
Reduces labour
requirements leading to timely harvesting and processing that reduce
physical PHL
a. Net-deficit farmers gain from
greater food availability and quality
b. Surplus farmers will capture the gains of better quality and better
market access
8 million / 10MT/day Cassava harvester
Green
3 Better drying Reduce
physical losses and fungal attack
Roots with
less physical deterioration, more and better quality grain available to
consume or
sell
a. Net-deficit
farmers gain from greater food availability and quality
b. Surplus farmers will capture the
gains of better
quality and better market access
• 15 m/ 12MT
solar operated dryer
• 120 million/10 MT electric dryer
Green
4 Better storage
Can significantly limit deterioration
of food in
Implementation costs very low, both net-deficit and surplus farmers can capture
the gains of greater quantity and better
• 7000/PICS bag
• 8.5 million/5MT/day hermetic
Green

39
S/N Post-harvest
Losses Intervention
Benefit Expected
Impact
Food Security Vs.
Income
Cost (UGX) Professional
Advice
storage quality cocoon
5 Moisture Monitoring
Inform decision on postharvest operation
Moisture Control to control fungi growth; reduction in
food contamination
Net-deficit farmers gain from greater food availability and quality
0.5 million/moisture meter
Green
6.2.2 Proposed medium-term interventions (Low-hanging unripe fruits)
81) Table 8 shows the proposed medium-term interventions with turnkey cost implications. These
are investments that can be done after interventions at farm level. Cost estimates ex-works and land acquisition.
Table 8: Proposed medium-term interventions with cost turn implications. S/N Opportunity Rationale for
prioritization Cost (UGX) Professional Advice
1 Food-grade ethanol • Domestic market is large and growing, with imports
averaging ~30 million litres over the last three years
• Key off-takers in the
spirit industry note interest in buying locally if price can compete with imports
12 billion Orange – first
organize farm level
interventions
2 HQCF for biscuits & snacks
• Substitution of 20-50% has been proven to be feasible in other countries
• Biscuit & snack companies in
particular are focused on cutting costs, and HQCF can be
produced at below the market price of wheat flour
8 billion Orange – first
organize farm level
interventions
3 Cassava starch for • Paints
• All these industries already exist in
20 billion Orange – first

40
S/N Opportunity Rationale for
prioritization
Cost (UGX) Professional Advice
• Automotive & battery • Textiles • Food & beverages • Petroleum
• Pharmaceutical & others
Uganda and this intervention lowers the cost of production and increases
innovation
organize farm level
interventions
In order to to minimize negative environmental impacts for processing of key agricultural
commodities, NDPIII proposes the establishment of two starch and three ethanol processing
factories from cassava in Gulu, Tororo and Lira. These can be the pilot projects for the establishment
of the starch processing technologies in Uganda.
6.2.3 Proposed Long-term interventions (Growing new fruit trees)
82) Table 9 shows the proposed long-term interventions with turnkey cost implications. These are
investments that can be done after interventions at farm level. Cost estimates ex-works and land acquisition.
Table 9: Proposed long-term interventions with cost turn implications. S/N Opportunity Rationale for
prioritization Cost (UGX) Professional Advice
1 HQCF for bread Bread market is large, so even limited uptake would
drive large demand for
HQCF
8 billion Orange – first
organize farm level
interventions
2 Glucose and sweeteners • Annual imports of over 90,000 MT of glucose and significant production of syrups and sweeteners from
imported sugar
• Diverse uses across food & beverage
sector, with
confectionary and brewing industries growing rapidly
20 billion Orange – first
organize farm level
interventions

41
6.3 “Golden” Bananas
6.3.1 Proposed Short-term Interventions (Low- hanging ripe fruits)
83) Table 10 shows the proposed short-term interventions with turnkey cost implications. Cost estimates ex- works and land acquisition.
Table 10: Proposed medium-term interventions with cost turn implications. S/N Opportunity Rationale for
prioritization Cost (UGX) Professional Advice
1 Vacuum-packed peeled
bananas
• Domestic market is
already consuming bananas. By vacuum packing, bananas will enter the
supermarket value chain
5 billion Red – This line of
products is not viable as starter product
2 Banana Leaves and pseudostems
• Used in the cultivation of Oyster mushroom
30 million Orange – first
organize farm level
interventions
6.3.2 Proposed Medium-term interventions (Low- hanging unripe fruits)
84) Table 11 shows the proposed medium term interventions with turnkey cost implications. Cost estimates ex-civil works and land acquisition.
Table 11: Proposed medium-term interventions with cost turn implications. S/N Opportunity Rationale for
prioritization Cost (UGX) Professional Advice
1 Vacuum-packed peeled
bananas
• Domestic market is
already consuming bananas. By vacuum packing, bananas will enter the supermarket value chain
5 billion Red – This line of
products is not viable as starter product
2 Blended and fortified banana flour (powder)
• Local demand for baking flour although arresting enzymatic
reactions is still a challenge
25 billion Red – This line of products is not viable as starter
product

42
S/N Opportunity Rationale for
prioritization
Cost (UGX) Professional Advice
3 Banana starch • Food thickeners, gelling agent, reinforcing agent in tablets, fillers
• Has good Viscosity and swelling properties
• Substitution of cassava starch for textural properties of snacks (crackers)
• Production of starch based edible films
20 billion Orange – first
organize farm level
interventions
4 Pectin • Food thickeners
• Gelling agent
30 billion Red – This line of
products is not viable as starter
product
5 Non-food cellulose from
Pseudostem produced by mix cultures from banana plantation soil -Ref. Zainol and Abdul Rahman (2008)
Sugars, fuel and animal feed
80 billion Red – This line of
products is not viable as starter product
6 a-amylase from Banana peels produced by Aspergillus niger,
Aspergillus fumigatus, Aspergillus flavus, and Penicillium frequestans. – Ref. Adeniran and Abiose (2009)
Food processing 120 billion Red – This line of products is not viable as starter
product
6.3.3 Proposed Long-term Intervention (Growing new fruit trees)
85) Investment in tertiary processing of bananas has the potential to propel Uganda into a first class economy. The vast of products that bananas offer are just phenomenal and indeed make bananas the new gold. This also feeds into the employment opportunity for B.Sc. bioprocessing
Engineering graduate. Table 12 shows the proposed long-term interventions with turnkey cost implications. Cost estimates ex-civil works and land acquisition.
Table 12: Proposed long term interventions with cost turn implications. S/N Opportunity in Bioactive compounds Rationale for
prioritization Cost (UGX) Professional Advice
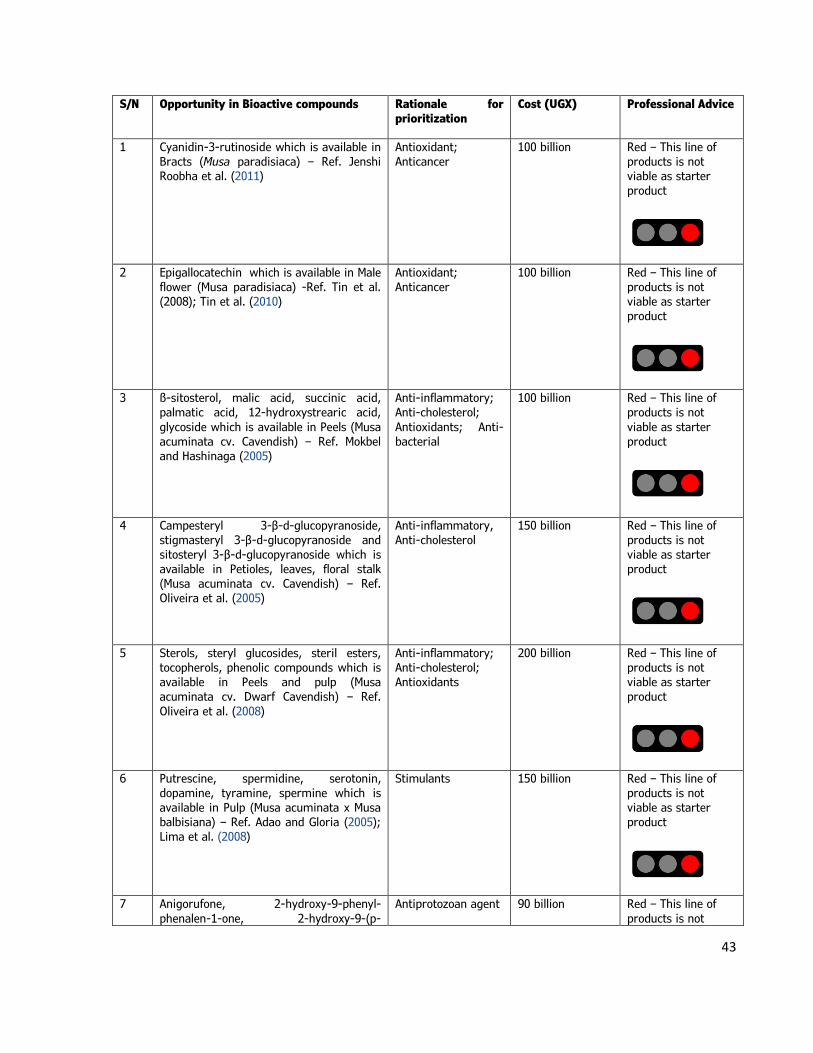
43
S/N Opportunity in Bioactive compounds Rationale for
prioritization
Cost (UGX) Professional Advice
1 Cyanidin-3-rutinoside which is available in Bracts (Musa paradisiaca) – Ref. Jenshi Roobha et al. (2011)
Antioxidant; Anticancer
100 billion Red – This line of products is not viable as starter product
2 Epigallocatechin which is available in Male flower (Musa paradisiaca) -Ref. Tin et al. (2008); Tin et al. (2010)
Antioxidant; Anticancer
100 billion Red – This line of products is not viable as starter product
3 ß-sitosterol, malic acid, succinic acid, palmatic acid, 12-hydroxystrearic acid,
glycoside which is available in Peels (Musa acuminata cv. Cavendish) – Ref. Mokbel and Hashinaga (2005)
Anti-inflammatory; Anti-cholesterol;
Antioxidants; Anti-bacterial
100 billion Red – This line of products is not
viable as starter product
4 Campesteryl 3-β-d-glucopyranoside, stigmasteryl 3-β-d-glucopyranoside and sitosteryl 3-β-d-glucopyranoside which is available in Petioles, leaves, floral stalk
(Musa acuminata cv. Cavendish) – Ref. Oliveira et al. (2005)
Anti-inflammatory, Anti-cholesterol
150 billion Red – This line of products is not viable as starter product
5 Sterols, steryl glucosides, steril esters, tocopherols, phenolic compounds which is available in Peels and pulp (Musa acuminata cv. Dwarf Cavendish) – Ref.
Oliveira et al. (2008)
Anti-inflammatory; Anti-cholesterol; Antioxidants
200 billion Red – This line of products is not viable as starter product
6 Putrescine, spermidine, serotonin, dopamine, tyramine, spermine which is
available in Pulp (Musa acuminata x Musa balbisiana) – Ref. Adao and Gloria (2005); Lima et al. (2008)
Stimulants 150 billion Red – This line of products is not
viable as starter product
7 Anigorufone, 2-hydroxy-9-phenyl-
phenalen-1-one, 2-hydroxy-9-(p-
Antiprotozoan agent 90 billion Red – This line of
products is not

44
S/N Opportunity in Bioactive compounds Rationale for
prioritization
Cost (UGX) Professional Advice
methoxyphenyl)-phenalen-1-one, 2,3-epoxy-9-(p-methoxyphenyl)phenalen-1-one, 2,3-epoxy9-phenyl-phenalen-1-one – Ref. Luque-Ortega et al. (2004)
viable as starter product
8 2-hydroxy-1H-phenalen-1-one and 2-methoxy-1H-phenalen-1-one – Ref.
Otalvaro et al. (2007)
Antifungal agent 45 billion Red – This line of products is not
viable as starter product
9 Thaumatin-like protein Ref. Ho et al.
(2007) Antifungal agent 40 billion Red – This line of
products is not viable as starter product
10 31-norcyclolaudenone – Ref. Ragasa et al. (2007)
Antimicrobial agent 50 billion Red – This line of products is not viable as starter product
6.4 Bean
6.4.1 Proposed Short Term Interventions (Low- hanging ripe fruits)
86) Table 13 shows the proposed short-term interventions with turnkey cost implications. These are investments that can be done after interventions at farm level. Cost estimates ex- works and land
acquisition.
Table 13: Proposed short-term interventions with cost turn implications. S/N Opportunity Rationale for
prioritization Cost (UGX) Professional Advice

45
6.4.2 Proposed Mediumiterm interventions (Low- hanging unripe fruits)
87) Table 14 shows the proposed short medium interventions with turnkey cost implications. These are investments that can be done after interventions at farm level. Cost estimates ex- works and
land acquisition.
Table 14: Proposed medium-term interventions with cost turn implications. S/N Opportunity Rationale for
prioritization Cost (UGX) Professional Advice
1 Drum-dried beans • Shorter cooking times
• Saves energy
20 billion Orange – first
organize farm level
interventions
2 Breakfast snack • Good protein and
fibre
30 billion Orange – first
organize farm level
interventions
1 Hot-air fast-dried beans Fast-dried beans will be
similar to the popular dry ones on the market,
while offering more microbial and pest resistance.
5 billion Orange – first
organize farm level
interventions
2 Canned beans Local demand in armed forces
25 billion Orange – first
organize farm level
interventions
3 Frozen beans Reduced cooking times 3 billion Orange – first
organize farm level
interventions

46
6.4.3 Proposed Long-term intervention (Growing new fruit trees)
88) Table 15 shows the proposed long medium interventions with turnkey cost implications. These are investments that can be done after interventions at farm level. Cost estimates ex- works and
land acquisition.
Table 15: Proposed long term interventions with cost turn implications. S/N Opportunity Rationale for
prioritization Cost (UGX) Professional Advice
1 Bean powders and flours • Boost protein levels in
a recipe and can provide texture, gelation, adhesion, emulsification, and
water retention • High lysine content,
bean flours and powders act as catalysts for the Maillard reaction, helping with browning and thus making them an
excellent addition to gluten-free baked good mixes.
• Bean flour will enhance the chewiness, structure, and crust consumers
expect from a high-quality bread
• Bean powders and flours can also replace wheat flour as thickening agents in
soups and sauces, without negative impact on flavor
• In applications like yogurt, bean powder can help control syneresis and aid in
fermentation • In addition, beans
contain about 21% protein compared to about 6% protein in eggs. Beans also boast 70-80%
globulins and 15-25% albumins, compared to eggs’ 12% and 71%, respectively
20 billion Orange – first
organize farm level interventions

47
S/N Opportunity Rationale for
prioritization
Cost (UGX) Professional Advice
• bean powder can be added to shakes and smoothies to boost protein and fiber
2 Micronutrient bean
flour industrial
fortification
• Fortified bean flour will offer important micronutrients to the vulnerable
communities
7 billion Complete support to the piloting industries
7. Our Survival: The Parish Model for the Implementation of Agro-processing Interventions
89) The second National development Plan (NDP II) mid-term review and NDPI end of term evaluation reports emphasis the need to improve the functionality and range of services provided by sub-counties and parishes in order to effectively address development needs at the local level.
In the situational analysis of NDPIII, it is noted that sub-counties and parishes in particular remain to be dysfunctional in delivering key services such as agricultural extension services,
community bulking and cooperative development. Based on the success agricultural production and commercialization stories reported from Kalangala, Ankole, Kigezi and Toro, NDPIII proposes a major reform around using parishes as centres for delivery of production, marketing and
financial services to farmers, with the parish chief as the focal point in coordinating the supervision of agricultural extension.
90) In general, as summarized in Table 16, the parish model implementation is well-captured in NDPIII programmes of implementation. In regards to agro-processing, key interventions as highlighted are on the establishment of an information management system to provide accurate
info on the performance of, inter alia, agro-processing interventions and the transitional implementation of the parish model to fit the interests of the agro-processing. The second area
of importance is the review and re-orientation of the institutional architecture for Community Development and mobilization.

48
Table 16. NDPIII anchoring programmes for parish model implementation
NDPIII Programme Objective Intervention Players
Community
mobilisation and
Mind-set change
Strengthen institutional
capacity of central and
local governments and
non-state actors for
effective mobilization of
communities
Establishing and
operationalising Community
Development Management
Information
System (CDMIS) at parish and
sub-county level is proposed
MOGLSD8, LGs, OP,
MoLG
Public Sector
Transformation
Deepen decentralization
and citizen participation in
local development
Operationalize the parish
model
MOLG, OPM, OP,
LGs,
UBC, NPA
Regional
Development
Stimulate the growth
potential of the sub-
regions through area-
based agribusiness
LEDinitiatives
Strengthen agricultural
extension services through
increased supervision
andimplementation of the
parish model
LGs, CSOs,
Farmers
grouping
Development Plan
Implementation
Strengthen capacity for
development planning
Strengthen the planning and
development function at the
parish level to bring delivery
ofservices closer to the
people;
MOLG, MOPS, NPA
Strengthen capacity for
implementation to ensure
a focus on results
Review and re-orient the
institutional architecture for
Community Development
(from the parish to the
national level) to focus on
mindset change and poverty
eradication
91) Just like the sub-country structure, the parish model structure extends to many facets of
community engagement. These are represented by five pillars namely, community leadership, mind-set change, Community infrastructure, Local economy and Community Information
systems (Figure 18). In regards to agro-processing, the administrative structures for the fourth pillar on Local economy are important. These will support and favor technology transfer towards
8 MODLSD: Ministry of Gender Labor and Social Development, LG: Local Governments, MoLG: Ministry of Local
Government, MoPS: Ministry of Public Service.

49
the establishment of favor agro-processing. Planning and financing units of government are cognizant of the cost of extending administrative structures from the current 1,671 sub-counties
to 10029 parishes (or wards). Therefore, a lot of novelty is required in resource allocation to
favor the parish model.
3.2 Expected minimum service delivery package at the parish level:
3.1.2 Minimum Basic Service Delivery at Parish Level
Figure 18. The Parish Model Structure
7.1. Funding source options for parish model development
To achieve cost effectiveness in the parish model implementation, Government should leverage the
existing and relevant Grant transfers to Local Governments to support financing of the Parish model as elaborated hereafter. In addition, Government may source for other innovative financing
options/mechanisms, including non- concessional loans. As a short- and medium-term intervention, Government should first exploit the existing Local Government Transfers including affirmative sources before seeking for credit. These include:
• Discretionary Development Equalization Grant • Sector Conditional Grant Transfers- Development and Non-Wage
• External financing from Development Partners- Donors and CSOs, Faith based Organizations, • PPP arrangements with Local Service Providers • Social Corporate Responsibility by Private Sector
• Startup Capital Development Fund- For Minimum Infrastructure Requirements
Pillar 5: Community
information systems
• Community
monitoring &
reporting tools
• ICT collection
• Data
• Feedback
mechanism
• Planning • Implementation
• Monitoring and evaluation
Pillar 1: Community
leadership structures
• PDCs
• Opinion Leaders
• Associations
• Cooperatives
• LC II
• Parish Chiefs
•
Pillar 2: Mind-set
change
• Household
extension out-
reaches
Pillar 3: Community
infrastructure &
services
• Community
Access Roads,
Water for
Production
• Water for
domestic Use &
production
• Clean Energy
• Markets
• Health Care
• Education
Pillar 4: Local
economy
• Priority
Product(s) at least
one
• Food storage
• Food processing
• Financial Services
Results
• Sustainability
• Ownership
• Accountability
50
• Parish SACCO for empowerment- the Youth Livelihood Fund and Uganda Women Entrepreneurship Programme are options.
7.2. Planning and Implementation Mechanism to favor agro-processing
Short-term interventions
a) Planning for administrative data acquisition at parish level.
Under the intervention of Establishing and operationalizing Community Development Management Information System (CDMIS) at parish level, NPA should fast track the linkage of
the administrator platform the web-based design that is currently being developed to marry data acquisition from MDAs and ministries to the Public Finance Management system. The re-
launch of the Community Information System project under Uganda Bureau of Statistics is key in building technical capacity at Parish level to competently collect and report administrative data. This data is key in studying local market trends which will then inform
technology capacity requirements.
b) Establishment of interim parish administrative parish structure for food security. Using local governments and NDPIII programme leadership, zonal agricultural center leaders, parish chiefs and development officers at subcounty level can be structured to aid the
strategic location and installation of food preservation and storage facilities, as well-as mobilizing communities for common market delivery of staple commodities.
Medium-term interventions
a) Establishment of process facilities as per the defined agro-ecological zones. Detailed regional feasibility studies will be conducted with the support of the interim parish administrative structure.
Long-term interventions
a) Establishment of permanent Parish level administrative structures


