Assessment of molecular diversity of greengram [Vigna ... (1... · 2 LEGUME RESEARCH - An...
8
AGRICULTURAL RESEARCH COMMUNICATION CENTRE www.arccjournals.com/www.legumeresearch.in *Corresponding author’s e-mail: [email protected] Legume Research, 40 (1) 2017 : 1-8 Print ISSN:0250-5371 / Online ISSN:0976-0571 Assessment of molecular diversity of greengram [Vigna radiata (L.) Wilzek] through RAPD Gunnjeet Kaur*, Arunabh Joshi, Devendra Jain, Ganesh Rajamani and Divya Vyas Department of Molecular Biology and Biotechnology, Rajasthan College of Agriculture, M.P.U.A.T., Udaipur-313 001, India. Received: 20-04-2015 Accepted: 13-10-2015 DOI:10.18805/lr.v0iOF.9442 ABSTRACT A total twenty three genotypes of green gram (Vigna radiata) were subjected to Randomly amplified polymorphic DNA (RAPD) analysis for molecular characterization. A total of 25 randomly selected decamers were screened, out of which only 15 generated 126 amplification products from which 117 bands were found polymorphic, the average polymorphism being 93.48%. The total number of amplified bands varied between 2 (primer OPP-09) to 17 (primer OPA-1) with an average of 9.5 bands per primer. The overall size of PCR amplified products ranged between 200 bp to 2900 bp. The average Polymorphism Information Content(PIC) was 0.32 ranging from 0.17 to 0.46. Primer OPA-01 and OPP-06 detected two unique bands ranged between 250 bp to 2500 bp in two genotypes (PUSA-672 and HUM-12). Jaccard’s similarity coefficient values ranged from 0.28-0.90 with an average of 0.59. Based on dendrogram generated through UPGMA method and PCA, most of the genotypes got divided into four main clusters. Genotype EC-398885 lay far apart and thus showed maximum genetic distance. The assessment of genetic diversity is a prerequisite and important step for the improvement of any legume crop. Thus, present results of the present study could be further extrapolated to other green gram accessions in Vigna germplasm. Key words: Diversity analysis, PCA, Polymorphism, RAPD, Similarity coefficient, UPGMA. INTRODUCTION Green gram ( Vigna radiata ) also known as mungbean belongs to the family Fabaceae (Leguminoceae). It is a self pollinated crop with genome size 579 Mbp and is diploid (2n) with 22 chromosomes (Arumuganathan and Earle, 1991). Since it is a legume, it possess the ability to fix atmospheric nitrogen (30-50 kg/ha). It is a fast growing crop with a short life span, photo-insensitive and has a dense crop canopy, these qualities gives it a special significance in crop intensification, diversification and conservation of natural resources as well as sustainability of production system. It has strategic position in Southeast Asian countries for nutritional security and as a sustainable crop. As of the 2012- 13 cultivation statistics in India, green gram was grown on 2.75 million hectares with a production status of 1.19 million tonnes and yield of 436 kg/ha (Economic Survey, 2012- 2013). Green gram is rich in easily digestible good quality protein (25.9%) and lysine (504 mg/g) for both human and animals (Saini et al., 2010). The major constraints in achieving high yield of this crop are lack of genetic variability, poor harvesting index and susceptibility to biotic and abiotic stresses. The major factor out of these remains the lack of genetic variability and non availability of suitable ideotypes for various cropping plans (Singh et al., 2013). Although the germplasm collection from India is very large, much diversity has not been reported in morphological characters. Therefore, there is an urgent need to identify genetic divergence based on morpho-molecular basis for utilization in breeding programmes. There are numerous techniques available for assessing the genetic variability and relatedness among crop germplasm. Several studies have shown that DNA markers have many advantages over morphological markers (Bernatzky et al.1989 and Gepts et al.1993). Estimation of the genetic variation in green gram has been carried out using various molecular markers that includes RAPD (Santalla et al. 1998, Afzal et al. 2004, Lavanya et al. 2008, Saini et al. 2010, Undal et al. 2011, Sony et al. 2012 and Bhuyan et al. 2014), AFLP (Bhat et al. 2005), ISSR (Reddy et al. 2008) and SSR (Gwag et al. 2010, Gena et al. 2015). For simple, efficient and economic way of cultivar identification and diversity analysis RAPD-PCR based DNA finger printing has widely used (Gherardi et al ., 1998). RAPD markers have the advantage that they are random and do not require any prior sequence information for implementation. RAPDs are generated by PCR amplification using single, short, synthetic, random oligonucleotide as a primers that acts both as forward as well as reverse primer (Yadav et al., 2014). RAPD analysis can be mostly used to reveal genetic relationship between genotypes of a species (Bhuyan et al, 2014). DNA markers such as RAPD provides a direct
Transcript of Assessment of molecular diversity of greengram [Vigna ... (1... · 2 LEGUME RESEARCH - An...

AGRICULTURAL RESEARCH COMMUNICATION CENTREwww.arccjournals.com/www.legumeresearch.in
*Corresponding author’s e-mail: [email protected]
Legume Research, 40 (1) 2017 : 1-8Print ISSN:0250-5371 / Online ISSN:0976-0571
Assessment of molecular diversity of greengram [Vigna radiata (L.) Wilzek]through RAPDGunnjeet Kaur*, Arunabh Joshi, Devendra Jain, Ganesh Rajamani and Divya Vyas
Department of Molecular Biology and Biotechnology,Rajasthan College of Agriculture, M.P.U.A.T., Udaipur-313 001, India.Received: 20-04-2015 Accepted: 13-10-2015 DOI:10.18805/lr.v0iOF.9442
ABSTRACTA total twenty three genotypes of green gram (Vigna radiata) were subjected to Randomly amplified polymorphic DNA(RAPD) analysis for molecular characterization. A total of 25 randomly selected decamers were screened, out of whichonly 15 generated 126 amplification products from which 117 bands were found polymorphic, the average polymorphismbeing 93.48%. The total number of amplified bands varied between 2 (primer OPP-09) to 17 (primer OPA-1) with anaverage of 9.5 bands per primer. The overall size of PCR amplified products ranged between 200 bp to 2900 bp. Theaverage Polymorphism Information Content(PIC) was 0.32 ranging from 0.17 to 0.46. Primer OPA-01 and OPP-06detected two unique bands ranged between 250 bp to 2500 bp in two genotypes (PUSA-672 and HUM-12). Jaccard’ssimilarity coefficient values ranged from 0.28-0.90 with an average of 0.59. Based on dendrogram generated throughUPGMA method and PCA, most of the genotypes got divided into four main clusters. Genotype EC-398885 lay far apartand thus showed maximum genetic distance. The assessment of genetic diversity is a prerequisite and important step for theimprovement of any legume crop. Thus, present results of the present study could be further extrapolated to other greengram accessions in Vigna germplasm.
Key words: Diversity analysis, PCA, Polymorphism, RAPD, Similarity coefficient, UPGMA.
INTRODUCTIONGreen gram (Vigna radiata) also known as
mungbean belongs to the family Fabaceae (Leguminoceae).It is a self pollinated crop with genome size 579 Mbp and isdiploid (2n) with 22 chromosomes (Arumuganathan andEarle, 1991). Since it is a legume, it possess the ability to fixatmospheric nitrogen (30-50 kg/ha). It is a fast growing cropwith a short life span, photo-insensitive and has a dense cropcanopy, these qualities gives it a special significance in cropintensification, diversification and conservation of naturalresources as well as sustainability of production system. Ithas strategic position in Southeast Asian countries fornutritional security and as a sustainable crop. As of the 2012-13 cultivation statistics in India, green gram was grown on2.75 million hectares with a production status of 1.19 milliontonnes and yield of 436 kg/ha (Economic Survey, 2012-2013). Green gram is rich in easily digestible good qualityprotein (25.9%) and lysine (504 mg/g) for both human andanimals (Saini et al., 2010). The major constraints inachieving high yield of this crop are lack of geneticvariability, poor harvesting index and susceptibility to bioticand abiotic stresses. The major factor out of these remainsthe lack of genetic variability and non availability of suitableideotypes for various cropping plans (Singh et al., 2013).Although the germplasm collection from India is very large,much diversity has not been reported in morphological
characters. Therefore, there is an urgent need to identifygenetic divergence based on morpho-molecular basis forutilization in breeding programmes. There are numeroustechniques available for assessing the genetic variability andrelatedness among crop germplasm. Several studies have shown that DNA markers havemany advantages over morphological markers (Bernatzkyet al.1989 and Gepts et al.1993). Estimation of the geneticvariation in green gram has been carried out using variousmolecular markers that includes RAPD (Santalla et al. 1998,Afzal et al. 2004, Lavanya et al. 2008, Saini et al. 2010,Undal et al. 2011, Sony et al. 2012 and Bhuyan et al. 2014),AFLP (Bhat et al. 2005), ISSR (Reddy et al. 2008) and SSR(Gwag et al. 2010, Gena et al. 2015). For simple, efficientand economic way of cultivar identification and diversityanalysis RAPD-PCR based DNA finger printing has widelyused (Gherardi et al., 1998). RAPD markers have theadvantage that they are random and do not require any priorsequence information for implementation. RAPDs aregenerated by PCR amplification using single, short, synthetic,random oligonucleotide as a primers that acts both as forwardas well as reverse primer (Yadav et al., 2014).
RAPD analysis can be mostly used to revealgenetic relationship between genotypes of a species (Bhuyanet al, 2014). DNA markers such as RAPD provides a direct
2 LEGUME RESEARCH - An International Journal
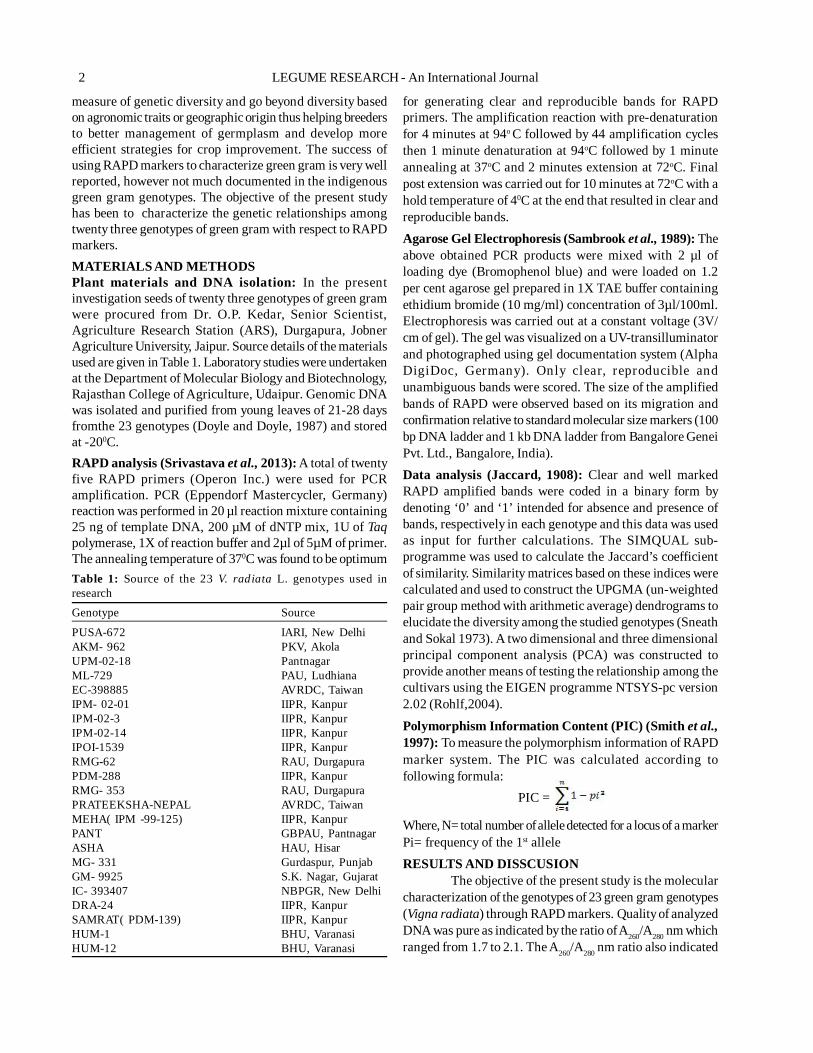
measure of genetic diversity and go beyond diversity basedon agronomic traits or geographic origin thus helping breedersto better management of germplasm and develop moreefficient strategies for crop improvement. The success ofusing RAPD markers to characterize green gram is very wellreported, however not much documented in the indigenousgreen gram genotypes. The objective of the present studyhas been to characterize the genetic relationships amongtwenty three genotypes of green gram with respect to RAPDmarkers.MATERIALS AND METHODSPlant materials and DNA isolation: In the presentinvestigation seeds of twenty three genotypes of green gramwere procured from Dr. O.P. Kedar, Senior Scientist,Agriculture Research Station (ARS), Durgapura, JobnerAgriculture University, Jaipur. Source details of the materialsused are given in Table 1. Laboratory studies were undertakenat the Department of Molecular Biology and Biotechnology,Rajasthan College of Agriculture, Udaipur. Genomic DNAwas isolated and purified from young leaves of 21-28 daysfromthe 23 genotypes (Doyle and Doyle, 1987) and storedat -200C.RAPD analysis (Srivastava et al., 2013): A total of twentyfive RAPD primers (Operon Inc.) were used for PCRamplification. PCR (Eppendorf Mastercycler, Germany)reaction was performed in 20 µl reaction mixture containing25 ng of template DNA, 200 µM of dNTP mix, 1U of Taqpolymerase, 1X of reaction buffer and 2µl of 5µM of primer.The annealing temperature of 370C was found to be optimum
for generating clear and reproducible bands for RAPDprimers. The amplification reaction with pre-denaturationfor 4 minutes at 94o C followed by 44 amplification cyclesthen 1 minute denaturation at 94oC followed by 1 minuteannealing at 37oC and 2 minutes extension at 72oC. Finalpost extension was carried out for 10 minutes at 72oC with ahold temperature of 40C at the end that resulted in clear andreproducible bands.Agarose Gel Electrophoresis (Sambrook et al., 1989): Theabove obtained PCR products were mixed with 2 µl ofloading dye (Bromophenol blue) and were loaded on 1.2per cent agarose gel prepared in 1X TAE buffer containingethidium bromide (10 mg/ml) concentration of 3µl/100ml.Electrophoresis was carried out at a constant voltage (3V/cm of gel). The gel was visualized on a UV-transilluminatorand photographed using gel documentation system (AlphaDigiDoc, Germany). Only clear, reproducible andunambiguous bands were scored. The size of the amplifiedbands of RAPD were observed based on its migration andconfirmation relative to standard molecular size markers (100bp DNA ladder and 1 kb DNA ladder from Bangalore GeneiPvt. Ltd., Bangalore, India).Data analysis (Jaccard, 1908): Clear and well markedRAPD amplified bands were coded in a binary form bydenoting ‘0’ and ‘1’ intended for absence and presence ofbands, respectively in each genotype and this data was usedas input for further calculations. The SIMQUAL sub-programme was used to calculate the Jaccard’s coefficientof similarity. Similarity matrices based on these indices werecalculated and used to construct the UPGMA (un-weightedpair group method with arithmetic average) dendrograms toelucidate the diversity among the studied genotypes (Sneathand Sokal 1973). A two dimensional and three dimensionalprincipal component analysis (PCA) was constructed toprovide another means of testing the relationship among thecultivars using the EIGEN programme NTSYS-pc version2.02 (Rohlf,2004).Polymorphism Information Content (PIC) (Smith et al.,1997): To measure the polymorphism information of RAPDmarker system. The PIC was calculated according tofollowing formula: PIC =
Where, N= total number of allele detected for a locus of a markerPi= frequency of the 1st alleleRESULTS AND DISSCUSION
The objective of the present study is the molecularcharacterization of the genotypes of 23 green gram genotypes(Vigna radiata) through RAPD markers. Quality of analyzedDNA was pure as indicated by the ratio of A260/A280 nm whichranged from 1.7 to 2.1. The A260/A280 nm ratio also indicated
Table 1: Source of the 23 V. radiata L. genotypes used inresearchGenotype Source
PUSA-672 IARI, New DelhiAKM- 962 PKV, AkolaUPM-02-18 PantnagarML-729 PAU, LudhianaEC-398885 AVRDC, TaiwanIPM- 02-01 IIPR, KanpurIPM-02-3 IIPR, KanpurIPM-02-14 IIPR, KanpurIPOI-1539 IIPR, KanpurRMG-62 RAU, DurgapuraPDM-288 IIPR, KanpurRMG- 353 RAU, DurgapuraPRATEEKSHA-NEPAL AVRDC, TaiwanMEHA( IPM -99-125) IIPR, KanpurPANT GBPAU, PantnagarASHA HAU, HisarMG- 331 Gurdaspur, PunjabGM- 9925 S.K. Nagar, GujaratIC- 393407 NBPGR, New DelhiDRA-24 IIPR, KanpurSAMRAT( PDM-139) IIPR, KanpurHUM-1 BHU, VaranasiHUM-12 BHU, Varanasi

Volume 40 Issue 1, 2017 3
that the analyzed DNA was free from contaminants likepolysaccharides, protein and RNA.
RAPD markers having a GC contect of 60 percentor more were used for the identification and determinationof the genetic relationship. In the present study, fifteen RAPD
Table 2: DNA amplification profile and polymorphism generated in V.radiata L. using 15 RAPD primers.
Primer Code Sequence 5’ to 3’ Molecular weight Total number of Polymorphic bands PIC
range (bp) bands amplified (x) Number Frequency(%)OPA-01 CAGGCCCTTC 2500-200 17 17 100 0.31OPA-02 TGCCGAGCTG 2200-700 08 08 100 0.32OPC-08 TGGACCGGTG 2500-300 11 11 100 0.38OPE-03 CCAGATGCAC 1700-300 09 09 100 0.24OPF-17 AACCCGGGAA 1500-400 06 04 66.66 0.17OPF-19 CCTCTAGACC 2800-200 11 11 100 0.37OPK-06 CACCTTTCCC 2100-700 07 07 100 0.34OPK-07 AGCGAGCAAG 2900-200 10 10 100 0.38OPP-04 GTGTCTCAGG 1800-300 10 08 80 0.35OPP-05 CCCCGGTAAC 1800-250 09 08 88.88 0.30OPP-06 GTGGGCTGAC 1800-250 12 08 66.66 0.21OPP-07 GTCCATGCCA 1800-500 03 03 100 0.20OPP-08 ACATCGCCCA 700-500 03 03 100 0.42OPP-09 GTGGTCCGCA 900-600 02 02 100 0.46OPP-10 TCCCGCCTAC 1800-300 08 08 100 0.44Total 126 117 93.48 0.32
primers, among the 25 primers from OPA/E/F/C/K/P serieswere amplified presented in Table 2.
RAPD analysis (Figure 1) showed a high percentof polymorphism (93.48%). Out of 126 amplified bandsobtained 117 were polymorphic. The total number of
Fig 1: RAPD profiles of Vigna radiata L. genotypes generated through (a) OPP04 (b) OPP05. G1-G23 represents G1-PUSA672; G2-AKM962; G3-UPM02-18; G4-ML-729; G5-EC-398885; G6-IPM-02-1; G7- IPM-02-03; G8-IPM02-14; G9-IPOI-1539; G10-RMG-62; G11-PDM-288; G12-RMG-353; G13-PRETEEKHSA-NEPAL; G14-MEHA; G15-PANT; G16-ASHA;G17-MG331;G18-GM9925, G19-IC-393407; G20-DRA-24; G21-SAMRAT;G22-HUM-1 and G23-HUM-12. M1-100 bp DNA Ladder and M2- 1000 bp DNA Ladder

4 LEGUME RESEARCH - An International Journal
amplified bands varied between 2 (primer OPP-09) and 17(primer OPA-01) with an average of 9.5 bands per primer.The overall size of PCR amplified products ranged between200 bp to 2900 bp. The percent polymorphism ranged fromas low as 66.66 (OPF-17 and OPP-06) to as high as 100(OPA-01, OPA-02, OPC-08, OPE-03, OPF-19, OPK-06,OPP-07, OPP-08, OPP-09 and OPP-10). A similar findinghas also been reported by Datta et al., (2012).
The average PIC was 0.32 and values ranged 0.17to 0.46. The lowest and the highest PIC value were recordedfor primer OPP-17 and OPP-09 respectively. Reddy et al.,(2008) reported that accessions with most distinct DNAprofiles are likely to contain the greatest number of novelalleles. It is these accessions that are likely to uncover thelargest number of unique and potential agronomically usefulalleles. Similarly two unique bands were detected in twogenotypes viz., PUSA-672 and HUM-12 with 2 RAPDprimers (OPA-01 and OPP-06). The size of these uniquebands ranged from 250-2500 bp.Genetic relationship and cluster tree analysis: Jaccard’ssimilarity coefficient values ranged from 0.28-0.90 with anaverage of 0.59 (Table 3). The average similarity across allthe genotypes was found out to be 0.59 showing that genotypewere moderately diverse genetically. Maximum similarityvalue of 0.90 was observed between genotypes MEHA andASHA and MG-331 and ASHA. Similarly minimumsimilarity value of 0.28 was observed between genotypesRMG-353 and EC-398885 and these genotypes were highlydiverse at genetic level. Similar results were also shown bySaini et al., (2010).
The 23 genotypes of V. radiata L. were grouped bysubjecting the Jaccard’s similarity values (Table 3) toUPGMA clustering which are divided in 4 major clusters ata similarity coefficient of 0.64 on dendrogram (Fig 2). ClusterI included three genotypes viz., PUSA-672, UPM-02-18 and
Fig 2: Dendrogram constructed with UPGMA clustering method among 23 genotypes of V. radiata L. using RAPD.
IPM-02-3 at similarity coefficient of 0.64. It was furtherdivided into one sub-cluster that included two genetypesPUSA-672 and UPM-02-18 which were similar to each otherat 0.71 similarity coefficient. Cluster II included 2 genotypesAKM-962 and ML-729 which were related to each other at0.74 similarity coefficient. Cluster III was the main clusterhaving thirteen genotypes viz., IPOI-1539, RMG-62,PRATEEKSHA NEPAL, DRA-24 , SAMRAT, PDM-288 ,RMG-353 , MEHA , ASHA ,MG-331, PANT, HUM-12 andIC-393407 at similarity coefficient of 0.73 . Cluster III wasfurther divided into three subclusters. Subcluster I containedtwo genotypes DRA-24 and SAMRAT which were similarto each other at similarity coefficient of 0.87. Subcluster IIcontained two genotypes PDM-288 and RMG-353 whichwere similar to each other at similarity coefficient of 0.85.Sub cluster III contained two genotypes MEHA and ASHAwhich were similar to each other at similarity coefficient of0.90.
The cluster IV included four genotypes viz., GM-9925, IPM-02-01, IPM-02-14 and HUM-1 at similaritycoefficient of 0.65. It could be divided into one subclusterthat contained GM-9925 and HUM-1 found related to eachother at similarity coefficient of 0.80. Genotype EC-398885fell apart from all the clusters. Similar results were obtainedby Datta et al. (2012), the dendrogram revealed the geneticsimilarity among the twenty four varieties of green gram hadranged from 0.45 to 0.78. The RAPD cluster pattern includedtwo main clusters, Cluster I comprising of sixteen varietiesin five sub clusters (IA to IE) and cluster II comprises offour varieties.
Two and three dimension principal componentanalysis based on RAPD data (Fig. 3) showed similarclustering of 23 genotypes as evident from cluster treeanalysis. Dice similarity coefficients ranged from 0.58 to0.98. Most of the genotypes tended to cluster mainly into

Volume 40 Issue 1, 2017 5
Tab
le 3
: Ja
ccar
d’s s
imila
rity
coef
ficie
nt f
or R
APD
pro
file
gene
rate
d by
aga
rose
gel
ele
ctro
phor
esis

6 LEGUME RESEARCH - An International Journal
Fig 3: (a) Two Dimensional Principal Component Analysis (b) Three Dimensional Principal Component Analysis based on Euclidean Cluster AnalysisUsing RAPD Markers.

Volume 40 Issue 1, 2017 7
four clusters. Cluster I included three genotypes (PUSA-672,UPM-02-18 and IPM-02-3) while cluster II included twogenotypes (AKM-962 and ML-729) that lay closer. ClusterIII was the major one that included thirteen genotypes viz.,IPOI-1 5 3 9, RM G -6 2 , P RAT E E K S HA N E PAL, DRA- 2 4 , SAMRAT, PDM-288, RMG-353, MEHA, ASHA,MG-331, PANT, HUM-12 and IC-393407. Cluster IVincluded four genotypes viz., GM-9925, IPM-02-01, IPM-02-14 and HUM-1. Amongest all, the genotype EC-398885was lying apart and showed maximum genetic distance.Similar results have been observed by Saini et al., (2010).
In the present study, EC-398885 genotype is foundto be most diverse among the 23 genotypes. This genotypehad the lowest similarity (0.28) with the genotype RMG-353 indicating\ indicate that genotypes were highly diverseat genetic level and that EC-398885 genotype might be mostfrequently used in the green gram varietal developmentprogramme. RAPD studies have numerous advantages likewider applicability, accuracy and speed of estimation. Thus,
RAPD analysis proved in the present to be applicable forgenotyping, genetic diversity and relatedness evaluation. Theanalysis revealed narrow genetic base among green gramgenotypes used in the study. In conclusion, the RAPDpatterns obtained from our study can serve as a vital input tothe conventional method of var ietal iden tification, futuregermplasm management and marker assisted selection toimprove the efficiency of green gram germplasmimprovement in future breeding that relies solely onmorpho-molecular characterization. Such information mayalso be useful in selecting diverse parents and monitoringthe genetic diversity periodically in the breeders’ workingcollection of green gram.ACKNOWLEDGEMENT
Gunnjeet Kaur acknowledges UGC for sponsoringSRF (Maulana Azad Fellowship). Authors are gratefullyacknowledged the financial assistance from RKVY project“Validation of important crop varieties through DNAfingerprinting”.
REFERENCESAfzal, M.A., Haque, M.M. and Shanmugasundaram, S. (2004). Random Amplified Polymorphic DNA (RAPD) Analysis
of Selected Green gram [Vigna radiata (L.)Wilczek] Cultivars. Asian Journal of Plant Sciences, 3: 20-24.Arumuganathan, K. and Earle, E.D. (1991). Nuclear DNA content of some important plant species. Plant Molecular
Biology Report , 9: 208-218.Bernatzky, R. and Tanksley, S.D.(1989).Restriction fragments as molecular markers for germplasm evalution and
utilization, in The use of plant genetic resources. Cambridge University Press, New York: 353-362.Bhat, K.V., Lakhanpaul, S. and Chadha, S. (2005). Amplified fragment length polymorphism (AFLP) analysis of genetic
diversity in Indian green gram [Vigna radiate (L.) Wilczek] cultivars. Indian Journal of Biotechnology, 4:56-64.Bhuyan, S.I., Hossain, M.S., Islam, M.M., Begum, S.N., Urbi, Z. and Hossain, M.S. (2014). Molecular Assessment of
Genetic Diversity and Relationship in Selected Green gram Germplasms. Biotechnology, 13: 126-134.Datta, S., Gangwar, S., Kumar, S.,Gupta, S.Rai, R, Kaashyap, Singh ,P., Chaturvedi, S.K., Singh ,B.B. and Nadarajan,
N.(2012).Genetic Diversity in Selected Indian Green gram [Vigna radiata (L.) Wilczek] Cultivars Using RAPDMarkers. American Journal of Plant Sciences, 3:1085-1091.
Doyle, J.J. and Doyle, J.L. (1987). A rapid DNA isolation procedure for small quantities of fresh leaf material. PhytochemicalBulletin, 19: 11-15.
Economic Survey. (2012-2013). Ministry of Finance, Department of Economic Affairs, Economics Division Governmentof India, New Delhi.
Jena, B., Panigrahi, K. K., Baisakh, K., Das, T. R. (2015). Genetic Diversity as Assessed by Agronomical Traits andMolecular Markers in Local Land Races of Green gram (Vigna radiata L.) Under Rice Fallow Condition. MolecularPlant Breeding, 6: 1-7.
Gepts, P. (1993). The use of molecular and biochemical markers in crop evolution studies. Evolution Biology, 27: 51-94.Gherardi ,M., Mangin, B., Goffinet, B., Bonnet, D. and Huguet, T. (1998). A method to measure genetic distance between
allogamous populations of alfalfa (Medicago sativa) using RAPD molecular markers. Theory Application Geneticia,96: 406-412.
Gwag, J.G., Dixit, A., Park, Y.J., Ma, K.H., Kwon, S.J., Cho, G.T., Lee, G.A., Lee, S.Y.,Kang ,H.K. and Lee, S.H.(2010).Assessment of genetic diversity and population structure in green gram. Genes & Genomics , 32: 299-308.
Jaccard, P. (1908). Nouvelles researches surla distribution florale. Societe Vaudoise des Science Natulelles Bulletin,44: 233-170.
Lakhanpaul, S., Chadha, S. and Bhat, K.V. (2000). Random amplified polymorphic DNA (RAPD) analysis in Indian mungbean (Vigna radiata (L.) Wilczek) cultivars. Genetica , 109: 227-234.
Lavanya, G.R., Srivastava, J. and Ranade, S.A. (2008). Molecular assessment of genetic diversity in green gram germplasm.Journal of Genetics, 87: 65–74.

8 LEGUME RESEARCH - An International Journal
Reddy,K.S., Souframanien, J., Reddy, K.S. and Dhanasekar, P. (2008). Genetic diversity in mung bean as revealed by SSRand ISSR markers. Journal of Food Legumes, 21: 15- 21.
Rohlf, F.J. (2004). NTSYS-PC. Numerical taxonomy and multivariate analysis system. Exeter Software, New York.Saini, M., Singh, S., Hussain, Z. and Yadav, A. (2010). RAPD analysis in green gram (V. radiata (L.) Wilczek): I. Assessment
of genetic diversity. Indian Journal of Biotechnology, 9:137-146.Sambrook, J., Fritschi, E.F. and Maniatis, T. (1989). Molecular Cloning: A Laboratory Manual, Cold Spring Harbor
Laboratory Press, New York.Santala, M., Power, J.B. and Davey, M.R. (1998). Genetic diversity in green gram germplasm revealed by RAPD
markers. Plant Breeding, 117: 473-478.Singh, A.K., Mishra, A. and Shukla, A. (2010). Genetic evaluation and identification of genetic donors in black gram
(Vigna mungo) revealed by agro-morphological traits and seed storage protein analysis. World Applied SciencesJournal, 10: 477-488.
Singh, A., Dikshit, H.K., Jain, N., Singh, D. and Yadav, R.N.(2013).Efficiency of SSR,ISSR and RAPD markers in molecularcharacterization of green gram and other Vigna species. Indian Journal of Biotechnology, 13: 81-88.
Sneath, P.H.A. and Sokal, R.R. (1973). Numerical Taxonomy. San Francisco: Freeman.Smith, J.S.C., Chin, E.C.L., Shu, H., Smith, O.S., Wall, S.J., Senior, M.L., Mitchell, S.E., Kresovich, S. and Zeigle, J.
(1997). An evaluation of the utility of SSR loci as molecular markers in maize (Z. mays L.): comparisons with datafrom RFLPs and pedigree. Theoretical and Applied Genetics, 95: 163-173.
Sony, S.K., Habib, M.A. and Islam, M.N. (2012). Genetic diversity analysis of thirteen green gram (V. radiata L.) cultivarsusing RAPD markers. Bangladesh Journal of Botany, 41: 169-175.
Srivastava, P., Pandey, A. and Sinha, D.P. (2013). Genetic diversity analysis in different varieties of black gram usingRAPD markers. International Journal of Biological Research, 1: 43-48.
Undal, V.S., Thakare, P.V., Chaudhari, U.S., Deshmukh, V.P. and Gawande, P.A. (2011). Estimation of Genetic Diversityamong wild Vigna species revealed by RAPD Markers. Annals of Biological Research, 2: 348-354.
Yadav, K. Yadav, S.K., Yadav ,A., Pandey, V.P. and Dwivedi, U.N.(2014). Comparative Analysis of Genetic Diversityamong Cultivated Pigeonpea (Cajanus cajan (L) Millsp.) and Its Wild Relatives (C. albicans and C. lineatus)Using Randomly Amplified Polymorphic DNA (RAPD) and Inter Simple Sequence Repeat (ISSR) Fingerprinting.American Journal of Plant Sciences, 5: 1665-1678.
Williams, G.K., Kubelik, A.R., Livak, K.L., Rafalshi, J.A. and Tingey, S.V. (1990). DNA polymorphisms amplified byarbitrary primers are useful as genetic markers. Nucleic Acid Research, 18: 6531-6535.