ASSESSMENT OF MINERAL AND EXTRACTIVE ... CONTENTS ACKNOWLEDGEMENTS v CONTENTS 6 SUMMARY 8 1....
63
ASSESSMENT OF MINERAL AND EXTRACTIVE MATERIALS RESOURCES QUEENSLAND CRA/RFA STEERING COMMITTEE
Transcript of ASSESSMENT OF MINERAL AND EXTRACTIVE ... CONTENTS ACKNOWLEDGEMENTS v CONTENTS 6 SUMMARY 8 1....

ASSESSMENT OF MINERALAND EXTRACTIVEMATERIALS RESOURCES
QUEENSLAND CRA/RFA STEERINGCOMMITTEE


For more information contact:Regional Forest Assessments, Department of NaturalResources
Block C, 80 Meiers RoadINDOOROOPILLY QLD 4068
phone: 07 3896 9836fax: 07 3896 9858
Forests Taskforce, Department of Prime Minister andCabinet
3-5 National CircuitBARTON ACT 2600
phone: 02 6271 5181fax: 02 6271 5511
© Queensland Government 1999© Commonwealth of Australia 1999Forests Taskforce Department of Prime Minister andCabinet, January 1999This work is copyright. Apart from fair dealing for thepurpose of private study, research, criticism or review aspermitted under the Copyright Act 1968, no part of thisdocument may be reproduced by any means without thejoint permission from the Joint Commonwealth andQueensland RFA Steering Committee.
This project has been jointly funded by the Queenslandand Commonwealth Governments. The work undertakenwithin this project has been managed by the jointQueensland / Commonwealth CRA RFA SteeringCommittee and overseen by the Social and EconomicTechnical Committee.
Optional further details about contributors and creditsgoes here.
ISBN 0 642 27378 2
Cover photo/s: n/a
DisclaimerThe views and opinions expressed in this report are thoseof the author and do not necessarily reflect the views ofthe Queenland and Commonwealth governments. TheQueensland and Commonwealth governments do notaccept responsibility for any advice or information inrelation to this material.


v
ACKNOWLEDGEMENTS
Assessments of mineral resources and the potential (undiscovered) mineral resources of SoutheastQueensland were prepared by Berkman, D.A (1996) for minerals, and by Siemon, J.E. and Holmes,K.H. (1996) for extractive materials resources. These assessment reports were prepared for theQueensland Department of Mines and Energy. The two reports were consolidated in a singletechnical report by the Bureau of Resource Sciences and QDME. Mineral resource and mineralpotential layers were then constructed in a Geographic Information System (GIS) environmentusing the maps and data provided in reports by Berkman and by Siemon and Holmes for use in theRegional Forest Agreement process.
Queensland Department of Mines and Energy (QDME)Warwick Willmott, Len Cranfield, Robert Barker, Cecil Murray, John Greig
Bureau of Resource SciencesBruce McConachie, Subhash Jaireth, Yanis Miezitis, Keith Porritt, Stuart Girvan, Aden McKay,Andrew Lucas, Tim Johns, Neal Evans, Neil Corby (Australian Geological Survey Organisation),Lindsay Highet AGSO.

6
CONTENTS
ACKNOWLEDGEMENTS v
CONTENTS 6
SUMMARY 8
1. INTRODUCTION 10
2. LEGISLATION AND REGULATION RELEVANT TO EXPLORATION, MINING AND EXTRACTIVEMATERIALS 11
3. GEOLOGICAL SETTING AND MINERAL DEPOSIT STYLES 13
4. CURRENT MINING AND EXTRACTIVE ACTIVITIES 144.1 Minerals 144.2 Extractive materials 15
5. POSSIBLE NEW MINES 165.1 Forested areas 165.2 Cleared areas 17
6. MINERAL EXPLORATION AND MINING ACTIVITIES 18
7. ASSESSMENT OF POTENTIAL MINERAL AND EXTRACTIVE MATERIAL RESOURCES 207.1 Methodology 207.2 General comments on extractive materials potential 237.3 Summary of potential mineral and extractive materials resources 26
8. APPLICATION OF RESULTS OF MINERAL RESOURCE ASSESSMENT IN RESERVE DESIGN FORSOUTH EAST QUEENSLAND REGION 29
9. CONCLUSIONS 29
10.APPENDICES 31
11. METADATA 33
12. REFERENCES 63
LIST OF TABLES
TABLE 1 SUMMARY OF MINES IN FORESTED AREAS IN 1994-95 11
TABLE 2: SUMMARY OF POTENTIAL MINERAL RESOURCES AS AT SEPTEMBER 1997 18
LIST OF FIGURES
FIGURE 1. RELATIONSHIP BETWEEN LEVELS OF RESOURCE POTENTIAL AND LEVELS OFCERTAINTY 21
FIGURE 2. WEIGHTED MINERAL POTENTIAL SCORES OF MINERAL DEPOSIT TYPES ATDIFFERENT LEVELS OF MINERAL POTENTIAL 21

7
LIST OF MAPS
MAP 1. SOUTHEAST QUEENSLAND GEOLOGY
MAP 2. SOUTHEAST QUEENSLAND PRODUCING MINES, MAJOR PROSPECTS AND MINERALOCCURRENCES
MAP 3. COMPOSITE MINERAL POTENTIAL MAP OF GOLD, BASE METALS AND HEAVY MINERALSANDS
MAP 4. COMPOSITE MINERAL POTENTIAL MAP OF COAL AND OIL SHALE
MAP 5. COMPOSITE MINERAL POTENTIAL MAP OF EXTRACTIVE AND INDUSTRIAL MINERALAND SIGNIFICANT QUARRIES
MAP 6. WEIGHTED COMPOSITE MINERAL POTENTIAL

8
SUMMARY
This report has been prepared for the joint Commonwealth/State Steering Committee whichoversees the Comprehensive Regional Assessment (CRA) of forests in the Southeast QueenslandCRA region.
This agreement will determine the future of the region’s forests and will define those areas neededto form a comprehensive, adequate and representative (CAR) reserve system and those availablefor ecologically sustainable commercial use.
This report was undertaken to assess known and potential (undiscovered) mineral and extractiveresources of the region.
In the forested parts of the Southeast Queensland Region there are significant mining operations forheavy minerals and coal, as well as smaller mines for gold and industrial minerals. The region is ofmoderate to high potential for a number of mineral deposit types and is likely to containundiscovered deposits (Berkman 1996; Siemon and Holmes 1996). For about two thirds of theregion the mineral potential is either low, or is unknown due to insufficient data. Parts of the regionare currently being geologically remapped which should reduce the areas of unknown mineralpotential.
Forested areas were delineated from 1: 250 000 scale maps prepared by the Forest AssessmentSection of the Resource Management Institute, that showed areas of forest interpreted from LandsatTM satellite imagery flown on 15 October 1991.
In 1996 there were 147 mining leases of total area 230 square kilometres within the 35 000 squarekilometres of forested land within the region, which represent 0.65% of the forest areas. Thecommitted exploration expenditure in the Southeast Queensland region was $4.1 million in 1995-96whereas the total mineral expenditure in Queensland in 1996 was $180 million.
The forested parts of the region contain active mining operations at 19 centres, that produced coal,rutile-zircon-ilmenite, gold, sand, magnetite and other industrial minerals to a total value of $199.2million in 1996-97 ($190.6 million in 1994-95 year) and total royalties for that year were $6.02million. Most of this value is accounted for by the two largest mines which are the rutile-zircon-ilmenite mining operations on North Stradbroke Island, and the coal mine at Tarong supplying theTarong powerhouse. They are followed by the silica sand mining on North Stradbroke Island. TheBurgowan coal mine closed in early 1997.
Berkman (1996) estimated that in 1994-95 there were 644 persons directly employed in mining andexploration activities in forested areas of the region. These figures do not take into account themultiplier effect of employment in primary production.
The cleared parts of the region contain the coal mines of the West Moreton (Ipswich to Amberley)district, a gold mine at Gympie, the Kingaroy kaolin workings and the Flinders dolomite operation.Total 1994-95 coal production from the West Moreton district was 4.3 Mt of saleable coal, worth$187 million. Gold production at Gympie was about 10 000 oz for 1994-95, valued at $5 million.The total value of production from mines in cleared areas was about $192.5 million.

9
The value of mine production from the forested and unforested areas is about the same. However,the production from the forested areas was obtained from 19 centres, compared with four centres inthe cleared land.
Extractive materials are vital for development of urban areas and infrastructure and are requiredwithin economical transport distance of major markets, in this case Brisbane, the Gold andSunshine Coasts and major regional centres. Because of their relative low value compared to othercommodities, extractives are not generally traded between regions and the opportunity costs ofprecluding access will depend on the location of other extractive resources in the region.
Supply of extractive materials is important for the more settled parts of the region. Most sourcesand known potential deposits are in cleared areas, but some important ones are in forested land.Some relevant statistics for production of extractive resources in the region include:
Quarry Rock from all major Quarries in region Production 1994/95 >16.7million tonnesClay from Mining Leases in region Production 1994/95 >1.45million tonnes
The region has Queensland’s largest quarry, Hymix at Nerang, with more than one million tonnesproduced in 1994/95. This quarry is partly in State Forest and total production of quarry rock fromState Forest in the region in 1994/95 was in excess of 2.6 million tonnes as compared with a totalquarry rock production of in Queensland in 1994-95 of about 22 million tonnes.
Known deposits which may be mined in forested parts of the region in future include the AgnesWaters-Middle Island-Hummock Hill Island heavy mineral deposits, where reserves exceed 2.4 Mtof ilmenite, rutile and zircon. The Mount Rawdon gold deposit, about 15 kilometres southeast ofMount Perry, has a resource of 22 Mt of ore of average grade 1.2 g/t gold and 4 g/t silver.Development of the Spring Mountain coal resource, southeast of Ipswich, could proceed byunderground mining (at a rate up to 2 Mt/year) within 10 years. Other known deposits in forestedparts of the region include the Ban Ban zinc deposit, about 30 km southerly from Biggenden andthe Norton gold deposit.
The Stuart oil shale is a world class deposit located in unforested part of the region close toinfrastructure at Gladstone. Other oil shale deposits are at Nagoorin south of Gladstone and Lowmeadnorth of Bundaberg.
Berkman (1996) and Siemon and Holmes (1996) reported potential for 27 types of deposits.Mineral deposit types include 6 types of metalliferous deposits, 2 types of heavy mineral sanddeposits, 4 types of coal deposits, oil shale deposits, 10 types of industrial mineral deposits, and 4types of deposits for extractive materials.

10
1. INTRODUCTION
The National Forest Policy Statement recognises the need to consider access for mineralexploration, mining and extractive activities in deciding on land use for public native forests. Dueto the incomplete nature of information on minerals resources and because exploration is a dynamicinformation-gathering process, continued access to land is a significant issue for the miningindustry and for future mineral development.
Access for exploration, mining and extraction varies with land tenure. Access arrangements of suchtenures have a large bearing on the level, and type, of exploration and mining that occurs in aregion. Transparent and well-defined access arrangements reduce uncertainty and facilitateexploration and mining activities. Access provisions of relevant legislation are outlined below.
Before changes to land tenures or access arrangements are made, it is important to understand thecurrent mining and extraction industry and assess the potential for new discoveries and production.
Assessments of the mineral and extractive resources of the Southeast Queensland BiogeographicRegion (‘Southeast Queensland region’ or the ‘region’) were commissioned in 1996 by theQueensland Department of Mines and Energy and the results were reported in “The MiningIndustry and Mineral Potential of the Forested Areas within the Southeast QueenslandBiogeographic Region” by D A Berkman, and the associated “Assessment of Extractive MaterialsPotential for the Southeast Queensland Biogeographic Region” authored by J E Siemon and K HHolmes. In these assessments the term extractive materials refers primarily to quarry rock, sand andgravel not administered under the mining legislation, but also includes brick clay and buildingstone which are administered in that way. An assessment of petroleum resources was not originallyundertaken due to low potential in forested parts of the region and the ability of petroleumexplorers to access most land tenures.
The aim of this report is to draw together this information in a format and terminology consistentwith previous studies of Regional Forest Agreement (RFA) to provide input of mineral resourcesdata in the development of the RFA. In particular this assessment addresses the followingquestions:
■ Production from current mining operations in forested areas■ Queensland State income from mining and exploration activities in forested areas■ Number of people employed in mining and exploration■ Level of annual exploration expenditure, and trends in mining and exploration activity■ Comparison of mining and exploration activities in forested and unforested areas A broadscale qualitative assessment was also made of the potential (undiscovered) mineral andextractive resources in the region The ‘forested areas’ of the region were identified from 1:250 000 scale maps prepared by the ForestAssessment Section of the Resources Management Institute, that showed areas of forest interpretedfrom Landsat TM satellite imagery, using bands 2, 3, 4 and 5, on scenes flown on 15 October,1991. Boundaries were drawn to separate areas predominantly under forest from thosepredominantly cleared. Thus the ‘forested areas’ include some interspersed cleared land and viceversa, but a finer discrimination is not required for this study. Vegetation in forested areas may be

11
closed forest, eucalypt forest, woodland or heath, in various stages of disturbance, but the foreststructure is still essentially present. Plantations of introduced species were excluded from theforested areas. Since the assessments by Berkman (1996) and Siemon and Holmes (1996) the boundary of theSoutheast Queensland Region was changed. This necessitated the deletion of 20 mineral potentialtracts from the study by Berkman, minor alterations to several and the incorporation of one newtract to cover the Stuart Oil Shale deposit. This report outlines: current operating mines, identified mineral deposits, the potential for severaldeposit types, indicators of the region’s potential mineral value, factors affecting this value, as wellas the potential for extractive materials deposits. The report considers identified mineral deposits incleared parts of the region where such deposits signify the potential for the discovery of similardeposits in the forested parts. The Southeast Queensland Region is moderately to highly prospective for a number of mineraldeposit types and is therefore likely to contain undiscovered deposits. In forested parts of the regionthere are significant heavy mineral and coal mines, as well as smaller mines for gold and industrialminerals. There are several known but undeveloped deposits. Many old deposits and mineraloccurrences have attracted on-going exploration interest. There are further major coal, gold andindustrial mineral operations and undeveloped deposits in cleared parts of the region. Supply of extractive materials is important for the more settled parts of the region. Most sourcesand known potential deposits are in cleared areas, but some important ones are in forested land. It is important to note that no assessment of potential (undiscovered) mineral resources can ever beconsidered ‘final’. New information, new concepts and better understanding of geologicalprocesses continually change the perceived prospectivity of a region and the availability, usefulnessand implications of these can change over time. There are also dynamic aspects to marketinformation that will affect perceptions of a region's prospectivity, for example mineral prices andextraction costs may change substantially over time.
2. LEGISLATION AND REGULATION RELEVANT TO EXPLORATION,MINING AND EXTRACTIVE MATERIALS
In Australia ownership of mineral resources and control of mineral exploration and developmentlargely lies in the hands of the state and territory governments. The Commonwealth governmenthas control over mining and exploration activities outside three nautical miles offshore and overradioactive substances in the Northern Territory. It also exercises its constitutional powers to exertcontrol over the way states and territories access and use their mineral resources. The principal legislation covering mineral exploration and mining in Queensland is the MineralResources Act 1989, which is the responsibility of the Minister for Mines and Energy andadministered by the Department of Mines and Energy. Safety aspects are administered under theMines Regulation Act 1968. Petroleum exploration and production, including pipelines, areadministered by the same authorities under the Petroleum Act 1923, but there are few petroleum-related activities in the region.

12
All exploration and mining activities are subject to a range of environmental conditions. Forexploration permits there are requirements to: ■ conform to a code of conduct;■ lodge an Environmental Management Plan for any major disturbing activities and for activities
in sensitive areas when required by the Minister; and■ submit a Final Rehabilitation Report on surrender. For mining there are requirements to: ■ lodge a satisfactory Environmental Management Overview Strategy (EMOS), as part of any
application for a mining lease (for major projects an Environmental Impact Statement may berequired);
■ reach a Compensation Agreement with land holders (including those for leasehold land) beforegrant;
■ lodge a security deposit against satisfactory environmental performance before grant;■ lodge a satisfactory Plan of Operations before commencing mining;■ submit to audits and inspections by Departmental officers and to take any remedial action when
directed. Environmental Protection Policies under the Environmental Protection Act 1994 are currentlybeing negotiated for mining and petroleum. Exploration and mining are not permitted in National Parks and Conservation Parks, which aregazetted under the Nature Conservation Act 1992. Exploration and production of petroleum arepermitted under conditions decided by the Department of Environment. Such activities are possiblein multiple-use Resources Reserves declared under the Nature Conservation Act 1992, with theconsent of any Trustees gazetted. In mineralised areas the Trustees are usually the Department ofEnvironment and the Department of Mines and Energy and consent is given in accordance with amanagement plan. In State Forests, Timber Reserves and other Crown Reserves, exploration andmining is possible with the consent of the owners or trustees, usually the Minister for NaturalResources. In practice conditions are usually imposed on such consent to protect the values of theReserves. The administration of quarry rock, sand and gravel on private land is controlled by LocalGovernments through provisions of their town planning schemes, although the degree of controlvaries. Some Cities and Shires have Extractive Industry zoning while in others extraction is aconsent use in rural zonings. Sand and gravel extraction from in-stream sites in non-tidal and tidalareas is controlled by the Departments of Natural Resources, and Environment respectively.Processing of materials can not be undertaken in-stream. If processing is undertaken on shore,operators are required to have an approval under the Local Government town planning scheme andpay levies when using local roads. If no processing is undertaken then no Local Governmentapproval or road maintenance levies are required. Hard rock resources within State Forests andCrown Land are now controlled by the Department of Primary Industries subject to approval fromthe Department of Natural Resources. Operations must also conform to the requirements of therelevant town plan. The extraction of clay, building stone, silica sand and foundry sand requires a Mining Leaseadministered by the Department of Mines and Energy. Mining and exploration are currently excluded from significant mineralised parts of southeastQueensland because of Government decisions to create National Parks on Fraser Island, the

13
Cooloola sand mass and Moreton Island, and encroaching urban settlement around the Ipswich andWest Moreton coalfields. The extractive industries face on-going difficulties in securing access tonew deposits at economical distances from urban markets because of rapid urban and ruralresidential expansion in the coastal parts of the region.
3. GEOLOGICAL SETTING AND MINERAL DEPOSIT STYLES
The region contains five major geological domains (geotectonic provinces, (Maps 1, 2)), brieflydescribed below in order of decreasing age. A more comprehensive description of the geology ofthe region is provided in Murray (1990, pp. 1431-1450), and in reports of the QueenslandGeological Survey. The New England Fold Belt is the basement throughout the region, and its rocks outcropthroughout its length. It was an active continental margin from Late Silurian to Middle Triassictime (about 415 to 230 million years ago), much like the western coast of South America today.Chains of active volcanoes parallel to the old coastline fed volcanic sourced sediment to the eastinto continental shelf and oceanic trench basins. These sediments were deformed and uplifted byearth movements associated with collisions of major crustal plates. Subsequent sedimentary basinsformed by extensional faulting, and were in turn uplifted by earth movements. Towards the end ofthis period the fold belt was intruded by Permo-Triassic granitoids, from granite to diorite incomposition. The Gympie Province, along the present eastern edge of the Fold Belt, is a unique unit, containingPermian and Early Triassic volcanics and metasediments accreted to the Belt along a major thrustfault. It comprises a younger part of the New England Fold Belt. The Yarrol Province comprisesthe northwest part of the New England Fold Belt. The Gympie and Yarrol Provinces are notdifferentiated on the accompanying geological map. Most of the mineral deposits in the Fold Belt are genetically related to the intrusion of the Permo-Triassic granitoids, and are of porphyry, skarn or structure-controlled vein type. The porphyry(copper or molybdenum) deposits were formed during the final stages of emplacement of thegranitoids, and are associated with small plutons (of diameter around 5 kilometres) and areas ofhydrothermal alteration. The largest examples are the Coalstoun and Mount Cannindah copper andthe Anduramba molybdenum deposits. The skarn deposits are hosted by limy sediment near themargins of the intrusives, with the larger examples the Many Peaks and Glassford Creek copper-gold, the Mount Biggenden magnetite and Ban Ban zinc-lead deposits. The structure-controlledvein deposits were formed in fault planes or shear zones in the granitoids, along the granitoid-sediment contact, or in the sediment near that contact. The more important of these are clusters ofdeposits at the Gympie gold, Mount Perry copper-gold and Calgoa copper fields. Some vein-typedeposits are distant from granitoid bodies, and may have been formed by metamorphic fluids.Limestone deposits occur in the rocks of shelf origin. Metasediments and metavolcanics of the FoldBelt are significant sources of quarry rock for the Brisbane and Gold Coast districts. The Triassic Volcanic Province comprises several large areas of terrestrial acid-intermediatevolcanics and minor sediment, along the northeastern edge and in troughs within the Fold Belt.These are younger than the main pulse of granitoid intrusion in the Fold Belt, and immediatelyprecede or are contemporaneous with the coal measure sediment of the Callide, Tarong andIpswich Basins, on the western edges of the Fold Belt.

14
Potentially commercial deposits of this age include the volcanogenic (epithermal) Mount Rawdon,Manumbar and North Arm gold. The volcanogenic gold areas are considered most likely to be theresource base for the largest future mines in the region. Triassic volcanics, hornfels associated withgranites and the granites themselves are important sources of quarry rock in some districts,particularly the Sunshine Coast. The succeeding Triassic coal basins are important for the coal mined at Ipswich and Tarong andshale mined for clay in Ipswich and Brisbane. The Clarence Moreton Basin, near the southwestern edge of the region, contains continentalsediment and coal, including the Jurassic Walloon Coal Measures. These contain large resources ofsteaming coal which are used in power stations within the region and for export, and also containresources of bentonite. Sandstone is mined for building blocks, facings and tiles at Helidon. The Maryborough and Nambour Basins, on the eastern edge of the region, contain Jurassiccontinental sedimentary successions, Early Cretaceous silicic to intermediate volcanics, plusmarine and coal measure rocks, and isolated granitoid plutons. There are no important metalliferous deposits in these basins. The Maryborough Basin contains theCretaceous Burrum Coal Measures, which are considered to have some potential for further coaldeposits in the Burrum Syncline. The Tiaro Coal Measures outcrop along the western edge of theBasin, but are considered to hold low potential for economic coal deposits. Important shale depositsmined for clay occur on the Sunshine Coast and near Maryborough and Bundaberg. Tertiary and Quaternary sediment and volcanics cover much of the surface of the region. Theyinclude the Narrows Graben, Nagoorin and Lowmead Basins, in the north of the region, which areisolated basins of Tertiary sediment containing large resources of oil shale. Some dolomiteresources are present in Tertiary sediments south of Ipswich, and small deposits of perlite anddiatomite occur in Tertiary volcanic sequences at Numinbah (west of the Gold Coast) and BlackDuck Creek (Gatton area). Kaolin clays occur in Tertiary sediments and volcanics near Kingaroy,and brick clays are mined in Brisbane, Ipswich and the Sunshine Coast. Tertiary basalts andintrusive trachyte plugs are important sources of quarry rock. The Quaternary coastal sand plains and dunes contain major deposits of heavy minerals (ilmenite,rutile and zircon), silica sand and foundry sand. Older source areas of ilmenite in the Montodistrict, have weathered and eroded to produce eluvial and alluvial deposits of ilmenite in soil andriver sediment. Bauxite and manganese deposits, formed by weathering of older rocks, are belowcommercial size and grade. Major streams draining the older rocks of the fold belt are sources ofcoarse sand and gravel, while other streams draining the sedimentary basins and Tertiary sedimentsare sources of finer sands.
4. CURRENT MINING AND EXTRACTIVE ACTIVITIES
4.1 Minerals In 1996 there were 147 mining leases of total area 230 square kilometres within the 35 000 squarekilometres of forested land in the region, which represent 0.65% of the forest areas. The leasenumber, area, owner’s name, principal commodity, and number of employees are listed inAppendix 1 of Berkman (1996). Individual production in the 1994-95 year, value of this

15
production, and royalty and rents paid to the State have been recorded but remain confidential forcommercial reasons. The producing mines, major prospects and mineral occurrences are shown onMap 2. Significant quarries for extractive materials are shown on Map 5 and listed in Appendix A. In 1994-95 the forested parts of the region contained active mining operations at 19 centres, thatproduced coal, rutile-zircon-ilmenite, gold, sand, magnetite and other industrial minerals to a totalvalue of $190.6 million. In 1996-97 the total production value amounted to $199.2 million (Table1). Royalty payments in 96/97 on mine production in forested areas amounted to $6.022 million.The Burgowan coal mine closed in early 1997. The sites of the current mining operations areshown on Map 2. The two largest mines, namely the rutile-zircon-ilmenite mining operations onNorth Stradbroke Island, and the coal mine at Tarong supplying the Tarong powerhouse, accountfor most of the mine production value. They are followed by the silica sand mining on NorthStradbroke Island. The royalty returns show that in 1994-95 there were 603 persons employed on mining leases inforested areas, of which 586 were employed at the 19 operating mines. Employment on explorationactivities (see below) is estimated at 41 persons. Thus the total direct employment in mining andexploration activities in forested areas is 644 persons. In 1996-97 at least 541 persons wereemployed at 19 operating mines but employment figures were not available for four of these mines.These figures do not take into account the multiplier effect of employment in primary production,by which the employment of each person in mining generates several other positions in otherindustries. The cleared parts of the region contain the coal mines of the West Moreton (Ipswich to Amberley)district, the recently opened gold mine at Gympie, the Kingaroy kaolin workings and the Flindersdolomite operation. Production of coal for the 1994-95 year was dominated by the Ebenezer,Jeebropilly, and Wattle Glen Extended mines, with a combined output of about 3.8 Mt of saleablecoal. The other six mines in this district produced a total of about 500 000 t of coal. Total 1994-95 production from the West Moreton district was 4.3 Mt of saleable coal, worth $187 million.Gold production at Gympie was about 10 000 oz for 1994-95, valued at $5 million. The total valueof production from mines in cleared areas was about $192.5 million. The value of mine production from the forested and unforested areas is about the same. However,the production from the forested areas was obtained from 19 centres, compared with four centres inthe cleared land.
4.2 Extractive materials Extractive materials are vital for development of urban areas and infrastructure and are requiredwithin economical transport distance of major markets, in this case Brisbane, the Gold andSunshine Coasts and major regional centres. Because of their relative low value compared to othercommodities, extractives are not generally traded between regions and the opportunity costs ofprecluding access will depend on the location of other extractive resources in the region. Description of the major quarries, sand, gravel and clay pits is beyond the scope of this report, butdetails can be found in Siemon and Holmes (1996). Most operations are in cleared land but somemajor rock quarries are in State Forest on the Sunshine and Gold coasts and clay workings are inState Forest near Maryborough and Bundaberg.

16
The importance of the extractive materials industry in the region can be gauged from the followingstatistics. Largest Quarry in Queensland (Hymix at Nerang); Production 1994/95 >1 million tonnes partly in State Forest) Quarry Rock from State Forests in region Production 1994/95 >2.6 million tonnes Value >$1.2 million Quarry Rock from all major Quarries in region Production 1994/95 >16.7million tonnes Clay from Mining Leases in region Production 1994/95 >1.45million tonnes Total quarry rock production in Queensland 1994/95 ≈ 22 million tonnes O’Flynn (1992) indicated that the per capita consumption of quarry rock, sand and gravel for theMoreton Region was between 8 and 10.3 tpa per person. Information from local Governments inthe rapidly expanding parts of the Sunshine Coast and Gold Coast indicated that the figure may beas high as 14 tpa per person, while in the less developed areas in the west of the region the figure isobviously quite low. Mining leases held for clay within the region cover 5906 ha on which rentals paid to theDepartment of Mines and Energy total $124 039. Production from the leases totalled 1.45 milliontonnes in 1994/95 with royalties of approximately $363 000. Because many of the current buildingstone operations (sandstone at Helidon) were current at the time of the introduction of the currentMineral Resources Act, few operations are required to pay a royalty to the Department of Minesand Energy and total production is not known.
5. POSSIBLE NEW MINES
5.1 Forested areas The Agnes Waters-Middle Island-Hummock Hill Island heavy mineral deposits are in forestedcoastal land in Miriam Vale Shire, north and south of the Town of 1770. Mining Leases andExploration Permits here contain reserves exceeding 2.4 Mt of ilmenite, rutile and zircon. This isthe largest known unworked resource of heavy minerals on the Queensland coast outside of NorthStradbroke Island which has not been alienated by other land uses. As with each of the potentialmine developments mentioned below, development here is dependent on world prices (currentprices and expectations of future prices), and on the capital and operating costs of mining andprocessing. The Mount Rawdon gold deposit, about 15 kilometres southeast of Mount Perry, has a resource of22 Mt of ore of average grade 1.2 g/t gold and 4 g/t silver. The deposit is in Perry Shire, and about2 kilometres east of the eastern edge of Timber Reserve 296. A mine feasibility study undertakenrecently assumed that ore would be produced at around 2 Mt/yr, thus allowing a mine life of about11 years. The ore would be processed by heap leaching, to yield about 70 000 oz of gold per year.The project was expected to require a work force of about 100, and it was anticipated that manyemployees will be drawn from the region, and will live at Mount Perry or other townships nearby.Gross mine income was predicted to be about $40 million per year. The project would have a majorfinancial impact on Perry Shire, which had an estimated resident population of 404 in mid-1994(Regional Statistics Queensland, 1995). In 1997 the majority company in the project decided not toproceed, but its interests have been purchased by another company and investigations arecontinuing.

17
Development of the Spring Mountain coal resource, southeast of Ipswich, could proceed byunderground mining (at a rate up to 2 Mt/year) within 10 years. Although the development is in aforested area, underground mining is expected to have little effect on surface conditions. The Ban Ban zinc deposit is about 40 kilometres southeasterly from Gayndah and 30 km southerlyfrom Biggenden. The deposit is in Biggenden Shire, and about 2 km north of the northern tip ofState Forest 259. It has a resource of 1.5 Mt at 7.5% zinc and 9 g/t silver; development is dependenton an increase in the price of zinc. The Goondicum ilmenite project is about 30 kilometres east of Monto, and has a total resource, ineluvial and alluvial deposits, of 112 Mt of average grade 4.3% ilmenite. Some of the alluvialresource is in sediment of the Burnett River, outside the western boundary of the region. Theportion of the resource within the region is in Monto Shire, and just north of State Forest 54. MontoMinerals NL was formed in January 1994 to develop these deposits, and plans (subject to theresults of a detailed feasibility study) to produce 85 000 t of ilmenite in the first year of operations,increasing to more than 450 000 t in subsequent years. Marketing experts advised Monto Mineralsthat this quantity of ilmenite is saleable, at prices of $103-122/t . Using $100/t of ilmenite sold forsimplicity of calculation, gross income is estimated to be $8.5 million in the first year and$45 million in full production. The development would have a small but significant impact onMonto Shire, which had an estimated population of 3005 in mid-1994 (Regional StatisticsQueensland, 1995). The Norton gold deposit is in Calliope Shire, about 40 kilometres southerly from Calliope, in a‘corridor’ of timbered land between State Forests 645 and 719. Drilling in Mineral DevelopmentLicence 130, in part of the Norton Gold Field, has defined a resource of 120 000 t of average grade6 g/t gold. Subject to the grant of mining title, and determination of mine feasibility, it is planned tomine this resource in an open pit and truck the ore to a treatment plant at Eidsvold (Australian GoldAnnual, 1996, p. 78). The mining and transport operation commenced in early 1997 using localcontractors. Initial reserves are adequate for only a short term (1-2 years), but there are hopes forextensions.
5.2 Cleared areas The Stuart oil shale is a world class deposit situated close to infrastructure at Gladstone. The resourcecontains 3 billion barrels of oil in situ at an average grade of 93 litres per tonne (at zero moisture).Construction of the $250 million Stage 1 of Stuart, a demonstration plant involving production ofup to 4,500 barrels of oil per day, is under way and due for completion in mid 1999. Sitepreparation for the processing plant commenced in early August 1997 and the main infrastructureitem, a $40 million retort, has been ordered, with a 22 month construction time. Close-spacedgeotechnical drilling on the initial entry for the open cut has been in progress since late July 1997.Stuart Energy (Management) Pty Ltd has been awarded “Major Projects Facilitation” status by theFederal Government, ensuring that all issues relating to the Commonwealth are addressed in atimely and efficient manner and that any unnecessary overlap between the Commonwealth andState Governments is avoided. The proposed mining operation at Stuart is a sunrise industry forQueensland and, if successful would pave the way for development of eight other proven oil shaleresources in Queensland which contain more than 27 billion barrels of oil.

18
6. MINERAL EXPLORATION AND MINING ACTIVITIES
The exploration process starts with assessments of very large regions and is then systematicallynarrowed down as the exploration target becomes better defined. The direct costs facing explorersincrease as the target area becomes smaller and exploration methods become more intense. Theenvironmental impact associated with exploration also increases as the area being exploredbecomes smaller and the exploration methods used become more invasive (for example, drilling),unless special steps are taken to reduce such impacts. Compared with exploration, mining generally covers relatively small areas involves greaterdisturbance to the land surface in the immediate area of the mine, and may leave changedlandforms when mining is finished. Mining is generally seen as posing greater difficulties in termsof compatibility with other land uses.
Many potential environmental effects of mining activities can be eliminated or mitigated, though ata cost to the mining company. Given the relatively limited areas of land disturbed by the operationof a mine, water pollution often represents the major potential threat to the environment frommining. This can be controlled by using techniques such as impoundment and evaporation oftailings, sedimentation, filtration and pH neutralisation. Modern site rehabilitation, at thecompletion of operations, can restore many features of the landscape that existed before miningbegan, substantially, replacing and assisting the re-establishment of vegetation and reducing thepotential for pollution from the former mine site.
Thus, part of the impact on the environment caused by exploration and mining activities can beeliminated or mitigated, although this increases exploration and mining costs and reduces the likelyprofitability of these activities. If it is feasible to avoid certain types of environmental damage, thenan assessment is required of the nature of the environmental damage and the costs of avoiding thisdamage. If it is not feasible to avoid certain types of environmental damage, then the costs need tobe assessed against the economic benefits of the exploration and mining activities.
It is important to gather information about the range of attributes and values of areas which offeralternative uses — such as environmental attributes and conservation values of an area as well asthe mineral potential of the area and the mining options for those resources.
The information about environmental and mineral values is dynamic, and the availability,usefulness and implications of this information can change over time. Continuing advances of thekind seen in environmental research, exploration geoscience and mining technologies may renderinformation obsolete, and previous land use decisions may need to be periodically reconsidered.There are also dynamic aspects to market information that will affect its relevance over time:mineral prices and extraction costs, for example, may change substantially. Similarly, the value ofparticular environmental resources may change over time.
Exploration companies manage the financial risk of exploration by a series of safeguards, whichinclude: 1. Ore search in a number of regions, for a variety of commodities - which might be called‘spreading the risk’; 2. Exploring in regions in which the legislative framework provides an assurance that a discoverycan be mined, allows for an acceptable return from a discovery, and has precedents which suggestthat the rules will not be capriciously changed; and

19
3. Selecting those regions in which exploration is perceived to have the highest chance of success. Exploration proceeds in stages, in which each step involves an increase in the level of expenditure,but a decrease in the level of risk as the likelihood of success improves. The many stages may besimplified to : 1. Area selection - This stage comprises the choice of a prospective region, and then selecting thepart(s) of that region with the best chance of success, by a study of published geological data andinformation from unpublished exploration reports, culminating in an application for an explorationtitle. Note that each geoscientist brings a personal bias to this stage, and often a different set ofcritical factors necessary for ore formation and exploration success - thus the same area may beprospected by many mining companies, over a long period of time, as different objectives ortheories are used. 2. Reconnaissance exploration - This involves an examination of all of the area of the explorationtitle, using a mixture of exploration methods, which may include regional geochemical, geologicaland geophysical surveys. There is a multitude of techniques available for each of these three classesof survey, and every geoscientist and mining company has an individual preference. The objectiveof this stage is the reduction of the area of interest from hundreds of square kilometres to a numberof targets, each a few square kilometres in area. As in the first stage, exploration potential is notexhausted by a few regional exploration surveys, and it is fallacious to assume that an area is‘completely’ explored. 3. Prospect evaluation - This is a careful examination of each of the target areas, by a mixture ofdetailed geological, geophysical and geochemical surveys, culminating in drilling of some of thetargets. As in stages 1 and 2, this procedure is not a conclusive test of the area, as some methods arenot applied to some targets, all targets are not drilled, and in many programmes the targets drilledare only tested by a few shallow holes. Most exploration programs are terminated, during any of the three stages, by a decision that resultsto date show that the chance of success is now unacceptably low. The information collected duringeach program is made available to other explorers, in ‘open file’ reports held by the Department ofMines and Energy. These provide an essential guide to the area selection process. All of the factors which companies require before investing in an exploration programme - depositsof many minerals, a satisfactory legislative system, and zones of high mineral potential - areavailable in the region. Figures for employment in exploration in the region are not readily available. Explorationcompanies are not required to provide statistics on the number of persons employed, but this can beestimated from the level of expenditure. The total expenditure commitment for exploration titles inforested areas for the 1995-96 year was $4.148 million. In Berkman (1996) it was assumed thatevery $100 000 represents a person’s annual income, it is estimated that 41 persons are employedin exploration. By comparison, the total expenditure on mineral exploration in Queensland in 1996was $180 million. As at February 1996 the Exploration Permits within the region, contained a total area of 11 054square kilometres. All or parts of 82 of these titles, of area 6276 square kilometres, were in forestedparts of the region. The extent of Exploration Permits and Mineral Development Licences in July1996, (which may be somewhat different because of the volatility of these tenures) is shown in

20
Figures 3A, 3B, 3C in Berkman (1996). The area covered by the Exploration Permits does notindicate any particular bias towards exploring in either forested or cleared land.
7. ASSESSMENT OF POTENTIAL MINERAL AND EXTRACTIVE MATERIAL RESOURCES
7.1 Methodology The mineral potential of the Southeast Queensland region was assessed by determining the types ofmineral deposits likely to be found within the geological framework known or believed to existthere. The general methodology used is a modified version of one developed by the United StatesGeological Survey (USGS), and has been used successfully for mineral resource assessments ofwilderness areas in North America and elsewhere. This approach identifies areas or zones (tracts)occupied by geological units that could contain particular types of mineral deposits. Thequalitative assessment methodology is described in publications by Marsh, Kropschot andDickinson (1984), Taylor and Steven (1983), and by Dewitt, Redden, Wilson and Buscher (1986).The method has been modified and extended by BRS for use in a GIS environment. A qualitative assessment of the potential resources of an area is an estimate of the likelihood ofoccurrence of mineral deposits which may be of sufficient size and grade to constitute a mineralresource. The term ‘mineral resource’ is restricted to material, the extraction of which is judged tobe potentially viable now or some time in the next 25 years. Only the deposit types judged to bemost likely to constitute significant resources in the region have been assessed in detail. In the Southeast Queensland region, zones of mineral potential were identified by Berkman (1996)and Siemon and Holmes (1996) for 27 different types of deposits. In addition the Maryborough andClarence Moreton Basins have low potential for hydrocarbons, mainly gas. The boundaries of the zones (or tracts) of mineral potential were identified from the distribution ofthe mineral occurrences, also taking into account geology and geophysical results (Berkman, 1996).Each zone contains mineral occurrences and deposits of the same metal or mineral, formed by thesame process, in the same geological setting. Each zone contains evidence that the ore-formingprocess has operated, generally in the form of an ore deposit, and often has many examples of thegenetic class. There are few zones of mineral potential defined on the basis of associatedgeoscientific criteria without direct evidence of mineralisation. The zones were defined from the information and data available as at early 1996. Furtherexploration, or regional geological and geophysical mapping, will allow a more precise location ofthe zones, and will identify new zones. Users of this appraisal are advised to check the descriptionand location of zones against geological maps and the latest exploration and mapping results. The mineral potential of each zone (or tract) was assessed in the report by Berkman (1996) as: ■ Likely, ie there is a strong possibility that the zone contains more deposits,■ Possible, indicating that there is some chance that the zone contains further deposits, or■ Alienated, including areas of known resources where closer settlement, environmental
constraints or other interests effectively preclude development for the foreseeable future,■ Low or unknown, with only a slight or unknown chance of further deposits. Only the areas of likely, possible and alienated potential were shown on maps. Areas of low andunknown potential are left blank and are not distinguished.

21
For the purpose of this report, Berkman’s categories for the levels of mineral potential (namely‘likely’ and ‘possible’) were converted to the terminology used in other RFA areas (Figure 1). Eachzone as defined and described in the report by Berkman (1996) was examined by a panel of DMEand BRS geologists. As a general rule, areas with ‘likely’ potential were equated with ‘moderate-high’ potential and areas of ‘possible’ potential were equated with ‘low-moderate’ potential. Some
H HIGH POTENTIAL
U and L
Decreasing level of potential
↓
M MODERATE POTENTIAL
UNKNOWN
L LOW POTENTIAL
POTENTIAL
Decreasing level of knowledge of the area being assessed → FIGURE 1. RELATIONSHIP BETWEEN LEVELS OF RESOURCE POTENTIAL AND LEVELS OF
CERTAINTY of the zones of ‘likely’ potential were equated with ‘high’ potential where Berkman’s descriptionsindicated a higher level of potential. For this report, ‘standard scores’ were allocated according to a subjective ranking of levels ofmineral potential: 18 (for high potential), 12 (moderate-high), 6 (moderate), 2 (low-moderate), and1 (low). Unknown potential is not scored. The subjective scores provide a very broaddifferentiation between different levels of mineral potential for processing and presentation in GISenvironment. The assessment however is still qualitative, and the scores are not meant to betranslated into quantitative probabilities of potential. Estimation of quantitative probabilities wouldrequire a full scale quantitative assessment of undiscovered mineral resources. The same standardscores were used for assessments of the other Regional Forest Agreement areas. In addition, each deposit type was assigned a ranking. The rankings of deposit types weredetermined by a panel assessment by persons familiar with the geology of the area, the reports byBerkman (1996) and Siemon and Holmes (1996), the relative values of the commodities of theregion and the type of assessment methodology being used. The panel comprised geologists of theQueensland Department of Minerals and Energy, Brisbane and of the Bureau of Resource Sciences,Canberra. In assigning a rank to a deposit type the panel first considers the relative significance of the deposittype by comparing it with other types of deposits. For example, in similar circumstances a majoreconomic limestone deposit, in most cases, is going to be less significant and have a lower rank

22
(say 2) than a major economic coal deposit (say 8). Secondly, the panel then evaluates the rank ofthe deposit type by considering the area in question. For example in Southeast Queensland theavailable evidence suggest that more coal deposits of world scale significance will be found(Walloon type coal) and the rank is adjusted upwards from 8 to 9. A limestone deposit near a majorpopulation centre, with a high demand for limestone, like Southeast Queensland could have its rankadjusted upwards from 2 to 3 whereas a similar deposit limestone type near Tennant Creek may beadjusted downwards from 2 to one. On the other hand a type of coal of variable quality and limitedmineable seam widths like the Burrum coal has a rank of only 1. ‘Weighted scores’ for mineral potential tracts were derived by multiplying the standard scores withmineral deposit rankings. The values were then used to produce a weighted composite mineralpotential map (Map 6) to define the areas of highest mineral potential for the most important typesof mineral deposits. The tracts were weighted in this way to differentiate tracts with potential forsignificant types of deposits like Walloon coal and gold from less significant types of deposits likelimestone. The weighted mineral potential map provides a broad guide to the relative significanceof mineral potential tracts for different types of deposits. But as stated previously, this is still aqualitative assessment and the ranking of levels of mineral potential and deposit types is subjective.The assessment is not a quantitative economic analysis of different types of deposits. Several petroleum wells have been drilled in the Clarence-Moreton Basin, however no zones ofpetroleum potential have been identified and potential is unknown. TABLE 2: SUMMARY OF POTENTIAL MINERAL RESOURCES AS AT SEPTEMBER 1997 Mineral deposit class Deposit type Ranking
ofdeposit
type(Index)
Mineralpotential
Standardscore
Weightedscore
Area of tract (sqkm)
% of regioncovered by
tract
Gold deposits Volcanogenic (epithermal) golddeposits
7 H 18 126 215 0.35%
7 M-H 12 84 408 0.66%
7 L-M 2 14 4,380 7.12%
Alienated 223 0.36%
Structure/Vein-hosted golddeposits
4 H 18 72 1,822 2.96%
4 M-H 12 48 5,043 8.20%
4 L-M 2 8 448 0.73%
Other metalliferous Porphyry copper-molybdenum 7 H 18 126 65 0.11%
deposits 7 M-H 12 84 228 0.37%
7 L-M 2 14 81 0.13%
base metal skarn deposits:copper-gold-lead-zinc; copper-gold-magnetite; zinc-lead-gold
2 M-H 12 24 302 0.49%
Volcanogenic hydrothermaldeposits: mercury; copper-
lead-zinc-gold
2 M-H 12 24 539 0.88%
Base metal vein deposits:copper-gold; copper-lead-zinc;copper-gold-silver;lead-silver
2 M-H 12 24 430 0.70%
2 L-M 2 4 207 0.34%
Shoreline andalluvial/eluvial placer
deposits
Coastal heavy mineral sanddeposits (ilmenite-rutile-zircon)
10 H 18 180 128 0.21%
10 M-H 12 120 71 0.11%
Alienated 1,128 1.84%
Alluvial/eluvial placers: ilmenite-gold
4 M-H 12 48 39 0.06%
Coal deposits Burrum 1 M-H 12 12 155 0.25%

23
1 L-M 2 2 274 0.45%
Walloon 9 H 18 162 289 0.47%
9 M-H 12 108 15 0.02%
9 L-M 2 18 1,740 2.83%
Tarong 7 H 18 126 50 0.08%
7 M-H 12 84 90 0.15%
7 L-M 2 14 355 0.58%
Ipswich 5 H 18 90 53 0.09%
Alienated 129 0.21%
Oil shale deposits Oil shale deposits 8 H 18 144 21 0.03%
8 M-H 12 96 196 0.32%
Industrial mineraldeposits
Limestone 3 M-H 12 36 132 0.21%
Magnetite 3 M-H 12 36 2 0.00%
Glass/silica sand 5 H 18 90 21 0.03%
5 M-H 12 60 24 0.04%
Foundry sand 3 H 18 54 29 0.05%
3 M-H 12 36 67 0.11%
Dolomite 2 M-H 12 24 7 0.01%
Diatomite 1 M-H 12 12 6 0.01%
Perlite 1 M-H 12 12 6 0.01%
Kaolin 3 H 18 54 11 0.02%
Bentonite 2 M-H 12 24 10 0.02%
Graphite 1 M-H 12 12 7 0.01%
Extractive materials Quarry rock 3 H 18 54 128 0.21%
3 M-H 12 36 295 0.48%
3 L-M 2 6 445 0.72%
Sand and gravel 3 H 18 54 42 0.07%
3 M-H 12 36 143 0.23%
3 L-M 2 6 326 0.53%
Brick clay 3 H 18 54 64 0.10%
3 M-H 12 36 202 0.33%
Building stone 4 H 18 72 36 0.06%
7.2 General comments on extractive materials potential The extractive materials study by Siemon and Holmes (1996) has attempted to identify areas whererock of a suitable nature occurs in close proximity to a major consumer market or in closeproximity to a major transport system (preferably railway line) to allow easy access to markets.These are generally near to areas with large growing populations. The future trend is for a few largequarries to supply virtually all high quality aggregate requirements and smaller quarries andscrapings to be abandoned. Little information is known about many of the deposits outlined andfurther work would be required to confirm their absolute suitability. Past and present investigationshave shown that many rock types throughout the region can be utilised as construction materials.Construction specifications and the requirement for quality assurance has forced the closure ofmany small pits and scrapings, except those which are utilised for maintenance of local gravelroads and general fill. The majority of Local Government pits have been closed due to the abovefactors, cost pressures and the need to comply with the requirements of the EnvironmentalProtection Act. Apart from the Sunshine Coast and southern Gold Coast areas, where current and potentialresources in State Forests are important, sufficient potential resources of quarry rock exist oncleared land outside of State Forests and Crown Land which can be utilised to supply current and

24
future markets. However, there are some resources of rock possibly important for the longer term inState Forest near Maryborough (see p29 RM2, Siemon and Holmes, 1996) While sand and gravel resources may occur in forested areas, no significant resources wererecorded in native forest in State Forests. However some sand resources are known in plantationState Forests south of Caloundra. As a consequence potential resources have been defined primarilyalong major streams or in areas of known coastal sediments. A major impediment to manyresources being extensively worked is the presence of feldspar, which prevents the sand beingutilised for high strength concrete. This is a major problem along the Burnett and Kolan Rivers andin some resources derived from the Marburg Formation. Most potential resources within stream beds will be increasingly difficult to access due toenvironmental concerns regarding stream stability. At off-stream workings along major streamsstrict controls are likely to prevent extensive erosion of bund walls.

25
2
4
6
6
8
12
12
12
12
14
14
14
18
24
24
24
24
24
36
36
36
36
36
36
48
48
54
54
54
54
54
60
72
72
84
84
84
90
90
96
108
120
126
126
126
144
162
180
0 20 40 60 80 100 120 140 160 180
Burrum coal L-M
Base metal vein L-M
Quarry rock L-M
Sand and gravel L-M
Structure/Vein-hosted gold L-M
Burrum coal M-H
Diatomite M-H
Perlite M-H
Graphite M-H
Volcanogenic gold L-M
Porphyry copper-molybdenum L-M
Tarong coal L-M
Walloon coal L-M
Base metal skarn M-H
Volcanogenic hydrothermal base metals M-H
Base metal vein M-H
Dolomite M-H
Bentonite M-H
Limestone M-H
Magnetite M-H
Foundry sand M-H
Quarry rock M-H
Sand and gravel M-H
Brick clay M-H
Structure/Vein-hosted gold M-H
Alluvial/eluvial placers M-H
Foundry sand H
Kaolin H
Quarry rock H
Sand and gravel H
Brick clay H
Glass/silica sand M-H
Structure/Vein-hosted gold H
Building stone H
Volcanogenic gold M-H
Porphyry copper-molybdenum M-H
Tarong coal M-H
Ipswich coal H
Glass/silica sand H
Oil shale M-H
Walloon coal M-H
Coastal heavy mineral sand M-H
Volcanogenic gold H
Porphyry copper-molybdenum H
Tarong coal H
Oil shale H
Walloon coal H
Coastal heavy mineral sand H
Dec
reas
ing
wei
ghte
d m
iner
al p
oten
tial
sco
res
ofm
iner
al d
epos
it t
ypes
at
diff
eren
t le
vels
of
min
eral
pot
enti
al
Weighted Mineral Potential Score
(weighted score)
Deposit type Potential
H = High mineral potentialM = Moderate mineral potentialL = Low mineral potential
FIGURE 2: WEIGHTED MINERAL POTENTIAL SCORES OF MINERAL DEPOSIT TYPES AT DIFFERENT LEVELS OF MINERAL POTENTIAL

26
Manufactured sand can be derived from many of the large rock quarries operating within theregion, but some rocks are more useful than others. A major problem for their use in concrete is thepresence of clays that are extremely difficult to wash from sand size-fractions. As a consequenceonly fresh rock can be used to produce manufactured sand, otherwise disposal of effluent will be amajor problem in the industry. The industry is now beginning to look at using coarse sandstone of the Woogaroo Subgroup in theHelidon area west of Ipswich as a raw material for manufactured sand. Although distant from themajor markets along the coast the area is conveniently located close to major road and railcorridors. Significant parts of this resource are located within State Forest north and east ofHelidon. Clay resources in the Brisbane region do not occur in State Forests although some occur within thebroad forested zone. Supplies of clay for the Cooroy brickworks are mainly derived from pitslocated adjacent to areas of State Forest north of Cooroy, with dark firing materials extracted froma pit in State Forest near Imbil. Near Bundaberg and Maryborough, where substantial areas ofpotential clay bearing units are utilised for sugar cane (considered as prime agricultural land)potential resources adjacent to existing leases are considered to be of major importance to the brickindustry. Some of these areas are within State Forest. Building stone (sandstone) is important north of Helidon to supply both domestic and exportmarkets. Resources currently worked are located on freehold land, but resources extend into StateForest nearby. Although the Helidon Sandstone extends east toward Gatton and Esk, no workingsare known in this area and from recent investigations the potential of the eastern area appears low. The Queensland Department of Minerals and Energy has been working on a detailed report on thebuilding stone, coarse sandstone and quarry rock resources (and the needs of explosives industry)of the Helidon Hills as part of the ‘Sustainable Management of the Helidon Hills’ planning projectof the Western Regional Organisation of Councils (WESROC). This work is undertaken withfunding from the National Heritage Fund and DME’s report is almost complete. The more detaileddata of this work may be available for the integration process of the Southeast Queensland RFA.
7.3 Summary of potential mineral and extractive materials resources The mineral resources of the Southeast Queensland region were assessed by Berkman (1996) andby Siemon and Holmes (1996) for 27 types of deposits. Areas of mineral potential for these typesof deposits are outlined on maps in technical reports by these authors. These deposit types are listedin Table 2 of this report and indicate various levels of potential for: ■ 6 types of metalliferous deposits,■ 2 types of heavy mineral sand deposits,■ 4 types of coal deposits,■ oil shale deposits,■ 10 types of industrial mineral deposits, and■ 4 types of deposits for extractive materials. The mineral potential tracts for metalliferous and heavy mineral sand deposit types are groupedtogether on Map 3. Most of the tracts are labelled to indicate the types of deposits the mineralpotential was assessed for. For additional detail the reader is referred to the report by Berkman

27
(1996). The potential for metalliferous deposits is confined to the rocks of the New England FoldBelt with the most significant being those for volcanogenic gold and structure/vein controlled golddeposits. Tracts of high potential for volcanogenic deposits are near the most significant knownvolcanogenic gold deposit of Mount Rawdon, near Mount Perry. Tracts of high potential forstructure/vein controlled gold deposits include these type of gold occurrences in the Gympie golddistrict. Tracts of moderate-high potential for structure/vein type gold deposits are quite extensivearound Gympie and to the southwest and also northwest of Mount Perry. South of Mount Perrythere is a large tract of low-moderate potential for volcanogenic gold deposits. Although beingassessed as having only low-moderate potential, this tract was considered by Berkman (1996) to beof obvious interest to the exploration industry for volcanogenic gold deposits. The New England Fold Belt also has small areas of high and moderate-high potential for porphyrytype copper-molybdenum deposits, and moderate-high potential for base metal skarn, base metalvein, and base metal/mercury hydrothermal deposits. High potential for coastal heavy mineral sand deposits is confined to North Stradbroke Island.There are several additional tracts of potential for heavy mineral sands north of North StradbrokeIsland but these areas have been alienated by other land uses, mainly by various types of parks. Inthe northern part of the region, tracts of moderate-high potential for coastal heavy mineral sandsinclude the Agnes Waters-Middle Island-Hummock Hill heavy mineral sand deposits. There is alsoa small tract of potential for alluvial/eluvial heavy mineral sand deposits north-west of MountPerry, which includes the known Goondicum ilmenite deposit. Mineral potential tracts for deposits of coal and oil shale are grouped on Map 4. Tracts of low-moderate, moderate-high and high potential for Walloon coal are confined to the Clarence-MoretonBasin south of Ipswich. South of Ipswich there is a small tract of high potential for Ipswich typecoal with part of the tract being alienated due to other land uses. There are tracts of low-moderate,moderate-high and high potential for Tarong coal south of Kingaroy and two tracts of low-moderate and moderate-high potential for Burrum type coal between Bundaberg and Maryboroughin the Maryborough Basin. A tract of high potential for oil shale is just north-west of Gladstonewhich includes the Rundle deposit with two other tracts of moderate-high potential for oil shalesouth-east of Gladstone. The mineral potential for 10 types of deposits of industrial minerals and 4 types of extractivematerials are shown on Map 5. The size of many of these tracts are too small to be shown at a scaleof 1:1.5 million as they are often restricted to sites around pits and quarries. For this reason thelocation of about 177 major quarries are also shown on Map 5. Most of the tracts on Map 5 are alsolabelled with the relevant type of mineral deposit, but for additional detail the reader is referred tothe technical report by Siemon and Holmes (1996). The most widespread tracts are those forextractive materials (quarry rock, sand and gravel, and brick clay). Map 6 shows the weighted composite mineral potential for the region as assessed by a panel ofgeoscientists in September 1997. This method of mineral potential assessment makes someallowance for the relative economic significance between different types of mineral deposits. Inthis approach, different types of mineral deposits are ranked for their relative economicsignificance. For example, Walloon type coal deposits were allocated a ranking of 9 out of 10,whereas brick clay deposits were given a ranking of only 3 out of 10. The economic significance ofthe world class coastal heavy mineral deposits in this part of Australia were allocated the highestranking of 10 out of 10. The rankings for the various deposit types are listed in Table 2. ‘Standardpotential scores’ were allocated according to a subjective ranking of different levels of mineralpotential as follows: 18 (for high potential); 12 (moderate to high); 6 (moderate); 2 (low to

28
moderate) and 1 (low). The weighted composite score is calculated by multiplying the depositranking by the standard potential score. For example, heavy mineral sands tract (ranking of 10)with high potential (18) will have a weighted composite score of 180. Where there are overlappingtracts with different weighted scores, the highest of these scores is assigned to the area of overlap.Areas of unknown or alienated potential are not scored. Similarly, no scores are allocated to areaswhere low and unknown potential have not been differentiated. The weighted scores at all levels ofmineral potential for all of the deposits assessed are tabulated in Table 2 and are also presented in asorted list in Figure 2. Weighted mineral potential scores of tracts on Map 6 range from 2 to 180 and occupy about 30% ofthe region. About 2.2% of the region is occupied by areas with alienated tracts and about 67% ofthe region comprise areas of low and unknown potential which have not been differentiated. Tracts with weighted scores of 108 to 180 cover about 1.4% of the Southeast Queensland regionand include deposits with a rank of 7 to 10 (Table 2). These areas comprise tracts of high potentialand moderate-high potential for coastal mineral sands (weighted mineral potential score of 180 forhigh potential and 120 for moderate-high) and Walloon type coal deposits (162 for high potentialand 108 for moderate-high). All of the other tracts in this weighted mineral potential class range arefor high potential for Tarong type coal (weighted mineral potential score of 126), oil shale (144),volcanogenic gold (126) and porphyry type copper-molybdenum deposits (126). As statedpreviously these tracts include known major deposits of Walloon and Tarong coal, the NorthStradbroke Island and Agnes Waters-Middle Island-Hummock Hill heavy mineral sand deposits,oil shale deposits and the Mount Rawdon volcanogenic gold deposit. Tracts with a weighted score of 48 to 96 cover about 10.9% of the region and indicate mineralpotential for deposit types with a rank of 4 to 8. At the top of this range are tracts of moderate-highpotential for oil shale (rank of 8 and a weighted potential score of 96 (Table 2)) and for Tarongtype coal (rank of 7 and score of 84). Tracts for metalliferous deposits include moderate-highpotential for volcanogenic gold (rank of 7 and weighted potential score of 84); moderate-highpotential for porphyry copper-molybdenum deposits (7 and 84) and high and moderate-highpotential of structure/vein hosted gold deposits (rank of 4 and a weighted potential score of 72 forhigh potential and 48 for moderate-high). Other tracts in this class range include high potential fordeposits of industrial and extractive minerals with silica glass sand (rank of 5, weighted mineralpotential score of 90), and building stone (4 and 72) near the top of this range (Table 2). The tracts with a weighted mineral potential score of 2 to 36 occupy about 17.6% of the region andinclude deposits with rankings in the range of 1 to 7. This weighted score range is dominated bytracts with moderate-high and low-moderate potential for deposits of industrial and extractivecommodities with rankings of 1 to 3. The weighted mineral potential of 36 at the top of thisweighted score interval is represented by deposit types with a rank of 3 having tracts of moderate-high potential for industrial and extractive type commodities (limestone, magnetite, foundry sand,quarry rock, gravel). Deposit types with higher rankings (eg 7 for volcanogenic gold and porphyrytype copper-molybdenum and 9 for Walloon type coal) in this range of weighted scores arerestricted to tracts of low-moderate potential. The weighted composite mineral potential map provides a broad indication of the relativesignificance of mineral potential tracts for different types of deposits. For example it provides acomparison of the relative significance of a tract with high potential for kaolin and a moderate tohigh potential for porphyry copper-molybdenum deposits. The weighted mineral potential scoresare expressed in numerical terms so that the results can be readily processed and displayed visually

29
in GIS environments using various cut offs of weighted scores to analyse and compare the spatialdistribution of mineral potential with other land values in the integration process. However, asstated previously, the assessment of mineral potential is qualitative and subjective and it is notpossible to make a direct comparison mineral potential with other land values in dollar terms. Ageneral appreciation of the economic value of the various types of deposits may be gained byreference to similar deposit being mined in Australia or elsewhere in the world. Apart from presenting a weighted composite potential map, it is also possible to produce weightedcumulative maps in areas with overlapping mineral potential tracts. The weighted scores of theoverlapping tracts are added to provide a cumulative score. A cumulative mineral potential mapwas not prepared because areas with overlapping tracts are not common in the SoutheastQueensland region.
8. APPLICATION OF RESULTS OF MINERAL RESOURCE ASSESSMENTIN RESERVE DESIGN FOR SOUTH EAST QUEENSLAND REGION
Elements of the mineral resource assessment which should be considered in reserve design and theintegration process for the Southeast Queensland region include GIS layers showing: ■ locations of existing mining and quarrying operations,■ known mineral deposits,■ existing mineral tenements, and■ areas with mineral potential tracts of significant importance. As stated previously, various cut-off scores of weighted mineral potential may be used to analysethe distribution of mineral potential with other land use values. Ultimately however, decisions onreserve design will have to be made in a consultative environment on case by case basis.
9. CONCLUSIONS
■ The Southeast Queensland region includes major population concentrations of Brisbane, Gold
Coast and Sunshine Coast which represent some of the fastest growing areas in Australia. Thesecommunities will require continued access to resources of extractive materials for buildingpurposes.
■ State Forests in the Gold Coast and Sunshine Coast hinterlands supply an important proportionof the quarry rock used in those markets, making up about one-sixth of the total rock producedin the region. There are also important resources of clay and rock in State Forests nearBundaberg and Maryborough.
■ The region also has significant mines for coal, heavy mineral sands and gold. Total productionof mineral commodities and extractive materials in 1994/95 amounted to about $383 million andabout half of this production was derived from forested areas.
■ Mineral deposits known to occur in forested parts of the region and which may be mined infuture include heavy mineral sands, gold and coal.
■ Tracts of mineral potential for 27 different types of mineral deposits have been delineated overabout one third of the region; discoveries of volcanogenic type of gold deposits would be themost significant of the metalliferous deposit types.

30
■ Over two thirds of the area the mineral potential is either low, or is unknown partly due to thelack of modern regional mapping and the lack of high resolution airborne geophysical data;current geological mapping programs in the region should reduce some of the areas of unknownmineral potential.
■ The assessment of potential mineral resources will need to be reviewed as data become availablefrom current detailed regional geological mapping, high resolution airborne geophysical surveysand ongoing exploration.

10. APPENDICES
APPENDIX A: EXTRACTIVEMINERAL DEPOSITS ANDQUARRIES (as shown on Map 5)
MAPLOCATION
No.
NAME OFDEPOSIT/QUARRY
EASTING
NORTHING COMMODITY
1 350500 7328400 Gravel
2 381800 7314300 Agglomerate
3 358600 7308200 Rhyolite
4 366600 7302400 Rhyolite
5 337700 7294300 Chert
6 Chowey 389500 7287000 Sand
7 400500 7280400 Laterite
8 389900 7275800 Gravel
9 426000 7266600 Gravel
10 429000 7263000 Sand
11 Flagstone Ck 417000 7260300 Sand
12 430500 7257000 Sand
13 433500 7255800 Sand
14 413000 7254000 Sand
15 406700 7250800 Sand
16 Tomato Island 429000 7249000 sand
17 446200 7250200 Basalt
18 446000 7249200 Basalt
19 446400 7247900 Basalt
20 444300 7237300 Sandy Loam
21 McCormack 397100 7235800 Claystone
22 381700 7233900 Metasiltstone
23 389500 7228800 Mudstone
24 452800 7223200 Sand
25 451000 7222800 Sand
26 414800 7218000 Mudstone ?
27 364000 7216000 Biotite Schist
28 363600 7213700 Hornfels
29 365600 7208200 Biotite Schist
30 428000 7209900 Rhyolitic Tuff
31 436300 7216300 Basalt
32 436800 7216300 Laterite
33 466800 7206500 Sand
34 469700 7205300 Sand
35 471000 7201600 Sand
36 Dundowran 475100 7202400 Basalt
37 479000 7202300 Sand
38 479200 7202400 Sand
39 479700 7202500 Sand
40 374200 7194000 Schist
41 360400 7187400 Conglomerate
42 362200 7186200 Conglomerate
43 Port Wine 390000 7183400 Mudstone
44 374200 7180800 Rhyolite
45 369300 7178200 Agglomerate
46 382000 7175000 Chert
47 359400 7166200 Conglomerate
48 362600 7165400 Gravel
49 432100 7178300 Mudstone
50 446600 7176800 Gravel
51 425300 7168300 Mudstone
52 454600 7165000 Andesite
53 454700 7158500 Gravel
54 459300 7158300 Andesite ?
55 454400 7155600 Sand
56 461400 7148500 Siltstone
57 448500 7142600 Sand
58 Coynes 458400 7138700 Sandstone
59 474800 7135900 Quartzite
60 481200 7134700 Laterite
61 451900 7132500 Gravel
62 461000 7129200 Siltstone
63 448500 7128500 Sand
64 485000 7125500 Laterite
65 487800 7117000 Laterite
66 Curra Quarry 457200 7113100 Limestone
67 454600 7112900 Sand
68 455800 7111300 Sand
69 Ringtail 496000 7085500 Trachyte
70 Forestry No1 387700 7083500 Quartzite
71 Council Pit 508900 7077800 Sand
72 Toolborough 503400 7065000 Tuff
73 Moy Pocket 474400 7064700 Trachyandesite
74 435700 7063700 Arenites
75 Gheerulla Ck 476000 7062000 Sand
76 472800 7059400 Sand
77 Kenilworth Pit 473300 7058200 Sand
78 Image Flat 494000 7058000 Rhyolite
79 Bli Bli 497800 7056800 Rhyolite
80 Hodgleigh 394900 7054400 Hornfels
81 419300 7049800 Sand
82 468600 7051300 Loam
83 468800 7050200 Loam
84 468700 7047000 Sand
85 Eudlo Ck 500500 7049200 Sand
86 Marshalls 500200 7048700 Sand
87 Mooloolah 502000 7038300 Sand
88 Mooloolah 502800 7038300 Sand
89 435400 7030100 Sand
90 429600 7029000 Sand
91 438600 7026500 Sand
92 458500 7023200 Sand
93 Glasshouse Exsel 492000 7023000 Trachyandesite
94 Sunrock 497000 7022000 Trachyte
95 Villeneuve 462100 7017600 Meta-siltstone
96 442700 7015300 Arenites
97 441100 7013300 Sand
98 438700 7012400 Sand
99 Bracalba 481800 7014000 Granodiorite
100 Moodlu 490700 7006400 Trachyte
101 508600 7004600 Sand
102 508900 7004300 Sand
103 507800 7003600 Sand
104 501900 6995700 Sand
105 Whiteside 492300 6986800 Greenstone
106 Petrie 493000 6986000 Greenstone
107 499200 6983000 Sand
108 500300 6982200 Sand
109 501300 6981400 Sand
110 499900 6980500 Sand
111 South Pine 501000 6980300 Sand
112 499300 6977900 Sand
113 499300 6977600 Sand
114 419400 6977000 Sand
115 438200 6972400 Sand
116 443200 6970700 Sand
117 440000 6970300 Sand
118 440000 6969700 Sand
119 Rous Channel 540700 6971400 Sand
120 Levitt Rd 493300 6967300 Granite
121 495200 6966500 Granite
122 Krugers 433800 6961200 Sand
123 430700 6959700 Laterite
124 410700 6956400 Laterite
125 414400 6954300 Gravels
126 419400 6952100 Sand
127 417800 6949700 Sand
128 Mt Whitestone 416200 6937200 Basalt
129 Mt Cootha 497200 6960500 hornfels
130 Brisbane River 502000 6960800 Sand
131 Pine Mtn 508300 6956700 Quartzite
132 Mt Marrow Quarry 462700 6947500 basalt
133 503000 6946000 Sand
134 500000 6943600 Sand
135 500500 6942800 Sand
136 500000 6941800 Sand
137 500000 6941000 Sand
138 487700 6939100 Basalt
139 486200 6938800 Trachyte
140 Kingston Bega Rd 511000 6939800 Quartzite
141 512200 6936200 Sand

142 Carbrook 524300 6936800 Sand
143 531500 6934200 Sand
144 Stonemaster 523500 6934200 Quartzite
145 Reedy Ck 524100 6932200 Quartzite
146 Stapylton 525000 6931300 Quartzite
147 465500 6929700 Basalt
148 Purga 475000 6930000 dolerite
149 534000 6927200 Sand
150 532800 6926900 Sand
151 531600 6925000 Sand
152 Beenleigh 521800 6925600 Greywacke
153 Wolffdene 520400 6925500 Greywacke
154 500600 6924500 Sand
155 Jimboomba 501900 6922900 Basalt
156 Bluerock 518500 6921600 Greenstone
157 Ormeau 521000 6922000 Greywacke
158 511500 6918500 Sand
159 510600 6917300 Sand
160 494900 6918500 Sand
161 488000 6919300 Sand
162 491100 6918900 Sand
163 489400 6918500 Sand
164 490800 6917300 Sand
165 Coomera 530000 6915800 Sand
166 Coomera 529000 6915000 Sand
167 Coomera 529000 6914000 Sand
168 514400 6912600 Sand
169 Coomera 527700 6912400 Sand
170 493100 6909000 Sand
171 491300 6908000 Sand
172 Hymix 531800 6906500 Greywacke
173 Old Coach Road 534300 6904800 Greywacke
174 Birnam Range 502200 6905200 Basalt
175 489800 6890400 Sand
176 Burleigh 540800 6890700 Argillite
177 Burleigh West 542300 6890000 Greywacke

33
11. METADATA
GENERALISED GEOLOGY, SEQ BIOGEOGRAPHIC REGION
Dataset
Title: Generalised Geology, SEQ Biogeographic Region
Jurisdiction:
Custodian: Qld Dept of Mines and Energy (DME)
Description
Abstract:Generalised geological map of the SEQ Biogeographic Region
Search word(s): Geology, Tectonic Map, Southeast Queensland Biogeographic Region
Attribute List: Generalised geological units
Geographic Extent Name(s): Qld-NSW border to Gladstone
Geographic Extent Polygon(s): Southeast Queensland Biogeographic Region assupplied by Dept of Natural Resources
Data Currency
Beginning Date: 30-8-97
Ending Date: 30-9-97
Dataset Status
Progress: Completed
Maintenance and Update Frequency: Not planned in this format
Access
Stored Data Format(s): Digital -ArcInfo/Arcview
Available Format Type(s): ArcInfo, Arcview shape files
Access Constraint: Licensed

34
Data Quality
Lineage: Combines generalised geology from DME’s current 1:100 000 SoutheastQueensland geological mapping project, and older DME/AGSO 1:250 000 mapping of theRockhampton, Mundubbera and Bundaberg Sheet Areas
Scale:
Cell Size:
Positional Accuracy:
Attribute Accuracy:
Logical Consistency:
Completeness:
Contact Information
Contact Organisation: 1. Geological Survey of Queensland, DME;2. Bureau of Resource Sciences, Canberra
Contact Position: 1. Project Leader, Southeast Queensland Project, GSQ, DME.2.Manager Mineral Potential and Exploration, BRS
Contact Person: 1.Len Cranfield, GSQ, DME2.Yanis Miezitis, BRS
Mail Address 1: GPO Box 194 Brisbane Q 4001
Mail Address 2: PO Box E11 Kingston ACT 2604
Suburb (or Place or Locality): 61 Mary Street Brisbane Qld
State (or Locality 2): Kingston ACT
Country: Australia
Postcode: See above
Telephone:1. (07) 3237 1515 2. (02) 6272 5939
Facsimile: 1. (07) 3235 4074 2 (02) 6272 4161
Electronic Mail Address: 1. [email protected]. [email protected]
Metadata Date
Metadata Date: 30-10-97

35
Additional Metadata

36
MINERAL POTENTIAL TRACTS (27 MAPS)
Dataset
Title: Mineral Potential Tracts
Jurisdiction:
Custodian: Bureau of Resource Sciences
Description
Abstract: Mineral potential tract of a deposit type defines areas that are assessed to havegeological environment favourable for the formation of that type. The tracts are drawn based onthe reports by D. A. Berkman and J. E. Siemon and K. H. Holmes. A panel of experts translatedlevels of potential into a six-fold classification used in other CRA regions. Delineation of tracts andthe assessment of mineral potential is carried out by following the methodology of qualitativeassessment developed by the United States Geological Survey. For a description of depositmodels and tracts, see reports by D. A. Berkman and J. E. Siemon and K. H. Holmes.
Search word(s): Mineral potential tracts.
Attribute List: Important attributes are:Map_code – code representing zone delineated on the tract map (for details seereport by D. A. Berkman)Prob – potential expressed as probability (for details see report byD. A. Berkman)Revprob – probability in Prob translated into the six-fold classification (low, low tomoderate, moderate, moderate to high, high, unknown).Accuracy – a measure of the accuracy of the location of zone boundary (for detailssee report by D. A. Berkman).Revprobval – probability in Revprob expressed in numerical symbols (low = 1, lowto moderate = 2, moderate = 6, moderate to high = 12, high = 18, unknown = 0).‘Tract name’_pot – the same as Revprobval.
Geographic Extent Name(s):
Geographic Extent Polygon(s): Bounding Co-ordinates: 150.787, -28.370, 153.577, -23.581
Data Currency
Beginning Date: 1996
Ending Date: 1998
Dataset Status
Progress:

37
Maintenance and Update Frequency: Irregular
Access
Stored Data Format(s): Digital – ArcInfo
Available Format Type(s): ArcInfo, Arcview shape files, ArcInfo grids
Access Constraint: licensed
Data QualityDetermined by that of primary datasets such as geology and the accuracy ofassessments in the reports of D. A. Berkman and J. E. Siemon and K. H.Holmes.
Lineage:
Scale: 1:250,000
Cell Size:
Positional Accuracy:
Attribute Accuracy:
Logical Consistency:
Completeness:
Contact Information
Contact Organisation: Bureau of Resource Sciences
Contact Position: Chief Geologist
Contact Person: Yanis Miezitis
Mail Address 1: Bureau of Resource Sciences, P O Box E11, Kingston, ACT2604
Mail Address 2:
Suburb (or Place or Locality): Kingston
State (or Locality 2): A.C.T
Country: Australia
Postcode: 2604
Telephone: (02) 62725939

38
Facsimile: (02) 62724161
Electronic Mail Address: [email protected]
Metadata Date
Metadata Date: April 1998
Additional Metadata
Additional Metadata:

39
COMPOSITE MINERAL POTENTIAL (3 MAPS)
Dataset
Title: Composite Mineral Potential
Jurisdiction:
Custodian: Bureau of Resource Sciences
Description
Abstract: Composite mineral potential map is a collation of mineral potential tracts of individualdeposit types. The three maps are for Gold, basemetals and heavy minerals; Coal and oil shales;and Industrial mineral and extractive materials. The maps are created by using Spatial Analysis ifArc View 3. Maps represent the highest level of mineral potential assessed (in August 1996 andApril 1998) for any specific area in the CRA region.
Search word(s): Composite Mineral potential.
Attribute List: Important attributes are:Grid_code – numerical code representing levels of mineral potential (low = 1, low tomoderate = 2, moderate = 6, moderate to high = 12, high = 18, unknown = 0).
Geographic Extent Name(s):
Geographic Extent Polygon(s): Bounding Co-ordinates: 150.787, -28.370, 153.577, -23.581
Data Currency
Beginning Date: 1996
Ending Date: 1998
Dataset Status
Progress:
Maintenance and Update Frequency: Irregular
Access
Stored Data Format(s): Digital – ArcInfo
Available Format Type(s): ArcInfo, Arcview shape files

40
Access Constraint: licensed
Data QualityDetermined by that of primary datasets such as geology and the accuracy ofassessments in the reports of D. A. Berkman and J. E. Siemon and K. H.Holmes.
Lineage:
Scale: 1:250,000
Cell Size:
Positional Accuracy:
Attribute Accuracy:
Logical Consistency:
Completeness:
Contact Information
Contact Organisation: Bureau of Resource Sciences
Contact Position: Chief Geologist
Contact Person: Yanis Miezitis
Mail Address 1: Bureau of Resource Sciences, P O Box E11, Kingston, ACT2604
Mail Address 2:
Suburb (or Place or Locality): Kingston
State (or Locality 2): A.C.T
Country: Australia
Postcode: 2604
Telephone: (02) 62725939
Facsimile: (02) 62724161
Electronic Mail Address: [email protected]
Metadata Date
Metadata Date: April 1998

41
WEIGHTED COMPOSITE MINERAL POTENTIAL
Dataset
Title: Weighted Composite Mineral Potential
Jurisdiction:
Custodian: Bureau of Resource Sciences
Description
Abstract: Weighted Composite mineral potential map is a collation of mineral potential tracts ofindividual deposit types (27 maps). The data set/map is created by using Spatial Analysis if ArcView 3. It represents the highest weighted level of mineral potential assessed (in August 1996 andApril 1998) for any specific area in the CRA region. Each deposit type is assigned a weighting(score/index) on a scale of 1 to 10 by a panel of experts. The weighting reflects the relativeimportance of deposit types. For weightings of deposit types see the summary report.
Search word(s): Weighted Composite Mineral potential.
Attribute List: Important attributes are:Grid_code – numerical code representing weighted levels of mineral potential.
Geographic Extent Name(s):
Geographic Extent Polygon(s): Bounding Co-ordinates: 150.787, -28.370, 153.577, -23.581
Data Currency
Beginning Date: 1996
Ending Date: 1998
Dataset Status
Progress:
Maintenance and Update Frequency: Irregular
Access
Stored Data Format(s): Digital – ArcInfo
Available Format Type(s): ArcInfo, Arcview shape files

42
Access Constraint: licensed
Data QualityDetermined by that of primary datasets such as geology and the accuracy ofassessments in the reports of D. A. Berkman and J. E. Siemon and K. H.Holmes.
Lineage:
Scale: 1:250,000
Cell Size:
Positional Accuracy:
Attribute Accuracy:
Logical Consistency:
Completeness:
Contact Information
Contact Organisation: Bureau of Resource Sciences
Contact Position: Chief Geologist
Contact Person: Yanis Miezitis
Mail Address 1: Bureau of Resource Sciences, P O Box E11, Kingston, ACT2604
Mail Address 2:
Suburb (or Place or Locality): Kingston
State (or Locality 2): A.C.T
Country: Australia
Postcode: 2604
Telephone: (02) 62725939
Facsimile: (02) 62724161
Electronic Mail Address: [email protected]
Metadata Date
Metadata Date: April 1998

43
EXTRACTIVE INDUSTRIES SEQ RFA
Dataset
Title: Sand and Gravel Resources, SEQ Biogeographic Region
Jurisdiction:
Custodian: Qld Dept of Mines and Energy (DME)
Description
Abstract: Potential sand and gravel resource areas defined as polygons, for the SEQBiogeographic Region.
Search word(s): Extractive Industry, Sand and Gravel, Southeast QueenslandBiogeographic Region
Attribute List: Resource Label, Map Code, Principal Commodity, Revised Probability,Revised Probability Value, Ranking, Symbol.
Geographic Extent Name(s): Qld-NSW border to Gladstone
Geographic Extent Polygon(s): Southeast Queensland Biogeographic Region assupplied by Dept of Natural Resources
Data Currency
Beginning Date: 30-8-97
Ending Date:
Dataset Status
Progress: Completed
Maintenance and Update Frequency: Not planned in this format
Access
Stored Data Format(s): Digital –ARC/INFO/ArcView
Available Format Type(s): ARC/INFO Coverages, ArcView shape files
Access Constraint: Licensed
Data Quality

44
Lineage: The resource potential polygons were translated from MapInfo tables that formeda part of the report “Assessment Of Extractive Materials Potential Of The Southeast QueenslandBiogeographic Region” (Siemon and Holmes). The original resource potential polygons weredigitised from interpretations that used data from:
District reviews of workings of Construction Materials - Queensland Government Mining Journal
Industrial rock and mineral surveys - 100 000 Sheets - Geological Survey of QueenslandPublications
Industrial rock and mineral surveys – Shires - Geological Survey of Queensland Records
Other reports utilised included:
Geological Sheet Reports- Geological Survey of Queensland Reports,Queensland Department of Mines Map commentaries
Reviews of river sand and gravel resources – Department of PrimaryIndustries - Water Resources
TABLE 1 PRINCIPAL DATA SOURCES
Report Author Date ReferenceDalby-Millmerran-Chinchilla O’Flynn 1984 QGMJ February 84, p49Toowoomba O’Flynn 1980 QGMJ September 80, p447Gladstone Holmes 1980 QGMJ May 80, p267Pialba 1:100 000 Robertson 1981 QGMJ March 81, p131South Burnett Martin & Neville 1981 QGMJ October 81, p491Nambour & Caloundra 1:100 000 Martin 1985 GSQ Pub 385Brisbane & Caboolture 1:100 000 O’Flynn, Holmes &
Trezise1983 GSQ Pub 382
Ipswich 1:100 000 Willmott, Cooper &Martin
1979 GSQ Pub 373
Beenleigh & Murwillumbah 1:100000
Willmott, Martin,O’Flynn & Cooper
1976 GSQ Pub 368
Beaudesert Shire Martin 1975 GSQ Rec 1975/27Laidley & Gatton Shires Zahawi 1979 GSQ Rec 1979/04Laidley & Gatton Shires Zahawi 1979 GSQ Rec 1979/04Warwick - Stanthorpe O’Flynn 1983 QGMJ September 83, p339Gympie O’Flynn & Graham 1987 QGMJ July 87, 240Noosa Shire Trezise 1989 GSQ Rec 1989/21Maryborough 1:100 000 Robertson 1981 QGMJ Dec 81, 591Biloela - Mt Morgan Trezise 1982 QGMJ August 82, p364Bundaberg 1:100 000 Robertson 1980 GSQ Rec 1980/1Central Burnett Trezise 1984 QGMJ May 84, p167Upper Burnett Trezise & Graham 1984 QGMJ June 84, p208Southern Esk Shire Holmes 1979 GSQ Rec 1979/18Gatton Shire Willmott 1987 GSQ Rec 1987/30
Scale: 1: 250 000
Cell Size:
Positional Accuracy:
Attribute Accuracy:

45
Logical Consistency:
Completeness:
Contact Information
Contact Organisation: 1. Geological Survey of Queensland, DME2. Bureau of Resource Sciences, Canberra
Contact Position: 1. Project Leader, Southeast QueenslandProject, GSQ, DME2. Manager Mineral Potential and Exploration, BRS
Contact Person: 1. Len Cranfield, GSQ, DME2. Yanis Miezitis, BRS
Mail Address 1: GPO Box 194 Brisbane Q 4001
Mail Address 2: PO Box E11 Kingston ACT 2604
Suburb (or Place or Locality): 1. 61 Mary Street Brisbane2. Kingston
State (or Locality 2): 1. Queensland 2. ACT
Country: Australia
Postcode: 1. 4001 2. 2604
Telephone: 1. (07) 3237 1515 2. (02) 6272 5939
Facsimile: 1. (07) 3235 4074 2. (02) 6272 4161
Electronic Mail Address: 1. [email protected]. [email protected]
Metadata Date
Metadata Date: 30-10-97
Additional Metadata
Additional Metadata:

46
Dataset
Title: Sand and Gravel Workings, SEQ Biogeographic Region
Jurisdiction:
Custodian: Qld Dept of Mines and Energy (DME)
Description
Abstract: Point localities for medium to large sand and gravel workings, for the SEQBiogeographic Region.
Search word(s): Extractive Industry, Sand and Gravel Working, Southeast QueenslandBiogeographic Region
Attribute List: Easting, Northing, Longitude, Latitude, Name, Sheet, Symbol,Rock_type_1, Rock_type_2, Rock_type_3, Weathering, Working, Size, Point Size, Status,Operator, Designated, Local_Authority, Land_Tenure, Land_Use, Production, Use_1,Use_2, Use_3, Comments, Report, Map Symbol
Geographic Extent Name(s): Qld-NSW border to Gladstone
Geographic Extent Polygon(s): Southeast Queensland Biogeographic Region assupplied by Dept of Natural Resources
Data Currency
Beginning Date: 30-8-97
Ending Date:
Dataset Status
Progress: Completed
Maintenance and Update Frequency: Not planned in this format
Access
Stored Data Format(s): Digital - ARC/INFO, ArcView
Available Format Type(s): ARC/INFO Coverages, ArcView shape files
Access Constraint: Licensed

47
Data Quality
Lineage: The “workings” locality and attribute data formed a part of the report “AssessmentOf Extractive Materials Potential Of The Southeast Queensland Biogeographic Region” (Siemonand Holmes). They were compiled as Excel spreadsheets from the following sources:
District reviews of workings of Construction Materials - Queensland Government Mining Journal
Industrial rock and mineral surveys - 100 000 Sheets - Geological Survey of QueenslandPublications
Industrial rock and mineral surveys – Shires - Geological Survey of Queensland Records
Other reports utilised included:
Geological Sheet Reports - Geological Survey of Queensland Reports,Queensland Department of Mines Map commentaries
Reviews of river sand and gravel resources – Department of PrimaryIndustries - Water Resources
TABLE 1 PRINCIPAL DATA SOURCES
Report Author Date ReferenceDalby-Millmerran-Chinchilla O’Flynn 1984 QGMJ February 84, p49Toowoomba O’Flynn 1980 QGMJ September 80, p447Gladstone Holmes 1980 QGMJ May 80, p267Pialba 1:100 000 Robertson 1981 QGMJ March 81, p131South Burnett Martin & Neville 1981 QGMJ October 81, p491Nambour & Caloundra 1:100 000 Martin 1985 GSQ Pub 385Brisbane & Caboolture 1:100 000 O’Flynn, Holmes &
Trezise1983 GSQ Pub 382
Ipswich 1:100 000 Willmott, Cooper &Martin
1979 GSQ Pub 373
Beenleigh & Murwillumbah 1:100000
Willmott, Martin,O’Flynn & Cooper
1976 GSQ Pub 368
Beaudesert Shire Martin 1975 GSQ Rec 1975/27Laidley & Gatton Shires Zahawi 1979 GSQ Rec 1979/04Laidley & Gatton Shires Zahawi 1979 GSQ Rec 1979/04Warwick - Stanthorpe O’Flynn 1983 QGMJ September 83, p339Gympie O’Flynn & Graham 1987 QGMJ July 87, 240Noosa Shire Trezise 1989 GSQ Rec 1989/21Maryborough 1:100 000 Robertson 1981 QGMJ Dec 81, 591Biloela - Mt Morgan Trezise 1982 QGMJ August 82, p364Bundaberg 1:100 000 Robertson 1980 GSQ Rec 1980/1Central Burnett Trezise 1984 QGMJ May 84, p167Upper Burnett Trezise & Graham 1984 QGMJ June 84, p208Southern Esk Shire Holmes 1979 GSQ Rec 1979/18Gatton Shire Willmott 1987 GSQ Rec 1987/30
The spreadsheets were translated to Dbase files then to ArcViewshapefiles using the add event theme command.
Scale: 1: 100 000
Cell Size:

48
Positional Accuracy: +/- 100m to +/- 1000m
Attribute Accuracy: variable with some fields a subjective/ relative judgement according tothe data’s author. Inconsistent naming of sites.
Logical Consistency: no spatial joins to check point/poly relationships
Completeness: Inconsistent due to time constraints
Contact Information
Contact Organisation: 1. Geological Survey of Queensland, DME 2. Bureau of Resource Sciences, Canberra
Contact Position: 1. Project Leader, Southeast QueenslandProject, GSQ, DME2. Manager Mineral Potential and Exploration, BRS
Contact Person: 1. Len Cranfield, GSQ, DME2. Yanis Miezitis, BRS
Mail Address 1: GPO Box 194 Brisbane Q 4001
Mail Address 2: PO Box E11 Kingston ACT 2604
Suburb (or Place or Locality): 1. 61 Mary Street Brisbane Qld2. Kingston
State (or Locality 2): 1. Queensland 2. ACT
Country: Australia
Postcode: 1. 4001 2. 2604
Telephone: 1. (07) 3237 1515 2. (02) 6272 5939
Facsimile: 1. (07) 3235 4074 2. (02) 6272 4161
Electronic Mail Address: 1. [email protected]. [email protected]
Metadata Date
Metadata Date: 30-10-97
Additional Metadata
Additional Metadata:

49
Dataset
Title: Quarry Rock Resources, SEQ Biogeographic Region
Jurisdiction:
Custodian: Qld Dept of Mines and Energy (DME)
Description
Abstract: Potential quarry rock resource areas defined as polygons, for the SEQBiogeographic Region.
Search word(s): Extractive Industry, Quarry Rock, Road Metal, Southeast QueenslandBiogeographic Region
Attribute List: Resource Label, Map Code, Principal Commodity, Revised Probability,Revised Probability Value, Ranking, Symbol.
Geographic Extent Name(s): Qld-NSW border to Gladstone
Geographic Extent Polygon(s): Southeast Queensland Biogeographic Region assupplied by Dept of Natural Resources
Data Currency
Beginning Date: 30-8-97
Ending Date:
Dataset Status
Progress: Completed
Maintenance and Update Frequency: Not planned in this format
Access
Stored Data Format(s): Digital –ARC/INFO/ArcView
Available Format Type(s): ARC/INFO Coverages, ArcView shape files
Access Constraint: Licensed
Data Quality

50
Lineage: The resource potential polygons were translated from MapInfo tables that formeda part of the report “Assessment Of Extractive Materials Potential Of The Southeast QueenslandBiogeographic Region” (Siemon and Holmes). The original resource potential polygons weredigitised from interpretations that used data from:
District reviews of workings of Construction Materials - Queensland Government Mining Journal
Industrial rock and mineral surveys - 100 000 Sheets - Geological Survey of QueenslandPublications
Industrial rock and mineral surveys – Shires - Geological Survey of Queensland Records
Other reports utilised included:
Geological Sheet Reports- Geological Survey of Queensland Reports,Queensland Department of Mines Map commentaries
Reviews of river sand and gravel resources – Department of PrimaryIndustries - Water Resources
TABLE 1 PRINCIPAL DATA SOURCES
Report Author Date ReferenceDalby-Millmerran-Chinchilla O’Flynn 1984 QGMJ February 84, p49Toowoomba O’Flynn 1980 QGMJ September 80, p447Gladstone Holmes 1980 QGMJ May 80, p267Pialba 1:100 000 Robertson 1981 QGMJ March 81, p131South Burnett Martin & Neville 1981 QGMJ October 81, p491Nambour & Caloundra 1:100 000 Martin 1985 GSQ Pub 385Brisbane & Caboolture 1:100 000 O’Flynn, Holmes &
Trezise1983 GSQ Pub 382
Ipswich 1:100 000 Willmott, Cooper &Martin
1979 GSQ Pub 373
Beenleigh & Murwillumbah 1:100000
Willmott, Martin,O’Flynn & Cooper
1976 GSQ Pub 368
Beaudesert Shire Martin 1975 GSQ Rec 1975/27Laidley & Gatton Shires Zahawi 1979 GSQ Rec 1979/04Laidley & Gatton Shires Zahawi 1979 GSQ Rec 1979/04Warwick - Stanthorpe O’Flynn 1983 QGMJ September 83, p339Gympie O’Flynn & Graham 1987 QGMJ July 87, 240Noosa Shire Trezise 1989 GSQ Rec 1989/21Maryborough 1:100 000 Robertson 1981 QGMJ Dec 81, 591Biloela - Mt Morgan Trezise 1982 QGMJ August 82, p364Bundaberg 1:100 000 Robertson 1980 GSQ Rec 1980/1Central Burnett Trezise 1984 QGMJ May 84, p167Upper Burnett Trezise & Graham 1984 QGMJ June 84, p208Southern Esk Shire Holmes 1979 GSQ Rec 1979/18Gatton Shire Willmott 1987 GSQ Rec 1987/30
Scale: 1: 250 000
Cell Size:
Positional Accuracy:
Attribute Accuracy:

51
Logical Consistency:
Completeness:
Contact Information
Contact Organisation: 1. Geological Survey of Queensland, DME 2. Bureau of Resource Sciences, Canberra
Contact Position: 1. Project Leader, Southeast QueenslandProject, GSQ, DME2. Manager Mineral Potential and Exploration, BRS
Contact Person: 1. Len Cranfield, GSQ, DME2. Yanis Miezitis, BRS
Mail Address 1: GPO Box 194 Brisbane Q 4001
Mail Address 2: PO Box E11 Kingston ACT 2604
Suburb (or Place or Locality): 1. 61 Mary Street Brisbane2. Kingston
State (or Locality 2): 1. Queensland 2. ACT
Country: Australia
Postcode: 1. 4001 2. 2604
Telephone: 1. (07) 3237 1515 2. (02) 6272 5939
Facsimile: 1. (07) 3235 4074 2. (02) 6272 4161
Electronic Mail Address: 1. [email protected]. [email protected]
Metadata Date
Metadata Date: 30-10-97
Additional Metadata
Additional Metadata:

52
Dataset
Title: Quarry Rock Workings/Quarries, SEQ Biogeographic Region
Jurisdiction:
Custodian: Qld Dept of Mines and Energy (DME)
Description
Abstract: Point localities for large quarry rock (road metal) workings/quarries, for the SEQBiogeographic Region.
Search word(s): Extractive Industry, Quarry, Quarry Rock, Road Metal, SoutheastQueensland Biogeographic Region
Attribute List: Easting, Northing, Longitude, Latitude, Name, Sheet, Symbol,Rock_type_1, Rock_type_2, Rock_type_3, Weathering, Working, Size, Point Size, Status,Operator, Designated, Local_Authority, Land_Tenure, Land_Use, Production, Use_1,Use_2, Use_3, Comments, Report, Map Symbol
Geographic Extent Name(s): Qld-NSW border to Gladstone
Geographic Extent Polygon(s): Southeast Queensland Biogeographic Region assupplied by Dept of Natural Resources
Data Currency
Beginning Date: 30-8-97
Ending Date:
Dataset Status
Progress: Completed
Maintenance and Update Frequency: Not planned in this format
Access
Stored Data Format(s): Digital - ARC/INFO, ArcView
Available Format Type(s): ARC/INFO Coverages, ArcView shape files
Access Constraint: Licensed
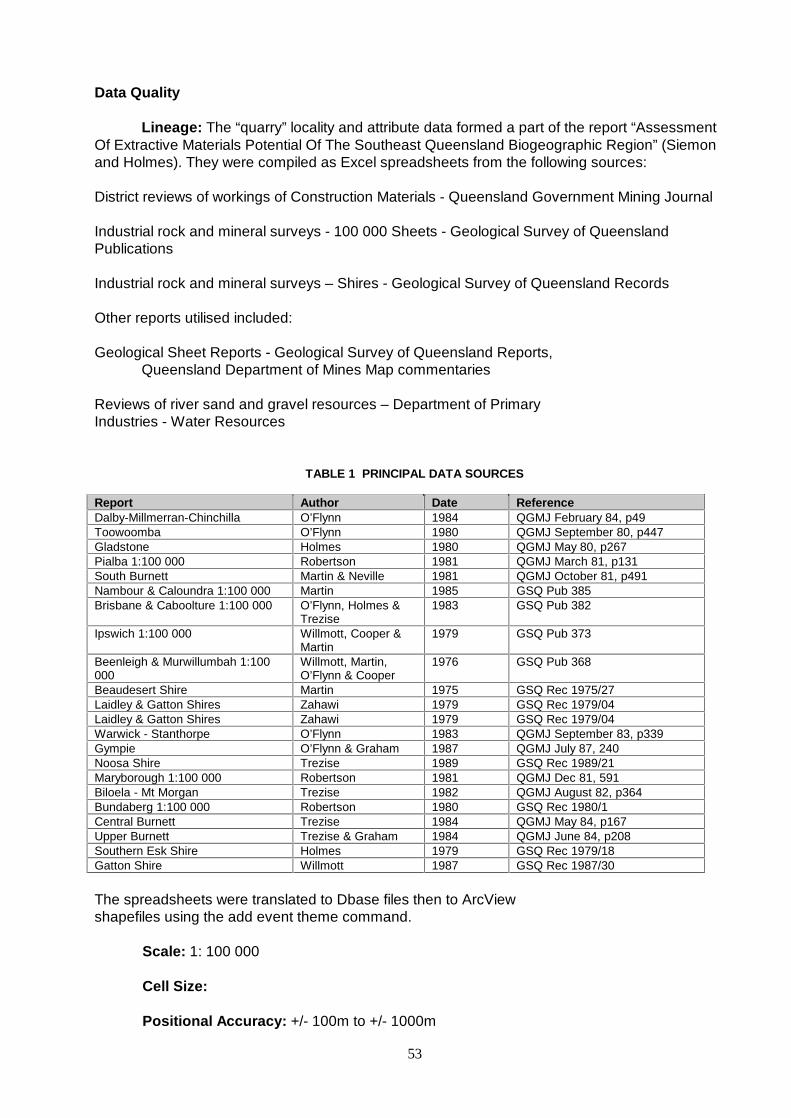
53
Data Quality
Lineage: The “quarry” locality and attribute data formed a part of the report “AssessmentOf Extractive Materials Potential Of The Southeast Queensland Biogeographic Region” (Siemonand Holmes). They were compiled as Excel spreadsheets from the following sources:
District reviews of workings of Construction Materials - Queensland Government Mining Journal
Industrial rock and mineral surveys - 100 000 Sheets - Geological Survey of QueenslandPublications
Industrial rock and mineral surveys – Shires - Geological Survey of Queensland Records
Other reports utilised included:
Geological Sheet Reports - Geological Survey of Queensland Reports,Queensland Department of Mines Map commentaries
Reviews of river sand and gravel resources – Department of PrimaryIndustries - Water Resources
TABLE 1 PRINCIPAL DATA SOURCES
Report Author Date ReferenceDalby-Millmerran-Chinchilla O’Flynn 1984 QGMJ February 84, p49Toowoomba O’Flynn 1980 QGMJ September 80, p447Gladstone Holmes 1980 QGMJ May 80, p267Pialba 1:100 000 Robertson 1981 QGMJ March 81, p131South Burnett Martin & Neville 1981 QGMJ October 81, p491Nambour & Caloundra 1:100 000 Martin 1985 GSQ Pub 385Brisbane & Caboolture 1:100 000 O’Flynn, Holmes &
Trezise1983 GSQ Pub 382
Ipswich 1:100 000 Willmott, Cooper &Martin
1979 GSQ Pub 373
Beenleigh & Murwillumbah 1:100000
Willmott, Martin,O’Flynn & Cooper
1976 GSQ Pub 368
Beaudesert Shire Martin 1975 GSQ Rec 1975/27Laidley & Gatton Shires Zahawi 1979 GSQ Rec 1979/04Laidley & Gatton Shires Zahawi 1979 GSQ Rec 1979/04Warwick - Stanthorpe O’Flynn 1983 QGMJ September 83, p339Gympie O’Flynn & Graham 1987 QGMJ July 87, 240Noosa Shire Trezise 1989 GSQ Rec 1989/21Maryborough 1:100 000 Robertson 1981 QGMJ Dec 81, 591Biloela - Mt Morgan Trezise 1982 QGMJ August 82, p364Bundaberg 1:100 000 Robertson 1980 GSQ Rec 1980/1Central Burnett Trezise 1984 QGMJ May 84, p167Upper Burnett Trezise & Graham 1984 QGMJ June 84, p208Southern Esk Shire Holmes 1979 GSQ Rec 1979/18Gatton Shire Willmott 1987 GSQ Rec 1987/30
The spreadsheets were translated to Dbase files then to ArcViewshapefiles using the add event theme command.
Scale: 1: 100 000
Cell Size:
Positional Accuracy: +/- 100m to +/- 1000m

54
Attribute Accuracy: variable with some fields a subjective/ relative judgement according tothe data’s author. Inconsistent naming of sites.
Logical Consistency: no spatial joins to check point/poly relationships
Completeness: Inconsistent due to time constraints
Contact Information
Contact Organisation: 1. Geological Survey of Queensland, DME 2. Bureau of Resource Sciences, Canberra
Contact Position: 1. Project Leader, Southeast QueenslandProject, GSQ, DME2. Manager Mineral Potential and Exploration, BRS
Contact Person: 1. Len Cranfield, GSQ, DME2. Yanis Miezitis, BRS
Mail Address 1: GPO Box 194 Brisbane Q 4001
Mail Address 2: PO Box E11 Kingston ACT 2604
Suburb (or Place or Locality): 1. 61 Mary Street Brisbane Qld2. Kingston
State (or Locality 2): 1. Queensland 2. ACT
Country: Australia
Postcode: 1. 4001 2. 2604
Telephone: 1. (07) 3237 1515 2. (02) 6272 5939
Facsimile: 1. (07) 3235 4074 2. (02) 6272 4161
Electronic Mail Address: 1. [email protected]. [email protected]
Metadata Date
Metadata Date: 30-10-97

55
Dataset
Title: Structural Clay Resources, SEQ Biogeographic Region
Jurisdiction:
Custodian: Qld Dept of Mines and Energy (DME)
Description
Abstract: Potential structural clay resource areas defined as polygons, for the SEQBiogeographic Region.
Search word(s): Extractive Industry, Clay, Southeast Queensland Biogeographic Region
Attribute List: Resource Label, Map Code, Principal Commodity, Revised Probability,Revised Probability Value, Ranking, Symbol.
Geographic Extent Name(s): Qld-NSW border to Gladstone
Geographic Extent Polygon(s): Southeast Queensland Biogeographic Region assupplied by Dept of Natural Resources
Data Currency
Beginning Date: 30-8-97
Ending Date:
Dataset Status
Progress: Completed
Maintenance and Update Frequency: Not planned in this format
Access
Stored Data Format(s): Digital –ARC/INFO/ArcView
Available Format Type(s): ARC/INFO Coverages, ArcView shape files
Access Constraint: Licensed
Data Quality
Lineage: The resource potential polygons were translated from MapInfo tables that formeda part of the report “Assessment Of Extractive Materials Potential Of The Southeast QueenslandBiogeographic Region” (Siemon and Holmes). The original resource potential polygons weredigitised from interpretations that used data from:

56
District reviews of workings of Construction Materials - Queensland Government Mining Journal
Industrial rock and mineral surveys - 100 000 Sheets - Geological Survey of QueenslandPublications
Industrial rock and mineral surveys – Shires - Geological Survey of Queensland Records
Other reports utilised included:
Geological Sheet Reports- Geological Survey of Queensland Reports,Queensland Department of Mines Map commentaries
Reviews of river sand and gravel resources – Department of PrimaryIndustries - Water Resources
TABLE 1 PRINCIPAL DATA SOURCES
Report Author Date ReferenceDalby-Millmerran-Chinchilla O’Flynn 1984 QGMJ February 84, p49Toowoomba O’Flynn 1980 QGMJ September 80, p447Gladstone Holmes 1980 QGMJ May 80, p267Pialba 1:100 000 Robertson 1981 QGMJ March 81, p131South Burnett Martin & Neville 1981 QGMJ October 81, p491Nambour & Caloundra 1:100 000 Martin 1985 GSQ Pub 385Brisbane & Caboolture 1:100 000 O’Flynn, Holmes &
Trezise1983 GSQ Pub 382
Ipswich 1:100 000 Willmott, Cooper &Martin
1979 GSQ Pub 373
Beenleigh & Murwillumbah 1:100000
Willmott, Martin,O’Flynn & Cooper
1976 GSQ Pub 368
Beaudesert Shire Martin 1975 GSQ Rec 1975/27Laidley & Gatton Shires Zahawi 1979 GSQ Rec 1979/04Laidley & Gatton Shires Zahawi 1979 GSQ Rec 1979/04Warwick - Stanthorpe O’Flynn 1983 QGMJ September 83, p339Gympie O’Flynn & Graham 1987 QGMJ July 87, 240Noosa Shire Trezise 1989 GSQ Rec 1989/21Maryborough 1:100 000 Robertson 1981 QGMJ Dec 81, 591Biloela - Mt Morgan Trezise 1982 QGMJ August 82, p364Bundaberg 1:100 000 Robertson 1980 GSQ Rec 1980/1Central Burnett Trezise 1984 QGMJ May 84, p167Upper Burnett Trezise & Graham 1984 QGMJ June 84, p208Southern Esk Shire Holmes 1979 GSQ Rec 1979/18Gatton Shire Willmott 1987 GSQ Rec 1987/30

57
Scale: 1: 250 000
Cell Size:
Positional Accuracy:
Attribute Accuracy:
Logical Consistency:
Completeness:
Contact Information
Contact Organisation: 1. Geological Survey of Queensland, DME 2. Bureau of Resource Sciences, Canberra
Contact Position: 1. Project Leader, Southeast QueenslandProject, GSQ, DME2. Manager Mineral Potential and Exploration, BRS
Contact Person: 1. Len Cranfield, GSQ, DME2. Yanis Miezitis, BRS
Mail Address 1: GPO Box 194 Brisbane Q 4001
Mail Address 2: PO Box E11 Kingston ACT 2604
Suburb (or Place or Locality): 1. 61 Mary Street Brisbane2. Kingston
State (or Locality 2): 1. Queensland 2. ACT
Country: Australia
Postcode: 1. 4001 2. 2604
Telephone: 1. (07) 3237 1515 2. (02) 6272 5939
Facsimile: 1. (07) 3235 4074 2. (02) 6272 4161
Electronic Mail Address: 1. [email protected]. [email protected]
Metadata Date
Metadata Date: 30-10-97
Additional Metadata

58
MINERAL OCCURRENCE DATA SEQ RFA
Dataset
Title: Mineral Occurrences, SEQ Biogeographic Region
Jurisdiction:
Custodian: Qld Dept of Mines and Energy (DME)
Description
Abstract: Mineral occurrence localities defined as points, for the SEQ BiogeographicRegion.
Search word(s): Mineral Occurrence, Southeast Queensland Biogeographic Region
Attribute List: X_coord, Y_coord, Number, Map, Name, Major_production,Minor_production 1, Minor_production 2, Minor_production 3, Easting, Northing,Host_formation, Age, Genetic_co, Symbol
Geographic Extent Name(s): Qld-NSW border to Gladstone
Geographic Extent Polygon(s): Southeast Queensland Biogeographic Region assupplied by Dept of Natural Resources
Data Currency
Beginning Date: 30-8-97
Ending Date:
Dataset Status
Progress: Completed
Maintenance and Update Frequency: Not planned in this format
Access
Stored Data Format(s): Digital – Oracle, ARC/INFO, ArcView
Available Format Type(s): Excel or comma delimited text, ARC/INFO coverage, ArcViewshape files
Access Constraint: Licensed

59
Data Quality
Lineage: data compiled from company reports, Geological Survey Reports andPublications, field observations. Data points plotted onto cadastral or topographic mapsheets then digitised, or GPS locations. ArcView shape file generated from dBase file usingadd event theme command.
Scale: 1: 100 000
Cell Size:
Positional Accuracy: +/_ 50m to +/- 300m
Attribute Accuracy: relative to field observations and geological/mineralogicalinterpretations
Logical Consistency:
Completeness: subset of a much larger data set
Contact Information
Contact Organisation: 1. Geological Survey of Queensland, DME 2. Bureau of Resource Sciences, Canberra
Contact Position: 1. Project Leader, Southeast QueenslandProject, GSQ, DME2. Manager Mineral Potential and Exploration, BRS
Contact Person: 1. Len Cranfield, GSQ, DME2. Yanis Miezitis, BRS
Mail Address 1: GPO Box 194 Brisbane Q 4001
Mail Address 2: PO Box E11 Kingston ACT 2604
Suburb (or Place or Locality): 1. 61 Mary Street Brisbane2. Kingston
State (or Locality 2): 1. Queensland 2. ACT
Country: Australia
Postcode: 1. 4001 2. 2604
Telephone: 1. (07) 3237 1515 2. (02) 6272 5939
Facsimile: 1. (07) 3235 4074 2. (02) 6272 4161
Electronic Mail Address: 1. [email protected]. [email protected]

60
Metadata Date
Metadata Date: 30-10-97
Additional Metadata
Additional Metadata:

61
Dataset
Title: Producing Mines and Major Prospects, SEQ Biogeographic Region
Jurisdiction:
Custodian: Qld Dept of Mines and Energy (DME)
Description
Abstract: Location of producing mines and major prospects defined as points, for the SEQBiogeographic Region.
Search word(s): Mineral Occurrence, Producing Mine, Major Prospect, SoutheastQueensland Biogeographic Region
Attribute List: Name, Commodity, Environment, Status, Symbol
Geographic Extent Name(s): Qld-NSW border to Gladstone
Geographic Extent Polygon(s): Southeast Queensland Biogeographic Region assupplied by Dept of Natural Resources
Data Currency
Beginning Date: 30-8-97
Ending Date:
Dataset Status
Progress: Completed
Maintenance and Update Frequency: Not planned in this format
Access
Stored Data Format(s): Digital –Oracle, ARC/INFO, ArcView
Available Format Type(s): Excel or comma delimited text, ARC/INFO coverage, ArcViewshape files,
Access Constraint: Licensed
Data Quality
Lineage: : A combination of MINLOC data and data compiled from company reports,Geological Survey Reports and Publications, field observations. Data points plotted ontocadastral or topographic map sheets then digitised, or GPS locations. ArcView shape filegenerated from dBase file using add event theme command.
Scale: 1: 100 000

62
Cell Size:
Positional Accuracy: +/_ 50m to +/- 300m
Attribute Accuracy: relative to field observations and geological/mineralogicalinterpretations
Logical Consistency:
Completeness: specific subset of a much larger data set
Contact Information
Contact Organisation: 1. Geological Survey of Queensland, DME 2. Bureau of Resource Sciences, Canberra
Contact Position: 1. Project Leader, Southeast QueenslandProject, GSQ, DME2. Manager Mineral Potential and Exploration, BRS
Contact Person: 1. Len Cranfield, GSQ, DME2. Yanis Miezitis, BRS
Mail Address 1: GPO Box 194 Brisbane Q 4001
Mail Address 2: PO Box E11 Kingston ACT 2604
Suburb (or Place or Locality): 1. 61 Mary Street Brisbane2. Kingston
State (or Locality 2): 1. Queensland 2. ACT
Country: Australia
Postcode: 1. 4001 2. 2604
Telephone: 1. (07) 3237 1515 2. (02) 6272 5939
Facsimile: 1. (07) 3235 4074 2. (02) 6272 4161
Electronic Mail Address: 1. [email protected]. [email protected]
Metadata Date
Metadata Date: 30-10-97
Additional Metadata

63
12. REFERENCES
Berkman, D.A., 1996. The mining industry and mineral potential of forested areas within thesoutheast Queensland biogeographic region. Queensland Minerals and Energy Review Series,Department of Mines and Energy, Queensland.
Cox, A., Beil, S. and Waring, T., 1994. Exploration, mining and resource access policy, aneconomic perspective on environmental and native title issues. Paper presented at the 6th Mineralsand Energy Forum, Beijing, 16 March .
Dewitt, E., Redden, J. A., Wilson, A. B. and Buscher, D., 1986. Mineral resource potential andgeology of the Black Hills National Forest, South Dakota and Wyoming. United States GeologicalSurvey Bulletin 1580.
Industry Commission, 1991. Mining and Minerals Processing in Australia, vol. 3, Issues in Detail,Report no. 7, AGPS, Canberra.
Marsh, S. P., Kropschot, S. J. and Dickinson, R. G., 1984. Wilderness mineral potential.Professional Paper United States Geological Survey 1300.
Murray, C. G., 1990. Tasman Fold Belt in Queensland, pp. 1431-1450 in Geology of the MineralDeposits of Australia and Papua New Guinea, AusIMM Monograph 14.
Murray, R., Cox, A. and Allen, C. 1995. Mining and the environment: issues in resource access.Paper presented to the Northern Australian Regional Outlook Conference, Darwin, 12 October.
O’Flynn, M.L., 1992. Resources of extractive materials in the eastern Moreton Region. QueenslandResource Industries Review Series. Department of Resource Industries, Queensland.
Siemon, J.E. and Holmes, K.H., 1996. Assessment of extractive materials potential of the southeastQueensland biogeographic region. A report prepared for the Queensland Department of Mines andEnergy.
Taylor, R.B. and Steven, T.A., 1983. Definition of mineral resource potential. Economic Geology,vol. 78, pp. 1268-1270.