
„Assessment of macroeconomic effects of quantitative easing...
138
MASTERARBEIT Titel der Masterarbeit „Assessment of macroeconomic effects of quantitative easing (QE)“ Verfasst von Shanna Ruf BSc angestrebter akademischer Grad Master of Science (MSc) Wien, 2015 Studienkennzahl lt. Studienblatt: A 066 914 Studienrichtung lt. Studienblatt: Masterstudium Internationale Betriebswirtschaft Betreuer: o. Univ.-Prof. Dipl.-Math. Dr. Jörg Finsinger
Transcript of „Assessment of macroeconomic effects of quantitative easing...

MASTERARBEIT
Titel der Masterarbeit
„Assessment of macroeconomic effects of quantitative easing (QE)“
Verfasst von
Shanna Ruf BSc
angestrebter akademischer Grad
Master of Science (MSc)
Wien, 2015 Studienkennzahl lt. Studienblatt: A 066 914 Studienrichtung lt. Studienblatt: Masterstudium Internationale Betriebswirtschaft Betreuer: o. Univ.-Prof. Dipl.-Math. Dr. Jörg Finsinger
II
Table of contents
Table of Figures ................................................................................................. V
Table of Abbreviations .................................................................................... VI
Table of Symbols ........................................................................................... VIII
1. Introduction .................................................................................................. 1
2. The Main Aspects of Evolution of Quantitative Easing ........................... 5
2.1 Conventional vs. Unconventional Policy Measures .......................................... 7
2.2 The Nature of Quantitative Easing ................................................................... 10
2.3 Credit Easing Compared to Quantitative Easing ............................................. 11
2.4 Transmission Channels for Quantitative Easing .............................................. 12
2.4.1 Portfolio-rebalancing Channel ................................................................. 12
2.4.2 Signaling .................................................................................................. 13
2.4.3 Liquidity ................................................................................................... 13
2.5 Expansion of Central Bank Balance Sheets ..................................................... 14
3. Assessment of Economic Environment, Quantitative Easing Measures and Empirical Research in the United States, England, European Union and Japan. ......................................................................................................... 19
3.1 Quantitative Easing in the United States: Description of Economic
Environment .................................................................................................... 19
3.2 United States: Scale and Description of Measures Introduced ........................ 22
3.2.1 Lending Facilities: Term Auction Facility, Term Securities
Lending Facility, Primary Dealer Credit Facility .................................... 24
3.2.2 Central Bank Liquidity Swap Lines ......................................................... 25
3.2.3 Troubled Asset Relief Program ................................................................ 25
3.2.4 Large-Scale Purchase Programmes .......................................................... 26
a. Commercial Paper Funding Facility ............................................................. 26

III
b. Asset-Backed Commercial Paper Money Market Mutual Fund
Liquidity Facility ...................................................................................... 26
c. Agency Mortgage-Backed Securities Purchase Program .............................. 27
d. Purchase of Long-term U.S. Treasury Bills .................................................. 28
3.3 Evaluation of The Relevant Research Papers and The Empirical
Results ............................................................................................................. 30
3.4 Quantitative Easing in the Eurozone: Description of Economic
Environment .................................................................................................... 33
3.5 Eurozone: Scale and Description of Measures Introduced .............................. 37
3.5.1 Exceptional Liquidity Provision .............................................................. 38
3.5.2 Fixed-rate Full Allotment ......................................................................... 39
3.5.3 Three-year Refinancing Operations (3-year LTRO) ................................ 39
3.5.4 Liquidity in Foreign Currencies ............................................................... 40
3.5.5 Collateral Easing ...................................................................................... 40
3.5.6 Purchases of Assets .................................................................................. 41
3.6 Evaluation of the Relevant Research Papers and the Empirical Results ......... 44
3.7 Quantitative Easing in the United Kingdom: Description of Economic
Environment .................................................................................................... 50
3.8 United Kingdom: Scale and Description of Measures Introduced .................. 52
3.8.1 Liquidity Facilities ................................................................................... 52
3.8.2 Short-term Rate Reduction ....................................................................... 53
3.8.3 Large-Scale Asset Purchases and Quantitative Easing ............................ 54
3.9 Evaluation of the Relevant Research Papers and the Empirical Results ......... 55
3.10 Quantitative Easing in Japan: Description of Economic Environment ............ 60
3.11 Japan: Scale and Description of Measures Introduced .................................... 63
3.11.1 Non-performing Loans ............................................................................. 64
3.11.2 Fiscal Stimulus Programs ......................................................................... 65
3.11.3 Quantitative Easing .................................................................................. 66

IV
3.12 Evaluation of the Relevant Research Papers and the Empirical Results ......... 68
4. Assessment of the Effects of Quantitative Easing ................................... 73
4.1 Assessment of the Effects on Inflation ............................................................ 73
4.2 Assessment of the Effects on Unemployment ................................................. 79
4.3 Assessment of the Effects on GDP .................................................................. 82
4.4 Assessment of the Effects on Spreads .............................................................. 86
5. Conclusion ................................................................................................... 94
Appendix .......................................................................................................... VI
Zusammenfassung ........................................................................................... XI
Summary ....................................................................................................... XIII
Bibliography .................................................................................................... XV
Ehrenwörtliche Erklärung ................................................................. XXXVIII
Curriculum Vitae .................................................................................... XXXIX

V
Table of Figures
Figure 1 – Development of the policy rates of selected central banks .......................... 5
Figure 2 – Development of central banks’ balance sheets ........................................... 15
Figure 3 – Economic development in the U.S. ............................................................ 21
Figure 4 – Economic development in the Eurozone .................................................... 35
Figure 5 – Economic development in the United Kingdom ........................................ 51
Figure 6 – Economic development of Japan ................................................................ 62
Figure 7 – Development of inflation relative to the central bank balance sheet in US,
UK, Eurozone and Japan ...................................................................................... 78
Figure 8 – Divergence in balance sheet expansion of FED and ECB relative to the
development of unemployment ............................................................................ 81
Figure 9 – Divergence in balance sheet expansion of BOE and BOJ relative to the
development of unemployment ............................................................................ 82
Figure 10 – Balance sheet expansion relative to real GDP growth in U.S., Eurozone,
UK and Japan ....................................................................................................... 85
Figure 11 – Libor-OIS GBP 3 months spread versus U.K. Generic Government Bond
10-year yield ........................................................................................................ 89
Figure 12 – Effects of SMP and OMT on the Government Bond 10-year yields of
Germany, Italy, Portugal and Spain ..................................................................... 91

VI
Table of Abbreviations
ABCP Asset-Backed Commercial Paper
ABS Asset Backed Securities
ABSPP Asset Backed Securities Purchase Programme
AMLF Asset-Backed Commercial Paper Money Market Mutual Fund
Liquidity Facility
APF Asset Purchase Facility
APP Asset Purchase Program
BEAPFF Bank of England Asset Purchase Facility Fund Limited
BOE Bank of England
BOJ Bank of Japan
BVAR Bayesian Vector Auto Regression
CAB Current Accounts Balance
CBPP Covered Bonds Purchase Programme
CCPC Cooperative Credit Purchasing Company
CME Comprehensive Monetary Easing
CPFF Commercial Paper Funding Facility
CPI Consumer Price Index
DWF Discount Window Facility
ECB European Central Bank
ELTR Extended Collateral Three-Month Repo
EMU Economic and Monetary union of the European Union
EONIA Euro Overnight Index Average
ESCB European System of Central Bank
ETF Exchange-Traded Funds
FAVAR Factor-Augmented Vector Autoregression
FED Federal Reserve
FOMC Federal Open Market Committee
FRFA Fixed-rate Full Allotment
GC General Collateral
GDP Gross Domestic Product
GFC Great Financial Crisis
GSE Government-Sponsored Enterprise

VII
J-REIT Japanese real estate investment trust
JGB Japanese Government Bond
LIBOR London Interbank Offered Rate
LSAP Large-Scale Asset Purchases
LTRO Longer-Term Refinancing Operations
MBS Mortgage-Backed Security
MMIFF Money Market Investor Funding Facility
MPC Monetary Policy Commitee
MRO Main Refinancing Operation
MS-FAVAR Markov Switching-Factor-Augmented Vector Autoregression
MS-SVAR Markov Switching-Structural Vector Auto Regression
NCBs National Central Banks
NIESR National Institute of Economic and Social Research
OIS Overnight Index Swap
OMO Open Market Operations
OMT Outright Monetary Transaction
PDCF Primary Dealer Credit Facility
QE Quantitative Easing
QEMP Quantitative Easing Monetary Policy
QEP Quantitative Easing Policy
RMBS Rated Residential Mortgage-Backed Securities
SLS Special Liquidity Scheme
SLTRO Supplementary Longer-Term Refinancing Operations
SMP Securities Markets Programme
SVAR Structural Vector Auto Regression
TAF Term Auction Facility
TARP Troubled Assets Relief Program
TED Treasuries Over Euro Dollar
TSLF Term Securities Lending Facility
TVP-SVAP Time Varying Parameter-Structural Vector Auto Regression
VAR Vector Auto Regression
VLTRO Very Long Term Refinancing Operation
ZIRP Zero Interest Rate Policy
VIII
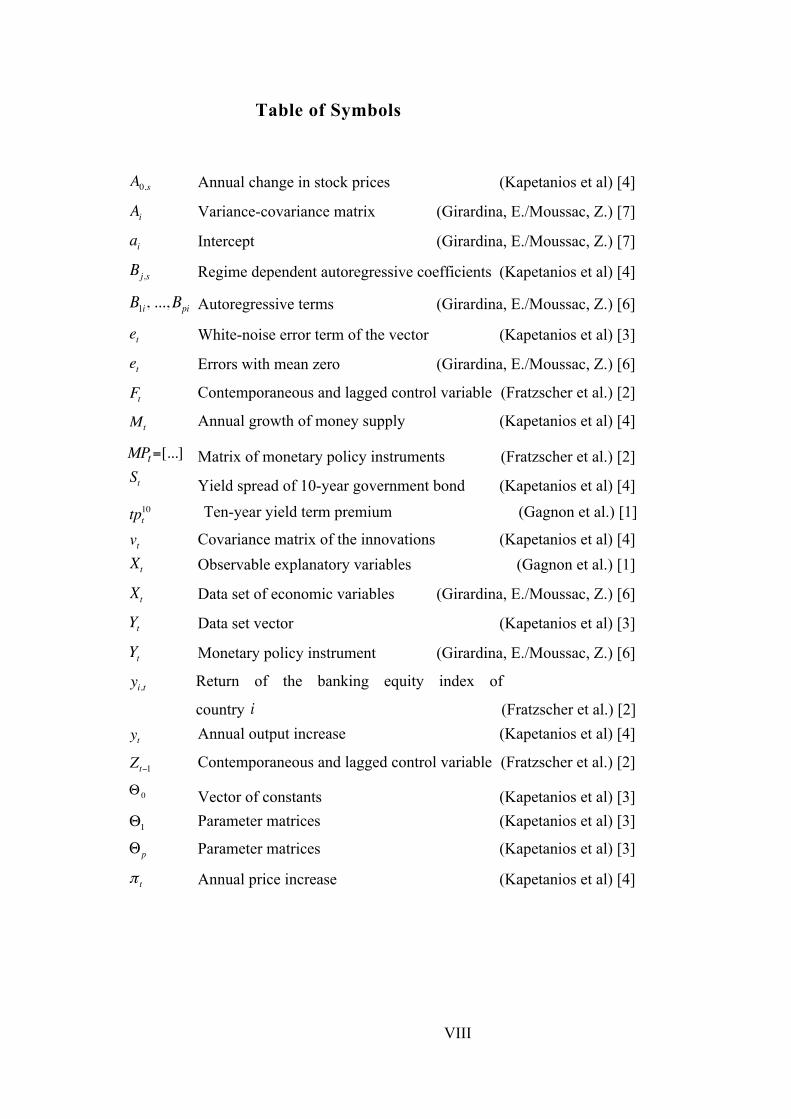
vt
Table of Symbols
Annual change in stock prices (Kapetanios et al) [4]
Variance-covariance matrix (Girardina, E./Moussac, Z.) [7]
Intercept (Girardina, E./Moussac, Z.) [7]
Regime dependent autoregressive coefficients (Kapetanios et al) [4]
Autoregressive terms (Girardina, E./Moussac, Z.) [6] White-noise error term of the vector (Kapetanios et al) [3]
Errors with mean zero (Girardina, E./Moussac, Z.) [6]
Contemporaneous and lagged control variable (Fratzscher et al.) [2]
Mt Annual growth of money supply (Kapetanios et al) [4]
MPt=[...] Matrix of monetary policy instruments (Fratzscher et al.) [2] Yield spread of 10-year government bond (Kapetanios et al) [4]
Ten-year yield term premium (Gagnon et al.) [1] Covariance matrix of the innovations (Kapetanios et al) [4]
Observable explanatory variables (Gagnon et al.) [1]
Data set of economic variables (Girardina, E./Moussac, Z.) [6]
Data set vector (Kapetanios et al) [3]
Monetary policy instrument (Girardina, E./Moussac, Z.) [6]
Return of the banking equity index of
country (Fratzscher et al.) [2] yt Annual output increase (Kapetanios et al) [4]
Contemporaneous and lagged control variable (Fratzscher et al.) [2]
Vector of constants (Kapetanios et al) [3] Parameter matrices (Kapetanios et al) [3]
Parameter matrices (Kapetanios et al) [3]
Annual price increase (Kapetanios et al) [4]
A0,sAiaiBj,s
B1i, ...,Bpi
etetFt
St
Xt
Xt
YtYtyi,t
i
Zt−1Θ 0
Θ1
Θp
π t
tpt10

1
1. Introduction
Financial crises happen time and again throughout different economies and over
several decades. Historical perspectives showed through the appearance of substantial
economic and financial crises such as Great Recession of 2008, Great Depression of
1929 or Black Monday 1987 how closely intertwined and staggeringly fragile national
economies are. One of the conditions of a well functioning economy are “well-
developed, liquid and transparent credit markets”1. These and some other substantial
rules were neglected during last global financial crisis resulting in the Great Recession
that led to financial imbalances and uncertainty in both developed and emerging
economies. Several countries felt the consequences of this colossal disruption having
difficulties with the access to liquidity over the interbank market.2
Responding to severe financial economic changes, fiscal and monitory institutions
applied a range of conventional and unconventional policy measures. Once,
conventional monetary policy targeting usually short-term interest rates provides no
more effective results to successfully deal with incurred difficulties, it becomes
necessary to adopt unconventional monetary measures that involve a direct effect on
long-term interest rates. Therefore, easy money policy, being a part of unconventional
monetary policy, was initiated by the leading central banks around the world in order
to alleviate liquidity shortage and stabilized economic activity. On that point,
“Quantitative Easing” (QE) turned to a predominant tool among the variety of
unconventional monetary policies applied.3
In 1995 Richard Werner4,5 first introduced the term of Quantitative Credit Easing by
analyzing the stagnating and deflationary periods of Japanese economy. Prof. Werner
defined Quantitative Credit Easing as a monetary instrument targeting not the
expansion of money base via reserve increases, but rather focusing on credit creation 1 Chapman, J. (2011), p. 1. 2 Cf. Verick, S./Islam, I. (2010), p. 3 ff.; cf. Berrospide, J. (2013), p. 1. 3 Cf. Bowdler, C./Radia, A. (2012), p. 604, 606. 4 Cf. Werner, R. (1995). 5 German economist, Director of International Development and founding Director of the Centre for Banking, Finance and Sustainable Development, also former Prof. of Frankfurt University. (Cf. Southampton Business School (2014): Professor Richard Werner)
2
in order to encourage banking sector that in turn was supposed to stimulate economic
activity. Later this term became rather known as Quantitative Easing, which over last
decades, was practiced as a tool expanding monetary aggregates and thereby focusing
on increasing the balance sheet size and liability side of central bank.6 In most of the
literature the term Quantitative Easing is defined as set of programs of large-scale
asset purchases bankrolled by expenditures of a central bank presenting at the same
time expansions of its balance sheet.7
Although central banks of the United States (U.S.), Eurozone, United Kingdom (UK)
and Japan were similar in introduction of unconventional policies, the implementation
of the unconventional tools, in particular, QE differed across those major economies.8
Quantitative easing was first introduced in Japan and later in the U.S., Eurozone and
UK. It became the prevailing instrument in combating economic and financial
downfall in times when central bank’s monetary policy regulation via short-term
interest rates faced its limits.9
The main focus of this work is dedicated to the one of the most controversial
unconventional monetary measures – quantitative easing, applied by central banks
during the recent years. The work is aimed at describing and assessing of the effects
of quantitative easing used by the selected central banks. Thus, the work seeks to
answer the following questions:
1. Can QE improve selected macroeconomic indicators?
2. Can there be a consistent path of conducting the policy, which can be similarly
applied to another countries in an effort to achieve the same positive results?
This work will incorporate four chapters. After the introductory part, second chapter
will outline the main aspects of evolution of quantitative easing as a tool for
conducting the monetary policy. Thereby, a short overview of general economic
background will be provided in order to demonstrate the necessity of central bank’s
6 Cf. Lyonnet, V./Werner, R. (2012), p. 96; cf. Werner, R. (1995), p. 1. 7 Cf. Bowdler, C./Radia, A. (2012), p. 604. 8 Cf. Fawley, B./Neely, C. (2013), p. 52. 9 Cf. Joyce, M. et al. (2012), p. 272, 274.

3
action in introducing the non-standard monetary policy tool known as quantitative
easing. Furthermore, in the following there will be presented and highlighted the
underlying differences between the conventional and unconventional monetary
policies. Approaching more deeply the toolkit of measures of unconventional
monetary policy, the two most notable measures such as Quantitative easing and
Credit easing will be described with regard to their distinctive features and, more
importantly the interconnection with the expansive development of central banks’
balance sheets.
Additionally, the second chapter will capture essential transmission channels, which
QE works through, and will especially highlight portfolio-rebalancing, signaling and
liquidity channels. Moreover, there will be described the extensive development of
balance sheet size expansion by selected central banks, which addressed the
consequences of financial crisis. The aim of this will be to present the comparison of
the central banks’ economic targets, which varied across countries and whose
achievement directly depended on the extent of unconventional measures applied.
Third chapter will focus on the provision of an extensive description of the economic
environment, along with severe deterioration of macroeconomic and financial
indicators e.g. inflation, GDP growth, unemployment, and spreads observed in the
selected countries during the financial crisis. This description of underlying stance of
relevant economies will pursue the purpose of presenting initial economic and
financial conditions, which induced the necessity for application of quantitative
easing. Based on that, a wide range of monetary policy measures applied by main
central banks with regards to economic meltdown will depict another key point,
which will be covered by the third chapter.
Thereby, given the structural differences of financial systems across the countries, the
extent and composition of relevant monetary measures will largely differ across
central banks. Consequently, to perform an assessment of empirical research papers,
chapter three will provide an overview over the relevant empirical research studies
conducted to investigate the effectiveness of quantitative easing on both economic
and financial markets.

4
Importantly, the fourth chapter will conduct assessment of effects of quantitative
easing on the economy and financial markets. For this, applying data from the
selected economies, there will be studied the development of key macroeconomic and
financial indicators represented by inflation, unemployment, GDP and spreads.
Finally, the conclusion of the research work will reassert the statement, discuss the
issues and reach a conclusive statement.

5
2. The Main Aspects of Evolution of Quantitative Easing
In light of the financial crisis of 2008 what economists now denote the Great
Recession, major central banks of advanced economies were forced to deal with the
implementation of a broad variety of unconventional policy measures.10 The purpose
of these measures was to avert severe downturn of economic activity and provide
necessary liquidity to financially distressed financial institutions.11
Since regulation and monitoring of short-term interest rates is the general and typical
way of how a central bank conducts its monetary policy, starting in 2008, major central
banks across the world responded with considerable short-term interest rates cuts to the
worsening of financial crisis. The shifts of short-term interest rates towards the zero
lower bound were first steps in approaching the less conventional monetary policy.12
Figure 1 – Development of the policy rates of selected central banks
Source: Federal Reserve (Fed), European Central Bank (ECB), Bank of England
(BOE), Bank of Japan (BOJ).
10 Cf. Bowdler, C./Radia, A. (2012), p. 604. 11 Cf. Fawley, B./Neely, C. (2013), p. 53 f. 12 Cf. Ibid., p. 51 f.
0,0
1,0
2,0
3,0
4,0
5,0
6,0
2005 2006 2007 2008 2009 2010 2011 2012 2013 2014 2015
Fed Funds Target Rate ECB Refinance Rate
UK Official Bank Rate Japan Central Bank Rate
6
Consequently, as it can be seen from the Figure 1 above, in the summer of 2007 Fed
undertook an aggressive step-down of its target federal funds rate in response to the
financial crisis, which was followed by a number of programs aimed at easing
financial conditions and boosting the economic activity.13 In October 2008, ECB as
well as BOE following a concerted decision entered the path of aggressive key
interest rate reduction, too.14
Japans movement towards aggressive interest rate reduction aroused as a result of a
severe economic and financial misery burdening Japan since 1990s. In response to
persistent deflation and only modest GDP development, Bank of Japan (BOJ)
introduced an unprecedented zero interest rate policy (ZIRP) in 1999. In course of
time ZIRP was repeatedly terminated and restarted as in 2010 along with the second
QE program ZIRP was reintroduced again and continued until today.15
Facing the bottom-bound of short-term interest rates, that were stretched to their
limits in generating expected recovery, central banks decided to provide further
monetary stimulus to sustain the economic growth.16 Depending on the specificity and
structure of each economy, the implementation of unconventional monetary policy
measures differentiated across central banks. Thus, while U.S. and UK primarily
focused on large-scale asset purchase programs (LSAPs) as suitable measure to
achieve economic and financial recovery through reduction of yields, ECB and Japan,
targeting particularly revival of impaired credit market and banking sector, applied a
wide spectrum of liquidity and lending supporting programs within their
unconventional policy measure.17
Next section will be highlighting difference between conventional and unconventional
policy measures.
13 Cf. Bernanke, B. (2009), p. 1 ff. 14 Cf. European Central Bank (2010b), p. 65; cf. Bank of England (2008b), p. 9 f. 15 Cf. Kurihara, Y. (2014), p. 77 f.; cf. Horioka, C. (2006), p. 1. 16 Cf. Joyce, M. et al. (2012), p. 272, 276. 17 Cf. Baumeister, C./Benati, L. (2010), p. 15 f.; cf. Fawley, B./ Neely, C. (2013), p. 71.

7
2.1 Conventional vs. Unconventional Policy Measures
Conventional monetary policy is a type of monetary policy that is conducted when the
economy is not exposed to an economic shock and a normal economic environment is
assumed.18 Thereby, among all its standard instruments applied, such as standing
facilities, minimum reserve etc., conventional monetary policy set off especially open
market operations as major tool in implementing the monetary policy.19
Open market operations serve as a reliable instrument for influencing the interest rates
and thus money supply in the market. In doing so, central bank is involved in an open
market activity where it purchases or sales securities in order to regulate reserves and
the money base, which in turn can influence the short-term interest rate in the finance
market through the change of the money supply.20
Making use of transmission mechanisms enables central bank to transfer monetary
decisions and impulses, which result from monetary policy measures in place, to the
economy and affect macroeconomic policy factors.21 Many economists refer to interest
rate and credit channel, which depict most common transmission channels. By means
of real interest rate channel, central bank attempts to affect both investment activity
and aggregate demand.22 Thus, widening of monetary base and money in circulation
causes reduction in real interest rate consistent with reduction of cost of capital.23
At the same time, effects exercised on the short-term interest rates induce also
changes in long-term yields, which according to the expectation hypothesis consist of
average of short-term rates and risk premium. Therefore, monetary measures focusing
on reduction of short-term interest rates can influence long-term interest rates and
push them down.24 As a result, arising low costs of capital lead to positive investment
18 Cf. Smaghi, L. (2009): Conventional and unconventional monetary policy. 19 Cf. European Central Bank: Monetary Policy Instruments. 20 Cf. Mishkin, F. (2001), p. 439; cf. Federal Reserve (2013): Open Market Operations. 21 Cf. European Central Bank (2010a), p. 85. 22 Cf. Ibid., p. 86, 89. 23 Cf. Mishkin, F. (1996), p. 2. 24 Cf. Gagnon, J. et al. (2011), p. 6 f.
8
prospects allowing investors to spend more and therefore increase aggregate demand
boosting the overall economic activity.25
Credit channel is another way used by central banks to interact with the economy.
Hereby, commercial banks play an important role serving as channels for providing
loans and ensuring access to financing, especially for those, who are not able to
independently participate in the credit market by using stock or bond market as an
alternative source of financing.26 Consequently, increasing bank reserves as result of
easing credit conditions exert direct positive influence on banks’ ability to award loans.
That is why banks` propensity to lend money increases banks´ and private consumers’
expenditures and encourages aggregate output by enhancing investment activities.27
Financial and economic market impairment as consequences of a financial crisis might
be the reason for the inoperability of both credit and interest rate channel. On the one
side, arising distrust among banks and liquidity shortage for lending might lead to
credit channel blockage.28 On the other side, short-term interest rate set within the scope
of conventional monetary policy near to or at zero might cause interest rate regulation
problems due to the inability of further lowering the short-term interest rate.29
In particular, as short-term interest rates already hit their bottom, conventional
monetary stimulus becomes no longer effective. At this point, various sources refer to
an extreme case of so-called liquidity trap30, which initially was defined by John
Maynard Keynes and was later extended by renowned economists such as Milton
Friedman and Paul Krugman. According to them, economy experiencing liquidity
trap faces a situation, where money supply can no longer effect interest rates and
consequently cannot affect aggregate spending.31
25 Cf. Gagnon, J. et al. (2011), p. 6 f.; cf. Mishkin, F. (1996), p. 3. 26 Cf. Mishkin, F. (1996), p. 9. 27 Cf. Ibid., p. 9. 28 Cf. Mishkin, F. (1996), p. 16 f. 29 Cf. Joyce, M. et al. (2012), p. 276. 30 Cf. Keynes, J. (1936), p. 103; cf. Krugman, P. (1998), p. 1. 31 Cf. Mishkin, F. (2001), p. 556.
9
At this point, introduction of new monetary policy measures becomes necessary.
Therefore, by means of the unconventional policies that encompass a range of
monetary policy instruments, central banks can additionally relax financial conditions
and affect directly long-term rates.32 Unconventional policy measures entail a broad
range of tools and measures in order to ease financial constraints within an ailing
economy. Depending on the goals determined by central banks, a variety of
unconventional policy measures can be chosen in order to target those objectives.
Thus, by e.g. applying exceptional liquidity provision facilities central bank might
help banks to avoid much stronger liquidity shortage problem. Simultaneously,
operating through large-scale asset purchases might enable central banks to influence
and lower the long-term yields.33
According to Bowdler and Radia, one can differentiate between conventional
unconventional and unconventional unconventional monetary policies. The former
expression refers primarily to implementation of QE, one instrument that depicts
large-scale asset purchases conducted by the central banks aimed at changing central
banks balance sheet size and targeting the long-term interest rate. The latter
expression captures a set of all other programs that were introduced as a part of
expansionary policy. Those policy initiatives ranged from forward guidance –
“explicit statements by a central bank about the likely path of future policy rates”34 to
short-term and long-term liquidity provision in form of refinancing operations and
credit easing measures.35
In next paragraph there will be discussed two most common unconventional policy
measures put in focus by central banks in order to stimulate financial activity and
aggregate demand operating through active altering of the composition and volume of
the central bank´s balance sheets.
32 Cf. Bowdler, C./Radia, A. (2012), p. 604 ff. 33 Cf. Smaghi, L. (2009): Conventional and unconventional monetary policy. 34 Cœuré, B. (2013): The Usefulness. 35 Cf. Bowdler, C./Radia, A. (2012), p. 604, 608.
10
2.2 The Nature of Quantitative Easing
The term of QE that was primarily introduced by the BOJ and is nowadays
synonymously used for large-scale asset purchases program consistent with expansion
of the monetary base. However, the original definition came from Richard Werner,
who initially defined QE as set of measures stimulating quantity of credit creation
rather than money base expansion.36 In response to Japan´s persistent economic
recession, Werner proposed Quantitative Monetary Easing to BOJ, whose focus
resided in creation of credit market supporting programs, which were supposed to
help Japan´s economy generate growth after longstanding economic stagnation.
However, despite this proposal BOJ decided to introduce monetary policy of bank
reserve targeting under today commonly known term of “Quantitative Easing”.37
As one of the unconventional measures applied by central banks across advanced
economies, QE expands central banks’ balance sheet size by influencing the liabilities
as part of their balance sheets. Thereby, it does not reconfigure the assets side of the
same balance sheet by leaving the composition of central banks asset holdings
unchanged. Instead QE blows up the size of the balance sheet and expands the money
base by creating increased level of central bank reserves.38
By applying QE, central banks aim at stimulating the aggregate demand and
economic activity, when short-term interest rates hitting their zero bound constraints
cannot achieve the targeted result. Thereby, central banks purchasing extensive
financial assets across different segments attempt to influence the curve of yields of
long term securities. Thus, induced shortage of financial assets being purchased via
LSAPs leads to increase in prices of those financial assets and reduction of their
interest rates.39 Since stance of long-term rates entails investors’ expectations in
regard to central bank´s future actions as well as strongly affects peoples spending
36 Cf. Werner, R. (1995), p. 1. 37 Cf. Lyonnet V./Werner, R. (2012), p. 96; cf. Werner, R. (1995), p. 1. 38 Cf. Lenza, M. et al. (2010), p. 9. 39 Cf. Smaghi, L. (2009): Conventional and unconventional monetary policy; cf. Gagnon, J. et al. (2011), p. 6.
11
decisions, central banks sought to target long-term interest rates by overwhelmingly
purchasing government bonds.40
This approach was implemented by major central banks and contributed to
considerable expansion of their balance sheet sizes. Intensity of LSAPs depended on
the conditions of the economy of a certain country related to weak demand, negative
price development and rising unemployment.
2.3 Credit Easing Compared to Quantitative Easing
In practice, both Quantitative and Credit easing lead to a change of the central banks
balance sheet. The conceptual difference of these two measures resides in distinct
balance sheet sides, which these approaches focus on. While QE particularly influences
the size and the liability side of the balance sheet, Credit easing directly addresses the
asset side and the composition of the balance sheet.41 Thereby, implementation of
Credit easing measures aims at lowering the banks’ funding cost and stimulating
banks’ lending activity by lowering yield curves and easing of credit conditions.42
Credit easing measures seeking to improve credit conditions may also not only
change the balance sheet volume but more usually they vary the composition of assets
at different maturities on the asset side. In order to influence yield curve central banks
short-term asset holdings can be replaced by long-term assets, whose increased
purchases might induce decrease in long-term risk premiums and flatten the yield
curve on the market. Thus, this approach targets at risk-spread reduction across
securities that lost their usual market in light of financial crisis.43
Besides asset purchases, Credit easing measures include various lending facilities and
liquidity provisions programs among those Long-Term Refinancing Operations
(LTROs) or Term Auction Facility, which enable central banks to organize an 40 Cf. Federal Reserve Bank of San Francisco (2014), p. 1; cf. Engen, E. et al. (2014), p. 15. 41 Cf. Shiratsuka, S. (2010), p. 93 ff. 42 Cf. Shiratsuka, S. (2010), p. 93 f.; cf. Bowdler, C./Radia, A. (2012), p. 618 f. 43 Cf. Shiratsuka, S. (2010), p. 95; cf. Smaghi, L. (2009): Conventional and unconventional monetary policy.

12
additional supply of liquidity straight to financially distressed institutions in order to
ensure appropriate temporary financing possibilities.44 Thus, all four central banks had
applied Credit easing measures to greater or lesser extent before Quantitative easing
became the leading approach. Thereby, from December 2007 Fed explicitly declared
to be conducting Credit easing, while ECB officially entered the policy phase of
“enhanced credit support” in August 2007. BOE and BOJ applied similar Credit
easing measures for supporting credit markets, however, they did not explicitly
signalize that policy conducted was directed towards Credit Easing.45
2.4 Transmission Channels for Quantitative Easing
In numerous papers authors refer to three particular QE transmission channels. In the
following those three channels including portfolio rebalancing channel, signaling
channel and liquidity channel will be presented.
2.4.1 Portfolio-rebalancing Channel
Many analysts and researchers argue that QE might primarily affect the long-term
interest rates through the so-called portfolio-rebalancing channel.46 However
beforehand, it becomes necessary to take a quick look on the composition of long-
term interest rate. Both risk premium, bearing additional investor risk of long-term
investment, and average of prospective short-term interest rates depict the two
components long-term interest rate is based on. Thereby, LSAPs operating through
the portfolio-rebalancing channel do not exert effect on the prospective short-term
interest rates, but directly target the risk premium. Applying LSAPs central bank adds
to aggregate demand for long duration assets what leads to reduction in risk premium
of long-term assets and of long-term yields accordingly.47
However, there is an additional spill over effect- that derives from reduction in long-
tem interest rate. Low long-term yields of specific assets force investors to escape into
44 Cf. Bowdler, C./Radia, A. (2012), p. 618 f.; cf. Bernanke, B. (2009), p. 4. 45 Cf. Bernanke, B. (2009), p. 4; cf. Trichet, J.-C. (2009), p. 10, 12. 46 Cf. Bauer, M./Rudebusch, G. (2013), p. 1 f. 47 Cf. Gagnon, J. et al. (2011), p. 6 f.

13
higher yielding assets segments. By chasing higher returns, investors seek for suitable
substitutes, which might depict corporate bonds or other risky assets. Investors’
portfolio shift towards these assets raises their demand, which for its part pushes
related asset prices high. In total, LSAPs contribute to flattering of yield curves across
different securities reducing long-term funding cost. Such favorable financing
conditions are supposed to help economy to trigger increase in aggregate demand.48
2.4.2 Signaling
Signaling is the second transmission channel used within QE to influence the long-term
interest rates. Acting through the signaling channel, first component of long-term
interest rate - average future short-term interest rates - comes into focus. Signals set by
central banks via particular monetary policy measures might affect private sector´s
outlook for the prospective monetary policy development. As a result, LSAP
announcements serve as measures, used by central bank to signal its intention to
maintain policy rates at a lower level longer lasting. By implementation of LSAPs,
central bank additionally communicates its commitment towards targeting the low up to
zero level of policy rates. Thus, this credible guidance by the central bank induces
downwards revision of investors’ expectations in regard to future short-term interest
rates, which being a component of long-term interest rate can influence it accordingly.
In this way, lower average expected short-term rate, resulted from credible commitment
made by central bank to lower short-term rates, brings long-term rate to fall.49
2.4.3 Liquidity
Liquidity channel works by primarily exerting a so-called liquidity effect. Usually,
this effect arises from the expansion in the money supply that in turn brings short-
term interest rates downwards. Liquidity effect faces particular limitation, when short-
term interest rates reach minimum levels. From then on liquidity supply provided by a
central bank is not capable to exert decreasing effect on short-term interest rates. At
the same time long-term interest rate, still providing positive yields, can experience
liquidity effect. In other words, banks following the positive yield on assets strategy
48 Cf. Gagnon, J. et al. (2011), p. 8.
49 Cf. Bowdler, C./Radia, A. (2012), p. 611; cf. Bauer, M./Rudebusch, G. (2013), p. 1.
14
look for higher return on assets preferring long-term over short-term interest rates.
Thus, growing demand for long-term securities as a result of reserves expansion
induces decrease in long-term yields.50
Referring to another explanation of liquidity channel, LSAPs implemented by central
banks have a direct effect on liquidity premia. Thus, in times of financial uncertainties
and market impairments, liquidity premia for assets might increase since selling of
those assets becomes more difficult. That is why asset purchases associated with
reserves increase contribute to the overall demand of those securities and thereby lift
up prices for purchased assets by reducing both the liquidity premia and yields.51
2.5 Expansion of Central Bank Balance Sheets
In response to the financial crisis central banks of advanced economies puffed up their
central bank balance sheets extremely. Unconventional monetary policy implemented
in terms of of asset purchases across different segments and maturities for the purpose
of financial market and economy revival highlighted a turning point within traditional
monetary policy measures previously used and contribute to significant changes in
composition and enormous expansion of central bank balance sheets.52 The following
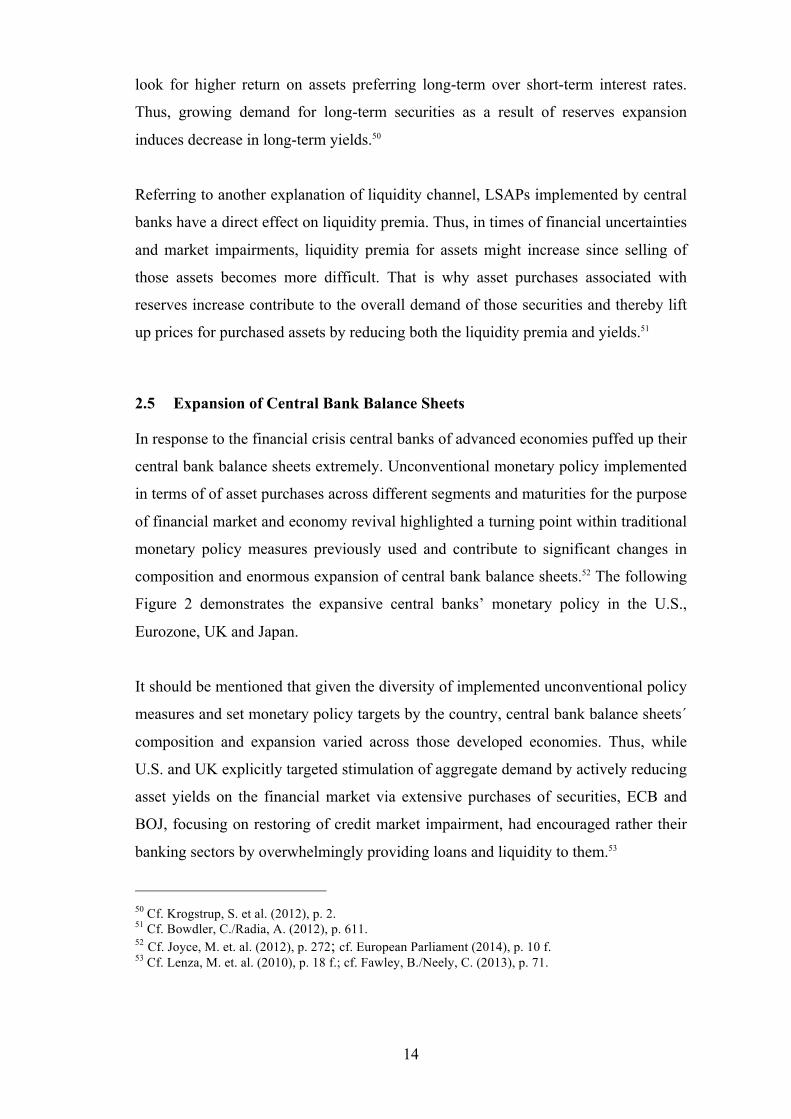
Figure 2 demonstrates the expansive central banks’ monetary policy in the U.S.,
Eurozone, UK and Japan.
It should be mentioned that given the diversity of implemented unconventional policy
measures and set monetary policy targets by the country, central bank balance sheets´
composition and expansion varied across those developed economies. Thus, while
U.S. and UK explicitly targeted stimulation of aggregate demand by actively reducing
asset yields on the financial market via extensive purchases of securities, ECB and
BOJ, focusing on restoring of credit market impairment, had encouraged rather their
banking sectors by overwhelmingly providing loans and liquidity to them.53
50 Cf. Krogstrup, S. et al. (2012), p. 2. 51 Cf. Bowdler, C./Radia, A. (2012), p. 611. 52 Cf. Joyce, M. et. al. (2012), p. 272; cf. European Parliament (2014), p. 10 f. 53 Cf. Lenza, M. et. al. (2010), p. 18 f.; cf. Fawley, B./Neely, C. (2013), p. 71.
15
Figure 2 – Development of central banks’ balance sheets
Source: Fed, ECB, BOE, BOJ.
Market-centered financial system of the United States determined Fed´s way in
conducting Quantitative easing. Thereby, Fed criticizing the importance of banks in
transferring funds to the broad economy and non-financial sector chose to implement
unconventional policy measures mainly and directly through financial market rather
than banking system. However, at the beginning of the crisis Fed pursued the policy
of Credit easing by providing extensive emergency lending facilities programs and
purchasing of asset backed securities (ABS) and debt issued by agencies.54
In particular, these programs affected the asset side of the bank’s balance sheet making
it more than double so high by the end of November 2008. In 2009, Fed announced its
first round of Quantitative easing, where Fed, implementing LSAP, additionally
expanded its balance sheet by USD 300bn of Treasury securities, USD 175bn of
agency debt and USD 1.25tn of agency mortgage-backed securities. Although the
outright asset-purchasing program was declared to be terminated in fall of 2009 for
54 Cf. Lenza, M. et. al. (2010), p. 19, 25 f.; cf. Labonte, M. (2014), p. 6.
0 50 100 150 200 250 300 350 400 450 500 550 600
0
100
200
300
400
500
600
2006 2007 2008 2009 2010 2011 2012 2013 2014
FED ECB UK JAPAN

16
Treasuries and in spring of 2010 for agency assets, Fed conducted additional Treasury
and asset-backed securities purchases in order to maintain a constant size of the
balance sheet, which was diminishing as a result of maturing securities.55
Between November 2010 and June 2011, slow economic recovery in the U.S.
prompted the introduction of QEII, under which Fed undertook additional purchases
of USD 600bn of U.S. Treasury and made an announcement on further proceeding of
Treasury purchases aimed at changing the structure of maturities. In September 2012
Fed decided to provide a significant boost to the economy by targeting the
improvement on the labor market and optimal price level over the medium term. For
that purpose, every month USD 40bn of agency mortgage-backed and USD 45bn of
long-term Treasury securities were added to Fed´s asset portfolio. After January 2014
Fed bought only USD 30bn of MBS and USD 35bn of Treasuries on the monthly
basis. These LSAPs referred to QE III as their financing were conducted through the
expansion of Fed’ balance sheet, whose size dramatically increased in the course of
the years from around USD 0.9tn in 2007 to USD 4.2tn in Summer 2014.56
UK´s action in regard to its extensive balance sheet expansion via LSAP could
earliest be observed after the Lehman Brothers collapse and Northern Rock´s demise
in 2009. However, already before that, BOE introduced a range of emergency
liquidity insurance operations, i.e. longer-term repo transactions on the asset side and
deposit facility on the liability side of the BOE balance sheet, which considerably
contributed to its expansion. Until 2009, banks in the UK increased their reserves
from GBP 16bn in July 2007 to GBP 45bn in December 2008. The provision of long-
term reserves followed in January of 2009 and was underpinned by additional
issuance of bills for GBP 100bn.57 The Figure 2 highlights these developments.
BOE continued its expansive monetary policy in January 2009 with the introduction of outright asset purchases conducted by the Asset Purchase Facility Fund. From March 2009 until January 2010, BOE bought GBP 200bn medium and long-term
55 Cf. Labonte, M. (2014), p. 6 f. 56 Cf. Labonte, M. (2014), p. 3, 8 f.; cf. European Parliament (2014), p. 10. 57 Cf. Lenza, M. et. al. (2010), p. 26; cf. Cross, M. et. al. (2010), p. 38.

17
assets, which largely consisted of UK gilts. Therewith, BOE revealed its intention to rather expand the liability side of the balance sheet.58 Consequently, between 2011 and 2012 BOE extended its total amount of assets purchased to GBP 375bn. From 2012 on balance sheet size of BOE did not experience considerable expansion.59
In comparison to U.S. market-centered financial system, euro area’s approach against the problem of financial market impairment and economic downturn derived from the bank-centric nature of Eurozone’s financial system. It mainly contained exceptional liquidity provision procedures, which occurred in variety of liquidity innovations in particular refinancing operations i.e. repo within the ECB´s operational framework. Therefore, expansion of ECB´s balance sheet resulted mainly from the bank´s borrowings rather than asset purchases, which were less comprehensive compared to that in the U.S. or UK.60 From October 2008 until December 2009, ECB conducted so-called „enhanced credit support“ policy by implementing fixed rate full allotment, collateral easing, Covered Bonds Purchase Programme (CBPP1) as well as Longer-Term Refinancing Operations (LTRO) and Supplementary Longer-Term Refinancing Operations (SLTRO). During this period ECB´s balance sheet expanded considerably by recording EUR 442bn in LTRO and EUR 60bn in covered bonds purchases.61 Hit by the sovereign debt crisis, ECB decided to introduce Securities Markets Programme (SMT) in May 2010, consistent with asset purchases of sovereign bonds of euro area member countries, whose amount added up to EUR 219.5bn in the end of 2012. However, these assets had no effect on the balance sheet since they were sterilized by the following ECB actions. Thus in 2011, ECB continued purchasing additional EUR 40bn within CBPP2. Later in 2014 further asset purchase programs on covered bonds (CBPP3) and ABS were announced.62 By complementing OMT program in 2015, which focused on the purchase of government bond in the secondary market, ECB extended its newly initiated asset purchase program by purchasing EUR 60bn in assets monthly. These asset purchases included covered 58 Cf. Cross, M. et. al. (2010), p. 39; cf. Lenza, M. et. al. (2010), p. 26 f. 59 Cf. Bank of England (2012/2013), p. 1; cf. Bank of England (2013/2014), p. 3. 60 Cf. Lenza, M. et. al. (2010), p. 18, 26; cf. Constâncio, V. (2015), p. 2. 61 Cf. European Central Bank (2010b), p. 66 f., 71. 62 Cf. European Central Bank (2010b), p. 72; cf. Szczerbowicz, U. (2012), p. 15 f.
18
bonds, ABS and government bonds and significantly contributed to the balance sheet expansion of the ECB.63 Japan being the pioneer in implementing unconventional measures, in particular Quantitative Easing, began its expansive monetary policy a long time ago - in the early 1990s after the asset bubble and equity market crash. Between 1992 and 1999 only, before the introduction of Quantitative Easing Monetary Policy (QEMP), Japan´s balance sheet was significantly expanded following numerous fiscal stimulus packages and asset purchases of non-performing loans.64 Later in 2001, BOJ initiated an unprecedented QEMP, whose focus was strongly put on increase of commercial banks current accounts balance (CAB) at the central bank. By purchasing overwhelmingly large amount of long-term Japanese Government Bonds (JBG), BOJ conducted its operation on meeting the target of CAB, which was increased from to JPY 5tn monthly65 at the beginning of the program to JPY 35tn at the end in 2006.66 In 2010 reintroduction of QE so-called Comprehensive Monetary Easing along with
Asset Purchase Program (APP) aimed at purchasing a wide range of assets, among
others short- and long-term Japanese government bonds, risky private and public assets
as well as Japanese real estate investment trusts (J-REITs) in order to flatten both long-term yields and risk premium across different asset segments. Under APP, CAB target was dramatically lifted up from JPY 35tn to JPY 101tn in 2012. Thus, Qualitative and
Quantitative easing launched by BOJ in 2013 increased the amount of bonds and
targeted a new goal of monetary base expansion of around JPY 60-70tn a year.67
After analyzing the specifics of Quantitative easing, its mechanism and application
framework, the next section will particularly take on the assessment of policy
measures as well as on studying the empirical research conducted on the example of
the selected economies.
63 Cf. European Central Bank (2015): 22 January 2015 - ECB. 64 Cf. Chapter 3.11.-3.12. 65 Cf. Rogers, J. et al. (2014), p. 10. 66 Cf. Girardina, E./Moussac, Z. (2011), p. 465. 67 Cf. Fawley, B./Neely, C. (2013), p. 73 f.; cf. Rogers, J. et al. (2014), p. 11.

19
3. Assessment of Economic Environment, Quantitative Easing
Measures and Empirical Research in the United States, England,
European Union and Japan.
The main focus of the research is aimed at the recent financial crisis. In fact, the state
of the economies, including their macroeconomic situation, financial strength was
largely different, which needs to be put into perspective first. Then, there will be
shown measures of Quantitative Easing, which were specifically applied by the
authorities. Furthermore, a detailed overview of the research papers will be provided
with the focus on the particular country, highlighting the model frameworks.
3.1 Quantitative Easing in the United States: Description of Economic
Environment
Financial Recession of 2008 in U.S. occurred as a result of subprime mortgage crisis
that showed already in mid-2007 its first signs of unprecedented complications in the
mortgage lending market. Thus, an unexpected drop in house prices implied
downgrade of asset-backed securities risk.68,69As a result of asset price bubble
bursting, emerged reassessment of mortgage-backed securities’ risk had a vast impact
on the whole U.S. financial market. In light of dramatically decreased asset prices and
inability of financial institutions to manage their losses, a high number of banks like
Bear Stearns, Lehman Brothers and Merrill Lynch announced their bankruptcy.70
Financial markets had immediately reflected new information inducing high volatility
among security prices and among key rates such as 3-month LIBOR and interest rate
of U.S. T-bill. The so-called TED spread that depicts the difference between 3-month
LIBOR and 3-months U.S. Treasury interest rate and so indicates credit risk level of
interbank lenders compared to the safe U.S. Treasury bill, increased to enormous 458
68 Cf. Marshall, J. (2009), p. 7 f. 69 Asset-backed financial instruments consisting of mortgage loans were treated as collateralized debt obligations (CDO) and spread throughout the credit market. (Cf. Dodd, R./Mills, P. (2008): Outbreak: U.S. Subprime Contagion) 70 Cf. Marshall, J. (2009), p. 7 f.

20
basis points by October 10, 2008.71 Such severe TED spread increase indicated
ultimate credit market impairment.72
Resulting dysfunction of commercial paper market that commonly ensures short-term
funding for the firms divested especially non-financial firms of usual liquidity access.
Furthermore, the failure of interbank lending, which had resulted from the total
distrust among banks, tightened supplemental funding sources for non-financial
business additionally. Accordingly, economic sectors like automotive and retail
experienced a sharp decline in their sales between September and October 2008.73,74
Burdened with debt and negative equity, private sector was lacking the incentives to
borrow and spending further, but had rather focused on increased savings and
deposits. This change in behavior of private sector is known as “balance sheet
recession” that intensively underwent United States as well as many European
countries of euro area.75
Severe downfall of U.S. economy took place at the beginning of third quarter of 2008.
Thus, U.S. economy had to assess the all time low for its main economic variables. In
the fourth quarter of 2008 the real GDP of U.S. economy shrank by 8.9 percent
keeping the negative GDP annual rate far up to the third quarter of 2009.76 Also, the
unemployment rate faced cloudy prospects accounting in October 2009 to 10.1
percent and reaching so its critical amount that had exceeded unemployment rate of
summer 2007 by twice.77 After November 2010, where a high unemployment rate of
71 Cf. Marshall, J. (2009), p. 8 f.; cf. Mishkin, F. (2010), p. 2 f. 72 Cf. Federal Reserve Bank of St. Louis (2015): TED Spread. 73 Cf. Marshall, J. (2009), p. 8 f. 74 In 1990s, during the last financial crisis Japan, United States and the Euro area experienced a similar problem that refers to a so-called term of “balance sheet recessions”. Thereby, the beginnings of the problem lay in the massive credit expansion of a specific sector. In case of the United States especially households and non-financial sectors suffered from high indebtedness. Sudden asset prices collapse had raised private sector´s liabilities and upset the equilibrium of their balance sheets. (Cf. European Central Bank (2012a), p. 98 f.) 75 Cf. Koo, R. (2011), p. 19 f., 25. 76 Cf. United States Department of the Treasury (2012), p. 1. 77 Cf. Casaux, S./Turrini, A. (2011), p. 2.

21
9.6 percent was captured again, the U.S. unemployment rate began to fall and reached
in December 2014 a value of 6.2 percent.78
At the same time between 2007 and 2011, the U.S. experienced only slight
disinflationary development against the backdrop of a severe economic depression
and high unemployment. Despite a temporary deflationary turn in 2009, where the
inflation rate came to -0.355 percent, the inflation rate in the aftermath was clearly
above the zero bound and even higher as the inflation target of 2 percent, achieving
the value of 3.15 percent in 2011.79 This is shown by the Figure 3 below.
Figure 3 – Economic development in the U.S.
Source: Bloomberg.
In light of a deteriorating debt problem, U.S. also suffered from its heavy federal debt
burden that currently amounts to USD 18.1tn80 and therewith had exceeded its GDP of
USD 17.4tn in 2014.81,82
78 Cf. Federal Reserve Bank St. Louis (2015): Civilian Unemployment Rate. 79 Cf. Federal Reserve Bank St. Louis (2014): Inflation. 80 Cf. U.S. National Debt Clock (2015): The Outstanding Public Debt. 81 Cf. Statista (2015): Gross domestic product. 82 Between 1970 and 2007 the American debt had a dynamic increase in contrast to the GDP growth. In 2007, it formed a ratio of 64 percent of American GDP and over 100 percent of GDP starting from 2007. (Cf. Thornton, D. (2012), p. 442 f.)
6,2%
-2,8%
3,9%
-4,0%
-2,0%
0,0%
2,0%
4,0%
6,0%
8,0%
10,0%
12,0%
2000 2002 2004 2006 2008 2010 2012 2014
Unemployment GDP growth CPI

22
Especially financial recession of 2008-2009 contributed a significant share to the
massive expansion of the outstanding public debt, as in October 2008 United States
Secretary of the Treasury had passed “The Emergency Economic Stabilization Act”.
According to this legislation the so-called Troubled Assets Relief Program (TARP)
aimed at launching a range of investment programs supposed to bring back and ensure
economic stabilization. For this purpose, alone until 2010 the U.S. government issued
an amount of around USD 7.4tn Treasury bonds by excessively expanding its
government debt.83
Facing all the economic and financial troubles investors became much more risk-
averse and searched for possibilities to invest in safe assets. Thus, U.S. Treasury
bonds being regarded as low risk and low default securities received an enormous
popularity among investors. Shift in investments towards the U.S. Treasuries brought
their yields to fall and had increased the corporate bond yields simultaneously as a
result of diminishing demand for these risky assets. However, this fall in yields
mainly affected short-term Treasuries by leaving behind only a slight effect on the
long-term U.S. Treasuries. In the aftermath, Fed tried to achieve the same effect on
long-terms Treasuries by launching the large-scale asset purchases programs.84
To continue with monetary policy intervention, in the next paragraph there will be
discussed both main monetary policy tools, applied by Federal Reserve against the
economic recession, and the nature of convectional and unconventional measures.
3.2 United States: Scale and Description of Measures Introduced
Federal fund rate depicts the main monetary policy instrument within the
conventional monetary policy framework that can be regulated via open market
operations such as trading of securities. Federal fund rate is the interest rate used by
American financial institutions to conduct their overnight lending businesses and thus
it is tightly linked with banks lending capacity and their liquidity demand. Hence,
83 Cf. Noeth, B./Sengupta, R. (2010), p. 18; cf. U.S. Department of the Treasury (2015): TARP Programs. 84 Cf. Noeth, B./Sengupta, R. (2010), p. 18, cf. chapter 4.4.
23
beginning from the August 2007, Federal Open Market Committee (FOMC)
undertook rapid and decisive steps against financial crisis by influencing short-term
federal fund rate.85
In order to realize adequate easing of financial constraints, federal fund rate was cut
from 4.94 percent in September 2007 to 1.98 percent in May 2008 capturing an
astonishing decrease of 296 basis points. Additionally, FOMC decreased number of
other lending rates aimed at restoring the activity on the credit market. This interest
rate reduction gave U.S. economy temporary support, however in the long run it did
not provide the necessary defense against deteriorating liquidity problems and overall
financial markets turbulences.86
Despite loose liquidity path through to financial institutions, the provision of loans to
the private sector did not take place. FOMC has been keeping federal fund rate within
a range of 0 and 0.25 percent for 6 years now, signalizing economic unreadiness for
the interest rates liftoff. Facing limits of conventional monetary and zero bound
interest rate policy applied, FOMC decided to focus on non-standard monetary policy
measures for boosting the economy.87
In further step of its easing monetary policy, Fed targeted at ensuring accommodative
access for financial institutions to the short-term liquidity. According to Bernanke all
the measures introduced by Fed, with regard to the purpose mentioned above, were
part of carefully considered and purposeful Credit Easing approach that distinguished
Fed´s policy from the one applied in Japan better known as QE. Instead of boosting
the liability side of balance sheet by targeting banks reserves, as it was the case in
Japan, Fed mainly targeted at easing of credit conditions, which on the one hand
demanded accommodative facility programs and on the other hand required outright
purchase programs, involving asset side expansion of Fed´s balance sheet, however.88
85 Cf. Labonte, M. (2014), p. 1. 86 Cf. Bernanke, B. (2009), p. 2, 4; cf. Federal Reserve Bank of St. Louis (2015): Effective Federal Funds Rate. 87 Cf. Bernanke, B. (2009), p. 2, 4; cf. Federal Reserve (2014a), p. 12, 16. 88 Cf. Bernanke, B. (2009), p. 4.
24
One of Federal Reserve´s regular channels for liquidity provision depicts so-called
discount window lending that provides credit lending to the institutions.89 In light of
the funding difficulties on the credit market in 2007, Fed reduced the spread,
calculated as difference between the primary credit rate and the federal funds rate,
from 1 to 0.5 percent. However, this change in discount window lending was not well
received by institutions, since they considered funding from the market still as a more
attractive option. Then, after a significant deterioration of term funding conditions in
November and early December 2007, Fed decided to alter its discount window facility
and to generate a range of credit facilities by creating a set of new lending programs.90
3.2.1 Lending Facilities: Term Auction Facility, Term Securities Lending
Facility, Primary Dealer Credit Facility
In December 2007, Fed initiated its first lending program namely Term Auction
Facility (TAF). Contrary to the original discount window lending, TAF program
provided termed funding to counterparties by auctioning 28-day as well as 84-day
loans at the “stop-out rate” - a minimum accepted bid rate at which auction occurs - and
against a wider pool of collateral. The purpose of this program was the improvement
of liquidity conditions for sound companies within dysfunctional credit market.91
In March 2008, Fed came up with two additional liquidity support programs for
triparty repurchase agreement market that had experienced enormous funding
tensions. Primary dealers who usually serve as intermediaries between Federal
Reserve and security market participants by providing financial services within open
market operations were out of financial sources for maintaining U.S. Treasury
securities market. Thus, Fed initiated both Term Securities Lending Facility (TSLF)
and Primary Dealer Credit Facility (PDCF) programs.92
Thereby, under the TSLF, primary dealer were able to receive so-called 28-day
facility. Consequently, in exchange for less liquid-eligible collateral, this loan facility
89 Cf. Labonte, M. (2015), p. 4 f. 90 Cf. Armantier, O. et al. (2008), p. 4. 91 Cf. Armantier, O. et al. (2008), p. 6 ff.; cf. Federal Reserve (2009a), p. 1, 3, 5. 92 Cf. Bernanke, B. (2009), p. 3; cf. Federal Reserve Bank of New York: Primary Dealers List.

25
provided primary dealers with Treasury general collateral (GC) that had included
securities essential for open market operations such as Treasury bills, inflation-
indexed securities and bonds.93 At later time, Fed established PDCF conceived as an
overnight loan facility allowing primary dealers lending straight from the Fed and
using a much broader set of eligible collateral instead of prior required investment-
grade securities. Credit facility was terminated in February 2010 after slightly
mitigating the long-lasting liquidity pressure.94
3.2.2 Central Bank Liquidity Swap Lines
In order to normalize the global dollar funding markets that were exposed to strong
fluctuations in the overseas, Fed organized liquidity swap lines among six
international central banks. As a result, Dollar Liquidity Swap Lines and Foreign
Currency Liquidity Swap Lines were introduced, where under these lines a
prespecified amount of foreign currency could be exchanged against dollar and be
later used for support the funding in dollar or in other foreign currency for U.S.
institutions and institutions of counterparties.95
3.2.3 Troubled Asset Relief Program
In October 2008, U.S. government approved an extensive purchase program, so-
called Troubled Asset Relief Program (TARP) or The Paulson Plan96 focusing on
strengthening financial institutions and improving liquidity access. Series of
initiatives under TARP supposed to provide financial support to different sectors of
U.S. economy. For this purpose, USD 700bn fund was provided. Especially Capital
Purchase Program depicting a part of TARP enabled a large-scale purchase and
management of securities rated as “troubled” or “toxic”.97
93 Cf. Federal Reserve Bank of New York (2009): Term Securities Lending Facility. 94 Cf. Federal Reserve (2014): Primary Dealer Credit Facility. 95 Cf. Federal Reserve (2014): Central Bank Liquidity Swap Lines. 96 Cf. Fein, M. (2008), p. 34. 97 Cf. Federal Reserve Bank of St. Louis (2013): The Troubled Asset Relief Program.
26
3.2.4 Large-Scale Purchase Programmes
a. Commercial Paper Funding Facility
Dysfunction of commercial paper market in the late 2008 depicted an enormous
problem for U.S. economy. Commercial paper market plays a key role, being
essential source of funding, among the most financial and non-financial sectors. In
order to finance their business, enterprises often turn to commercial papers that allow
them to borrow on the short-term basis from the market at lower cost. However,
during the crisis, commercial market papers lost their attractiveness by the majority of
investors and induced commercial paper market standstill. Investor´s reluctance to
purchase commercial papers led to critical underfunding and shortage of credit
availability for a high number of enterprises. Thus, only within a year the amount of
asset-backed commercial paper in the market declined from USD 1.18tn to
USD 745bn indicating perceptual fall of 37 percent.98
To address this problem, Fed decided to launch one of its unconventional monetary
policy measures by acquiring commercial papers directly from the primary market.
As a result, an adequate program referred to as Commercial Paper Funding Facility
(CPFF) focusing on the purchase of high-quality, three-month commercial papers
from the issuers was called into action. It aimed at providing required additional
liquidity to frail institutions and unburdening them from their toxic assets. At the
beginning of 2009, Fed became the sole largest purchaser acquired commercial papers
of a total amount of USD 357bn.99 Applying CPFF, Fed focused on recovery of
investors’ encouragement and willingness to buy commercial papers and provide their
money both for short-term and long-term funding.100
b. Asset-Backed Commercial Paper Money Market Mutual Fund Liquidity
Facility
At the same time, in September 2008, Fed faced another severe financial problem as
one of the significant money market mutual funds (MMMF), Reserve Primary Fund,
98 Cf. Kacperczyk, M./Schnabl, P. (2010), p. 29 ff.; cf. Bernanke, B. (2009), p. 3. 99 Cf. Kacperczyk, M./Schnabl, P. (2010), p. 30. 100 Cf. Federal Reserve (2014): Commercial Paper Funding Facility; cf. Bernanke, B. (2009), p. 3.

27
declared the state of “broke the buck” meaning that its emerging massive losses
caused a sharp drop in fund´s value and pushed the value of its share below USD 1.
As a result, a wave of investors overthrew MMMFs pursuing only one goal to
withdraw their funds. MMMFs were confronted with a problem of bank run and being
incapable to satisfy/meet investors demand for liquidity.101 Assets to be sold,
especially asset-backed commercial papers, suffered from illiquidity that was caused
through increased doubts on the quality of its underlying collaterals.102
In response to this event and concurrently to the CPFF program, Fed initiated Asset-
Backed Commercial Paper Money Market Mutual Fund Liquidity Facility (AMLF)
program targeted at elimination of illiquidity on asset-backed commercial paper
market by organizing an additional liquidity supply. Consequently, Fed acted by use
of so-called nonrecourse loans and facilitators in the form of U.S. financial
institutions, which had received funding via fully collateralized nonrecourse loans
with the purpose of acquiring ABCP from MMMFs. By these purchases Fed ensured
an active market for ABCP and helped MMMFs to avoid much higher losses on the
commercial paper market.103
c. Agency Mortgage-Backed Securities Purchase Program
In November 2008, for the purpose of further credit market stabilization, FOMC
focused its attention on the backup actions for the long-term rate. Therefore, Fed
decided to extend its balance sheet size by purchasing longer-term securities at a large
scale. Chairman Bernanke announced in December 2008 FOMC´s intention to buy
around USD 100bn in debt issued by government-sponsored enterprises (GSE) and
USD 500bn in GSE mortgage-backed securities. These agency debt and agency
mortgage-backed securities (MBS) referring to securities issued by federal agencies
such as Fannie Mae and Ginnie Mae were bought at sizable levels.104 Between 2009
and 2010, Fed acquired an amount of USD 1.25tn in agency MBS and USD 200bn in
agency debt. Targeted objective of lowering mortgage rates was achieved, since they
101 Cf. Kacperczyk M./Schnabl, P. (2010), p. 30 f. 102 Cf. Ibid., p. 29. 103 Cf. Federal Reserve (2014): Asset-Backed Commercial Paper. 104 Cf. Bernanke, B. (2008), p. 5; cf. Federal Reserve (2014): Agency Mortgage-Backed Securities.

28
experienced considerable fall after the program was set into operation, what had
formed a foundation for housing market recovery.105
d. Purchase of Long-term U.S. Treasury Bills
Chairman Bernanke´s announcement in December 2008 of the large-scale purchase of
government bonds began its implementation in November 2010. Up to this moment
Fed had mainly pursued its monetary policy program of credit easing, however the
first signs of Quantitative Easing became visible in the early 2008 as Fed via selling
of government bonds financed the large-scale purchase of less-liquid assets and
thereby contributed to extension of its asset side.106 Fed let itself finally in for the new
monetary approach known as Quantitative Easing as it made its first step towards the
Large Scale Purchase of agency debt and mortgage-backed securities in 2009, and
entered a new round of QE2 in November 2010 by purchasing long-term U.S.
Treasury bonds.107
During QE2 Fed intended to purchase up to USD 600bn additional government bonds
with primarily longer maturity, whose overwhelmingly share contained securities at
maturity between 2½ and 10 years. The QE2 program was implemented till the
middle of 2011, as in September 2011 Fed continue carrying out measures of
reducing long-term rates by introducing the maturity extension program called
Operational Twist. As the name of the program revealed, a substantial portion of
long-term government bonds was purchased being financed through the revenues
generated by the disposal of USD 400bn short-term Treasury bills. Thus, Operational
Twist varied from QE1 and QE2, as it depicted a sort of asset swap, where Fed
purchased long-term assets by reversely selling the short-term ones. As a result, Fed´s
balance sheet experienced no extension effect and did not increase its size.108
Fed´s intention of flattering the long-term yield under QE2 and Operational Twist had two main goals to achieve: the first and most significant one referred to the idea to 105 Cf. Federal Reserve (2014): Agency Mortgage-Backed Securities; cf. Federal Reserve (2009): Press release. 106 Cf. Blinder, A. (2010), p. 467 f. 107 Cf. Ricketts, L. (2011), p. 1 f. 108 Cf. Labonte, M. (2014), p. 8.

29
decrease risk premiums of long-term risky assets via sufficient reduction of riskless interest rates like U.S. Treasury bonds.109 Holding on the assumption of portfolio balance theory regarding imperfect substitutability and announced outright purchase of government bonds, Fed expected to increase investors’ willingness to purchase corporate bonds and therewith put down corporate bond yields along with their risk premiums.110 Secondly, lowering long-term interest rates supposed to induce a reduction in the borrowing costs for the companies and private sector both to improve recapitalization conditions and stimulate consumer spending. As a result, both objectives aimed at providing strengthening impulse to the stagnated economy and aggregate demand.111 The third round of QE was announced in September 2012. This time Fed aimed particularly at achieving a goal of “maximum employment and price stability“.112 Against this background, Fed announced to additionally buy USD 40bn of agency MBS on a monthly basis. It continued further its program of average maturity extension, which was implemented through the end of 2012, in the course of which USD 267bn113 in T-Bills was acquired. All in all, until the end of 2012, overall USD 85bn in longer-term securities per month were supposed to be added to Fed´s longer-term securities holdings and therewith to exercise a much stronger downward pressure on long-term interest rate.114 All these actions should have been implemented until unemployment and price stability would achieve desirable development. In this sense, Fed pursued the objective of unemployment rate below 6.5 percent and in the same time allowing inflation rate to be in rage of 2.0-2.5 percent.115 In October 2014, new Chair of Federal Reserve Janet L. Yellen announced the end of six years lasting large-scale purchase programs, which were conducted in three rounds (QE1, QE2, QE3) and finally showed striven recovery of U.S. economy. Nevertheless, in order to provide further an accommodative monetary policy and slow
109 Cf. Labonte, M. (2014), p. 10. 110 Cf. Gagnon, J. et al. (2011), p. 7 f. 111 Cf. Blinder, A. (2010), p. 466 f. 112 Federal Reserve (2014a), p. 12. 113 Cf. Federal Reserve (2013): Maturity Extension Program. 114 Cf. Federal Reserve (2012): Press release. 115 Cf. Federal Reserve (2012): Minutes of the Federal Open Market Committee.

30
crossover towards tightening monetary policy, Fed left the federal fund rate unchanged ranging between 0 and 0.25 percent.116
3.3 Evaluation of The Relevant Research Papers and The Empirical Results
In this section, there will be presented some relevant research papers conducted empirical results with focus on economic development and quantitative easing in the United States. A broad analysis of the empirical and analytical scientific research shows that Gagnon et al. contributed a significant part to the fundamental research on the field of quantitative easing, especially emphasizing the impact of central bank’s instruments of monetary policy in reducing risk premia through various transmission channels.117 Furthermore, they discussed Fed experience with LSAP programs by describing some challenges in this regard as well as underlying mechanisms, which helped to transfer positive stimulus to the U.S. economy. Moreover, they assessed LSAP programs´ efficiency in targeting long-term assets and in flattering their yield curve. Based on the empirical research, the implied application of both even-study and time-series analysis provided empirical evidence for LSAP´s economically meaningful effects.118 In their research paper, authors examined to which extent communication or announcement in regard to LSAP programs implementation had an impact on interest rates and market expectations. Therefore, a set of mainly long-term yields on different financial assets119 became the object of event study analysis. Considerations of corporate bond yields and swap rates within the variables examined aimed at determination of the responsiveness of financial assets that had not been included into LSAP programs. Responses of interest rates as a result of eight announcements made by Fed in regard to the conditions of LSAP program were observed within one-day
116 Cf. Federal Reserve (2014): Press release. 117 Cf. Kapetanios, G. et al. (2012), p. 319; cf. Joyce, M. et al. (2010), p. 8. 118 Cf. Gagnon, J. et al. (2011), p. 5, 16. 119 It included yields on: treasuries at two-year maturity, agency debt and treasuries at ten-year
maturity, “current-coupon thirty-year agency MBS, the ten-year Treasury term premium, the ten-year swap rate and the Baa corporate bond index.” (Gagnon, J. et al. (2011), p. 17)

31
windows around the announcement. But later the framework of applied event-study analysis was slightly changed in order to achieve more complete research results.120 Thereby, on the one hand authors observed, instead of eight announcements, all FOMC´s statements made between November 2008 and January 2010 leaving the one-day response window untouched. On the other hand, they experimented with one-day response window extending it to two days and left event set unchanged. As opposed to event study analysis focusing on effects resulted from announcement of LSAP, time series analysis used in the second part of Gagnon et al. et al. research aimed at gauging the responsiveness of ten-year term premium arisen from asset purchases themselves.121 For this purpose, authors made use of ordinary least squares regression model, where
denoted ten-year yield term premium, while depicted different observable
explanatory variables.122
[1]
In order to illustrate historical variation in term premium, authors´ set of observable variables required inclusion of relevant explanatory variables that at the same time captured effects of changes in unemployment gap, core CPI inflation, long-run inflation disagreement, “six-month realized daily volatility of the on-the-run ten-year Treasury yield” 123 and represented longer-term debt securities.124 Both approaches provided significant results highlighting the importance of LSAP
programs for the U.S. financial market in reducing long-term interest rates. As the result showed, after the announcement of LSAP programs all the examined interest rates
experienced a strong backdrop. Of particular significance here is the generated evidence
for LSAP´s large impact on swap rate and the investment grade corporate bond yields of Baa credit quality, on those assets that were not a part of LSAPs program, but whose
120 Cf. Gagnon, J. et al. (2011), p. 16 ff., 22. 121 Cf. Ibid., p. 22. 122 Cf. Ibid., p. 25 f. 123 Gagnon, J. et al. (2011), p. 26. 124 Cf. Gagnon, J. et al. (2011), p. 26 ff.
tpt10 Xt
tpt10=Xt ß+εt
32
yields were reduced considerably. Thus, the widespread and overarching effect of
LSAP programs was proven.125 Empirical analysis of Gagnon et al. et al. revealed that asset purchases were efficient in decreasing term premium. Referring to ten-year term premium changes, LSAP had induced a substantial reduction amounted from 30 to 100 basis points. Similar and even stronger reductions in term premiums were considerably observed in both mortgage and corporate bond markets, what contributed to enhancement of the credit and money market.126 Another study by Chung et al. produced results confirming improvement of real GDP and other relevant macro economic variables such as labor market and prices stability by analyzing scenarios with Fed´s large-scale asset purchases and scenarios without. Using two large scale FRB/US model and simple model of portfolio balance effects authors were able to provide meaningful estimates for U.S economy.127 For the purpose of assessment of macroeconomic effects derived from implementation of LSAPs (LSAP 1 and LSAP 2), authors conducted simulations of the large-scale model called FRB/US model128 helping Fed to make forecasts and analysis on U.S. economy. The model incorporated many endogenous variables, which
enabled Fed to analyze different macroeconomic policies as well as their effects and
exogenous shocks on aggregate demand and other related major economic variables.129 Additionally to this, authors established portfolio-balance effects model, which assumed that the extent of effects on long-term interest rates presents not only dependent variable of current long-term assets on Fed´s balance sheet, but is also closely linked with investors expectation about the future evolution of these assets held. The model also contained information about spread reductions of mortgage rate arising in 2009 and in the first part of 2010 and, therewith, captured achieved recovery in mortgage market resulted from extensive agency MBS purchase.130
125 Cf. Gagnon, J. et al. (2011), p. 20. 126 Cf. Ibid., p. 38 f. 127 Cf. Chung, H. et al. (2011), p. 1, 5. 128 Cf. Brayton, F. et al. (2014): The FRB/US Model. 129 Cf. Chung, H. et al. (2011), p. 2. 130 Cf. Ibid., p. 2 f.

33
Finally, results of the simulation FRB/US model and the simple model of portfolio balance effects revealed that Fed’s first phase of large-scale asset purchases led to a reduction in 10-year Treasury yield inducing 0.5 percent decline. This yield downward movement was observed every time after a new phase of LSAP programs was initiated. Looking at the macro economic variables, reduction in long-term interest rates induced a positive stimulus to the economy as it triggered stock market valuations and decreased dollar’s foreign exchange value in the course of time.131 These beneficial market conditions had a boosting effect on the level of real GDP improving it by 3 percent in the latter part of 2012. Based on this changes in the output, labor market was also facing positive prospects. According to estimations, LSAP programs should have created around 3.7 million jobs over their entire execution period. In addition, the results from the simulations were of a high relevance showing that without implementation of LSAPs core inflation would have been 1 percent lower and would have been facing deflationary problems.132
3.4 Quantitative Easing in the Eurozone: Description of Economic Environment
The global financial crisis of 2008 hit the euro area along with EU member states badly. It evolved into the Eurozone crisis sparking sovereign debt crisis and economic and structural commotion in the whole euro area. Eurozone faced a problem of the viability of common currency, disruptions of a single financial market and instability of architectural concept of the economic and monetary union as a whole.133 Rising distrust concerning financial stability and transmission mechanism led to profound impairment within interbank lending. This engendered stagnation in liquidity provision within the European bank system and exposed a high range of financial institutions to high default and insolvency risk. Different from United States, in 2008 the Eurozone possessed no banking union allowing it to regulate and supervise the entire financial sector of the 17 Member States of the Eurozone.
131 Cf. Chung, H. et al. (2011), p. 3. 132 Cf. Ibid., p. 4. 133 Cf. Glencross, A. (2013), p. 4, cf. Szczerbowicz, U. (2012), p. 7.

34
Therefore, each national government of the Eurozone was in charge to restore and rescue its financial institutions from financial downfall.134 Moreover, as a result of European integration, eased bank-lending conditions within the Eurozone enabled member countries to raise more funds and increase borrowings.135,136 Thus, already in late 2009 Greece became the first country announcing its difficulties to maintain its national solvency. Only thanks to extensive bailout programs, coming from the Eurozone countries, in particular from Germany, the above-mentioned difficulties could be overcome.137 By late 2011 also Spain and Italy were captured by the economic and financial misery pushing both into recession.138 Contemporary, many European countries reported a higher deficit/GDP ratio than expected. Both bad prospects in regard to banking sector recovery; rising fears about sovereign solvency and currency redenomination deteriorated the state of sovereign debt market especially of sovereign bond value.139 In fact, severe fluctuations in annual spread on long-term government bond yields took place among European economies. Aware of sovereign credit risks, investors searched for flight-to-safety, which was found in German Bunds.140
Sovereign bond yield depicts one of the most important economic and financial key
variables. It is essential for development of key interest rates used in the real
economy, which play a major role in capital investment or spending decision-making
for private consumers and firms. Since sovereign bond yield operates as an important
134 Cf. Glencross, A. (2013), p. 4, 7. 135 Cf. Lane, P. (2012), p. 52. 136 According to the study of Lane and Pels, especially so-called credit boom development highlighted the time between 2002-2007, leading to persistent current account imbalances and deficits among the Eurozone member countries. (Cf. Lane, P. (2012), p. 53 f.; cf. Lane, P./Pels, B. (2012), p. 2). 137 Cf. Glencross, A. (2013), p. 8 f. 138 Cf. Ibid., p. 10. 139 Cf. Lane, P. (2012), p. 56. 140 Hereunto, ECB stated in its monthly Bulletin of May 2014 the fact that yields of ten-year sovereign bonds in EU member states experienced a considerable growth compared to the German ones. (Cf. European Central Bank (2014a), p. 75 f.) As a result, July 2011 sovereign spreads sharply increased for Greece, Ireland and Portugal amounting to 1.600, 1,200 and 1,100 basis points accordingly. In 2012, also Italy and Spain reached its threshold indicating sovereign spreads of 500 and 600 basis points for their long-term bonds. (Cf. European Central Bank (2014a), p. 77) Similarly, already in October 2008, spreads between refinancing key rates like 3-month Euribor and EONIA showed a significant difference highlighting record high of 156 basis points. (Cf. Smaghi, L. (2009): Conventional and unconventional monetary policy)

35
instrument for conducting monetary policy, the induction of unconventional monetary
measures in order to normalize sovereign spreads was of a high relevance for ECB.141
At the beginning of 2009 covered bond market that served as the most essential and
favored market for the banks funding experienced also its hard times. Thus, interbank
paralyzation along with liquidity risk and overall deterioration of transmission
mechanisms induced widening of covered bond spreads. In light of these events ECB
saw itself forced to take hold of some exceptional monetary policies to deal with
economic and financial turmoil.142
Undisputedly, this meltdown of financial market had a severe and unavoidable impact
on the European economy. Thus, overall in the EU, GDP decreased by around 4 percent
in 2009. Thereby, contraction in GDP for the euro area countries such as Germany and
Italy amounted to around 5 percent, while i.e. Ireland or Finland faced dramatic GDP
downturn of about 7-7½ percent.143 This is shown by the Figure 4 below.
Figure 4 – Economic development in the Eurozone
Source: Bloomberg.
141 Cf. European Central Bank (2014a), p. 67. 142 Cf. Beirne, J. et al. (2011), p. 9 f. 143 Much stronger GDP contractions experienced Baltic countries, with GDP dropping by about 14 percent in Estonia and 18 percent in neighboring countries. (Cf. European Commission (2009), p. 8)
11,6%
-4,5%
1,8% 2.5%
0,4%
-6,0%
-4,0%
-2,0%
0,0%
2,0%
4,0%
6,0%
8,0%
10,0%
12,0%
2000 2002 2004 2006 2008 2010 2012 2014
Unemployment GDP growth CPI
36
The outbreak of financial crisis also caused an increase in unemployment of the euro
area, whose rate gradually rose reaching its peak of 12.0 percent in 2013. Extreme
surge in unemployment rate was observed in Greece after outbreak of the sovereign
crisis in late 2009 and in Spain post 2011, whose unemployment rates increased to
around 26 percent in 2013.144,145
Ongoing low interest rates environment and ultra low policy conducted by the ECB
for several years resulted in suitable conditions for European inflation to rise.
However, despite this fact, some factors led rather to disinflationary development and
dampened inflation growth.146 Since end-2011 downwards trend prevailed the
European inflation development.147 In December 2014, overall HICP inflation rate of
the Eurozone approached -0.2% by making deflation to persistent problem of the euro
area.148,149
From the late 2008 on, government debt relative to GDP continuously and steeply
increased in the euro area. Thus, the strongest relative rise of about 10 percent in
government debt was recorded between Q4 2008 and Q4 2009. Nowadays,
government debt accounts for almost 100 percent of euro area GDP by reaching 92.1
percent in 2014 Q3.150,151
144 Cf. Eurostat (2014): Unemployment. 145 Especially youths suffered severely from unemployment and deterioration in the labor market in Greece, where the rate exceeded 50 percent and reached 62.5 percent, Portugal (42.5 percent), Italy (40.5) and Spain (56.4 percent). (Cf. Eurostat (2013): April 2013 Euro area) 146 Cf. European Commission (2014winter), p. 39. 147 Cf. European Commission (2014winter), p. 39. 148 Cf. European Central Bank (2015): Measuring inflation. 149 Drop in the oil prices, beginning from 2011, implied reduction in petrol prices and supplemental oil products affecting consumer price index. Moreover, downward development of energy and services prices, still low productivity growth causing negative output gap and overall weak demand sentiment had contributed to steadily falling inflation year on year. (Cf. European Commission (2014winter), p. 39 f.; cf. European Central Bank (2014): Introductory statement) 150 Cf. European Central Bank: Government debt. 151 Regarding specific euro area members, Greece, Italy, Ireland and Portugal revealed the highest numbers in general government gross debt as a percentage of GDP. As result in 2014, general government gross debt in Greece amounted to 175.5 percent of GDP, in Italy (132.2 percent), in Portugal (127.7 percent), in Ireland (110.5 percent of GDP). (Cf. European Commission (2014autumn), p. 71, 73, 81, 101).
37
Given the heterogeneity of the euro area and hence different level of sovereign
indebtedness, balance sheet recession was experienced differently from one euro area
country to another. Some highly indebted euro area countries that had excessively
expanded their government debt and run current account deficits over several years
were forced to deleveraging and to make according balance sheet adjustments while
dealing with the financial crisis.152 Against the backdrop of enormous house prices
boost in 2007 and strong debt increase in private sector, that until the onset of the
crisis amounted to over 100 percent of GDP in Ireland and nearly 100 percent in
Spain, both countries were facing painful correction in asset prices.153
Next paragraph will outline the range of steps and monetary policies undertaken by
the ECB to overcome the financial and debt crisis and maintain the primary objective,
price stability, of the euro system.
3.5 Eurozone: Scale and Description of Measures Introduced
In view of financial turmoil, ECB intended to apply a set of conventional and
unconventional monetary policy instruments. One essential tool of ECB´s toolkit in
conducting monetary policy depicts steering of short-term interest rate allowing ECB
to regulate and to influence economy under normal circumstances.154 After decisive
short-term interest rate increase to 4,25% in July 2008 that aimed at serving as a
demonstrative backstop for the upcoming price instability, ECB resolved upon a sharp
interest rate cut. Thus, in October 2008, ECB reduced the short-term interest rate
profoundly and kept lowering it further throughout the months.155
Hence, in May 2009, interest rate achieved its all-time low of 1%. Consequently,
together with the last current interest rate cut in September 2014 to 0,05%,156 ECB
introduced an additional monetary policy measure that implied reduction of deposit
facility rate and therewith stimulated bank´s lending propensity. Negative deposit 152 Cf. European Central Bank (2012a), p. 102 f. 153 Cf. Ibid., p. 103 f. 154 Cf. European Central Bank (2010b), p. 60 f.; cf. chapter 2.1. 155 Cf. European Central Bank (2010b), p. 65. 156 Cf. European Central Bank: Key ECB interest rates; cf. European Central Bank (2009b), p. 9.

38
facility rate of -0,10% and later on of -0,20% targeted at making parking of bank´s
funds on central bank´s account less attractive due to arising financing costs. In this
way ECB tried to push banks towards an active lending activity among each other.157
According to the study of Urszula Szczerbowicz, the non-standard operational
measures launched by the ECB as result of financial and debt crisis of 2008 can be
divided into three categories 1) exceptional liquidity measures, 2) collateral easing
and 3) purchases of assets. These measures aimed at easing monetary conditions and
providing sufficient liquidity for the banking system. In the wake of the
unsuccessfully implemented conventional measures, including the extensive reduction
of main refinancing rate and wide-range of measures158 within the regular operational
framework of the Euro system’s instruments, ECB decided to introduce non-standard
monetary policy instruments.159
3.5.1 Exceptional Liquidity Provision
The implementation of exceptional liquidity measures entailed a wide range of liquidity
innovations provided by the ECB in order to eliminate liquidity shortage among banks
and thus assure the pass through of credit to European small to medium- sized
companies.160 In this, two objectives were pursued. Firstly, exceptional liquidity
provision was supposed to resolve interference on the interbank market and thus enable
the provision of credits to companies and private sector via enhanced bank lending
capabilities. At the same time, exceptional liquidity should stimulate overall investment
activity by creating incentives for firms to buy money assets i.e. corporate bonds as
result of portfolio rebalancing mechanism. According to their theory, in an environment
of excess money supply demand for non-money assets increases with negatively
influencing asset yields, so that instead money assets become more attractive.161
157 Cf. European Central Bank: Key ECB interest rates. 158 ECB´s regular operational instrument set includes: open market operation such as “main refinancing operations, longer-term refinancing operations, fine-tuning operations, structural operations and standing facilities”. (European Central Bank: Monetary Policy Instruments) 159 Cf. European Central Bank (2009b), p. 9. 160 Cf. European Central Bank (2009b), p. 9 f. 161 Cf. Szczerbowicz, U. (2012), p. 9 f.; cf. Metzler A. (1995), 54 f.

39
3.5.2 Fixed-rate Full Allotment
In his speech a Member of the Executive Board of the ECB argued that fixed-rate
full-allotment “is probably the most significant non-standard measure the ECB is
implementing”.162 Starting from October 2008, ECB introduced the FRFA programs.
Instead of traditionally applied variable rate tenders to steer the open market
operations, FRFA had provided banks access to extensive liquidity on fixed rate
tender base. Moreover, fixed rate procedure was set for all refinancing operations
with duration of up to 180 days.163
With this operational step, ECB aimed at achieving two significant goals: 1) fixed rate
implementation for both main refinancing operations with regular short-term maturity
and long-term operations having usually the maturity of three months; 2) extension of
the length of refinancing maturity to six month that ensured favorable lending
conditions for banks.164 Introduction of FRFA was revealed to be an effective tool for
balancing out liquidity risk and to dispose uncertainties in regard to refinancing
capabilities. Furthermore, it delivered ECB an informative overview of liquidity
demand in the financial sector, since banks were able to signalize independently how
much liquidity they required.165
3.5.3 Three-year Refinancing Operations (3-year LTRO)
Every bit as non-standard as FRFA was another monetary tool implemented by the
ECB that depicted the long-term refinancing operations carried out in 2011 and 2012
through fixed rate tenders and extended maturity. In addition to traditional three-month
liquidity-providing operations in euro conducted within the scope of regular open
market operations, ECB extended its operational scope by expanding the maturity to
six months in March 2008 and later to two three-year refinancing operations, both
162 González-Páramo, J. (2011): The ECB’s monetary policy during the crisis. 163 Cf. Smaghi, L. (2009): Conventional and unconventional monetary policy; cf. Szczerbowicz, U. (2012), p. 11. 164 Cf. Szczerbowicz, U. (2012), p. 11; cf. Smaghi, L. (2009): Conventional and unconventional monetary policy. 165 Cf. González-Páramo, J. (2011): The ECB’s monetary policy during the crisis.
40
maturing in 2015. The two three-year operations generated large increase in the
liquidity provided, so that more than EUR 1tn was lent to the financial market.166
3.5.4 Liquidity in Foreign Currencies
Unprecedented subprime crisis in U.S. caused also difficulties for financial institutions
in Eurozone in regard to refinancing operations and obtaining funding in foreign
currencies. For this reason, supplementary to national currency, provision of liquidity
in foreign currency was organized by the ECB beginning from December 2007. By use
of currency swaps, on which ECB agreed with a number of central banks, among those
Fed, Swiss National Bank, Bank of England, ECB enabled the inflow of money from
adjacent countries and overseas to the European market. Thanks to foreign exchange
swaps, banks could exchange euro against foreign currency and make use of funding in
Dollar, Swiss franc and British pound. Since 2008, FRFA served as one of the prudent
ways, which ECB used for allocation of foreign money to financial institutions.167
3.5.5 Collateral Easing
Even before the crisis ECB distinguished oneself from other central banks by much
broader definition of securities eligible as collateral for banks credit operations.
However, the outbreak of the crisis worsened funding activity for the most of the
banks, requiring further extension of collateral framework and increase in collateral
availability by the ECB.168 Among all the loosening rules implemented, ECB decided
to expand the eligibility of collateral by accepting assets collateralized in foreign
currencies such as USD, JPY or GBP.169 Moreover, it widened the eligibility list for
ABS and approved the acceptance for a set of supplemental securities including credit
claims, institutional debt instruments, government bonds, bank deposits or bank
certificates. In order to reduce high-risk exposure of underlying assets, ECB also
adapted the so-called valuation haircuts that implied devaluation of collateralized
securities for the sake of risk perspective.170
166 Cf. Szczerbowicz, U. (2012), p. 11 f. 167 Cf. Ibid., p. 12. 168 Cf. Ibid., p. 16. 169 Cf. European Central Bank (2013), p. 14. 170 Cf. European Central Bank (2013), p. 14 f.; cf. Szczerbowicz, U. (2012), p. 16 f.

41
3.5.6 Purchases of Assets
Against strong growing financial crunch in the euro area, ECB chose to react with a
range of bond and asset purchase programs. By use of purchases of sovereign bonds,
asset-backed securities and covered bond from primary and secondary markets, ECB
intended to exert influence on high-risk premium contained in prices of government
bonds and transmission mechanisms that did not function appropriately. Especially
Securities Markets Programme (SMP) and Outright Monetary Transactions (OMT)
were designated to attend to this task.171
a. Sovereign Bond Purchases
In May 2010, ECB introduced its first and most controversial purchase program
called Securities Markets Programme (SMP). In response to intense riddance of high-
default-risk Greek government bonds on the market, ECB dared to implement most
unconventional monetary policy. Thus, ECB not only accepted sovereign bonds as a
part of collateral within the regular refinancing operations, it participated in the
purchase of the euro area debt on the secondary market by itself. Many scientists met
this program with criticism. They argued that ECB was operating in an irregular mode
and, with this, was acting beyond its mandate. Despite everything ECB asserted its
initiative by pursing the target of maintenance of adequate sovereign bond prices,
recovery of transmission channels and stabilization of the euro.172
In January 2011, ECB terminated temporary purchase programs and even increased
base interest rate to 0.5% as a result of elusive economic stabilization. Because
already in July of 2011 the euro crisis hit profoundly Italy and Spain by negatively
affecting sovereign solvency and sovereign bond yields of both countries.173 Against
this background SMP had to be resumed in August 2011 again, so that from May
2010 until the end 2012, ECB purchased sovereign bonds amounting to around EUR
220bn mainly focusing on Greece, Spain, Italy, Portugal and Ireland.174
171 Cf. European Central Bank: Open market operations; cf. Szczerbowicz, U. (2012), p. 13 f., 16. 172 Cf. Szczerbowicz, U. (2012), p. 14. 173 Cf. Szczerbowicz, U. (2012), p. 14; cf. European Central Bank: Key ECB interest rates. 174 Cf. Szczerbowicz, U. (2012), p. 14 f.; cf. Eser, F./Schwaab, B. (2013), p. 1.

42
New inflammation of euro crisis especially in Spanish banking sector in the summer
of 2012 had challenged ECB again and made the ECB to undertake some further
steps. In September 2012, SMP was stopped and simultaneously announced to be
replaced by another unconventional monetary program called Outright Monetary
Transactions (OMT). Targeting the same goal as its predecessor SMP, OMT was
designated to operate in secondary market for sovereign bonds.175
In comparison to SMP that was focusing on long-term bonds, OMT was designated to
consider only those government bonds, which had a maturity of maximum three
years. Differently from SMP, OMT underlay to no temporal and quantitative
limitations. It was justified by ECB´s intention to do everything feasible to safeguard
the euro from downfall. Finally, within the scope of OMT, ECB decided to be treated
the same as private holders and to give up its seniority status.176
At the beginning of 2015, ECB announced to begin with, as in 2012 presented, OMT that
were supposed to depict a part of so-called Expanded Asset Purchase Programme
presumably lasting until September 2016. Additionally to the running Asset Purchase
Programmes including CBPP3 and ABSPP, ECB finally introduced OMT focusing on
sovereign bond purchases by primarily chasing the objective of stabilization of
European inflation rate over the medium-term. Therewith, Draghi intended to address
the prolonged low inflation as well as deflationary risk of the euro area.177 These
purchases aimed at expanding ECB´s balance sheet and influencing medium-term
inflation expectations.178
b. Covered Bond Purchases (CBPP1, CBPP2, CBPP3 and ABSPP)
In May 2009, ECB announced to start outright covered bond purchases. For this
purpose, the Covered Bond Purchase Programme (CBPP) aimed at improvement of
175 Cf. Demary, M./Matthes, J. (2013), p. 40 f.; cf. Szczerbowicz, U. (2012), p. 15. 176 Cf. Szczerbowicz, U. (2012), p. 15; cf. European Central Bank (2012): 6 September 2012-Technical features. 177 Thereby, intended total amount on assets to be purchased in a month will account to EUR 60 billion. (Cf. European Central Bank (2015): 22 January 2015 - ECB) 178 This expansive measure should achieve the inflationary goal by bringing inflation rate to its target level of close but still below 2 percent. (Cf. Draghi, M. (2015): Introductory statement)
43
strained covered bond market that experienced gradually withering as a result of
equity abandonment induced by shift of equity towards less risky assets. It is
important to highlight the important role of the covered bond market within European
capital markets.179 In contrast to other securities, especially covered bonds enjoyed
popularity by investors. Relative to asset-backed securities or non-securitized assets,
covered bonds offer a high extent of safety securing the credit risk by a stock of liquid
assets that serve as strong collateral.180
Covered Bond Purchase Programme intended to pursue 3 main goals, which were part
of ECB´s decision disclosure in 2009. According to this statement, Covered Bond
purchases were supposed to help:
a. “promoting the ongoing decline in money market term rates;
b. easing funding conditions for credit institutions and enterprises;
c. encouraging credit institutions to maintain and expand their lending to
clients;
d. improving liquidity in major segments of the private debt securities market.”181
ECB set its first CBPP in May 2009, intervening in both primary and secondary
markets. Only within one year ECB purchased covered bonds valued to EUR 60bn
predominantly with maturities ranging between three to seven years. Following this,
in June 2010, CBPP 1 was terminated and replaced by new Covered bond Purchase
Programme 2, introduced on 6 October 2011.182 Persistent financial instability
required purchases of further EUR 40bn euro-denominated covered bonds within
CBPP 2. Easing of financial tension and liquidity constraints on financial markets
kept further to be the primary goal.183
This idea was also underpinned by Jean-Claude Trichet in 2009, who declared CBPPs
as well as all non-standard measures, mentioned above, to be of clear credit easing
179 Covered bond market is regarded as a key-funding source for European medium and long-term refinancing operations (Cf. Szczerbowicz, U. (2012), p. 15 f.). 180 Cf. Beirne , J. et al. (2011), p. 9. 181 European Central Bank (2009a), p. 18. 182 Cf. Beirne J. et al. (2011), p. 5. 183 Cf. European Central Bank (2011): 3 November 2011- ECB.

44
nature and a part of a so-called Enhanced credit support monetary policy. This
monetary policy and its unconventional instruments differed from the ones of Fed or
BOE especially in the placement of monetary focus - predominantly loosening of
liquidity and funding constraints within the banking sector.184
Recently, ECB decided to complement its Covered Bond Programmes set by
introducing the third series of Covered Bond purchases beginning from fourth quarter
of 2014. Additionally to this, new Asset Backed Securities Purchase Programme
(ABSPP) was supposed to be incorporated into the financial market in October 2014.
Both programs served as extensions of monetary measures implemented before and
aimed at continuing enhancement of transmission mechanism and additional easing of
liquidity provision to the Eurozone economy.185
However, in 2015, in light of European deflationary development, ECB slightly
shifted its attention from credit easing to pure quantitative easing. Thus, additionally
to the running Asset Purchase Programmes including CBPP3 and ABSPP, ECB
finally introduced OMT involving sovereign bond purchases programme by primarily
chasing the objective of stabilization of inflation rate over the medium-term.186
In the next paragraph, there will be presented some relevant research papers with
particular focus on the monetary easing measures applied in the Eurozone.
3.6 Evaluation of the Relevant Research Papers and the Empirical Results
Among many international research papers conducted on the subject of QE effects,
the paper by Fratzscher et al. depicts one of the rare papers with particular focus on
the euro area. For the first time, authors provided an extensive evaluation analysis in
regard to the financial market effects resulted from unconventional monetary policy
instruments applied by the ECB. Applying empirical approach in their research paper,
authors aimed at both quantifying impacts of ECB´s unconventional policy measures,
184 Cf. Trichet J.-C. (2009), p. 11 f.; cf. Fawley, B./Neely, C. (2013), p. 71. 185 Cf. European Central Bank (2014): 2 October 2014 - ECB. 186 Cf. Draghi, M. (2015): Introductory statement.

45
in particular SMP policy, on asset prices across European markets and examining
spillover effects occurred for sovereign asset prices and investment market.187
Focusing on a time period between May 2007 and September 2012, authors analyzed
a dataset presenting 38 countries. Daily information on different financial market
variables such as interest rates, asset prices, yields as well as data on ECB´s monetary
policy instruments and balance sheet features were gathered from multiple sources
and complemented by the information on investment activity in portfolio equity for
each of the country in order to capture the effects on capital flows.188
With the use of benchmark model below, authors approached the assessment of
ECB´s unconventional measures. Looking at the components of the model equation,
yi,t as a endogenous variable denoted return of the banking equity index of country i
at a point in time t . Explanatory variables depicted on the one hand MPt including
information on monetary policy instruments and on the other Ft and Zt−1 presenting
contemporaneous and lagged control variables.189
yi,t=βMPt + γ1Ft + γ2Zt−1 + εi,t [2]
With MPt= AN_OMTt, AN_SMPt, SLTROt, VLTROt, SMPt[ ]
Assuming that alone the intention of ongoing SMP purchases might affect market
expectations and thereby have an impact on asset price development, authors decided
to investigate both effects as a result of underlying announcements and as a result of
application of monetary policy instruments as such. For that purpose, authors
incorporated 4 announcements ( ) in matrix revealing
ECB´s intention to initiate the QE policy in form of SMP and OMT.190
187 Cf. Fratzscher, M. et al. (2014), p. 3. 188 Cf. Ibid., p. 9. 189 Cf. Ibid., p. 10. 190 Cf. Ibid., p. 11.
AN_OMTt, AN_SMPt MPt

46
Furthermore, authors selected dummies to capture the effects of monetary policy
interventions including liquidity injection in form of Supplementary Long Term
Refinancing Operations (SLTRO), Long Term Refinancing Operations (VLTRO) and
asset purchases presented by SMP.191
According to the empirical findings generated from the benchmark equation, which
encompassed overall impact of unconventional operations, ECB´s news in regard to
OMP and SMP had following effects on bond market of the euro area countries. OMT
announcement resulted in a total 74 basis points reduction for Italian and Spanish 10-
year government bond yields and in 121 basis points after SMP announcement. At the
same time, OMP announcement had an opposite effect on government bond yields of
“core” euro area countries192 inducing a total 10 basis points rise in corresponding
yields and leaving same yields unchanged as a result of SMP news.193
Based on OMT and SMP announcement, findings on equity markets effects revealed
a positive development. Thereby, both financially weaker, non-core countries, Italy
and Spain, as well as highly rated European countries experienced an equity index
and bank equity price increase. While Italy and Spain felt considerable enhancement
of 900 basis points in equity indexes and 1400 basis points in equity prices
respectively, due to OMT, and 7 percent and 15 percent respectively thanks to SMP,
core countries recorded comparably only a light climb-out in this regard.194
Evidences generated on liquidity injections showed that SLTRO and VLTRO provided
a considerable support to financial markets. Thus, by means of EUR 660bn high capital
injection in 2010 within SLTRO, ECB achieved to lower 10- years sovereign spreads by
24 basis points in Italy and Spain, thereby yields of Core countries went down by 5 basis
points. Ensuing extensive VLTRO programs implied an even stronger impact on yields
of 10-years government dropping yields by 0.52 percent of non-core countries and by
191 Cf. Fratzscher, M. et al. (2014), p. 12. 192 i.e. Finland, Germany, Austria, Netherlands. 193 Cf. Fratzscher, M. et al. (2014), p. 14 f. 194 Cf. Ibid., p.14 f.

47
0.06 percent in Core European countries. Both operations strengthened equity markets
and contributed to a substantial increase in equity returns.195
Monetary policy intervention via application of SMP purchases led also to reduction
in yields by around 0.7 percent in non-core euro area countries. It has proven itself to
be an effective measure in increasing equity prices across the whole Eurozone.196
Finally, further results of the study additionally approved that if unconventional
policy was not applied, sovereign bond yields of all examined European countries
would have remained on a higher level.197
Relating to global markets effects, authors could show that ECB´s monetary policy
was not only able to lower investors´ risk aversion as well as sovereign and credit
risks and therewith strengthen trust into investment market, but also create positive
spillover to the global financial system.198
In contrast to the paper above, following paper presented by Peersman focused
primarily on macroeconomic effects resulted from the extension of ECB´s balance
sheet in light of unconventional monetary policy. Using a range of empirical
approaches among those baseline model VAR, SVAR model, extended VAR model
and sensitivity analysis, author tried to identify unconventional monetary policy
shocks and to analyze the impact of those effects on the broader economy.199
Referring to the unconventional monetary policy shocks, Peersman defined them as
the innovative measures to the credit supply. In other words these measures depicted a
set of monetary operations targeting improvement of money market and liquidity
provision without steering ECB´s refinancing rate. All ECB´s non-standard measures
applied from financial easing such as fixed rate tender with full allotment, through
extension of eligible collateral, right up to intended OMT and covered bond
195 Cf. Fratzscher, M. et al. (2014), p. 15. 196 Cf. Ibid., p. 15. 197 In case of Italy and Spain about 3 percent higher and for core euro area countries about 0.05 percent. (Cf. Fratzscher, M. et al. (2014), p. 16 f.) 198 Cf. Fratzscher, M. et al. (2014), p. 30 f. 199 Cf. Peersman, G. (2011), p. 6 ff., 20.

48
purchases, have contributed to loosening of credit conditions and additional liquidity
supply. Their influence on macroeconomic variables was incorporated in the
empirical investigation.200
Furthermore, Peersman determined two possible unconventional policy shocks. While
the first shock referring to credit supply induced the reduction of funding risk and
term spreads, "balance sheet" shock focused on significant extension of central bank´s
balance sheet. Both shocks implemented a shift of the credit supply and contributed to
financial market recovery.201
In his study Peersman found evidences for non-standard policy effectiveness in
improvement of credit supply. Based on that evidence author suggested that well
functioning credit channel resulted from unconventional policy shocks induced
significant impact on economic activity but only of an impermanent nature, while it
provided a prolonged effect on the price level. However, the first significant changes
consistent with significant increase in both macroeconomic variables could be
observed only one year after.202
Extended Covered Bond Purchase Programme introduced by the ECB in 2009 as
additional measure for covered bond market revival became the main topic of analysis
by the paper of Beirne et al. Authors undertook an extensive analysis in order to identify
to what extent CBPP1 was an efficient instrument in stimulating covered bond market
recovery and what were the effects of CBPP on primary and secondary bond markets.
Thus, by examining CBPP´s effects on primary market and applying cointegration
techniques, authors targeted at identifying any observable changes in overall remaining
amounts including both bonds covered and uncovered.203
Moreover, authors attempted to approach empirical evaluation of CBPP´s effects on the secondary market. Therefore, authors made a use of both “event study” analyses
200 Cf. Peersman, G. (2011), p. 13. 201 Cf. Ibid., p. 24. 202 Cf. Ibid., p. 15. 203 Cf. Beirne, J. et al. (2011), p. 5.
49
and regression model helping them to evaluation covered bond market reaction towards the announcement of the CBPP across the euro area countries.204 As results of the study revealed, introduction of CBPP had led to a positive effect on both primary and secondary bond markets. It turned out to be efficient measure in helping to reestablish covered bond market activity by decreasing covered bond spreads and its attractiveness for investors. However, in the primary market only covered bonds experienced a new pick-up resulted from CBPP that significantly boosted the issuance of these bonds.205 By the help of CBPP, banks funding costs could be successfully decreased, what aroused investors interest in regard to covered bonds products as alternative funding instrument. CBPP provided a strong stimulus to the credit market of the euro area even of countries faced large sovereign and financial tensions in the financial crisis.206 Additionally, results in regard to reaction of covered bonds spreads after CBPP initial announcement on 7 May 2009 clearly showed that during the announcement day
average daily change in German spreads contracted by 7 basis points, while days
before this announcement it showed minimum up to non changes.207 It was suggested
that after the initial announcement and until June 2010 spreads of German covered
bond went down by about 0.4 percent, while French covered bonds spreads declined
by 50 basis points.208 In this way, Beirne et al. approved the CBPPs effectiveness, which resulted in improved covered bond market and funding conditions. The next paragraph will initiate discussion on the United Kingdom and the range of steps and monetary policies undertaken by the BOE in order to master the consequences of the financial crisis.
204 Cf Beirne, J. et al. (2011), p. 5 f. 205 Cf. Ibid., p. 5 f. 206 Cf. Ibid., p. 24. 207 Cf. Ibid., p. 19. 208 Cf. Ibid., p. 21 f.

50
3.7 Quantitative Easing in the United Kingdom: Description of Economic Environment
In the course of financial crisis in 2008, UK experienced hard times facing financial meltdown and deteriorating economic prospects as many other European countries. Worldwide breakdown of money markets and impairment of international banking system seeded prevailing mood of uncertainty and fears among the financial sector and private households in UK.209 Its severe turmoil began in 2007 with the failure of Northern Rock, one of the biggest banks in UK. However, beforehand in September 2007, a triggered bank run had forced Northern Rock to appeal to Bank of England for emergency financial support.210 Despite received liquidity assistance from the BOE, Northern Rock did not overcome
its financial difficulties and finally became a subject to nationalization. Through
funding shortcomings due to the failure of interbank market many companies were
exposed to a high deleveraging risk. As a result, sizable equity disposal of UK´s biggest companies caused a substantial share price decline that was reflected in FTSE 100
index,211 which experienced a fall of more than 2600 basis points in March 2009
compared to it highest value of 6930.2 basis points in December 1999.212
This downward development was also strongly observed in UK`s economy. Thus, between 2007 and 2009 tightening of credit market and increased borrowing costs
induced the strongest output fall since the World War II amounting to 7.2 percent.213,214
National Institute of Economic and Social Research (NIESR) stated that UK GDP
growth first stagnated in March 2008 and had reached its peak contraction of 5.5
209 Cf. Chowla, S. et al. (2014), p. 169. 210 Cf. Shin, H. (2009), p. 101 f. 211 Cf. Dimsdale, N. (2009), p. 2, 4. 212 Cf. UK Finance Yahoo UK & Ireland: FTSE 100 (FTSE). 213 Cf. Chowla, S. et al. (2014), p. 169. 214 UK housing market as one of the most important sectors in the economy because of its steady growth in real estate prices over the years also faced the problem of housing bubble. Bursting of the housing bubble, resulted in sharp asset price fall, significantly devalued household wealth and diminished household´s consumption willingness accordingly. It is stated that during the financial crisis UK housing market was hit much stronger than in other European countries, so that between 2008 and 2010 real houses prices experienced a fall by 15 percent and residential investment decreased up to 50 percent of GDP. (Cf. Abbas, A. et al. (2014), p. 10, 12)

51
percent in the second quarter of 2009.215 British economy officially entered into
recession in January 2009 and influenced substantially the British labor market
inducing enormous job losses, whose peak was achieved in Q1 of 2009 as the number
of redundant workers increased to 2.43 million.216,217
In September 2008, CPI increased markedly to 5.2 percent, however in November
2009 CPI inflation showed a sharp fall to 1.1 percent capturing deterioration of credit
market conditions and tightening of the money supply.218 In the aftermath introduced
measures aimed at stabilization of target inflation rate were able to push inflation rate
higher to 3.1 percent in September 2010.219 These macroeconomic developments are
represented by the Figure 5 below.
Figure 5 – Economic development in the United Kingdom
Source: Bloomberg.
215 Cf. Astley, M. et al. (2009), p. 178; cf. Vaitilingam, R. (2009), p. 10. 216 Cf. Vaitilingam, R. (2009), p. 16. 217 The unemployment severely hit the young people aged between 16 and 24 whose redundancy rate rose from 11.8 percent in 2008 to 17.2 percent in 2009. (Cf. Bell, D./Blanchflower, D. (2010), p. 4 f.) 218 Cf. Bank of England (2008b), p. 5; cf. Bank of England (2009b), p. 5. 219 Cf. Bank of England (2010), p. 7.
6,3%
-5,5%
2,6%
1,5%
-7,0%
-5,0%
-3,0%
-1,0%
1,0%
3,0%
5,0%
7,0%
9,0%
2000 2002 2004 2006 2008 2010 2012 2014
Unemployment GDP growth CPI

52
As the Figure 5 shows, since 2012 the stabilization of the GDP growth has been
accompanied by the decline in UK’s unemployment. However, it needs to be
highlighted that lower CPI during 2012 and 2014 may have been limiting GDP
growth development at some extent.
3.8 United Kingdom: Scale and Description of Measures Introduced
3.8.1 Liquidity Facilities
After the bank run of Northern Rock, Monetary Policy Committee (MPC) began to
undertake substantial steps towards financial support by providing emergency
liquidity to financial institutions lacking short-term funding. In the wake of severe
tensions in the money market, in December 2007, MPC decided to modify its regular
long-term repo open market operations (OMOs) and offer the so-called Extended
collateral three-month repos (ELTRs).220
Thus, MPC extended the pool of its collateral eligible for 3-month repos by allowing
covered bonds and highly rated residential mortgage-backed securities (RMBS) to be
pledged besides high-quality sovereign securities. Later, dependent on worsening of
financial situation on the money market, MPC intensified these operations in 2008
and provided more funds, much frequently and on further extended collateral basis,
including mortgage and commercial backed securities as well as corporate debt.221
Failure of U.S. leading investment banks in 2008 forced international central banks,
among others BOE, to react with additional supportive measures towards dried up
lending market. As a result, in April 2008 BOE established the Special Liquidity
Scheme (SLS) aimed at exchanging illiquid assets like high quality mortgage-backed
and some other securities for liquid short-term UK gilts. So, around GBP 185bn in
Treasury bills were provided to the market under this program.222 In this way, MPC
unburdened balance sheets and diversified funding source of financial institutions.
220 Cf. Cross, M. et. al. (2010), p. 37. 221 Cf. Ibid., p. 37. 222 Cf. Bank of England (2009c), p. 1; cf. Joyce, M. et al. (2010), p. 10 f.

53
Facing dollar market fluctuations, in September 2008 BOE approached so-called U.S.
Dollar Repo Operations allowing BOE to lend U.S. dollars overnight. These
operations designated to provide funds in U.S. Dollar through auctions to UK
companies and were enabled through a swap line arrangement between BOE and Fed.
Under this swap facility program, BOE, as many other central banks, established an
enhanced access to U.S. currency in turn offering its counterpart currency.223
Banks Discount Window Facility (DWF) was a further step undertaken by BOE in
October 2008 in order to loose liquidity strains of short-term lending market. Similar
to precedent SLS, DWF provided exchange of illiquid assets accepting even broader
set of collateral. However, different from SLS, DWF offered borrowing loans on
short-term basis of 30-days. DWF was designated as a sort of bridge financing and
temporary financial backup until the next financing source to come for companies
experiencing acute shortage in sterling liquidity.224
3.8.2 Short-term Rate Reduction
Simultaneously with some other central banks, BOE addressed the severe shortage in
money supply and lending stagnation by reducing the Bank rate by 0.5 percent in
October 2008. However, in the wake of deteriorating prospects in different economic
sectors as well as weakening outlook for reaching the target inflation of 2 percent,
MPC went further and decreased Bank rate firstly by 1.5 percent to 3 percent in
November 2008 and additionally to 1 percent in the aftermath.225 These reductions,
along with facility programs implemented, had a downward impact on three month
LIBOR rate bringing it down to 2.3 percent in January 2009, while Libor spread
experienced decline to 80 basis points in September of the same year.226
223 Cf. Bank of England: U.S. Dollar Repo Operations; cf. Bank of England (2008a), p.1. 224 Cf. Fisher, P. (2012), p. 3. 225 Cf. Bank of England (2009a), p. 6, 10. 226 Cf. Dimsdale, N. (2009), p. 5.
54
3.8.3 Large-Scale Asset Purchases and Quantitative Easing
BOE made its first turn towards large-scale asset purchase programs in January of
2009, as a program of Asset Purchase Facility (APF) was introduced. Financed by a
new issuance of Treasury bills and carried out by Bank of England Asset Purchase
Facility Fund Limited (BEAPFF), which was extra created for this special purpose,
the fund acquired sizable amount of commercial papers, corporate bonds and other
high quality assets. This program focused on credit market stabilization and therewith
on setting a stimulus to overall demand that both could be achieved via portfolio
balance channel. Initially, an amount of up to GBP 50bn of highly quality securities
should have been purchased creating additional central bank reserves.227
In March 2009, MPC announced to shift its monetary policy focus towards the
achievement of inflation target in the medium term.228 Thus, MPC intended to use APF
to meet this goal implying the widening of the target asset amount to be purchased.229
Simultaneously with sharp reduction of bank rate to the all time low of 0.5 percent in
March 2009 and the evidence of no additional trigger to impact the economy via short-
term rate manipulation, BOE decided to pursue the long-term rate by implementing an
unconventional monetary policy measure known as Quantitative Easing.230
Introduction of quantitative easing was undertaken within the previously implemented
APF program. Thus, from March 2009 to January 2010, MPC purchased up to
GBP 200bn of gilts and private assets by building central bank reserves. Thereby, BOE
primarily targeted at purchasing gilts that made GBP 198bn out of total GBP 200bn.
Additionally, terms of maturity were changed after August 2009 allowing MPC to
consider gilts with remaining maturity of three and 25 years beside the initial 5 years.231
Between November 2009 and July 2012, MPC continuously extended the amount of
government bonds purchased, so that at the end total value of asset purchases amounted
227 Cf. Bank of England: Asset Purchase Facility; cf. Joyce, M. et al. (2010), p. 11. 228 Cf. Kapetanios, G. et al. (2012), p. 3. 229 Cf. Bank of England: Asset Purchase Facility. 230 Cf. Dimsdale, N. (2009), p. 6. 231 Cf. Joyce, M. et al. (2010), p. 11 f.
55
to GBP 375bn. From 2012 on, BOE left its amount of assets purchased unchanged.232
According to Inflation Report on August 2013, MPC announced its unreadiness to
decrease its stock of asset purchases until the optimal unemployment rate of 7 percent
was achieved. On the contrary, it approved to undertake further asset purchases, if
necessary, to bring unemployment rate downward to its target rate of 7 percent.233
3.9 Evaluation of the Relevant Research Papers and the Empirical Results
This section will discuss the relevant research papers and their results concerning the
effects of quantitative easing on the UK economy.
Thus, the empirical study of Kapetanios et al. focused on evaluation of effects of QE
on the UK wider economy, especially on the economic activity and inflation by
providing an extensive estimation work. In particular, the authors applied
counterfactual analysis, which in general investigates scenarios from the perspective
of the question “what if”. Thus, in this study authors analyzed real GDP and CPI
inflation against the backdrop of how these macro economic variables would have
developed, if QE had not been introduced. Conducting an additional baseline
prediction, which incorporated QE, and using empirical models, including large
BVAR, MS-SVAR and TVP-SVAR, results generated in counterfactual analysis and
the ones from baseline prediction were then compared with each other.234
By means of the 3 models authors carried out counterfactual analysis in order to
investigate how the UK macro economic variables were effected and if these effects
were of long continuance. For the purpose of providing conditional forecasts for
2 examined macro economic variables - real GDP and CPI inflation, authors made use
of econometric vector auto regression models, which allowed incorporation and
analysis of a large data set and helped to find out interrelation between spreads and
real economy. One of the models was the Bayesian VAR (BVAR),235
232 Cf. Bank of England: Quantitative Easing; cf. chapter 2.5. 233 Cf. Bank of England (2013), p. 5. 234 Cf. Kapetanios, G. et al. (2012), p. 4 f. 235 Cf. Ibid., p. 4, 6.

56
[3]
whose application enabled to capture structural change.236 Thereby, was the vector
containing data on 5-year and 10-year government bond spreads237 and all the variables
such as the factor that described white-noise error term of the vector, while Θ0
denoted a vector of constants and both and referred to parameter matrices.238,239
Monetary policy changes, which contained both introduction of ZLB or quantitative
easing policy, related structural shocks affecting aggregate demand and CPI inflation
were captured in the MS-SVAR [4] and TVP-SVAR [5] models below:240
[4]
[5]
where represented data set vector, which encompassed information on the 3-month
Treasury bill, yield spread of 10-year government bond , annual output increase yt
as well as annual price increase . It also included information on and ,
which denoted regime dependent autoregressive coefficients. While captured the
information on annual change in stock prices, Mt presented annual growth in money
supply. Additionally, - depicted covariance matrix of the innovations presented in
TVP-SVAR.241 All in all, the BVAR model on a monthly basis observed a large set of
236 Cf. Kapetanios, G. et al. (2012), p. 6, 12. 237 Cf. Ibid., p. 20. 238 „The Parameter Matrices, or Parameter Index Matrices (PIM), define the set of real parameters, and allow constraints to be placed on the real parameter estimates“. (MARK Program Help File Contents: Parameter Index Matrices (PIM)) 239 Cf. Kapetanios, G. et al. (2012), p. 12 f. 240 Cf. Ibid., p. 14 f., 16. 241 Cf. Ibid., p. 14, 16.
Yt= Θ0 + Θ1Yt−1+...+ ΘpYt−p+ et
Yt
et
Θ1 Θp
Yt= cs+ B j,,sYt−1+ A0,sεtj=1
K
∑
Yt= ct+ φl,tYt−ll=1
L
∑ + vt
Yt
St
π t A0,s Bj,s
SPt
vt
57
43 variables from April 1993 to September 2010. At the same time a rather smaller
set of data from 1963 to 2011 on a monthly and quarterly basis was used for the
SVAR models.242
In the first scenario referring to the baseline prediction within counterfactual analysis
conducted, authors assumed the medium to long-term bond yield to be reduced by
100 basis points as a result of successful QE implementation. As opposed to the first
scenario, the second one did not experience any reduction in yield spread indicating
100 basis points higher yield level compared to QE implementation scenario. Finally,
authors used slope change of the yield curve as suitable measure for representing the
difference between the two generated conditional forecasts with for target macro
economic variables.243
According to the 3 time-series models applied and counterfactual analysis conducted,
QE implementation consistent with 100 basis point decline in medium to long-term
government bond yields provided significant economic backup for real GDP by
preventing it from a much stronger fall. Considering estimated forecast in regard to
the CPI inflation, a positive shock keeping CPI inflation away from a very low level
and deflationary outcome was proven in light of QE implementation.244
Thus, average results across used empirical models revealed that compared to
baseline forecast, aggregate demand, without QE application, would have been
around 1.4 percent to 3.6 percent smaller, as well as CPI inflation around 1.2 percent
to 2.6 percent lower. As a result, authors stated that effects on real GDP and inflation
were mainly significant in the fourth quarter of 2009.245 However, the expecting
inflation and output growth based on maximum effect was observable only after 6 to
9 months for GDP and after one year for inflation since QE has been introduced.246
242 Cf Kapetanios, G. et al. (2012), p. 18 f. 243 Cf. Ibid., p. 19 f. 244 Cf. Ibid., p. 21. 245 Cf. Ibid., p. 26. 246 Cf. Ibid., p. 21.
58
Another well-know empirical study of Joyce et al., with its empirical findings on QE
effects, served as one of the main assumptions made for the baseline prediction of
counterfactual analysis in the conducted research above.247 Joyce et al. set focus of
their research paper on the changes occurred at financial market resulted from large
scale asset purchases initiated by the MPC. Thereby, given the fact that extensive
asset purchase programs of MPC accounted prevailing for gilts, large-scale purchases
of conventional gilts, started in March 2009, and the corresponding effects on gilt and
other financial asset markets became the object of authors investigation.248 Using 2
related empirical approaches authors aimed at gauging QE effects on asset prices,
specifically on gilt yields and gilt-OIS (overnight index swap) spreads.249
Based on the assumption that expectation of the imminent large-scale gilt purchase
program has a stronger effect on gilt and gilt-OIS spreads as the purchase program
itself, authors made a use of event-study method. Event-study analysis allowed
examining the market prices reaction in response to MPC´s announcement made
regarding the large-scale gilts purchases. A two-day window and additionally one and
three-day window were chosen as time intervals for this comparative study.250
Furthermore, authors observed zero-coupon yield curves of Bank of England, which
contained spot rates ranging between 5 and 25 years maturity in order to visualize
precisely the QE effects on the term structure of gilts.251
The second approach helping to assess the QE effects on gilt yields was the so-called
news-based calibration. Compared to event study, new-based calibration concentrated
on the amount of information content contained in the announcement itself and its
impact on the publicity. In order to quantify the information content for each
announcement and its effect, authors used Reuters´ survey results where around 50
economists revealed their responses in regard to the total QE purchase amount.
Assuming that responses of the respondents were consistent with their expectations,
247 Cf. Kapetanios, G. et al. (2012), p. 10, 19. 248 Cf. Joyce, M. et al. (2010), p. 5 f. 249 Cf. Joyce, M. et al. (2010), p. 9, 15; cf. chapter 4.4. 250 Cf. Joyce, M. et al. (2010), p. 14 f. 251 Cf. Ibid., p. 18 f.

59
authors compared the expectations of respondents on total amount of QE purchases in
light of two situations ex ante and ex post MPC´s decision on QE purchases.252
The difference between these surveys was regarded as a measure for the market
reaction assuming that market by anticipating QE overstated the information in the
announcement and thus induced underestimation of yields reaction on released QE
information. Reuters´ survey numbers revealed that already before the actual
announcement the mean of their surveys amounted to GBP 204bn and only GBP
205bn after the announcement.253 Finally, results from the event study providing
information on two-day change in zero-coupon gilt yields were compared with the
new-based calibration QE measures for GDP release dates.254
With the use of the event study approach authors were able to find out that across all
examined maturities gilt yields experienced a fall by 55 to 120 basis points as a result
of the QE announcement. All in all, it was stated that QE news had a marketable
effect on gilt yields by reducing them by around 100 basis points.255 Similarly to
event-study analysis, new-based calibration showed a decrease in gilt spreads
amounting to 1.25 percent as well as a fall in OIS rates and gilts-OIS spread
accounting for 0.45 percent and 0.8 percent based on two-day window estimation.256
Furthermore, authors suggested portfolio-rebalancing channel to be responsible for
transferring QE effect to the financial market. Thus, six QE announcements had an
immediate impact on the sterling corporate bond yields with low default risk by
causing a contraction of 70 basis points and of 150 basis points for the high-risk
default corporate bonds. As a result, percentage based reduction in low risk default
corporate bonds spread appeared to be about 380 basis points for the time period
252 Cf. Joyce, M. et al. (2010), p. 20. 253 Cf. Ibid., p. 21. 254 Cf. Ibid., p. 22. 255 Cf. Ibid., p. 19. 256 Cf. Ibid., p. 22.

60
between March 2009 and May 2010, however the study could not deliver obvious
evidences that this effect could be purely deduced from the QE implementation.257
3.10 Quantitative Easing in Japan: Description of Economic Environment
Japan´s lost decade also known as Japan’s Great Recession serves as predecessor in
miniature or a lesson to be drawn when it comes to Great Recession of 2008-2009 and
all the monetary policy measures applied to prevent economy from a total breakdown.
In the context of lost decade, scientists often refer to markedly low growth rate of
Japan´s GDP lasting over a decade and ensuing prolonged stagnation of Japan´s
economy. Thus, between 1995-2002, Japan generated a GDP rate deseeding the ones
of other major industrialized countries.258
Similar to U.S., equity and real estate bubbles depicted initial triggers for the outbreak
of Japan´s financial crisis of 1990´s. So, oversupply of liquidity that was provided by
the BOJ to the market in the end of 1980´s, led to economic boom but at the same
time induced abnormal speculative high price development in asset and real estate
market.259 In order to cool down the occurring speculations on the stock and real estate
market, BOJ decided to tighten the credit market by increasing the interest rates, what
ensuing resulted in Japan´s asset and land bubble collapse in 1989 and 1990.260
Bursting of asset and real estate bubble caused severe plunge in stock and asset prices
by dramatically reducing firms’ and financial institutions’ capital reserves and
commercial, residential and industrial property values.261 Moreover, commercial and
residential real estate faced enormous land value losses amounting to 80 and 20 percent
drop, in particular areas, compared to their peak values in 1991. This financial markets 257 Same empirical results revealed slightly different evidence for the development of equity prices. In response to MPC news in February 2009, FTSE All-Share index sank by 20 basis points and ensuing by 320 basis points after a renewed QE announcement in March of the same year. However, in the aftermath until May 2010 FTSE All-Share index experienced gradual surge, but also in this case this effect was not attributable to large scale gilt purchases. (Cf. Ibid., p. 25 f.) 258 Cf. Horioka, C. (2006), p. 1. 259 Cf. Nanto, D. (2009), p. 3. 260 Cf. Ibid., p. 5. 261 In August 1992 Japan´s Nikkei index experienced a drastic fall of 50 percent and of entire 78 percent in 2002 relative to its highest value of JPY 38,917 in December 1989. (Cf. Reszat, B. (2013), p. 1; cf. Nanto, D. (2009), p. 3)
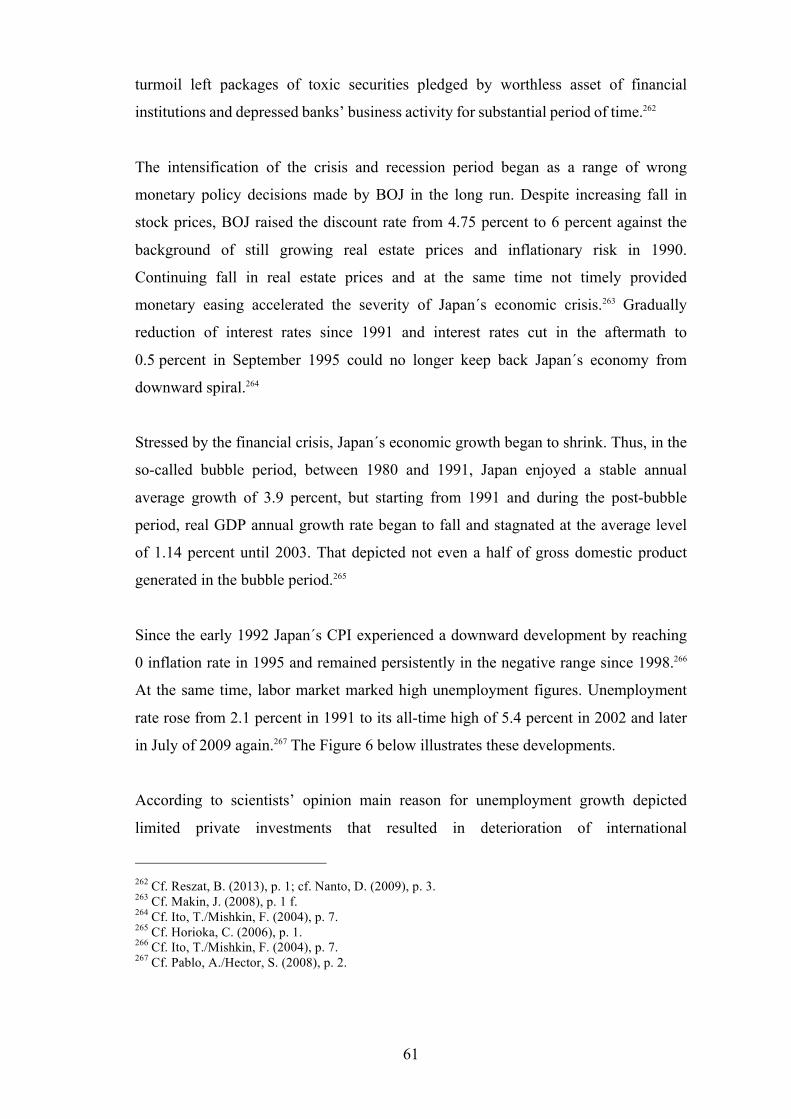
61
turmoil left packages of toxic securities pledged by worthless asset of financial
institutions and depressed banks’ business activity for substantial period of time.262
The intensification of the crisis and recession period began as a range of wrong
monetary policy decisions made by BOJ in the long run. Despite increasing fall in
stock prices, BOJ raised the discount rate from 4.75 percent to 6 percent against the
background of still growing real estate prices and inflationary risk in 1990.
Continuing fall in real estate prices and at the same time not timely provided
monetary easing accelerated the severity of Japan´s economic crisis.263 Gradually
reduction of interest rates since 1991 and interest rates cut in the aftermath to
0.5 percent in September 1995 could no longer keep back Japan´s economy from
downward spiral.264
Stressed by the financial crisis, Japan´s economic growth began to shrink. Thus, in the
so-called bubble period, between 1980 and 1991, Japan enjoyed a stable annual
average growth of 3.9 percent, but starting from 1991 and during the post-bubble
period, real GDP annual growth rate began to fall and stagnated at the average level
of 1.14 percent until 2003. That depicted not even a half of gross domestic product
generated in the bubble period.265
Since the early 1992 Japan´s CPI experienced a downward development by reaching
0 inflation rate in 1995 and remained persistently in the negative range since 1998.266
At the same time, labor market marked high unemployment figures. Unemployment
rate rose from 2.1 percent in 1991 to its all-time high of 5.4 percent in 2002 and later
in July of 2009 again.267 The Figure 6 below illustrates these developments.
According to scientists’ opinion main reason for unemployment growth depicted
limited private investments that resulted in deterioration of international
262 Cf. Reszat, B. (2013), p. 1; cf. Nanto, D. (2009), p. 3. 263 Cf. Makin, J. (2008), p. 1 f. 264 Cf. Ito, T./Mishkin, F. (2004), p. 7. 265 Cf. Horioka, C. (2006), p. 1. 266 Cf. Ito, T./Mishkin, F. (2004), p. 7. 267 Cf. Pablo, A./Hector, S. (2008), p. 2.
62
competitiveness and ensuing in absence of Japanese foreign demand.268 Additionally,
non-performing loans expanded to a big problem burdening persistently Japan´s
economy. Thereby, banks kept lending to the real estate sector, despite companies’
inability to meet their obligations and to pay interest rates back.269
Figure 6 – Economic development of Japan
Source: Bloomberg.
Analogically to U.S. recession of 2008-2009, Japan´s global financial situation in
1990s also experienced the so-called balance sheet recession, according to which
especially Japan´s corporate sector, being highly leveraged by pledging its real estate
properties, needed to adjust its balance sheets positions in the wake of significant
asset prices changes. As a result of strong economic boom and progressive
development in stock and land prices, Japan´s housing wealth to GDP increased
enormously in 1980s. However, due to sharp real estate price decline corporate and
private sector faced substantial wealth losses and eroding of property values. This
turned both into increased tendency for savings and into aversion for private
investments, what finally led Japanese economy to a strong negative wealth effect.270
268 Cf. Pablo, A./Hector, S. (2008), p. 20. 269 Cf. Ito, T./Mishkin, F. (2004), p. 7. 270 Cf. European Central Bank (2012a), p. 96, 98 f.
2,9%
5.4% 5,1%
-5,5%
0,2%
2,7%
-7,0%
-5,0%
-3,0%
-1,0%
1,0%
3,0%
5,0%
7,0%
1992 1994 1996 1998 2000 2002 2004 2006 2008 2010 2012 2014 Unemployment GDP growth CPI
63
Japan’s accumulation of government debt began in 1992 as a result of extensive fiscal
stimulus programs rolled out to combat progressively developing recession.271
Moreover, reconstruction programs after events such as Fukushima earthquake and
nuclear cataclysm in 2011 forced Japanese government to dig into public purse and
expand government debt substantially.272 In this context, issuance of new government
debt depicted the necessary financing source for the fiscal stimulus initiated. Thus, in
year 1990 government debt amounted to 47 percent of GDP and in 2000 it more than
doubled accounting for 106 percent of GDP in the same year. Especially, the
introduction of QEP in 2001 served as an enormous government debt booster, while
in 1992 BOJ´s government debt amounted to only 48 percent of GDP. 16 year later, in
2008, government debt already accounted for 167 percent of GDP.273
In 1995 Japan´s economy gave an evidence for fragile recovery. Japan´s delayed
liquidity injection programs as well as depreciation of Yen in the second half of 1995
had set necessary stimulus for boosting economy in 1996 and in beginning of 1997.
However, this recovery was impermanent, since in 1997 BOJ increased prematurely
consumption tax rate to 5 percent and hampered therewith already ailed overall
demand.274 Along with ensuing Asian currency crisis in 1997 and negative aggregate
demand based on capital devaluation and liquidity shortage, Japan´s economy turned
in 1998 to deep deflation and entered a period of economic stagnation. This
introduced the onset of a persistent recession for Japan economy.275
3.11 Japan: Scale and Description of Measures Introduced
Japan´s asset price bubble in 1989, forced BOJ to address the problem of highly
inflated equity and real estate prices with a tightening of monetary policy. This was
the beginning of the asset prices market collapse that brought stock prices to a rapid
fall while leaving real estate prices unchanged. In response to rising real estate prices,
BOE increased official discount rate from 4.25 percent to 6.00 percent in 1990. This
271 Cf. Nanto, D. (2009), p. 10. 272 Cf. Societe Generale (2013), p. 2. 273 Cf. Nanto, D. (2009), p. 10 f. 274 Cf. Ito, T./Mishkin, F. (2004), p. 8; cf. Makin, J. (2008), p. 3. 275 Cf. Ito, T./Mishkin, F. (2004), p. 8, 11.
64
measure, held until 1991, triggered real estate price decline, but also contributed to
the asset price plunge in the same year.276 In light of financial turmoil and weakening
economy, BOJ decided to cut the official discount rate from 6.00 percent to 5.5
percent in July 1991 for the first time. In the course of next years through 1995
additional discount rate cuts were applied. Finally in February-March 1999 discount
rate reached 0 percent.277
The practice of zero interest rate policy (ZIRP) pursued by the BOJ in 1999 was
neither seen nor applied before by any other country. Therewith, BOJ as originator
aimed at targeting deflationary problem until it was finally resolved and stimulating
the growth of ailing economic.278 In 2000, BOJ increased the interest rate to 0.25
percent as a result of overhasty conclusion made on economic improvement and
decreased it one year later again for the purpose of achieving a stable inflation rate
above zero.279
3.11.1 Non-performing Loans
In response to enormous problem of non-performing loans, Japan´s government
established, in 1992, specialized company called “Cooperative Credit Purchasing
Company” (CCPC) aimed at unburdening companies´ books from their non-
performing loans by buying only loans backed by real estate assets. Within a year,
CCPC helped to shed JPY 1.3tn in nonperforming loans and substantially reduce the
total amount of all loans written off in 1993. However, despite a significant amount in
non-performing loans that were purchased by the CCPC, the overall amount of non-
performing loans written of throughout the time of the crisis was growing and reached
its maximum of USD 318bn (JPY 37.2tn) in 2002.280
276 Cf. Makin, J. (2008), p. 2. 277 Cf. Ito, T./Mishkin, F. (2004), p. 7. 278 Cf. Kurihara, Y. (2014), p. 77. 279 Cf. Ito, T./Mishkin, F. (2004), p. 2 f. 280 Cf. Nanto, D. (2009), p. 5 f.

65
3.11.2 Fiscal Stimulus Programs
Many scientific papers for instance Makin, John H. (2008) or ECB´s Monthly
Bulletin (2012) assess BOJ´s slow and, in some respects, delayed response to
financial slump. In particular, it refers to the set of financial stimulus initiated in 1992
by BOJ, two years after equity market collapsed.281 In early 1990s, between 1992 and
1995, Japan´s government introduced stimulus packages focused mainly on public
works projects and land acquisition. Thereby, in year 1993 and 1995 two fiscal
stimulus packages were brought into action. All these considerable packages
amounted to 14 percent of total GDP of 2000 and were provided in a form of
supplementary budgets by central and local governments.282
After 1993, fiscal stimulus implemented along with reduction of income taxes helped
Japanese economy to get back on the recovery path, but already in 1995 Japanese
economy experienced a range of bankruptcies of housing and loans organizations
preceded by a considerable deterioration of economic development.283 Henceforth, the
second part of the decade was prevailing highlighted by fiscal stimulus packages
targeted at providing policy loans, credit lines and extensive liquidity programs to the
ailing enterprises of a small and medium size as well to housing sector.284
The outbreak of Asian currency crisis in 1997 and some miscarried government
measures towards elimination of the financial crisis i.e. premature consumption tax
increase, engulfed financial sector and economy in even much deeper crisis. Japan´s
government was forced to introduce a significant liquidity injection by supporting
banks and Deposit Insurance Corporation of Japan with a total amount of USD 250bn
(JPY 30tn). One-year later Japan´s government made another USD 14bn (JPY 1.8tn)
available for banks and in 1999 it provided an additional amount of USD 62.5bn (JPY
7.5tn).285 Fiscal packages followed after 1999 and until 2008 increased Japan´s
281 Cf. Makin, J. (2008), p. 4; cf. European Central Bank (2012a), p. 97. 282 Cf. Nanto, D. (2009), p. 6; cf. Brückner, M./Tuladhar, A. (2010), p. 5. 283 Cf. Nanto, D. (2009), p. 6. 284 Cf. Brückner, M./Tuladhar, A. (2010), p. 5 f. 285 Cf. Nanto, D. (2009), p. 6 f.

66
government debt additionally, so that in 2008 its amount accounted for 167 percent of
GDP depicting the main financing source for these capital injections.286
3.11.3 Quantitative Easing
Simultaneously to reintroduction of ZIRP in March 2001, BOJ turned to an
unprecedented non-conventional policy so-called “quantitative easing” focusing on
provision of extensive bank liquidity and expansion of money supply.287 Quantitative
Easing Monetary Policy (QEMP) was implemented by changing current accounts
balance (CAB) of financial institutions at the central bank. Current account balance
was taken as the main operating policy target and influenced by the enormous
acquisition of long-term government bonds resulting later in great expansion of
monetary base.288
QEMP adopted by the BOJ captured 3 important objectives; firstly it was supposed to
replace the main operating policy goal - targeting the nominal interest rate by the
focus on CAB that increased as it was already mentioned above. Secondly, by means
of the QEMP, BOJ committed itself to achieve the stable zero bound and positive year
on year development of the core CPI. This commitment made by BOJ for the first
time aimed at making market development on the prospective track of interest rates
more comprehensible. Finally, ample liquidity provision via purchases of long-term
government bonds was designated to attained target level of CABs.289
Therefore, in March 2001 target level of CAB was increased from initially JPY 4tn
Japanese government bonds (JGBs) per month to around JPY 5tn and in February of
2003 it experienced a threefold climb-out addressing worsening of economic
circumstances.290 Generally, for the purpose of the approaching the target level of
CABs, BOJ mainly bought long-term JGBs of 10 and 20 years maturity, however in
January 2002, it had expanded its purchase packages by 2, 4, 5 and 6-year short-term
286 Cf. Nanto, D. (2009), p. 10. 287 Cf. Ito, T./Mishkin, F. (2004), p. 17. 288 Cf. Girardina, E./Moussac, Z. (2011), p. 465. 289 Cf. Ugai, H. (2006), p. 2. 290 Cf. Reszat, B. (2013), p. 9.

67
bonds.291 At the beginning of 2004 target level of balance of the current accounts
reached JPY 35tn and led additionally to decrease in uncollateralized overnight call
rate that felt below 0.02-0.03 percent reached during the first round of ZIRP between
1999 and 2000. As of the end of 2005, BOJ purchased JPY 63tn in long-term JGBs
and, therewith, increased monetary base significantly to JPY 117tn.292
Thus, over the implementation period of QE government securities including long-
term government bonds and short-term government bills increased from JPY 57.7tn in
2001 to JPY 93.3tn at the end of 2006. Simultaneously, impairment of transmission
mechanism as well as paralysis of the asset-backed commercial paper market forced
BOJ, beginning from 2003 until 2006, to provide backup measures and implement
direct purchases of short-term ABCP, longer-term ABS and stocks. However, relative
to the purchase to the JGBs these operations remained by a rather minor execution.293
All these monetary policy operations and money supply enabled BOJ to improve core
CPI growth rate, which exceeded the zero bound from November 2005 and ensuing
increased up to 0.5 percent in 2006. In light of this inflationary improvement and
positive prospects in regard to targets set within QEP, BOJ announced exit from QE in
9 March 2006 and turned back to its initial operating goal-targeting of uncollateralized
overnight call rate and maintenance of ZIRP.294 However in October 2010, in response
to emerging financial crisis, BOJ reintroduced its second round of QE program, which
was transferred in a larger and aggressive QE program (Q3) in 2013.295
Japan´s QE 2 referring to Asset Purchase Program (APP) depicted part of the Japan´s
comprehensive monetary easing. Within the APP, BOJ aimed at making purchases
across a wide range of asset segments from government bonds at short- and long-term
maturity, corporate bonds to commercial papers, exchange-traded funds (ETFs) and
Japanese real estate investment trusts (J-REITs). Focusing on lowering risk premia of
291 Cf. Van Rixtel, A. (2009), p. 2. 292 Cf. Ugai, H. (2006), p. 2. 293 Cf. Van Rixtel, A. (2009), p. 2, 4. 294 Cf. Ugai, H. (2006), p. 3. 295 Cf. Andolfatto, D./Li, L. (2014), p. 1 f.

68
those assets, BOJ raised APPs from JPY 35tn to JPY 101tn by 2012.296 Ensuing,
Quantitative and Qualitative Monetary Easing initiated with taking on office of
Haruhiko Kuroda was introduced in April 2013. Clear goal of achievement of
2 percent inflation target rate as well as yearly monetary base expansion by JPY 60-
70tn became main targets of the new policy program. Additionally, BOJ extended the
maturity of purchased government securities to 7 years.297
3.12 Evaluation of the Relevant Research Papers and the Empirical Results
In this section, there will be presented research papers including most important
findings on the effects of quantitative easing in Japan.
First scientific paper depicts a research paper of Eric Girardina and Zakaria Moussac
that investigated the impact of QE on real economic variables of Japanese economy
such as output and price and assessed effectiveness of QEMP for overall economic
stimulus and changes in transmission mechanism. For the purpose of more precise
and comprehensive analysis of underlying data Girardina and Moussac decided to
combine Factor-Augmented and Markov switching VAR models. This new approach
called MS-FAVAR model would expand limited capacity of initial VAR approach
and enable to include more relevant variables working with broader set of data series.298
In their research paper, Girardina and Moussac stated important role of the
expectation and portfolio-rebalancing channel in influencing economy. While the
expectation channel requiring government commitment in keeping the short-term
interest rate at lower or close to zero level in the long run decreases the long-term
interest rate, portfolio-rebalancing channel acts in light of imperfect substitution
between different financial assets that induces investors to buy non-monetary assets
when the money supply increases. As a result, increased purchases of non-monetary
296 Cf. Fawley, B./Neely, C. (2013), p. 73 f.; cf. Rogers, J. et al. (2014), p. 10 f. 297 Cf. Takahashi, W. (2013), p. 301 f. 298 Cf. Girardina, E./Moussac, Z. (2011), p. 463.

69
assets led to reduction in their yields. Thus, both transmission channels cause drop in
long-term interest rates encouraging for their part overall demand and price level.299
In MS-FAVAR model applied by Girardina and Moussac, depicted data set of
economic variables, while illustrated monetary policy instrument controlled by the
BOJ and denoted errors with mean zero. Both measures and were assumed
to be vectors of economic variables. Thereby, , as a vector with ,
unobservable factors was linked to the variables in .300
[6]
Variables in vector depicted different economic concepts including economic
activity and price pressure. These variables summarized in a matrix301 can be
influenced by the development of the economy.302 In order to capture the change
inducing by the application of one of the regimes, Girardina and Moussac extend its
model by Hamilton´s approach.303
[7]
Formula above represents regimes assuming to be intercept,
autoregressive terms and variance-covariance matrix.304 Speaking about regimes it
is important to note that especially second regime, corresponding to monetary policy,
is important for the analysis as it indicates the period starting from 1999 when the
ZIRP along with QEMP were initiated.305
299 Cf. Girardina, E./Moussac, Z. (2011), p. 465 f. 300 Cf. Ibid., p. 467. 301 S. Appendix 1. 302 Cf. Girardina, E./Moussac, Z. (2011), p. 467. 303 Cf. Ibid., p. 468. 304 Cf. Ibid., p. 468. 305 Cf. Ibid., p. 475.
Xt
Yt
et Xt Yt
Ft K ×1( )
Xt
Xt
Zt= α1+B11Zt−1+...+ Bp1Zt−p+A1utαm+B1mZt−1+...+ BpmZt−p+Amut
"#$
%$ if st= 1 if st= m
ai B1i, ...,Bpi
Ai
Xt= ΛFt+ et

70
Using two-step estimating approach based on principal component analysis for the
data set consisting of three economic concepts in form of 3 sub-groups of factors and
monetary policy instruments, Girardina and Moussac analyzed quantitative easing
within a timeframe from 1985 to 2006 on the monthly base. Among with many
different monetary policy instruments to be observed in order to assess the effects on
monetary policy, Girardina and Moussac decided to focus on monetary base whose
expansion was the main measure how BOJ conducted QE and which became the only
factor to be observe in .306
Based on the research and analysis conducted by Girardina and Moussac, QEMP
introduced by BOJ positively affected economic variables such as output and price.
As a result, authors found out that during the extensive monetary programs focusing
on expansion of monetary base, Japanese economic activity showed an increase
exceeding the value before the introduction of QE by 3 times. However, this effect
was of a transient nature lasting only 13 months. Analysis revealed that expanding of
monetary base by 1 percent, being equivalent to JPY 46bn, induced growth in output
of around 0.15 percent. At the same time, 100 percent increase of total stock of CABs
will lead to a significant 15 percent surge in real activity. However, the significance
of the generated effects held only between 6 months and a year; after 13 months
observable effects continue to disappear.307
In regard to the price development, similar conclusion could be drawn. Different to
reaction of output to expansive measures applied, price factor responded with a
cumulative increase of 0.05 percent over 5 years (from 1999 until 2006) by a
monetary base expansion of 1 percent. This result revealed rather smaller impact,
however most probably longer executed QEPM could have generated better results.308
Moreover, looking at the transmission channels, Girardina’s and Moussac’s
investigation confirmed their effectiveness in affecting long-term interest rates. 306 Cf. Girardina, E./Moussac, Z. (2011), p. 469, 471 f. 307 Cf. Ibid., p. 475, 477. 308 Cf. Ibid., p. 477.
Yt
71
Thereby, portfolio-rebalancing channel was successful in reducing liquidity premiums
and encouraging investment towards financial assets during QEMP. Likewise,
expectation channel revealed its prevailing effect on long-term interest rate in second
regime, however these effects became visible only after a year. From the beginning of
the second year these positive effects became insignificant emphasizing also here fast
impermanence of QEPM´s effects.309 All in all, Girardina and Moussac came to the
conclusion that although QEPM´s effects were short-lived, they significantly
contributed to prevention of further deterioration in output and therewith to
intensification of Japanese recession.310
While focus of Girardina’s and Moussac’s empirical investigation mainly depicted
effects on macroeconomic variables such as economic activity and price level, Oda
and Ueda took particularly the assessment of effects from ZIRP and QEMP on
medium-and long-term interest yields of government bonds into account of their
empirical work. High importance of these rates in the transmission mechanism and
their strong validity when it comes to determination of current monetary policy
conditions served as justification of their analysis.311
In order to test their main model assumption, Oda and Ueda used backward-looking
model as one of the macro-finance models. The test particularly analyzed, if the
commitment to maintain a zero rate, made within QEMP, was effective in providing
the so-called “policy duration effect” that was consistent with the central bank´s
commitment to maintain short-term interest rate at zero bound in the long run. This in
turn influenced market expectations on the long-term interest rates and decreased
them accordingly.312
This model enabled a separate illustration and analysis of long-term interest rate
regarding the expectation and risk premium. For this purpose authors examined
relevant periods of 1999/Q2-2000/Q2 and 2001/Q2-2003/Q4 by applying the
309 Cf. Girardina, E./Moussac, Z. (2011), p. 477. 310 Cf. Ibid., p. 480 f. 311 Cf. Oda, N./Ueda, K. (2005), p. 1. 312 Cf. Okina, K./Shiratsuka, S. (2003), p. 1; Oda, N./Ueda, K. (2005), p. 6, 14.

72
maximum likelihood method.313 Approaching the construction of the model-based
yield curve, authors complemented their estimated macro-finance model by no-
arbitrage asset pricing theory.314 Moreover, using estimates from the analysis above,
Oda and Ueda performed an additional regression analysis in order to answer the
question, i) whether extensive purchase programs within the QEMP had produced a
signaling effect and ii) whether they were effective in decreasing risk premium of
medium and long-term interest rates.315
Compared to the research paper of Girardina and Moussac, Oda and Ueda generated
some additional and slightly different results. According to the generated result from
their empirical research, commitment made within QEPM influenced market
expectations of interest rates and therewith produced a commitment effect. This
conclusion is justified by the fact that after commitment policy interest rates at 3-, 5-,
and 10-year maturity became lower as it was the case before the commitment.316
On the contrary, as the estimated results on commitment effectiveness in reducing risk
premium of interest rates revealed, the impact on risk premium for the 3-year and 10-
year interest rate appeared was rather small. Also, perceptions made through the
regression run presented similar results. Thereby, portfolio-rebalancing effect induced
by increase in CABs and the purchases of JGBs showed no significance, in other
words it revealed no reducing impact on risk premium factor included in medium and
long-term interest rates.317 According to authors, signaling effect was successful in
keeping zero rate, however this effects was not clearly referable to such a measure as
increase in CABs consistent with QEMP or good communication between BOJ and
the market.318
313 Cf. Oda, N./Ueda, K. (2005), p. 6 f. 314 Cf. Ibid., p. 9. 315 Cf. Oda, N./Ueda, K. (2005), p. 15. 316 Cf. Oda, N./Ueda, K. (2005), p. 14. 317 Cf. Oda, N./Ueda, K. (2005), p. 16. 318 Cf. Ibid., p. 16 f.
73
4. Assessment of the Effects of Quantitative Easing
As it was already mentioned in the previous chapter, conducted empirical research on
the assessment of QE effects provided empirical evidences that implied application of
unconventional policy measures induces meaningful economic effects.319 In this
chapter the focus will be set on some selected macroeconomic and financial variables
and their development under implementation of unconventional monetary policy.
Additionally, there will be discussed to what extent QE affected these variables and if
QE was an effective monetary policy measure.
4.1 Assessment of the Effects on Inflation
Price stability ensured by an optimal inflation rate depicts the primary objective320 of
many central banks around the world and was one of the main variables to be
maintained or shifted towards close or to the target level of 2 percent in the period of
and after financial crisis. Highly interconnected with economic activity development
and country´s monetary policy, inflation rate incorporates country’s financial and
economic stance and reflects financial and economic headwinds a country might face.
However, quantifying effects on inflation as a macroeconomic variable cannot be
proceeded with easiness since its empirical evaluation faces a specific challenge. This
challenge refers to time lag occurring between monetary action that was undertaken
and the final impact of this action that becomes observable on the economic variables.
Delayed pass through of monetary policy decisions to inflation rate as a result of time
lag factor might induce both biased starting point and biased results for empirical
models.321 Nevertheless, there is a high range of empirical work presented, in which
authors assess and quantify effects of QE on macro economy by providing estimates
from their empirical models.322
319 Cf. Gagnon, J. et al. (2011), p. 5. 320 Cf. European Central Bank (2015): Tasks. 321 Cf. Joyce, M. et al. (2012), p. 284. 322 Cf. Ibid., p. 284 f.
74
During the Great Recession in 1990,323 related especially to Japan, and financial crisis
of 2008, countries as United States, Eurozone and United Kingdom became objects of
strong inflation fluctuations, whose extent depended on structural324 and financial
features of the economies. While Japan and euro area faced a problem of downward
and deflationary development,325 U.S. and UK were able to shift inflation towards
relatively healthy path by applying a wide range of monetary policy measures. Based
on empirical research papers that investigated effects of LSAP of government bonds
and gilts on inflation and GDP, relatively differently strong but positive magnitude of
the effect on CPI development was especially observed in U.S. and UK.326
This observation can be explained by fact that central banks of both countries openly
communicated their objective to reduce long-term yields and therefore applied asset
purchases programs excessively.327 By means of those purchase programs, which
captured both private and public asset segments, U.S. and UK aimed at provision of
extensive liquidity to the economy and financial market in order to stimulate nominal
spending and aggregate demand, which for their turn supposed to support and move
CPI inflation rate towards its medium-term target.328
Thereby, euro area and Japan mainly targeted at improvement of credit market
conditions and recovery of banking sector by following the policy path of “enhanced
credit easing” done by ECB and of using increasingly bank loans approached by BOJ.
Flattering the yield curve was not the initial goal of them two, what became visible in
clear focus on bank support.329
Different analysis approaches generated different extent of the effect on the examined
variable. Thus, according to the empirical estimates of Chung et al. inflation in the
United States was 1 percent higher as if LSAPs, referring to the first and second
323 Cf. Makin, J. (2008), p. 2. 324 Cf. Memedovic, O./Lapadre, L. (2009), p. 3 f.; cf. Chapter 3. 325 Cf. European Commission (2014winter), p. 39 f.; cf. Ito, T./Mishkin, F. (2004), p. 7 f. 326 Cf. Chung, H. et. al. (2011), p. 4; cf. Wiele, M./Wieladek, T. (2014), p. 17 f.; cf. Kapetanios, G. et al. (2012), p. 4. 327 Cf. Baumeister, C./Benati, L. (2010), p. 15 f. 328 Cf. Joyce, M. et al.(2010), p. 5; cf. Labonte, M. (2014), p. 10 f. 329 Cf. Fawley, B./Neely, C. (2013), p. 71.
75
round of QE, had not been conducted, while results of Weale and Wielade revealed a
0.38 percent increase in U.S. CPI.330 Similarly, estimates generated by Kapetanios at
al. showed that in UK annual inflation rate reached its peak effect amounting to 1.25
percentage points as a result of 1 percent decline in gilts spread, whereas Weale and
Wielade study revealed positive but less significant effect of about only 0.3 percent
increase in UK inflation.331
Weale and Wielade stated that asset purchase in UK primarily impacted UK inflation
through induced changes in overnight index swap rate futures (OIS rate futures)
compared to yields changes on long-term government bonds at 20 and 30 year
maturity and real exchange rate changes caused in response to government bonds
purchases in U.S.332 Thus, authors designated signaling channel to have enabled QE
effect to be transferred in UK, while portfolio-rebalancing channel was also determined
to be important in regard to effecting inflation and output in U.S.333
Besides the evidences for substantial effect of QE on inflation in all countries being
examined including U.S., UK, euro area and Japan, Baumeister and Benati found
evidences for QE effectiveness in preventing the UK and U.S. economies from high
deflation risk and economic activity breakdown based on research examining the time
period between 2007-2009. Estimates revealed that induced reduction in spreads
exuded a substantial encouraging power on U.S. inflation growth by boosting it
towards a 1.1 percent growth at its peak time in the end of 2009.334 As opposed to this,
study conducted by Chen et al. focusing on LSAP 2 effects, found only modest until
small effect on inflation.335
As previously already mentioned, by conducting its initial monetary policy of
enhanced credit easing, the euro area was mainly focused on enhanced liquidity
supply for revival of credit market and bank lending. Despite the application of
330 Cf. Chung, H. et. al. (2011), p. 4; cf. Weale, M./Wieladek, T. (2014), p. 5 f. 331 Cf. Kapetanios, G. et al. (2012), p. 26; cf. Weale, M./Wieladek, T. (2014), p. 5 f. 332 S. Appendix 2. 333 Cf. Weale, M./Wieladek, T. (2014), p. 6, 36. 334 Cf. Baumeister, C./Benati, L. (2010), p. 23, 20. 335 Cf. Chen H. et al. (2012), p. 313.

76
unconventional instruments i.e. SMP and CBPP, ECB´s monetary policy measures
were less radical compared to the ones of United States and UK, whose main response
to the crisis depicted asset purchases accounting for around 25 percent of lands’
GDP.336 Nevertheless, ECB´s monetary policy provided a positive effect on annual
CPI as the study of Peersman approved. Examining time sample from 1999 until 2009
Peersman claimed that ECB´s unconventional monetary policy instruments initiated
during the crisis induced a credit supply and balance sheet shock, which in turn were
responsible for the significant permanent effect on inflation of euro area.337
Altavilla et al., who analyzed the impact of OMT announcement on financial and
macroeconomic variables of the euro area countries, found evidence for positive and
powerful effect on CPI especially for European countries e.g. Italy and Spain by
noticing that these changes in inflation were similar, in regard to their extent, to those
of U.S. and UK. However, results for France and Germany showed that OMT
announcement had rather a small effect on consumer prices of both countries.338
However, from 2011euro area was facing its heaviest problem of constantly falling
inflation that remained since October 2013 permanently below the 2 percent bound.339
In response to this problem, ECB announced to introduce lately in 2012 presented
OMT and to extend excessively its balance sheet by intending to purchase amount of
EUR 60 billion of combined monthly public and private sector assets.340
Starting from 1998, Japan faced a problem of prolonged deflation period. As a result
Japan conducted 3 rounds of QE to stabilize economic growth, combat deflation and
stagnation of economy.341 However, most research papers on effectiveness of QE
generated different results by overwhelmingly inclining to the view that QE1 effect on
inflation was rather small. Thus, Girardina and Moussac analyzing QE effectiveness
for the time sample from 1985 until 2006, capturing only the first round of QE, found
336 Cf. European Parliament (2014), p. 4. 337 Cf. Peersman, G. (2011), p. 7, 15, 24; cf. European Central Bank (2015): Measuring inflation. 338 Cf. Altavilla, C. et al. (2014), p. 14. 339 Cf. European Parilament (2014), p. 14. 340 Cf. Draghi, M. (2015): Introductory statement. 341 Cf. Ito, T./Mishkin, F. (2004), p. 8; cf. Takahashi, W. (2013), p. 303.

77
that cumulative increase over 5 years in consumer price amounted only to 0.05 percent
by 1 percent monetary base expansion.342 According to Berkmen, reasons for such a
small responsiveness lay in the impairment of the credit market, deleveraging of
Japanese companies’ and banks’ strong reluctance for loans and lending.343
Berkmen’s research paper extended the analyzing period and generated results on
inflation development from the time period since 1998 to 2010. The results from this
time sample included second round of QE implemented in October 2010 and also
revealed a weak responsiveness of consumer price toward applied monetary easing
and no meaningful effect on inflation expectations. Study estimates showed that
expansion of Japanese current account balances by around JPY 10tn induced an
increase of 0.6 percentage points in core inflation during 2 years.344
A possible explanation for this development in Japan Berkmen saw in so-called
„flattening of the Phillips curve“, which implies decreasing price sensitivity to
economic activity changes or with other words refers to the situation, where in order
to trigger any changes in inflation a stronger output pressure is required. 345
However, the Figure 7 below illustrates that, after a decade of no significant price
growth, from 2013 Japanese economy started responding to the extensive balance
sheet expansion. Thus, with BOJ balance sheet size more than doubling in 2014
compared with 2006, the CPI began peaking up from 0.4% to 2.7% in 2013-2014.
A similar positive impulse for the CPI can be seen in the US, where the CPI showed a
reverse trend bottoming at 1.5% in 2013 and increasing to 1.6% in 2014, following a
continuous FED balance sheet expansion.
On the contrary, the Figure 7 also displays a slightly different illustration of the same
developments relevant to the UK and Eurozone. Thus, from 2012 the balance sheet
342 Cf. Girardina, E./Moussac, Z. (2011), p. 477. 343 Cf. Berkmen, P. (2012 ), p. 3. 344 Cf. Ibid., p. 7 f. 345 Cf. Ibid., p. 13.

78
size of BOE was not significantly increased and in 2014 remained at a constant level,
while that of ECB was even massively declining. Looking at the development of CPI,
the price growth in both the UK and Eurozone was fairly weak, showing meaningful
signs of deflationary development.
Figure 7 – Development of inflation relative to the central bank balance sheet in
US, UK, Eurozone and Japan
Source: Federal Reserve Bank of St. Louis, ECB, BOE, BOJ, Bloomberg.
For majority of the countries, effects on inflation become only visible after passing of
particular period of time. Most research papers speak about 6 to 13 month needed
until changes in monetary policy (application of specific instrument) become
observable in inflation itself.346 Indeed, this evidence proved the difficulty of time lags
and delayed pass through, which was described at the beginning of this chapter.
The next section will assess the effects of quantitative easing on the unemployment
and highlight its main aspects gained from the relevant research papers and related
economic data. 346 Cf. Kapetanios, G. et al. (2012), p. 21; cf. Girardina, E./Moussac, Z. (2011), p. 477.
100
-1%
1%
3%
5%
0
200
400
600
2006 2008 2010 2012 2014
FED Balance sheet US CPI
100
0%
2%
4%
6%
0
200
400
600
2006 2008 2010 2012 2014
BOE Balance sheet UK CPI
100
0%
1%
2%
3%
4%
0
100
200
300
2006 2008 2010 2012 2014 ECB Balance sheet EU CPI (right axis)
100
-2%
0%
2%
4%
0
100
200
300
2006 2008 2010 2012 2014
BOJ Balance sheet BOJ CPI
79
4.2 Assessment of the Effects on Unemployment
Great Recession and a slow recovery following severely shook labor markets of the
advanced economies. As a result, between 2008 and the beginning of 2011, U.S.
experienced a sharp unemployment increase, whose nearly all-time high of
10.1 percent in October 2009 was only exceeded by the huge unemployment numbers
during the Great Depression.347
As it was already mentioned in 4.1., the monetary policy of FED and BOE
differentiated from that of other central banks studied in this work. In particular,
among the selected central banks, only FED and BOE set and communicated a
quantitative target for unemployment rate to be achieved through the monetary
policies applied, while ECB and BOJ did not explicitly address unemployment.
Compared to U.S., the Eurozone faced similar unemployment development between
2008 and 2011, as the euro area suffered a sustained shock to GDP, which affected
the employment significantly. However only after 2010, where the U.S
unemployment rate began to reverse, the unemployment rate of the euro area
reversely picked up again and reached its critical point of 12.2 percent in April 2013.
Thus, the unemployment in the euro area is a complex phenomenon and appears
hardy influenceable by monetary policy given both the fundamental differences
across the 19 countries of the monetary union and diverge cyclical or structural labor
market drivers.348,349
In 2011, UK´s unemployment was recorded to reach its highest rate of 8.0 percent,
where especially young people were hit mostly.350 As far as Japanese unemployment
347 Cf. Casaux, S./Turrini, A. (2011), p. 2; cf. Federal Reserve Bank St. Louis (2015): Civilian Unemployment Rate. 348 Cf. European Central Bank (2014): Unemployment. 349 Cf. Thereby, Greece accounted for 27.0 percent, Spain recorded 26.8 percent and Portugal revealed a rate of 17.8 percent, representing the highest unemployment records. (Cf. Eurostat (2013): April 2013 Euro area) 350 Cf. Eurostat (2014): Unemployment; cf. Bell, D./Blanchflower, D. (2010), p. 4 f.

80
rate is concerned, the respective peaks of unemployment were observed in 2002 and
2009, where the unemployment rate was above 5.0 percent in both years.351
As Quantitative Easing, consistent with asset purchases, is a measure primarily
influencing asset price structure, positive changes in employment can be achieved
through the successful increase of asset prices as a result of portfolio rebalancing effect,
which leads to the rise of investors´ wealth level. Thus, spillover effect derived from the
financial market and passed through to the market for goods and services is a result of
the induced wealth increase. This wealth effect triggers an increased demand for more
service and goods, what in turn requires additional labor force.352 Furthermore, besides
the increase of investors’ wealth, asset purchases contribute to positive expectations of
future higher asset prices and induce decline in interest rates that both stimulate lending
activity within the economy and boost consumers’ spending, what depicts one of the
important preconditions for the rising employment.353
The interrelation between the unemployment rate and economic activity, particularly
the growth rate, strongly depends on the observation period. While in the short-term it
is rather characterized as loose and lagging, the long-term view suggests a negative
correlation in favor of the improving economic activity lowering unemployment,354
initially introduced and thereafter commonly known as Okun’s law355.
Looking at the execution of the monetary policy by FED and ECB, it is obvious that
the FED recognized the necessity of the balance sheet expansion earlier and continued
with its implementation through 2015. ECB, however, was rather not ready to follow
the similar path of massive balance sheet expansion, despite in 2008 the
unemployment rate in both the U.S. and Eurozone was similarly high. With no
explicit target for unemployment rate and with the balance sheet size decreasing
sizably, the Eurozone economy was not able to generate effect of wealth increase and
351 Cf. Eurostat (2014): Unemployment. 352 Cf. Watkins, J. (2014), p. 3 f.; cf. Friedman, M. (1969), p. 231. 353 Cf. Watkins, J. (2014), p. 4 f. 354 Cf. Levine, L. (2013), p. 1. 355 The law states that, to maintain a stable unemployment rate, GDP growth, adjusted for inflation, should level the growth rate of potential output required. (Cf. Okun, A. (1962), p. 1 ff.)

81
the unemployment continued deteriorating, picking at 12% in 2013. The Figure 8
below outlines these developments in more details.
Figure 8 – Divergence in balance sheet expansion of FED and ECB relative to the
development of unemployment
Source: Federal Reserve Bank of St. Louis, ECB, U.S. Bureau of Labor Statistics.
It is clearly seen from the above that, compared with the levels of 2006, by 2014 FED
increased its balance sheet by more than 5 times, while during same time frame,
ECB’s balance sheet only grew by 273 percent in 2012 prior to decline to 194 in
2014. With that, the development of unemployment shows quite a different path too.
Thus, the U.S. rate of unemployed labor force in 2014 was continuously declining
from 2008, reaching 5.6% in 2014. This compares to the rate of unemployed labor
force in the Eurozone, where the gauge was growing to its peak 12 percent in 2012
and reaching 11.2% in 2014.
While a certain relationship can be assumed from the above, the following Figure 9
cannot confirm the same divergence when looking at balance sheet expansion and
unemployment development in UK and Japan. In particular, similarly to the above, with
494 percent the balance sheet expansion in the UK was very sizeable, while that with
208 percent in Japan was moderate. However, the unemployment data both for UK and
Japan shows that the rate of unemployed labor force began to fall starting from 2010.
An additional aspect of this development was that the unemployment in Japan appeared
to have improved even at a higher rate than that in UK, leading to the conclusion that the
extent of the balance sheet expansion cannot be directly translated to the labor market.
Moreover, this relation can depend on the specific characteristics of labor market as
well as on the composition of the assets within the balance sheet expansion.
100
513
273 194
0
200
400
600
2006 2008 2010 2012 2014 FED Balance sheet ECB Balance sheet
9,6%
5,6%
10,2% 12,0%
2,0%
7,0%
12,0%
17,0%
2006 2008 2010 2012 2014 US Unemployment EU Unemployment

82
Figure 9 – Divergence in balance sheet expansion of BOE and BOJ relative to the
development of unemployment
Source: ECB, BOJ, Bloomberg.
Consequently, the link between the effects of quantitative easing and unemployment
is very complex and multi-faceted. A sustainable influence on the employment and
labor market is a function of a number of factors such as the unemployment drivers
and integrity of the labor market.356
4.3 Assessment of the Effects on GDP
This section will take on the assessment of the effects of quantitative easing on the
output and highlight its main development outcomes resulting from the relevant
research papers and related economic data.
In light of financial crisis U.S., UK, Eurozone and Japan (lost decade) experienced a
strong contraction of their economic activity. Financial market crash strongly shook
the economic stability and growth of major developed countries. Thus, U.S. recorded
8.9 percent real GDP contraction at the beginning of 2008.357 Between 2007 and 2009,
UK also faced the output fall of 7.2 percent, the strongest since the World War II, while
the Eurozone reported an accumulated output loss of 5 percent from the beginning of
the financial crisis in Q2 of 2008.358 Japan´s real GDP were falling since 1991 as a
356 Cf. European Central Bank (2014): Unemployment. 357 Cf. United States Department of the Treasury (2012), p. 1. 358 Cf. Astley, M. et al. (2009), p. 178; cf. European Commission (2009), p. 8.
494
100 208
0
200
400
600
2006 2008 2010 2012 2014
BOE Balance sheet BOJ Balance sheet
5,1%
3,6%
7,9%
5,7%
2,0%
4,0%
6,0%
8,0%
10,0%
2006 2008 2010 2012 2014
Japan Unemployment UK Unemployment

83
result of asset price bubble and indicated an average growth rate of 1.14 percent until
2003. In order to address the worsening of GDP growth major central banks were
forced to introduce unconventional monetary policy measures, whose effect on GDP
became the issue to be analyzed by the majority of research papers.359
Thus, most of the research studies confirm a positive effect on GDP derived from the
implementation of QE for the major developed economies. Peersman, analyzing non-
standard measures of ECB, found that emerging credit supply shock resulted from
enhanced credit easing policy increased the economic activity in the euro area.
However, these output changes were only of temporary nature and the first significant
increase could be observed only after approximately 12 months, what underlines time
lagging component of the pass-through.360
Moreover, further findings showed that OMT announcements of 2012 were
encouraging especially for GDP development in Italy and Spain.361 As opposed to
this, OMT announcement induced relative moderate to small changes in GDP of
France and Germany amounting to 0.46 for former and 0.34 percentage deviations for
the latter country.362 Additionally, Lenza et al. revealed that the effect on real activity
was exerted rather through the change of interest rate and spreads induced by
unconventional monetary tools and not through extension of broad money.363
Also, Girardina and Moussac came to the conclusion that although QEPM´s effects
were short-lived, they significantly contributed to prevention of further deterioration
in output and therewith to intensification of Japanese recession.364
Similar effect on GDP development was observed in U.S. and UK economies.
Therefore, many research papers focused especially on the asset purchases that were
359 Cf. Horioka, C. (2006), p. 1; cf. Fawley, B./Neely, C. (2013), p. 52. 360 Cf. Peersman, G. (2011), p. 15. 361 GDP of Spain experienced a sizeable effect of a 2.01 percentage deviations increase, while Italy recorded a 1.50 percentage deviations rise in its economic activity after OMT announcement was made. 362 Cf. Altavilla, C. et al. (2014), p. 14. 363 Cf. Lenza, M. et al. (2010), p. 34. 364 Cf. Girardina, E./Moussac, Z. (2011), p. 477.

84
extensively conducted in both U.S. and UK. As a result, estimates of Weale and
Wieladek showed that LSAP introduced in U.S. consistent with purchase of 1 percent
of GDP lowered the yield curve of bond spreads and helped to provide a positive
stimulus to real activity of a country indicating an increase by 0.36 percent. At the same
time asset purchases (1 percent of GDP) organized in UK mainly influenced the OIS
spreads. Bringing them down induced the reduction in financial market uncertainty,
what provided a positive effect to real GDP amounting to 0.18 percent.365
Kapetanios et al. assumed effect of asset purchases in UK on real economy to be
transferred via portfolio balancing channel that was strongly activated by the
cumulative LSAP of GBP 200bn assets initiated in March 2009. Estimates showed
that decrease of 100 basis points in gilt spreads prevented UK economy from severe
economical downturn and increased real GDP leading it to its maximum effect of
around 1.5 percent after a period of time between from 6 to 9 months.366 Additionally,
estimates for two rounds of QE in U.S. that were generated in research paper by
Chung et al. showed that overall effect of the two LSAP induced a considerable
increase in the level of GDP that accounted for nearly 3 percent.367
Capturing the first round of Japan´s QEMP beginning in 2001, Girardina and
Moussac empirical results showed that after the first QE round ensuing positive effect
on GDP occurred. This reaction of the real economy appeared to be of a moderate
extent and of short-lived duration. Authors quantified the effect by analyzing to what
extent GDP growth responded to JPY 4.6tn, which were used by BOJ to increase
banks CABs at the beginning of first round. As result, real GDP responded to CABs
increase by 0.15 percent to 0.1 percent growth, which took 6 to 12 month to become
visible. However, the duration of this small effect was observable only during the first
year, afterwards it lost on significance.368
365 Cf. Weale, M./Wieladek, T. (2014), p. 35 f. 366 Cf. Kapetanios, G. et al. (2012), p. 20 f., 26 f. 367 Cf. Chung, H. et al. (2010), p. 56. 368 Cf. Girardina, E./Moussac, Z. (2011), p. 477.
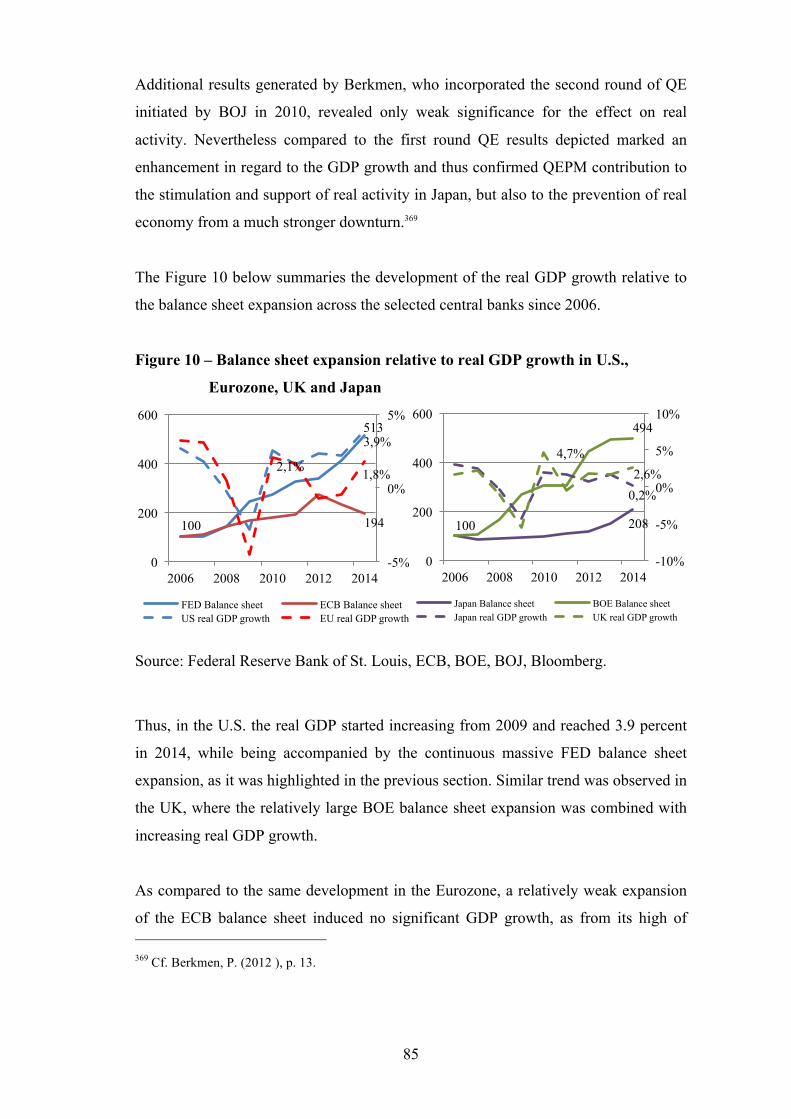
85
Additional results generated by Berkmen, who incorporated the second round of QE
initiated by BOJ in 2010, revealed only weak significance for the effect on real
activity. Nevertheless compared to the first round QE results depicted marked an
enhancement in regard to the GDP growth and thus confirmed QEPM contribution to
the stimulation and support of real activity in Japan, but also to the prevention of real
economy from a much stronger downturn.369
The Figure 10 below summaries the development of the real GDP growth relative to
the balance sheet expansion across the selected central banks since 2006.
Figure 10 – Balance sheet expansion relative to real GDP growth in U.S.,
Eurozone, UK and Japan
Source: Federal Reserve Bank of St. Louis, ECB, BOE, BOJ, Bloomberg.
Thus, in the U.S. the real GDP started increasing from 2009 and reached 3.9 percent
in 2014, while being accompanied by the continuous massive FED balance sheet
expansion, as it was highlighted in the previous section. Similar trend was observed in
the UK, where the relatively large BOE balance sheet expansion was combined with
increasing real GDP growth.
As compared to the same development in the Eurozone, a relatively weak expansion
of the ECB balance sheet induced no significant GDP growth, as from its high of 369 Cf. Berkmen, P. (2012 ), p. 13.
513
100 194
3,9%
2,1% 1,8%
-5%
0%
5%
0
200
400
600
2006 2008 2010 2012 2014
FED Balance sheet ECB Balance sheet US real GDP growth EU real GDP growth
208 100
494
0,2%
4,7% 2,6%
-10%
-5%
0%
5%
10%
0
200
400
600
2006 2008 2010 2012 2014
Japan Balance sheet BOE Balance sheet Japan real GDP growth UK real GDP growth
86
2.1% in 2010, the real GDP growth remained weak for consecutive years between
2012 and 2013, prior to lightly reviving in 2014. Japanese economy faced a similar
picture, as a moderate increase of the central bank’s balance sheet did not provide
enough stimulus for the economy to grow significantly.
4.4 Assessment of the Effects on Spreads
In response to the short-term interest rates that went down to its zero level and turned to
be insufficient and ineffective in combating against economic downturn, major central
banks of advanced economies decided to target the long-term interest rate by initiating
extensive asset purchases referring to LSAP.370 By reducing the amount of long-term
assets on the market, central banks aimed at increasing their prices and thus lowering
the long-term yields of these assets induced by reduction in their risk-premiums.371
Thus, alone employing SMP, ECB acquired EUR 220bn in government bonds of
different euro area country members, while between 2009 and March 2014 Fed
increased its stock of long-term Treasury bonds by accumulative USD 1.9tn and its
mortgage-backed securities portfolio by USD 1.6tn. UK´s numbers of medium and
long-term assets purchased amounted to GBP 375bn for the time period from January
2009 until November 2012.372 In 2004 Japanese purchases of long-term JGBs reached
its peak by setting a target level for CABs of JPY 36tn.373 Initiation of these LSAPs
was required in order to provide a substantial stimulus to economy by directly
effecting different yield spreads of assets at different maturities.374
There has been wide range of studies focusing on assessment of QE effects on
different segments of asset yields, targeted within LSAP. Various studies proved
LSAPs to be a powerful instrument in reducing long-term interest rates and so
flattering long-term yield curves across different assets. Thus, for example Gagnon et
al. research analysis showed that, between December 2008 and March 2010, 370 Cf. Joyce, M. et. al. (2012), p. 272, 274. 371 Cf. Gagnon, J. et al. (2011), p. 6 f. 372 Cf. European Parliament (2014), p. 8, 10. 373 Cf. Berkmen, P. (2012), p. 3. 374 Cf. Chen, H. et al. (2012), p. 289.

87
implemented LSAPs were successful in decreasing long-term yields of different
financial assets that were part of the purchases program such as government bonds,
asset-backed securities or agency MBS. However, not only those asset yields were
brought to fall, but also long-term interest rates of assets, which were not included
into Fed´s LSAPs i.e. swap rate and the Baa corporate bond, were similarly reduced
due to overarching effect of LSAPs.375
This particular spillover effect was connected by Gagnon et al. with the portfolio
balancing effect, which indirectly makes investors to look for substitutes with higher
returns as the relative return on those purchased assets gets lower.376 Furthermore,
authors’ findings revealed a significant reduction in 10-year term premium, which
accounted between 30 and 100 basis points, as well as a fall in term premium in
related market segments such as agency debt and agency MBS.377
Study of Rogers et al., dealing among others with reasoning of yields contraction
across countries, analyzed to what extent central banks’ commitment to future short-
term rates at the zero level for longer period and direct lowering of the term risk
contributed to falling yields. As Fed was mainly focusing on bonds purchases at long-
term maturity, authors’ estimates revealed that rates especially of 5 years and beyond
recorded a significant fall indicating the effect of term premium decline consistent
with portfolio rebalancing channel rather expectations hypothesis.378
Analyzing international spillover effects and cross border effect of QE, Chen et al.
(2011), among others, focused on the U.S. term spread shock that was estimated over
a horizon of five years. According to the empirical results of the study U.S. term
spread shock appeared to have a remarkable impact on European, British and
Japanese equity prices, which experienced rises related to that of the U.S., but not on
375 Cf. Gagnon, J. et al. (2011), p. 19 f. 376 Cf. Ibid., (2011), p. 8. 377 Cf. Ibid., (2011), p. 38 f. 378 Cf. Rogers, J. et al. (2014), p. 12.

88
a long-term basis, because already after a year equity prices of those advanced
economies reached their initial low levels.379
Also, Hancock and Passmore closely studied changes in agency MBS yields and U.S.
mortgage rates. They analyzed Federal Reserve MBS purchase programs launched in
2008.380 Research estimates suggested that extensive MBS purchase program and its
announcements had a considerable effect on MBS yields and mortgage rates by
reducing both by about 100 basis points. Moreover, MBS purchase programs by Fed
contributed to revival of adequate MBS market pricing with lower mortgage rates that
were mainly established between November 2008 and first quarter of 2009.381
Powerful effects on yields in UK were indicated in results generated by Joyce et al.
research study. Since LSAP in UK mainly focused on purchases of gilts, authors’
estimates suggested a significant reaction in this asset price segment. As a result their
estimates showed that average yield of gilts ranging between 5 to 25 years responded
to LSAPs announcement with a 100 basis points decline, whose overwhelming
amount accounted for reduction in spread.382
Study of Rogers et al. showed that the peak of the yield declines of UK long-term
assets was induced by the QE news in March 2009 strongly effecting forward yields
of 10 to 20 years, whose fall can be ascribed to the shift in term risk. Thereby, the
portfolio-rebalancing channel was especially pointed out as it enabled transfer of the
majority of the effect and also induced spill over effect on corporate bonds. Compared
to gilts, estimates for corporate bonds revealed even a stronger effect amounted to 150
basis points yield fall in high yield corporate bonds and the total spread decline of 380
basis points in high-grade corporate bonds for the period between March 2009 and
May 2010.383
379 Cf. Chen, Q. et al. (2011), p. 21. 380 Cf. Hancock, D./Passmore, W. (2010), p. 1. 381 Cf. Ibid., (2010), p. 2, 14. 382 Cf. Joyce, M. et al. (2010), p. 19, 38. 383 Cf. Rogers, J. et al. (2014), p. 12.

89
Following the Figure 11 below, the Libor-OIS GBP 3 months spread showed some
spikes between 2007 and 2009, peaking at nearly 300 basis points in December 2008.
When comparing the development of the Libor-OIS spread to the development of the
10-year gilts yields, as illustrated by the Figure 11, it is evident that a surge of the
spread between the late 2008 and early 2009 was accompanied by the massive 170
basis points drop in government bond yields. Similar movements were observed in the
U.S. and Eurozone, whereas the respective Libor-OIS spread in the Eurozone was the
highest among the markets observed.384 On the other hand, the lowest Libor-OIS
spread was observed in Japan.
Figure 11 – Libor-OIS GBP 3 months spread versus U.K. Generic Government
Bond 10-year yield
Source: Bloomberg.
A so-called Ted spread represents a further market risk-measuring indicator. As it was
mentioned earlier, in the financial crisis financial markets immediately reflected
information inducing price and rates volatility. Thus, 3-month LIBOR and interest
rate of U.S. T-bill, whose difference builds the Ted spread, indicated credit risk level
of interbank lenders compared to the safe U.S. Treasury bill and increased to
384 Cf. Figure 11 and Appendix 2-4.
6,27625
0,67
3,226
0
1
2
3
4
5
6
7
8
2005 2006 2007 2008 2009 2010 2011
LIBOR GBP 3 Month GBP SWAP OIS 3 Month UK Generic Govt 10Y Yield
90
enormous 458 basis points by October 10, 2008.385 Such severe TED spread increase
indicated ultimate credit market impairment.386
According to Lenza et al., spread between the EONIA and the target rate of the ECB
sharply increased in the wake of financial market impairment. However, ECB´s credit
easing measures, especially fixed rate full allotment procedures, managed to bring the
spread between MRO rate and EONIA down by 65 basis points in 2009.387
Furthermore, estimates generated by Fratzscher et al. also suggested that ECB´s
initiated liquidity programs, i.e. SLTRO and VLTRO, induced a fall in 10-year
sovereign bond spreads ranging between 24 and 52 basis points for Italy and Spain
and between 5 and 6 basis points for core European countries such as Germany,
Austria, Netherlands and Finland.388
Despite structurally different (sterilization of liquidity provided) and a rather
negligible asset purchase programs (measured against GDP), compared to U.S. and
UK,389 study of Fratzscher et al. investigating effects of SMP announcement made in
May 2010 and August 2011 as well as SMP conducted by ECB, revealed also
powerful results. So, their results indicated 121 basis points drop in Italian and
Spanish 10-year government bond yields after SMP was announced and at the same
time recorded no changes for the 10-year sovereign yields of core European
countries.390 Additionally, empirical results of the same study suggested that SMP
undertaken by ECB had contributed to the downward development of yields in all
examined euro area countries by bringing yields of non-core euro area countries to
fall by around 3 percent and of core euro area countries by 0.05 percent.391
These results appeared to be justified as the SMP initiated in May 2010 focused on
the purchases of sovereign bonds issued by Greek, Irish, Portuguese, Italian and
Spanish, countries experiencing severe economic and financial tensions. Despite of 385 Cf. Marshall, J. (2009), p. 8 f.; cf. Mishkin, F. (2010), p. 2 f. 386 Cf. Appendix 5; Federal Reserve Bank of St. Louis (2015): TED Spread. 387 Cf. Lenza, M. et al. (2010), p. 23, 29. 388 Cf. Fratzscher, M. et al. (2014), p. 15. 389 Cf. European Parliament (2014), p. 4, 17. 390 Cf. Fratzscher, M. et al. (2014), p. 15. 391 Cf. Ibid., p. 16.
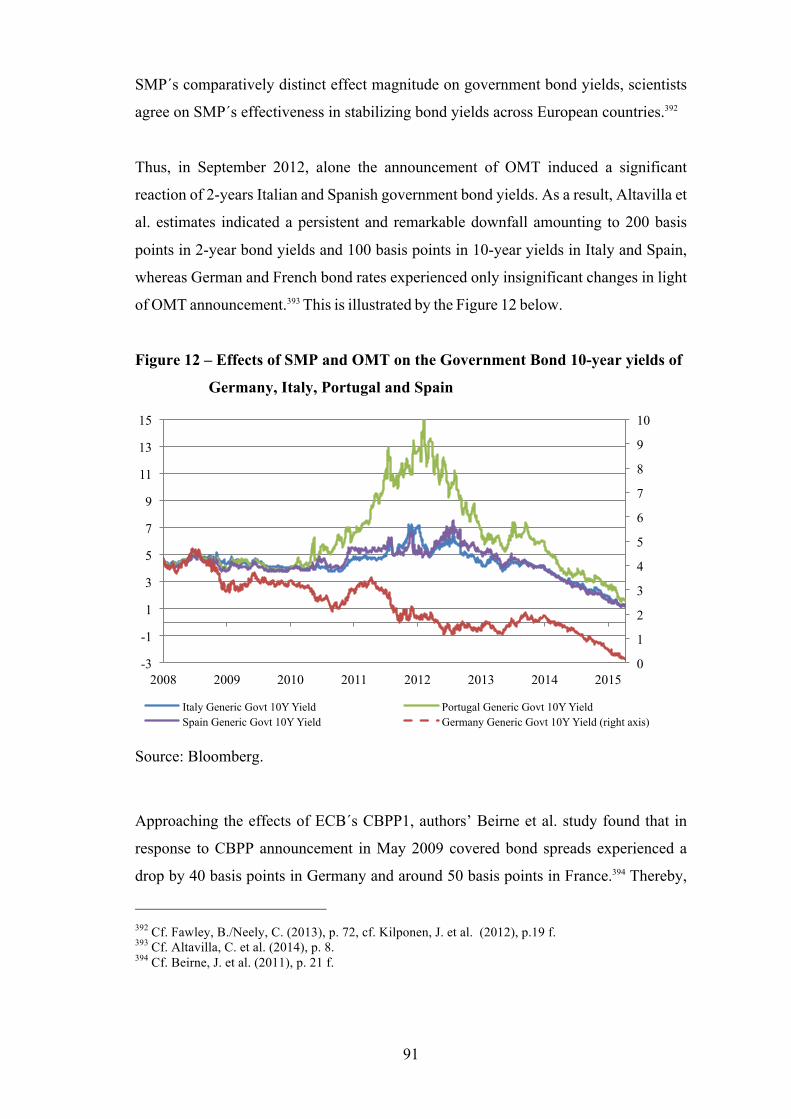
91
SMP´s comparatively distinct effect magnitude on government bond yields, scientists
agree on SMP´s effectiveness in stabilizing bond yields across European countries.392
Thus, in September 2012, alone the announcement of OMT induced a significant
reaction of 2-years Italian and Spanish government bond yields. As a result, Altavilla et
al. estimates indicated a persistent and remarkable downfall amounting to 200 basis
points in 2-year bond yields and 100 basis points in 10-year yields in Italy and Spain,
whereas German and French bond rates experienced only insignificant changes in light
of OMT announcement.393 This is illustrated by the Figure 12 below.
Figure 12 – Effects of SMP and OMT on the Government Bond 10-year yields of
Germany, Italy, Portugal and Spain
Source: Bloomberg.
Approaching the effects of ECB´s CBPP1, authors’ Beirne et al. study found that in
response to CBPP announcement in May 2009 covered bond spreads experienced a
drop by 40 basis points in Germany and around 50 basis points in France.394 Thereby,
392 Cf. Fawley, B./Neely, C. (2013), p. 72, cf. Kilponen, J. et al. (2012), p.19 f. 393 Cf. Altavilla, C. et al. (2014), p. 8. 394 Cf. Beirne, J. et al. (2011), p. 21 f.
0
1
2
3
4
5
6
7
8
9
10
-3
-1
1
3
5
7
9
11
13
15
2008 2009 2010 2011 2012 2013 2014 2015
Italy Generic Govt 10Y Yield Portugal Generic Govt 10Y Yield Spain Generic Govt 10Y Yield Germany Generic Govt 10Y Yield (right axis)

92
looking at the euro area level, CBPP was able to decrease covered bond rates by
around 12 basis points taking the same period of time.395
Magnitude of the effect transferred through unconventional monetary policy channels
between 1999 and 2003 to Japans medium to long-term interest rates were analyzed
by Oda and Ueda, whose estimates revealed an induced commitment effect that
brought interest rates at 3-, 5-, and 10-year maturity to fall and appeared to be most
effective ones among the others.396 However, there were no significant findings made
regarding the impact on risk premium through commitment effect. Similarly, portfolio
rebalancing effect was observed to be insignificant for the 10 year interest rate
estimates but rather significant for 3- and 5-year rates. In particular, this showed that
BOJ’s extensive CABs increase implied through JGB´s purchases were sufficient in
reducing risk premia and spreads of medium-term assets.397
Paper by Ugai summarizing research studies that dealt with assessment of quantitative
easing effects of QEP conducted between 2001 and 2006 in Japan delivered similar
evidences for portfolio rebalancing channel and showed that those effects derived from
purchases of JGB had rather negligible impact on JGB yields, while Ugai suggested
portfolio rebalancing effect to be significant on high-grade corporate bonds.398
However, Japan´s second round of QE also known as New Asset Purchase Program
under the Comprehensive Monetary Easing (CME) was more effective in decreasing
risk premium and spreads according to study of Lam. He pointed out the difference of
CME compared to QEP conducted previously. A wide range of various assets that
were captured besides the JGB within asset purchase program under CME since 2009
contributed to a significant effect on Japanese financial markets and different asset
yields. Thus, Lam argued that, opposed to QEP where only government bonds were
purchased, asset purchase under CME additionally encompassed risky and equity
395 Cf. Beirne, J. et al. (2011), p. 6. 396 Cf. Oda, N./Ueda, K. (2005), p. 14. 397 Cf. Ibid., p. 15, 17. 398 Cf. Ugai, H. (2006), p. 21, 43 f.
93
related assets that were able to push the sovereign bond yields down by inducing
portfolio rebalancing effect.399
Furthermore, empirical results of the study revealed that during the examined period
from 2005 to mid-2011 both long-term securities such as 10-year government and 2-
years sovereign yields experienced a fall by 24 basis points for the first one and by 14
basis points the latter. Similar results were shown on corporate bonds, which were
reduced by 15 to 22 basis points throughout different investment grade securities.400
Additionally, estimate showed that equity markets as well as real estate investment
trusts (REITs) were positively affected by showing significant surge of 5 to 7 percent
in equity prices and 14 percent in REITs prices after the monetary easing evens
analyzed. Thereby, Lam stressed out that announcement of new asset purchases
contributed much more to the above-mentioned results than the asset purchases per se.
Thus, the magnitude of the effect derived from the announcement was stronger than
effect from the actual purchases.401
399 Cf. Lam, R. (2011), p. 3 ff. 400 Cf. Ibid., p. 8. 401 Cf. Ibid., p. 9.
94
5. Conclusion
The study was set out to analyze and explore the effects of quantitative easing on
selected economic indicators in the U.S., Eurozone, UK and Japan. The work has also
sought to conclude whether unconventional tool of monetary policy, such as
quantitative easing, can result in and is able to induce positive or negative effect while
stabilizing the economy. The overall theoretical works on this subject are usually
limited to assessment of effects on a single economy. Moreover, there have already
been conducted numerous works, however, they have often provided an inconclusive
statement on the direction of effects.
Specifically, the work sought to answer two of these questions:
1. Can QE improve the selected macroeconomic indicators?
2. Can there be a consistent path of conducting the policy that can be similarly
applied to another countries in an effort to achieve the same positive results?
When analyzing the effects of quantitative easing, the study faced several issues, when
assessing the effects, such as inflation time lag between implementation of a particular
monetary policy measure and final impact on the output, structural differences in labor
market across selected countries and diverse structure and size of asset purchases. In
particular, these issues weakened the results prevented a consistent picture across the
selected countries.
Thus, the study argues that QE can improve the selected macroeconomic indicators
such as inflation, GDP growth and spreads. However, in order for the magnitude of
the effects to become significant, following conditions must be met:
a. Signaling channel and portfolio rebalancing channel are necessary to influence
asset price structure and to induce wealth level rise
b. Communication of a transparent policy target to the market, which is achieved
rather by provision of extensive liquidity within asset purchase programs than
by enhanced credit easing
c. Lowering the yield curve of bond spreads to provide a positive stimulus to the
real activity
95
On the contrary, the study finds no significant effect of QE on unemployment, as the
extent of the balance sheet expansion cannot be directly associated with the labor
market development.
The work, furthermore, suggests that similar effects of QE, achieved in a single
economy, will be less consistent to achieve across other countries. The reasons for
these conclusions are various specific characteristics of the labor market, such as
labor market integrity, as well as the composition of assets purchased within balance
sheet expansion.

VI
Appendix
Appendix 1
xt1
xt2
...xtI
!
"
#####
$
%
&&&&&
=
Λ1f 0 ... 00 Λ2
f ... 0... ... ... ...0 0 0 Λ I
f
!
"
#####
$
%
&&&&&
Ft1
Ft2
...Ft
I
!
"
#####
$
%
&&&&&
+
et1
et2
...etI
!
"
#####
$
%
&&&&&
Source: Girardina, E./Moussac, Z. (2011), p. 467.
Appendix 2 – Libor-OIS USD 3 months spread versus U.S. Generic Government Bond 10-year yield
Source: Bloomberg.
5,62125
4,75
0,303
2,1915 1,9183
0
1
2
3
4
5
6
7
2005 2006 2007 2008 2009 2010 2011
LIBOR USD 3 Month USD SWAP OIS 3 Month US Generic Govt 10 Year Yield

VII
Appendix 3 – Euribor-OIS EUR 3 months spread versus Euro Generic Government Bond 10-year
yield
Source: Bloomberg.
Appendix 4 – Libor-OIS JPY 3 months spread versus Japan Generic Government Bond 10-year yield
Source: Bloomberg.
5,33
0,665
0,434 0
1
2
3
4
5
6
2005 2006 2007 2008 2009 2010 2011 2012 2013 2014
Euribor EUR 3 Month EUR SWAP OIS 3 Month Euro Generic Govt Bond 10 Year
1,09375
0,19571 0,0965
0,845
0
0,5
1
1,5
2
2,5
2005 2006 2007 2008 2009 2010 2011
LIBOR JPY 3 Month JPY SWAP OIS 3 Month Japan Generic Govt 10Y Yield

VIII
Appendix 5 – Development of the Ted spread
Source: Bloomberg.
Appendix 6 – Development of Government Bond 10-year yields
Source: Bloomberg.
0
100
200
300
400
500
2003 2005 2007 2009 2011 2013 2015
TED Spread
0,00
1,00
2,00
3,00
4,00
5,00
6,00
7,00
8,00
9,00
1994 1996 1998 2000 2002 2004 2006 2008 2010 2012 2014
US Govt 10 Year Yield Euro Govt Bond 10 Year UK Govt 10Y Yield Japan Govt 10Y Yield

IX
Appendix 7 – Development of US Government Bond 2-year yields versus US Government Bond 10-
year yields and Fed Funds Target Rate between 1994-2014
Source: Fed, Bloomberg.
Appendix 8 – Development of Eurozone Government Bond 2-year yields versus Eurozone
Government Bond 10-year yields and ECB Refinance Rate between 1999-2015
Source: ECB, Bloomberg.
0,00
1,00
2,00
3,00
4,00
5,00
6,00
7,00
8,00
1994 1996 1998 2000 2002 2004 2006 2008 2010 2012 2014
US Govt 10 Year Yield US Govt 2 Year Yield Fed Funds Target Rate
-‐1,00
0,00
1,00
2,00
3,00
4,00
5,00
6,00
1999 2001 2003 2005 2007 2009 2011 2013 2015
Euro Govt Bond 10 Year Euro Govt Bond 2 Year
ECB Refinance Rate

X
Appendix 9 – Development of UK Government Bond 2-year yields versus UK Government Bond 10-
year yields and UK Official Bank Rate between 1994-2014
Source: BOE, Bloomberg.
Appendix 10 – Development of Japan Government Bond 2-year yields versus Japan Government
Bond 10-year yields and Japan Central Bank Rate between 1993-2015
Source: BOJ, Bloomberg.
0,00
1,00
2,00
3,00
4,00
5,00
6,00
7,00
8,00
9,00
1994 1996 1998 2000 2002 2004 2006 2008 2010 2012 2014
UK Govt 10Y Yield UK Govt Bonds 2 Year Note
UK Official Bank Rate
0,00 0,50 1,00 1,50 2,00 2,50 3,00 3,50 4,00 4,50 5,00
1993 1995 1997 1999 2001 2003 2005 2007 2009 2011 2013 2015
Japan Govt 10Y Yield Japan Govt Bond 2yr
Japan Central Bank Rate

XI
Zusammenfassung
In der vorliegenden Masterarbeit werden Effekte von Quantitative Easing (QE)
analysiert, wobei auf QE als Instrument der unkonventionellen Geldpolitik sowie auf
die ausgewählten makroökonomischen als auch finanzwirtschaftlichen Indikatoren
der vier wirtschafsstärksten Länder wie Vereinigte Staaten, Vereinigtes Königreich,
Eurozone und Japan besonderer Fokus gelegt wird. Bei dieser Masterarbeit kommt es
speziell darauf an zu bewerten, ob die Anwendung von QE gegen
Wirtschaftsabschwung und andere verheerende Folgen der Wirtschafts- und
Bankenkrise eine effektive Lösung darstellt.
Zu Beginn dieser Masterarbeit werden die wichtigsten Aspekte der Entwicklung von
QE erfasst. Dabei wird auf folgende Themen verstärkt eingegangen: das globale
Wirtschaftsgeschehen als Folge der Wirtschaftskrise, der Unterschied zwischen der
konventionellen und unkonventionellen geldpolitischen Maßnahmen, der Unterschied
zwischen Quantitative Easing und Credit Easing, sowie die wichtigsten
Transmissionskanäle des QE und der expansiven Ausweitung der Bilanz der
Zentralbanken.
Basierend auf den unterschiedlichen strukturellen und finanziellen Besonderheiten der
Länder im Fokus wird im Laufe der Masterarbeit eine umfassende Beschreibung der
wirtschaftlichen Lage eines jeden Landes und die Veränderung wichtiger
makroökonomischer und finanzwirtschaftlicher Faktoren in Folge der Wirtschafskrise
vorgenommen. Außerdem werden im weiteren Verlauf die wichtigsten
geldpolitischen Maßnahmen ausführlich beschrieben, die in den jeweiligen Ländern
gegen die Krisenbekämpfung angesetzt wurden. Anschließend werden relevante
Forschungstudien mit ausführlicher und qualitativer Auseinandersetzung zu den
Effekten von QE, samt ihren vorgestellten empirischen Modellen und bedeutenden
Ergebnissen präsentiert und analysiert.
Zum Schluss dieser Arbeit werden Effekte aus den im Kapitel 3 vorgestellten
Modellen aufgegriffen und deren Effektivität anhand einer umfassenden Analyse der
ausgewählten Hauptwirtschafts- und Finanzindikatoren wie Inflation,
Arbeitslosigkeit, Wachstumsrate des Bruttoinlandsprodukts und Spreads gemessen
sowie die wichtigsten Erkenntnisse präsentiert.

XII
Zusammenfassend ist festzustellen, dass die Intensität der Anwendung von
unkonventionellen geldpolitischen Maßnahmen als auch deren Zusammensetzung
sich von Land zu Land deutlich unterscheidet und in Abhängigkeit von der Spezifität
und Struktur der jeweiligen Wirtschaft sowie der ökonomischen Zielsetzung realisiert
wird. So versuchte z. B. Fed und die Bank of England mittels umfangreicher
Wertpapierkäufe Einfluss auf die Zinsstrukturkurve zu nehmen und somit die
Wirtschaftsaktivität anzukurbeln. Dagegen fokussierten sich Europäische Zentralbank
und die Bank of Japan vor allem auf die Wiederbelebung des beeinträchtigten
Kreditmarkts und angeschlagenen Bankensektors. Dafür haben die Zentralbanken
dieser beiden Länder verstärkt eine Reihe von Liquiditätsmaßnahmen betrieben. Dies
erfolgte zum Ziel, durch ausgiebige Liquiditätsversorgung die Problematik stockender
Kreditvergabe sowie die Störung auf dem Interbankenmarkt zu eliminieren und somit
die Realwirtschaft zum Aufschwung zu bringen.
Bei der Beurteilung von Effekten von QE auf die ausgewählten Wirtschaftsfaktoren
wurde deutlich, dass Stärke dieser Effekte von bestimmten Merkmalen dieser
Wirtschaftsfaktoren abhängt. Demnach führten Verzögerungseffekt von Inflation,
strukturelle Unterschiede der Arbeitsmärkte der Zielländer sowie die verschiedene
Zusammenstellung und Ausmaß der Wertpapierkäufe durch Zentralbanken zur
unterschiedlichen Entwicklung von Inflation, Arbeitslosigkeit, Bruttoinlandsprodukt
und Spreads.
Schließlich wurde erkennbar, dass QE als ein effektives Instrument zur Verbesserung
der makroökonomischen Indikatoren wie Inflation, BIP und Spreads eingesetzt
werden kann. Jedoch konnte der Einfluss von QE auf die Verbesserung der
Arbeitslosigkeit und des Arbeitsmarktes nicht eindeutig festgestellt werden. Denn
Beschäftigung stellt eine komplexe Funktion dar, die von der Integrität des
Arbeitsmarktes abhängig ist und von diversen Faktoren getrieben wird, welche unter
den Ländern inkonsistent sein können.
XIII
Summary
The main focus of this work is dedicated to the assessment of the effect of the most
controversial unconventional monetary measures - quantitative easing (QE) on
selected macroeconomic and financial indicators of the four economically most
powerful countries such as United States, Eurozone, United Kingdom and Japan. The
work is aimed at evaluating the effectiveness of implementation of QE in combating
economical downturn and other devastating consequences derived from Great
Recession and banking crisis.
At the beginning of this master thesis there is outlined the main aspects of evolution
of quantitative easing as a tool for conducting the monetary policy. Thereby, the work
provides description of global economic development as a result of financial crisis,
difference between conventional and unconventional monetary policy measures,
difference between Quantitative Easing and Credit Easing, as well as main
transmission channels of QE and extensive development of central bank balance
sheets of the selected countries in response to the financial crisis.
Given the structural differences of economy and financial systems across the
countries, this master thesis focuses on the provision of an extensive description of
the economic environment, along with severe deterioration of macroeconomic and
financial indicators e.g. inflation, GDP growth, unemployment, and spreads observed
in the selected countries during the financial crisis. Furthermore, in the following
there is described a wide range of monetary policy measures applied by major central
banks in response to the economic meltdown. Consequently, there is analyzed and
presented the overview over the relevant empirical research studies, which were
conducted to investigate the effectiveness of QE on economic and financial markets,
along with their empirical models and generated results.
At the end of this work, effects, presented in the models previously, will be captured
by measuring their effectiveness based on a comprehensive analysis of selected key
economic and financial factors including inflation, unemployment, GDP growth and
spreads. Finally, relying on the previous analysis, the thesis will highlight the most
evident conclusions.
XIV
Overall the work shows that intensity of the application of unconventional measures
and the their composition vary across countries. The realization of those
unconventional measures depend on specificity, structure of a particular economy as
well as economic goal pursued. Thus, while U.S. and UK attempt to achieve
economic and financial recovery by applying extended large-scale asset purchase
programs (LSAPs) and affecting actively yield curve, ECB and Japan apply a wide
range of programs supporting liquidity and lending in an effort to eliminate existing
disturbances and to stimulate economy.
When analyzing the effects of QE, the work faces several issues. Thus, the assessment
faces inflation time lag between monetary action and final impact on the output,
structural differences in labor market across selected countries and diverse structure
and size of asset purchases. In particular, these issues lead to different developments
of the key indicators such as inflation, unemployment, GDP growth and spreads.
Finally, the impact of QE on selected macro economic and financial factors,
particularly inflation, GDP growth and spreads proves to be an effective instrument.
However, the effect of QE on enhancement of unemployment and labor market is not
clearly determined. Consequently, the link between the effects of QE and
unemployment proves to be very complex and multi-faceted. Thus, a sustainable
influence on employment and labor market depicts a function of a number of factors
such as the unemployment drivers and integrity of the labor market.

XV
Bibliography
Abbas, Ali, S./ Osorio Buitron, Carolina/ Denis, Stephanie/ Ishi, Kotaro/ Lama,
Ruy/ Norat, Mohamed (2014): United Kingdom, International Monetary Fund, IMF
Country Report No. 14/234/ July 2014, p. 5-64, Access on 08.02.2014 via
http://www.imf.org/external/pubs/ft/scr/2014/cr14234.pdf.
Altavilla, Carlo/ Giannone, Domenico/ Lenza, Michele (2014): The Financial and
Macroeconomic Effect of OMT Announcement, in: European Central Bank Working
Paper Series No 1707/ August 2014, p. 1-23, Access on 27.02.2014 via
file:///Users/secret/Quantative%20Easing/2014/4.chapter_effects/ecbwp1707.pdf.
Andolfatto, David/ Li, Li (2014): Quantitative Easing in Japan: Past and Present, in:
Federal Reserve Bank of St. Louis, Economic Synopses, Number 1/ January 2014, p.
1-2, Access on 23.02.2015 via
http://research.stlouisfed.org/publications/es/14/ES_1_2014-01-10.pdf.
Armantier, Olivier/ Krieger, Sandra/ McAndrews, James (2008): The Federal
Reserve’s Term Auction Facility, in: Federal Reserve Bank of New York, Current
Issues in Economics and Finance, Volume 14, Number 5/ July 2008, p. 1-11, Access
on 26.01.2015 via http://www.newyorkfed.org/research/current_issues/ci14-5.pdf.
Astley, Mark/ Giese, Julia/ Hume, Michael/ Kubelec, Chris (2009): Global
Imbalances and the Financial Crisis, in: Bank of England, Quarterly Bulletin
Emerging Market Economies Articles, Quarterly Bulletin 2009 Q3, p. 178-190,
Access on 02.02.2015 via
http://www.bankofengland.co.uk/publications/Documents/quarterlybulletin/qb090301
.pdf.
Bank of England (2008a): Coordinated Central Bank Action to Improve US$
Liquidity, News Release/ 18 September 2008, p. 1-2, Access on 04.02.2015 via
http://www.bankofengland.co.uk/archive/Documents/historicpubs/news/2008/054.pdf
XVI
Bank of England (2008b): Inflation Report November 2008, p. 5-52, Access on
05.02.2015 via
http://www.bankofengland.co.uk/publications/Documents/inflationreport/ir08nov.pdf.
Bank of England (2009a): Inflation Report February 2009, p. 5-55, Access on
05.02.2015 via
http://www.bankofengland.co.uk/publications/Documents/inflationreport/ir09feb.pdf.
Bank of England (2009b): Inflation Report November 2009, p. 5-52, Access on
08.02.2015 via
http://www.bankofengland.co.uk/publications/Documents/inflationreport/ir09nov.pdf.
Bank of England (2009c): Special Liquidity Scheme/ 3 February 2009, p. 1-2,
Access on 04.02.2015 via
http://www.bankofengland.co.uk/markets/Documents/marketnotice090203c.pdf.
Bank of England (2010): Inflation Report November 2010, p. 5-53, Access on
12.02.2015 via
http://www.bankofengland.co.uk/publications/Documents/inflationreport/ir10nov.pdf.
Bank of England (2012/2013): Annual Report 2012/2013, Bank of England Asset
Purchase Facility Fund Limited, p. 1-13, Access on 21.03.2015 via
http://www.bankofengland.co.uk/publications/Documents/other/markets/apf/boeapfan
nualreport1307.pdf.
Bank of England (2013): Monetary Policy Trade-offs and Forward Guidance/
August 2013, p. 5-44, Access on 06.02.2015 via
http://www.bankofengland.co.uk/publications/Documents/inflationreport/2013/ir13au
gforwardguidance.pdf.
Bank of England (2013/2014): Annual Report 2013/2014, Bank of England Asset
Purchase Facility Fund Limited, p. 1-13, Access on 21.03.2015 via
http://www.bankofengland.co.uk/publications/Documents/other/markets/apf/boeapfan
nualreport1407.pdf.

XVII
Bank of England: U.S. Dollar Repo Operations, Access on 04.02.2015 via
http://www.bankofengland.co.uk/markets/Pages/other/dollarrepo/default.aspx.
Bank of England: Quantitative easing - Frequently asked questions, Access on
05.02.2015 via
http://www.bankofengland.co.uk/monetarypolicy/Pages/qe/qe_faqs.aspx.
Bank of England: Asset Purchase Facility, Access on 06.02.2015 via
http://www.bankofengland.co.uk/markets/Pages/apf/default.aspx.
Bauer, Michael D./ Rudebusch, Glenn D. (2013): The Signaling Channel for
Federal Reserve Bond Purchases, Federal Reserve Bank of San Francisco, Working
Paper Series 2011-21/ April 2013, p. 1-37, Access on 10.05.2015 via
http://www.frbsf.org/economic-research/files/wp11-21bk.pdf.
Baumeister, Christiane/ Benati, Luca (2010): Unconventional Monetary Policy and
the Great Recession Estimating The Impact of Compression in the Yield Spread at the
Zero Lower Bound, European Central Bank Working Paper Series NO 1258/ October
2010, p. 4-33, Access on 27.02.2015 via
https://www.ecb.europa.eu/pub/pdf/scpwps/ecbwp1258.pdf.
Beirne, John/ Dalitz, Lars/ Ejsing, Jacob/ Grothe, Magdalena/ Manganelli,
Simone/ Monar, Fernando/ Sahel, Benjamin/ Sušec, Matjaž/ Tapking, Jens/
Vong, Tana (2011): The Impact of the Eurosystem’s Covered Bond Purchase
Programme on the Primary and Secondary Markets, European Central Bank
Occasional Paper Series NO 122/ January 2011, p. 4-33, Access on 08.10.2015 via
http://www.ecb.europa.eu/pub/pdf/scpops/ecbocp122.pdf.
Bell, David N.F., Blanchflower, David G. (2010): UK Unemployment in the Great
Recession, National Institute Economic Review No. 214/ October 2010, access on
03.02.2015 via http://www.dartmouth.edu/~blnchflr/papers/Bell-Blanchflower.pdf.

XVIII
Berkmen, Pelin, S. (2012): Bank of Japan’s Quantitative and Credit Easing: Are
They Now More Effective?, International Monetary Fund Asia and Pacific
Department, IMF Working Paper 12/2, p. 2-16, Access on 21.02.2015 via
http://www.imf.org/external/pubs/ft/wp/2012/wp1202.pdf.
Bernanke, Ben S. (2008): Federal Reserve Policies in the Financial Crisis, Chairman
Speech, Board of Governors of Federal Reserve System/ December 2008, Access on
19.06.2014 via
http://www.federalreserve.gov/newsevents/speech/bernanke20081201a.htm.
Bernanke, Ben S. (2009): The Crisis and the Policy Response, Chairman Speech,
Board of Governors of Federal Reserve System / January 2009, Access on 19.03.2014
via http://www.federalreserve.gov/newsevents/speech/bernanke20090113a.htm.
Berrospide, Jose (2013): Bank Liquidity Hoarding and the Financial Crisis: An
Empirical Evaluation, Federal Reserve Board, Washington, Divisions of Research &
Statistics and Monetary Affairs, Finance and Economics Discussion Series/
November 2012, p. 1-41, Access on 14.07.2014 via
http://www.federalreserve.gov/pubs/feds/2013/201303/201303pap.pdf.
Blinder, Alan S. (2010): Quantitative Easing: Entrance and Exit Strategies, in:
Federal Reserve Bank of St. Louis Review, November/ December 2010, 92(6), p.
465-79, Access on 23.01.2015 via
https://research.stlouisfed.org/publications/review/10/11/Blinder.pdf.
Bowdler, Christopher/ Radia, Amar (2012): Unconventional monetary policy: the
Assessment, in: Oxford Review of Economic Policy, Volume 28, Number 4/ 2012, p.
603–621, Access on 10.04.2015 via
http://oxrep.oxfordjournals.org/content/28/4/603.full.pdf+html.
Brayton, Flint/ Laubach, Thomas/ Reifschneider, David (2014): The FRB/US
Model: A Tool for Macroeconomic Policy Analysis, Board of Governors of the
Federal Reserve System, Feds notes/ April 2013, Access on 14.02.2015 via
http://www.federalreserve.gov/econresdata/notes/feds-notes/2014/a-tool-for-
macroeconomic-policy-analysis.html.
XIX
Brückner, Markus/ Tuladhar, Anita (2010): Public Investment as a Fiscal
Stimulus: Evidence from Japan’s Regional Spending During the 1990s, International
Monetary Fund, Fiscal Affairs Department, IMF Working Paper/ 10/110, p. 4-30,
Access on 09.02.2015 via
https://www.imf.org/external/pubs/ft/wp/2010/wp10110.pdf.
Casaux, Suzanne/ Turrini, Alessandro (2011): Post-crisis Unemployment
Developments:U.S. and EU approaching?, European Commission, Directorate-
General for Economic and Financial Affairs, ECFIN Economic Brief, Issue 13/ May
2011, Access on 11.01.2015 via
http://ec.europa.eu/economy_finance/publications/economic_briefs/2011/pdf/eb13_en
.pdf.
Chapman, John L. (2011): The Importance of a Well-Functioning Monetary System
to Capital Markets and Wealth Creation, Alhambra Investment Partners/ November
2010, Access on 02.04.2014 via http://www.alhambrapartners.com/2011/11/21/the-
importance-of-a-well-functioning-monetary-system-to-capital-markets-and-wealth-
creation/.
Chen, Han/ Curdia, Vasco/ Ferrero, Andrea (2012): The Macroeconomic Effects
of Large-Scale Purchase Programmes, in: the Economic Journal, 122/ November
2012, p. 289–315, Access on 26.02.2015 via
file:///Users/secret/Downloads/Chen_et_al-2012-The_Economic_Journal.pdf.
Chen, Qianying/ Filardo, Andrew/ He, Dong/ Zhu, Feng (2011): International
Spillovers of Central Bank Balance Sheet Policies, Hong Kong Monetary Authority
and Bank for International Settlements/ November 2011, p. 1-49, Access on
17.03.2015 via http://www.bis.org/events/cbbsap/chenfilardohezhu.pdf.
Chung, Hess/ Laforte, Jean-Philippe/ Reifschneider, David/ Williams, John, C.
(2010): Have We Underestimated the Likelihood and Severity of Zero Lower Bound
Events? Federal Reserve Bank Of San Francisco, Working Paper Series 2011-01/
January 2011, p. 1-56, Access on 01.03.2015 via http://www.frbsf.org/economic-
research/files/wp11-01bk.pdf.
XX
Chung, Hesse/ Laforte, Jean-Phillipe/ Reifschneider, David/ Williams, John, C.
(2011): Estimating the Macroeconomic Effects of the Fed’s Asset Purchases, in:
Federal Reserve Bank of San Francisco, FRBSF Economic Letter 2011-03/ January
2011, p. 1-5, Access on 18.02.2015 via http://www.frbsf.org/economic-
research/publications/economic%20letter/2011/january/macroeconomic-effects-fed-
asset-purchases/el2011-03.pdf.
Chowla, Shiv/ Quaglietti, Lucia/ Rachel, Łukasz (2014): How have world shocks
affected the UK economy? Bank of England, Bank’s International Economic Analysis
Division, in: Topical Articles, Quarterly Bulletin 2014 Q2, p. 167-179, Access on
02.02.2015 via
http://www.bankofengland.co.uk/publications/Documents/quarterlybulletin/2014/qb1
4q206.pdf.
Cœuré, Benoît (2013): The Usefulness of Forward Guidance, European Central Bank
Speeches/ September 2013, Access on 14.07.2014. via
http://www.ecb.europa.eu/press/key/date/2013/html/sp130926_1.en.html.
Constâncio, Vítor (2015): 2015 U.S. Monetary Policy Forum Panel discussion on
Central Banking with Large Balance Sheets, European Central Bank/ February 2015,
Access on 23.03.2015 via
https://www.ecb.europa.eu/press/key/date/2015/html/sp150227.en.pdf?67d22bd0967e
f0cfc97778b23fd2635e.
Cross, Michael/ Fisher, Paul/ Olaf, Weeken (2010): The Bank’s Balance Sheet
during the Crisis, Bank of England, in: Quarterly Bulletin 2010 Q1, p. 34-42, Access
on 04.02.2015 via
http://www.bankofengland.co.uk/publications/Documents/quarterlybulletin/qb100102
.pdf.
Demary, Markus/ Matthes, Jürgen (2013): EZB auf Abwegen? Teil 1: Die
unkonventionelle Geldpolitik der EZB – eine Bestandsaufnahme, Institut der
deutschen Wirtschaft Köln, in: IW policy paper 13/ 2013, p. 1-45, Access on
18.06.2014 via http://www.iwkoeln.de/en/studien/iw-policy-papers/beitrag/markus-
demary-juergen-matthes-die-ezb-auf-abwegen-127105.

XXI
Dimsdale, Nicholas H. (2009): The Financial Crisis of 2007–9 and the British
Experience, The Queen’s College, Oxford University, in: Oxonomics 4, 2009, p. 1-9,
Access in 01.012.2015 via http://onlinelibrary.wiley.com/doi/10.1111/j.1752-
5209.2009.00026.x/pdf.
Dodd, Randall/ Mills, Paul (2008): Outbreak: U.S. Subprime Contagion, in: Finance
and Development, A quarterly magazine of IMF, Volume 45, Number 2/ June 2008,
Access on 12.01.2015 via
http://www.imf.org/external/pubs/ft/fandd/2008/06/dodd.htm.
Draghi, Mario (2015): Introductory statement to the press conference (with Q&A),
European Central Bank/ 22 January 2015, Access on 20.02.2015 via
http://www.ecb.europa.eu/press/pressconf/2015/html/is150122.en.html.
Eser, Fabian/ Schwaab, Bernd (2013): Assessing Asset Purchases within the ECB´s
Securities Market Programme, European Central Bank Working Paper Series No
1587/ September 2013, Access on 11.01.2015 via
http://www.ecb.europa.eu/pub/pdf/scpwps/ecbwp1587.pdf.
Engen, Eric/ Laubach, Thomas/ Reifschneider, Dave (2014): The Macroeconomic
Effects of the Federal Reserve’s Unconventional Monetary Policies, Federal Reserve
Board/ December 2014, p. 1-54, Access on 18.03.2015 via
file:///Users/secret/Downloads/MacroeconomicEffectsOfTheFederalRes_preview.pdf.
European Central Bank: Monetary Policy Instruments, Access on 12.06.2014 via
http://www.ecb.europa.eu/mopo/implement/intro/html/index.en.html.
European Central Bank: Key ECB Interest Rates, Access on 12.01.2015 via
https://www.ecb.europa.eu/stats/monetary/rates/html/index.en.html.
European Central Bank: Open Market Operations, Access on 23.12.2014 via
http://www.ecb.europa.eu/mopo/implement/omo/html/index.en.html.

XXII
European Central Bank: Government debt (consolidated) (as % of GDP), in:
Statistical Data Warehouse, Access on 16.03.2015 via
http://sdw.ecb.europa.eu/quickview.do?SERIES_KEY=GFS.Q.N.I7.W0.S13.S1.C.L.
LE.GD.T._Z.XDC_R_B1GQ_CY._T.F.V.N._T&
European Central Bank (2009a): Decision of the European Central Bank of 2 July
2009 on the Implementation of the Covered Bond Purchase Programme
(ECB/2009/16) (2009/522/EC), in: Official Journal of the European Union/ July 2013,
p. 1-175, Access on 11.01.2015 via
https://www.ecb.europa.eu/ecb/legal/pdf/l_17520090704en00180019.pdf?d74bb43a6
071db357e77cc2439415ebe.
European Central Bank (2009b): Governing council decision on non-standard, in: ECB’s Monthly Bulletin/ June 2009, p. 5-96, Access on 10.06.2014 via
https://www.ecb.europa.eu/pub/pdf/mobu/mb200906en.pdf
European Central Bank (2010a): Monetary Policy Transmission in the Euro Area, a
Decade after Introduction of the Euro, in: ECB’s Monthly Bulletin/ May 2010,
Access on 22.07.2014 via https://www.ecb.europa.eu/pub/pdf/mobu/mb201005en.pdf.
European Central Bank (2010b): The ECB´s response to the financial crisis, in:
ECB’s Monthly Bulletin/ October 2010, p. 5-74, Access on 11.01.2015 via
https://www.ecb.europa.eu/pub/pdf/mobu/mb201010en.pdf
European Central Bank (2011): 3 November 2011-ECB announces details of its
new Covered Bond Purchase Programme (CBPP2), Press Release, November 2011,
Access on 09.01.2015 via
http://www.ecb.europa.eu/press/pr/date/2011/html/pr111103_1.en.html.
European Central Bank (2012a): Comparing the recent financial crisis in the United
States and the Euro Area with the experience of Japan in the 1990s, in: ECB´s
Monthly Bulletin/ May 2012, p. 5-112, Access on 14.01.2014 via
http://www.ecb.europa.eu/pub/pdf/mobu/mb201205en.pdf.
XXIII
European Central Bank (2012): 6 September 2012-Technical features of Outright
Monetary Transactions, Press Release/ September 2012, Access on 10.01.2015 via
https://www.ecb.europa.eu/press/pr/date/2012/html/pr120906_1.en.html.
European Central Bank (2013): Collateral eligibility requirements a comparative
study across specific frameworks, in: ECB Report of collateral frameworks/ July
2013, p. 4-75, Access on 12.12.2014 via
https://www.ecb.europa.eu/pub/pdf/other/collateralframeworksen.pdf.
European Central Bank (2014a): The determinants of euro area sovereign bond
yield spreads during the crisis, Monthly Bulletin May 2014, p. 5-100, Access on
06.01.2015 via https://www.ecb.europa.eu/pub/pdf/mobu/mb201405en.pdf.
European Central Bank (2014): 2 October 2014 - ECB announces operational
details of Asset-Backed Securities and Covered Bond Purchase Programmes, Access
on 09.01.2015 via
http://www.ecb.europa.eu/press/pr/date/2014/html/pr141002_1.en.html
European Central Bank (2014): Introductory statement to the press conference
(with Q&A), Mario Draghi, Frankfurt am Main/ December 2014, Access on
21.01.2015 via
https://www.ecb.europa.eu/press/pressconf/2014/html/is141204.en.html.
European Central Bank (2014): Unemployment in the euro area, Speech by Mario
Draghi/ August 2014, Access on 20.03.2015 via
https://www.ecb.europa.eu/press/key/date/2014/html/sp140822.en.html.
European Central Bank (2015): Measuring Inflation in the Euro Area: The
Harmonised Index of Consumer Prices (HICP)- Annual Percentage change, Access on
18.01.2015 via https://www.ecb.europa.eu/stats/prices/hicp/html/inflation.en.html.
European Central Bank (2015): Tasks, Access on 12.01.2015 via
https://www.ecb.europa.eu/ecb/tasks/html/index.en.html.

XXIV
European Central Bank (2015): 22 January 2015 - ECB announces expanded Asset
Purchase Programme, Press Release, Access on 01.02.2015 via
https://www.ecb.europa.eu/press/pr/date/2015/html/pr150122_1.en.html.
Eurostat (2013): April 2013 Euro area unemployment rate at 12.2% EU27 at 11.0%,
in: Eurostat newsreale euroindicator STAT/13/81/ May 2013, Access on 20.03.2015
via file:///Users/secret/Downloads/STAT-13-82_EN.pdf.
Eurostat (2014): Unemployment rate, 2002-2013 (%), in: Eurostat Statistics
explained/ May 2014, Access on 24.03.2015. via
http://ec.europa.eu/eurostat/statistics-
explained/index.php/File:Unemployment_rate,_2002-2013_(%25).png.
European Commission (2009): European Economic Forecast-Autumn 2009,
European Economy10/ 2009, Access on 12.01.2015 via
http://ec.europa.eu/economy_finance/publications/publication16055_en.pdf.
European Commission (2014winter): European Economic Forecast-winter 2014,
European Economy2|2014, Access on 18.01.2015 via
http://ec.europa.eu/economy_finance/publications/european_economy/2014/pdf/ee2_e
n.pdf.
European Commission (2014autumn): European Economic Forecast-autumn 2014,
European Economy7/ 2014, ISSN 1725-3217, Access on 03.04.2015
http://ec.europa.eu/economy_finance/publications/european_economy/2014/pdf/ee7_e
n.pdf.
European Parliament (2014): The (not so) Unconventional Monetary Policy of the
European Central Bank since 2008, Directorate General for Internal Policy
Department A: Economic and Scientific Policy, June 2014, Access on 28.02.2015 via
file:///Users/secret/Downloads/The%20(not%20so)%20Unconventional%20Monetary
%20Policy%20of%20the%20European%20Central%20Bank%20since%202008%20(
English)%20(1).pdf.

XXV
Fawley, Brett, W./ Neely, Christopher, J. (2013): Four stories of Quantitative
Easing, Federal Reserve Bank of St. Louis/ January/February 2013, 95(1), p. 51-88,
Access on 14.05.2014 via
http://research.stlouisfed.org/publications/review/13/01/Fawley.pdf.
Federal Reserve (2009a): Term Auction Facility Questions and Answers/ January
2009, Access on 23.10.2015 via
http://www.federalreserve.gov/monetarypolicy/files/TAFfaq.pdf.
Federal Reserve (2009): Press Release/ August 12 2009, Access on 17.12.2014 via
http://www.federalreserve.gov/newsevents/press/monetary/20090812a.htm.
Federal Reserve Bank of New York: Primary Dealers List, Access on 05.08.2014
via http://www.newyorkfed.org/markets/pridealers_current.html.
Federal Reserve Bank of New York (2009): Term Securities Lending Facility:
Program Terms and Conditions/ June 2009, Access on 05.08.2014 via
http://www.newyorkfed.org/markets/tslf_terms.html.
Federal Reserve (2012): Press Release/ September 13 2012, Access on 01.02.2015
via http://www.federalreserve.gov/newsevents/press/monetary/20120913a.htm
Federal Reserve System (2012): Minutes of the Federal Open Market Committee/
December 12 2012, Access on 01.02.2015 via
http://www.federalreserve.gov/monetarypolicy/fomcminutes20121212.htm.
Federal Reserve (2013): Maturity Extension Program and Reinvestment Policy/
August 2013, Access on 01.02.2015 via
http://www.federalreserve.gov/monetarypolicy/maturityextensionprogram.htm.
Federal Reserve (2013): Open Market Operations/ February 2013, Access on
14.06.2014 via
http://www.federalreserve.gov/monetarypolicy/openmarket.htm.
XXVI
Federal Reserve Bank of St. Louis (2013): The Troubled Asset Relief Program-Five
Years Later/ Fall 2013, Access on 03.02.2015 via
https://www.stlouisfed.org/publications/central-banker/fall-2013/the-troubled-asset-
relief-programfive-years-later.
Federal Reserve Bank St. Louis (2014): Inflation, consumer prices for the United
States/ September 2014, Access on 24.01.2015 via
http://research.stlouisfed.org/fred2/series/FPCPITOTLZGUSA.
Federal Reserve Bank of San Francisco (2014): U.S. Monetary Policy: An
Introduction. Part 3: How does monetary policy affect the U.S. economy?, in: FRBSF
Economic Paper Number 2004-03/ January 2004, p. 1-3, Access on 20.03.2015 via
http://www.frbsf.org/economic-research/files/el2004-03.pdf.
Federal Reserve (2014a): Transcript of Chair Yellen’s FOMC Press Conference/
December 17 2014, Access on 21.01.2015 via
http://www.federalreserve.gov/mediacenter/files/FOMCpresconf20141217.pdf.
Federal Reserve (2014): Primary Dealer Credit Facility (PDCF)/ December 2014,
Access on 21.01.2015 via
http://www.federalreserve.gov/newsevents/reform_pdcf.htm.
Federal Reserve (2014): Asset-Backed Commercial Paper Money Market Mutual
Fund Liquidity Facility (AMLF)/ December 2014, Access on 25.01.2015 via
http://www.federalreserve.gov/newsevents/reform_amlf.htm.
Federal Reserve (2014): Agency Mortgage-Backed Securities (MBS) Purchase
Program/ December 2014, Access on 24.01.2015 via
http://www.federalreserve.gov/newsevents/reform_mbs.htm.
Federal Reserve (2014): Central Bank Liquidity Swap Lines/ December 2014,
Access on 27.01.2015 via
http://www.federalreserve.gov/newsevents/reform_swaplines.htm.
XXVII
Federal Reserve (2014): Press Releases/ October 29 2014, Access on 02.02.2015 via
http://www.federalreserve.gov/newsevents/press/monetary/20141029a.htm.
Federal Reserve (2014): Commercial Paper Funding Facility (CPFF)/ February
2010, Access on 12.02.2015 via
http://www.federalreserve.gov/monetarypolicy/cpff.htm.
Federal Reserve Bank of St. Louis (2015): Effective Federal Funds Rate/ April
2015, Access on 23.01.2015 via
http://research.stlouisfed.org/fred2/series/FedFUNDS.
Federal Reserve Bank St. Louis (2015): Civilian Unemployment Rate/ April 2015,
Access on 24.01.2015 via http://research.stlouisfed.org/fred2/series/UNRATE.
Federal Reserve Bank of St. Louis (2015): TED Spread, in: Federal Reserve
Economic Data, April 2015, Access on 10.10.2015 via
https://research.stlouisfed.org/fred2/series/TEDRATE/.
Fein, Melanie L. (2008): The Economic Stabilization Act 2008 and Related
Government Actions in Support ofU.S. Financial System, Yale Law School/
November 2008, Access on 09.08.2014 via
http://www.law.yale.edu/documents/pdf/cbl/Fein_Economic_Stabilization.pdf.
Fisher, Paul (2012): Liquidity support from the Bank of England – the Discount
Window Facility, Bank of England, Speech by Fisher/ March 2012, Access on
01.02.2015 via http://www.bis.org/review/r120330e.pdf.
Fratzscher, Marcel/ Lo Duca, Marco/ Straub, Roland (2014): ECB
Unconventional Monetary Policy Actions: Market Impact, International Spillovers
and Transmission Channels, International Monetary Fund, 15th Jacques Polak Annual
Research Conference, Washington, DC/ November 13–14 2014, Access on
17.02.2015 via
https://www.imf.org/external/np/res/seminars/2014/arc/pdf/fratzscher_loluca_straub.p
df.
XXVIII
Friedman, Milton (1969): The Optimum Quantity Of Money/ January 2005, Access
on 20.03.2015 via
https://books.google.de/books?id=DZ9OTS6LbEcC&pg=PR7&lpg=PR7&dq=optimu
m+quantity+of+money+milton+friedman&source=bl&ots=NL0tyjA5_w&sig=06RN
pQpbr0Eu0_uieG-
kE7CyEho&hl=en&sa=X&ei=7qMmVYCYIIyusAHrtYCoDA&ved=0CEkQ6AEwB
TgK#v=snippet&q=231&f=false.
Gagnon, Joseph/ Raskin, Matthew/ Remache, Julie/ Sack, Brian (2011): The
Financial Market Effects of the Federal Reserve’s Large-Scale Asset Purchases, in:
International Journal of Central Banking, Vol. 7, No. 1/ March 2011, Access on
19.12.2014 via http://www.ijcb.org/journal/ijcb11q1a1.pdf.
Girardina, Eric/ Moussac, Zakaria (2011): Quantitative easing works: Lessons
from the unique experience in Japan 2001–2006, in: Journal of International Financial
Markets, Institutions & Money; Volume 21, Issue 4/ January 2011, p. 461– 495,
Access on 13.07.2014 via http://ac.els-cdn.com/S1042443111000059/1-s2.0-
S1042443111000059-main.pdf?_tid=4e5c6800-d892-11e4-b533-
00000aab0f01&acdnat=1427908542_9c358b16a91fe859c775830628567f63.
Glencross, Andrew (2013): The EU Response to Eurozone Crisis: Democratic
Contestation and the New Fault Lines in the European Integration, Europa-Kolleg
Hamburg, Institute for European Integration, Discussion Paper No 3/13/ July 2013,
Access on 03.01.2015 via
http://www.econstor.eu/bitstream/10419/82634/1/766849171.pdf.
González-Páramo, José, M. (2011): The ECB’s monetary policy during the crisis,
Closing Speech at the Tenth Economic Policy Conference/ October 2011, Access on
09.01.2015 via
http://www.ecb.europa.eu/press/key/date/2011/html/sp111021_1.en.html.
Hancock, Diana/ Passmore, Wayne (2010): Did the Federal Reserve´s MBS
Purchase Program lower Mortgage Rates?, Board of Governors of the Federal
Reserve System/ October 2010 Access on 26.01.2015
http://www.federalreserve.gov/pubs/feds/2011/201101/201101pap.pdf.
XXIX
Horioka, Charles Yuji (2006): The causes of Japan´s lost decade: the role of
household consumption, National Bureau of Economic Research Working Paper
12142/ March 2006, Access on 03.02.2015 via
http://www.nber.org/papers/w12142.pdf.
Ito, Takatoshi/ Mishkin, Frederic, S. (2004): Two Decades of Japanese Monetary
Policy and the Deflation Problem, National Bureau of Economic Research Working
Paper 10878/ October 2004, Access on 05.02.2015 via
http://www.nber.org/papers/w10878.pdf.
Joyce, Michael/ Lasaosa, Ana/ Stevens, Ibrahim/ Tong, Matthew (2010): The
financial market impact of quantitative easing, Bank of England Working Paper No.
393/ August 2010, Access on 10.06.2014 via
http://papers.ssrn.com/sol3/Papers.cfm?abstract_id=1638986.
Joyce, Michael/ Miles, David/ Scott, Andrew/ Vayanos, Dimitri (2012):
Quantitative Easing and Unconventional Monetary Policy-An Introduction, The
Economic Journal, 122/ November 2012 p. F271-F288, Access on 12.07.2014 via
http://onlinelibrary.wiley.com/doi/10.1111/j.1468-0297.2012.02551.x/epdf.
Kacperczyk, Marcin/ Schnabl, Philipp (2010): When Safe Proved Risky:
Commercial Paper during the Financial Crisis of 2007–2009, in: Journal of Economic
Perspectives-Volume 24, Number 1/ Winter 2010, p. 29–50, Access on 22.01.2015
via http://pages.stern.nyu.edu/~sternfin/mkacperc/public_html/commercial.pdf.
Kapetanios, George/ Mumtaz, Haroon/ Stevens, Ibrahim/ Theodoridis,
Konstantinos (2012): Assessing the economy-wide effects of quantitative easing, in:
The Economic Journal, 122/ November 2012, p. F316–F347, Access on 03.07.2014
via http://onlinelibrary.wiley.com/doi/10.1111/j.1468-0297.2012.02555.x/epdf.
Kapetanios, George/ Mumtaz, Haroon/ Stevens, Ibrahim/ Theodoridis,
Konstantinos (2012): Assessing the economy-wide effects of quantitative easing,
Working Paper No. 443, January 2012, Bank of England, p. 3-41, Access on 05.07.2014
via
http://www.bankofengland.co.uk/research/Documents/workingpapers/2012/wp443.pdf.

XXX
Keynes, John, Maynard (1936): The General Theory of Employment, Interest, and
Money, International Relationships and Security Network, ISN ETH Zürich, Primary
Sources, February 1936, p. 2-190 Access on 22.07.2014 via
http://www.google.de/url?sa=t&rct=j&q=&esrc=s&source=web&cd=2&ved=0CCoQ
FjAB&url=http%3A%2F%2Fmercury.ethz.ch%2Fserviceengine%2FFiles%2FISN%2
F125515%2Fipublicationdocument_singledocument%2F0a26b9c2-f618-4f62-a280-
4144a23330e4%2Fen%2F1366_KeynesTheoryofEmployment.pdf&ei=ddXPU5_lOej
Y7AbY3oGYDw&usg=AFQjCNE3JqRSGq8kE7S6F8dRZFaYTZi7Kg&sig2=73Kl8
tvTFb96xIPhZtX_dA&bvm=bv.71667212,d.ZGU.
Kilponen, Juha/ Laakkonen, Helinä/ Vilmunen, Jouko (2012): Sovereign risk,
European crisis resolution policies and bond yields, Bank of Finland Research
Discussion Papers 22/ 2012, p. 1.24, Access on 12.03.2015 via
http://www.suomenpankki.fi/en/julkaisut/tutkimukset/keskustelualoitteet/Documents/
BoF_DP_1222.pdf.
Koo, Richard, C. (2011): The world in balance sheet recession: causes, cure, and
politics, Nomura Research Institute, Tokyo, in: real-world economics review, issue
no. 58, p. 19-37, Access on 26.01.2015 via
http://www.paecon.net/PAEReview/issue58/Koo58.pdf.
Krogstrup, Signe/ Reynard, Samuel/ Sutter, Barbara (2012): Liquidity Effects of
Quantitative Easing on Long-Term Interest Rates, Swiss National Bank Working
Papers 2012-2, p. 1-29, Access on 12.05.2014 via
http://www.snb.ch/n/mmr/reference/working_paper_2012_02/source/working_paper_
2012_02.n.pdf.
Krugman, Paul, R. (1998): It's Baaack: Japan's Slump and the Return of the
Liquidity Trap, Brookings Papers on Economic Activity 2/ 1998, p. 137-205, Access
on 12.12.2014 via
http://www.brookings.edu/~/media/Files/Programs/ES/BPEA/1998_2_bpea_papers/1
998b_bpea_krugman_dominquez_rogoff.pdf.

XXXI
Kurihara, Yutaka (2014): Has Zero Interest Rate Policy of the Bank of Japan
Influenced Financial Markets?, Journal of Finance & Economics Volume 2, Issue 2/
2014, p. 77-85, Access on 13.02.2015 via
http://www.todayscience.org/JFE/article/jfe.v2i2p77.pdf.
Labonte, Marc (2014): Federal Reserve: Unconventional Monetary Policy Options,
Congressional Research Services/ February 2014, p. 1-33, Access on 19.03.2015 via
http://fas.org/sgp/crs/misc/R42962.pdf.
Labonte, Marc (2015): Monetary Policy and the Federal Reserve: Current Policy and
Conditions, Specialist in Macroeconomic Policy, Congressional Research Services/
February 2015, p. 1-23, Access on 11.03.2015.
https://www.fas.org/sgp/crs/misc/RL30354.pdf.
Lam, Raphael, W. (2011): Bank of Japan’s Monetary Easing Measures: Are They
Powerful and Comprehensive?, International Monetary Fund Working Paper 11/264/
November 2011, p. 2-18 Access on 14.03.2015 via
https://www.imf.org/external/pubs/ft/wp/2011/wp11264.pdf.
Lane, Philip, R. (2012): The European Sovereign Debt Crisis, in: Journal of
Economic Perspectives, Volume 26, Number 3/ Summer 2012, p. 49–68, Access on
04.01.2015 via http://pubs.aeaweb.org/doi/pdfplus/10.1257/jep.26.3.49
Lane, Philip R./ Pels, Barbara (2012): Current Account Imbalances in Europe, IIIS
Discussion Paper No. 397/ April 2012, p. 1-35, Access on 04.01.2015. via
http://www.tcd.ie/iiis/documents/discussion/pdfs/iiisdp397.pdf.
Lenza, Michel/ Pill, Huw/ Reichlin, Lucrezia (2010): Monetary Policy in
Exceptional Times, European Central Bank, Working Paper Series, No 1253/ October
2010, p. 4-38, Access on 28.02.2015 via
http://www.ecb.europa.eu/pub/pdf/scpwps/ecbwp1253.pdf.
Levine, Linda (2013): Economic Growth and the Unemployment Rate,
Congressional Research Service/ January 2013, p. 1-7, Access on 23.03.2015 via
http://fas.org/sgp/crs/misc/R42063.pdf.
XXXII
Lyonnet, Victor/ Werner, Richard (2012): Lessons from the Bank of England on
‘quantitative easing’ and other ‘unconventional’ monetary policies, International
Review of Financial Analysis, Volume 25/ December 2012, p. 94-105, Access on
13.07.2014 via http://ac.els-cdn.com/S1057521912000737/1-s2.0-
S1057521912000737-main.pdf?_tid=a9490798-d868-11e4-8e45-
00000aab0f02&acdnat=1427890655_a991a78d8fcbcd5476673dfcb4acacd8.
Makin, John H. (2008): Japan’s Lost Decade: Lessons for the United States in 2008,
American Enterprise Institute for Public Policy Research, in: Economic Outlook/
March 2008, p. 1-5, 06.02.2015. via https://www.aei.org/wp-
content/uploads/2011/10/20080225_22772EOMarch_g.pdf.
MARK Program Help File Contents: Parameter Index Matrices (PIM), Access on
15.02.2015 via
http://warnercnr.colostate.edu/~gwhite/mark/markhelp/parameter_matrices.htm.
Marshall, John (2009): The financial crisis in the US: key events, causes and
responses, House of Commons Library, Research Paper 09/34/ April 2009, p. 2-55,
Access on 13.01.2015 via
http://www.voltairenet.org/IMG/pdf/US_Financial_Crisis.pdf.
Memedovic, Olga/ Lapadre, Lelio (2009): Structural Change in the World
Economy: Main Features and Trends, United Nations Industrial Development
Organization, Working Paper 24/2009, p. 1-52, Access on 24.02.2015 via
http://www.unido.org/fileadmin/user_media/Publications/Pub_free/Structural_change
_in_the_world_economy.pdf.
Metzler, Allan H. (1995): Monetary, credit and (other) transmission processes: A
monetarist perspective, in: Journal of Economic Perspectives, Vol. 9, No. 4/ Fall
1995, p. 49-72, Access on 10.01.2015 via
http://pubs.aeaweb.org/doi/pdfplus/10.1257/jep.9.4.49.
Mishkin, Frederic, S. (1996): The Channels of Moneatry Transmission: Lessons for
Monetary Policy, National Bureau of Economic Research Working Paper Series 5464,
February 1996, p. 1-27, Access on 15.06.2014 via
http://www.nber.org/papers/w5464.pdf.

XXXIII
Mishkin, Frederic, S. (2001): Economics of Money, Banking and Financial Markets,
Sixth edition, Pearson Education, U.S., p. 3-736.
Mishkin, Frederic, S. (2010): Over the clif: from the subprime to the global financial
crisis, Working Paper 16609, National Bureau of Economic Research Working Paper
Series 16609/ December 2010, p. 1-32, Access on 23.01.2015 via
https://www0.gsb.columbia.edu/faculty/fmishkin/papers/nberwp.w16609.pdf.
Nanto, Dick, K. (2009): The Global Financial Crisis: Lessons from Japan’s Lost
Decade of the 1990s, Congressional Research Service, May 2009, Access on
04.02.2015 via http://fpc.state.gov/documents/organization/125542.pdf.
Noeth, Bryan/ Sengupta, Rajdeep (2010): Flight to Safety and U.S. Treasury
Securities, Federal Reserve Bank of St. Louis, in: The Regional Economist/ July
2010, p. 18-19, Access on 24.01.2015 via
https://research.stlouisfed.org/publications/regional/10/07/treasury_securities.pdf.
Oda, Nobuyuki/ Ueda, Kazuo (2005): The Effects of the Bank of Japan’s Zero
Interest Rate Commitment and Quantitative Monetary Easing on the Yield Curve: A
Macro-Finance Approach, Bank of Japan Working Paper Series No.05-E-6/ April
2005, p. 1-22, Access on 13.02.2015 via
http://www.boj.or.jp/en/research/wps_rev/wps_2005/data/wp05e06.pdf.
Okina, Kunio/ Shiratsuka, Shigenori (2004): Policy duration effect under zero
interest rates: an application of wavelet analysis, CESIFO Woking Paper No. 1138,
February 2004, p. 1-29, Access on 15.02.2015 via
http://papers.ssrn.com/sol3/papers.cfm?abstract_id=521402.
Okun, Arthur, M. (1962): Potential GNP: Its measurement and significance, Yale
University, Cowles Foundation Paper 190, Access on 23.03.2015 via
http://cowles.econ.yale.edu/P/cp/p01b/p0190.pdf.

XXXIV
Pablo, Agnese/ Hector, Sala (2008): Unemployment in Japan: A look at the ‘lost
decade’, IESE Business School, Universitat Aut`onoma de Barcelona, Munich
Personal RePEc Archive Paper No. 14332, September 2008, p. 1-23, Access on
09.02.2015 via http://mpra.ub.uni-muenchen.de/14332/1/MPRA_paper_14332.pdf.
Peersman, Gert (2011): Macroeconomics effects of unconventional monetary policy
in the euro area, European Central Bank, Working Paper Series No 1397/ November
2011, p. 3-33, Access on 24.02.2015 via
http://www.ecb.europa.eu/pub/pdf/scpwps/ecbwp1397.pdf.
Ricketts, Lowell, R. (2011): Quantitative Easing Explained, Research Library of the
Federal Reserve Bank of St. Louis, Economic Information letter, April 2011, Access
on 11.01.2015 via http://research.stlouisfed.org/pageone-
economics/uploads/newsletter/2011/201104.pdf.
Reszat, Beate (2003): Japan’s Financial Markets: The Lost Decade, Hamburg
Institute of International Economics, Hamburgisches Welt-Wirtschafts-Archiv
(HWWA), HWWA Discussion Paper 231, June 2003, p. 1-26, Access on 09.02.2015
via http://ageconsearch.umn.edu/bitstream/26335/1/dp030231.pdf.
Rogers, John H./ Scotti, Chiara/ Wright, Jonathan H. (2014): Evaluating Asset-
Market Effects of Unconventional Monetary Policy: A Cross-Country Comparison,
Board of Governors of the Federal Reserve System, International Finance Discussion
Papers Number 1101, March 2014, p. 1-65, Access on 01.03.2015 via
http://www.federalreserve.gov/pubs/ifdp/2014/1101/ifdp1101.pdf.
Shin, Hyun Song (2009): Reflections on Northern Rock: The Bank Run that
Heralded the Global Financial Crisis, in: Journal of Economic Perspectives, Volume
23, Number 1/ Winter 2009, p. 101-119, Access on 01.02.2015 via
http://www.princeton.edu/~hsshin/www/nrJEP.pdf.

XXXV
Shiratsuka, Shigenori (2010): Size and Composition of the Central Bank Balance
Sheet: Revisiting Japan’s Experience of the Quantitative Easing Policy, Federal
Reserve Bank of Dallas Globalization and Monetary Policy Institute, Working Paper
No. 42, January 2010, p. 1-32, Access on 12.05.2014 via
http://www.dallasfed.org/assets/documents/institute/wpapers/2010/0042.pdf.
Smaghi, Lorenzo, B. (2009): Conventional and unconventional monetary policy,
European Central Bank, Keynote lecture at the International Center for Monetary and
Banking Studies (ICMB), April 2009, Access on 10.06.2014 via
http://www.ecb.europa.eu/press/key/date/2009/html/sp090428.en.html.
Societe Generale (2013): Studies Rising public debt in Japan: How far is too far?,
Societe Generale Department of Economic, ECONOTE, No 21, November 2013,
Access on 14.02.2015 via
http://www.societegenerale.com/sites/default/files/documents/Econote/131121%20Ec
oNote_21_Japon_EN.pdf.
Southampton Business School (2014): Professor Richard Werner, Access on
21.11.2014 via https://www.sbs.ac.uk/academic-profiles/richard-werner.
Statista (2015): Gross domestic product (GDP) of the United States at current prices
from 2008 to 2018 (in billion U.S. dollars), Access on 19.01.2015 via
http://www.statista.com/statistics/263591/gross-domestic-product-gdp-of-the-united-
states/.
Szczerbowicz, Urszula (2012): The ECB unconventional monetary policies: have
they lowered market borrowing costs for banks and governments?, Centre d´études
prospectives et d´informations internationales (CEPII), No 2012-36/ December 2012,
p. 3-40, Access on 03.01.2015 via http://www.cepii.fr/PDF_PUB/wp/2012/wp2012-
36.pdf.
Thornton, Daniel, L. (2012): The U.S. Deficit/Debt Problem: A Longer-Run
Perspective, Federal Reserve Bank of St. Louis Review/ November/December 2012,
94(6), p. 441-455, Access on 25.01.2015 via
http://research.stlouisfed.org/publications/review/12/11/Thornton.pdf.

XXXVI
Takahashi, Wataru (2013): Japanese Monetary Policy: Experience from the Lost
Decades, in: International Journal of Business, 18(4)/ 2013, p. 288-306, Access on
12.03.2015 via http://www.craig.csufresno.edu/ijb/Volumes/Volume%2018/V184-
1.pdf.
Trichet, Jean-Claude (2009): The ECB’s Enhanced Credit Support, in: Cesifo
Working Paper No. 2833/ October 2009, Access on 09.01.2015 via
http://papers.ssrn.com/sol3/papers.cfm?abstract_id=1500267##.
Ugai, Hiroshi (2006): Effects of the Quantitative Easing Policy: A Survey of
Empirical Analyses, Bank of Japan Working Paper Series No.06-E-10 / July 2006, p.
1-53, Access on 27.02.2015 via
https://www.boj.or.jp/en/research/wps_rev/wps_2006/data/wp06e10.pdf.
UK Finance Yahoo UK & Ireland: FTSE 100 (^FTSE), Access on 05.02.2015 via
https://uk.finance.yahoo.com/echarts?s=^FTSE.
United States Department of the Treasury (2012): Recent U.S. economy growth in
Charts/ May 2012, p. 1-13, Access on 21.01.2015 via
http://www.treasury.gov/resource-center/data-chart
center/Documents/20120502_EconomicGrowth.pdf.
U.S. National Debt Clock (2015): The Outstanding Public Debt as of 26 Jan 2015,
Access on 26.01.2015 via http://www.brillig.com/debt_clock/.
U.S. Department of the Treasury (2015): TARP Programs, Access on 24.01.2015
via http://www.treasury.gov/initiatives/financial-stability/TARP-
Programs/Pages/default.aspx#.
Vaitilingam, Romesh (2009): Recession Britain, Findings from economic and social
research, Economic & Social Research Council, p. 2-48, Access on 08.02.2015 via
http://www.esrc.ac.uk/_images/Recession_Britain_tcm8-4598.pdf.

XXXVII
Van Rixtel, Adrian (2009): The exit from Quantitative Easing (QE): The Japanese
experience, International Financial Markets Division, Associate Directorate General
International Affairs, Bank of Spain, Access on 14.02.2015 via
http://www.law.harvard.edu/programs/about/pifs/symposia/japan/2009-
japan/briefing-book/van-rixtel.pdf.
Verick, Sher/ Islam, Iyanatul (2010): The Great Recession of 2008-2009: Causes,
Consequences and Policy Responses, Institut for the Study of Labor, Discussion
Paper No. 4934/ May 2010, p. 3-61, Access on 04.07.2014 via
http://ftp.iza.org/dp4934.pdf.
Watkins, John, P. (2014): Quantitative Easing as a Means of Reducing
Unemployment: A New Version of Trickle-Down Economics, Westminster College/
January 2014, p. 2-16, Access on 20.03.2015 via
file:///Users/secret/Downloads/UsingQuantitativeEasingToReduceUnem_preview%20
(1).pdf.
Weale, Martin/ Wieladek, Tomasz (2014): What are the macroeconomic effects of
asset purchases?, Bank of England, External MPC Unit, Discussion Paper No. 42,
April 2014, p. 2-59, Access on 27.02.2015 via
http://www.bankofengland.co.uk/research/Documents/externalmpcpapers/extmpcpape
r0042.pdf.
Werner, Richard, A. (1995): How to Create a Recovery through ‘Quantitative
Monetary Easing’, We must increase total purchasing power, Even economic growth
of 4% is possible, Economics Classroom/ September 1995, p. 1-3, Access on
09.06.2014 via
http://eprints.soton.ac.uk/340476/1/Translation_Werner_QE_Nikkei_Sep_1995_final
1.pdf.
XXXVIII
Ehrenwörtliche Erklärung
Hiermit versichere ich an Eides Statt, dass ich die vorliegende Arbeit selbstständig
und ohne die Benutzung anderer als der angegebenen Hilfsmittel angefertigt habe.
Alle Stellen, die wörtlich oder sinngemäß aus veröffentlichten und nicht
veröffentlichten Schriften entnommen wurden, sind als solche kenntlich gemacht. Die
Arbeit ist in gleicher oder ähnlicher Form oder auszugsweise im Rahmen einer
anderen Prüfung noch nicht vorgelegt worden.
Unterschrift
Frankfurt am Main, den 30.04.2015
Shanna Ruf

XXXIX
Curriculum Vitae
SHANNA RUF
Am Roetheneck 5, 60385 Frankfurt/Main, Germany +49 170 7077799 Email: [email protected]
Citizenship: German Date of birth: March 9, 1987 Place of birth: Karaganda, Kazakhstan
10/2012 – 05/2015 University of Vienna, Austria International Business Administration, Master Studies
Majors: Corporate Finance, International Management
08/2011 – 12/2011 San Diego State University, CA, USA Economics, semester abroad
Majors: Corporate Finance, Fiscal and Budgetary Policy, Public Finance, Supply Chain Management
04/2010 – 08/2012 University of Cologne, Germany Economics, Bachelor Studies
Majors: Corporate Finance, Supply Chain Management
04/2009 – 02/2010 University of Bonn, Germany Economics, Bachelor Studies
08/2014 – 12/2014 IKB Deutsche Industriebank AG, Frankfurt/Main M&A Corporate Finance Real Estate, Intern
02/2011 – 04/2011 Deutsche Telekom AG (DAX30), Bonn Dep. Group Market Research, intern (full-time)
08/2009 – 12/2009 HDI-Gerling Industrie Versicherung AG, Cologne Dep. Mathematics Technics, working student
10/2010 – 04/2013 Cologne Stock Market Association Member of the organization team
09/2009 – 09/2012 Centre for Financial Research, University of Cologne Member of the organization team
06/2008 Elisabeth-von-Thüringen Gymnasium, Cologne, („Abitur“)
PERSONAL DATA
EDUCATION
PROFESSIONAL EXPERIENCE
SELF-EMPLOYMENT
SCHOOL
secret
Rectangle
XL
Microsoft Word good skills Microsoft Excel good skills Microsoft Power Point good skills Bloomberg good skills
English fluent German mother tongue Russian mother tongue French good skills
French language, theatre, salsa, theology, travelling
Frankfurt/Main, April the 30th 2015.
IT-SKILLS
LANGUAGE SKILLS
HOBBYS/ INTERESTS