Assessment of likely Technology Maturation Pathways for...
213
Front cover information panel IEA Bioenergy: Task XX: xxxx: xx Assessment of likely Technology Maturation (ATM) Project Assessment of likely Technology Maturation Pathways for biojet production from forest residues
Transcript of Assessment of likely Technology Maturation Pathways for...
Front cover information panel
IEA Bioenergy: Task XX: xxxx: xx
Assessm
en
t o
f likely
Tech
no
log
y M
atu
rati
on
(A
TM
) P
ro
ject
Assessment of likely Technology Maturation Pathways for biojet
production from forest
residues

1
The main funders for this project were the Green Aviation Research and Development
Network (GARDN) and Boeing
Project Manager: Guy Impey (NORAM Engineering & Constructors Limited, Vancouver)
Assistant Project Manager: Susan van Dyk (University of British Columbia, Vancouver)
Contributing authors:
Susan van Dyk, Mahmood Ebadian, Jianping Su, Fraser Larock, (University of British Columbia,
Vancouver)
Yi Zhang and Jacques Monnier (CanmetENERGY-Ottawa, IETS, Natural Resources Canada)
Huamin Wang, Daniel M. Santosa, Mariefel V. Olarte, Gary Neuenschwander, Leslie J. Rotness,
Douglas C. Elliott, Corinne Drennan (Pacific Northwest National Laboratory, Richland, WA, USA)
Don O’Connor (S&T2)
Oskar Meijerinck (SkyNRG)
Alexander Burns, Christopher Reid (NORAM Engineering and Constructors Limited)
Miguel Garcia Claro (Bombardier)
Main Reviewers:
Michael Lakeman, Olivier Rolland (Boeing)
Geoff Tauvette (Westjet)
Jack Saddler (UBC)
Ira Wolff (NORAM Engineering)
If you need further information about this project, please contact:
Ira Wolff (NORAM Engineering) [email protected]
Jack Saddler (University of British Columbia) [email protected]
This report can be cited as follows: Van Dyk et al. (2019) Assessment of likely maturation pathways
for production of biojet fuel from forest residues. Vancouver, University of British Columbia
Full author list: Susan van Dyk, Mahmood Ebadian, Jianping Su, Fraser Larock, Yi Zhang, Jacques
Monnier, Huamin Wang, Daniel M. Santosa, Mariefel V. Olarte, Gary Neuenschwander, Leslie J.
Rotness, Douglas C. Elliott, Corinne Drennan, Don O’Connor, Oskar Meijerinck, Alexander Burns,
Christopher Reid, Miguel Garcia Claro, Michael Lakeman, Jack Saddler
We acknowledge the contribution of IEA Bioenergy Task 39 in hosting this report on their
website and distributing through their communication channels. The report can be
downloaded for free from the website at task39.ieabioenergy.com.
Assessment of likely Technology Maturation Pathways for production of biojet fuel (The ATM Project) March 2019
2
BACKGROUND TO THE ATM PROJECT The ATM Project was funded by GARDN to advance the development of biojet fuels in Canada.
This section provides a brief background to the challenge that formed the motivation for this project.
This section also describes the objectives of this project, the project partners and their roles, as well
as the scope of the project.
Limiting and reducing aviation greenhouse gas (GHG) emissions is a key objective of the
aviation industry, who have adopted environmental targets to reduce GHG emissions with the
achievement of carbon neutral growth from 2020 and reducing its carbon emissions by 50 per cent by
2050 compared to 2005 levels. Significant progress has been made to reduce emissions through
greater fuel efficiency including engineering improvements, technology enhancements, and advanced
operations (including efficiency improvements in air traffic management). These improvements will
continue to play a major role towards the carbon emissions reduction target, however they are not
sufficient in the context of growing air traffic. The use of biojet fuels1 are therefore critical to reach the
targets.
While five biojet fuel production technologies have been approved by ASTM for use in aviation
and more than 150,000 commercial flights have been using biojet fuels, only limited volumes of biojet
fuels are currently produced on a regular basis, and only one dedicated biojet facility is in operation
worldwide (World Energy, formerly AltAir Fuels, in Paramount, California). Virtually all of the
commercial volumes of biojet fuels currently available are produced through the hydrogenation of
lipids, including vegetable oils, tallow, used cooking oil, etc. These biofuels are known as HEFA-SPK
biojet fuels (hydroprocessed esters and fatty acids synthetic paraffinic kerosene). Although this type
of biofuel is the most available today due to the availability of feedstock and maturity level of the
technology and process, there is a need for diversifying the feedstock base in order to develop value
chains in different parts of the world. To produce sufficient volumes of biojet at low cost, which are
able to meet or exceed industry/government emissions targets, feedstocks such as sustainably
sourced biomass will have to be used. These feedstocks can include a variety of sources such as wood,
including sawdust or forest residues, agricultural waste, etc. However, technologies that are able to
use such feedstocks are still under development and have not reached commercial stage. To ensure
the long-term supply of sustainable biojet fuels, technologies that are able to utilize these feedstocks
have to be developed to commercial scale. This forms the rationale for the ATM Project, the
Assessment of likely Technology Maturation pathways to produce biojet fuels from forest residues.
Based on work carried out within the International Energy Agency Bioenergy Task 39 on
Liquid Biofuels (Karatzos et al. 2014), thermochemical technologies, based on gasification or
liquefaction of biomass, have been identified as the most likely to produce high volumes of sustainable
and competitive drop-in biofuels, including biojet.
Thermochemical liquefaction technologies, such as pyrolysis and hydrotreatment into finished
drop-in fuels were selected by this project as a target for research and development. Many challenges
remain for this technology pathway, including the upgrading of liquid intermediates into finished fuels.
While this has received a lot of attention from researchers, the focus has been on general production
of hydrocarbon fuels. Very little work has been done to examine the specific production of biojet fuels
through this pathway. This is the key focus of the ATM Project as we hope to determine whether this
1 While the term biojet fuel will be used throughout this document, the aviation industry often use the term Sustainable Aviation Fuel
(SAF). However, as this could refer to fuels from non-biomass, the term biojet fuel is preferred in this report.
Assessment of likely Technology Maturation Pathways for production of biojet fuel (The ATM Project) March 2019
3
pathway is a viable route for production of biojet fuels.
a) Description of the ATM Project
The goal of the ATM Project was to assess the potential of producing biojet fuels using
thermochemical liquefaction technologies and woody biomass as a feedstock. One of the most likely
long-term supplies of biojet will come from woody biomass and using thermochemical technologies
such as gasification and pyrolysis (the latter being broadly defined as thermochemical liquefaction in
order to include hydrothermal liquefaction and other variations such as catalytic pyrolysis). Canada is
in the fortunate position that it has considerable forest resources and an established forest products
sector that could potentially provide large volumes of sustainable feedstock to establish a Canadian
biojet industry based on thermochemical technologies. Forest residues, a waste product from
harvesting trees, are currently underutilized and available in large quantities for value-added
production of biojet fuels.
Gasification and Fischer-Tropsch is pursued by several groups/companies around the world,
but the ATM Project decided to focus on the thermochemical liquefaction platform as a potentially
cost-competitive technology if remaining technical challenges can be overcome. This technology
would make use of the available forest residue feedstock to produce biojet fuels and develop domestic
production capacity suitable to Canada.
The thermochemical liquefaction process produces a biocrude intermediate which needs to be
upgraded, e.g. via hydrotreatment, to produce biojet fuels. However, these upgrading steps still pose
significant challenges such as catalyst requirements, catalyst cost and lifespan, as well as hydrogen
requirements. These challenges present a technical obstacle to the production of biojet fuel using the
thermochemical liquefaction platform, but in addition, the economics and sustainability of various
biocrude production and upgrading routes have not been assessed. The goal of the ATM project was
therefore to:
1) Determine whether thermochemical liquefaction of forest residues and upgrading of
biocrude via a hydrotreatment approach was a feasible approach to production of
biojet fuels.
2) Elucidate the differences between biocrudes and upgraded products from fast
pyrolysis, catalytic pyrolysis and hydrothermal liquefaction in terms of upgrading
requirements and technical specifications of products.
3) Compare the differences between and effectiveness of two distinct upgrading
approaches of two laboratories, namely the Canmet-Energy Ottawa labs and the US
DoE’s Pacific Northwest National Laboratory (PNNL).
4) Based on a common feedstock supply chain chosen in British Columbia, determine
the differences in techno-economic and sustainability performance between different
technology and upgrading pathways.
5) Based on the results obtained in the project, develop a design for a demonstration
scale upgrading facility that is able to progress the domestic production of drop-in
biofuels and biojet in Canada.

Assessment of likely Technology Maturation Pathways for production of biojet fuel (The ATM Project) March 2019
4
6) Develop recommendations with regards to technical and policy considerations,
including a proposed pathway to certification, that could contribute to the
advancement of biojet production from thermochemical liquefaction technologies.
The project sourced three different types of biocrudes from different biocrude producers using
fast pyrolysis, catalytic pyrolysis and hydrothermal liquefaction technologies and then evaluated the
upgrading of such bio-oils to biojet using two different laboratories with distinct approaches to
upgrading.
Although upgrading and hydrotreatment research has been carried out by various companies,
a comprehensive study which compares/contrasts and assesses the most promising sustainable biojet
options under common criteria has not been done. The uniqueness of this work lies in addressing
both upstream and downstream challenges (a complete supply chain), covering everything from the
availability of low cost and sustainable Canadian biomass feedstocks through to the
technical/economic challenges of producing and converting biocrudes to biojet fuels (i.e. the cost and
technology risk associated with hydrotreating the various biocrudes).
After production of sufficient volumes of biojet fuel, preliminary analysis against core ASTM
standards were carried out to identify technical characteristics that will need to be addressed in a path
to certification. The results obtained in the project will be used as the basis for the design of a
Canadian biomass based biojet facility at the pilot/demonstration scale, based on optimal
economic/regional conditions.
The project is funded by the Green Aviation Research and Development Network (GARDN)
(gardn.org) and Boeing.2
2 Boeing released the following press Release in December 2015: http://boeing.mediaroom.com/2015-12-02-Boeing-
Canadian-Aviation-Industry-Launch-Sustainable-Aviation-Biofuel-Project
Assessment of likely Technology Maturation Pathways for production of biojet fuel (The ATM Project) March 2019
5
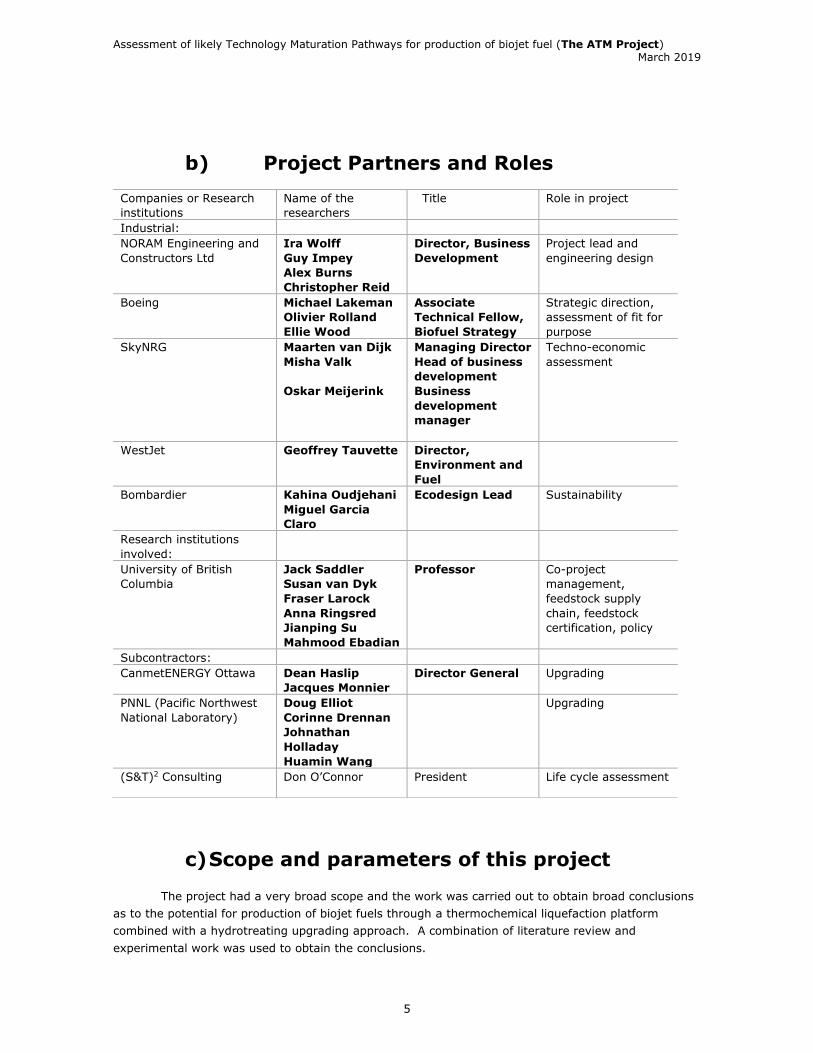
b) Project Partners and Roles
c) Scope and parameters of this project
The project had a very broad scope and the work was carried out to obtain broad conclusions
as to the potential for production of biojet fuels through a thermochemical liquefaction platform
combined with a hydrotreating upgrading approach. A combination of literature review and
experimental work was used to obtain the conclusions.
Companies or Research
institutions
Name of the
researchers
Title Role in project
Industrial:
NORAM Engineering and
Constructors Ltd
Ira Wolff
Guy Impey
Alex Burns
Christopher Reid
Director, Business
Development
Project lead and
engineering design
Boeing Michael Lakeman
Olivier Rolland
Ellie Wood
Associate
Technical Fellow,
Biofuel Strategy
Strategic direction,
assessment of fit for
purpose
SkyNRG Maarten van Dijk
Misha Valk
Oskar Meijerink
Managing Director
Head of business
development
Business
development
manager
Techno-economic
assessment
WestJet Geoffrey Tauvette Director,
Environment and
Fuel
Bombardier Kahina Oudjehani
Miguel Garcia
Claro
Ecodesign Lead
Sustainability
Research institutions
involved:
University of British
Columbia
Jack Saddler
Susan van Dyk
Fraser Larock
Anna Ringsred
Jianping Su
Mahmood Ebadian
Professor Co-project
management,
feedstock supply
chain, feedstock
certification, policy
Subcontractors:
CanmetENERGY Ottawa Dean Haslip
Jacques Monnier
Director General Upgrading
PNNL (Pacific Northwest
National Laboratory)
Doug Elliot
Corinne Drennan
Johnathan
Holladay
Huamin Wang
Upgrading
(S&T)2 Consulting
Don O’Connor President Life cycle assessment
Assessment of likely Technology Maturation Pathways for production of biojet fuel (The ATM Project) March 2019
6
Feedstock sourcing, cost and supply chain used for this project
Current biojet fuels are based on upgrading of vegetable oil feedstocks, but in order to obtain
significant volumes of biojet fuels, lignocellulosic feedstock utilization must be expanded in the long-
term. Previous work carried out by Prof Jack Saddler’s group has highlighted the significant volumes of
sustainable feedstock available in British Columbia, specifically forest residues that are currently
underutilized and burnt in slash piles. These forest residues were seen as a clear opportunity for
creating a value-added proposition for the forest sector while advancing the production of biojet fuels
in Canada. However, direct utilization of such forest residues for this project was not feasible due to
budget limitations. Sufficient funding was not available to directly source forest residues from British
Columbia, which would have required harvesting, comminution and shipping to biocrude producers in
The Netherlands, Denmark and Finland. In addition, the chosen volumes of biocrude used in this
project would have been extremely expensive to produce as a dedicated undertaking. The biocrude we
were able to obtain was routinely produced by the biocrude producers as part of their ongoing
commercial or research operations.
In order to carry out a full life cycle and techno-economic assessment on each biocrude and
upgrading approach, it was considered essential to include a notional feedstock supply chain in the
models. Data was collected on availability of a range of woody biomass feedstocks in British Columbia,
including mill residues, forest residues and wood pellets. A supply chain curve for potential Timber
Supply Areas (TSAs) was prepared to determine the estimated cost of feedstock. This information was
used to select a potential location of a biocrude production facility based on a realistic transportation
distance for feedstock (100km). A further assumption was included in the supply chain model, that the
upgrading facility will be co-located with an existing refinery for hydrogen sourcing, waste water
treatment and downstream.
Biocrudes selected for this project – technology platforms
The ATM project was based on advancing the upgrading of thermochemical liquefaction
biocrude into finished drop-in biofuels, specifically focused on biojet fuel. The main technology in this
sphere has been fast pyrolysis and this process is at commercial stage for biocrude production, but the
production of biojet fuels via this technology pathway has not been demonstrated. Some challenging
characteristics of fast pyrolysis biocrudes, including instability, high oxygen and high TAN have led to
the development of alternative thermochemical liquefaction technologies, including catalytic pyrolysis
(in situ or ex situ), hydropyrolysis and hydrothermal liquefaction. As these technologies produce
biocrude with improved characteristics, including lower oxygen, they are considered easier to upgrade
into finished biofuels as they have greater stability and require less hydrogen during upgrading.
However, most of the studies published in literature have been based on fast pyrolysis
biocrude upgrading with very limited information available on other types of thermochemical
liquefaction. Some information suggests that biocrudes based on catalytic pyrolysis and hydrothermal
liquefaction are more stable and easier to upgrade. Yet limited studies have been carried out to do a
side-by-side comparison of different thermochemical liquefaction technologies and upgrading
requirements. And no studies have incorporated comparison of technical upgrading, life cycle analysis
and techno-economic assessment. Technical upgrading requirements alone are not sufficient to
evaluate the production of drop-in biofuels and the ATM project has a unique opportunity to provide a
more complete comparative matrix.
How were specific biocrudes selected for assessment in the ATM project?
Assessment of likely Technology Maturation Pathways for production of biojet fuel (The ATM Project) March 2019
7
Companies around the world were identified that were engaged in production of biocrudes.
Due to limited availability of biocrudes, it was decided that 50L volumes were the minimum that each
upgrading laboratory should receive to allow a general analysis and characterization of fractions,
especially the biojet fraction.
Approaches were made to companies in this space to acquire a suitable volume for targeted
upgrading experiments. The ATM project had a limited budget for acquiring biocrudes as it was hoped
that companies would want to donate biocrudes in order to further the commercialization of their
technology platform into finished biofuels. However, at the start of the project it became apparent that
some companies were not interested in participating due to concerns over Intellectual Property, while
other companies were pursuing their own upgrading strategies. In addition, some of the companies
did not have the operational capacity to produce the required volumes of biocrude. Some pilot scale
facilities were shut down for upgrading and maintenance and had to be excluded.
The feedstock used by biocrude producers (from which samples were obtained) was softwood.
The assumption was made that there was sufficient similarity between feedstocks to allow for
comparison of the biocrudes and their upgrading.
Experimental work – upgrading of biocrudes
Two laboratories were engaged to carry out upgrading of biocrudes, CanmetENERGY-Ottawa,
a government research laboratory part of Natural Resources Canada; and the Pacific Northwest
National Laboratories (PNNL) in Richland, Washington.
PNNL (https://www.pnnl.gov/) has been leaders in the field of production and upgrading of
biocrudes using fast pyrolysis and hydrothermal liquefaction and their research in this area dates back
to the 1980s. PNNL has published numerous peer-reviewed papers on this subject and many reports,
including techno-economic analyses on fast pyrolysis biocrude production and upgrading for a
commercial scale facility (Jones et al. 2009; 2013; 2014; 2015;2016). PNNL has a pilot-scale
upgrading facility and extensive experience in upgrading based on a hydrotreating approach using
commercial catalysts. For fast pyrolysis biocrude upgrading, PNNL has used a two-stage approach with
an initial, low severity hydrotreatment step for stabilization of the biocrude, followed by a more severe
hydrotreatment step. PNNL was eager to become involved in the ATM Project based on the proposed
approach for assessment of biojet production potential using these technology platforms.
Canmet Laboratory in Ottawa is a national laboratory and under the leadership of Dr Jacques
Monnier, Canmet-Ottawa has developed a patented upgrading approach using a novel dispersed
molybdenum sulfide catalyst, combined with a co-processing approach (biocrudes are mixed with a
fossil feedstock such as furnace oil before upgrading) for hydrotreatment of thermochemical
liquefaction biocrudes. The lab has pilot scale upgrading facilities and extensive analytical resources
and capacity. It is envisaged that the project will provide valuable insight for Canmet to advance their
technology for building domestic biojet fuel production capacity.

Assessment of likely Technology Maturation Pathways for production of biojet fuel (The ATM Project) March 2019
8
EXECUTIVE SUMMARY Air transport accounts for approximately 2% of the global man-made carbon dioxide
(CO2) emissions. As the fastest growing transportation sector, these emissions will continue to grow.
The aviation sector has committed to carbon neutral growth from 2020 and a 50% reduction in
emissions by 2050. While improvements in technology and efficiency can contribute to these goals, it
is generally acknowledged that sustainable aviation fuels (biojet fuels) can make the biggest
contribution to these climate goals.
Such biojet fuels have to be drop-in biofuels that are functionally equivalent to existing,
conventional jet fuels and able to make use of existing infrastructure such as airplanes and fuelling
infrastructure. Drop-in biojet fuels should also deliver significant emission reductions to meet climate
objectives of the sector towards 2050. Fuels used in aircraft have to undergo strict certification
procedures under ASTM and since 2008, five technology pathways have been approved for use in
commercial airplanes.
However, current production of biojet fuels is limited, with one technology pathway,
hydrotreated esters and fatty acids (HEFA) supplying the vast majority of biojet fuels by using
feedstocks such as used cooking oil, fats and vegetable oils. High sustainability demands in the sector
limit the use of food feedstocks for biofuel production, but the supply of alternative, waste feedstocks
such as used cooking oil, fats and greases is restricted. The most feasible solution for significant
volumes of biojet fuel production is the development of technologies that can use feedstocks such as
lignocellulosic biomass, including forest residues that are available in large quantities on a global scale
and often underutilized. Thermochemical technologies based on these feedstocks have been shown to
be very promising. Gasification combined with synthesis of fuels through Fischer-Tropsch has obtained
ASTM certification for use as a biojet fuel, although commercial production of these fuels has been
slow, partly due to the very high investment costs required. The other type of thermochemical
technology, thermochemical liquefaction, produces a liquid intermediate that can be catalytically
upgraded into finished biofuels through hydrotreatment or catalytic cracking. Due to the high oxygen
content of these liquid intermediates, addition of hydrogen is generally needed for deoxygenation.
Thermochemical liquefaction technologies have not been commercially demonstrated to
produce biojet fuels and have not undergone certification under ASTM as a biojet fuel. Such fuels are
produced in two distinct stages, the production of a liquid intermediate, followed by the upgrading into
finished fuels. Commercial development of the liquid intermediate (biocrude) production has been
quite advanced, particularly fast pyrolysis that has reached small commercial stage. Other
technologies, such as catalytic pyrolysis and hydrothermal liquefaction is at a less advanced stage of
commercialization. However, the upgrading stage to produce finished fuels has been technically
challenging and the production of biojet fuels via this route has not been demonstrated.
One of the key objectives of the ATM Project was to demonstrate that biojet production
through thermochemical technologies and upgrading through hydrotreatment is feasible from a
technical perspective, but also from an economic perspective provided the right policies are
implemented. In addition, the ability of these biofuels to provide significant emission reductions was
evaluated as this is an essential component of biojet fuel development.

Assessment of likely Technology Maturation Pathways for production of biojet fuel (The ATM Project) March 2019
9
The ATM Project was a comprehensive study and included the following elements:
• A full assessment of a notional feedstock supply chain for forest residues within British Columbia
was carried out, determining availability and cost for a biocrude production facility in Prince
George, BC and an upgrading facility co-located with a refinery in the Lower Mainland.
• Three different biocrudes based on conventional fast pyrolysis, catalytic pyrolysis and
hydrothermal liquefaction was sourced and analysed.
• Upgrading of the three biocrudes was carried out using two different hydrotreatment approaches
at the Canmet-Energy laboratories (Ottawa, Canada) and PNNL laboratories in Richland,
Washington.
• After hydrotreatment, the refined biocrudes were fractionated through distillation based on boiling
point cuts to yield naphtha, jet, diesel and heavy fuel oil fractions. The fractions were
characterized through analysis, with a focus on the properties of the jet fractions compared with
general standards in ASTM D7566.
• A full life cycle assessment of the entire supply chain was carried out using GHGenius to
determine the potential emission reductions from different technology and upgrading pathways,
as well as on the full engineering design for a demonstration size facility. Recommendations were
included for optimization of pathways with respect to the LCA impact.
• A full techno-economic assessment for an entire supply chain was carried out, assessing the net
present value (NPV) and minimum fuel selling price (MFSP) of different technology and upgrading
pathways. In addition, a sensitivity analysis was carried out to identify cost elements that have
the greatest impact on the TEA.
• Engineering designs were developed out to assess the feasibility of a demonstration scale
upgrading facility in BC based on biocrude produced through a hydrothermal liquefaction process
and upgrading through hydrotreatment. Recommendations were made for optimization and
resolution of engineering uncertainties and challenges.
• The policy environment with respect to liquid biofuels and the feedstock supply and cost was
assessed within the context of current and proposed legislation and recommendations proposed.
• The overall suitability of the thermochemical technology pathways combined with hydrotreating
was assessed with respect to the quality of the jet fuel fraction and the ability to meet certification
through the ASTM D7566 should this process be initiated.
• Finally, a comparative assessment of all the technology and upgrading pathways was completed
around three key metrics: technical, LCA and TEA results.
• In conclusion, recommendations for improvements and optimization is made and the value of the
project to the Canadian aviation sector evaluated.
Assessment of likely Technology Maturation Pathways for production of biojet fuel (The ATM Project) March 2019
10
The ATM Project represents a significant achievement in advancing the knowledge and
identifying key challenges of producing biojet fuels through thermochemical liquefaction technologies.
To our knowledge, it is the first integrated study that compared technical, life cycle and techno-
economic parameters of three types of thermochemical liquefaction technologies and upgrading into
finished fuels. Current research has mainly focused on the technical challenges of biocrude production
or the upgrading challenges. While some life cycle and techno-economic assessments have been
carried out, this has been limited to individual technologies or individual upgrading methods, and
broad use of assumptions has raised questions over the real-world applicability of calculated results
for key aspects such as the minimum fuel selling price (MFSP) and carbon intensity. By carrying out
the technical upgrading of three different biocrudes: (1) using a co-processing and hydrotreatment
strategy within one laboratory (Canmet) and a (2) direct hydrotreating strategy (PNNL), direct
comparison of the three biocrudes could be carried out based on real data. This was a significant
achievement in itself as it provided an insight into the advantages and disadvantages of different
methods which has previously only been the subject of speculation.
HIGHLIGHTS OF RESULTS/ACHIEVEMENTS:
• A significant fraction of high quality biojet was produced from all three biocrudes (fast pyrolysis,
catalytic pyrolysis and hydrothermal liquefaction) using a hydrotreating approach (both methods).
The jet fraction had a reasonable quality and met many of the general ASTM specifications for jet
fuel A1, and it seems likely that all specifications could be met with further optimization. While an
ASTM spec for biojet via thermochemical liquefaction does not currently exist, the results from this
study show the feasibility and suitability of biojet production through any of these pathways.
• Based on a comprehensive life cycle analysis using GHGenius, between 50-80% reduction in GHG
emissions could be achieved with these technologies and upgrading pathways. Optimization of
technologies and upgrading pathways could result in even greater potential emission reductions.
Fast pyrolysis with two-stage hydrotreatment produced the greatest emission reduction (81%).
However, optimized HTL with single-stage, dedicated hydrotreatment could attain similar levels
(86%).
• A techno-economic analysis of the various pathways showed a minimum fuel selling price (MFSP)
between CAD1,724 - CAD3,545 per metric tonne of fuel for the different pathways. The lowest
MFSP was obtained with the HTL pathway with single-stage, dedicated hydrotreatment. Based on
current prices for conventional jet fuel (CAD855,25/MT), a premium of CAD963/MT would be
required for the lowest cost biojet. Although higher than current prices for jet fuel, the premium is
significantly lower than many other biojet pathways currently utilized, and with further
development and application at scale, the projected costs for these pathways should continue to
decrease It should be noted that the production of multiple fuel products that can be sold has a
large impact on lowering the MFSP. The NPV consistently showed the greatest sensitivity in cost
variation for the CAPEX (biocrude production), feedstock price and hydrogen price.
• Flow sheets were developed for a 200 bbl/d technology demonstration, including facilities for
biocrude production by subcritical hydrothermal liquefaction (HTL), HTL wastewater treatment by
anaerobic and aerobic biological treatment, and biocrude upgrading by hydrotreatment. The 200
bbl/d technology demonstration plant could produce enough jet fuel for up to 10 medium-haul

Assessment of likely Technology Maturation Pathways for production of biojet fuel (The ATM Project) March 2019
11
flights per day as a 10% blend. The HTL production facility and associated wastewater treatment
plant were assumed to be greenfield developments located in Prince George, BC, Canada, with
permits to discharge pre-treated wastewater to the municipal sanitary sewer. The biocrude
upgrading facility was assumed to be co-located with an existing petroleum refinery in the Lower
Mainland region of BC, Canada. This has the advantage of being able to blend the upgraded
products into the existing petroleum supply chain, as well as access to unit operations for final fuel
polishing to meet specifications.
• The location for a hypothetical biocrude production plant was chosen as Prince George, British
Columbia and a detailed analysis of the availability and cost of forest residue feedstock within the
supply area was carried out, demonstrating sufficient volumes to support a facility of the proposed
size. A delivered feedstock cost of CAD80 was estimated for a 100 km radius of the biocrude
facility.
• NPV showed a strong sensitivity to feedstock price and forest policies in BC were evaluated and
recommendations made for new policies that could have a significant impact on feedstock cost. The
way the current tenure system is structured and the requirement for burning of forest residues
presents an obstacle to broader use of these residues.
• British Columbia has a very favorable policy environment for establishing a domestic biojet sector,
including a well-developed low carbon fuel standard that has been in operation for many years.
Expansion of this policy to include aviation fuel would play an important role in promoting biojet
production and consumption, while fuel for international aviation can also be accommodated to
incentivize this sector. The flexibility imparted by Part 3 agreements within the BC regulations play
a significant role in promoting lower carbon intensity fuels and this can be further expanded to
accommodate co-processing and refinery integration. Part 3 agreements could potentially allow
earning of credits for establishment of biocrude production and other measures. Other biofuel
products, produced simultaneously with jet fuel, could currently earn credits under the regulations
based on reduction of carbon intensity of other fuel products.

Assessment of likely Technology Maturation Pathways for production of biojet fuel (The ATM Project) March 2019
12
Table of contents BACKGROUND TO THE ATM PROJECT .................................................................................. 2
EXECUTIVE SUMMARY ....................................................................................................... 8
Table of contents ............................................................................................................ 12
List of Figures ................................................................................................................ 16
List of tables .................................................................................................................. 19
CHAPTER 1 -INTRODUCTION AND LITERATURE REVIEW ....................................................... 22
1.1 The Aviation Sector and the Rationale for biojet fuel, also known as Sustainable
Aviation Fuel (SAF) ......................................................................................................... 22
1.2 Aviation Fuel Requirements, Specifications and Standards .......................... 24
1.2.1 Status of Commercial Biojet /Sustainable Aviation Fuel (SAF) Production ............ 27
1.3 Thermochemical liquefaction technologies ................................................ 29
1.4 Bio-oils/biocrudes – composition, characteristics and upgrading challenges ... 38
1.5 Upgrading bio-oils/biocrudes to transportation fuels ................................... 40
1.6 Refinery integration of liquefaction platform as an upgrading strategy .......... 47
CHAPTER 2 – FEEDSTOCK AND SUPPLY CHAIN ................................................................... 50
2.1 Availability and cost of forest residues and other lignocellulose feedstock in Canada 50
2.1.1 Lignocellulosic biomass resources in Canada ................................................... 51
2.1.2 Forest biomass resources in Canada .............................................................. 52
2.1.2.1 Sawmill residues availability and cost ......................................................... 55
2.1.2.2 Forest residues availability and cost ........................................................... 56
2.1.2.3 Wood pellets ........................................................................................... 58
2.1.2.4 Agricultural biomass availability and cost .................................................... 58
2.1.2.5 Municipal Solid Waste (MSW) availability and cost ........................................ 60
2.1.2.6 Potential forest residue availability in Western Canada .................................. 60
2.1.3 Regional biocrude supply chain scenario ........................................................ 64
2.1.4 Feedstock Conclusions ................................................................................ 68
2.2 Potential policy and economic tools to increase access and use of BC forest residues for bioenergy and biofuels production ..................................................................................... 69
2.2.1 Introduction .............................................................................................. 69
2.2.2 Economic challenges of increasing BC forest residue use .................................. 71
2.2.3 Provincial regulations and limitations ............................................................. 72
2.3 Expanding the use of forest residues for bioenergy and biofuels ........................... 73
2.3.1 Policy alternatives for expanded use of residues .............................................. 73
2.3.2 Potential policy and economic tool alternatives ............................................... 73
2.3.2.1 Carbon Pricing......................................................................................... 73
2.3.2.2Regulation changes if a BC forest residue supply chain was to be established .... 74
2.3.2.3 Wildfire management ............................................................................... 75

Assessment of likely Technology Maturation Pathways for production of biojet fuel (The ATM Project) March 2019
13
2.3.2.4 Operational regulations that would be required to support diverse uses of forest biomass ........................................................................................................................ 75
2.3.2.5 Downstream incentives that could be used to raise the value of BC forest residues ................................................................................................................................... 76
2.3.3 Sustainability certification of forest residues in BC ........................................... 77
2.3.3.1 Forest management certification ................................................................ 78
2.3.3.2 Sustainability considerations of harvesting additional forest biomass ............... 78
2.3.3.3 Extending forest certification systems for bioenergy and biofuels markets ........ 79
2.4 Source and cost of hydrogen for production of biojet fuel .................................... 81
CHAPTER 3 – BIOCRUDES – SOURCES, PRODUCTION AND CHARACTERISATION ..................... 82
3.1 Bio-oil Production ................................................................................. 82
3.1.1 Fast Pyrolysis ............................................................................................ 82
3.1.2 Catalytic Pyrolysis ...................................................................................... 84
3.1.3 Hydrothermal Liquefaction ........................................................................... 85
3.2 Characterisation of biocrudes (results of analysis) ..................................... 87
3.3 CanmetENERGY-Ottawa upgrading ................................................................... 88
3.3.1 Canmet upgrading results ......................................................................... 90
3.3.1.1 Preparation of biocrude feed blends ............................................................ 90
3.3.1.2 Distillation, fractionation and characterisation .............................................. 91
3.3.1.3 Biogenic carbon content in oil products ....................................................... 91
3.3.2 Summary of CE-O results .......................................................................... 94
3.4 PNNL upgrading .................................................................................... 96
3.4.1 Characterization of biocrude feedstocks ......................................................... 96
3.4.2 Hydrotreating of the Biocrudes ..................................................................... 99
CHAPTER 4 - ENVIRONMENTAL SUSTAINABILITY, EMISSIONS AND LIFE CYCLE ANALYSIS ....... 112
4.1 General background to Sustainability considerations of biojet fuels.............. 112
4.1.1Biojet Fuels and emission reductions within the aviation industry ..................... 112
4.1.1.1 ICAO perspective ................................................................................... 113
4.1.1.2 Airlines perspective ................................................................................ 114
4.1.4 Current regulatory and voluntary certification standards ................................ 115
4.1.5 Key aspects of sustainability ...................................................................... 118
4.2 Life cycle analysis and results of the ATM Project .............................................. 119
4.2.1 Forest Residues and the impact of current policy on slash burning ................... 121
4.2.2 Biocrudes used in the ATM Project .............................................................. 122
4.2.3Biocrude Upgrading and comparison of refined biocrudes ................................ 123
4.2.3.1 PNNL pathway comparison ...................................................................... 124
4.2.3.2 Canmet pathway Comparison .................................................................. 125
4.2.4Opportunities for Improvements .................................................................. 126
4.2.4.1 Bio-oil Production .................................................................................. 126

Assessment of likely Technology Maturation Pathways for production of biojet fuel (The ATM Project) March 2019
14
4.2.4.2 Upgrading ............................................................................................ 128
4.2.5Sensitivity Analysis .................................................................................... 129
4.2.5.1 Hydrogen ............................................................................................. 129
4.2.5.2 Fuel Gas ............................................................................................... 129
4.2.6 Discussion of LCA Results .......................................................................... 131
4.2.7 Impact of avoided slash burning emissions on LCA results .............................. 132
CHAPTER 5 – TECHNO-ECONOMIC ANALYSIS .................................................................... 134
5.1 Assumptions ................................................................................................ 135
5.2 Results ............................................................................................... 140
5.2.1 HTL – PNNL pathway ................................................................................ 141
5.2.2 Fast pyrolysis (BTG) – PNNL ...................................................................... 143
5.2.3 Catalytic pyrolysis (VTT) – PNNL ................................................................. 145
5.2.4 HTL (Aarhus) - CANMET ............................................................................ 147
5.2.5 Fast pyrolysis (BTG) - CANMET ................................................................... 149
5.2.6 Catalytic pyrolysis (VTT) - CANMET ............................................................. 151
5.3 Review of the results ............................................................................ 153
5.3.1 Potential of policy incentives ...................................................................... 154
5.3.2 Concluding remarks .................................................................................. 155
5.3.2.1 CAPEX ................................................................................................. 155
5.3.2.2 Role of hydrogen on TEA ........................................................................ 155
5.3.2.3 Hydrotreatment and potential of co-processing in an existing refinery ........... 156
CHAPTER 6 – POTENTIAL FEASIBILITY OF ESTABLISHING A DEMONSTRATION SCALE PRODUCTION
AND UPGRADING FACILITY IN BRITISH COLUMBIA............................................................. 157
6.1 Background and design guidelines .................................................................. 157
6.2 Discussion ................................................................................................... 162
6.2.1 Analysis of capital cost .............................................................................. 162
6.2.2 Integration at a Canadian airport ................................................................ 162
6.2.3 Scientific and engineering challenges .......................................................... 162
CHAPTER 7 – THE POLICY ENVIRONMENT AND POLICY RECOMMENDATIONS ......................... 166
7.1 Aviation perspective ...................................................................................... 166
7.2 Policy at international level and likely effectiveness for achieving objectives .......... 167
7.3 Policy at national level and likely effectiveness for achieving objectives ................ 168
7.3.1 Federal Clean Fuel Standard ...................................................................... 169
7.3.2 Evaluation of the CFS in the context of this project ........................................ 170
7.4 Policy at provincial level and likely effectiveness for achieving objectives .............. 170
7.5 Policy conclusions and Recommendations ......................................................... 172
CHAPTER 8 – RESULTS AND DISCUSSION ......................................................................... 174
8.1 Comparison of biocrudes and upgrading approaches .......................................... 174

Assessment of likely Technology Maturation Pathways for production of biojet fuel (The ATM Project) March 2019
15
8.2 Analysis of jet fractions and suitability of thermochemical liquefaction and hydrotreating as a strategy to produce biojet fuel .................................................................................. 176
8.3 Specific considerations and specifications relevant to biojet fuels ......................... 179
CHAPTER 9 – CONCLUSIONS AND RECOMMENDATIONS ...................................................... 181
9.1 Conclusions ................................................................................................. 181
9.2 Recommendations ........................................................................................ 184
9.3 Significance of this project to advancing biojet fuels .......................................... 186
9.4 Benefits of this project to Canada ................................................................... 186
REFERENCES BY CHAPTER .............................................................................................. 188
APPENDIX A ................................................................................................................. 199
Co-processing of biocrudes in existing refineries ................................................... 199
Insertion of bio-oils/biocrudes in the fluid catalytic cracker ..................................... 199
Insertion of bio-oils/biocrudes into the hydrotreater .............................................. 200
APPENDIX B ................................................................................................................. 202
Source and cost of hydrogen ............................................................................... 202
Introduction .................................................................................................... 202
Hydrogen production technologies ...................................................................... 203
Customer requirements for quality and cost ......................................................... 205
Hydrogen cost.................................................................................................. 206
Hydrogen storage and transportation .................................................................. 207
Hydrogen supply in Canada and BC ..................................................................... 207
APPENDIX C ................................................................................................................. 209
Approach to Life Cycle Analysis in this project ........................................................ 209
ISO 14040 ........................................................................................................ 209
ISO Principles .................................................................................................. 210
LCA Modelling Issues .......................................................................................... 210
Attributional vs. Consequential ........................................................................... 210
Attributional LCA Approaches ............................................................................. 211
Consequential LCAs .......................................................................................... 212

Assessment of likely Technology Maturation Pathways for production of biojet fuel (The ATM Project) March 2019
16
List of Figures Figure 1. Emissions from aviation in the absence of any action, and emissions-reduction goals set by
the industry (Air Transport Action Group) ......................................................................... 23
Figure 2. Graphic illustration of the fuels approval process as set out in ASTM D4054 (CAAFI - http://www.caafi.org/resources/pdf/D4054_Users_Guide_V6_2.pdf) .................................... 25
Figure 3 Simplified schematic of bubbling fluidized bed (BFB) fast pyrolysis (adapted from Bridgwater, 2012) ......................................................................................................................... 32
Figure 4: Simplified schematic of circulated fluid bed (CFB) fast pyrolysis (adapted from Bridgwater, 2012) ......................................................................................................................... 33
Figure 5 Deoxygenation reactions ........................................................................................... 41
Figure 6: Reactivity scale of oxygenated compounds under hydrotreatment conditions. .................. 44
Figure 7: Refinery insertion points (red arrows) for HDO Bio-oils. (adapted from (US EIA, 2007) ...... 49
Figure 8. Map of agricultural and forest lands in Canada covering about 7% and 40% of total landmass in Canada, respectively (AAFC, 2012; NRCan, 2018). ......................................................... 50
Figure 9. Total primary energy supply of renewable energy sources in Canada in 2016 (Petajoule -PJ). After hydropower, the second largest single source of renewable energy is biomass, representing about 26% of total renewables supply and around 4.5% of the total primary energy supply in 2016 (IEA Bioenergy, 2018). .......................................................................................... 51
Figure 10. Typical yield of sawlog components in British Columbia (AEBIOM et al., 2013) ................ 53
Figure 11. Annual harvest versus wood supply (based on the AAC) in Canada (National Forestry Database, 2017) ........................................................................................................... 54
Figure 12. Supply curve of forest residues for Anahim Lake, Williams Lake Timber Supply Area, BC (FPInnovations, 2018a). Average delivered cost is 68.78 $/dt. ............................................ 56
Figure 13. Supply curve of forest residues for Fort St. James, Prince George Timber Supply Area, BC (FPInnovations, 2018b). Average delivered cost is 75.71 $/dt. ............................................ 57
Figure 14. Supply curve of forest residues for Whitecourt, Upper Athabasca region, Alberta (BIMAT, 2018). Average delivered cost is 88.69 $/dt...................................................................... 57
Figure 15. Distribution of corn stover delivered cost for three biorefinery scenarios in Southwestern Ontario (Wang et al., 2017) ........................................................................................... 60
Figure 16. Potential locations in BC where large volumes of forest residues are available (Industrial Forestry Service Ltd. et al., 2015; FPInnovations, 2018)..................................................... 62
Figure 17. Alberta’s land-use framework planning regions (Government of Alberta, 2014) ............... 63
Figure 18. Map of the Prince George TSA (Nicholls, 2016). FNWL: First Nation Woodland Licence; TFL: Tree Farm Licences; CFL: Community Forest Licenses ........................................................ 66
Figure 19. Cost-supply curve of forest residues for Prince George TSA. There are sufficient quantities of forest residues to meet the annual biomass demand of a biocrude facility with the production capacity of 2000 barrels/day that requires 300,000 dry tonnes of forest biomass annually
(Biomass data source: FPInnovations, 2018b). .................................................................. 67
Figure 20. Distribution of transportation distance between forest biomass collection points in forest stands and biocrude production facility in Prince George (km) ............................................. 68
Figure 21 Empyro Facility, Hengelo Netherlands ........................................................................ 82
Figure 22 BTG Process Flow ................................................................................................... 83
Figure 23 VTT Process Flow ................................................................................................... 84
Figure 24. Aarhus University Facility ........................................................................................ 85

Assessment of likely Technology Maturation Pathways for production of biojet fuel (The ATM Project) March 2019
17
Figure 25 HTL Process Flow ................................................................................................... 86
Figure 26. Comparison of three biocrudes - elemental composition .............................................. 87
Figure 27– Diagram of CanmetENERGY-Ottawa’s processing approach to convert biocrudes into biojet fuel fraction ................................................................................................................. 88
Figure 28– Two potential insertion points for the upgrading unit prior to the middle distillates and kerosene hydrotreaters (oil refinery diagram based on www.uop.com/refining -flowscheme-2/ )
.................................................................................................................................. 90
Figure 29: The distribution of biogenic carbon in the oil-phase product ......................................... 93
Figure 30. Filter cake on the 5-micron screen of the ATM-HTL biocrude. ....................................... 99
Figure 31. Schematic of bench-scale hydrotreater at PNNL ....................................................... 100
Figure 32. Simulated distillation curve of hydrotreated product from fast pyrolysis. ...................... 104
Figure 33. Simulated distillation curve of the hydrotreated fuel from the VTT CFP bio-oil ............... 107
Figure 34. Simulated distillation curve of hydrotreated product from fast pyrolysis. ...................... 110
Figure 35 Lifecycle Stages – Forest Residue Biojet ................................................................... 120
Figure 36 Sensitivity to Hydrogen Consumption ...................................................................... 129
Figure 37 Sensitivity to Natural Gas Use ................................................................................ 130
Figure 38 Sensitivity to Both Variables ................................................................................... 130
Figure 39 Emissions for fuel production and upgrading pathways relative to fossil jet fuel ............. 132
Figure 40 Schematic representation of the supply chain and most important sources used ............ 134
Figure 41. NPV Sensitivity of HTL + PNNL pathway – based on a yearly 300,000 ODT feedstock input and 73,000 MT upgraded fuel output. ............................................................................ 142
Figure 42. MFSP of HTL + PNNL pathway ............................................................................... 143
Figure 43. NPV sensitivity analysis of pyrolysis (BTG) + PNNL – based on a yearly 300,000 ODT feedstock input and 51,000 MT upgraded fuel output. ...................................................... 144
Figure 44. MFSP of BTG + PNNL pathway ............................................................................... 145
Figure 45. NPV sensitivity of catalytic pyrolysis (VTT) + PNNL pathway – based on a yearly 300,000 ODT feedstock input and 30,000 MT upgraded fuel output. ............................................... 146
Figure 46. MFSP of catalytic pyrolysis + PNNL pathway ............................................................ 147
Figure 47. NPV sensitivity of HTL + CANMET pathway – based on a yearly 300,000 ODT feedstock input and 75,000 MT upgraded fuel output. .................................................................... 148
Figure 48. MFSP of HTL + CANMET pathway ........................................................................... 149
Figure 49. NPV sensitivity of Pyrolysis (BTG)- CANMET pathway – based on a yearly 300,000 ODT feedstock input and 64,000 MT upgraded fuel output. ...................................................... 150
Figure 50. MFSP analysis of pyrolysis (BTG) - CANMET pathway ................................................ 151
Figure 51. NPV sensitivity of Catalytic pyrolysis (VTT) - CANMET pathway – based on a yearly 300,000 ODT feedstock input and 33,000 MT upgraded fuel output. ............................................... 152
Figure 52. MFSP analysis of catalytic pyrolysis (VTT) - CANMET pathway .................................... 153
Figure 53. Impact of BC-LCFS on HTL-PNNL case .................................................................... 155
Figure 54 Simplified block diagram for the hydrothermal liquefaction facility design ...................... 158
Figure 55. Simplified block diagram showing the upgrading facility design ................................... 159
Figure 56 Mass yield diagram from wet forestry residue through to final products for the HTL route
................................................................................................................................ 160

Assessment of likely Technology Maturation Pathways for production of biojet fuel (The ATM Project) March 2019
18
Figure 57. Feedstock used to produce hydrogen on a global scale (IHS, 2015)............................. 203
Figure 58. Average cost of hydrogen production (Acar & Dincer 2014) ........................................ 206
Assessment of likely Technology Maturation Pathways for production of biojet fuel (The ATM Project) March 2019
19
List of tables Table 1 List of companies producing HEFA fuels (mainly renewable diesel) .................................... 28
Table 2: Commercial and pre-commercial (≥ 50 tpd) bio-oil facilities in 2017 ................................ 35
Table 3 Comparison of typical properties of bio-oils and biocrudes from lignocellulosic feedstock via different technologies with crude oil. Variations in process conditions may result in variation in properties for catalytic fast pyrolysis and hydrothermal liquefaction. .................................... 38
Table 4. Biomass availability and cost estimations in Canada ...................................................... 52
Table 5. Delivered cost of sawlogs based on 1.5-hour hauling cycle time and the contribution of various cost items (International Wood Markets Group Inc., 2014; Industrial Forestry Service Ltd. et al., 2015; Timberline Natural Resource Group Ltd., 2009; Timmenga & Associates Inc., 2008; Murray, 2010; FPInnovations, 2010) ...................................................................... 54
Table 6. Delivered cost of sawmill residues based on 1.5-hour hauling cycle time (Mobini, 2015; Industrial Forestry Service Ltd. et al., 2015; Timberline Natural Resource Group Ltd., 2009) ... 55
Table 7. Wood pellet production and transportation costs (Mobini, 2015; International Wood Markets
Group Inc., 2014; Pinnacle Renewable Energy Inc., 2014; Strauss, 2013; Murray, 2010;) ....... 58
Table 8. Potential locations in BC where large volumes of forest residues are available and the average delivered cost (Industrial Forestry Service Ltd. et al., 2015; FPInnovations, 2018). The biomass availability, cost and supply radius are estimated based of the size of forest stands in the region and the location of the delivery point. .............................................................................. 61
Table 9. Potential locations in Alberta where large volumes of forest residues are available (BIMAT, 2018) ......................................................................................................................... 63
Table 10. Potential locations for the development of a regional supply chain scenario for biocrude production in Western Canada ........................................................................................ 65
Table 11. BTG Process Parameters .......................................................................................... 83
Table 12 VTT Process Parameters ........................................................................................... 85
Table 13. HTL Process Parameters .......................................................................................... 86
Table 14 Comparison of three biocrudes .................................................................................. 87
Table 15: Biocrude feed blend composition (in wt%) .................................................................. 90
Table 16: Biocarbon fraction of total C in oil-phase products obtained by 14C analysis .................... 92
Table 17: Product yield of biogenic carbon ............................................................................... 93
Table 18 Analysis of raw FP bio-oil .......................................................................................... 97
Table 19. Analysis of the VTT CFP bio-oils before and after filtration ............................................. 97
Table 20. Analysis of the filtered VTT CFP bio-oil ....................................................................... 98
Table 21. Analysis of raw biocrude and filtered biocrude ............................................................. 98
Table 22. Reaction conditions of hydrotreating test .................................................................. 101
Table 23. Yield from stabilization and finishing step of hydrotreating of pyrolysis oil ..................... 101
Table 24. Gas yield from both stabilization and finishing hydrotreating step. ............................... 101
Table 25. Analysis of stabilized bio-oil.................................................................................... 102
Table 26 Yield data of final hydrotreating of stabilized bio-oil .................................................... 103
Table 27. Gas yield from finishing hydrotreating step. .............................................................. 103
Table 28. Overall yield from raw FP bio-oil to final products for combining both stabilization and hydrotreating step ...................................................................................................... 103

Assessment of likely Technology Maturation Pathways for production of biojet fuel (The ATM Project) March 2019
20
Table 29. Final characterization of hydrotreated fuel from bio-oil. .............................................. 104
Table 30 Mass approximation of hydrocarbon product .............................................................. 105
Table 31. Characterization of the aqueous product from the finishing upgrading step. ................... 105
Table 32. Reaction conditions of hydrotreating test .................................................................. 106
Table 33. Yield, carbon yield, H2 consumption, mass balance of hydrotreating of the VTT CFP oil ... 106
Table 34. Composition of the produced gas from hydrotreating of the VTT CFP oil ........................ 106
Table 35. Analysis results of the hydrotreated fuel from the VTT CFP bio-oil ................................ 107
Table 36. Calculated weight distribution of different fractions of hydrotreated fuel from the VTT CFP oil based on simulated distillation results ............................................................................ 107
Table 37. Mass yields from fractionation of hydrotreated oils. ................................................... 108
Table 38. Quantity of each fuel fraction obtained .................................................................... 108
Table 39 Analysis results of the aqueous products from hydrotreating of the VTT CFP bio-oil ......... 108
Table 40. Hydrotreating process parameter ............................................................................ 109
Table 41. Yield from finishing step of hydrotreating of biocrude. ................................................ 109
Table 42. Gas yield from finishing the hydrotreating step. ........................................................ 109
Table 43. Final characterization of hydrotreated fuel from biocrude. ........................................... 110
Table 44. Mass approximation of hydrocarbon product ............................................................. 111
Table 45. Characterization of the aqueous product from the HTL biocrude upgrading step. ............ 111
Table 46: The RSB Principles and Criteria for sustainability certification ...................................... 115
Table 47 Slash Burning Emissions ......................................................................................... 122
Table 48 Biocrude Comparison ............................................................................................. 123
Table 49 GHG Emission Comparison ...................................................................................... 123
Table 50 Refined Bio-oil Comparison for the PNNL upgrading process ......................................... 124
Table 51 GHG Emission Comparison for the PNNL upgrading process .......................................... 125
Table 52 Refined Bio-oil Comparison- Canmet ......................................................................... 125
Table 53 GHG Emission Comparison - Canmet ........................................................................ 126
Table 54 Modelling Parameters – 200 Bbbl/day HTL ................................................................. 127
Table 55 GHG Emissions - 200 Bbl/day HTL ............................................................................ 127
Table 56 HTL Refined Bio-oil GHG Emissions - 200 Bbl/day ....................................................... 128
Table 57 Canmet Optimized Upgrading Fast Pyrolysis .............................................................. 128
Table 58 GHG Emission Comparison ...................................................................................... 131
Table 59 HTL Refined Bio-oil GHG Emissions – Avoided Forest Burning Emissions ......................... 133
Table 60 Avoided Forest Burning Emissions – BTG and VTT Refined Bio-Oil ........................... 133
Table 61. General financial parameters .................................................................................. 135
Table 62. CAPEX assumptions .............................................................................................. 136
Table 63. Biocrude production yields from woody biomass ........................................................ 136
Table 64. Yields upgrading PNNL-HTL .................................................................................... 137
Table 65. Yields upgrading PNNL-Pyrolysis (BTG) .................................................................... 137

Assessment of likely Technology Maturation Pathways for production of biojet fuel (The ATM Project) March 2019
21
Table 66. Yields upgrading PNNL-Catalytic Pyrolysis (VTT) ........................................................ 137
Table 67. Yields upgrading CANMET-HTL ................................................................................ 138
Table 68. Yields upgrading CANMET-Pyrolysis (BTG) ................................................................ 138
Table 69. Yields upgrading CANMET-Catalytic Pyrolysis (VTT) .................................................... 138
Table 70. Fossil value prices ................................................................................................. 139
Table 71. Utility prices assumed ........................................................................................... 140
Table 72. Other fixed operational costs. ................................................................................. 140
Table 73. Overall yields in wt% of biocrude production and upgrading ........................................ 141
Table 74. P&L first 5 years HTL + PNNL pathway – based on a yearly 300,000 ODT feedstock input and 73,000 MT upgraded fuel output. ............................................................................ 142
Table 75. P&L first 5 years Pyrolysis (BTG) + PNNL pathway – based on a yearly 300,000 ODT feedstock input and 51,000 MT upgraded fuel output. ...................................................... 144
Table 76. P&L Catalytic pyrolysis (VTT) + PNNL pathway – based on a yearly 300,000 ODT feedstock input and 30,000 MT upgraded fuel output. .................................................................... 146
Table 77. P&L HTL + CANMET pathway – based on a yearly 300,000 ODT feedstock input and 75,000 MT upgraded fuel output. ............................................................................................. 148
Table 78. P&L of pyrolysis (BTG) – CANMET – based on a yearly 300,000 ODT feedstock input and 64,000 MT upgraded fuel output. .................................................................................. 150
Table 79. P&L of Catalytic pyrolysis (VTT) - CANMET pathway – based on a yearly 300,000 ODT feedstock input and 33,000 MT upgraded fuel output. ...................................................... 152
Table 80. PNNL pathways overview of results ......................................................................... 153
Table 81. CANMET pathways overview of results ..................................................................... 153
Table 82. Oxygen content in biocrudes .................................................................................. 154
Table 83. Indication of costs in CAD cents/litre for different blends of fossil jet and biojet ............. 154
Table 84 Overall process mass and carbon balance for a 200 bbl/d technology demonstration ...... 161
Table 85. Overall Class 5 (-50%/+100%) cost estimate for a complete 200 bbl/d HTL biocrude production, upgrading, and wastewater treatment demonstration project (M CAD) ............... 161
Table 86 Scientific gaps and engineering challenges ............................................................... 163
Table 87. Combined results of all pathways ............................................................................ 175
Table 88. Comparison of pathways with respect to specific factors ............................................. 176
Table 89. Results of analysis of jet fractions from the ATM Project compared with specifications as listed in Table 1 of ASTM D7566. (FP-fast pyrolysis, CP-catalytic pyrolysis, HTL-hydrothermal liquefaction, C-Canmet upgrading, P-PNNL upgrading) Highlighted values fall outside the specification. .............................................................................................................. 178
Table 90: Comparison of FCC and hydroprocessing as refinery co-processing platforms for bio-oils . 201
Table 91. Major hydrogen production technologies (SDTC, 2006) ............................................... 204
Table 92. Hydrogen production technologies and customer requirements (SDTC, 2006) ................ 206
Table 93. Hydrogen production capital cost comparison as a function of plant capacity (ton/day, tpd). Acar & Dincer 2014. .................................................................................................... 207
Table 94 Comparison of Attributional and Consequential LCAs ................................................... 211

Assessment of likely Technology Maturation Pathways for production of biojet fuel (The ATM Project) March 2019
22
CHAPTER 1 -INTRODUCTION AND LITERATURE REVIEW
This section of the report provides an introduction to the aviation sector and the rationale for
development of biojet fuels. It further lists the current biojet fuels certified under ASTM and the
process that has to be followed by a biojet producer to become certified to use their biojet fuel in
commercial flights. We also look at the current availability of commercial volumes of biojet fuels. To
provide a background on the technology selected within the ATM Project, we briefly summarise and
describe pyrolysis, catalytic pyrolysis and HTL technologies and challenges for biojet production via
this pathway. Included in this literature review we describe the types of technologies, characteristics
of bio-oils/biocrudes and a summary of the published literature on upgrading of these biocrudes into
finished fuels.
1.1 The Aviation Sector and the Rationale for biojet fuel, also known as Sustainable Aviation Fuel (SAF)
Air transport accounts for approximately 2% of the global man-made carbon dioxide
(CO2) emissions. In 2017, carbon dioxide (CO2) emissions from international civil aviation as a whole
amounted to 859 million tonnes (Mt), with forecasts projecting increased emissions if no action is
taken (ICAO, 2016)3. In 2017, nearly 4.1 billion passengers were carried by airlines.
Given this sector’s steady growth, aviation will play a key role in meeting the international
climate targets in the United Nations Framework Convention on Climate Change (UNFCCC) COP21
agreement, even though aviation emissions were not specifically mentioned in the document. Outside
of UNFCCC, the aviation industry has adopted targets to mitigate the CO2 emissions from air
transport: (1) An average improvement in fuel efficiency of 1.5% per year from 2009 to 2020, (2)
carbon-neutral growth by 2020 and (3) a 50% reduction in GHG emissions by 2050 (relative to 2005
levels).
More recently, and in order to address short term emission reduction, the industry recognized
that global market-based measures (GMBM) are needed to fill any remaining emissions gap. As a
result, ICAO adopted CORSIA, a global carbon offsetting4 scheme to address CO2 emissions from
international aviation in 2016. In parallel, emissions can be reduced by new technology, more efficient
aircraft operations and infrastructure improvements (including modernized air traffic management
systems).
Sustainable aviation fuels—such as biojet— represent the single greatest means for airlines to
achieve significant, long-term reduction of emissions. (Figure 1). Aviation is unique for its dependency
on liquid fuels for today and into the foreseeable future. Research is underway to evaluate the
feasibility of alternative technologies such as electric motors or liquid hydrogen for propulsion or in a
fuel cell; however, these options are unlikely to be ready for commercial large scale and sector-wide
3 This is based on a calculation of 3.16 kg of CO2 emitted per kg of fuel and forecasts for fuel consumption increases. See Figure 5 on page 19 of the report. Note that fuel consumption for domestic aviation is excluded from this figure. 4 A carbon offset is a reduction in emissions of carbon dioxide or greenhouse gases made in order to compensate for or
to offset an emission made elsewhere.

Assessment of likely Technology Maturation Pathways for production of biojet fuel (The ATM Project) March 2019
23
deployment in the near term. An additional hurdle to such deployment is related to the long lifespan of
aircraft and the high fleet renewal costs associated with the commercial aviation industry. Biojet fuels
will be an essential measure to achieve significant reductions in aviation emissions by 2050.
Figure 1. Emissions from aviation in the absence of any action, and emissions-reduction goals set by the industry
(Air Transport Action Group)
Biojet fuels can potentially reduce greenhouse gas (GHG) emissions compared to fossil jet fuel
(based on a well-to-wheel life cycle analysis). However, the emissions-reduction potential of different
feedstocks and technology pathways in a specific geography using local utilities and infrastructure may
differ significantly, with values ranging from 50% to 95% reduction potential as compared to fossil jet
fuel5.
Achieving the GHG emissions-reduction targets proposed by the aviation industry in Figure 1,
and by organisations such as the International Civil Aviation Organisation (ICAO), will require a
significant increase in biojet fuel production and consumption. The exact volumes required to achieve
specific goals are not clear because of factors such as the aviation sector’s future fuel consumption,
the extent of emissions reductions achieved through offsets, and the specific emissions-reduction
potential of various options for making biojet fuels, which are called pathways. Fuel consumption for
international aviation could be as high as 852 million tonnes (t) by 2050 (ICAO, 2016) and could
require 426 m t of biojet fuels to meet the GHG goals. Current production however is still very limited,
at less than 0.1% of global total consumption of jet fuels. This section will explain how supply at that
level will require significant policy, technological, and supply-chain support for biojet fuel
development.
5 The Renewable Energy Directive, Annex V, Section B contains default values for biofuels GHG savings which can be used as a
guideline. Diesel using a wood-based Fischer-Tropsch process has a default value of 95%, for example, while typical GHG savings
values for hydrotreated vegetable oil are from 40% to 65% based on different feedstocks.
Assessment of likely Technology Maturation Pathways for production of biojet fuel (The ATM Project) March 2019
24
Since the dawn of the jet age, commercial aviation has been dependent upon conventional jet
fuel – the price of which can represent about 30% of an airline’s operating cost. In addition, jet fuel
prices are highly volatile resulting in extreme and rapid swings in price, which can dramatically affect
the profitability and long-term financial stability of airlines. Biojet fuel produced from sustainably
sourced forest biomass offers a potentially attractive alternative to conventional jet fuel. In addition
to resulting in more local / regional control of production and supply—as well as reducing price
volatility—biojet fuels will have significantly lower carbon footprint and help airlines achieve significant
greenhouse gas emission reductions. A future cost effective, sustainable and robust biojet supply
chain could provide a key competitive advantage for Canadian airlines.
Aviation in Canada continues to grow and the Canadian carriers have invested billions of
dollars in fuel efficient aircraft. However, it is apparent that continued growth in air traffic will result in
an increase in the environmental footprint of the Canadian aviation sector. Together with improved
fuel efficiency and optimized routing, aviation bio-fuels are the biggest opportunity to reduce GHG
emissions and improve the sustainability of the Canadian aviation sector.
The Canadian aerospace industry will benefit from local development and production of
biofuels for two main reasons:
• It will help the Canadian airline industry to fulfill their (international) commitments
with respect to emission reductions. Canada is a member state of the UN’s
International Civil Aviation Organization while various airlines (Westjet, Air Canada,
Air Transat), and Equipment Manufacturers (Boeing, Airbus, Bombardier) are also
members of IATA and ATAG respectively which has set specific targets for emission
reductions by 2020 and 2050.
• As fuel represents 30% of airline operating costs, locally produced biojet fuels will
contribute by reducing dependence on petrochemical sources with volatile prices,
while also offering potential for a cost effective and stable supply to improve energy
security and reduce reliance on foreign imports.
1.2 Aviation Fuel Requirements, Specifications and Standards
The aviation sector uses specific fuels to power jet turbine aircraft, and these are usually
classified as Jet A/A1 fuels in most regions. All jet fuel has to meet strict specifications defined by the
engine and airframe OEMs documentation and approved by the regulatory authorities. Examples of
fuel specifications that have been shown to meet the requirements of the engine and airframe OEMs
are ASTM 1655 and Def Stan 91-091. A separate standard, ASTM D7566 was created for alternative
jet fuels, including biojet fuel, to ensure that the same high standards are maintained. An ASTM
D4054 standard was created as a guide for what testing and properties the OEMs evaluate in
approving a new fuel from non-conventional sources. Further guidance documents are published by
organizations such as CAAFI and IATA to assist in navigating this complex area.
Key documents providing guidance on requirements and certification of alternative jet fuel:
• ASTM D1655 – specification for Jet A/A1 • ASTM D7566 - Standard Specification for Aviation Turbine Fuel Containing
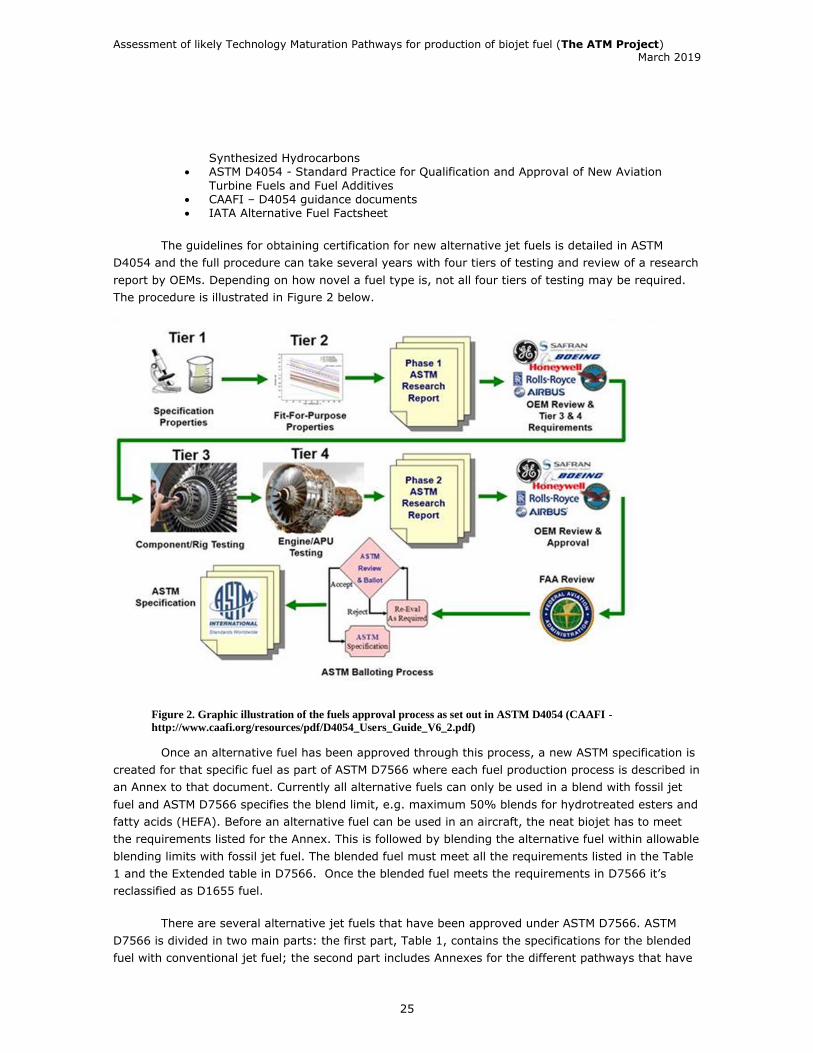
Assessment of likely Technology Maturation Pathways for production of biojet fuel (The ATM Project) March 2019
25
Synthesized Hydrocarbons • ASTM D4054 - Standard Practice for Qualification and Approval of New Aviation
Turbine Fuels and Fuel Additives • CAAFI – D4054 guidance documents • IATA Alternative Fuel Factsheet
The guidelines for obtaining certification for new alternative jet fuels is detailed in ASTM
D4054 and the full procedure can take several years with four tiers of testing and review of a research
report by OEMs. Depending on how novel a fuel type is, not all four tiers of testing may be required.
The procedure is illustrated in Figure 2 below.
Figure 2. Graphic illustration of the fuels approval process as set out in ASTM D4054 (CAAFI -
http://www.caafi.org/resources/pdf/D4054_Users_Guide_V6_2.pdf)
Once an alternative fuel has been approved through this process, a new ASTM specification is
created for that specific fuel as part of ASTM D7566 where each fuel production process is described in
an Annex to that document. Currently all alternative fuels can only be used in a blend with fossil jet
fuel and ASTM D7566 specifies the blend limit, e.g. maximum 50% blends for hydrotreated esters and
fatty acids (HEFA). Before an alternative fuel can be used in an aircraft, the neat biojet has to meet
the requirements listed for the Annex. This is followed by blending the alternative fuel within allowable
blending limits with fossil jet fuel. The blended fuel must meet all the requirements listed in the Table
1 and the Extended table in D7566. Once the blended fuel meets the requirements in D7566 it’s
reclassified as D1655 fuel.
There are several alternative jet fuels that have been approved under ASTM D7566. ASTM
D7566 is divided in two main parts: the first part, Table 1, contains the specifications for the blended
fuel with conventional jet fuel; the second part includes Annexes for the different pathways that have
Assessment of likely Technology Maturation Pathways for production of biojet fuel (The ATM Project) March 2019
26
been approved since the introduction of ASTM D7566 (IATA, 2017):
• Annex A1 for Fischer-Tropsch Hydroprocessed Synthesized Paraffinic Kerosene (FT SPK)
• Annex A2 for Synthesized Paraffinic Kerosene from Hydroprocessed Esters and Fatty Acids
(HEFA SPK)
• Annex A3 for Synthesized Iso-Paraffins from Hydroprocessed Fermented Sugars (SIP SPK)
• Annex A4. Synthesized kerosene with aromatics derived by alkylation of light aromatics from
nonpetroleum (SPK/A)
• Annex A5. Alcohol-to-jet synthetic paraffinic kerosene (ATJ-SPK)
More recently, April 2018, the co-processing of vegetable oils within existing petroleum
refineries was granted ASTM certification. However, as the co-processed jet fuel obtained in this
manner never exists as a neat fuel, the ASTM certification was granted as a modification of ASTM
D1655 rather than an Annex within ASTM D7566.
It should be noted that ASTM D7566 is not only concerned with biojet fuels, but any
alternative fuel from non-petroleum sources. Annex A1 and A4 fuels were derived from coal, although
biomass-based fuels produced using the same process would also qualify under this standard. It
should also be noted that the Annexes contain a brief description of the production process and the
feedstock to be used with the implication that similar fuels produced by a significantly different
process or feedstock would not qualify under the same Annex. For example, the initial alcohol-to-jet
certification was based on conversion of isobutanol to jet fuel (application brought by Gevo). The
production of biojet from ethanol was approved separately (application launched by Lanzatech).
Efforts are under way by organisations such as CAAFI to simplify the description to be more inclusive,
but safety concerns are paramount, and the approach is therefore very conservative. Once the
blended fuel meets the requirements of ASTM D7566, it can be comingled with conventional jet fuel
handling, storage, and distribution network and is treated as conventional jet fuel.
The ASTM certification process (as set out in D4054) for alternative fuels is a very thorough
and rigorous process in which many entities participate. The first step in the process is for the fuel
producer to provide a research report with test data to the original equipment manufacturers (OEMs)
for review. The OEMs review the reports and provide guidance on what additional testing if any may
be required. Fuel volumes that may be required for the process are up to 10 gallons (38 liters) for the
Specification Tests; 10 to 100 gallons for the fit-for-purpose tests; 250 to 10,000 gallons (950 to
38,000 liters) for the Component and Rig Tests; and up to 225,000 gallons (852,000 liters) for the
engine test. These are estimates because the extent of required fit-for-purpose tests is dependent
upon the fuel chemistry and results of the Specification tests. A process that is similar to an already
approved alternative fuel may require less testing. Once the OEMs are satisfied with the research
report they give approval of the fuel to go to the broader ASTM committee for balloting.
Table 1 of ASTM D7566 establishes the core testing and properties that should be carried out
and maximum/minimum ranges while the specific Annex for an alternative fuel process may contain
further tests and properties relating to the neat biofuel, and a description of feedstock and process
requirements.

Assessment of likely Technology Maturation Pathways for production of biojet fuel (The ATM Project) March 2019
27
The ATM Project pursued the production of biojet fuels through thermochemical liquefaction
technologies, combined with upgrading through hydroprocessing (with two different upgrading
approaches used: a co-processing strategy by Canmet and dedicated hydroprocessing of neat
biocrude by PNNL). Any biojet fuel produced in this project will not be ASTM certified, but the project
aimed to establish the feasibility of producing a biojet fuel that could potentially form the basis of a
future application under ASTM D4054.
Based on the current approval approach it should be noted that each type of biocrude (from
fast pyrolysis, catalytic pyrolysis and hydrothermal liquefaction) may require separate ASTM
applications. In addition, the distinct nature of the upgrading strategies will also require distinct
applications for approval. Based on our current understanding, the co-processing approach will not
produce a neat biofuel and approval of such a process may have to be a modification of ASTM D1655,
while upgrading of neat biocrude could form part of ASTM D7566.
As there is no existing ASTM D7566 Annex for thermochemical liquefaction-based biojet fuels,
analysis on biojet fraction produced in this project was based on general ASTM specifications for jet
fuel. It should be noted, however, that analysis was limited by the volumes of biojet fuel fractions
available after upgrading of each biocrude. Where large volumes of sample were required for
analytical procedures, testing could not be carried out at this stage. Chapter 8 of this report assesses
the results of analysis of biojet fractions derived from this project, evaluates compliance with current
specifications and further processing that may be required to meet the standards. A potential pathway
to achieving ASTM approval for thermochemical liquefaction biojet fuels are also discussed and
outlined.
1.2.1 Status of Commercial Biojet /Sustainable Aviation Fuel (SAF) Production
Biojet fuel can be produced through a multitude of pathways using different feedstocks as
starting material and a number of them have been certified for use in aircraft. However, the vast
majority of commercial volumes of biojet fuels are produced through the HEFA pathway, the
hydrotreatment of lipids, including triglycerides and fatty acids derived from vegetable oils, tallow,
used cooking oil, etc. While a number of facilities exist that produce HEFA biofuels, it should be noted
that the main product generated is not HEFA (aviation grade) but Hydrotreated Vegetable Oil - HVO
(renewable diesel grade). Table 1 below lists the current facilities and total plant capacity. However,
only one facility, World Energy (previously AltAir), routinely makes biojet, although renewable diesel is
still a major product for this plant, about 4 tonnes of renewable diesel is produced for every tonne of
biojet fuel.

Assessment of likely Technology Maturation Pathways for production of biojet fuel (The ATM Project) March 2019
28
Table 1 List of companies producing HEFA fuels (mainly renewable diesel)
The operational capacity of the world’s current hydrotreated oil facilities is about 5.5 bn L/y.
In order to allow the use of more output towards jet fuel, ASTM has also been evaluating the use of
renewable diesel (HEFA+, or high freeze-point HEFA, HFP-HEFA) in blend with jet fuel. If it receives
ASTM approval, this strategy could have a significant impact on biojet production capacity as
renewable diesel with good cold-flow properties could also be used as a biojet blending component.
Order of magnitude wise, if all of this capacity was diverted to biojet production, it would provide up to
1.5% of the world’s jet fuel requirements.
Although biojet produced by biomass gasification and subsequent FT conversion is not yet
commercial, two facilities are planned and expected to soon be under construction. The companies
building them are Fulcrum Bioenergy, with a planned production of 37 M litres per year (L/y) of biofuel
from MSW and Red Rock Biofuels, with a planned production of 45 m L/y using wood as the feedstock.
A third facility has been proposed in Finland by Kaidi. It would have a capacity of 1 bn L/y. It should
be noted that these volumes describe the anticipated total fuel production of each plant, of which
biojet would be only one type, if included in the product slate.
Current and future farnesene production capacity is difficult to determine as only one
company, Amyris, produces this potential biofuel in sizeable quantities, at its plant in Brotas, Brazil.
Due to the high value of farnesene as a biochemical, cosmetics ingredient and lubricant feedstock,
most the farnesene that is currently produced is sold into non-biojet markets.
Company Location Technology Feedstock Capacity Status
Neste Rotterdam NEXBTL Vegetable oil,
UCO and animal
fat
1.28 bn
L/y
Operational
Neste Singapore NEXBTL Vegetable oil,
UCO and animal
fat
1.28 bn
L/y
Operational
Neste Porvoo, Finland NEXBTL Vegetable oil,
UCO and animal
fat
385 m
L/y
Operational
Neste Porvoo 2,
Finland
NEXBTL Vegetable oil,
UCO and animal
fat
385 m
L/y
Operational
ENI Venice, Italy EcofiningTM Vegetable oils 462 m
L/y
Operational
Diamond
Green Diesel
Norco, Louisiana EcofiningTM Vegetable oils,
animal fats and
UCO
1.04 bn
L /y
Operational
UPM Lappeenranta,
Finland
UPM Bioverno Crude tall oil 120 m
L/y
Operational
World Energy
(AltAir)
Paramount,
California
EcofiningTM Non-edible oils
and waste
150 m
L/y
Operational
Renewable
Energy Group
Geismar,
Louisiana
Developed by
Dynamic Fuels
LLC
High and low free
fatty acid
feedstocks
284 m
L/y
Operational
Total LA MÈDE
Vegan® by
Axens
UCO and
vegetable oils
641
mL/y
Start-up
Assessment of likely Technology Maturation Pathways for production of biojet fuel (The ATM Project) March 2019
29
Although the alcohol-to-jet (ATJ) pathway received certification based on Gevo’s isobutanol,
there is currently no integrated commercial facility for biojet production using this route. The EU,
under FP7, is supporting the development of two demonstration projects. One will produce biojet from
ethanol (with Swedish Biofuels technology) and the other will produce biojet from the lignin fraction of
a cellulosic ethanol plant (with Biochemtex technology). The former will have a capacity of 10 MLY of
biojet, and the latter will be smaller. The company, Lanzatech, recently obtained ASTM certification for
biojet fuel produced from ethanol but planned capacity for biojet production is not clear. LanzaTech
recently began producing ethanol at its first commercial facility in Shougang, China with a production
capacity of 48,000 MT per annum. LanzaTech has also announced commercial facilities in Belgium,
South Africa, India, and in California. These projects range in size from 34,000 MT per annum (India)
to 62,000 MT per annum (Belgium).
In addition, the co-processing of lipids (5% blends) in existing refinery infrastructure was
recently approved for the production of biojet fuel as a modification to ASTM D1655. However, the
extent of current co-processing is not known.
As of July 2018, a total of 150,000 commercial flights have used alternative jet fuels, and a
regular supply of alternative fuels are available in the airport hydrant system at Oslo Airport and Los
Angeles Airport.
1.3 Thermochemical liquefaction technologies
The three types of thermochemical liquefaction technologies that are the subject of this
project will be discussed in this section:
• Conventional fast pyrolysis
• Catalytic pyrolysis
• Hydrothermal liquefaction
Additionally, variations on these technologies include hydropyrolysis. One of the key
differences between all of these technologies is the characteristics of the biocrude product obtained,
specifically the level of oxygen. Fast pyrolysis generally produces a biocrude with high oxygen levels
(>40%) while much lower levels of oxygen are achievable with catalytic pyrolysis and/or hydrothermal
liquefaction (5-25%), depending on process conditions. From a technical upgrading perspective, the
oxygen content is very important as it will impact the stability of the bio-oil, the extent of external
hydrogen required during upgrading, etc. It should be noted that several other parameters such as
yield of biocrude per tonne of feedstock, would also influence the broader feasibility and economics of
each process.
Fast pyrolysis exposes small biomass particles, about 3 mm, to heat at 500°C for a few
seconds to produce a biocrude with up to 75 wt% yield. Although companies such as Ensyn in Canada
have been producing fast-pyrolysis biocrudes for many years, these have mainly been used in niche
applications such as food flavouring. Energy applications have been restricted to heavy fuel oil used in

Assessment of likely Technology Maturation Pathways for production of biojet fuel (The ATM Project) March 2019
30
stationary heating and power-generating facilities. Ensyn6 recently obtained regulatory approval for
RFDiesel and RFGasoline (in the US), which are fuel products generated via co-processing in
petrochemical refineries, but no jet fuel has been produced this way. In the Netherlands BTG has
commercialised the flash pyrolysis technology in its EMPYRO7 project. However, at this point in time,
the biocrude is used to replace natural gas in a heating application in a milk factory. BTG has also
been testing possible co-processing of bio-oil in a petroleum refinery.
The commercial production of biojet via the pyrolysis route is likely to be challenging as
biocrudes derived from fast pyrolysis contain up to 40% oxygen (similar to the biomass itself),
whereas a fit-for-purpose jet fuel should contain zero % oxygen This necessitates extensive upgrading
to produce biojet, which is typically achieved through hydroprocessing. These processing costs, as well
as the need for external hydrogen, represent a large proportion of equipment and production costs
(Jones et al., 2009). A further challenge to the hydroprocessing of pyrolysis oils is the cost and
stability of the catalysts that are required.
Catalytic pyrolysis or processes such as HTL can produce a bio-oil intermediate with
significantly lower oxygen content, 10 to 30%, which would be easier to upgrade to produce fuels,
including biojet. Although some studies have indicated that these methods could potentially produce
the lowest-cost biojet (de Jong et al. 2016), the high-pressure requirements of HTL during the
production of biocrude will impact its potential for scale-up. While production of bio-oil via pyrolysis is
at a commercial scale, HTL is currently just at the large pilot stage, as pioneered by Licella’s Australian
plant. Although there is a scarcity of reliable technical and economic analyses, a recent study
projected that a minimum fuel-selling price (MFSP) of USD 3.39 per gallon for an nth plant could be
achieved when making diesel and gasoline via fast pyrolysis followed by upgrading (Jones et al,
2013).
The thermochemical liquefaction approach to biojet production has the potential to leverage
existing oil refinery infrastructure and thus reduce the capital and operating costs of making biojet.
Similarly, significant savings might be achieved by directly sourcing hydrogen from an oil refinery and,
in the longer term, through using existing processing units. Co-processing in existing petroleum
refineries is considered a key strategy for upgrading pyrolysis-derived bio-oils. Technical challenges
include selecting the point of insertion, the extent to which upgrading is required prior to insertion and
the disparate types of catalysts needed for bio-oils compared with those used in oil refining (Karatzos
et al. 2014). Refinery insertion strategies should be synergistically beneficial but are likely more
technically challenging than is generally acknowledged. This is further discussed in section 1.6.
1.3.1 Fast Pyrolysis
Fast pyrolysis is a thermal decomposition process which requires rapid heating of biomass to
about 500°C and a subsequent rapid cooling of the resulting vapours to room temperature. Upon
cooling, these vapours condense to form the liquid bio-oil product. It has been demonstrated that
rapid heating and cooling is crucial to maximizing bio-oil liquid yields at the expense of char and gas
production (Bridgwater, 2012). To maximize bio-oil yields (to about 75% of starting biomass by mass)
rapid heating to the target temperature must be achieved throughout each biomass particle (i.e.,
within about one second). These high heat transfer rates (up to 1000 °C/s) ensure maximum
devolatilization (vaporization) of the biomass solids and, so far, have only been achieved by a select
6 http://www.ensyn.com/2015/08/26/ensyn-receives-key-regulatory-approval-for-its-renewable-diesel/ 7 http://www.empyroproject.eu/

Assessment of likely Technology Maturation Pathways for production of biojet fuel (The ATM Project) March 2019
31
number of reactor designs (Bridgwater, 2012).
Some of the reactor designs used for fast pyrolysis are listed here and discussed briefly:
• Bubbling fluidized bed reactor
• Circulating fluidized bed reactor
• Ablative or rotating cone reactor
The Bubbling Fluidized Bed (BFB) reactor type is well suited for fast pyrolysis (and effective
heat transfer). This reactor uses a hot sand fluidized bed to achieve high rates of heat transfer to
biomass particles. The reactor beds are fluidized using a compressed carrier gas which is fed through
the bottom of the reactor at sufficiently high rates to “fluidize” the solids (sand and biomass) while
transferring the gas-entrained char upwards. These types of BFB reactors have been used by the
petroleum industry for the gasification of coke since the 1950s. They are robust systems that achieve
high heat transfer rates and uniform bed temperatures (Ringer, Putsche and Scahill, 2006), which are
both highly desirable attributes for fast pyrolysis reactions.
As depicted in the simplified schematic of a typical BFB fast pyrolysis process (Figure 3) the
biomass is first dried and ground to a particle size of about 3 mm to facilitate rapid particle heating
and devolatilization. These particles enter the fluidized bed pyrolysis reactor where they are rapidly
heated to a temperature of about 500°C. After about a 2 second residence time, the generated
vapours are vented to a cyclone where they are separated from the entrained solid char particles. The
recovered char can be sold as a value-added product (e.g. soil amendments and activated carbon) or
used as fuel for the furnaces that generate and compress the hot recycle gas that feeds the main
pyrolyser reactor. The clean vapours are then swiftly transferred to a quench cooler where they are
condensed to form the bio-oil. The uncondensed fraction of the vapours along with the permanent
gases is then transferred to a second condensation train such as a coalescing filter, scrubber or
electrostatic precipitator (e.g. Nexterra) where additional bio-oil is recovered. The remaining flue gas
is fed to the furnace that generates hot gas for the main reactor. Fast pyrolysis oils contain up to 75%
of the mass and 65% of the energy that was contained in the original biomass feedstock (Bridgwater,
2012). These types of BFB reactors have been used by the Canadian company Dynamotive at a semi-
commercial scale as well as at a smaller, demonstration scale such as the 200 kg/hr unit of Union
Fenosa in Spain. Both the Dynamotive and the Union Fenosa facilities are based on a design
developed at the University of Waterloo and commercialized through its Canadian spin-off company
RTI (Resource Transformations International) (Czernik and Bridgwater, 2004; Bridgwater, 2012).
Neither plant was operated for long and the technology is no longer under development for
commercial interests.

Assessment of likely Technology Maturation Pathways for production of biojet fuel (The ATM Project) March 2019
32
Figure 3 Simplified schematic of bubbling fluidized bed (BFB) fast pyrolysis (adapted from Bridgwater, 2012)
A more complex version of the bubbling fluidized bed (BFB) reactor is the circulating fluidized
bed (CFB) reactor (Figure 4). This reactor configuration has been used by the petroleum industry for
many decades and it has a long history of industrial operations especially in the fluidized catalytic
cracking (FCC) units. This type of system is similar to the BFB process except the compressed recycle
gas is fed at much higher velocities, such that the entire loose contents of the reactor (vapors, gases,
char as well as the fluidized bed’s sand particles) are carried into the downstream cyclone. The char
and sand are then recovered from the cyclone and fed together to a combustor, where the char is
burned off to heat up the sand. The cleaned hot sand (at about 800 °C) is then fed back to the main
reactor entrained in the compressed carrier gas and the process cycle is repeated. This system is more
expensive to install and operate than the BFB process but it comes with the advantages of constantly
regenerating clean sand bed particles and achieving higher throughputs. CFB requires careful sizing of
the biomass particles since the rapid gas flow only permits a very short residence time in the hot zone
of the pyrolysis reactor. The CFB pyrolysis is the configuration of choice for the Canadian pyrolysis
company “Ensyn” who markets their technology under the name RTP (Rapid Thermal Processing).
Other developers of the CFB configuration include CRES (catalytic pyrolysis, Greece) and Ensyn for
ENEL (Italy) (Ringer, Putsche and Scahill, 2006) and VTT-led consortium in Finland (Metso, UPM,
Fortum).
Fluid bed reactor
500oC, 2 sec, atmospheric
pressure 3 mm biomas
s particle
Volatiles and char
cyclone
Recycle gas
heater
Char
Volatiles (char-free)
Quench coole
r
Electrostatic precipitator
Pyrolysis liquids 75 wt%
yield
Gas
Gas Condensat
e

Assessment of likely Technology Maturation Pathways for production of biojet fuel (The ATM Project) March 2019
33
Figure 4: Simplified schematic of circulated fluid bed (CFB) fast pyrolysis (adapted from Bridgwater, 2012)
The main drawbacks of fluidized bed reactors are their reliance on a compressed carrier gas
which often carries char contaminants to the bio-oil product. Gas compression also requires high
capital and operating costs. The carrier gas, used to mix and circulate the sand bed, carries char
particles of such small submicron size that even the solids separation cyclone cannot capture them.
Thus, these tiny particles remain entrained in the vapour that enters the quench cooler and they end
up in the bio-oil product (Bridgwater, 2012). This can be a problem as char particles can catalyze tar
and coke formation and they can plug reactor pipes and filters upon subsequent bio-oil upgrading. It
should also be noted that the compressors used to deliver high speed carrier gases are capital-
intensive and they are not well suited for small scale applications (Wright et al., 2010).
Alternative reactors that do not use a carrier gas have recently been developed. These
reactors use centrifugal forces and mechanical motion to achieve the high rates of heat transfer
needed to rapidly volatilize the biomass particles. These types of pyrolysis reactors include ablative
and rotating cone designs based on the principle of sliding biomass particles against a hot surface,
thus “melting” the fibre in a similar way that a block of butter melts when pressed against a hot
surface. Ablative pyrolysis reactors do not use a fluidized bed or sand particles while rotating cone
reactors use sand particles contacting biomass particles but without using fluidization by a carrier gas
(Venderbosch and Prins, 2011; Bridgwater, 2012). The concept of ablative pyrolysis was first proposed
by the CNRS laboratories in Nancy, France. Subsequent ablative reactor designs have been developed
by NREL in the USA (vortex reactor) and by Aston University in the UK (plate reactor) (Bridgwater,
2012). The company formerly known as Pytec had a demonstration plant for ablative pyrolysis in
Germany. A small development reactor is still in operation at UMSICHT while there are plans for a
technology demonstration in California. The rotating cones reactor concept was initially developed by
the Dutch Company BTG (a University of Twente spin-off) which currently operates a 5 tonne biomass
feed per hour facility in the Netherlands (Empyro BV) and they supply bio-oil commercially through an
Char &
sand
Volatiles
char &
sand
Fluid bed
reactor
500oC, 2 sec,
atmospheric
pressure
3 mm
Bioma
ss
Cyc
lon
e
Combus
tor
Volatiles
(char-
free)
Que
nch
cool
er
Electr
ostati
c
precip
itator
Pyrolysis
liquids
75% yield
Gas
Gas
Hot
sand
Condensa
te
Assessment of likely Technology Maturation Pathways for production of biojet fuel (The ATM Project) March 2019
34
on-line store8. BTG had designed and built a 48 tpd facility which was operated in Malaysia several
years ago (see Table below).
Another carrier-gas-free pyrolysis reactor is the “auger” or “screw” reactor which has been
used for more than 50 years in coal degassing and heavy oil coking applications (Meier et al., 2013).
Due to the relatively poor heat transfer through the auger shell, this technology is not well suited for
fast pyrolysis as it is only able to heat up the biomass relatively slowly. Auger reactors also produce
lower amounts of bio-oil as their slower heating and longer residence time characteristics favour
greater solids formation (a more “charcoal-like” process). However, it has been shown that the low-
grade liquid and the char can be recombined after recovery to produce pyrolysis “slurries” which can
serve as an improved feed for gasification. The energy density of the slurry can be in the range of 18-
25 GJ/m3, and is typically higher than char-free bio-oils (ca. 21 GJ/m3) or raw biomass (Dahmen et
al., 2012). An example of such a system is the Bioliq™ process from KIT in Germany which proposes
to use auger derived slurries to feed central large scale gasification facilities (Meier et al., 2013). If
both char and bio-oil are desired as co-products, the auger reactor may be a viable approach.
Although several groups around the world are pursuing biomass pyrolysis, the current
production capacity for fast pyrolysis oils is quite low. Bio-oil facilities that have been or will be
operated at the semi-commercial scale (> 50 tpd) are listed in Table 2 together with their
characteristics and reactor type. Most pyrolysis facilities to date are based on CFB and BFB reactor
designs which, as mentioned earlier, are relatively robust, scalable and result in relatively high yields
of bio-oil.
Some pyrolysis technology providers focus on small scale (1-5 tpd) and mobile pyrolizers.
These units are described as mobile densification facilities that produce liquid bio-oils or bioslurries
which are intended to be subsequently transported and processed or upgraded at large, centrally
located facilities. These plants can also be co-located with oil refineries to take advantage of co-
processing opportunities. Companies that lead this trend for mobile pyrolizer systems development
include Canada’s ABRI-Tech, California’s Cool Planet and ROI, in Alabama (Meier et al., 2013),
Battelle’s9 ton-per-day pilot mobile pyrolizer in Ohio can convert pine chips, shavings and sawdust into
up to 130 gallons of wet bio-oil per day10.
8 https://www.btg-btl.com/en/technology 9 http://www.biofuelsdigest.com/bdigest/2013/11/11/is-it-the-future-of-fuel-new-battelle-mobile-pyrolysis-unit-nets-130-gallons-of-
bio-oil-per-ton/ http://www.biofuelsdigest.com/bdigest/2013/11/11/is-it-the-future-of-fuel-new-battelle-mobile-pyrolysis-unit-nets-
130-gallons-of-bio-oil-per-ton/ 10 http://www.biofuelsdigest.com/bdigest/2015/08/03/the-pyromaniax-class-of-2015-the-top-10-pyrolysis-projects-in-renewable-
fuels/ http://www.biofuelsdigest.com/bdigest/2015/08/03/the-pyromaniax-class-of-2015-the-top-10-pyrolysis-projects-in-renewable-
fuels/

Assessment of likely Technology Maturation Pathways for production of biojet fuel (The ATM Project) March 2019
35
Table 2: Commercial and pre-commercial (≥ 50 tpd) bio-oil facilities in 2017
Company Location Status Capacity
(ODT)
Application Reactor type
Fortum,
Finland11
Joensuu CHP
plant
Demonstration 303 tpd* CHP fuel CFB integrated
with CHP
system (Metso
design)
Ensyn,
Canada
Renfrew,
Ontario
Commercial 70tpd(namepl
ate)
Bio-Oil12 CFB (Ensyn
design)
Quebec,
Canada
Commissionin
g end 2017
200 Bio-oil CFB (Ensyn
design)
Kerry
group/Red
Arrow,
Ireland/USA
Rhinelander,W
isconsin, USA
Commercial 3x(30-
40)tpd13
Food
flavouring
/browning
products and
CHP fuel
CFB (Ensyn
design)
BTG-BtL
Malaysia
Palm oil
processing
facility
Not operating 48 tpd Cofiring with
waste
Rotating Cone
(BTG design)
Hengelo, the
Netherlands)14
Commercial? 120 tpd
(nameplate)
CHP fuel Rotating Cone
(BTG design)
*calculations based on 330 day/year operations. Sources: (Oasmaa and Czernik, 1999; Dynamotive, 2009; BTG, 2012;
Starck, 2012; Bayar, 2013; Ensyn, 2013; Fortum, 2013; Green Fuel Nordic, 2013; KiOR, 2013; Landalv, 2013)
1.3.2 Catalytic pyrolysis & others
Catalytic pyrolysis is divided into in situ and ex situ pyrolysis processes. Ex-situ catalytic fast
pyrolysis is an uncatalyzed fast pyrolysis integrated with a catalytic post-treatment of pyrolysis vapors
before condensation (eg. zeolite such as HZSM-5) to deoxygenate pyrolysis vapors and to produce
aromatics and olefins. Ex-situ catalytic pyrolysis produces bio-oil with a lower oxygen content (ranging
between 4 – 35%) and allows a lower temperature processing regime than conventional uncatalyzed
fast pyrolysis. The advantage of ex-situ catalytic fast pyrolysis is that some of the polymerization and
gum formation reactions are prevented that greatly reduce viscosity and instability of bio-oil (Pham et
al., 2014).
In-situ catalytic fast pyrolysis is a process where the biomass is pyrolyzed at a lower
temperature (i.e. less than 500°C) with a catalyst (i.e. solid acid, alkali, non-acidic mixed metals,
transition metal or precious metal catalysts) in the heating medium or impregnated with the biomass
prior to the pyrolysis. Wang et al. (2014) compared ex-situ and in-situ catalytic pyrolysis using a
micro-reactor system. They found that in-situ pyrolysis produced more aromatics while ex-situ
produced significantly more olefins, although this is dependent on the catalyst used. KiOR is an
11 https://www.cif-ifc.org/wp-content/uploads/2016/10/First-Commercial-Pyrolysis-Oil-Plant-_-DEMO-2016_-Sikanen.pdf 12 http://www.biofuelsdigest.com/bdigest/2015/08/03/the-pyromaniax-class-of-2015-the-top-10-pyrolysis-projects-in-renewable-
fuels/ http://www.biofuelsdigest.com/bdigest/2015/08/03/the-pyromaniax-class-of-2015-the-top-10-pyrolysis-projects-in-renewable-
fuels/ 13 http://www.ensyn.com/licensed-production.html 14 https://biorrefineria.blogspot.ca/2015/06/empyro-project-commercial-scale-fast-pyrolysis-plant.html

Assessment of likely Technology Maturation Pathways for production of biojet fuel (The ATM Project) March 2019
36
example of a company that employed in-situ catalytic pyrolysis, although the company went bankrupt
in 2014. KiOR’s technology was based on a catalytic fast pyrolysis process using zeolite catalyst to
convert the lignocellulose into bio-oil. The bio-oil could then be upgraded to transport fuel blendstock
in a hydrotreater. Studies have shown that during the pyrolysis the alkali in biomass is deposited onto
the acidic catalyst thereby deactivating it (VTT). Non-acidic catalysts have been more recently under
development (Agblevor USU).
Another in-situ catalytic pyrolysis process (IH2) has been developed by the Gas Technology
Institute (GTI) in Des Plaines, Illinois in USA (Marker et al., 2012) and is licensed to SenSel Energy,
which has proposed three projects in the upper Midwest of USA. The process involves fast pyrolysis of
the lignocellulosic biomass in a catalytic fluidized bed at around 400–430°C under 14–35 bar of
hydrogen (i.e. hydropyrolysis) with a 500–850 μm in size hydropyrolysis catalyst developed by CRI
Catalyst, a project partner. The second stage of the process incorporates a second catalytic step to
convert the intermediate products into hydrocarbons, which can be fractionated to fuels.
1.3.3 Hydrothermal liquefaction
Hydrothermal liquefaction (HTL) is another thermochemical process which produces a
biocrude intermediate that can be further upgraded into fuels. However, it is quite distinct from
pyrolysis as it can utilize wet biomass. The process converts biomass to low oxygen bio-oil (10-20%
oxygen), depending on the specific processing conditions. The HTL process uses high pressures (e.g.
50 - 250 bar or more) and moderate temperatures (around 250-450 °C) as well as catalysts for 20-60
min to liquefy and deoxygenate biomass (Goudrian and Peferoen, 1990; Elliott, 2007; Akhtar and
Amin, 2011).
The HTL technology is not new and has been extensively studied. As early as the 1920s, Berl
proposed the concept of using hot water and alkali catalysts to produce oil out of biomass (Berl,
1944). This was the foundation of later HTL technologies that attracted research interest, especially
during the 1970s oil embargo. It was around that time that a high-pressure (hydrothermal)
liquefaction process was developed at the Pittsburgh Energy Research Center (PERC) and
demonstrated (at the 100kg/h scale) at the Albany Biomass Liquefaction Experimental Facility at
Albany, Oregon, US (Elliott, 2007). Subsequently Shell Oil developed the HTU™ process in the
Netherlands. The HTU™ process applied pressures in the range 150-180 bar and temperatures in the
range 300 to 350°C (Goudrian and Peferoen, 1990; Nielsen, Olofsson and Søgaard, 2012). As an
example, eucalyptus chips treated with HTU at 180 °C and 180 bar for 6 min yielded 48.6 wt% DAF
(dry and ash free basis) bio-oil, 32.8% gas and 18.6% aqueous phase. The oil contained 10% oxygen
(Goudrian and Peferoen, 1990). HTL oils can be very viscous and melting points of about 80 °C have
been reported (Elliott, 2007).
Potential feedstocks for HTL include lignocellulosic biomass (non-food), organic waste, sludge,
manures, peat, algae, as well as low-grade coals like lignite. While organic substances are insoluble in
water under normal conditions, water can be a good solvent for non-polar substances under
supercritical conditions (Tekin et al., 2014). An increase in the ionic character of water can facilitate
acid-base catalyzed reactions (Elliott, 2011). The hydrothermal liquefaction of biomass usually occurs
in the presence of an alkali metal and alkaline earth metal carbonate, bicarbonate or formate catalyst
(e.g., Na2CO3).
In the hot water environment, the reaction involves both hydrolysis and/or degradation of

Assessment of likely Technology Maturation Pathways for production of biojet fuel (The ATM Project) March 2019
37
macromolecules of biomass into small molecules. In this process, a substantial part of the oxygen in
the biomass is removed by dehydration or decarboxylation. In comparison with fast pyrolysis, HTL has
a lower oil yield around 30% but produces a relatively stable oil and does not require energy to dry
the biomass feedstock.
Steeper Energy uses HydrofactionTM technology which, under supercritical water conditions
transforms low-energy biomass feedstocks into a high energy density biocrude which can be further
upgraded into finished fuels. In March 2015, Steeper Energy received a $3m grant from the
Sustainable Development Technology Canada (STDC) Tech Fund (Lane, 2015b). This funding will be
used for the development of an industrial scale pilot plant to commercialize their HydrofactionTM of
lignocellulosic biomass technology. The goal of the project is to produce 100 barrels of biocrude per
day (i.e. 4.35 MLPY). The industrial scale pilot plant will be co-located with the Daishowa Marubeni
International (DMI) Alberta Peace River pulp mill. The company also indicated future plans for a
commercial plant at a scale of 2000 to 5000 barrels per day (i.e. from 87 to 217 MLPY). In December
2017, the company announced a partnership with Silva Green Fuel, a Norwegian-Swedish joint
venture, to construct a $59 M demonstration plant at a former pulp in Tofte, Norway. Steeper has
licensed its technology to Silva, who hope to build a 4,000 L/day facility over the next 18 months.
Start-up is planned for spring 201915.
Licella, an Australian company, developed a proprietary catalytic hydrothermal liquefaction
(HTC) process using supercritical water to convert lignocellulosic biomass feedstock to produce
biocrude. Licella has demonstrated conversion of Radiata Pine sawdust and other energy crops such as
corn stover and sugar cane trash into biocrude at their pilot plant in Whyalla, South Australia. The
pilot plant was constructed in 2011. In March 2013, Licella received $5.4 million from the Australian
Government through the Australian Renewable Energy Agency’s (ARENA) Advanced Biofuels
Investment Readiness program (Licella, 2013). This funding supported a $8.4 million feasibility study
into the construction of its first pre-commercial biofuel plant with a target production capacity of
125,000 barrels of biocrude oil per annum (i.e., 14.875 MLPY). In July, 2014, Licella identified an
optimum site for a commercial plant in the “Green Triangle” of South Australia. The target production
capacity is between 87 – 217 MLPY biocrude made from 200,000 odt/year of lignocellulosic biomass.
In 2017, Licella entered into a joint venture with Canfor, a Canadian company, with the aim of
developing a demonstration plant for production of biocrudes from forest residues. The company
received a $13M non-repayable contribution through Sustainable Development Technology Canada
that will enable Canfor to further develop and demonstrate Licella’s technology.16
Pacific Northwest National Laboratory (PNNL), with funding from the Bioenergy Technologies
Office of the US Department of Energy, has done extensive research and investigation into
hydrothermal liquefaction of lignocellulosics, food processing wastes, and algae in subcritical water.
The process licensee, Genifuel, has built a demonstration plant for Reliance Industries Limited in India
for liquefaction of algae. The team has also evaluated processing wet wastewater treatment sludge
through HTL to produce biocrude and upgrade to transportation fuels in collaboration with the WERF
and MetroVancouver.
15 http://www.biofuelsdigest.com/bdigest/2018/01/16/the-silver-in-silva-the-story-of-steeper-energys-59m-advanced-biofuels-project-in-
norway/ 16 http://www.biofuelsdigest.com/bdigest/2017/03/14/the-wonder-from-down-under-and-canadall-fund-er-canfor-picks-up-13m-for-licella-biofuels-project/

Assessment of likely Technology Maturation Pathways for production of biojet fuel (The ATM Project) March 2019
38
1.4 Bio-oils/biocrudes – composition, characteristics and upgrading challenges
Pyrolysis bio-oil (Py oil) is a dark brown liquid composed of more than 300 different carbon
molecules. Although referred to as an oil, with a similar physical appearance to crude oil, it is
chemically distinct and the term biocrude is more appropriate as a term for lignocellulose-derived
liquids/oils, as opposed to lipid-derived liquids/oils. In addition, differences in bio-oil characteristics
and composition are found using different process technologies and feedstocks. Generally, references
to bio-oil refer to fast pyrolysis bio-oils (FPO) as they have been extensively characterised. Bio-oils or
biocrudes from other processes are more specifically identified, e.g. catalytic pyrolysis bio-oil (CPO) or
hydrothermal liquefaction biocrudes (HTL biocrudes).
Pyrolysis oils contain about 40% oxygen compared to the typical maximum amount of 2%
oxygen found in crude oil (Speight, 2006). The oxygen content of biomass results in biofuels with
undesirably high reactivity (low chemical stability) and low energy density. Compared to crude oil, bio-
oil has less than 50% of the energy density (16-19MJ/kg vs 40 MJ/kg). Bio-oils/biocrudes based on
modified processes such as catalytic pyrolysis or HTL are expected to have significantly lower oxygen
content and Table 3 gives an indication in variation of chemical characteristics of bio-oils from a
variety of processing platforms. However, it should be noted that, although single data points are
provided for catalytic pyrolysis and hydrothermal liquefaction biocrudes, they would typically also
display properties over a range as process conditions may vary.
Table 3 Comparison of typical properties of bio-oils and biocrudes from lignocellulosic feedstock via different
technologies with crude oil. Variations in process conditions may result in variation in properties for catalytic fast
pyrolysis and hydrothermal liquefaction.
Fast pyrolysis 1 Catalytic fast
pyrolysis 2
Hydrothermal
liquefaction3
Crude oil
Water, wt% 15-30 8.3 0.8 0.1
pH 2-3 2.6 ~8 --
HHV, MJ/kg 16-19 30.4 38.6 44
µ50℃, Cp 40-100 285* 17,360*** 180
C, wt% 55-65 72 81.4 83-86
O, wt% 28-40 21.5 9.8 <1
H, wt% 5-7 6.4 8.7 11-14
S, wt% <0.05 -- 0.01 <4
N, wt% <0.4 0.02 0.095 <1
Yield, wt% 55-75 32(18**) 45.3 --
HDO’s H2, Scf/bbl fd 4 ~3400 -- ~1800 358-1150
1 Data taken from Mortensen et al. 2011; Dabros et al. 2018
2 Data taken from Passikallio 2016; *measured at 40 ℃; **recovered in the bio-oil fraction
3 Data taken from Jensen et al. 2017; ***measured at 40 ℃
4 Hydrogen required consumption for hydrotreatment, scf/bb fd (standard cubic feet/barrel feed) (Holladay, 2014)
Bio-oil composition is derived from the decomposition (depolymerisation and fragmentation
reactions) of the main biomass components of lignin, cellulose and hemicellulose (Oasmaa and
Czernik, 1999). From a compositional perspective, bio-oil resembles woody biomass much more than
it resembles crude oil.
Assessment of likely Technology Maturation Pathways for production of biojet fuel (The ATM Project) March 2019
39
Water is a major component of bio-oils and its concentration varies depending on the initial
moisture content of the biomass and the pyrolysis conditions used. Severe pyrolysis conditions (high
temperature and residence time) remove more water but also promote vapor polymerizations and
thus increase the viscosity and solids content of the resulting bio-oil (Oasmaa and Czernik, 1999).
Water is derived from both the original water in the feedstock and from the water formed during the
dehydration reactions occurring during pyrolysis. An excessive amount of water in bio-oils is
undesirable because it acts as a heat sink during combustion and it can also promote destabilization
and phase separation of the fuel during storage. To minimize the water content in bio-oil, the moisture
content of the biomass feedstock is best kept below about 10 wt% in the case of fast and catalytic
pyrolysis, although this is not applicable to hydrothermal liquefaction where much higher moisture
levels in feedstock can be tolerated.
As well as water, the other major chemical components of bio-oil include hydroxyaldehydes,
hydroxyketones, sugars, carboxylic acids, and phenolics (Bridgwater, 2012). As was the case with
water, the amount of these compounds in the bio-oil depends on the composition of the original
biomass as well as the pyrolysis conditions used. Some of these components, such as the sugars, are
hydrophilic but others, such as the phenolics, are more hydrophobic. Thus, most bio-oils can be
considered micro-emulsions. The continuous phase of the emulsion is the aqueous solution containing
the polysaccharide decomposition products and the discontinuous phase is the pyrolytic lignin (the
emulsion is mainly stabilized by weak hydrogen bonds). The breakdown of this emulsion results in the
formation of two phases, a lighter, more aqueous phase and a heavier, less aqueous (Bridgewater,
2012). If the aqueous phase is separated from the heavier phase, a significant amount of feedstock
carbon can be “lost”.
Pyrolysis oils are prone to “ageing” which is measured as increased viscosity over time and it
occurs through reactions between the oxygenated carbon molecules in the bio-oil emulsion.
Polymerization reactions between double bonded components as well as esterification and
etherification reactions between hydroxyl and carbonyl groups produce high molecular weight, water-
insoluble components such as gums. These reactions lead to increased viscosity and, ultimately, to a
phase separation of the bio-oil into an upper aqueous phase (containing a higher proportion of acids
and sugars) and a lower tar phase (containing less water and a higher proportion of water insoluble
solids and lignins) (Lehto et al., 2013).
The main factors that accelerate these undesirable “aging” reactions are:
• Time: most bio-oils destabilize/phase-separate after storage for about 6 months or
more) at room temperature.
• Temperature: The viscosity of a hardwood bio-oil could double after a year at room
temperature, after a week at 60 °C and after a day at 80 °C.
• Alkali char: catalyzes polymerization reactions thereby increasing bio-oil viscosity.
(Oasmaa and Czernik, 1999)
Processes such as hot filtration to remove char particles can improve the stability of bio-oils
(Sitzmann, 2009) or by adding solvents (Lehto et al., 2013) such as methanol. Methanol blending has
been shown to greatly improve the stability of bio-oils when used as burner fuels (Diebold, 2000). In

Assessment of likely Technology Maturation Pathways for production of biojet fuel (The ATM Project) March 2019
40
earlier work, Diebold & Czernik (1997) showed that a 10% methanol blending reduced the bio-oil
aging rate 20-fold. These and other stabilization techniques have been discussed earlier (Diebold,
2000; Oasmaa & Czernik, 1999) but nearly all of the options are costly and/or lead to bio-oil yield
loss. The impact of added solvents on the life cycle analysis has not been thoroughly investigated
although this project provides some insight into the matter. To our knowledge the ATM Project is the
first to assess the LCA implications of additives during upgrading.
Due to the substantial amounts of non-volatile materials found in bio-oils, such as sugars and
oligomeric phenolics, etc., they are unsuitable for distillation. The slow heating of the oils during
distillation accelerates the polymerization reactions resulting in the formation of heavy and non-
volatile compounds. Heavy Fuel Oil typically leaves 1% residue after vacuum distillation whereas a
bio-oil leaves up to 50% of the starting material as distillation residue. This poor distillation
performance has implications for further processing of bio-oils into drop-in fuels. Whereas crude oils
are first subjected to distillation after which fractions are upgraded into finished products, bio-oils
have to be subjected at least some upgrading first before any fractionation through distillation.
Bio-oils are already used as fuels for burner/boilers and burner/furnaces for stationary heat
and power generation. However, its water content, oxygenated compounds and char particles can be
challenging. They also have drawbacks for combustion such as low energy density, ignition difficulties,
high viscosity and instability as well as low pH and high particulate levels. Although bio-oils generally
produce less NOx and SOx than do fossil fuels (coal and oil), they typically emit more particulate
emissions due to the char content of the bio-oil (Lehto et al., 2013).
For bio-oils to be used as transportation fuel, upgrading has to be carried out. This section
looks at the two most suitable upgrading methods, hydrotreating and catalytic cracking.
1.5 Upgrading bio-oils/biocrudes to transportation fuels
Physical upgrading of bio-oil can take place through hot-vapour filtration, liquid filtration and
centrifugation (Bridgewater, 2013). Hot vapour filtration can reduce the ash content of the oil to less
than 0.01% and the alkali content to less than 10 ppm (Diebold et al., 1994). This reported value is
much lower than that produced in systems using cyclones only. The filtered bio-oil also has a lower
char content; however, the char is catalytically active and can potentially crack the vapours and
reduce the bio-oil yields to 20%. The low char content is also supported by the reduction in the bio-oil
viscosity and average molecular weight.
Liquid filtration of bio-oil is very difficult when filtering very low diameter particles (around 5
μm). This difficulty is due to complex interactions between the char and viscous components believed
to be lignin oligomers which rapidly clog the filter with a gel-like substance. The use of solvents or
self-cleaning filters are needed to overcome this problem (Bridgewater, 2012). UOP indicated the
desire to reduce the solids in the oil to preferably below 0.01 wt.% and that pressure filtration may
require up to 8 bar (Traynor et al., 2012). However, UOP suggested that centrifugation or ionic
exchange application may be a better method for removing the char from the bio-oil. Centrifugation
has been shown to be successful in reducing char content of the bio-oil. However, this reduces the
bio-oil yield as some of the bio-oil is disposed together with the char cake.
As discussed previously, bio-oils can be used in various stationary heat and power
applications or they can be upgraded to drop-in transportation biofuels such as diesel, gasoline and jet

Assessment of likely Technology Maturation Pathways for production of biojet fuel (The ATM Project) March 2019
41
fuel grade hydrocarbons. However, although the relatively high oxygen content of bio-oils can be
tolerated for direct combustion in stationary power applications, it is a significant problem for
automobile engines and jet engines.
Upgrading of bio-oils to transport fuels involves extensive deoxygenation with the major
challenge being to deoxygenate the bio-oil while maintaining high conversion yields and high
hydrogen-to-carbon ratios in the finished fuel.
Various upgrading techniques have been proposed over the last few decades with the top two
contenders being hydrotreating and zeolite cracking (Solantausta, 2011). Both processes are catalytic
and selectively promote hydrogenation reactions. Hydrotreating uses large amounts of hydrogen to
remove water from bio-oils in the form of H2O molecules. In contrast, zeolite cracking uses no
hydrogen but instead rejects oxygen in the form of CO2, thus lowering the biofuel yield. Both
technologies try to elevate the effective H/C ratio of bio-oils from about 0.2 to about 2 in order to fit
the functional properties of hydrocarbon motor fuels. Virtually all the current bio-oil upgrading
processes originated in the petroleum industry and use specialized catalysts to improve reaction
selectivity. As capital costs for upgrading bio-oils are high it would be synergistically beneficial if
existing oil refinery equipment could be used to process these biomass derived liquids.
Deoxygenation of biomass intermediates is essential for the production of drop-in biofuels and
is achieved through three main chemical reduction processes: (1) decarbonylation (producing CO &
H2O); (2) decarboxylation (DCO) (producing CO2) and (3) hydrodeoxygenation (HDO) (producing
H2O). These reactions are illustrated for the deoxygenation of fatty acids in Figure 5 but are generally
applicable to deoxygenation of any oxygen-containing biomass.
Figure 5 Deoxygenation reactions
During hydrodeoxygenation the hydrogen present in the biomass intermediates (or supplied
externally) is oxidized and oxygen can be removed as water (H2O). During decarboxylation the
carboxyl group carbon is oxidized and the oxygen is removed as carbon dioxide. During
decarbonylation, oxygen is removed as carbon monoxide with a water molecule also formed. While
reaction conditions can be adjusted to favour one reaction (e.g. the type of catalyst used), in practice
these processes take place simultaneously. The HDO process is typically favoured when hydrogen is
externally added (e.g. hydrogen gas derived from natural gas) while, in the absence of hydrogen, the
DCO route is favoured (NSF, 2011; Pearlson, 2011). However, it is interesting to note that some co-
processing studies in a fluid catalytic cracker (where no additional hydrogen is added), resulted in

Assessment of likely Technology Maturation Pathways for production of biojet fuel (The ATM Project) March 2019
42
hydrogen transfer between molecules and all three reactions still took place (from fossil molecules to
biomolecules) (Pinho et al. 2015, 2017).
When decarboxylation or decarbonylation takes place, feedstock carbon is lost by oxidation
and, as a result, the yield of hydrocarbons is reduced. When hydrogen inputs are used to remove
oxygen, yields of hydrocarbons are generally higher, but the cost and sustainability of the imported
hydrogen has to be considered.
1.5.1 Hydrotreating
Hydrotreatment is a hydrogen-intensive process for deoxygenating and upgrading bio-oils to
drop-in- transportation fuels. Higher levels of hydrogen are needed to hydrotreat bio-oils because they
contain about 40-50 wt% oxygen compared to the 10% typically found in vegetable oils. Thus bio-oils
require extensive hydrogen and processing effort to become functionally equivalent to petroleum
diesel. The targeted chemical reaction in bio-oil hydrotreating is the rejection of oxygen in the form of
H2O. This hydrodeoxygenation (HDO) reaction of bio-oil is conceptually represented as:
C1H1.33O0.43 + 0.77H2 → CH2 + 0.43H2O (Bridgwater, 2012)
However, in practice, hydrotreatment is not highly selective and the HDO reaction described
above does not take place in isolation but rather in association with other reactions which divert
carbon and/or hydrogen from the targeted liquid fuel product. These reactions include polymerization
and condensation to form tars and coke, gasification to form methane or COx and reactions that form
low H/C hydrocarbons such as aromatics and olefins (Bridgwater, 2012). Thus, the low selectivity for
hydrodeoxygenation and hydrogenation reactions often leads to low fuel yields and high hydrogen
requirements.
In most of the hydrotreating processes modelled so far the biomass to fuel yield is around
25% by mass (55% by energy) when hydrogen is provided externally and 15% (33%) when hydrogen
is produced by gasifying the biomass (Brown, 2011; Bridgwater, 2012; Dynamotive, 2013). These
relatively poor carbon yields and hydrogen use efficiencies can be improved through the development
of more selective catalysts and optimized processes.
Owing to the highly heterogeneous, oxygenated and reactive nature of bio-oils, their
hydrotreatment is a lot more complex than that of petroleum. In oil refineries, hydrotreatment is
mainly used to remove sulfur from petroleum feeds in a process known as hydrodesulfurization (HDS).
The process conditions include temperatures that range between 300 and 600 °C, hydrogen pressures
of 35 to 170 bar and liquid hourly space velocities (LHSV) of 0.2 to 10 per hour. The catalysts used in
petroleum HDS are typically sulfided Co-Mo and Ni-Mo supported on porous alumina or aluminosilicate
matrices. Unfortunately, as described below, these conditions are not suitable for processing bio-oils
for a number of reasons:
• Sulfided Co-Mo and Ni-Mo catalysts, when in contact with bio-oils, are rapidly
stripped of their sulfur and require constant resulfurization (addition of H2S) to
prevent catalyst deactivation (Huber, 2007). This deprives bio-oils of their low sulfur
content advantage (Wang et al., 2013)
Assessment of likely Technology Maturation Pathways for production of biojet fuel (The ATM Project) March 2019
43
• Alumina supports create an acidic environment and they are not stable in the
presence of water (irreversible dealumination) (Mortensen et al., 2011)
• Bio-oils are unstable at high temperatures as they can rapidly become viscous and
eventually phase separate.
• Bio-oils tend to form coke residues, particularly in acidic environments and at high
temperature and pressure. Coke is undesirable as it deactivates the catalysts by
depositing on their active sites and it can severely plug reactor components (Wang et
al., 2013).
• The water in bio-oil inhibits hydrotreating by modifying and deactivating the catalysts
and by adsorbing onto active sites (Furimsky and Massoth, 1999). Aside from the
water content of bio-oils (up to 30%), more water is produced upon hydrotreatment.
These and other limitations have motivated the search for hydrotreating processes and
catalysts that are better suited to the highly oxygenated and heterogeneous nature of bio-oils. Early
research focused on adjusting process conditions and working with model bio-oil mixtures while using
the same sulfided catalysts that oil refineries use for desulfurization (Corma et al., 2007). Although
these alumina supported Co-Mo and Ni-Mo catalysts have various problems in processing bio-oils, they
improve hydrotreating selectivity and they are widely available at relatively low cost.
Bio-oils are thermally unstable and it is generally thought that they would likely have to first
be pretreated at lower temperatures in order to form a stable oil intermediate that can then be further
hydrotreated at high temperatures. Although single stage hydrotreating of bio-oil at high
temperatures has been attempted, it resulted in a heavy, tar like product (de Miguel Mercader et al.,
2010; Jones et al., 2009) due to the polymerization, charring and eventually coking reactions which,
at high temperatures, take place faster than the desired hydrotreating reactions. However, effective
hydrotreatment often requires high temperatures and hydrogen pressures and extended reaction
times (up to 4 hours) (Elliott, 2007). To fulfil these disparate condition requirements for stabilization
and complete hydrotreatment of bio-oils, a two-stage bio-oil upgrading approach is commonly used
(Elliott, 2007; Jones et al. 2009). The first, mild, catalysed hydrotreatment stabilizes the bio-oil and a
second, higher severity hydrotreatment stage deoxygenates the fuel to transport-grade liquids. The
first hydrotreatment typically forms at least two phases, one hydrophobic and one hydrophilic and
effectively separates out a large proportion of the water within the bio-oil. The resulting hydrophobic
liquid is more stable and amenable to further catalytic upgrading. Fast pyrolysis bio-oils, catalytic
pyrolysis bio-oils and hydrothermal liquefaction biocrudes may require significantly different
approaches.
When earlier workers (Centeno, Laurent and Delmon, 1995; Ferrari et al., 2001) investigated
the fundamentals of bio-oil hydrotreatment using traditional sulfide molybdenum catalysts on model
bio-oil compounds such as ketones, esters and phenolics (while alcohols and carboxylic acids where
formed in the process), they concluded that ketones react first at lower temperatures (> 200 °C) to
form alkenes while carboxylic and phenolic groups are converted at higher temperatures (> 300 °C).
This early work lead to a proposed reactivity scale for the major components of bio-oils; the scale is
plotted in Figure 6. The olefins and other double bond species are the most reactive and can be
hydrogenated to more stable components such as alcohols and alkanes at temperatures around 250
°C and below. Alcohols are dehydrated to olefins at temperatures closer to 300 °C while carboxylic
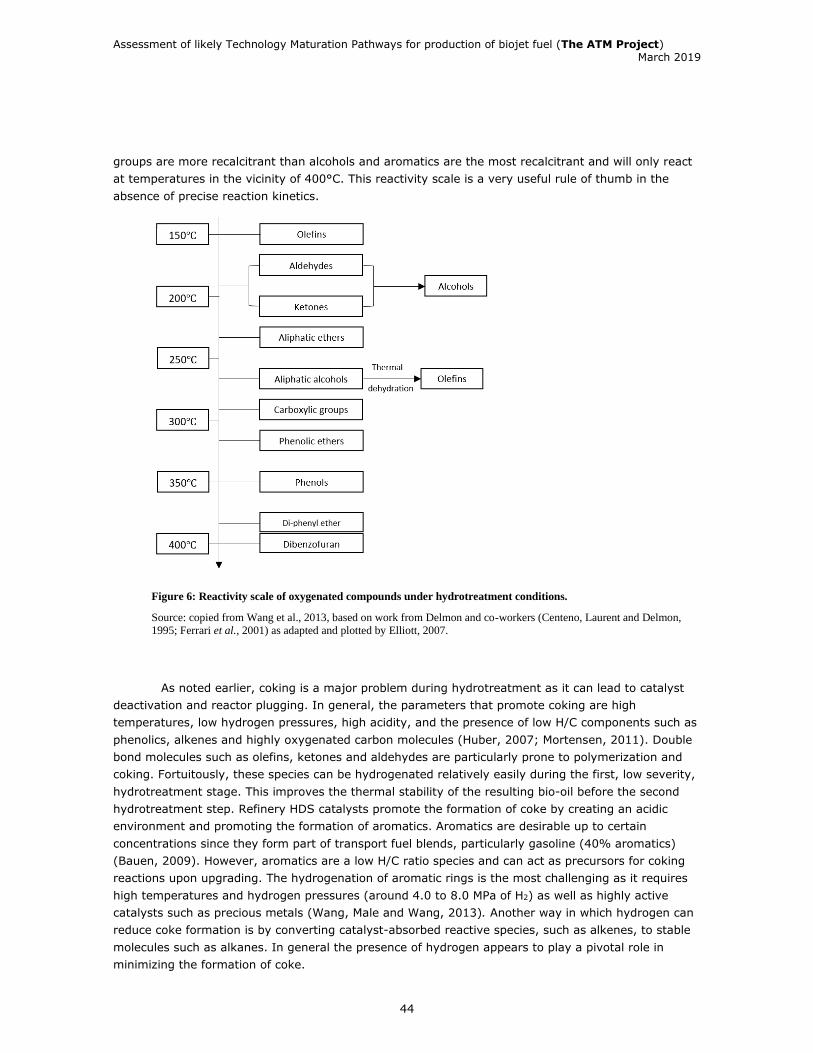
Assessment of likely Technology Maturation Pathways for production of biojet fuel (The ATM Project) March 2019
44
groups are more recalcitrant than alcohols and aromatics are the most recalcitrant and will only react
at temperatures in the vicinity of 400°C. This reactivity scale is a very useful rule of thumb in the
absence of precise reaction kinetics.
Figure 6: Reactivity scale of oxygenated compounds under hydrotreatment conditions.
Source: copied from Wang et al., 2013, based on work from Delmon and co-workers (Centeno, Laurent and Delmon,
1995; Ferrari et al., 2001) as adapted and plotted by Elliott, 2007.
As noted earlier, coking is a major problem during hydrotreatment as it can lead to catalyst
deactivation and reactor plugging. In general, the parameters that promote coking are high
temperatures, low hydrogen pressures, high acidity, and the presence of low H/C components such as
phenolics, alkenes and highly oxygenated carbon molecules (Huber, 2007; Mortensen, 2011). Double
bond molecules such as olefins, ketones and aldehydes are particularly prone to polymerization and
coking. Fortuitously, these species can be hydrogenated relatively easily during the first, low severity,
hydrotreatment stage. This improves the thermal stability of the resulting bio-oil before the second
hydrotreatment step. Refinery HDS catalysts promote the formation of coke by creating an acidic
environment and promoting the formation of aromatics. Aromatics are desirable up to certain
concentrations since they form part of transport fuel blends, particularly gasoline (40% aromatics)
(Bauen, 2009). However, aromatics are a low H/C ratio species and can act as precursors for coking
reactions upon upgrading. The hydrogenation of aromatic rings is the most challenging as it requires
high temperatures and hydrogen pressures (around 4.0 to 8.0 MPa of H2) as well as highly active
catalysts such as precious metals (Wang, Male and Wang, 2013). Another way in which hydrogen can
reduce coke formation is by converting catalyst-absorbed reactive species, such as alkenes, to stable
molecules such as alkanes. In general the presence of hydrogen appears to play a pivotal role in
minimizing the formation of coke.

Assessment of likely Technology Maturation Pathways for production of biojet fuel (The ATM Project) March 2019
45
While this more fundamental work has built an invaluable body of knowledge around the
hydrotreatment and coking mechanisms of bio-oils, these studies have been mainly based on “model”
as opposed to “real” bio-oils (Butler et al., 2011). In contrast, Elliott and co-workers (Elliott, 2007)
used sulfide Co-Mo and Ni-Mo catalysts on real bio-oil substrates and developed a two stage process
that brings the oxygen content of the bio-oil down to < 1 wt%. The first stage of the process is
conducted at 270°C and 136 bar and the second at 400°C and 136 bar. Consistent with the known
challenges of these catalysts, the authors reported catalyst deactivation and formation of gums as
major drawbacks of the process.
More recent research has focused on developing catalysts that may circumvent the challenges
encountered with traditional HDS catalysts such as CoMo and NiMo supported on alumina materials.
Precious metals such as Ruthenium, Palladium and Platinum have been assessed as bio-oil
hydrotreatment catalysts (Bridgwater, 2012). These metals performed better than CoMo and NiMo
catalysts in terms of both hydrocarbon yields and H/C ratio of final product (Wildschut et al., 2009; Lin
et al., 2011; Wang, Male and Wang, 2013). They are also more stable, less acidic and do not promote
coking particularly when supported on non-acidic carbon. The company UOP has been a leader in
using precious metal catalysts for hydrotreatment of petroleum. Together with PNNL they have
assessed the potential of non-sulfided metal catalysts such as Ruthenium on bio-oils. Ruthenium
seems to be the lowest cost and most promising of the precious metal catalysts assessed so far
(Wildschut et al., 2009, 2010; Wildschut, Melian-Cabrera and Heeres, 2010). When Lin et al. (2011)
assessed various precious metal catalysts using the model compound guaiacol, they reported that the
Ru-based catalyst showed the best HDO activity and a preference to saturate benzene rings. Although
Ruthenium is less expensive than Palladium and Platinum, on June 28, 2013 the spot price for Ru was
about USD $3 million/t which is more than a 100 times the same day price of Cobalt (ca. USD $30,000
USD/t), Nickel (ca. USD $10,000/t) or Molybdenum (ca. USD $20,000/t) (IndexMundi, 2013;
InvestmentMine, 2013). Although precious metal catalysts are more favoured for bio-oil
hydroprocessing, as they are more active in comparison to NiMo and CoMo based catalysts, their cost
is so prohibitive that their use in industrial applications may be very limited.
The ability to recycle and the stability of Ru/C catalysts has been challenged by Wildschut
(2009). When he conducted three successive hydrotreatment reactions (200 bar, 350oC and 4.3 h
each) where the catalyst was reused after repeated acetone washes, he found that the activity of the
catalyst deteriorated even after the first repeat. After 2 repeats the oil yields dropped significantly (55
to 30%-wt.), whereas the amount of gas phase (5 to 11%-wt.) and solids (3 to 20%-wt.) increased,
all indicating significant catalyst deactivation. This deactivation mostly affected the ability of the
process to hydrogenate while it did not affect much of its ability to deoxygenate. The deactivation was
attributed to sintering and coke formation on the surface of the catalyst. It would therefore be
desirable if the catalysts could have been regenerated with a more effective technique than acetone
washing.
The prohibitive price of precious metals means that novel catalysts have to be designed which
will achieve high hydrotreating activity at lower cost. Although phosphide catalysts have been
suggested as alternatives to sulfide catalysts they face similar issues. Once in contact with water they
form phosphates which can deactivate the active sites on the catalyst (Wang et al. 2013).
Other than deoxygenation, the hydrotreatment of bio-oils has many favourable side effects
such as decreasing its water content, increasing its energy density (from 18 MJ/kg in crude bio-oil to
40 MJ/kg in hydrotreated bio-oil), decreasing its bulk density (from >1 in bio-oils to <0.8 in
Assessment of likely Technology Maturation Pathways for production of biojet fuel (The ATM Project) March 2019
46
deoxygenated bio-oils), decreasing the coking propensity, and decreasing its viscosity (from > 100cps
in raw bio-oil to <5 cps in bio-oil that contains <5% oxygen) (Elliott, 2007). All of these advantages
result in higher yields and the higher H/Ceff ratio of the final transport fuel product. These benefits are
generally absent in any bio-oil upgrading technologies that do not entail any hydrogen inputs.
1.5.2 Catalytic cracking
Catalytic cracking is a process used in the Fluid Catalytic Crackers (FCCs) of oil refineries and
it has potential in bio-oil upgrading as a non-hydrogen consuming, non-pressurized alternative to
hydrotreatment. The main deoxygenation mechanism of catalytic cracking is the rejection of oxygen in
the form of coke and CO2. The conceptual reaction of this mechanism is summarised below:
C1H1.33O0.43 + 0.26O2 → 0.65CH1.2 + 0.34CO2 + 0.27 H2O
When this formula is compared with the earlier equivalent formula for hydrotreating it is
apparent that, in the absence of hydrogen, as occurs in zeolite cracking, bio-oil upgrading is poor. The
theoretical carbon yields for catalytic cracking are low (65% compared to 100% in hydrotreatment)
and the hydrocarbons produced have a low H/C ratio (1.2 compared to 2 for hydrotreatment). This
low H/C ratio indicates that the upgraded bio-oil is rich in aromatics and olefins and that the resulting
fuel will have a low heating value, typically about 20-25% lower than crude oil (Balat et al., 2009;
Mortensen et al., 2011). Similar to what occurs in hydrotreatment, the cracking reaction takes place
alongside other undesirable reactions such as polymerization and coking which results in the diversion
of some of the carbon from the targeted liquid biofuel. Thus, even in the presence of catalysts,
cracking typically results in bio-oil-to-fuel yields in the range of 14-23 wt% of bio-oil (Balat et al.,
2009), which is much lower than the theoretical 45 wt% yield which can be calculated from the
equation above. This is largely because 26-39 wt% of the starting bio-oil goes towards the formation
of solid tar and cokes (Balat et al., 2009).
Zeolites such as ZSM-5 and HZSM-5 are made of a highly porous aluminosilicate matrix and,
as a result, they are typically not stable in the presence of bio-oils at high temperatures and
pressures. Zeolite catalysts such as ZSM-5 have a strong acidity, high activities and shape selectivities
which work well for upgrading petroleum feeds. However, for bio-oils, zeolite cracking poses severe
catalyst coking and deactivation issues.
On the more positive side zeolite cracking requires no hydrogen gas and can operate at
atmospheric pressures. This means that FCC-type systems can be used for bio-oil processing where
the heavily coked catalyst can be rapidly regenerated in the FCC combustor. These systems have
great potential to utilise the coke formed on catalysts as a fuel for heat and power generation.
However, these systems often convert more biomass carbon to thermal energy than to liquid fuel
products. Operating costs of FCCs are higher than regular fixed bed reactors because the faster
recycling of carrier gas needed to regenerate the rapidly coked catalyst is highly energy intensive.
Other workers (Vispute et al., 2010) have proposed an approach that involves a mild
hydrotreating step prior to zeolite cracking. The advantage of this approach is that it converts the
most reactive oxygenated compounds, the carbonyls, to more thermally stable alcohols. In zeolite
cracking carbonyl functionalities go directly to coke formation whereas alcohols contribute to the
Assessment of likely Technology Maturation Pathways for production of biojet fuel (The ATM Project) March 2019
47
formation of valuable molecules such as olefins and aromatics. The introduction of a mild
hydrotreatment step prior to zeolite cracking appears to result in bio-oil conversion yields (aromatics)
as much as three times higher than direct zeolite cracking. This is particularly desirable for BTX
(benzene, toluene, xylene) production which is the target of the Huber group’s spin off company
AnelloTech. However, the alkane yields are low and, while this technology may be relevant to making
aromatic fractions for gasoline, it is not directly applicable to the production of the longer chain
hydrocarbons that are needed for the production of diesel and jet fuels.
1.6 Refinery integration of liquefaction platform as an upgrading strategy
The ATM Project selected two laboratories with distinct upgrading approaches and this is
described in Chapter 3. Canmet followed a “co-processing” approach which involved mixing the bio-
oil/biocrude with furnace fuel oil (fossil-based) prior to single-stage hydrotreating. The products were
therefore a mixture of fossil hydrocarbons and renewable hydrocarbons and this was identified
through C14 methods. The second approach was carried out by PNNL with hydrotreatment conducted
on the bio-oils/biocrudes either in single stage or two-stage approach (for fast pyrolysis bio-oil). Both
of these approaches were carried out at pilot scale. Part of the ATM Project is the development of a
demonstration-scale engineering design for scaling up the upgrading.
Hydrotreating approaches were followed for upgrading, but this is not the only approach
possible. As shown in the previous section, catalytic cracking is an alternative approach to upgrading.
As this is generally used in refineries for producing gasoline, rather than jet, this approach was not
followed in the ATM Project.
A further distinction can be made between dedicated upgrading of biobased feedstocks; and
upgrading methods based on fossil feedstocks, but with a co-processing strategy (insertion of
biobased feedstocks/intermediates into an existing refinery in low concentrations and processing as
normal.)
As mentioned earlier, the majority of the processes and catalysts used to upgrade pyrolysis
oils originate in the oil refining industry. It has also been suggested that pyrolysis oils or their
derivatives could be “dropped into” existing refineries for final processing (Corma et al., 2007;
Solantausta., 2011). The main benefit of this approach is capital cost savings by utilizing facilities and
off-take infrastructure that has already been built. For example, the USDA “Regional Roadmap to
Meeting the Biofuels goals of the Renewable Fuels Standard” (2010) concluded that 527 new
biorefineries would be needed to meet the requirements of the RFS 2, at a cost of about 168 billion
USD (Weyen, 2012). A big part of this capital cost could be avoided if biomass intermediates could be
upgraded to biofuels using existing oil refinery equipment. An important trend that is projected for the
next three decades is that refineries in the US and around the world will be producing less gasoline
and more diesel and jet fuels (more middle distillates). This shift translates to refineries directing
petroleum feed away from FCC units and towards hydrocracking units. According to the US EIA 2013
Annual Energy Outlook (EIA, 2013), the already decreased utilization of FCCs (83% in use in 2011) in
US refineries is expected to decline further and approach 62% in 2040. In contrast the US
hydrocracking capacity is expected to increase from 1.8 million bpd in 2012 to 3 million bpd in 2040.
Assessment of likely Technology Maturation Pathways for production of biojet fuel (The ATM Project) March 2019
48
More recently, OPEC’s World Oil Outlook (2016)17 projected utilization of hydrocracking units to be in
the low 80% range, through the period to 2040 while FCC unit utilization peak at 81% close to 2020
due to short-term gasoline demand increase and then gradually down to 75% after 2030.
It has been suggested that oil refiners could either dedicate whole process units such as
hydrotreaters exclusively to bio-oil processing or they could co-process bio-oils together with
petroleum feeds (Corma et al, 2007, Egeberg et al., 2010). Dedicating whole refinery units to
upgrading bio-oil derivatives would save capital costs and avoid complications of co-processing.
However, candidate refinery units for biomass liquids processing such as hydrotreating and
hydrocracking facilities are very large scale and as noted earlier, they typically process around
100,000 barrels of fuel per day. Commercial pyrolysis facilities are usually envisioned to be about 30
times smaller at around 3,000 barrels per day, at a scale large enough to benefit from economies of
scale while small enough to avoid transporting bulky and wet biomass over prohibitively long distances
(Stephen, Mabee and Saddler, 2010). Thus sourcing, transporting and utilising the biomass feedstock
needed to occupy a whole refinery unit will be challenging. Thus, co-processing is a more likely
integration pathway than dedicating entire refinery units to biomass feeds. Co-processing also has the
advantage that small amounts of biomass derived liquids can be blended with petroleum feeds
mitigate the problems that come with neat pyrolysis oil processing.
As mentioned earlier, neat pyrolysis oil is challenging to co-process with petroleum feeds as
they typically contain up to 30% water and 40% oxygen and has limited miscibility with the apolar
petroleum liquids (Venderbosch and Prins, 2011). As the oxygen content of bio-oils also increases
coking and deactivation of zeolite and HDO catalysts they cannot be readily inserted in oil refineries
before at least partial deoxygenation (hydrotreated). However, it will be important to deoxygenate
only enough to meet the minimum requirements of the refinery since deoxygenation gets
disproportionately costlier when approaching oxygen-free bio-oils (Ringer, Putsche and Scahill, 2006;
Elliott, 2007).
Once the oxygen content of the bio-oil has been reduced by hydrotreatment, it becomes a
liquid hydrocarbon intermediate (such as hydrodeoxygenated oil, (HDO)) that can potentially be
inserted into an oil refinery. As HDO bio-oils, even when partially deoxygenated, are unstable at 400
°C or 500 °C (temperatures that are often used in petroleum distillation) they cannot be directly
inserted with crude oil at an early process stage of the refinery. Thus bio-oil insertion is likely to occur
at the refinery’s hydroprocessing (hydrotreatment and hydrocracking) or fluid catalytic cracking
reactors. As described earlier, these two processes are similar to the processes used for
hydroprocessing and zeolite cracking of neat pyrolysis oils in stand-alone setups. A simplified
schematic showing HDO bio-oil insertion points (red arrows) within a typical refinery is outlined in
Figure 7.
17 https://woo.opec.org/images/woo/WOO_2016.pdf
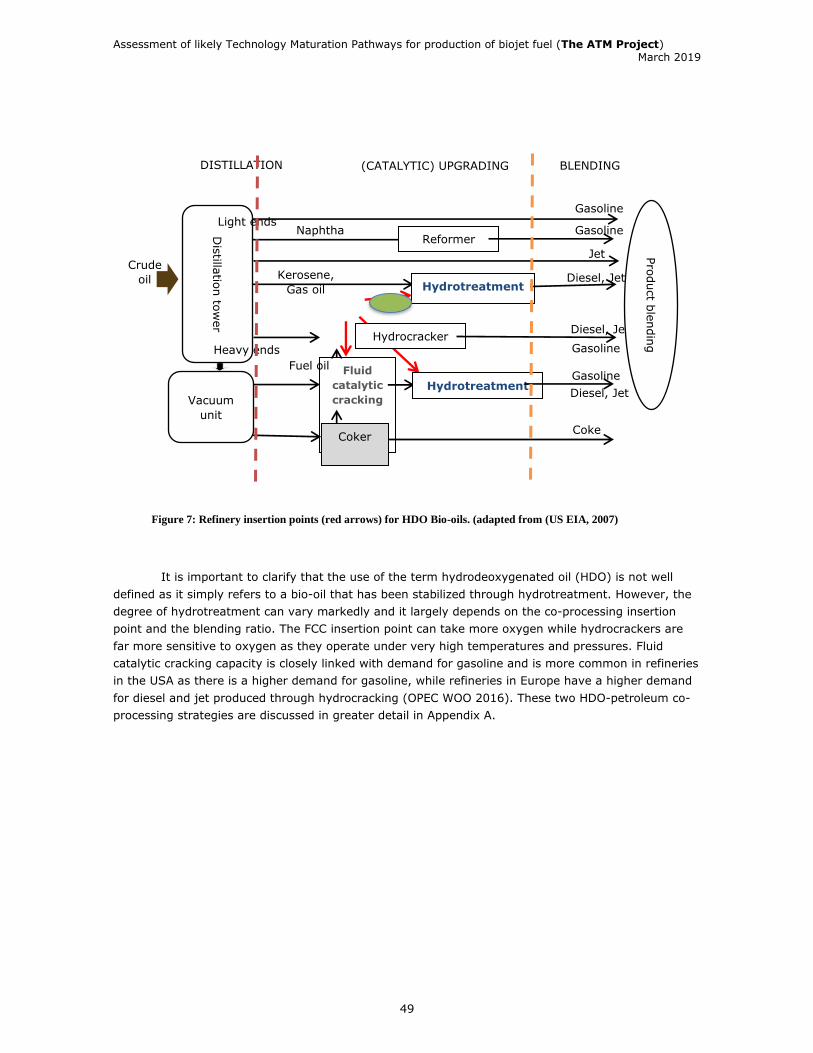
Assessment of likely Technology Maturation Pathways for production of biojet fuel (The ATM Project) March 2019
49
Figure 7: Refinery insertion points (red arrows) for HDO Bio-oils. (adapted from (US EIA, 2007)
It is important to clarify that the use of the term hydrodeoxygenated oil (HDO) is not well
defined as it simply refers to a bio-oil that has been stabilized through hydrotreatment. However, the
degree of hydrotreatment can vary markedly and it largely depends on the co-processing insertion
point and the blending ratio. The FCC insertion point can take more oxygen while hydrocrackers are
far more sensitive to oxygen as they operate under very high temperatures and pressures. Fluid
catalytic cracking capacity is closely linked with demand for gasoline and is more common in refineries
in the USA as there is a higher demand for gasoline, while refineries in Europe have a higher demand
for diesel and jet produced through hydrocracking (OPEC WOO 2016). These two HDO-petroleum co-
processing strategies are discussed in greater detail in Appendix A.
Crude
oil
Dis
tillatio
n to
wer
Vacuum
unit
Light ends
Heavy ends
Reformer Gasoline
Jet
Hydrotreatment Diesel, Jet
Hydrocracker Diesel, Jet
Gasoline
Fluid
catalytic
cracking
Coker Coke
Hydrotreatment Gasoline
Diesel, Jet
Pro
duct b
lendin
g
DISTILLATION (CATALYTIC) UPGRADING BLENDING
Naphtha
Kerosene,
Gas oil
Fuel oil
Gasoline

Assessment of likely Technology Maturation Pathways for production of biojet fuel (The ATM Project) March 2019
50
CHAPTER 2 – FEEDSTOCK AND SUPPLY CHAIN 2.1 Availability and cost of forest residues and other lignocellulose feedstock in Canada
Canada is the second largest country in the world, with forest or other wooded land making
up 40% of its 979 million hectares. In addition, Canada has 68 million ha of agricultural land,
producing over 100.6 million tonnes of agricultural products each year. With active forest and
agricultural industries, Canada has substantial biomass resources that can be used to produce
bioenergy and biofuels (Canadian Council of Forest Ministers, 2018; Li et al., 2012). Figure 8 shows
maps of agricultural (a) and forest lands (b) in Canada.
Sustainable forest practices are at the forefront and Canada is the leading country in forest
certification on a global scale. Only 10% of the world’s forests are certified, and Canada holds 40% of
the world’s forest certification (i.e. 170 million ha). Forest certification provides independent
assurance that forest products are legally sourced from sustainably managed forests (Canadian
Council of Forest Ministers, 2016). With vast forest and agricultural resources and an innovative and
sustainable forestry and agriculture industry, Canada could potentially support an evolving advanced
biofuel sector.
Figure 8. Map of agricultural and forest lands in Canada covering about 7% and 40% of total landmass in Canada,
respectively (AAFC, 2012; NRCan, 2018).
Biomass is currently the second largest source of domestic renewable energy (i.e. heat, power
and biofuels) in Canada (26%) after hydropower (69%), as shown in Figure 9. The share of biomass
in total primary energy supply in the Canada has been relatively stable around 4.5% over the past five
years (IEA Bioenergy, 2018).

Assessment of likely Technology Maturation Pathways for production of biojet fuel (The ATM Project) March 2019
51
Figure 9. Total primary energy supply of renewable energy sources in Canada in 2016 (Petajoule -PJ). After
hydropower, the second largest single source of renewable energy is biomass, representing about 26% of total
renewables supply and around 4.5% of the total primary energy supply in 2016 (IEA Bioenergy, 2018).
The most used source of biomass to produce electricity and steam in Canada is industrial
wood waste, particularly from the pulp and paper industry. Every year, more than 400 PJ of bioenergy
are produced and used in the industrial sector. The pulp and paper industry is by far the largest
industrial user of bioenergy, which accounts for more than half of the energy used in this industry. The
2013 Canadian Bioenergy Data Survey showed cogeneration taking place at 39 pulp and paper mills.
Large heat and power are not only found at pulp and paper companies and there are also 23
independent heat and power producers in Canada, including eight in BC (Bradburn, K., 2014). The
majority of the used woody biomass is black liquor and sawmill residues, the byproduct of chip and
sawmill plants.
Biofuels are a growing form of renewable energy and Canada accounted for 2% of world
biofuels production (5th highest in the world after the United States, Brazil, the European Union and
China) (NRCan, 2018). The principal agricultural feedstocks for producing ethanol in Canada are corn
and wheat. Canola, animal fat, and recycled oils remained the primary biodiesel feedstocks (USDA,
2018).
2.1.1 Lignocellulosic biomass resources in Canada Although forest biomass, agricultural crops and waste have been used as feedstocks for
production of bioenergy and biofuels, there are still significant quantities of underutilized
lignocellulosic biomass resources in Canada that can be used as feedstock for the production of
advanced biofuels such as biojet. Table 4 shows different types of potential biomass sources, their
estimated availability in Canada and cost (as a range for delivered feedstock). The available quantities
and average delivered costs of these biomass resources will be discussed in the next sections.
1,397
528
100 12
Hydropower
Biomass
Wind
Solar

Assessment of likely Technology Maturation Pathways for production of biojet fuel (The ATM Project) March 2019
52
Table 4. Biomass availability and cost estimations in Canada
(National Forestry Database, 2017; International Wood Markets Grou Inc., 2014; Industrial Forestry Service Ltd. et al., 2015;
Mobini, 2015; Roach and Berch, 2014; Wood Pellet Association of Canada, 2018; Li et al., 2012; Statistics Canada, 2016)
Biomass type Average
availability/year
(million dry tonnes)
Average delivered cost
($/dry tonnes)d
Roundwood 33.3 76-259
Harvest/logging residues 13.2 69-90
Sawmill residues (woodchips,
sawdust, wood shaving and hog
fuel)
-a Hog fuel: 12-13
Sawdust/yard waste: 20-30
Wood shaving: 25-52
Residual chips: 70-110
Wood pellets -b 100-117e
Agricultural residues 52.8 82-94
Municipal solid waste (MSW) 28.77 (67-133)c(negative cost)
a A significant proportion of sawmill residuals in Canada is already committed to the existing pulp and paper mills,
bioenergy plants, board mills and pellet plants or used internally by mills for their own energy consumption. There are
surplus quantities of sawdust, wood shavings and hog fuel available in the country. However, these are widely dispersed
and are not available in sufficient volumes in a specific region of the country to meet the annual feedstock demand of a
commercial-scale biofuel plant. The change in the dynamics of the forest products industry can increase the availability
of this forest biomass source, for example the increase in the production capacity of sawmills or downturn in pulp
production in Canada.
b About 95% of the produced wood pellets in Canada is currently exported to the EU, USA, and Asia and 5% is
consumed in the domestic market
c Tipping fee paid to MSW receivers
d All dollar values in this report are Canadian
e Price of wood pellet at the pellet plant
2.1.2 Forest biomass resources in Canada The main source of biomass in Canada is forest biomass. Forest-based biomass include: 1)
roundwood (the trunk of the tree); 2) harvest residues (tops, branches, and non-merchandise timber
from harvest operations); 3) mill residues (chips, sawdust and shavings, and hog fuel); and 4)
intermediates such as wood pellets. The amount of wood permitted to be harvested in Canadian
Provinces on an annual basis is called the Annual Allowable Cut (AAC). All forest-based feedstocks
originate from harvesting under the AAC. Typically, trees are logged on site and tops and branches
(harvest residues) removed and left at the harvesting site. The roundwood is transported to sawmills
where it is cut to a predetermined length, while the mill residues are generated at sawmills,
representing chips, shavings and sawdust. Figure 10 shows the typical yield of sawlog components in
British Columbia. A processed log at the sawmill typically yields 46% lumber (lumber and trim blocks),
30% wood chips, 15% sawdust/shavings, and 9% bark by weight (Figure 10) (AEBIOM et al., 2013).
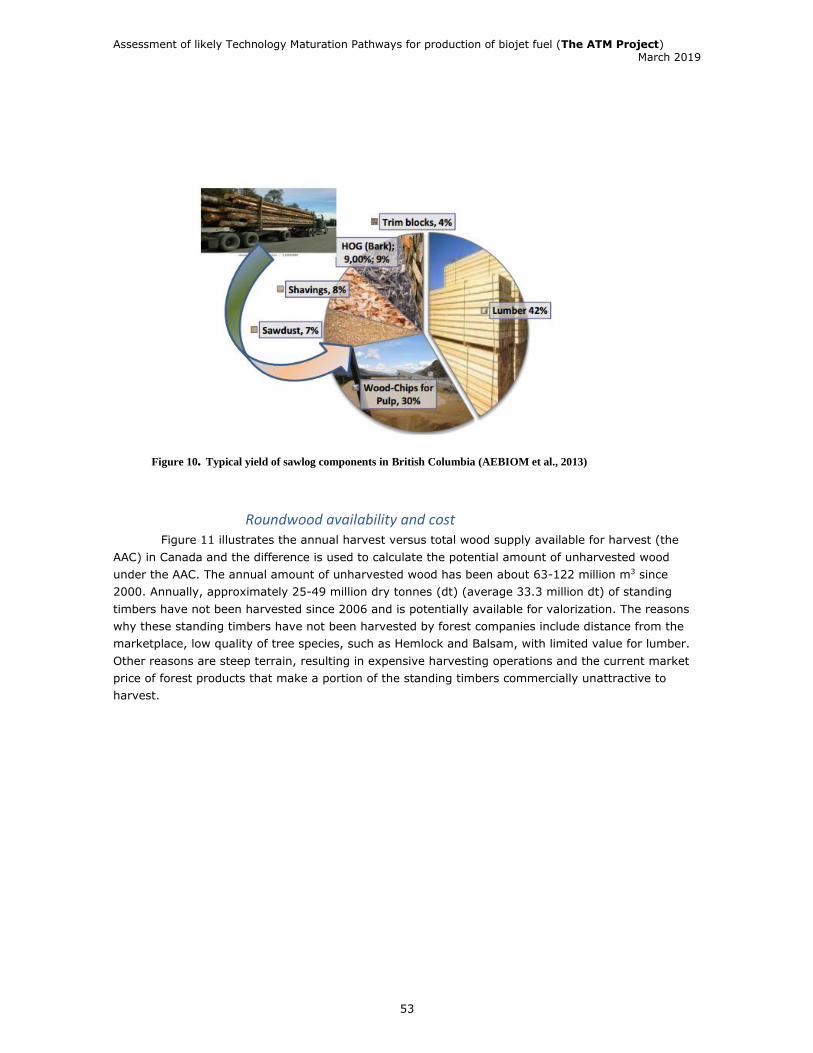
Assessment of likely Technology Maturation Pathways for production of biojet fuel (The ATM Project) March 2019
53
Figure 10. Typical yield of sawlog components in British Columbia (AEBIOM et al., 2013)
Roundwood availability and cost Figure 11 illustrates the annual harvest versus total wood supply available for harvest (the
AAC) in Canada and the difference is used to calculate the potential amount of unharvested wood
under the AAC. The annual amount of unharvested wood has been about 63-122 million m3 since
2000. Annually, approximately 25-49 million dry tonnes (dt) (average 33.3 million dt) of standing
timbers have not been harvested since 2006 and is potentially available for valorization. The reasons
why these standing timbers have not been harvested by forest companies include distance from the
marketplace, low quality of tree species, such as Hemlock and Balsam, with limited value for lumber.
Other reasons are steep terrain, resulting in expensive harvesting operations and the current market
price of forest products that make a portion of the standing timbers commercially unattractive to
harvest.
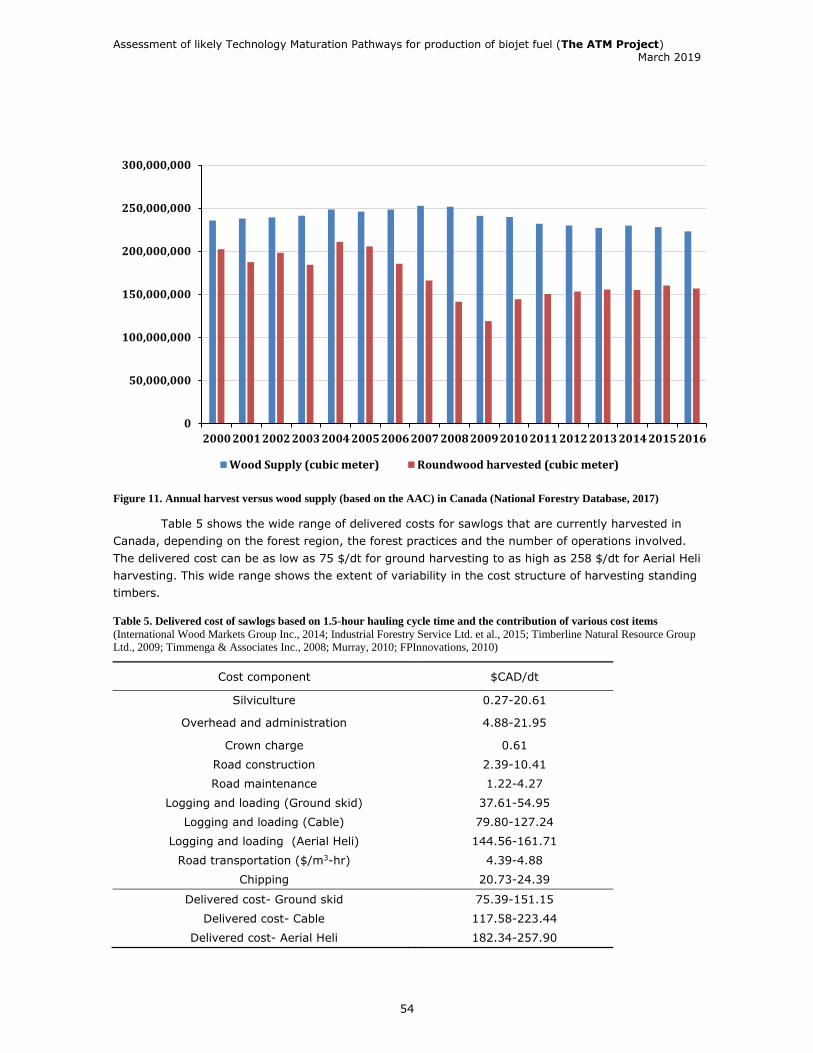
Assessment of likely Technology Maturation Pathways for production of biojet fuel (The ATM Project) March 2019
54
Figure 11. Annual harvest versus wood supply (based on the AAC) in Canada (National Forestry Database, 2017)
Table 5 shows the wide range of delivered costs for sawlogs that are currently harvested in
Canada, depending on the forest region, the forest practices and the number of operations involved.
The delivered cost can be as low as 75 $/dt for ground harvesting to as high as 258 $/dt for Aerial Heli
harvesting. This wide range shows the extent of variability in the cost structure of harvesting standing
timbers.
Table 5. Delivered cost of sawlogs based on 1.5-hour hauling cycle time and the contribution of various cost items
(International Wood Markets Group Inc., 2014; Industrial Forestry Service Ltd. et al., 2015; Timberline Natural Resource Group
Ltd., 2009; Timmenga & Associates Inc., 2008; Murray, 2010; FPInnovations, 2010)
Cost component $CAD/dt
Silviculture 0.27-20.61
Overhead and administration 4.88-21.95
Crown charge 0.61
Road construction 2.39-10.41
Road maintenance 1.22-4.27
Logging and loading (Ground skid) 37.61-54.95
Logging and loading (Cable) 79.80-127.24
Logging and loading (Aerial Heli) 144.56-161.71
Road transportation ($/m3-hr) 4.39-4.88
Chipping 20.73-24.39
Delivered cost- Ground skid 75.39-151.15
Delivered cost- Cable 117.58-223.44
Delivered cost- Aerial Heli 182.34-257.90
0
50,000,000
100,000,000
150,000,000
200,000,000
250,000,000
300,000,000
2000 2001 2002 2003 2004 2005 2006 2007 2008 2009 2010 2011 2012 2013 2014 2015 2016
Wood Supply (cubic meter) Roundwood harvested (cubic meter)

Assessment of likely Technology Maturation Pathways for production of biojet fuel (The ATM Project) March 2019
55
There is a large volume of unharvested roundwood in Canada which is potentially available for
biofuel production. The majority of the available roundwood is produced in British Columbia, followed
by Quebec, Alberta and Ontario. However, harvesting standing timbers for energy applications is
generally not considered economical in Canada because the recovery costs entail full costs of planning,
developing, and harvesting in addition to costs for biomass handling and preprocessing as well as the
relatively low price of transportation fuels in the current market situations. Therefore, we consider
other biomass sources in the following sections, including sawmill and forest residues as the more
affordable feedstock for biofuel production.
2.1.2.1 Sawmill residues availability and cost Sawmill residues are usually the least expensive source of woody biomass compared with
other sources such as forest residues and roundwood/sawlogs. They are the by-product of mill
operations and available at sawmills. Logistics operations would include loading, transportation to and
unloading at the biorefinery site. Table 6 shows the delivered cost of sawmill residues.
Table 6. Delivered cost of sawmill residues based on 1.5-hour hauling cycle time (Mobini, 2015; Industrial Forestry
Service Ltd. et al., 2015; Timberline Natural Resource Group Ltd., 2009)
* Value of chips depends on the tree species.
A significant proportion of sawmill residuals in Canada is already utilised by the existing pulp
and paper mills, bioenergy plants, board mills and pellet plants or internally by mills for their own
energy consumption. While there are surplus quantities of sawdust, wood shavings and hog fuel
available in the country, these are widely dispersed and are not available in sufficient volumes in a
specific region of the country to meet the annual feedstock demand of a commercial-scale biofuel
plant (e.g. 30 million gallons/year) (Industrial Forestry Service Ltd. et al., 2015). A change in the
dynamics of the forest products industry could increase the availability of this forest biomass source,
for example, an increase in the production capacity of sawmills or downturn in pulp production in
Sawmill residues $/dt
Hog fuel
Fibre price at the sawmill 2.00-3.00
Transportation cost 10.00
Delivery at the biorefinery 12.00-13.00
Sawdust/yard waste
Fibre price at the sawmill 10.00-20.00
Transportation cost 10.00
Delivery at the biorefinery 20.00-30.00
Wood shaving
Fibre price at the sawmill 15.00-42.00
Transportation cost 10.00
Delivery at the biorefinery 25.00-52.00
Residual chips
Fibre price at the sawmill 60.00-100.00
Transportation cost 10.00
Delivery at the biorefinery* 70.00-110.00
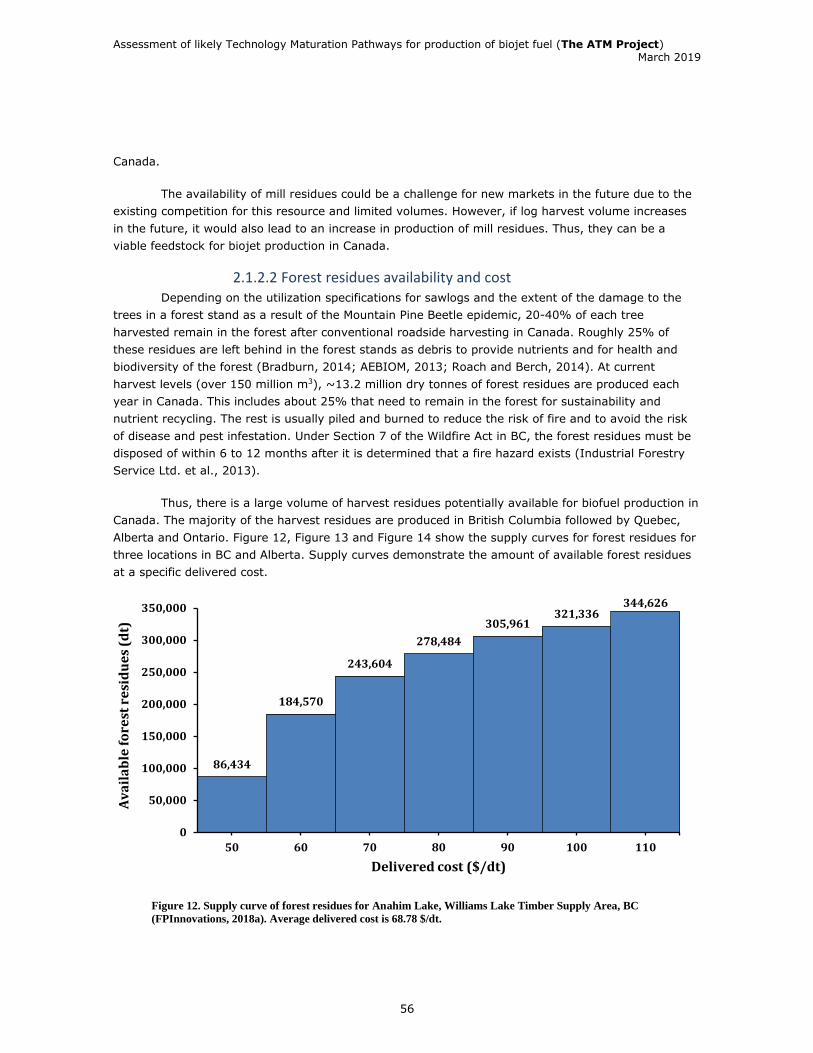
Assessment of likely Technology Maturation Pathways for production of biojet fuel (The ATM Project) March 2019
56
Canada.
The availability of mill residues could be a challenge for new markets in the future due to the
existing competition for this resource and limited volumes. However, if log harvest volume increases
in the future, it would also lead to an increase in production of mill residues. Thus, they can be a
viable feedstock for biojet production in Canada.
2.1.2.2 Forest residues availability and cost Depending on the utilization specifications for sawlogs and the extent of the damage to the
trees in a forest stand as a result of the Mountain Pine Beetle epidemic, 20-40% of each tree
harvested remain in the forest after conventional roadside harvesting in Canada. Roughly 25% of
these residues are left behind in the forest stands as debris to provide nutrients and for health and
biodiversity of the forest (Bradburn, 2014; AEBIOM, 2013; Roach and Berch, 2014). At current
harvest levels (over 150 million m3), ~13.2 million dry tonnes of forest residues are produced each
year in Canada. This includes about 25% that need to remain in the forest for sustainability and
nutrient recycling. The rest is usually piled and burned to reduce the risk of fire and to avoid the risk
of disease and pest infestation. Under Section 7 of the Wildfire Act in BC, the forest residues must be
disposed of within 6 to 12 months after it is determined that a fire hazard exists (Industrial Forestry
Service Ltd. et al., 2013).
Thus, there is a large volume of harvest residues potentially available for biofuel production in
Canada. The majority of the harvest residues are produced in British Columbia followed by Quebec,
Alberta and Ontario. Figure 12, Figure 13 and Figure 14 show the supply curves for forest residues for
three locations in BC and Alberta. Supply curves demonstrate the amount of available forest residues
at a specific delivered cost.
Figure 12. Supply curve of forest residues for Anahim Lake, Williams Lake Timber Supply Area, BC
(FPInnovations, 2018a). Average delivered cost is 68.78 $/dt.
86,434
184,570
243,604
278,484
305,961321,336
344,626
0
50,000
100,000
150,000
200,000
250,000
300,000
350,000
50 60 70 80 90 100 110
Av
ail
ab
le f
ore
st r
esi
du
es
(dt)
Delivered cost ($/dt)

Assessment of likely Technology Maturation Pathways for production of biojet fuel (The ATM Project) March 2019
57
Figure 13. Supply curve of forest residues for Fort St. James, Prince George Timber Supply Area, BC
(FPInnovations, 2018b). Average delivered cost is 75.71 $/dt.
Figure 14. Supply curve of forest residues for Whitecourt, Upper Athabasca region, Alberta (BIMAT, 2018).
Average delivered cost is 88.69 $/dt.
The Mountain Pine Beetle epidemic resulted in large volumes of standing dead trees in BC
(MPB trees). Most MPB trees are not suitable for lumber production and are considered as a portion of
the forest residues basket available for other industrial applications such as bioenergy and pellet
production. However, the challenge of using MPB trees is the high cost of harvesting. The average
9,588
94,837
168,667
226,575248,989
290,000 299,135
0
50,000
100,000
150,000
200,000
250,000
300,000
350,000
50 60 70 80 90 100 110
Av
ail
ab
le f
ore
st r
esi
du
es
(d
t)
Delivered cost ($/dt)
35,37764,457
106,344
165,382
252,741
348,158
456,281
0
50,000
100,000
150,000
200,000
250,000
300,000
350,000
400,000
450,000
500,000
50 60 70 80 90 100 110
Av
ail
ab
le f
ore
st r
esi
du
es
(dt)
Delivery cost ($/dt)

Assessment of likely Technology Maturation Pathways for production of biojet fuel (The ATM Project) March 2019
58
harvest cost for the full tree stem is in the range of $68.45-86.63/dt. This biomass source will appear
in the supply curve above $110/dt (FPInnovations, 2018). This makes MPB trees an expensive source
of feedstock for biofuel production.
2.1.2.3 Wood pellets Wood pellets are a potential source of feedstock for biofuel production in Canada. There are
currently 44 operating wood pellet plants in Canada. The annual production capacity of these plants is
about 4 million tonnes with the actual production level of 3 million tonnes. About 95% of Canada’s
wood pellet production is exported to the EU, USA, and Asia and 5% is consumed in the domestic
market. BC has the highest pellet capacity utilization in Canada at 85% with world-class pellet plants
and efficient infrastructure including tailored ports and rail to accommodate pellet handling. These
plants are able to ramp up their capacity to near 100% if they have access to affordable woody
biomass and a high market demand (Personal communication with Wood Pellet Association of Canada,
2018). Table 7. Wood pellet production and transportation costs (Mobini, 2015; International Wood
Markets Group Inc., 2014; Pinnacle Renewable Energy Inc., 2014; Strauss, 2013; Murray, 2010;)
shows the cost components of wood pellets. As can be seen in Table 4, wood pellets are more
expensive per tonne compared to forest residues. However, key processing steps such as drying and
size reduction is already incorporated in the wood pellet price. Although wood pellet is produced at
commercial volumes in Canada, the majority of production is exported and it is a relatively expensive
feedstock compared to sawmill and forest residues. However, it would have some advantages as a
feedstock as it will be homogenous from a quality and size perspective.
Table 7. Wood pellet production and transportation costs (Mobini, 2015; International Wood Markets Group Inc., 2014;
Pinnacle Renewable Energy Inc., 2014; Strauss, 2013; Murray, 2010;)
*Earnings before interest, taxes, depreciation, and amortization
2.1.2.4 Agricultural biomass availability and cost Agricultural residues are left on the fields after harvesting the grain as the primary
agricultural product. Each year, about 52.8 million tonnes of agricultural residues are produced in
Canada. The majority of this biomass is produced in Saskatchewan followed by Alberta, Ontario and
Manitoba (Li et al., 2012). Sustainable removal and utilization of crop residues for biofuel production
have been demonstrated by several cellulosic ethanol facilities. Figure 15 shows the distribution of
delivered cost for corn stover in Southwestern Ontario for three different biorefinery sizes. The
average corn stover delivered costs are estimated to be $82.09/dt, $87.49/dt and $93.75/dt for a
small size biorefinery (175 dt/day), a medium-size biorefinery (520 dt/day) and a large size
Cost component $/dt
Feedstock (woody biomass) 30.00-35.00
Pellet production 40.00-42.00
Producer EBITDA* 30.00-40.00
Total cost at the pellet mill 100.00-117.00
Transportation mode $/dt-mile
Transportation (road) 0.30
Transportation (railway) 0.067
Transportation (ocean) 0.0042

Assessment of likely Technology Maturation Pathways for production of biojet fuel (The ATM Project) March 2019
59
biorefinery scenario (860 dt/day), respectively (Wang et al., 2017).
a. Small size scenario (175 dt/day)
b. Medium size scenario (520 dt/day)
c. Large size scenario (860 dt/day)

Assessment of likely Technology Maturation Pathways for production of biojet fuel (The ATM Project) March 2019
60
Figure 15. Distribution of corn stover delivered cost for three biorefinery scenarios in Southwestern Ontario
(Wang et al., 2017)
A key challenge in utilizing agricultural biomass is its affordability due to the wide distribution
and the inefficiency of the existing logistics systems to deliver large quantities of agricultural residues
to commercial-scale biorefineries. Thus, the availability of these residues for industrial uses such as
biofuel production depends on the annual feedstock demand of the biorefinery and the fibre paying
capability of the biorefinery. Agricultural residues generally have a higher ash content than forest
biomass which poses some different challenges for their utilization in a biorefinery.
Although agricultural residues are available in commercial quantities for biofuel production in
Canada, they were not further considered in this project as the supply chain was focused in BC where
this feedstock is not available in any significant volumes.
2.1.2.5 Municipal Solid Waste (MSW) availability and cost MSW availability depends on local population, waste management, and recycling practices.
Currently, 28.77 million tonnes of MSW are disposed in landfills in Canada annually (Statistics Canada,
2016). From a cost perspective, MSW is an attractive feedstock for biofuel production as tipping fees
are paid to dispose of waste. Local municipalities set their tipping fees to offset the disposal facility
capital and operations. For example, in Metro Vancouver, on average, Transfer Stations charge
$110/tonne for disposal of garbage. For a commercial hauler, the tipping fee is around $80/tonne and
for small deliveries, it is around $133/tonne (Personal communication with Metro Vancouver). In
contrast, the Oxford County in Ontario charges a tipping fee of $67.83/tonne for garbage, and
$70.30/tonne for construction & demolition (C&D) material (Personal communication with Oxford
County). The potential tipping fee (available as a “negative cost feedstock”, ie. as revenue) for using
MSW for biofuel production depends on the long-term contract between the municipalities and biofuel
facilities.
MSW is a heterogeneous feedstock with high levels of contaminants, such as metals, that
make it less attractive as a feedstock for biofuel production, as it will require extensive pre-processing
clean-up. The inconsistent quality of MSW can significantly impact the cost-efficiency of the conversion
process.
In summary, Canada has abundant and diverse biomass resources that can be used for
different conversion technologies to produce transportation biofuels. A review of the availability and
estimated delivered cost of these biomass resources and the technical aspects of using these
lignocellulosic biomass resources as feedstock for the production of biojet reveal that forest residues
have a significant potential to be considered as feedstock of choice for production of biojet in mid-term
and long-term. In the next section, the availability of forest residues in Western Canada will be
discussed in greater detail.
2.1.2.6 Potential forest residue availability in Western Canada British Columbia (BC) and Alberta respectively constitute 18% (55 million hectares) and 11%
(35 million hectares) of Canada’s total forested area (310 million hectares). This ready availability of
wood fibre and the use of sustainable forestry practices have facilitated the development of various
industries including the primary (e.g. lumber, panels, engineered wood, etc.), secondary (pulp and
paper) and tertiary sectors (bioenergy, wood pellets, etc.). As well as a valued forest resource, the
sector also contains other assets such as skilled labour and knowledge/expertise within the wood fibre
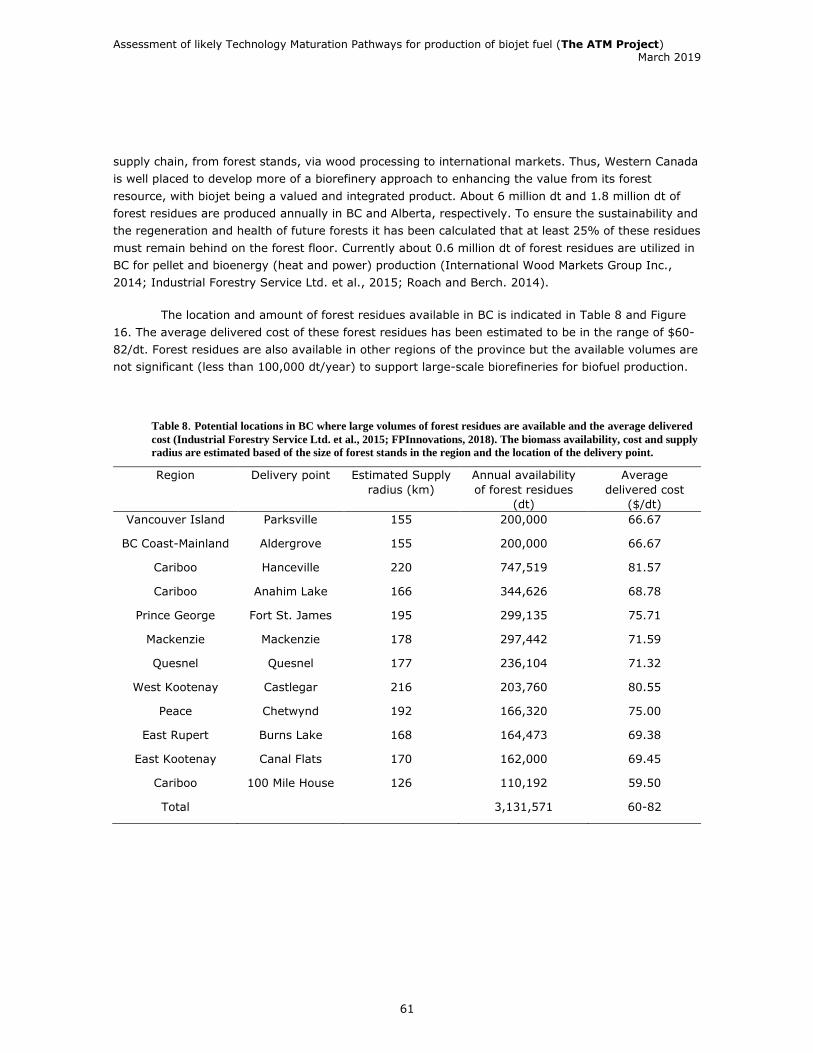
Assessment of likely Technology Maturation Pathways for production of biojet fuel (The ATM Project) March 2019
61
supply chain, from forest stands, via wood processing to international markets. Thus, Western Canada
is well placed to develop more of a biorefinery approach to enhancing the value from its forest
resource, with biojet being a valued and integrated product. About 6 million dt and 1.8 million dt of
forest residues are produced annually in BC and Alberta, respectively. To ensure the sustainability and
the regeneration and health of future forests it has been calculated that at least 25% of these residues
must remain behind on the forest floor. Currently about 0.6 million dt of forest residues are utilized in
BC for pellet and bioenergy (heat and power) production (International Wood Markets Group Inc.,
2014; Industrial Forestry Service Ltd. et al., 2015; Roach and Berch. 2014).
The location and amount of forest residues available in BC is indicated in Table 8 and Figure
16. The average delivered cost of these forest residues has been estimated to be in the range of $60-
82/dt. Forest residues are also available in other regions of the province but the available volumes are
not significant (less than 100,000 dt/year) to support large-scale biorefineries for biofuel production.
Table 8. Potential locations in BC where large volumes of forest residues are available and the average delivered
cost (Industrial Forestry Service Ltd. et al., 2015; FPInnovations, 2018). The biomass availability, cost and supply
radius are estimated based of the size of forest stands in the region and the location of the delivery point.
Region Delivery point Estimated Supply
radius (km)
Annual availability
of forest residues
(dt)
Average
delivered cost
($/dt)
Vancouver Island Parksville 155 200,000 66.67
BC Coast-Mainland Aldergrove 155 200,000 66.67
Cariboo Hanceville 220 747,519 81.57
Cariboo Anahim Lake 166 344,626 68.78
Prince George Fort St. James 195 299,135 75.71
Mackenzie Mackenzie 178 297,442 71.59
Quesnel Quesnel 177 236,104 71.32
West Kootenay Castlegar 216 203,760 80.55
Peace Chetwynd 192 166,320 75.00
East Rupert Burns Lake 168 164,473 69.38
East Kootenay Canal Flats 170 162,000 69.45
Cariboo 100 Mile House 126 110,192 59.50
Total 3,131,571 60-82
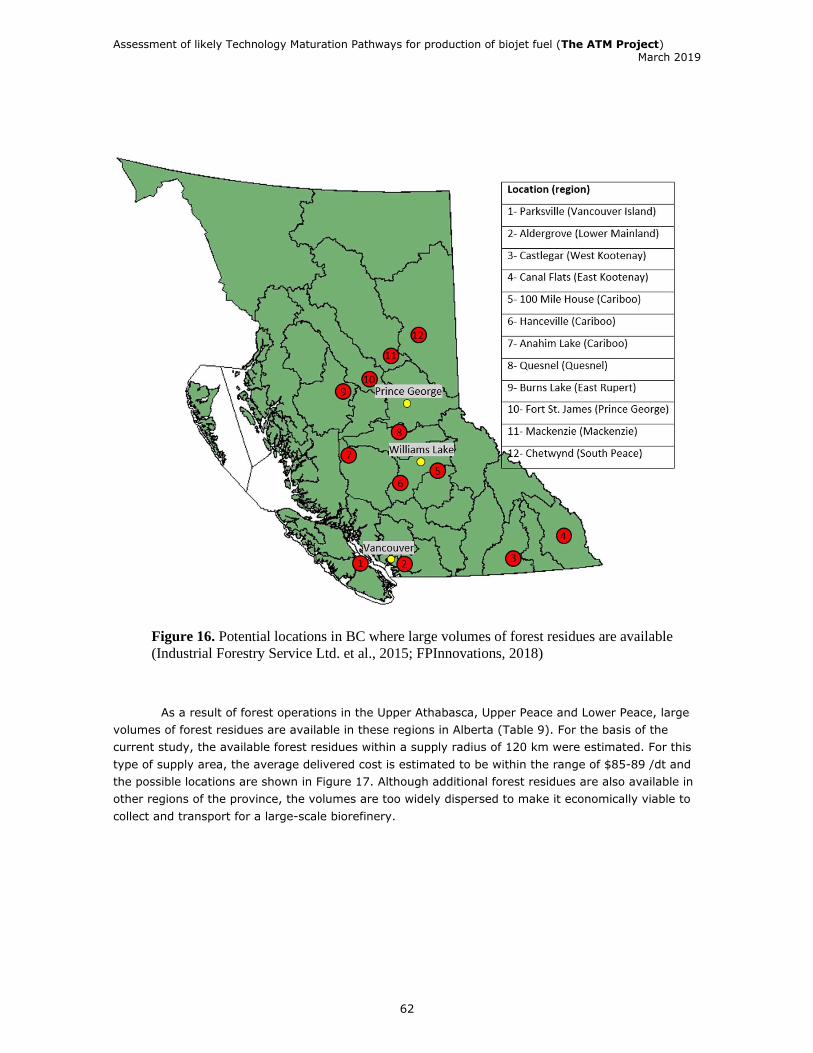
Assessment of likely Technology Maturation Pathways for production of biojet fuel (The ATM Project) March 2019
62
Figure 16. Potential locations in BC where large volumes of forest residues are available
(Industrial Forestry Service Ltd. et al., 2015; FPInnovations, 2018)
As a result of forest operations in the Upper Athabasca, Upper Peace and Lower Peace, large
volumes of forest residues are available in these regions in Alberta (Table 9). For the basis of the
current study, the available forest residues within a supply radius of 120 km were estimated. For this
type of supply area, the average delivered cost is estimated to be within the range of $85-89 /dt and
the possible locations are shown in Figure 17. Although additional forest residues are also available in
other regions of the province, the volumes are too widely dispersed to make it economically viable to
collect and transport for a large-scale biorefinery.
1
0

Assessment of likely Technology Maturation Pathways for production of biojet fuel (The ATM Project) March 2019
63
Table 9. Potential locations in Alberta where large volumes of forest residues are available (BIMAT, 2018)
Region Delivery point Available forest residues
(dt/yr)
Average delivered
cost ($/dt)
Upper Athabasca Whitecourt 456,281 88.96
Upper Athabasca Slave Lake 409,196 83.73
Upper Peace High level 280,662 85.13
Lower Peace Grand Prairie 342,986 87.42
Total 1,489,125
Figure 17. Alberta’s land-use framework planning regions (Government of Alberta, 2014)
To provide more of a “real-world” scenario, we assessed the regional availability of BC and
Alberta sourced forest residues that would be needed to supply the feedstock demand of a biocrude
facility with the production capacity of 2000 barrels/day which requires approximately 300,000 dry
tonnes of forest biomass annually (varies depending on the biocrude production technology)18.
18 This volume was based on (refer to Appendix? Or add here)
High level
Slave Lake
Whitecourt
Grand
Prairie
Assessment of likely Technology Maturation Pathways for production of biojet fuel (The ATM Project) March 2019
64
Assuming 20% mass loss in the biomass logistics and preprocessing, about 375,000 dry tonnes of
biomass needs to be collected at the roadside of forest stands. As discussed in the previous section,
the feedstock of choice for the biocrude facility is assumed to be forest residues. The next section
explains the regional supply chain for the considered biocrude facility.
As shown in Figure 12-14, the average delivered cost of sourcing these forest residues has
been estimated to be in the range of $60-82/dt (FPInnovations, 2018a,b; BIMAT 2018). Forest
residues are also available in other regions of the province but the available volumes are not
significant (less than 100,000 dt/year) for industrial applications such biofuel production.
2.1.3 Regional biocrude supply chain scenario The development of an optimal regional biojet supply chain would likely be through
integrating the existing wood fibre and fossil fuel supply chains in Western Canada, for example, the
existing fossil fuel supply chain and infrastructure could be used in a co-processing strategy for
upgrading the intermediate products of a biorefinery (e.g. biocrudes or FT liquids) and
storing/distributing drop-in biofuels to the marketplace19. This could potentially reduce capital and
operating costs. Integration of biojet production with existing wood fibre logistical operations could
also reduce the costs for delivery of forest residues to the biorefinery. Wood processing infrastructure
such as wood yards, grinders and dryers could also be utilized in an integrated manner to store and
pre-process woody biomass before conversion into biofuels.
Utilisation of this existing infrastructure is reflected in the criteria used for the site selection of
the biorefinery and the development of the biofuel supply chain in Western Canada. The supply chain
for the ATM Project was based on the biorefinery producing an intermediate biocrude or bio-oil which
is then transported to a central upgrading facility integrated with an existing petroleum refinery.
The criteria to determine the potential location of the biorefinery and to develop the regional
biojet supply chain include:
• Availability of woody biomass in the region.
• Proximity of the region to wood processing facilities, including sawmills, pulp and
paper mills, bioenergy plants and pellet plants.
• Proximity of the region to oil refineries/upgraders: The close proximity of the
biorefinery to existing petroleum refineries and upgraders provide an opportunity for
co-location and co-processing.
• Proximity to petrochemical plants: the synergy between a biorefinery and the
petrochemical industry could center around production and storage of hydrogen as
both industries need hydrogen to produce the final marketable products.
• Available transportation infrastructure in the region.
• Proximity to major airports and populated areas.
19 As many different supply chain options are possible, only a few were selected for study in this report.

Assessment of likely Technology Maturation Pathways for production of biojet fuel (The ATM Project) March 2019
65
Table 10 shows seven potential locations for the development of a regional supply chain
scenario for biocrude production. Five of these locations are in BC and two in Alberta: Prince George
(BC); Vancouver Island (BC), Coastal Mainland (BC), Kamloops (BC), Quesnel (BC), Slave Lake (AB)
and Whitecourt (AB). Among these locations, Prince George city has all the elements for the
development of a regional supply chain for biocrude production in Western Canada.
Table 10. Potential locations for the development of a regional supply chain scenario for biocrude production in
Western Canada
Potential locations Biomass
Availability
Proximity to wood
processing facilities
Available
transportation
infrastructure (road,
rail and water)
Proximity to oil
refineries and
airports
Prince George- BC ✓✓✓ ✓✓✓ ✓✓✓ ✓✓✓
Coastal Mainland-
BC
✓✓ ✓✓✓ ✓✓✓ ✓✓✓
Vancouver Island-
BC
✓✓ ✓✓ ✓✓ ✓✓
Kamloops- BC ✓ ✓✓✓ ✓✓ ✓
Quesnel- BC ✓ ✓✓✓ ✓✓✓ ✓
Slave Lake- Alberta ✓✓ ✓✓ ✓✓ ✓✓
Whitecourt- Alberta ✓✓ ✓✓ ✓✓ ✓✓
The Prince George timber supply area (TSA) is in British Columbia’s north-central interior and
covers about 7.97 million hectares and is one of the province’s largest forest management
units. Approximately 3 million hectares of the total TSA land base is considered available for timber
harvesting. The leading tree species are lodgepole pine, spruce and subalpine fir. Currently, there are
13 lumber mills, three pulp mills, one utility mill, four pellet operations, two cogeneration facilities and
a bioenergy facility operating in the timber supply area. Combined these mills can process up to 11
million cubic metres of logs annually. Prince George TSA’s current allowable annual cut (AAC) is
8,350,000 cubic metres as of October 11, 2017. Major communities in the region include Prince
George, Vanderhoof, Fort St. James and Fraser Lake. Figure 18 shows the map of the Prince George
TSA (Nicholls, 2017).
The Prince George TSA is subdivided into eight supply blocks. The AAC level includes three
partitions: (1) A maximum of 1.5 million cubic metres per year is attributed to supply blocks A and B;
(2) A maximum of 6.1 million cubic metres per year is attributed to the remaining supply blocks (and
reduced to 5.1 million cubic metres in October 2022), and (3) A maximum of 750,000 cubic metres
per year is attributed to bioenergy stands, which are mature, damaged pine-leading stands with less
than 140 cubic metres per hectare net merchantable sawlog volume.
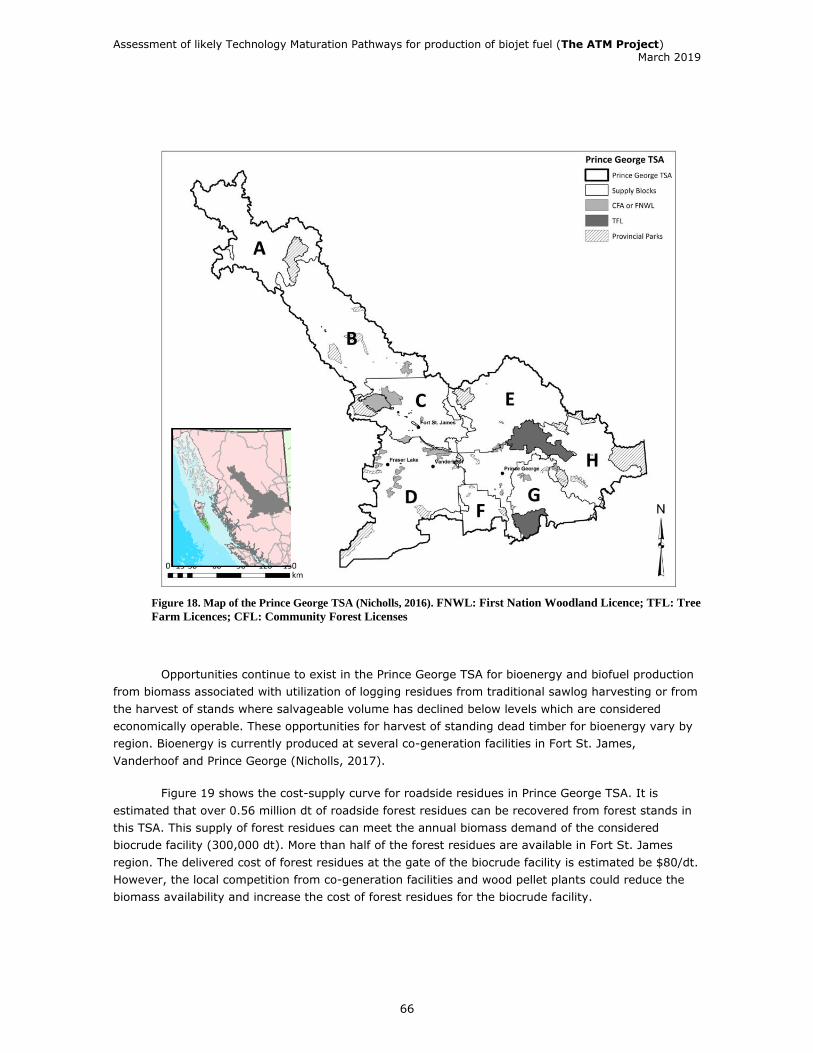
Assessment of likely Technology Maturation Pathways for production of biojet fuel (The ATM Project) March 2019
66
Figure 18. Map of the Prince George TSA (Nicholls, 2016). FNWL: First Nation Woodland Licence; TFL: Tree
Farm Licences; CFL: Community Forest Licenses
Opportunities continue to exist in the Prince George TSA for bioenergy and biofuel production
from biomass associated with utilization of logging residues from traditional sawlog harvesting or from
the harvest of stands where salvageable volume has declined below levels which are considered
economically operable. These opportunities for harvest of standing dead timber for bioenergy vary by
region. Bioenergy is currently produced at several co-generation facilities in Fort St. James,
Vanderhoof and Prince George (Nicholls, 2017).
Figure 19 shows the cost-supply curve for roadside residues in Prince George TSA. It is
estimated that over 0.56 million dt of roadside forest residues can be recovered from forest stands in
this TSA. This supply of forest residues can meet the annual biomass demand of the considered
biocrude facility (300,000 dt). More than half of the forest residues are available in Fort St. James
region. The delivered cost of forest residues at the gate of the biocrude facility is estimated be $80/dt.
However, the local competition from co-generation facilities and wood pellet plants could reduce the
biomass availability and increase the cost of forest residues for the biocrude facility.

Assessment of likely Technology Maturation Pathways for production of biojet fuel (The ATM Project) March 2019
67
Figure 19. Cost-supply curve of forest residues for Prince George TSA. There are sufficient quantities of forest
residues to meet the annual biomass demand of a biocrude facility with the production capacity of 2000
barrels/day that requires 300,000 dry tonnes of forest biomass annually (Biomass data source: FPInnovations,
2018b).
As Figure 19 shows, only a small portion of the forest residue demand for the biocrude facility
can be met in the Prince George supply block (10%). A large portion of the annual feedstock demand
of the biocrude facility would have to be fulfilled from nearby supply blocks in Fort St. James (52%),
Vanderhoof (16%) and Bear Lake (11%). Figure 20 shows the distribution of transportation distances
between forest biomass collection points in supply blocks and the biocrude production facility. The
minimum, average and maximum transportation distances are estimated to be 7.9 km, 52.8 km and
121.58 km, respectively. The size of the supply radius is estimated to be 100 km.
0
100,000
200,000
300,000
400,000
500,000
600,000
45 50 55 60 65 70 75 80 85 90 95 100 105 110 115 120 125 130
Rec
ov
ered
fo
rest
res
idu
es (
dt)
Average delivered cost in Prince George TSA ($/dt)
Prince George Vanderhoof Fraser Lake Fort St. James Bear Lake
Annual biomass demand of the considered biocrude facility

Assessment of likely Technology Maturation Pathways for production of biojet fuel (The ATM Project) March 2019
68
Figure 20. Distribution of transportation distance between forest biomass collection points in forest stands and
biocrude production facility in Prince George (km)
The delivered cost of forest residues has three components: comminution, transportation and
road network construction and maintenance. Comminution is the process of loading forest residues
into the grinding equipment at the roadside of forest stands, grinding and loading them into a truck.
The truck then transports the chipped forest biomass to the destination point. The comminution
operation is estimated at a cost of $25-32/dt. The next cost component is transportation which
depends on road conditions and truck configuration. For a 3-axle chip truck, transportation costs are
estimated to be in the range of $0.37-2.00/dt/km for the delivery point in Figure 18. Such a wide
range is due to the different road classes which impact the speed of the truck and the associated
costs. The transportation costs average $0.70/dt/km. The last cost component of the delivered cost is
the road construction and maintenance. End users of the forest residues are usually charged for using
the roads constructed by forest companies to transport sawlogs to their wood processing facilities.
These costs are in the range of $0-2.51/dt with an average cost of $0.80/dt. In summary, the
delivered cost of forest residues for the case study include $5.50/dt for pre-piling, $26.30/dt for
grinding, $2.10/dt for road network and $46.10/dt for transportation (FPInnovations, 2018a,b).
In recent years, the industry has been able to reduce the grinding costs by improving the
efficiency and the fuel consumption of this operation. In some regions, a grinding cost of $20/dt has
been reported (International Wood Markets Group Inc., 2014). More development and research is
ongoing to integrate the forest biomass logistics system with the existing forest supply chain to
further reduce the biomass logistics cost. This reduction can potentially make forest residues a more
affordable feedstock for biofuel and bioenergy applications.
2.1.4 Feedstock Conclusions There are sufficient quantities of forest residues available in BC and Alberta to meet the
0
20
40
60
80
100
120
140
160
180
200
5 15 25 35 45 55 65 75 85 95 105 115 125
Fre
qu
ency
of
trav
el
Distance between forest biomass collection point and biocrude production facility in Prince George (km)

Assessment of likely Technology Maturation Pathways for production of biojet fuel (The ATM Project) March 2019
69
annual demand of a biocrude facility with a capacity of 2000 barrels/day. Such facility requires
approximately 300,000 dry tonnes of forest biomass annually. Assuming 20% mass loss in the
biomass logistics and preprocessing, about 375,000 dry tonnes of biomass needs to be collected at the
roadside of forest stands. Prince George City was proposed for the location of the biocrude facility as it
has all the elements for the development of a regional supply chain for biocrude production in Western
Canada such as biomass availability, proximity to wood processing facilities, available transportation
infrastructure (road, rail and water) and proximity to oil refineries and airports. The annual biomass
demand for the considered biocrude facility (300,000 dt) would be met at a delivered cost of $80/dt
within a 100-km supply radius. The average transportation distance is estimated to be 52.8 km.
2.2 Potential policy and economic tools to increase access and use of BC forest residues for bioenergy and biofuels production
Economic sustainability is critical to the development of bioenergy and biofuels production, as
well as a reliance on large-scale feedstock supply chains. The BC forestry industry is uniquely
positioned to leverage the existing forest product supply chain and annually provide enough forest
biomass for biofuels production. Worldwide, policies have been used to promote development of
bioenergy and biofuels. Chapter 7 looks at the types of policies that would be needed to facilitate the
development of biojet production and consumption. Within the whole supply chain, feedstock is,
however, the kickoff point for production of biojet fuels. The forest sector has traditionally used woody
biomass for lumber and pulp and paper. Policies in the sector have therefore not accommodated the
use of residues and poor quality wood for other purposes such as bioenergy and biofuels. In BC, some
of the policies in the forest sector are in fact presenting an obstacle to the expanded utilization of
woody biomass and forest residues for alternative purposes.
BC forest policies limit the accessibility of companies to forest residues. Under the current
tenure system, the rights to harvest a public resource (i.e. timber) for forest products excludes other
non-timber values such as carbon and optimizes most aspects of the supply chain for log extraction
and traditional forest products.
This section outlines the challenges to forest residue collection and use in BC and analyzes the
potential policies and economic tools that could facilitate increased forest residue use for bio-products.
As bioenergy has developed more rapidly than biofuels, many policies used to promote bioenergy is
described here as an example with the potential to expand these to biofuels production.
2.2.1 Introduction Renewable energy subsidies in some markets (i.e. EU-Member States) have driven the
demand for wood pellets for biomass-fired power plants and have encouraged the development of
BC’s wood pellet industry over the past decade (Murray, 2015). To date, BC wood pellet producers
have primarily relied on saw and pulp mill residues as their biomass feedstock, which is very
economical and the lowest cost fibre available. Only small quantities of forest residues are being used
by pellet producers due to the higher cost and problems with accessibility.
Increased demand for wood pellets from EU Member States and other countries, such as
Japan, has increased pressure on BC wood pellet producers to seek additional sources of forest
biomass, including forest residues. This has placed increased pressure on fibre supply in the province

Assessment of likely Technology Maturation Pathways for production of biojet fuel (The ATM Project) March 2019
70
which has been influenced by additional factors. For example, the recent mountain pine beetle
epidemic has caused an enormous reduction in the midterm timber supply in BC. In response, in their
efforts to remain in operation, sawmills have increased their log recovery through new technology
investments, resulting in reduced wastage and residue generation (Personal communications, S.
Ferguson, July 2017). This has resulted in a reduced supply of (cheap) mill residues for wood pellet
production, placing additional pressure on fibre supply for bioenergy applications.
However, there are significant limitations to the large-scale collection and use of forest
residues due to two major challenges in BC forests: cost of forest residues; and current policies in BC.
First, the cost of removing forest residues is relatively high ($60-80) compared with mill
residues. Mill residues are generated as a waste product at the mill, while forest residues are
generated in the forest during harvesting. As a result, forest residues require comminution on site and
transport to a facility, which increases the cost associated with this feedstock. BC forests are vast and
mountainous geography make access to forest biomass challenging, requiring high investments in
road construction and transportation. While these costs are acceptable for high-value products such as
lumber, products made from forest residues, such as wood pellets or biofuels, are generally lower
value. High feedstock costs and low-value products cannot support a sustainable multi-national supply
chain on its own and integration with existing supply chains will be essential.
Second, current BC forest policies pose some obstacles to accessibility to forest residues by
companies. Under the current tenure system, the rights to harvest a public resource (i.e. timber) for
forest products excludes other non-timber values such as carbon and optimizes most aspects of the
supply chain for log extraction and traditional forest products (e.g. lumber). The access to and
utilization of forest residues have to be integrated with the current supply chain and policies have to
be modified to accommodate and facilitate this.
This section outlines the challenges to forest residue collection and use in BC and analyzes the
potential policies and economic tools that could facilitate increased forest residue use for bio-products.
The BC wood pellet supply chain is best positioned to define how BC forest residues are managed and
their economic availability. The work described in this section has focused on current and developing
forest residue policies and economic tools in the wood pellet industry. Economic tools refer to the
technical changes or direct-action government can take to decrease costs along the supply chain, from
standing tree to product. Policies refer to the regulations and amendments available to the provincial
government to incentivize or influence company behavior and get more value out of BC forests or
achieve other objectives, such as operational forestry legislation (i.e. Forest Range and Practices Act
(FRPA)).
To implement effective policies capable of encouraging companies to enter the forest to
collect additional forest biomass, this policy analysis has looked at the economic and policy tools that
have been successfully used in other countries, such as Sweden and the US south east.
It is highly likely that accessing BC forest residues will be heavily dependent on the existing
supply chain and markets of traditional forest products (i.e. pulp, paper and lumber). Due to the low
economic value of forest residues they are typically collected into slash piles on a harvest block and
burned. This practice has been adopted as it simultaneously recycles nutrients from biomass back to
the forest soil and removes unwanted biomass that can impede future tree growth. In fact, BC forest
policy requires forest fire prevention methods, which include the burning of unavoidable waste wood

Assessment of likely Technology Maturation Pathways for production of biojet fuel (The ATM Project) March 2019
71
from harvesting activities, particularly where regular forest fires are part of a resilient ecosystem cycle
such as in the BC interior (Government of British Columbia, 2002). Although controlled burns (forest
fires that are intentionally set and managed by forest managers to reduce forest fire risk) are not
common, burning relatively small slash piles in the winter months is very common. Enabling increased
utilization of forest residues would necessarily involve changing policies related to the burning of slash
piles, allowing diversion of this resource to additional value-added products. In addition to the policy
implications, the economic viability of removing these residues based on current conditions has to be
addressed.
In summary, the two major challenges limiting the increased access to and utilization of BC
forest residues, based on the current forest supply chain are:
• Economic limitations of the BC forest residue supply chain which impacts the business
viability of forest residue utilization; and
• Provincial regulations on forest harvesting focus on traditional forest products rather
than maximum utilization of biomass.
These challenges are discussed below, in the context of better accessing and using forest
residues.
2.2.2 Economic challenges of increasing BC forest residue use Perhaps the largest barrier to increased use of forest residues is the economic viability of
forest residue removal. The costs of collecting, processing and transporting forest residues from a
harvest block to a mill makes large-scale removal economically challenging. Thus, although large
quantities of residues are available, their actual availability based on economics is more challenging.
Availability and cost within various timber supply areas (TSA) within BC was described earlier in this
Chapter.
Some of the studies that have been carried out in BC to access forest residues have
suggested ways to reduce costs (Friesen and Goodison, 2011; Friesen, 2016; Pledger, 2016). These
studies outline approximately four steps in the forest residue supply chain that could be further
optimized. One major recommendation is to use a separate transportation network than the one
currently used for traditional forest products, implying that biomass producers will have to enter the
harvest block twice, once for harvesting timber and once for residual biomass. The key steps in a
forest residue supply chain include; pre-piling, comminution (processing), transport and other costs
(road maintenance etc.). Although some costs would be shared, such as pre-piling and road
maintenance, the cost of comminution and transportation of forest residues would be borne solely by
the biomass user.
A major cost is comminution, referring to the grinder or processor that must be transported
into a cut block to reduce the size of forest residues for transportation. Grinding involves a separate
machine that crushes or chips up forest residues into smaller pieces to optimize the transport of large
volumes of forest residues. Other harvesting costs, such as felling trees etc. is included in the price for
traditional forest products, not allocated to forest residue processing. However, forest residue access
is included in road maintenance costs.
It is apparent that the costs of a forest residue supply chain are such that significant policy

Assessment of likely Technology Maturation Pathways for production of biojet fuel (The ATM Project) March 2019
72
support will be required to encourage greater forest residues collection for products such as wood
pellets. However, increases in wood pellet pricing and other traditional forest products could also
motivate increased forest residue collection.
The high costs of forest residues are especially challenging in low-value products that
compete with fossil fuel alternatives. The price of oil has reached historically low levels in the past few
years and is subject to volatile markets and geo-political influences. Therefore, energy subsidies and
other support programs are most likely required to influence additional changes in supply chain costs
to incentivize companies to maximally utilize forest biomass to reduce GHG emissions.
2.2.3 Provincial regulations and limitations The other significant challenge to increased forest residue collection and use is BC’s current
forest policies. The government of BC supports its forest sector by establishing an updated annual
sustainable harvesting yield. The extensive policies that regulate industrial forestry in BC have
resulted in some challenges for forestry and biomass companies as it relates to the collection and use
of forest residues. For example, the Annual Available Cut (AAC), which is adjusted every 5 years
according to numerous factors, significantly influences forest residue availability by limiting harvesting
activities. This affects the quantity of residues that could be available in each year. However, other
constraints limit the accessibility of BC forest residues to forest companies as well as secondary
producers, such as wood pellet producers.
Currently, BC regulations primarily focus on traditional forestry products, missing
opportunities to extract other potential “value” out of forest biomass, such as reducing GHG emissions
and supporting the growth of a bioeconomy. Currently, there is little incentive for forest companies to
diversify or maximize the value they can extract from BC forests given current forest policies. For
example, the current BC forest tenure systems grants the right to harvest publicly owned trees for
profit if a certain amount of taxes and revenue is given to the province, stipulated in the Forest Act,
Part 4 (Government of British Columbia, 1996). The current tenure system only grants the rights to
timber, not additional values such as carbon or other non-timber forest values. Therefore, the section
below discusses possible alternative policies and economic tools that could be used to leverage BC’s
existing forest residue supply and support the growth of a potential bioeconomy using forest residues.
BCs forest management and supply chain are complex. There are multiple industry partners
involved in the current forest harvesting supply chain, in addition to the international forest products
markets. Consequently, balancing international demand fluctuations and local (often-rural) livelihoods
and environmental values means that the regulatory framework can quickly become punitive with
well-intended policies negatively affecting one group over another. To identify possible policy and
economic tool alternatives to overcome the challenges of encouraging a BC forest residue supply
chain, proven policies or economic tools used in countries that actively promote forest residues use
effectively and serve domestic or international markets are discussed. For example, The US south east
and Sweden are two jurisdictions where different policies and methods have been used to encourage
increased use of forest residues for wood pellet production and co-generation. While both regions
differ from Canada in many aspects, the outcome, commercial-scale removal and use of forest
residues for energy purposes, are comparable.
Given the current political climate and regulatory regime of BC, the two most important
criteria in assessing economic and policy drivers for forest residue use are the degree of change each
driver requires to be implemented and the expected negative stakeholder impacts (if any) of a driver.
Assessment of likely Technology Maturation Pathways for production of biojet fuel (The ATM Project) March 2019
73
For example, carbon pricing could be a critical component of BC’s renewable energy efforts and,
consequently, BC’s forestry industry could be incentivized to retrieve additional forest biomass for
uses such as bioenergy, biofuels and bio-products. However, the likelihood of such a change, such as
a $100/tonne of CO2eq is politically unlikely at present, barring any drastic changes to the salience of
climate change in Canada20.
2.3 Expanding the use of forest residues for bioenergy and biofuels As mentioned earlier, the main challenge is economic with significant economic limitations
impeding large scale forest residue removal. Therefore, a major focus of the policy analysis is to
assess potential economic and policy tool alternatives to either reduce the costs of the BC forest
residue supply chain or incentivize companies to retrieve biomass.
2.3.1 Policy alternatives for expanded use of residues There are a variety of policies and economic tools that could be used to incentivize companies
to retrieve forest residues. To narrow the search for possible alternatives, existing policies used in the
EU/US south east wood pellet supply chain and Sweden’s national bioenergy sector were assessed.
Various researchers (Greig & Bull, 2009; St-Laurent et al., 2017; St-laurent, Hoberg, Kurz,
Lemprière, & Smyth, 2017; Upham et al., 2011) have proposed policy alternatives to encourage
expanded use of BC forest residues for bio-products. These include:
• Changing BC forest policy to grant rights to non-timber forest values such as carbon;
• Changing operational-level regulations to behavior changes in forest residue
management; and
• Developing programs to encourage and implement downstream incentive programs
for bio-product production (e.g., UK Renewable Obligation Certifications)
• Applying a negative carbon price to BC’s forest biomass;
Currently, BC’s forest, climate and energy policies are not unified on all objectives or
coverage, leaving some gaps in BC’s policies and opportunities that will be needed to achieve
Canada’s climate targets under the Paris Agreement (St-laurent et al., 2017). The policy and economic
alternatives outlined here could have varied impacts on the availability and accessibility of BC forest
residues. However, they can also have unintended effects on stakeholders in the supply chain. Given
the current political climate and regulatory regime of BC, it is likely that the two most important
criteria will be the degree of change each driver requires to be implemented and the expected
stakeholder impacts (if any) of a tool.
2.3.2 Potential policy and economic tool alternatives
2.3.2.1 Carbon Pricing It is possible that carbon pricing could provide the incentives for forestry companies to enter
the forest and reduce the amount of slash piles they burn annually. BC has a $35/tonne of CO2 tax
20 CH4 and N2O emissions from slash burning is currently taxed at $35 per tonne, but not CO2

Assessment of likely Technology Maturation Pathways for production of biojet fuel (The ATM Project) March 2019
74
applied to fossil products, currently excluding forest products. However, a critical question is whether
the price will affect forest management-related emissions, such as burning forest residues in the
forest rather than redistributing the residues to processing facilities (Hoberg et al., 2016). Another
related aspect is the possible inclusion of wildfire emissions and other natural disturbance in the
provincial carbon tax. BC’s 2017 wildfire season was triple the provincial GHG emissions of a typical
year while, over the last decade, the Mountain Pine Beetle epidemic changed BC’s forests from a
carbon sink to a carbon source. It has been suggested that taxing carbon in the forest could improve
forest fire prevention activities through the removal of additional forest biomass from BC forests, as
well as improving forest management practices to reduce GHG emissions due to preventable natural
disturbances.
However, pricing forest carbon could drastically change the objectives of forest management
as a key influencer of forest sequestration over the short to long term. A forest carbon price could
broaden the potential of using forests as carbon sinks and as renewable substitutes to fossil fuel as a
feedstock for products. As part of the United Nations Framework Convention on Climate Change
(UNFCCC), BC has reported harvested wood products (HWP) in its GHG calculations. Currently it is
considering how and whether to include forest management net emissions in its accounting (Hoberg et
al., 2016). Additionally, recent foreign policy proposals (i.e. EU-Land-Use, Land-Use Change and
Forestry, 2016; EU-RED II, Article 26, 2016) are considering new requirements regarding carbon
management of forests that provide biomass for energy products. Currently, some models account for
forest carbon and sequestration rates. If this becomes more common, its inclusion could influence the
future of SFM in BC and provide more opportunities to incentivize companies to consider carbon as a
necessary and potential beneficial asset to manage, in addition to traditional timber for forest
products. The negative impacts of putting a price on forest derived carbon could be detrimental to the
traditional forest supply chain, as it is a commodity business and relies on global markets. Therefore,
the likely political acceptability is low, relative to the other alternatives.
2.3.2.2Regulation changes if a BC forest residue supply chain was to be established
The BC’s forest tenure system consists largely of Forest Licenses and Tree Farm Licenses
(TFLs) (Government of British Columbia, 1996). The structure of the tenure system, taxation on logs
and FRPA affects what companies have rights to, company values, the public’s expectations of those
companies in managing BC forests and the objectives that are prioritized in forest management plans
(Government of British Columbia, 2002). Therefore, the regulatory framework that governs BC forest
companies and forests offers several opportunities to incentivize the removal of forest residues for
bioproduct production.
The BC tenure system changed recently, with the addition of the Fiber Forestry License to Cut
(FFLTC) and the Fiber Supply License to Cut (FSLTC) to encourage the use of forest residues that are
left behind on landings and roadsides, by the primary license holders, such as the primary harvester
(Government of British Columbia, 2016). While these new tenures do offer the opportunity for
additional companies to use biomass, it does not solve the economic challenges of removing large
volumes of forest residues from BC forests. However, a tenure system designed to include the ‘rights’
of other ecosystem services and not just timber, such as forest carbon, could provide the additional
revenue streams for companies to manage for carbon, not just traditional wood products.
Thus, it is possible that accounting for carbon in BC forests could change the management
objectives of forest management and encourage companies to consider the potential of substituting
Assessment of likely Technology Maturation Pathways for production of biojet fuel (The ATM Project) March 2019
75
fossil fuels with forest residue wastes. Although adapting current tenure systems to support forest
residue removal does not provide direct economic support, it does provide a framework in which
forestry companies can measure and manage in-forest carbon. Although models do exist to measure
forest carbon within an acceptable degree of accuracy, implementing a new system into the forestry
supply chain could pose a significant challenge.
2.3.2.3 Wildfire management The BC Wildfire Act explicitly requires forest managers to assess fire risk and develop plans to
mitigate that risk through industrial activity. Burning piles of forest residues is a common practice in
cut blocks in BC as it is a cheap way to drastically reduce the risk of wildfires and clear the land for
replanting. Changing the BC Wildfire Act may be the cheapest way to change the perspective on BC
forest residues and forest prevention methods. Current practices result in the loss of forest biomass
that could be used to displace fossil fuels in some capacity. Therefore, an option to incentivize
companies to change their behavior is to adapt current wildfire policies to include forestland carbon.
However, a recent study completed by the Forest Practices Board found that there is little assessment
or consideration of other options to remove forest residues in BC beyond burning them on site (Forest
Practices Board, 2015). Changing the Wildfire Act in certain sections could result in a change in
behavior, such as including carbon as a ‘forestland resource and value’ in Section 18 (St-laurent et al.,
2017). Another example would be to require companies to measure slash piles and record their
potential impacts on air quality, wasted fiber and GHG emissions when conducting wildfire risk
assessments, aiding in the future management options for forest residues in BC.
Changes to the Wildfire Act and FRPA could result in a moderate change to BC forest practices
relating to forest residues. However, funding forest management initiatives, such as fire prevention,
has historically been challenging. Government programs that support the removal of ‘ladder fuels’,
fuels that elevate the risk of forest fires in summer months, aren’t a political priority compared to
other job creation programs. The historical allocation of BC’s forest fire budget has been spent on fire
suppression, not fire prevention activities, such as removing forest residues from the forest.
2.3.2.4 Operational regulations that would be required to support diverse uses of forest biomass
Part of the economic challenge companies face when collecting and removing forest residues
is the operational constraints of the traditional harvesting supply chain. Forest companies optimize the
current supply chain for traditional products derived from logs, not forest residues. Therefore, any
change in truck configuration or equipment means additional costs to the supply chain, such as road
usage.
To reduce the costs of transporting forest residues, or at the very least distributing the costs
across all forest products, there are a couple of operationally related drivers that could allow for the
flexibility necessary for lower-cost equipment to be used. For example, BC logging roads are a costly
necessity to access the remote areas of BC’s 55 million ha harvestable forestland. While FRPA and
other operational guidelines do outline specific road requirements for companies to follow, they are
optimized for long logging trucks, not for other vehicles such as dump trucks. Although this is
nuanced, additional road maintenance and accessibility contributes to the ongoing economic
challenges of reaching additional forest fiber.
Operational regulations create opportunities for different equipment to be used in the forest,
and the opportunity to share the costs of extracting forest residues with higher value forest products.
Assessment of likely Technology Maturation Pathways for production of biojet fuel (The ATM Project) March 2019
76
The potential for negative stakeholder impacts are moderate given the changes to the existing supply
chain, such as road construction costs. This also results in political acceptability to be moderate.
2.3.2.5 Downstream incentives that could be used to raise the value of BC forest residues
Renewable energy incentive programs from downstream markets are driven by government
subsidies. Two main strategies could be pursued regarding downstream partnerships and end-users of
forest residues (e.g., jet-fuel producers). First, international markets could provide downstream
product producers with incentives to use forest biomass for bio-product production. Prominent
renewable energy incentives, such as electricity certificates or subsidies, have resulted in many
countries rapidly adopting low-carbon energy alternatives and reducing their reliance on fossil fuels.
Sweden’s use of bioenergy increased since the 2000s with the Tradeable Renewable Energy
Certificates (TREC) program and associated subsidies (Ericsson and Werner, 2016).
BC’s version of renewable electricity credits consists of long-term contracts with BC Hydro,
the crown corporation energy utility in BC, signed with low-carbon energy producers, such as Conifex,
KDL and other forestry/bioenergy companies (Government of British Columbia, 2008). While this does
provide the certainty of price per MW and subsequently investment and development of the sector, it
does not support the collection and processing of forest residues from BC forests, given the current
prices set in those contracts. Retrieving forest residues from the forest are still restricted to $35-$40
CAD/odt at current energy prices set in 20-year contracts.
As mentioned earlier, the US south east, although different to Canada in many ways, does
rely heavily on forest residues to support the growing wood pellet industry, which supplies wood
pellets to the UK and other EU-Member States (Drax Group plc, 2015). A declining pulp and paper
sector in the US SE coupled with increased interest from European energy utility companies have led
to large-scale collection and use of forest residues. Canada could capture more interest from the EU, if
the value of wood pellets were to increase beyond their current ~$150 USD/odt price-point.
The second potential strategy is for the Canadian and BC government to promote and
facilitate partnerships between forestry companies, technology providers and downstream
providers/producers, such as the recent partnership between Canfor and Licella (Canfor Inc., 2016).
Although Licella is a technology company, they have provided the necessary expertise to produce
‘biocrude,’ a chemical input used for a variety of products and processes within the oil refinery
industry. Funding research and development within the forestry industry and promoting the
sustainable supply of BC forest residues can support the growth of multi-national partnerships
between Canada’s established forestry industry and key industries/markets in the bio-economy. The
economics of forest residues is such that downstream partnerships will be necessary to access high-
value markets to justify the capital investment. However, it is likely that forestry companies will have
to lead the charge. Currently, in initiatives such as biojet-fuel development, forestry companies are
largely left out and lack the knowledge or risk profile to further advance the potential of forest
biomass use in various aspects of the bio-economy.
It is apparent that supportive policies have and will be key in the global transition to a low-
carbon economy and at least partially led to the rapid development of the wood pellet sector in BC and
the US south east. It should be noted that the potential for negative stakeholder impacts, such as

Assessment of likely Technology Maturation Pathways for production of biojet fuel (The ATM Project) March 2019
77
increasing costs, in the forest supply chain is low given the ‘market pull’ of incentive programs.
Assessing the political acceptability of this type of strategy requires an assessment of the national and
international context. It is likely that Canada and BC recognize the value of supporting renewable
energy strategies with forest biomass. However, currently, there is a lack of subsidies or support at
the provincial and federal level (Bloomberg Magazine, 2017). This will be needed if BC and Canada are
to facilitate the expansion of forest biomass for the expansion of the emerging bioeconomy.
2.3.3 Sustainability certification of forest residues in BC The ATM Project looks at the production of biojet fuel from forest residues in British Columbia.
Use of forest residues as a feedstock for biofuels raises questions about the sustainability of this
practice within the broader framework of forest certification. While forest certification has been a long-
standing measure of sustainability in the forest sector, the removal of and utilization of forest residues
have not been covered under these certification schemes. Within the bioenergy sector, wood pellet
producers have developed specific sustainability certification schemes for their product, but this does
not address in-forest practices. This section of the ATM Project report looks at incorporation of forest
residues under the umbrella of current forest certification schemes to facilitate the sustainability
verification of this feedstock for production of biojet fuels.
British Columbia (BC) has a world-renowned forest sector and the highest percentage of third
party certified sustainable forests in the world. Thus, BC is well positioned to supply sustainable forest
biomass for bioenergy/biofuels.
Currently, underutilized forest residues could provide a major source of biomass for
bioenergy/biofuels. However, the use of forest residues under current BC forest management
standards does not fulfill some sustainability requirements defined by trade policies. Therefore, an
improved sustainability verification system would support the growth of bioenergy/biofuels globally.
Most forest certification systems were initially developed for traditional forest products such as lumber
and pulp. In contrast, the evolving bioenergy sector uses biomass-sourcing certification standards that
have limited connection to in-forest certification procedures. As a result, gaps between these
certification standards challenge the potential of forest residues being used as sustainable feedstocks
for the current and future bioeconomy.
A partnership between forest and biomass-sourcing sustainability standards would be
beneficial, potentially by connecting GHG emissions data and other key metrics along the supply
chain. The Programme of Endorsed Forest Certifications (PEFC) has begun developing a GHG tracking
system for forest managers and is considering partnership opportunities with the Sustainable Biomass
Program (SBP), a prominent wood pellet certification organization.
2.3.3.1Third-party certification standards Certification systems have become the de facto due diligence tools to verify that multi-
national supply chains are sustainable, particularly in the forestry industry. However, ‘new’ products
and supply chains, such as wood pellets or biojet fuels, often develop faster than certification
standards can adapt and create new verification procedures. Therefore, new feedstocks and products
often require overlapping standards or new modules to define and verify sustainable practices. Wood
pellet production using forest residues is one such case, where there is no ‘one-size-fits-all’ solution to
help verify the sustainability of a forest residue. Similarly, biojet fuels made from forest residue will

Assessment of likely Technology Maturation Pathways for production of biojet fuel (The ATM Project) March 2019
78
require innovative certification solutions to ensure sustainability within the forest.
2.3.3.1 Forest management certification Over the last two decades, sustainable forest certification has become a large part of the
management of Canada’s forests, with more than 43% of the world’s third-party certified forests
located in Canada (Natural Resources Canada, 2017). Forest certification authorities, such as the
Forest Stewardship Council (FSC) and the Sustainable Forest Initiative (SFI), emerged globally in the
early 1990s due to concerns about unsustainable harvesting in the pulp and paper industry (Auld,
Gulbrandsen and McDermott, 2008). ENGOs continue to play a pivotal role in the growth of private
governance systems or forest certifications in BC, which have become a due diligence tool for
multinational supply chains of traditional forest products. Forestry is among the first industries to
rapidly adopt and adapt private governance systems directly addressing sustainability, in response to
a variety of pressures including global consumer trends to buy products that have additional
transparency and sustainable practices.
2.3.3.2 Sustainability considerations of harvesting additional forest biomass
Forest residues in BC typically consist of treetops, branches and non-merchantable trees
(e.g., crooked or damaged trees) from harvest blocks that have undergone, or are being, harvested
for traditional forest products. Historically, BC forest residues have been collected, piled and burned
during the winter months of the harvesting period. In fact, the provincial legislation mandates forest
companies to reduce the fire risk in harvest-blocks by removing ‘unavoidable waste’ from their sites.
Some of BC’s forest residues are currently used in small quantities in power generation facilities next
to sawmills and pulp and paper mills, or in wood pellet production where mill residue supplies do not
fulfil current feedstock demand (Drax Group plc, 2015). However, regardless of the end use of forest
residues as a feedstock, there are significant sustainability concerns when managing a forest more
intensively through biomass removal beyond merchantable timber and products.
The rotation age of trees in BC (how long it takes a tree to grow until it is harvested) is
approximately 80-100 years. The long rotation age, relative to other areas, results in larger trees used
for construction products, panels and other high-quality products. Comparing BC’s forest residues and
its use in other areas that utilize forest residues for energy products can demonstrate how BC forest
residues can achieve sustainability requirements in bioenergy/biofuels. In the US SE, North America’s
largest wood pellet producing region, forest residues are different. Given the nature of the forest
products industry and dominant tree species, the US south east has much smaller diameter trees,
thus aiding in the removal of tree tops/branches and other biomass considered forest residues. The
decline of the pulp and paper industry has resulted in the increased availability of smaller trees unfit
for sawmills. Therefore, the US south east relies on forest residues and pulp and paper logs for wood
pellet production, exporting close to 4M t/year of wood pellets, 90% to the UK, Belgium and Denmark
(U.S. Department of Commerce, 2016).
Similarly, Finland’s forest residues consist of smaller treetops or pulp and paper logs, which
are ’whole-tree harvested’. The whole tree is cut and used, leaving little residues left on site. Forest
managers in Finland use every part of a tree in most cases, selling larger portions to sawmills and
using residues for domestic combined heat and power systems and other bioenergy applications
(Berndes et al., 2016). Despite the lack of certification, studies have shown the use of forest residues
for energy in Finland results in an increase in sequestered carbon and an overall reduction in GHG
Assessment of likely Technology Maturation Pathways for production of biojet fuel (The ATM Project) March 2019
79
emissions. The US south east and Finland provide unique perspectives on the development of wood
pellet production, forest residue sustainability and the role of certification standards. There has been
extensive research into the impacts of removing additional forest biomass from forests and these
studies generally indicate that, when managed sustainably, forest residues can be a sustainable
feedstock for the evolving bioeconomy (Stupak et al., 2011).
Despite these studies, the verification of sustainable forest management practices will be an
ongoing necessity, to ensure the availability of enough forest residues for bioenergy/biofuels
applications. Key environmental sustainability considerations in forest management include forest
productivity, forest ecosystem resilience and quality (soil nutrients, biodiversity, and water resources),
the ecological integrity of the landscape and the reduction of harmful pollutants (Hennenberg et al.,
2010; Stupak et al., 2011).
2.3.3.3 Extending forest certification systems for bioenergy and biofuels markets
The existence of biomass-sourcing certification standards and forest certification standards in
a supply chain results in a complex governance landscape, in addition to state/provincial and federal
level forest management and biomass trade policies. Due to the complexity, there are overlapping
biomass sustainability requirements, standards, and potential gaps that could affect the use of BC
forest residues in the future. It should be noted that ‘non-timber’ forest products, such as forest
residues, will likely require a larger scope than a management unit or even landscape to fulfill
downstream policy requirements.
Although many studies point to a ‘harmonization’ between certification standards as the
answer to the complexity and assurance of a transparent/sustainable supply chain, a pairing or
coupling is more likely and more effective. For a variety of reasons, SFI (through PEFC) and SBP are
best-positioned to develop a partnership to verify sustainable business practices across the entire
wood pellet supply chain and likely into other products that use forest biomass. First, one of the major
extensions to forest certification standards likely to occur is the development of a GHG emissions
tracking module. GHG emissions reporting is a current requirement for wood pellet production and
trade to the EU (European Parliament and the Council of the European Union, 2009). There are several
methods used to calculate GHG emissions, which unfortunately vary between each EU Member State.
Additionally, emissions tracking within the forestry supply chain is becoming particularly important, as
ENGOs lobby EU policy markets, arguing against the use of wood pellets sourced from BC or the US
south east, due to their ‘high GHG emissions’.
Although biomass-sourcing certification standards have GHG emissions tracking systems in
place, they do not enter the forest at the forest management unit (FMU)-level. Current tracking
systems do not report on emissions from the forest or from forest management practices. The EU
Forest Strategy (2013) indicates the growing need and interest in maximizing the use of woody
biomass, thus requiring additional GHG emissions tracking. Life Cycle Analysis (LCA) has become a
well-used tool to measure and manage GHG emissions in a variety of industries around the world for
products. Forestry companies will most likely need to adapt to include LCA GHG emissions tracking to
ensure feedstocks (e.g. forest residues and low-grade logs) adequately fulfill a net decrease in GHG
emissions when converted into a product.
Currently, the PEFC has initiated a Working Group to develop its own GHG emissions tracking
module for SFM and/or CoC certification. There is a potential additional module that will apply to PEFC
Assessment of likely Technology Maturation Pathways for production of biojet fuel (The ATM Project) March 2019
80
certifications aimed at tracking and managing FMU-level GHG emissions (Programme for Endorsed
Forest Certifications, 2015). While the working group is ongoing, PEFC has presented results of their
developments to the SBP in stakeholder meetings (Personal communications, G. Bull, August, 2017).
SBP is a likely and preferred collaborator on a GHG module, as the SBP ‘Data Transfer Platform’ (DTP),
one of the most robust solutions for data transfer, ensures all of the GHG data along the supply chain
is tracked and entered into calculations that are reported to EU Member States (Personal
communications, I. Stupak, July 2017). The DTP allows energy producers to use all the data needed
for a specific region or supply chain and do their GHG calculations using an acceptable model, such as
Biograce (required in Denmark). Tracking GHG emissions in this way shows compliance with national
requirements for GHG emission savings. However, a major challenge is still the varied requirements
for GHG emission savings for solids between the UK, Denmark, the Netherlands and Belgium.
The FSC has an Online Claims Platform (OCP), which ‘digitally connects certified FSC suppliers
and customers’ and could manage the tracking and reporting of GHG emissions data from a variety of
sources. However, FSC OCP does not currently include GHG emissions tracking or reporting. While this
type of certification is likely to have minimal impact on harvesting forest residues, it does involve
some adaptations to include the GHG emissions of biomass cultivation, harvest and transport
(Rosenbaum, Schoene and Mekouar, 2006). The FSC OCP or the CoC standard could be the tracking
system necessary to integrate the forestry supply chain with downstream standards, such as SBP or
RSB, subsequently fulfilling GHG reporting requirements. CoC’s will need to be adapted to handle the
new or modified equipment and processing of forest residues for collection and production and be able
to include large scale downstream organizations, such as a biorefinery.
Second, the recognition between standards will become increasingly important as more
businesses use forest biomass to produce various bioproducts, to reduce the reliance on fossil fuel
alternatives. To accommodate the overlap of sustainability standards, SBP, ISCC and RSB have
recognized some forest certification standards, ensuring equivalency and at times collaborating to
ensure future requirements align. Many standard authorities are recognized by others or EU Member
States, based on their equivalent fulfillment of policies or Principles and Criteria. However, there are
ongoing issues with the recognition or selection of certain certification standards over others.
It is apparent that the stakeholders and underlying politics involved in both biomass-sourcing
and forest certification authorities have resulted in a complex private-governance landscape. For
example, the RSB, to support environmentally focused standards, which are supported by their broad
membership, recognizes the FSC as a credible and equivalent sustainability standard for bioenergy
and biofuels feedstocks. This recognition of one forest certification over another, may limit the
applicability of the RSB approach for BC forest residue use as, currently, SFI or CSA-SFM certification
dominates BC forests. Recognizing only some upstream standards limits other businesses who certify
with other certification schemes (i.e. SFI), which contain nuanced differences to FSC. The fact that
RSB preferentially recognizes FSC is part of a larger movement, supported by environmental
organizations, such as the World Wildlife Fund (WWF), to develop and support for broad-stakeholder
driven sustainability standards rather than accepting industry-driven standards. The ISEAL Alliance
represents this movement.
The relationship between forest certification standards, biomass-sourcing certification
standards and stakeholders in the market can apply additional restrictions or market access burdens
on forest residue use in some markets. For example, the Sustainable Aviation Fuel User Group
(SAFUG) has publicly supported the ISEAL Alliance standards in the pursuit for a globally recognized
Assessment of likely Technology Maturation Pathways for production of biojet fuel (The ATM Project) March 2019
81
sustainable supply chain. However, ISEAL recognizes the FSC as the only forest management standard
to meet their requirements for membership, thus excluding most of BC’s forest residues, while they
remain under only SFI or CSA-SFM certification.
The recognition of one standard over another can exclude, or present a market barrier to,
large amounts of BC forest residues based on a political decision between forest certification
standards. Therefore, a significant challenge is in ensuring forest residues are properly and
consistently certified and that governments support all credible certification standards. While FSC may
already be fully supported by RSB, the SBP which includes all forest certification schemes likely makes
them better positioned to partner with the wood pellet industry and other bio-product industries as
they develop. Compared to FSC and RSB, which excludes industry-driven standards outside of the
ISEAL Alliance, a possible PEFC and SBP partnership would likely be more successful in providing a
fully transparent, verified sustainable supply chain for increased forest residue use.
2.4 Source and cost of hydrogen for production of biojet fuel
Conversion of biomass into drop-in biofuels requires removal of oxygen from feedstock and
addition of hydrogen to obtain hydrocarbon molecules with a high effective hydrogen to carbon ratio
(Heff/C) (Karatzos et al. 2014). Removal of oxygen takes place with the addition of hydrogen, either
through externally applied hydrogen during hydrotreatment or through hydrogen transfer within the
solution. A hydrotreatment approach was used in the ATM Project as the main method for upgrading
biocrudes into drop-in biofuels such as biojet. The higher the oxygen level in the starting feedstock,
the more hydrogen will be required to upgrade it into drop-in fuels that are fully fungible with existing
vehicles and infrastructure. In the case of fast pyrolysis bio-oils, the oxygen content could be as high
as 50%, with catalytic pyrolysis and HTL biocrudes having less oxygen and therefore requiring less
hydrogen.
The impact and role of hydrogen is important because large volumes of external hydrogen
inputs are required compared with the upgrading of fossil crudes. The cost of hydrogen would have
an impact on the final cost of the biofuel, while the source of the hydrogen will have an impact on the
life cycle assessment of the final fuel. An overview of sources of hydrogen, production methods, cost
and supply, with specific reference to hydrogen production and supply in BC can be found in Appendix
B.

Assessment of likely Technology Maturation Pathways for production of biojet fuel (The ATM Project) March 2019
82
CHAPTER 3 – BIOCRUDES – SOURCES, PRODUCTION AND CHARACTERISATION
3.1 Bio-oil Production Three different bio-oils were sourced from three suppliers as part of the project. Each bio-oil
was then subjected to two different upgrading schemes. The bio-oil suppliers provided information on
their processes.
3.1.1 Fast Pyrolysis The fast pyrolysis oil for the project was supplied by BTG of The Netherlands. The oil was
obtained from the commercial production of the Empyro 20 million litres/year facility at Hengelo,
Netherlands, as shown in the following Figure 21.
Figure 21 Empyro Facility, Hengelo Netherlands
The BTG process is shown in the following Figure 22.

Assessment of likely Technology Maturation Pathways for production of biojet fuel (The ATM Project) March 2019
83
Figure 22 BTG Process Flow
Like most pyrolysis processes the BTG process produces bio-oil, a combustible gas and some
char. In this process the char is consumed internally to provide the heat for the process. There is a
hot, combustible gas stream that can be used to supply heat and/or electricity.
The feedstock will have to be dried before being used in the process so the gas stream will be
used for drying. There is likely to be excess heat available but to be conservative it will be assumed
that it is all used for drying.
The process parameters used for modelling are shown in the following Table 11.
Table 11. BTG Process Parameters
The natural gas is used for start-up and the nitrogen is used for purging tanks during
shutdowns.
Parameters Value
Feedstock, kg/litre 1.875
Power, kWh/litre 0.0975
Natural gas for start-up, MJ/litre 0.48
Nitrogen, kg/litre 0.035
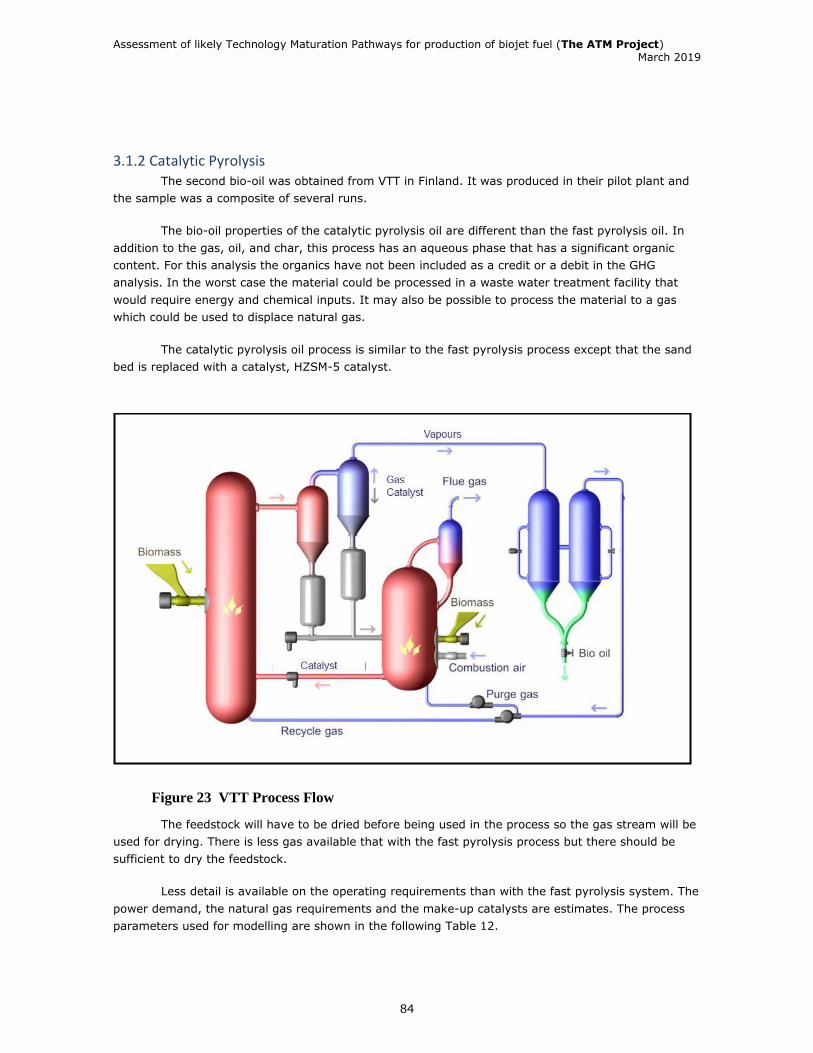
Assessment of likely Technology Maturation Pathways for production of biojet fuel (The ATM Project) March 2019
84
3.1.2 Catalytic Pyrolysis The second bio-oil was obtained from VTT in Finland. It was produced in their pilot plant and
the sample was a composite of several runs.
The bio-oil properties of the catalytic pyrolysis oil are different than the fast pyrolysis oil. In
addition to the gas, oil, and char, this process has an aqueous phase that has a significant organic
content. For this analysis the organics have not been included as a credit or a debit in the GHG
analysis. In the worst case the material could be processed in a waste water treatment facility that
would require energy and chemical inputs. It may also be possible to process the material to a gas
which could be used to displace natural gas.
The catalytic pyrolysis oil process is similar to the fast pyrolysis process except that the sand
bed is replaced with a catalyst, HZSM-5 catalyst.
Figure 23 VTT Process Flow
The feedstock will have to be dried before being used in the process so the gas stream will be
used for drying. There is less gas available that with the fast pyrolysis process but there should be
sufficient to dry the feedstock.
Less detail is available on the operating requirements than with the fast pyrolysis system. The
power demand, the natural gas requirements and the make-up catalysts are estimates. The process
parameters used for modelling are shown in the following Table 12.

Assessment of likely Technology Maturation Pathways for production of biojet fuel (The ATM Project) March 2019
85
Table 12 VTT Process Parameters
3.1.3 Hydrothermal Liquefaction The third bio-oil is a hydrothermal liquefaction oil produced by Aarhus University in Denmark.
The oil was produced in a pilot plant with a capacity of about 20 litres/hour of oil.
The system is as shown in the following Figure 24.
Figure 24. Aarhus University Facility
The HTL process is shown in the following Figure 25.
Parameters Value
Feedstock, kg/litre 6.55
Power, kWh/litre 0.20
Natural gas for start-up, MJ/litre 0.5
Make-up catalyst, kg/litre 0.012

Assessment of likely Technology Maturation Pathways for production of biojet fuel (The ATM Project) March 2019
86
Figure 25 HTL Process Flow
There is limited information available on the quantity and composition of the gases produced
from the process. It is likely that there is minimal combustible gas formation during the process as the
operating conditions are sub-critical. The primary products are the oil phase product and an aqueous
phase. As with the VTT system neither a credit nor debit is charged for the aqueous phase as little is
known about the product.
The process does not have to have dry wood as the feedstock, so no drying is required. The
pilot plant is electrically heated, but a larger plant would use natural gas to supply the energy required
to keep the system at the appropriate operating condition after as much heat is captured from the
produced product as possible.
The process parameters used for modelling are shown in the following Table 13.
Table 13. HTL Process Parameters
Parameters Value
Feedstock, kg/litre 3.05
Power, kWh/litre 0.20
Natural gas for start-up, MJ/litre 7.7
Potassium Hydroxide, kg/litre 0.0305
Carboxymethyl cellulose, kg/litre 0.0076

Assessment of likely Technology Maturation Pathways for production of biojet fuel (The ATM Project) March 2019
87
3.2 Characterisation of biocrudes (results of analysis)
Biocrudes were shipped to the upgrading labs and analysis was carried out on the biocrudes
prior to commencement of the upgrading process. Select results are shown in Table 14 below.
Table 14 Comparison of three biocrudes
Figure 26 shows the elemental composition of the three biocrudes graphically, illustrating the
large oxygen content of the BTG pyrolysis biocrude while the other two biocrudes had relatively similar
oxygen content.
Figure 26. Comparison of three biocrudes - elemental composition
0%
20%
40%
60%
80%
100%
120%
BTG VTT Aarhus
Per
cen
tage
Carbon Sulphur Hydrogen Oxygen
Parameter BTG VTT (filtered) Aarhus
Heating Value, MJ/Litre (HHV) 21.52 32.3 35.87
Density, g/litre 1,197 1,168 1,120
Carbon fraction % 44.1 74.2 78.2
Sulphur fraction % 0 0 0
Hydrogen fraction % 7.5 6.0 7.2
Oxygen fraction % 47.5 16.5 14.5
Aromaticity, % 42.9 63.9 60.9
Ash Content, wt % 0.013 0.92 0.61
pH 2.66 3 4.53
Pour point, oC -36 -6 33
Solids, wt% 0.03 1.34 0.5
TAN, mg KOH/g 125 82.6 28.6
Water content, wt % 25.7 7.6 5.6
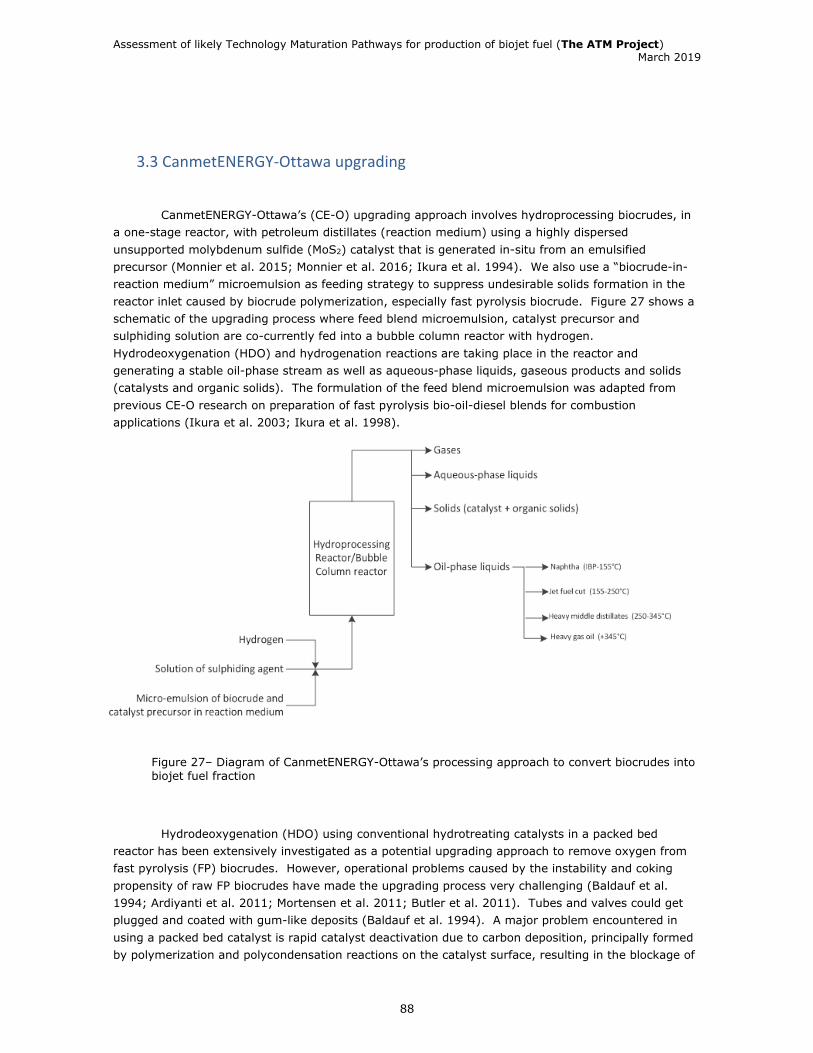
Assessment of likely Technology Maturation Pathways for production of biojet fuel (The ATM Project) March 2019
88
3.3 CanmetENERGY-Ottawa upgrading
CanmetENERGY-Ottawa’s (CE-O) upgrading approach involves hydroprocessing biocrudes, in
a one-stage reactor, with petroleum distillates (reaction medium) using a highly dispersed
unsupported molybdenum sulfide (MoS2) catalyst that is generated in-situ from an emulsified
precursor (Monnier et al. 2015; Monnier et al. 2016; Ikura et al. 1994). We also use a “biocrude-in-
reaction medium” microemulsion as feeding strategy to suppress undesirable solids formation in the
reactor inlet caused by biocrude polymerization, especially fast pyrolysis biocrude. Figure 27 shows a
schematic of the upgrading process where feed blend microemulsion, catalyst precursor and
sulphiding solution are co-currently fed into a bubble column reactor with hydrogen.
Hydrodeoxygenation (HDO) and hydrogenation reactions are taking place in the reactor and
generating a stable oil-phase stream as well as aqueous-phase liquids, gaseous products and solids
(catalysts and organic solids). The formulation of the feed blend microemulsion was adapted from
previous CE-O research on preparation of fast pyrolysis bio-oil-diesel blends for combustion
applications (Ikura et al. 2003; Ikura et al. 1998).
Figure 27– Diagram of CanmetENERGY-Ottawa’s processing approach to convert biocrudes into biojet fuel fraction
Hydrodeoxygenation (HDO) using conventional hydrotreating catalysts in a packed bed
reactor has been extensively investigated as a potential upgrading approach to remove oxygen from
fast pyrolysis (FP) biocrudes. However, operational problems caused by the instability and coking
propensity of raw FP biocrudes have made the upgrading process very challenging (Baldauf et al.
1994; Ardiyanti et al. 2011; Mortensen et al. 2011; Butler et al. 2011). Tubes and valves could get
plugged and coated with gum-like deposits (Baldauf et al. 1994). A major problem encountered in
using a packed bed catalyst is rapid catalyst deactivation due to carbon deposition, principally formed
by polymerization and polycondensation reactions on the catalyst surface, resulting in the blockage of

Assessment of likely Technology Maturation Pathways for production of biojet fuel (The ATM Project) March 2019
89
the active sites on the catalysts (Ardiyanti et al. 2011; Mortensen et al. 2011; Butler et al. 2011). In
addition, catalyst deactivation can occur through poisoning by water, sintering of the active metal
sites, and metal leaching due to the attack by water and organic acid (Mortensen et al. 2011).
Instead of using supported catalysts in packed bed reactors, CE-O utilize a dispersed unsupported
catalyst for hydrodeoxygenation of fast pyrolysis biocrude to suppress coke formation and avoid
catalyst deactivation. Dispersed unsupported catalysts have been reported to be better suited for
catalytic upgrading of petroleum residual oil and co-processing of heavy oil and coal (Panariti et al.
2000; Tian et al. 1998; Tye & Smith 2004). Dispersed unsupported catalysts have a number of
characteristic advantages over supported catalysts, i.e. little deactivation, processing of poor quality
feed, maximum interaction of oil and hydrogen with the catalyst active sites to inhibit coke formation,
and a high degree of active site utilization due to the absence of diffusional limitation of reactants
(Tian et al. 1998; Tye & Smith 2004; Al-Marshed et al. 2015). In our approach, highly dispersed
unsupported MoS2 catalysts were generated in-situ by thermal decomposition of the microemulsion
catalyst precursor. The microemulsion catalyst precursor was adapted from earlier research on co-
processing of heavy oil and coal as reported in a patent by Ikura et al. (1994).
CanmetENERGY-Ottawa’s upgrading approach is ideally suited for biojet components that can
be incorporated into an oil refinery jet fuel stream. Figure 28 presents two potential insertion points
of the biocrude upgrading unit in an oil refinery, i.e. prior to either the middle distillates hydrotreater
or the kerosene hydrotreater where straight-run (SR) middle distillates or SR kerosene streams are
refined. We envision that a fraction of the SR middle distillates or SR kerosene streams would be
diverted to the biocrude upgrading unit to be used as reaction medium and be enriched with biogenic
hydrocarbons (renewable content) before being returned to the middle distillates or kerosene
hydrotreater (oil phase products only). For this project, we use a furnace fuel oil as the reaction
medium, which has a boiling range close to straight-run middle distillates, in order to evaluate biojet
component production. The upgraded oil products are fractionated into naphtha (IBP-155°C), jet fuel
(155-250°C), heavy middle distillates (250-345°C) and heavy gas oil (+345°C) fractions. Refiners
may or may not fractionate the oil products prior to further refining. The properties of these four
fractions containing biogenic components derived from biocrudes are evaluated, with a special focus
on jet fuel fraction.

Assessment of likely Technology Maturation Pathways for production of biojet fuel (The ATM Project) March 2019
90
Figure 28– Two potential insertion points for the upgrading unit prior to the middle
distillates and kerosene hydrotreaters (oil refinery diagram based on www.uop.com/refining -flowscheme-2/ )
3.3.1 Canmet upgrading results
3.3.1.1 Preparation of biocrude feed blends CanmetENERGY-Ottawa (CE-O) performed production tests for each biocrude using a feed
blend containing 18 wt% biocrude (composition selected based on preliminary tests). All biocrudes
were tested as received and were not filtered prior to blending. Biocrude feed blend composition is
listed in Table 15.
Table 15: Biocrude feed blend composition (in wt%)
BTG FP VTT CP Aarhus U. HTL
Biocrude 18.08% 17.96% 17.97%
Furnace fuel oil 76.03% 69.67% 68.33%
Surfactant 2.74% 4.09% 4.15%
Methanol 1.11% 1.64% 1.66%
TPBS 1.08% 1.15% 1.76%
Water 0.64% 0.67% 1.03%
Ammonium
paramolybdate 0.24% 0.24% 0.37%
Ammonium hydroxide 0.08% 0.08% 0.13%
DEGMME — 4.49% 4.61%
Assessment of likely Technology Maturation Pathways for production of biojet fuel (The ATM Project) March 2019
91
A “biocrude-in-reaction medium” microemulsions was used as feeding strategy in order to
suppress undesirable solids formation and pressure buildup in the reactor inlet caused by biocrude
polymerization, especially for fast pyrolysis biocrude. The “biocrude-in-reaction medium”
microemulsion was prepared by emulsifying biocrude, furnace fuel oil and a surfactant solution (2.5:1
surfactant to methanol mass ratio) using a Polytron homogenizer. The preparation of the biocrude
microemulsion was adapted from the method used by Ikura et al. for making stable microemulsions
with 5-30 wt% bio-oil in diesel fuel (Ikura et al. 2003). In the case of the VTT catalytic pyrolysis (CP)
and Aarhus U. hydrothermal liquefaction (HTL) biocrude microemulsions, a diluent (diethylene glycol
monomethyl ether, DEGMME) was added to reduce the viscosity of the biocrude prior to preparing the
microemulsion. Meanwhile, more surfactant was used for VTT CP and Aarhus U. biocrude blends.
Being solid at room temperature, the Aarhus U. HTL biocrude was heated to 70°C before mixing with
DEGMME, furnace fuel oil, and surfactant solution. The catalyst precursor solution and the sulphiding
agent (TPBS) were subsequently mixed with each biocrude microemulsion prior to feeding into the
reactor system.
3.3.1.2 Distillation, fractionation and characterisation The Combined oil products were fractionated by spinning band distillation into naphtha (IBP-
155°C), jet fuel (155-250°C), heavy middle distillates (250-345°C) and heavy gas oil (+345°C)
fractions.
The product distribution data after fractionation indicates that 47.4 wt% and 49.4 wt% of the
oil produced respectively from HDO of the BTG FP and VTT CP biocrude blends are in the jet fuel
boiling range compared to 38.8 wt% of the oil from the Aarhus U. HTL biocrude blend. The other
major fraction of the oil phase products is the heavy middle distillates (250-345°C), varying between
33.6 wt% and 49.7 wt% depending on feed blend. The fractions of naphtha and heavy gas oil are
minor compared to the jet fuel and heavy middle distillates fractions. Naphtha is high for BTG FP and
VTT CP (10.6 wt% and 8.5 wt%) and low for Aarhus U. HTL (2.1%). Heavy gas oil fractions are high
for VTT CP and Aarhus U. HTL biocrude blends (8.4 wt% and 8.9 wt%) while it is low for BTG FP (3.3
wt%).
The jet fuel fraction yield was estimated to 40.2 g/100 g feed blend (BTG FP), 42.8% (VTT
CP) and 30% (Aarhus U. HTL) respectively. It should be noted that the BTG FP and VTT CP HDO tests
were performed with furnace fuel oil containing 49.2 wt% hydrocarbons boiling in the jet fuel range
(Batch I) whereas the Aarhus U. HTL tests used a second batch of furnace fuel containing 38.8 wt%
jet fuel range hydrocarbons (Batch II). Results show that the yields of different cuts are mostly
predetermined by the reaction medium used.
3.3.1.3 Biogenic carbon content in oil products Since a fossil-based reaction medium is used in CanmetENERGY-Ottawa’s upgrading
approach, it is essential to quantify the biogenic carbon in the different oil fractions. The biocarbon
content in liquid products (combined oil product and four fractions obtained by spinning band
distillation) was determined using 14C analyses (radiocarbon method) performed on a 3MV tandem

Assessment of likely Technology Maturation Pathways for production of biojet fuel (The ATM Project) March 2019
92
accelerator mass spectrometer (AMS) built by High Voltage Engineering Europa B.V. (HVE) at
University of Ottawa. The biocarbon fractions, calculated relative to the fraction modern carbon F14C
of the corresponding biocrude, are presented in Table 16.
As shown in Table 16, 14C analyses indicated that biocarbon accounted for 14.2% of all carbon
in the oil-phase liquid product from VTT CP biocrude. This is higher than that for the oil product
(8.0%) from the BTG FP biocrude feed blend. In the case of Aarhus U. BTL-derived oil, the biocarbon
fraction of total C reached 26.7%. However, based on carbon balance calculations, we have
concluded that this percentage is too high. Carbon balance data gave a biocarbon fraction of 16.5%,
which is slightly higher than the value obtained with the VTT CP biocrude-derived oil.
For VTT CP oil products, the 14C analyses of the four fractions obtained by spinning band
distillation indicate that biocarbon accounts for about 9.6% of total carbon in the jet fuel fraction,
26.9% of C in naphtha, 14.7% of C in heavy middle distillates and 34.4% of C in heavy gas oil
fractions. These biocarbon content values for the VTT CP-derived fractions are generally higher than
those for the BTG FP-derived jet fuel (3.4%), naphtha (15.0%), heavy middle distillates (10.1%) and
heavy gas oil (32.8%). The biocarbon content of Aarhus HTL-derived jet fuel reaches 12.7%, with
21.5%, 13.5% and 50.1% in naphtha, heavy middle distillates and heavy gas oil fractions
respectively.
Note that the variation in biocarbon contents among four fractions is the combined results of
the boiling point distribution of the reaction medium and that of components derived from biocrudes.
As each biocrude blend contains only 18 wt% biocrude and the major component, furnace fuel oil, is
made of about 45 wt% jet fuel fraction, the biogenic carbon contents in jet fuel fraction ended up
relatively low for the first two biocrudes investigated, i.e. 9.6 % for VTT CP and 3.4% for BTG FP
blend. The highest biocarbon content (12.7%) is found in Aarhus HTL-derived jet fuel. However, it is
expected that higher biogenic carbon contents in jet fuel fraction can be achieved by either blending
more biocrudes into the feed blend or using a reaction medium containing less jet fuel fraction.
Table 16: Biocarbon fraction of total C in oil-phase products obtained by 14C analysis
a: From mass balance calculations; b: Calculated value.
The distribution of biogenic carbon in the oil products is calculated and presented in Figure 29.
The distribution data indicates that 31.6% of biogenic carbon is in the jet fuel fraction for VTT CP
biocrude, 29.8% in the corresponding Aarhus U. HTL-derived fraction and 20.0% in the BTG FP-
derived fraction. Significantly more biogenic carbon is found in the heavy middle distillate fractions
(250-345°C), ranging from 33.8% to 47.7%. The biogenic carbon fraction in naphtha is 19.0%,
15.1% and 2.5% respectively, for BTG FP, VTT CP and Aarhus U. HTL biocrudes and it is 13.3%,
19.5% and 26.8% in heavy gas oils. For three biocrudes, in general, the majority of biocarbon is in
heavy middle distillates, followed by the jet fuel cut. Depending on biocrudes, 67.7%, 65.4% and
BTG FP derived
products
VTT CP derived
products
Aarhus U. HTL
derived products
The biocarbon fraction of total C, %
Oil-phase products 8.0 14.2 16.5a
Naphtha (IBP-155°C) 15.0 26.9 21.5
Jet fuel fraction (155-250°C) 3.4 9.6 12.7
Heavy middle distillates (250-345°C) 10.1 14.7 13.5b
Heavy gas oils (+345°C) 32.8 34.4 50.1

Assessment of likely Technology Maturation Pathways for production of biojet fuel (The ATM Project) March 2019
93
70.7% of biocarbon is in the diesel cut, i.e. middle distillate fraction (155-345°C).
This distribution of biogenic carbon is useful information because raw biocrudes cannot be
effectively distilled to determine the boiling point distribution without coking or significant material
loss.
The yields of biogenic carbon in the oil products, expressed in g bioC/100 g C in biocrude (or
simply % thereafter), are estimated based on 14C analysis for three biocrudes. Results are shown in
Table 17. For the VTT CP biocrude, the biogenic carbon yield in the oil phase product is higher than
that for the BTG FP biocrude, i.e. 91.7% vs. 75.2%, indicating a better biocarbon retention in the oil
product. Carbon retention in Aarhus U. HTL-derived oil-phase product is 86.7%, which is better than
BTG-FP but lower than VTT CP.
Moreover, for the VTT CP biocrude, the biocarbon yield in jet fuel is 29.0% while it is 25.8%
for Aarhus U. HTL and 15.0%, for BTG FP biocrude. It should be pointed out that the biogenic carbon
yields in heavy middle distillates are high for all biocrudes (from 31.0% to 35.9%). For naphtha
fractions, the biocarbon yields are similar for BTG FP and VTT CP biocrudes (14.3% vs. 13.8%) while it
is low (2.1%) for Aarhus U. HTL. The biocarbon yield in heavy gas oil fraction increases in the
following order: BTG FP, VTT CP and Aarhus U. HTL. The biocarbon yield in diesel cut with boiling
points from 155°C to 345°C, i.e. the sum of jet cut and heavy middle distillates, is 50.9%, 60.0% and
61.3% for BTG, VTT and Aarhus U. HTL biocrudes respectively.
Figure 29: The distribution of biogenic carbon in the oil-phase product
Table 17: Product yield of biogenic carbon
BTG FP VTT CP Aarhus U. HTL
Biocarbon yield in oil-phase, g bioC/100 g
C in the biocrude 75.2% 91.7% 86.7%
Naphtha (IBP-155°C) 14.3% 13.8% 2.1
Jet fuel fraction (155-250°C) 15.0% 29.0% 25.8
Heavy middle distillates (250-345°C) 35.9% 31.0% 35.5
Heavy gas oils (+345°C) 10.0% 17.9% 23.2
Assessment of likely Technology Maturation Pathways for production of biojet fuel (The ATM Project) March 2019
94
3.3.2 Summary of CE-O results Concluding observations were made by the CE-O scientists based on the upgrading tests
performed by CE-O.
CE-O’s upgrading approach uses a “biocrude-in-reaction medium” microemulsion as feeding
strategy to suppress undesirable solids formation in the reactor inlet caused by pyrolysis oil
polymerization. This microemulsion formula was typically developed for pyrolysis oil, thus it is
working with BTG FP biocrude without any issues. However, for preparing the feed blend with VTT CP
and Aarhus U. HTL biocrudes, the original proprietary microemulsion formula had to be modified to
accommodate the high viscosities of these two biocrudes. This was done by adding more surfactant
and a supplementary additive. At this point, the current microemulsion formulas for VTT CP and
Aarhus U. HTL biocrudes require further optimization.
CE-O processed three biocrudes at similar operating conditions although higher pressure and
higher Mo concentration were used for Aarhus U. HTL biocrude. We found that the oxygen content in
the oil products and the degree of deoxygenation are quite different from each other. At 93.4%, the
degree of deoxygenation for BTG FP feed blend is the highest of all three biocrudes with the lowest
oxygen content in the oil product (0.4 wt%). The degree of deoxygenation is lower with more oxygen
left in the oil products for VTT CP and Aarhus U. HTL biocrudes. This indicates that VTT CP and Aarhus
U. HTL biocrudes require upgrading at more severe operating conditions. But due to time constraints,
no such tests could be conducted within the timeframe of the R&D contract.
In terms of jet fuel properties, the jet fuel fraction produced from BTG FP biocrude feed blend
meets 14 out of 17 ASTM D7566 specifications, while 10 out of 17 ASTM D7566 specifications are met
by the jet fuel fraction derived from VTT CP biocrude21. In the case of the jet fuel fraction obtained
from HTL biocrude feed blend, we assessed 14 ASTM D7566 specifications due to the limited sample
available and met 11 out of them. We observed that for all biocrude-derived jet fuel fractions,
properties related to “contaminants” (existent gum, microseparometer rating) fell outside the
acceptable limits, although the microseparometer rating is significantly better for the HTL-derived jet
fraction. Neither BTG FP-derived nor VTT CP-derived jet fuel meets specifications for thermal stability.
The electrical conductivity and corrosion fell outside the acceptable limits for the VTT CP-derived
fraction. The specifications that are not met can be mostly linked to the presence of partially
converted oxygenated compounds in the jet fuel fractions. Therefore, it is expected that additional
fuel polishing would be performed to help meet all the ASTM D7566 jet fuel specifications. There are
several possible approaches that can be further examined to reduce the oxygen content in the oil
products and jet fuel fractions. The impact of increasing the operating severity of the upgrading stage
on the reduction of the oxygenated compounds in the oil products requires further investigation.
Other post-treatments such as extraction or adsorption can be explored. Reduction of oxygen at
refinery downstream hydrotreating stage requires collaborative investigation (for example,
incorporation of biogenic carbon in kerosene or middle distillates hydrotreaters).
The biogenic carbon content in the jet fuel fraction is 12.7% for Aarhus U. HTL, 9.6% for VTT
CP and 3.4% for BTG FP biocrudes-derived products. The biogenic carbon content is expected to
increase by blending more biocrude into the feed blend. Feed blends containing more biocrude thus
21 Note that this was based on the total co-processed fuel, not just the biogenic fraction
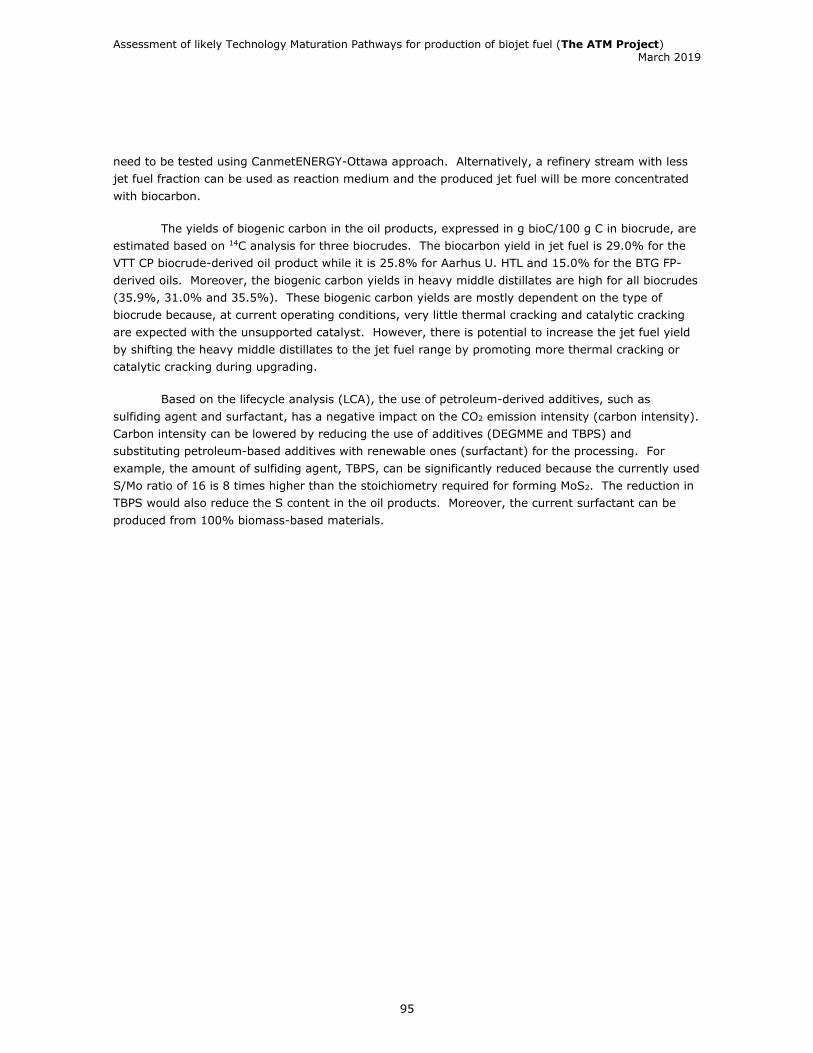
Assessment of likely Technology Maturation Pathways for production of biojet fuel (The ATM Project) March 2019
95
need to be tested using CanmetENERGY-Ottawa approach. Alternatively, a refinery stream with less
jet fuel fraction can be used as reaction medium and the produced jet fuel will be more concentrated
with biocarbon.
The yields of biogenic carbon in the oil products, expressed in g bioC/100 g C in biocrude, are
estimated based on 14C analysis for three biocrudes. The biocarbon yield in jet fuel is 29.0% for the
VTT CP biocrude-derived oil product while it is 25.8% for Aarhus U. HTL and 15.0% for the BTG FP-
derived oils. Moreover, the biogenic carbon yields in heavy middle distillates are high for all biocrudes
(35.9%, 31.0% and 35.5%). These biogenic carbon yields are mostly dependent on the type of
biocrude because, at current operating conditions, very little thermal cracking and catalytic cracking
are expected with the unsupported catalyst. However, there is potential to increase the jet fuel yield
by shifting the heavy middle distillates to the jet fuel range by promoting more thermal cracking or
catalytic cracking during upgrading.
Based on the lifecycle analysis (LCA), the use of petroleum-derived additives, such as
sulfiding agent and surfactant, has a negative impact on the CO2 emission intensity (carbon intensity).
Carbon intensity can be lowered by reducing the use of additives (DEGMME and TBPS) and
substituting petroleum-based additives with renewable ones (surfactant) for the processing. For
example, the amount of sulfiding agent, TBPS, can be significantly reduced because the currently used
S/Mo ratio of 16 is 8 times higher than the stoichiometry required for forming MoS2. The reduction in
TBPS would also reduce the S content in the oil products. Moreover, the current surfactant can be
produced from 100% biomass-based materials.

Assessment of likely Technology Maturation Pathways for production of biojet fuel (The ATM Project) March 2019
96
3.4 PNNL upgrading Hydrotreating (HT) tests were performed at the Pacific Northwest National Laboratory,
Richland Washington, USA, (PNNL) on three biocrude products provided by the ATM project: a fast
pyrolysis (FP) bio-oil from BTG in Hengelo, Netherlands, a catalytic fast pyrolysis (CFP) bio-oil from
the Technical Research Centre of Finland, Espoo, Finland (VTT), and a hydrothermal liquefaction (HTL)
biocrude from Aarhus University, Denmark. This chapter includes both the analytical methods and
data relative to the biocrudes and HT products, as well as the HT processing methods and results.
3.4.1 Characterization of biocrude feedstocks Detailed analysis of the received products was performed. Elemental components including
carbon, hydrogen, nitrogen (ASTM D5291/D5373), O (ASTM D5373mod), S (ASTM D1552/D4239) and
water content (Karl Fischer titration, ASTM D6869) were measured. The reported elemental
components data (C, H, O, N, S) in Table 19 are calculated on dry basis (subtracting the H and O
found in the moisture and then normalized to 100). Viscosity and density measurements were
conducted on a Stabinger viscometer (Anton Paar SVM 3000) at 20 °C for HT products but done at
higher temperature for the biocrudes due to high viscosity at room temperature. The carbonyl
contents of the biocrude samples were determined using a modified titration method (the modified
Faix method). A modified ASTM standard method D664 for determining the acid content of petroleum
products was used to determine both carboxylic acid numbers (CAN) and total acid numbers (TAN) of
biocrudes. The TAN includes carboxylic acids as well as weaker acidic compounds such as phenolics.
Therefore, the phenolic number (PhAN) was calculated by the difference between the TAN and the
CAN. Inductively coupled plasma atomic emission spectroscopy (ICP-AES) analysis was done on a
sample digested in a mixture of HNO3 and HF followed by a second step addition of boric acid. Solids
content was determined by ASTM D7579, heating value was determined by calorimetric bomb method
(ASTM D7544).

Assessment of likely Technology Maturation Pathways for production of biojet fuel (The ATM Project) March 2019
97
Table 18 is the summary of the characterization of the raw FP bio-oil originated from BTG.
Solids content in the raw bio-oil was very low (<0.1 wt%), which minimized catalyst fouling and
enabled the bio-oil to be hydrotreated without filtration.
The as-received CFP bio-oil from VTT was first analyzed for its solid content. Our previous
experience with hydrotreating of a similar VTT CFP bio-oil showed that the HT reactor plugged in 30 h
because of high solid content in their CFP bio-oil. As shown in Table 19, high solid and ash content
were observed in this bio-oil as well. Inorganic content analysis by ICP-AES showed that it was
primarily from zeolite catalyst used for CFP. Therefore, filtration was conducted to lower the solid
content for possible hydrotreating of the bio-oil. As shown in Table 19, filtration at 1 micron lowered
the solid content to below 0.05 wt%, which was acceptable for being processed without reactor
plugging within the planned hydrotreating test period. Density and viscosity of bio-oil decreased after
filtration, indicating the removal of some heavy component in bio-oil as well. Around 2 L filtered bio-oil
was produced. Approximately 5 % weight loss of bio-oil was observed, including solids and some
residual bio-oil in filter body. Such weight loss should be lower at a larger scale.
Table 18 Analysis of raw FP bio-oil
Table 19. Analysis of the VTT CFP bio-oils before and after filtration
The filtered CFP bio-oil was then characterized and the results are listed in Table 20.
Test Raw FP bio-oil
Density, g/ml at 20 °C 1.20
Viscosity, cSt at 20 °C 87.5±0.05
Water content, wt% 25.7 ± 0.2
Carbon, wt%, dry 62.8±0.3
Hydrogen, wt%, dry 7.5±0.1
Nitrogen, wt%, dry <0.05
Sulfur, wt%, dry <0.07
Oxygen, wt%, dry 29.8±0.3
CAN, mg KOH/g 71.5±5.5
PhAN, mg KOH/g 77.3±0.5
TAN, mg KOH/g 148.9±6
Carbonyl (mmol/g) 4.07±0.08
HHV (kJ/kg) 17,640
As received Filtered
at 3 micron
Filtered
at 1 micron
Solid content, wt%, ASTM
D7579
1.35 +/- 0.003 0.24 +/-
0.01
0.042 +/- 0.015
Ash content, wt%, ASTM D482 0.91 +/- 0.01 - -
Total Inorganic content, ppm,
ICP
4337 +/- 337
(Al: 740; Si: 2682)
- -
Density, g/ml at 20°C 1.176 - 1.168
Viscosity, cSt at 20 °C 10717 - 7012
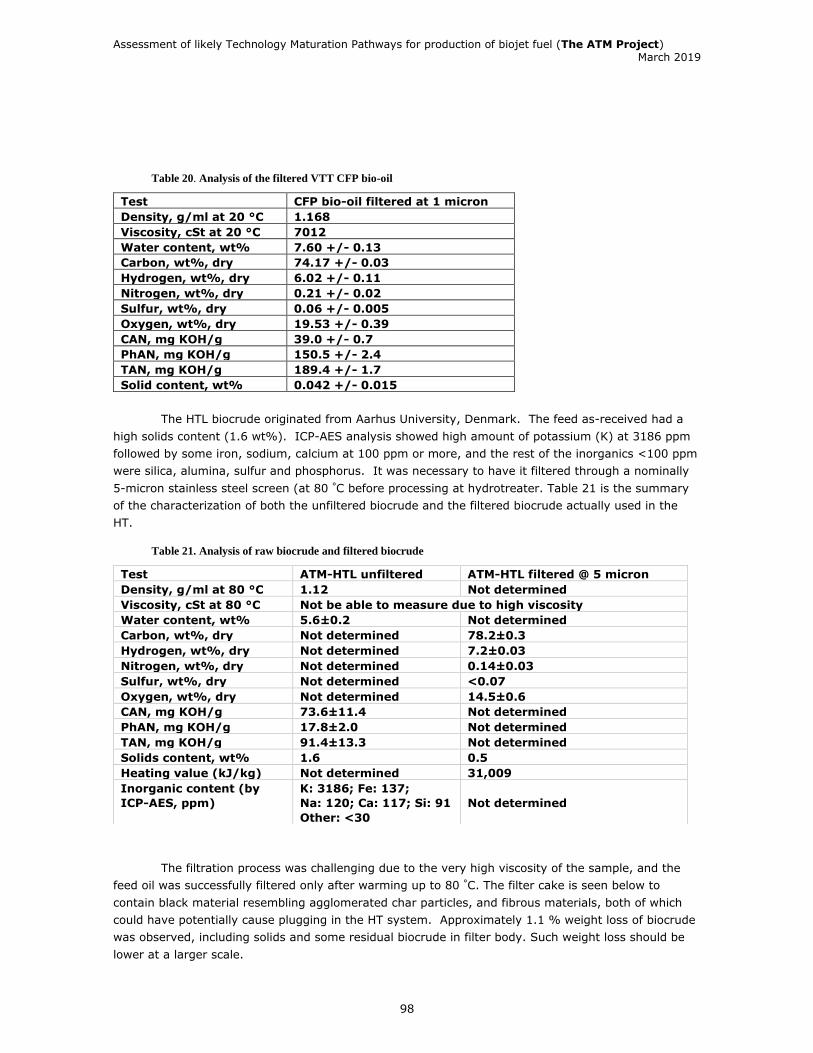
Assessment of likely Technology Maturation Pathways for production of biojet fuel (The ATM Project) March 2019
98
Table 20. Analysis of the filtered VTT CFP bio-oil
The HTL biocrude originated from Aarhus University, Denmark. The feed as-received had a
high solids content (1.6 wt%). ICP-AES analysis showed high amount of potassium (K) at 3186 ppm
followed by some iron, sodium, calcium at 100 ppm or more, and the rest of the inorganics <100 ppm
were silica, alumina, sulfur and phosphorus. It was necessary to have it filtered through a nominally
5-micron stainless steel screen (at 80 °C before processing at hydrotreater. Table 21 is the summary
of the characterization of both the unfiltered biocrude and the filtered biocrude actually used in the
HT.
Table 21. Analysis of raw biocrude and filtered biocrude
The filtration process was challenging due to the very high viscosity of the sample, and the
feed oil was successfully filtered only after warming up to 80 °C. The filter cake is seen below to
contain black material resembling agglomerated char particles, and fibrous materials, both of which
could have potentially cause plugging in the HT system. Approximately 1.1 % weight loss of biocrude
was observed, including solids and some residual biocrude in filter body. Such weight loss should be
lower at a larger scale.
Test CFP bio-oil filtered at 1 micron
Density, g/ml at 20 °C 1.168
Viscosity, cSt at 20 °C 7012
Water content, wt% 7.60 +/- 0.13
Carbon, wt%, dry 74.17 +/- 0.03
Hydrogen, wt%, dry 6.02 +/- 0.11
Nitrogen, wt%, dry 0.21 +/- 0.02
Sulfur, wt%, dry 0.06 +/- 0.005
Oxygen, wt%, dry 19.53 +/- 0.39
CAN, mg KOH/g 39.0 +/- 0.7
PhAN, mg KOH/g 150.5 +/- 2.4
TAN, mg KOH/g 189.4 +/- 1.7
Solid content, wt% 0.042 +/- 0.015
Test ATM-HTL unfiltered ATM-HTL filtered @ 5 micron
Density, g/ml at 80 °C 1.12 Not determined
Viscosity, cSt at 80 °C Not be able to measure due to high viscosity
Water content, wt% 5.6±0.2 Not determined
Carbon, wt%, dry Not determined 78.2±0.3
Hydrogen, wt%, dry Not determined 7.2±0.03
Nitrogen, wt%, dry Not determined 0.14±0.03
Sulfur, wt%, dry Not determined <0.07
Oxygen, wt%, dry Not determined 14.5±0.6
CAN, mg KOH/g 73.6±11.4 Not determined
PhAN, mg KOH/g 17.8±2.0 Not determined
TAN, mg KOH/g 91.4±13.3 Not determined
Solids content, wt% 1.6 0.5
Heating value (kJ/kg) Not determined 31,009
Inorganic content (by
ICP-AES, ppm)
K: 3186; Fe: 137;
Na: 120; Ca: 117; Si: 91
Other: <30
Not determined
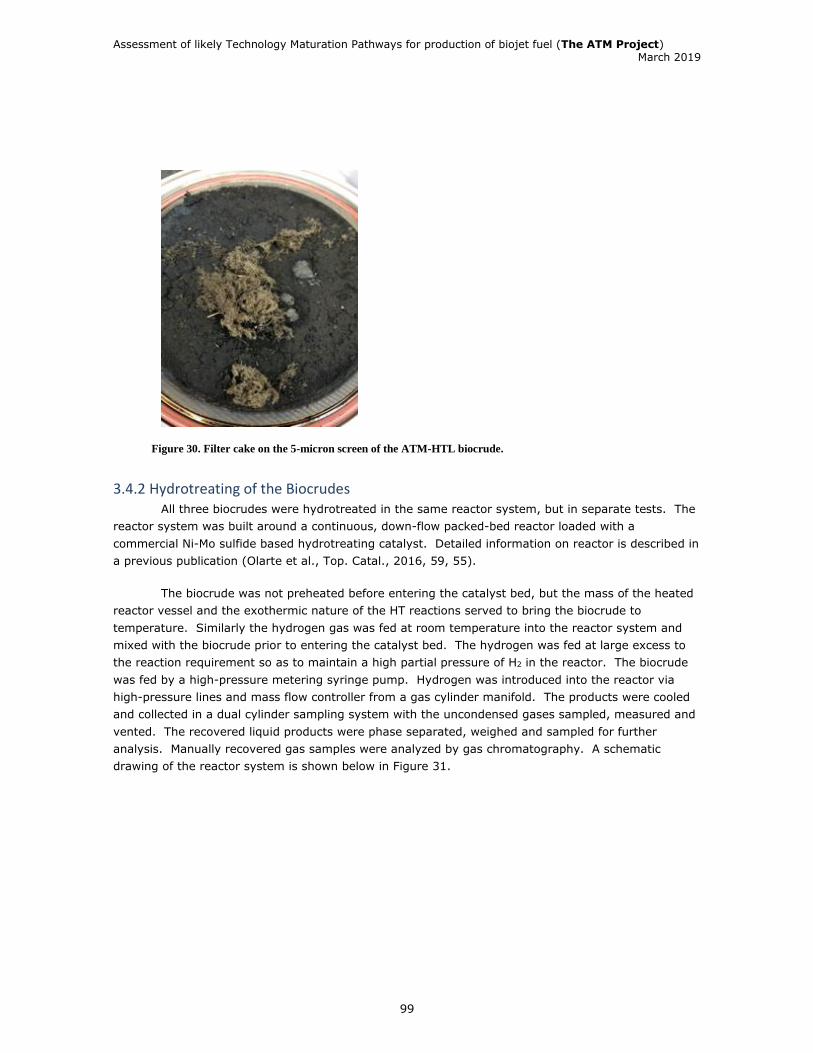
Assessment of likely Technology Maturation Pathways for production of biojet fuel (The ATM Project) March 2019
99
Figure 30. Filter cake on the 5-micron screen of the ATM-HTL biocrude.
3.4.2 Hydrotreating of the Biocrudes All three biocrudes were hydrotreated in the same reactor system, but in separate tests. The
reactor system was built around a continuous, down-flow packed-bed reactor loaded with a
commercial Ni-Mo sulfide based hydrotreating catalyst. Detailed information on reactor is described in
a previous publication (Olarte et al., Top. Catal., 2016, 59, 55).
The biocrude was not preheated before entering the catalyst bed, but the mass of the heated
reactor vessel and the exothermic nature of the HT reactions served to bring the biocrude to
temperature. Similarly the hydrogen gas was fed at room temperature into the reactor system and
mixed with the biocrude prior to entering the catalyst bed. The hydrogen was fed at large excess to
the reaction requirement so as to maintain a high partial pressure of H2 in the reactor. The biocrude
was fed by a high-pressure metering syringe pump. Hydrogen was introduced into the reactor via
high-pressure lines and mass flow controller from a gas cylinder manifold. The products were cooled
and collected in a dual cylinder sampling system with the uncondensed gases sampled, measured and
vented. The recovered liquid products were phase separated, weighed and sampled for further
analysis. Manually recovered gas samples were analyzed by gas chromatography. A schematic
drawing of the reactor system is shown below in Figure 31.
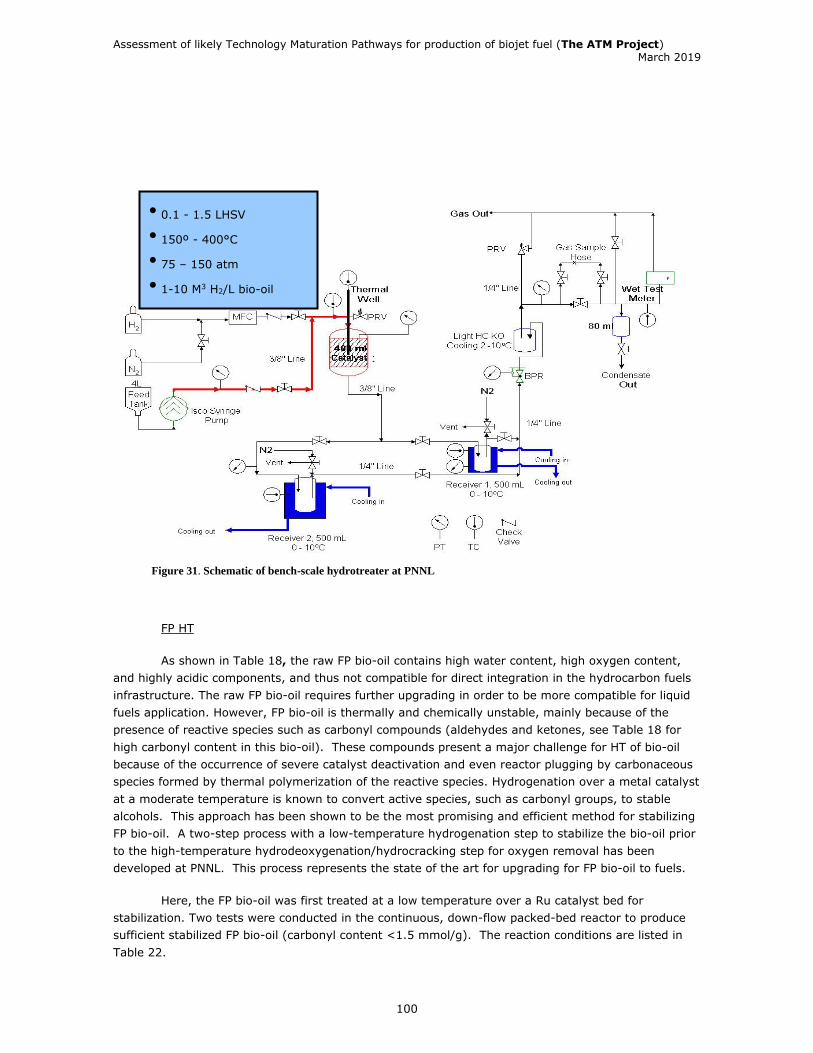
Assessment of likely Technology Maturation Pathways for production of biojet fuel (The ATM Project) March 2019
100
Figure 31. Schematic of bench-scale hydrotreater at PNNL
FP HT
As shown in Table 18, the raw FP bio-oil contains high water content, high oxygen content,
and highly acidic components, and thus not compatible for direct integration in the hydrocarbon fuels
infrastructure. The raw FP bio-oil requires further upgrading in order to be more compatible for liquid
fuels application. However, FP bio-oil is thermally and chemically unstable, mainly because of the
presence of reactive species such as carbonyl compounds (aldehydes and ketones, see Table 18 for
high carbonyl content in this bio-oil). These compounds present a major challenge for HT of bio-oil
because of the occurrence of severe catalyst deactivation and even reactor plugging by carbonaceous
species formed by thermal polymerization of the reactive species. Hydrogenation over a metal catalyst
at a moderate temperature is known to convert active species, such as carbonyl groups, to stable
alcohols. This approach has been shown to be the most promising and efficient method for stabilizing
FP bio-oil. A two-step process with a low-temperature hydrogenation step to stabilize the bio-oil prior
to the high-temperature hydrodeoxygenation/hydrocracking step for oxygen removal has been
developed at PNNL. This process represents the state of the art for upgrading for FP bio-oil to fuels.
Here, the FP bio-oil was first treated at a low temperature over a Ru catalyst bed for
stabilization. Two tests were conducted in the continuous, down-flow packed-bed reactor to produce
sufficient stabilized FP bio-oil (carbonyl content <1.5 mmol/g). The reaction conditions are listed in
Table 22.
• 0.1 - 1.5 LHSV
• 150º - 400°C
• 75 – 150 atm
• 1-10 M3 H2/L bio-oil

Assessment of likely Technology Maturation Pathways for production of biojet fuel (The ATM Project) March 2019
101
Table 22. Reaction conditions of hydrotreating test
For the stabilization step, the average yield data at steady-state is reported in Table 23. The
observed mass recovery was high at 100%. The yield of stabilized bio-oil was 98% on wet basis with
1.4% loss to gas product. The composition of gas product is reported in Table 24. The produced
stabilized bio-oil were collected at different time on stream but was then combined and analyzed in
detail. In general, significant hydrogen addition was observed and H/C molar ratio in stabilized bio-oil
(H/C: 1.7) was much higher than in the raw bio-oil (H/C: 1.4). Carbonyl content dropped
significantly, suggesting a much improved stability of the bio-oil.
Table 23. Yield from stabilization and finishing step of hydrotreating of pyrolysis oil
Table 24. Gas yield from both stabilization and finishing hydrotreating step.
Parameter Stabilization Finishing hydrotreating
This test Typical
Catalyst Ru/C 50/50 vol of Ru/C and
NiMo/Al2O3; Presulfided in
reactor prior to
hydrotreating test
NiMo/Al2O3;
Presulfided in reactor
prior to hydrotreating
test
Catalyst size,
mm
0.25 - 1.19 0.25 - 1.19
Catalyst density,
g/ml (bulk)
0.48 0.48 (Ru/C) and 0.49
(NiMo/Al2O3)
0.49 (NiMo/Al2O3)
Reaction
temperature,°C
140 170 for Ru/C section
400 for NiMo/Al2O3 section
400 for NiMo/Al2O3
bed
Pressure, MPa 12.4 12.4
LHSV, L/(L
catalyst h)
0.23 0.1 0.23
H2/bio-oil, L
H2/L bio-oil
998 2340
Stabilization
Stabilized bio-oil Yield, w/w 0.98
Carbon yield,
w/w
0.94
Gas product Yield, w/w 0.014
Carbon yield,
w/w
0.014
H2 consumption, w/w bio-oil 0.007
Mass balance, % 100
Carbon balance, % 95
Gas Concentration (vol %) CH4 C2H6 C3H8/C3H6 C4H10 C5H12 CO CO2
Stabilization 21.1 4.0 1.7 0.4 1.9 0.0 70.8
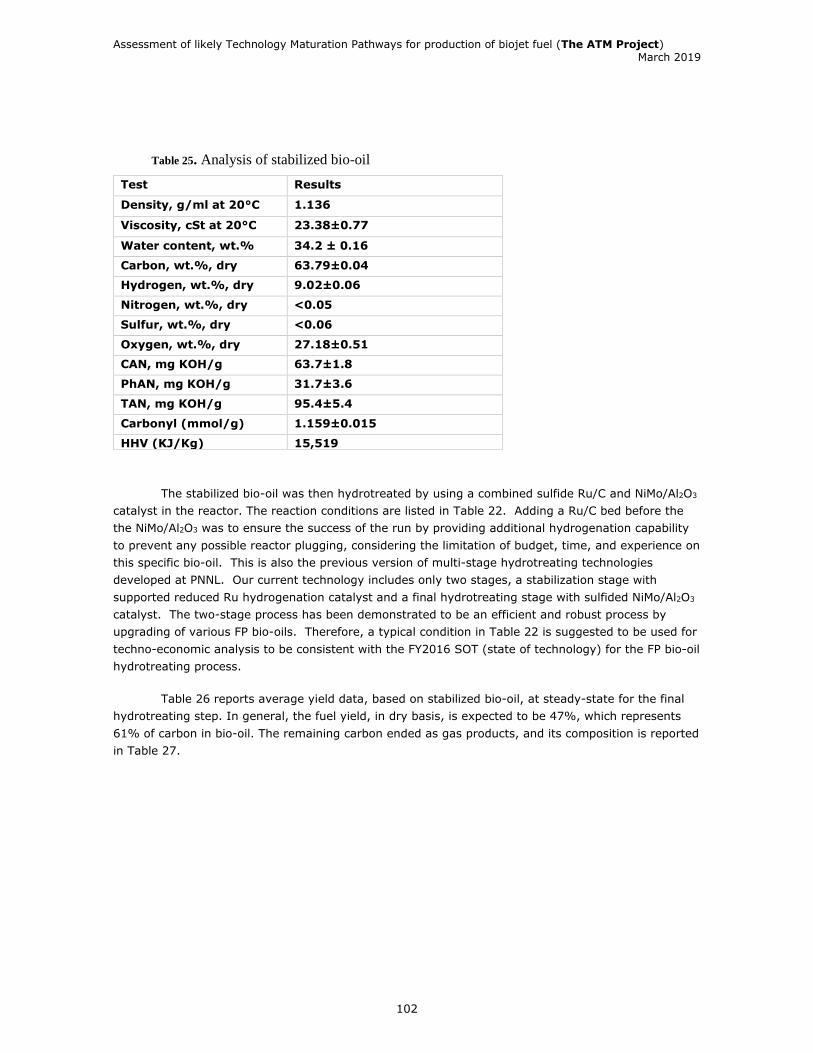
Assessment of likely Technology Maturation Pathways for production of biojet fuel (The ATM Project) March 2019
102
Table 25. Analysis of stabilized bio-oil
The stabilized bio-oil was then hydrotreated by using a combined sulfide Ru/C and NiMo/Al2O3
catalyst in the reactor. The reaction conditions are listed in Table 22. Adding a Ru/C bed before the
the NiMo/Al2O3 was to ensure the success of the run by providing additional hydrogenation capability
to prevent any possible reactor plugging, considering the limitation of budget, time, and experience on
this specific bio-oil. This is also the previous version of multi-stage hydrotreating technologies
developed at PNNL. Our current technology includes only two stages, a stabilization stage with
supported reduced Ru hydrogenation catalyst and a final hydrotreating stage with sulfided NiMo/Al2O3
catalyst. The two-stage process has been demonstrated to be an efficient and robust process by
upgrading of various FP bio-oils. Therefore, a typical condition in Table 22 is suggested to be used for
techno-economic analysis to be consistent with the FY2016 SOT (state of technology) for the FP bio-oil
hydrotreating process.
Table 26 reports average yield data, based on stabilized bio-oil, at steady-state for the final
hydrotreating step. In general, the fuel yield, in dry basis, is expected to be 47%, which represents
61% of carbon in bio-oil. The remaining carbon ended as gas products, and its composition is reported
in Table 27.
Test Results
Density, g/ml at 20°C 1.136
Viscosity, cSt at 20°C 23.38±0.77
Water content, wt.% 34.2 ± 0.16
Carbon, wt.%, dry 63.79±0.04
Hydrogen, wt.%, dry 9.02±0.06
Nitrogen, wt.%, dry <0.05
Sulfur, wt.%, dry <0.06
Oxygen, wt.%, dry 27.18±0.51
CAN, mg KOH/g 63.7±1.8
PhAN, mg KOH/g 31.7±3.6
TAN, mg KOH/g 95.4±5.4
Carbonyl (mmol/g) 1.159±0.015
HHV (KJ/Kg) 15,519
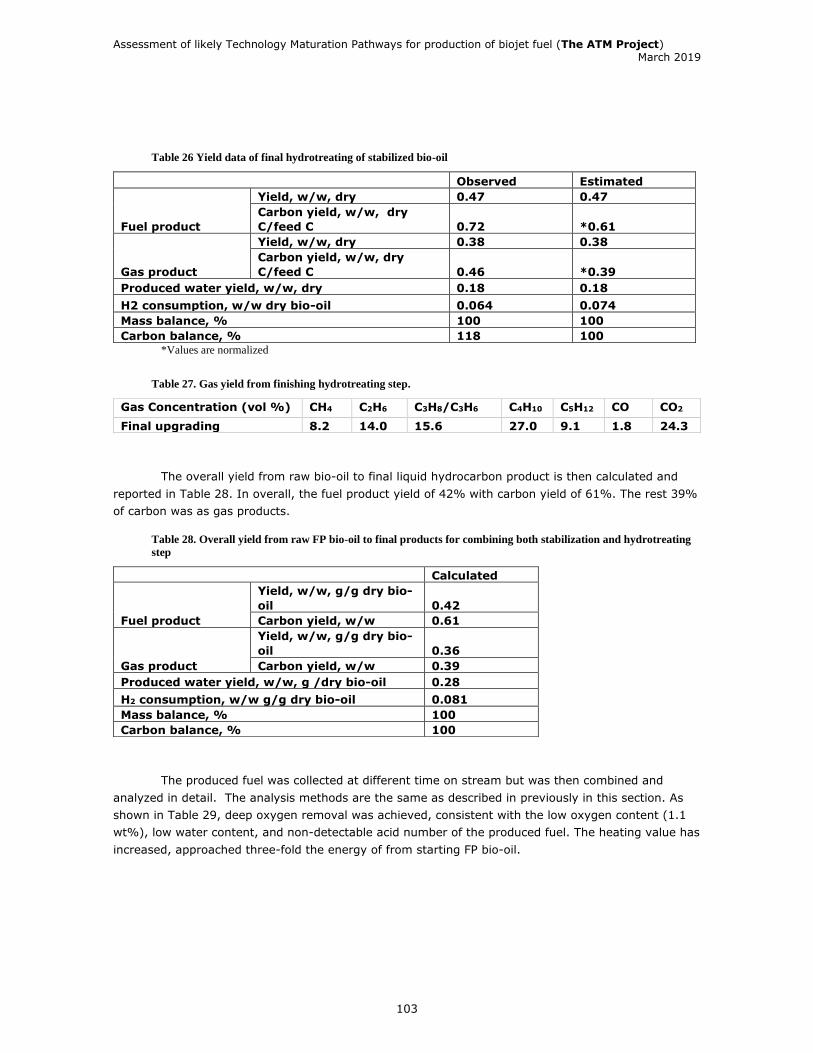
Assessment of likely Technology Maturation Pathways for production of biojet fuel (The ATM Project) March 2019
103
Table 26 Yield data of final hydrotreating of stabilized bio-oil
*Values are normalized
Table 27. Gas yield from finishing hydrotreating step.
The overall yield from raw bio-oil to final liquid hydrocarbon product is then calculated and
reported in Table 28. In overall, the fuel product yield of 42% with carbon yield of 61%. The rest 39%
of carbon was as gas products.
Table 28. Overall yield from raw FP bio-oil to final products for combining both stabilization and hydrotreating
step
The produced fuel was collected at different time on stream but was then combined and
analyzed in detail. The analysis methods are the same as described in previously in this section. As
shown in Table 29, deep oxygen removal was achieved, consistent with the low oxygen content (1.1
wt%), low water content, and non-detectable acid number of the produced fuel. The heating value has
increased, approached three-fold the energy of from starting FP bio-oil.
Observed Estimated
Fuel product
Yield, w/w, dry 0.47 0.47
Carbon yield, w/w, dry
C/feed C 0.72 *0.61
Gas product
Yield, w/w, dry 0.38 0.38
Carbon yield, w/w, dry
C/feed C 0.46 *0.39
Produced water yield, w/w, dry 0.18 0.18
H2 consumption, w/w dry bio-oil 0.064 0.074
Mass balance, % 100 100
Carbon balance, % 118 100
Gas Concentration (vol %) CH4 C2H6 C3H8/C3H6 C4H10 C5H12 CO CO2
Final upgrading 8.2 14.0 15.6 27.0 9.1 1.8 24.3
Calculated
Fuel product
Yield, w/w, g/g dry bio-
oil 0.42
Carbon yield, w/w 0.61
Gas product
Yield, w/w, g/g dry bio-
oil 0.36
Carbon yield, w/w 0.39
Produced water yield, w/w, g /dry bio-oil 0.28
H2 consumption, w/w g/g dry bio-oil 0.081
Mass balance, % 100
Carbon balance, % 100
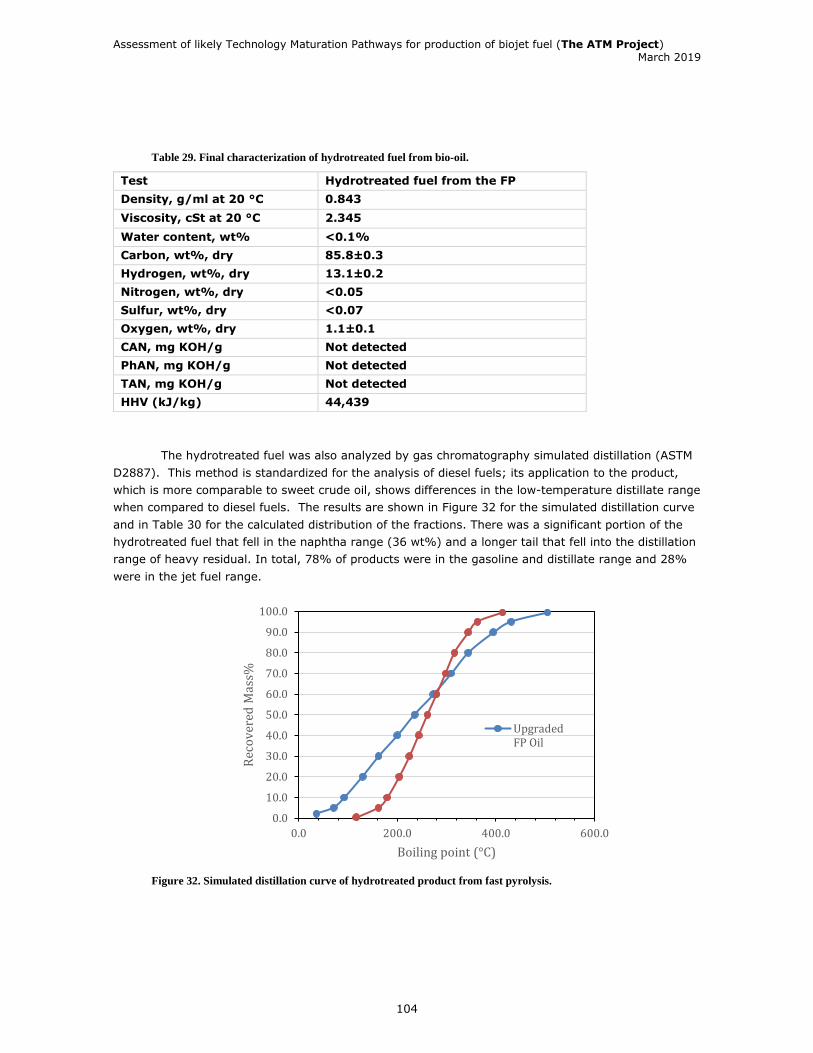
Assessment of likely Technology Maturation Pathways for production of biojet fuel (The ATM Project) March 2019
104
Table 29. Final characterization of hydrotreated fuel from bio-oil.
The hydrotreated fuel was also analyzed by gas chromatography simulated distillation (ASTM
D2887). This method is standardized for the analysis of diesel fuels; its application to the product,
which is more comparable to sweet crude oil, shows differences in the low-temperature distillate range
when compared to diesel fuels. The results are shown in Figure 32 for the simulated distillation curve
and in Table 30 for the calculated distribution of the fractions. There was a significant portion of the
hydrotreated fuel that fell in the naphtha range (36 wt%) and a longer tail that fell into the distillation
range of heavy residual. In total, 78% of products were in the gasoline and distillate range and 28%
were in the jet fuel range.
Figure 32. Simulated distillation curve of hydrotreated product from fast pyrolysis.
0.0
10.0
20.0
30.0
40.0
50.0
60.0
70.0
80.0
90.0
100.0
0.0 200.0 400.0 600.0
Rec
ov
ered
Mas
s%
Boiling point (°C)
UpgradedFP Oil
Test Hydrotreated fuel from the FP
Density, g/ml at 20 °C 0.843
Viscosity, cSt at 20 °C 2.345
Water content, wt% <0.1%
Carbon, wt%, dry 85.8±0.3
Hydrogen, wt%, dry 13.1±0.2
Nitrogen, wt%, dry <0.05
Sulfur, wt%, dry <0.07
Oxygen, wt%, dry 1.1±0.1
CAN, mg KOH/g Not detected
PhAN, mg KOH/g Not detected
TAN, mg KOH/g Not detected
HHV (kJ/kg) 44,439

Assessment of likely Technology Maturation Pathways for production of biojet fuel (The ATM Project) March 2019
105
Table 30 Mass approximation of hydrocarbon product
The produced aqueous products were also analyzed, as shown in Table 31. The analysis
methods are described previously in this section. Total organic carbon (TOC) is measured by using
EPA Method 9060A. Relatively clean water was produced, with carbon, nitrogen, and sulfur content of
0.36, 0.11, and below 0.05 wt%, respectively, and TOC of 2560mg/L.
Table 31. Characterization of the aqueous product from the finishing upgrading step.
CFP HT
The filtered CFP bio-oil was hydrotreated in the continuous, down-flow packed bed reactor
loaded with a commercial Ni-Mo sulfide based hydrotreating catalyst. The reaction conditions are
listed in Table 32. For this specific test, the bio-oil LHSV of 0.10 h-1 was used for a better control of
exotherm. Our recent research on a smaller scale reactor for hydrotreating of CFP bio-oil with
different properties showed that a similar HDO performance regarding oxygen removal could be
achieved at bio-oil LHSV of 0.20 h-1. A higher LHSV of 0.30 h-1, however, could lead to a hydrotreated
product with higher oxygen content (~3 wt.% instead of <1 wt.% below for LHSV at <0.20 h-1).
Therefore, the typical condition in table 3 are suggested to be used for techno-economic analysis.
Fraction Distribution, wt.%
Naphtha, IBP-184 °C 36
Jet, 150-250 °C 28
Diesel, 184-338 °C 42
Gas oil, >338 °C 22
Test Aqueous products
Density, g/ml at 20 °C 1.0
Viscosity, cSt at 20 °C 1.0
Water content, wt% 100.0
Carbon, wt% 0.36±0.06
Nitrogen, wt% 0.11±0.01
Sulfur, wt% <0.05
CAN, mg KOH/g Not detected
PhAN, mg KOH/g Not detected
TAN, mg KOH/g Not detected
TOC (mg/L, ppm) 2560

Assessment of likely Technology Maturation Pathways for production of biojet fuel (The ATM Project) March 2019
106
Table 32. Reaction conditions of hydrotreating test
The average yield data at steady-state is reported in Table 33. The observed mass balance is
around 90%. It is mainly because of the possible hold-up of liquid in the hydrotreater system.
Therefore, the product yield are further estimated based on the observed data in this test and also
other hydrotreating tests using similar CFP bio-oils in a smaller scale hydrotreater. In general, the
fuel yield, in dry basis, is expected to be 71%, which represents 84% of carbon in bio-oil. The loss of
carbon is mainly by producing gas products; composition is reported in Table 34.
Table 33. Yield, carbon yield, H2 consumption, mass balance of hydrotreating of the VTT CFP oil
Table 34. Composition of the produced gas from hydrotreating of the VTT CFP oil
The produced fuel at different time on stream was then combined and analyzed in detail. The
analysis methods are the same as described in section 1. As shown in Table 35, deep oxygen removal
was achieved, consistent with the low oxygen content (<1 wt%), low water content, and non-
detectable acid number of the produced fuel.
Parameter This test Typical
Catalyst Commercial supported Ni-Mo sulfide catalyst;
Presulfided in reactor prior to hydrotreating
test
Catalyst size, mm (ave. diameter) x
mm (ave. length) 1.26 x 2.77
Catalyst density, g/ml (bulk) 0.60
Reaction temperature, oC 400
Pressure, MPa 125
LHSV, L/(L catalyst h) 0.10 0.20
H2/bio-oil, L H2/L bio-oil 2400 2400
Observed Estimated
Fuel product
Yield, w/w, dry 0.64 0.71
Carbon yield, w/w, dry C/feed
C
0.76 0.84
Gas product
Yield, w/w, dry 0.11 0.12
Carbon yield, w/w, dry C/feed
C
0.10 0.11
Produced water yield, w/w, dry 0.21 0.23
H2 consumption, w/w dry bio-oil 0.07 0.07
Mass balance, % 90 99
Carbon balance, % 86 95
Gas CH4 C2H6 C3H8/
C3H6 C4H10 C5H12 CO CO2
Concentration
(vol %) 42.8 21.4 19.0 7.3 1.3 2.2 6.0
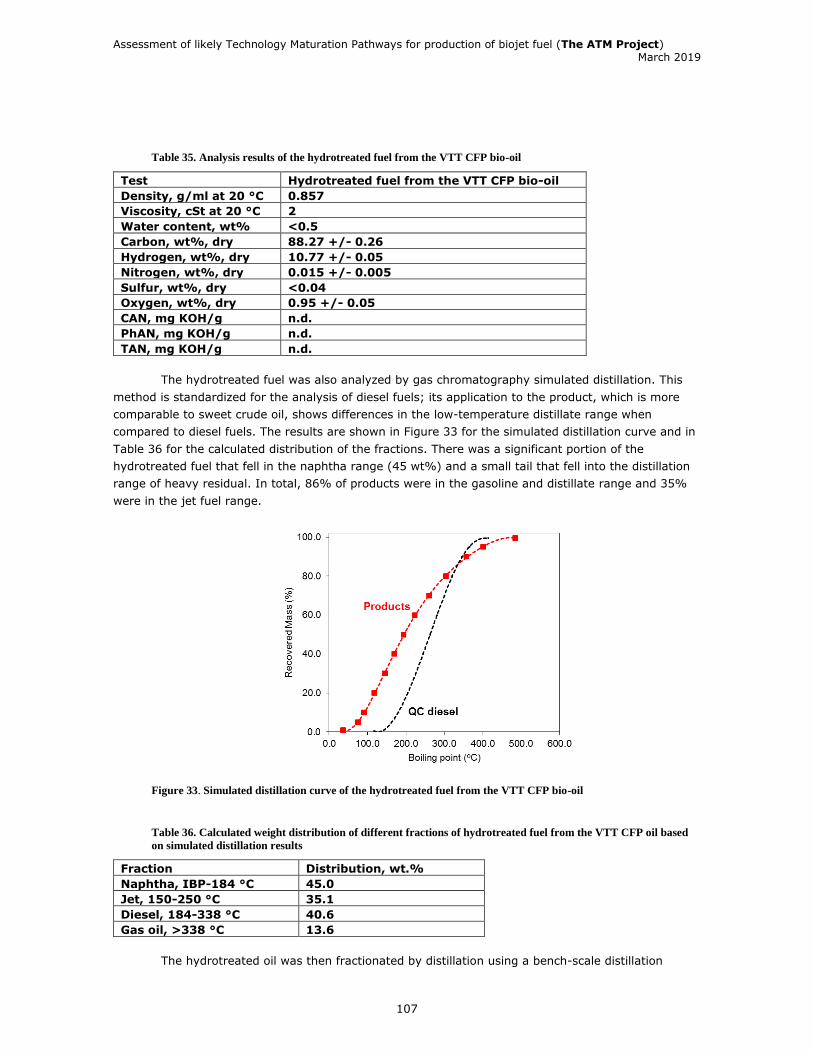
Assessment of likely Technology Maturation Pathways for production of biojet fuel (The ATM Project) March 2019
107
Table 35. Analysis results of the hydrotreated fuel from the VTT CFP bio-oil
The hydrotreated fuel was also analyzed by gas chromatography simulated distillation. This
method is standardized for the analysis of diesel fuels; its application to the product, which is more
comparable to sweet crude oil, shows differences in the low-temperature distillate range when
compared to diesel fuels. The results are shown in Figure 33 for the simulated distillation curve and in
Table 36 for the calculated distribution of the fractions. There was a significant portion of the
hydrotreated fuel that fell in the naphtha range (45 wt%) and a small tail that fell into the distillation
range of heavy residual. In total, 86% of products were in the gasoline and distillate range and 35%
were in the jet fuel range.
Figure 33. Simulated distillation curve of the hydrotreated fuel from the VTT CFP bio-oil
Table 36. Calculated weight distribution of different fractions of hydrotreated fuel from the VTT CFP oil based
on simulated distillation results
The hydrotreated oil was then fractionated by distillation using a bench-scale distillation
Test Hydrotreated fuel from the VTT CFP bio-oil
Density, g/ml at 20 °C 0.857
Viscosity, cSt at 20 °C 2
Water content, wt% <0.5
Carbon, wt%, dry 88.27 +/- 0.26
Hydrogen, wt%, dry 10.77 +/- 0.05
Nitrogen, wt%, dry 0.015 +/- 0.005
Sulfur, wt%, dry <0.04
Oxygen, wt%, dry 0.95 +/- 0.05
CAN, mg KOH/g n.d.
PhAN, mg KOH/g n.d.
TAN, mg KOH/g n.d.
Fraction Distribution, wt.%
Naphtha, IBP-184 °C 45.0
Jet, 150-250 °C 35.1
Diesel, 184-338 °C 40.6
Gas oil, >338 °C 13.6

Assessment of likely Technology Maturation Pathways for production of biojet fuel (The ATM Project) March 2019
108
setup. Cuts were made as follows: (a) fraction 1: 20 to 150 °C (b) fraction 2: 150 to 184 °C; (c)
fraction 3: 184 to 250 °C; (d) fraction 4: 250 to 338 °C; and (e) fraction 5: >338 °C. Fractions 4 and
5 were collected under vacuum (8 torr) to prevent oil degradation and coking at higher temperatures.
As shown in Table 37, 90% of the hydrotreated oil were in naphtha and diesel fractions and 37% of it
were in jet fuel range.
Table 37. Mass yields from fractionation of hydrotreated oils.
* Atmospheric equivalent temperature
By combining fraction 2 and 3 as jet fraction, we obtained four samples for fuel quality
analysis. Their total weight and distribution are listed in Table 38.
Table 38. Quantity of each fuel fraction obtained
* Approximated volume based on estimated density
The produced aqueous products were also analyzed, as shown in Table 39. The analysis
methods are the same as described in section 3.4.1. TOC is measured by using EPA Method 9060A.
Relatively clean water was produced, with carbon, nitrogen, and sulfur content of 0.33, 0.49, and 0.07
wt.%, respectively, and TOC of 2400 mg/L.
Table 39 Analysis results of the aqueous products from hydrotreating of the VTT CFP bio-oil
Fraction Distribution, wt.%
Fraction 1, 20-150 °C 27.0
Fraction 2, 150-184 °C 14.9
Fraction 3, 184-250 °C 21.7
Fraction 4, 250-338 °C* 25.6
Fraction 5, >338 °C* 10.3
Mass balance 99.5%
Naphtha, 20-184 °C 41.9
Jet, 150-250 °C 36.6
Diesel, 184-338 °C 47.3
Gas oil, >338 °C 10.3
Fraction Quantity, g (ml)
Total hydrotreated fuel 755 (880)
Light Naphtha, 20-150 °C 204 (~240*)
Jet, 150-250 °C 276 (~320*)
Heavy Diesel, 250-338 °C 194 (~220*)
Gas oil, >338 °C 78 (~85*)
Test Aqueous products
Density, g/ml at 20 °C 1.008
Viscosity, cSt at 20 °C 1.017
Water content, wt% 100.0
Carbon, wt% 0.33 +/- 0.03
Nitrogen, wt% 0.49 +/- 0.02
Sulfur, wt% 0.07 +/- 0.005
CAN, TAN, mg KOH/g n.d.
TOC (mg/L, ppm) 2400
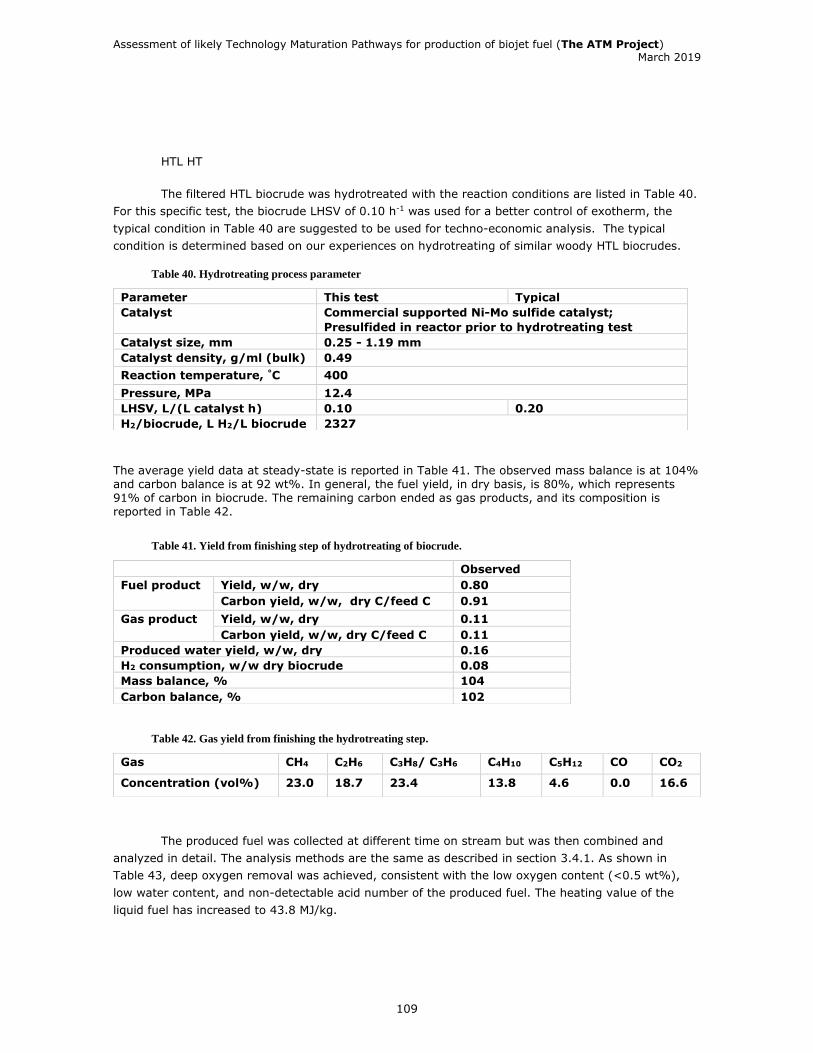
Assessment of likely Technology Maturation Pathways for production of biojet fuel (The ATM Project) March 2019
109
HTL HT
The filtered HTL biocrude was hydrotreated with the reaction conditions are listed in Table 40.
For this specific test, the biocrude LHSV of 0.10 h-1 was used for a better control of exotherm, the
typical condition in Table 40 are suggested to be used for techno-economic analysis. The typical
condition is determined based on our experiences on hydrotreating of similar woody HTL biocrudes.
Table 40. Hydrotreating process parameter
The average yield data at steady-state is reported in Table 41. The observed mass balance is at 104% and carbon balance is at 92 wt%. In general, the fuel yield, in dry basis, is 80%, which represents 91% of carbon in biocrude. The remaining carbon ended as gas products, and its composition is reported in Table 42.
Table 41. Yield from finishing step of hydrotreating of biocrude.
Table 42. Gas yield from finishing the hydrotreating step.
The produced fuel was collected at different time on stream but was then combined and
analyzed in detail. The analysis methods are the same as described in section 3.4.1. As shown in
Table 43, deep oxygen removal was achieved, consistent with the low oxygen content (<0.5 wt%),
low water content, and non-detectable acid number of the produced fuel. The heating value of the
liquid fuel has increased to 43.8 MJ/kg.
Parameter This test Typical
Catalyst Commercial supported Ni-Mo sulfide catalyst;
Presulfided in reactor prior to hydrotreating test
Catalyst size, mm 0.25 - 1.19 mm
Catalyst density, g/ml (bulk) 0.49
Reaction temperature, °C 400
Pressure, MPa 12.4
LHSV, L/(L catalyst h) 0.10 0.20
H2/biocrude, L H2/L biocrude 2327
Observed
Fuel product Yield, w/w, dry 0.80
Carbon yield, w/w, dry C/feed C 0.91
Gas product Yield, w/w, dry 0.11
Carbon yield, w/w, dry C/feed C 0.11
Produced water yield, w/w, dry 0.16
H2 consumption, w/w dry biocrude 0.08
Mass balance, % 104
Carbon balance, % 102
Gas CH4 C2H6 C3H8/ C3H6 C4H10 C5H12 CO CO2
Concentration (vol%) 23.0 18.7 23.4 13.8 4.6 0.0 16.6
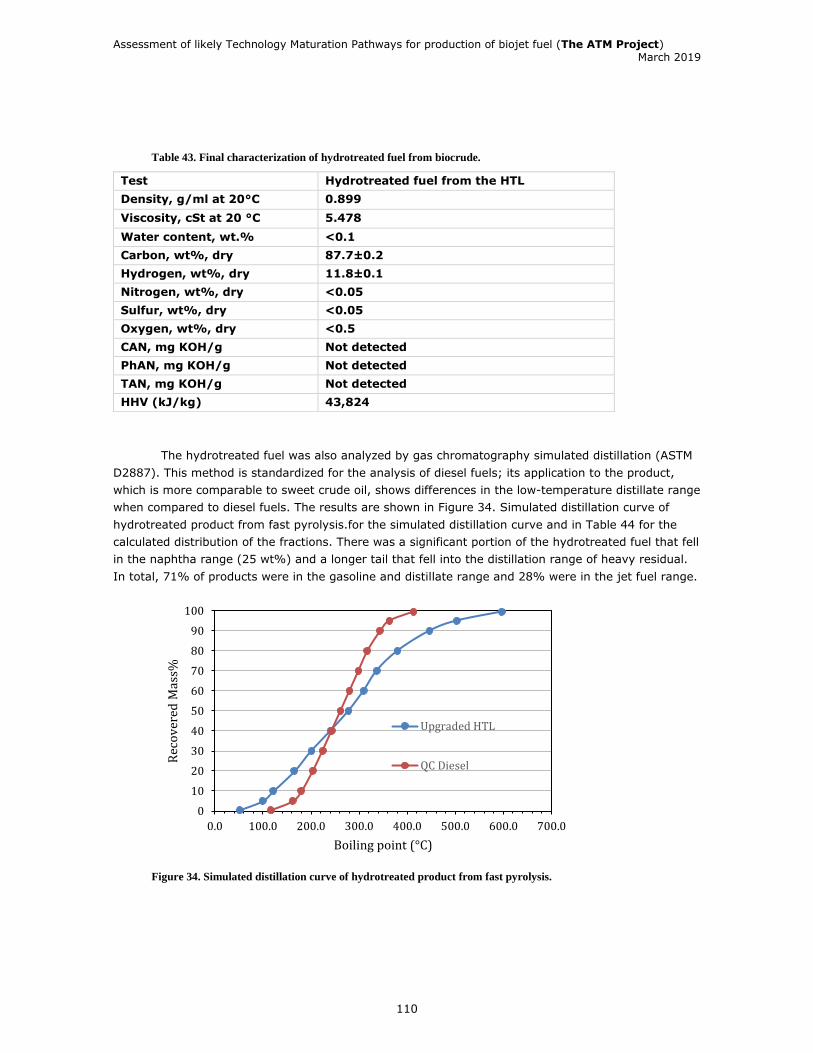
Assessment of likely Technology Maturation Pathways for production of biojet fuel (The ATM Project) March 2019
110
Table 43. Final characterization of hydrotreated fuel from biocrude.
The hydrotreated fuel was also analyzed by gas chromatography simulated distillation (ASTM
D2887). This method is standardized for the analysis of diesel fuels; its application to the product,
which is more comparable to sweet crude oil, shows differences in the low-temperature distillate range
when compared to diesel fuels. The results are shown in Figure 34. Simulated distillation curve of
hydrotreated product from fast pyrolysis.for the simulated distillation curve and in Table 44 for the
calculated distribution of the fractions. There was a significant portion of the hydrotreated fuel that fell
in the naphtha range (25 wt%) and a longer tail that fell into the distillation range of heavy residual.
In total, 71% of products were in the gasoline and distillate range and 28% were in the jet fuel range.
Figure 34. Simulated distillation curve of hydrotreated product from fast pyrolysis.
0
10
20
30
40
50
60
70
80
90
100
0.0 100.0 200.0 300.0 400.0 500.0 600.0 700.0
Rec
ov
ered
Mas
s%
Boiling point (°C)
Upgraded HTL
QC Diesel
Test Hydrotreated fuel from the HTL
Density, g/ml at 20°C 0.899
Viscosity, cSt at 20 °C 5.478
Water content, wt.% <0.1
Carbon, wt%, dry 87.7±0.2
Hydrogen, wt%, dry 11.8±0.1
Nitrogen, wt%, dry <0.05
Sulfur, wt%, dry <0.05
Oxygen, wt%, dry <0.5
CAN, mg KOH/g Not detected
PhAN, mg KOH/g Not detected
TAN, mg KOH/g Not detected
HHV (kJ/kg) 43,824

Assessment of likely Technology Maturation Pathways for production of biojet fuel (The ATM Project) March 2019
111
Table 44. Mass approximation of hydrocarbon product
The produced aqueous products were also analyzed, as shown in Table 45. The analysis
methods are the same as described earlier in this Section. TOC is measured by using EPA Method
9060A. Relatively clean water was produced, with nitrogen and sulfur content of 0.3 and below 0.09
wt%, respectively, and TOC of 2930 mg/L.
Table 45. Characterization of the aqueous product from the HTL biocrude upgrading step.
* The direct carbon analysis was inconsistent and is likely in error considering the much lower TOC measured and
historically low carbon numbers in HT byproduct waters.
Fraction Distribution, wt.%
Naphtha, IBP-184 °C 25
Jet, 150-250 °C 28
Diesel, 184-338 °C 46
Gas oil, >338 °C 29
Test Aqueous products
Density, g/ml at 20°C 1.0
Viscosity, cSt at 20 °C 1.0
Water content, wt% 98.0
Carbon, wt% 2.55+/- 1.58*
Nitrogen, wt% 0.3+/- 0.04
Sulfur, wt% 0.09+/- 0.005
CAN, mg KOH/g Not determined
PhAN, mg KOH/g Not determined
TAN, mg KOH/g Not determined
TOC (mg/L, ppm) 2930
Assessment of likely Technology Maturation Pathways for production of biojet fuel (The ATM Project) March 2019
112
CHAPTER 4 - ENVIRONMENTAL SUSTAINABILITY, EMISSIONS AND LIFE CYCLE ANALYSIS
4.1 General background to Sustainability considerations of biojet fuels The main rationale for alternative fuel development is the ability of these fuels to offer
emission reductions in order to meet global climate commitments, including specific goals of the
aviation sector (including the long-term goal of 50% reduction by 2050, compared to a 2005
baseline). While emission reductions are crucial, the overall sustainability of biofuel production is of
paramount importance to the sector, including a range of environmental impacts (soil, water, air,
biodiversity etc), social impacts (human rights, land rights, labor rights etc) and economic factors
(continuous improvement, legal compliance etc). Alternative fuels that are not demonstrably
sustainable are unlikely to achieve market acceptance. Sustainability commitments and guidelines in
the aviation sector has mostly been based on voluntary actions from stakeholders in this sector,
although increasingly, regulatory schemes that provide credit for low-carbon fuel use are including
sustainability requirements.
One such regulatory scheme is the International Civil Aviation Organisation’s Carbon
Offsetting and Reduction Scheme for International Aviation, CORSIA. Low carbon fuels in can be used
by an airline under CORSIA to reduce their offsetting requirement, provided these fuels are
sustainable. The meaning of sustainability in this context and the sustainability criteria for alternative
fuels are currently still under development by ICAO, but it is expected to take the form of a meta-
standard, under which existing voluntary and regulatory sustainability schemes will be assessed for
their eligibility to comply.
4.1.1Biojet Fuels and emission reductions within the aviation industry The UNFCCC COP21 Paris agreement was a global commitment to reduce greenhouse gas
emissions. However, international aviation and shipping fell outside the scope of this agreement and
these sectors were tasked to develop their own policies for reducing emissions at international bodies
with jurisdiction, ICAO and IMO (International Maritime Organisation).
Prior to this, the aviation sector had already taken several voluntary actions to reduce
emissions, including measures to improve fuel efficiency, air traffic management, operations and
aeronautics. Organisations like IATA developed voluntary, ambitious, aspirational goals for reducing
emissions in the sector in 2009 based on the following targets (IATA, 2009):
• An average improvement in fuel efficiency of 1.5% per year from 2009 to 2020;
• A cap on net aviation CO2 emissions from 2020 (carbon-neutral growth);
• A reduction in net aviation CO2 emissions of 50% by 2050, relative to 2005 levels.
It was recognized by the aviation industry that biojet fuels were a key component of the
strategy for reducing greenhouse gas (GHG) emissions in the aviation sector and ICAO Member States
Assessment of likely Technology Maturation Pathways for production of biojet fuel (The ATM Project) March 2019
113
were unlikely to achieve aspirational goals for reducing emission emissions from international aviation
without such fuels. That such biojet fuels should be sustainable is such an essential metric that the
aviation sector refers to them as “Sustainable Aviation Fuels” or SAF22.
While the objective to reduce GHG emissions has been the core of sustainability, the industry
has also emphasized a commitment to sustainability beyond emission reductions, extending to
broader aspects like biodiversity, land use change, etc.
Sustainability is assessed against set criteria and guidelines, the scope of which is defined by
a specific sector. Several voluntary certification schemes currently operate in various sectors, e.g. the
Roundtable on Sustainable Biomaterials (RSB). Companies or organisations can become members of
such schemes and obtain a sustainability certification based on an independent audit carried out on
behalf of the certification scheme. In this manner, many certification bodies have been established in
different industries and sectors for reasons such as access to markets, etc.
Against this background, ICAO is developing a meta-standard as a framework for CORSIA and
the aviation sector, defining the principles and criteria for sustainability that are directly applicable to
the aviation sector and biojet fuels. This meta-standard will use the standards and principles in
existing voluntary certification schemes, such as RSB, ISCC etc, as a guideline. However, rather than
the establishment of a new certification scheme, the meta-standard will likely be used as a guide
against which existing certification schemes could become approved under ICAO. The biojet fuel
producer or user therefore has the option to choose membership of a voluntary scheme, provided that
the scheme meets the criteria of the meta-standard.
4.1.1.1 ICAO perspective The International Civil Aviation Organization (ICAO) is an UN agency established in 1944 to
reach consensus on international civil aviation standards as well as on “policies in support of a safe,
efficient, secure, economically sustainable and environmentally responsible civil aviation
sector”23. On 4th October 2013 the ICAO resolution A38-18424 “Consolidated statement of
continuing ICAO policies and practices related to environmental protection — Climate change” entered
into force. Amongst other aspects this resolution also covers proposed sustainability criteria for
alternative fuels.
The following environmental and social sustainability criteria are listed in §32.j and k of the
resolution:
[The Assembly … Requests States to: …]
j. recognize existing approaches to assess the sustainability of all alternative fuels in general,
including those for use in aviation which should:
i. achieve net GHG emissions reduction on a life cycle basis;
ii. respect the areas of high importance for biodiversity, conservation and benefits
22 This definition also goes beyond biofuels to include any alternative fuel. 23 http://www.icao.int/about-icao/Pages/default.aspx 24 http://www.icao.int/Meetings/a38/Documents/Resolutions/a38_res_prov_en.pdf

Assessment of likely Technology Maturation Pathways for production of biojet fuel (The ATM Project) March 2019
114
for people from ecosystems, in accordance with international and national regulations; and
iii. contribute to local social and economic development, and competition with food
and water should be avoided;
k. adopt measures to ensure the sustainability of alternative fuels for aviation, building on
existing approaches or combination of approaches, and monitor, at a national level, the sustainability
of the production of alternative fuels for aviation.”
Of note is that the sustainability criteria included in paragraph 32.j iii. go beyond the current
mandatory requirements in place for biofuels sustainability in both EU and US legislation, although
these aspects are commonly included in voluntary standards.
4.1.1.2 Airlines perspective There is general agreement amongst the airlines that a minimum sustainability ambition level
should be defined under CORSIA. However, the view is that sustainability criteria should find the right
balance between sufficient stringency to ensure effectiveness and credibility of the industry’s actions
towards sustainable aviation and avoiding excessive limitation of available feedstock through overly
stringent constraints. Furthermore, significant competitive distortion between alternative fuels for
aviation and for other applications should be avoided. Despite this trade-off in the development of a
regulatory scheme, airlines could voluntarily meet higher sustainability levels than the minimum level.
For discussions on alternative fuel sustainability it is helpful to use the criteria and guidelines
of RSB, which cover a comprehensive set of sustainability standards, that are publically available.
Most of the biojet fuel flights made to date have used fuels certified to RSB in the absence of other
standards. Table 46presents the principles and criteria developed by RSB through a broad multi-
stakeholder consultation process.

Assessment of likely Technology Maturation Pathways for production of biojet fuel (The ATM Project) March 2019
115
Table 46: The RSB Principles and Criteria for sustainability certification
4.1.4 Current regulatory and voluntary certification standards Sustainability certification of biojet fuel is a means of demonstrating that the fuel meets the
compliance levels required by national laws, regulatory standards, or voluntary schemes. Current
schemes will have to demonstrate compliance with the sustainability requirements of CORSIA and will
Principles Criteria
1. Legality 1.1 Sustainable alternative jet fuel shall comply with all applicable
national and local laws and regulation.
2. Greenhouse gas
emissions
2.1 Sustainable alternative jet fuel shall achieve net greenhouse gas
emissions reductions on a life-cycle basis.
3. Carbon stock
conservation
3.1 Sustainable alternative jet fuel shall not be made from biomass
obtained from land with high carbon stock.
4. Biodiversity conservation 4.1 Sustainable alternative jet fuel shall not be made from biomass
obtained from land with high biodiversity value.
4.2 Basic ecosystem services in critical situations shall be
maintained or enhanced.
4.3 Biodiversity within the area of operation shall be maintained or
enhanced.
4.4 Biodiversity within the area of operation shall not be
compromised by the use of genetically modified plants,
microorganisms or algae.
5. Soil conservation 5.1 Good agricultural practices shall be implemented to maintain or
enhance soil physical, chemical, and biological conditions.
6. Sustainable water use 6.1: Good agricultural practices shall be implemented to maintain or
enhance water quality.
6.2 Good agricultural practices shall be implemented to use water
efficiently, and to avoid the depletion of surface or groundwater
resources beyond replenishment capacities.
7. Air quality 7.1 Open-air burning as part of land clearance, or the burning of
agricultural residues and wastes shall not be practised, unless there
are no viable alternatives.
7.2 Air pollution emissions shall be minimized.
8. Use of chemicals, wastes
and byproducts
8.1 Chemicals, wastes or by-products arising from fuel production
shall be stored, handled and disposed of responsibly to safeguard
the environment and to minimise the risk to people.
9. Land and water rights and
community engagement
9.1 Sustainable alternative jet fuel operations shall respect existing
land rights and land use rights.
9.2 Sustainable alternative jet fuel operations shall respect the
existing water rights of local and indigenous communities.
9.3 Sustainable alternative jet fuel operations shall only be
established with the free,prior and informed consent of land and
water users or owners.
10. Human rights and labour
rights
10.1 Human rights and labour rights governing child labour, forced
labour, discrimination, freedom of association and the right to
organise and bargain collectively shall not be violated.
11. Local food security 11.1 Sustainable alternative jet fuel operations shall not adversely
impact the human right to adequate food and shall not adversely
impact food security in food insecure regions.
12. Rural, social and
economic development
12.1 In regions of poverty, alternative jet fuel operations shall
contribute to the social and economic development of local, rural
and indigenous people and communities.

Assessment of likely Technology Maturation Pathways for production of biojet fuel (The ATM Project) March 2019
116
likely undergo a benchmarking process against the specific requirements of the meta-standard.
Current standards will include: legislated requirements such as the EU Renewable Energy
Directive (RED), the Renewable Fuel Standard (RFS) in the USA, and the UK Renewable Transport Fuel
Obligation (RTFO); Other voluntary standards likely to meet the meta-standard sustainability criteria
include: Roundtable on Sustainable Biomaterials (RSB) standard; and International Sustainability and
Carbon Certification (ISCC).
The following table (Alberici & Spoettle, 2016) illustrates the current compliance of various
regulatory and voluntary standards with a consolidated set of principles and criteria as might be found
in a meta-standard.

Assessment of likely Technology Maturation Pathways for production of biojet fuel (The ATM Project) March 2019
117

Assessment of likely Technology Maturation Pathways for production of biojet fuel (The ATM Project) March 2019
118
4.1.5 Key aspects of sustainability Sustainability is measured throughout the entire life cycle of the fuel. Three of the most
significant areas of sustainability include GHG performance, food security, and biodiversity.
Life cycle Assessment (LCA) is a tool that calculates the environmental impact of a product or
process over the entire lifecycle. The most prominent parameter in LCA is the total greenhouse gas
(GHG) emissions of every part of the lifespan including feedstock cultivation, transportation,
conversion and end use. The combination of all these emissions gives the overall lifecycle GHG
emissions of a product that can then be compared against other fuels or alternatives to determine the
potential emission reductions achievable with an alternative fuel. LCA and GHG reductions for each
biocrude and upgrading pathway in this project is presented in section 4.2 in great detail and will not
be further discussed here.
Different fuels using different technologies and feedstocks can result in different GHG
emission profiles, with some pathways giving far better GHG reductions than another pathway. It is
critical that any potential biojet supply chain be compared with one another and against the fossil fuel
baseline by looking at the full life cycle emissions utilizing equivalent system boundaries. Once passing
a 10% reduction threshold, the amount of GHG reduction calculated for an eligible fuel will form the
basis of the credit that can be earned under the CORSIA scheme. Therefore airlines using a biojet
with greater GHG reduction will earn more credit, therefore encouraging the production of biojet fuels
with better GHG sustainability.
Many first-generation biofuel feedstocks, such as corn for ethanol and soybeans or canola for
biodiesel, are derived from crops that have multiple uses in the food, feed, and/or fibre sectors.
Concerns with food security are important and it is generally agreed that the development of a biojet
supply chain should not contribute to food insecurity. Major sustainability certification systems include
indicators that seek to monitor impacts on local food security from biofuel development activities.

Assessment of likely Technology Maturation Pathways for production of biojet fuel (The ATM Project) March 2019
119
Each feedstock source and supply chain must be evaluated on its own merits. Where sustainability is
considered holistically, annual crops with multiple uses (including fuels) can have better sustainability
performance vs. purpose grown feedstocks.
Land-use impacts may result in the loss of valuable natural ecosystems and biodiversity.
These impacts are not solely limited to biofuel feedstocks, they apply to the entire agricultural system.
For example, significant tracts of Southeast Asian tropical forest—critical habitat for endangered
species such as orangutans—have been degraded due to clearing for palm oil plantations.
4.2 Life cycle analysis and results of the ATM Project
One of the primary drivers for biojet fuels is the need to reduce the lifecycle greenhouse gas
emissions of aviation fuels. Looking at the lifecycle emissions rather than just the fuel production or
fuel use emissions ensures that real reductions in GHG emissions over the full product lifecycle are
achieved.
The general approach to life cycle analysis and other background material is shown in
Appendix C.
The feedstocks for the fuel production process studied in this project are forest residues. The
resource was discussed in an earlier section of the report. Since these feedstocks are a waste material
the attributional LCA approach is the appropriate approach to use for this analysis.
Goal and Scope: The goal of the LCA study is to determine the GHG emissions of the
production and use of biojet from forest residues through various pyrolysis oil and hydrothermal
liquefaction biocrude production and upgrading systems. The GHG emissions will be used as part of
the evaluation process of the six different approaches analyzed (three biocrudes and two upgrading
systems for each bio-oil). The GHG emissions may also be used to guide the further development of
the technologies.
Information Used in the LCA: The project has collected primary data for the production of
three bio-oils and two different approaches to upgrading the oils. Secondary data for feedstock
collection and transportation, transportation of intermediate and final products, and the reference fuel
pathway is drawn from the GHGenius model.
Of the primary data collected, only the fast pyrolysis oil production system has data from
actual commercial scale production. The other two bio-oils were produced in laboratory settings and
do not necessarily represent optimized processes.
The upgrading experiments were not optimized either. The operating conditions for the
upgrading trials were based primarily on past experience with similar kinds of products. Given the lack
of optimization the upgrading results are encouraging with respect to product quality. However, due to
the quality of the data and the potential for further optimization of the production and upgrading
processes the results are more indicative than definitive.
Functional Unit: The functional unit for this work is one GJ (HHV) of refined bio-oil fuel.

Assessment of likely Technology Maturation Pathways for production of biojet fuel (The ATM Project) March 2019
120
System Boundaries: The system boundary starts with the collection of the forest residue and
ends with the use of the refined bio-oil in an aircraft.
Figure 35 Lifecycle Stages – Forest Residue Biojet
Allocation: Many real-world systems produce more than one product and an important issue
for LCA practitioners is to determine what portion of the emissions should be assigned to which
product. The finished refined bio-oils that are produced in the upgrading process can be fractionated
into fuels that have properties similar to gasoline, jet fuel, diesel fuel, and heavy fuel oil. The
emissions from the processes were allocated to the components based on their energy content.
For non-liquid fuel co-products the gaseous fuels are provided a displacement credit based on
natural gas production and use where it can be demonstrated that there is an existing natural gas load
that could be displaced. If electricity is produced it is assumed to displace grid power, which in British
Columbia is 99% hydro, wind, or biomass power.
Impact Analysis: This work considers only the GHG emissions associated with the production
and use of the refined bio-oils. The GHG emissions are calculated using the 100 year global warming
potentials from the 2007 IPCC fourth assessment report, as these are the values currently being used
for government reporting: Carbon dioxide=1; Methane=25; Nitrous Oxide=298. The GHG emissions of
carbon monoxide and unburned hydrocarbons will be calculated based on the assumption that these
short lived gases are oxidized to carbon dioxide; this is consistent with IPCC methodology.

Assessment of likely Technology Maturation Pathways for production of biojet fuel (The ATM Project) March 2019
121
LCA model: GHGenius 5.0c has been used for modelling. The year has been set to 2018 and
the region is set to British Columbia. All of the other user inputs are set to their default values unless
specified in this report. Higher heating values are used in the model and in this report. The GHGenius
model is used in fuel regulations in several Canadian Provinces and has the most complete inventory
of Canadian data for fuel production processes available.
Reference Fuel: One of the ISO LCA principles is that the analysis is done relative to another
product. The focus of the project is on the production of a biojet fuel so the natural reference fuel is
jet fuel produced from petroleum.
The lifecycle GHG emissions for jet fuel using the GHGenius model as described above are as
follows:
• Fuel dispensing 91 • Fuel distribution and storage 642 • Fuel production 6,383 • Feedstock transmission 78 • Feedstock recovery 5,647 • Feedstock upgrading 4,720 • Land-use changes, cultivation 210 • Fertilizer manufacture 0 • Gas leaks and flares 2,280 • CO2, H2S removed from NG 0 • Emissions displaced - co-products-138 • Fuel Production 19,913 • Fuel Use 67,637 • Total 87,550 g CO2eq/GJ
4.2.1 Forest Residues and the impact of current policy on slash burning
The feedstocks for all of the bio-oil production processes are forest residues. It is assumed
that they are sized in the forest and transported an average distance of 100 km to the bio-oil
production site. The emissions associated with the sizing and the transportation are included in the
system boundaries. Forest residues include harvest residue and non-merchantable residuals such as
insect and fire killed trees.
Forest residues are currently either gathered into piles and combusted in the forest (slash
burning) or some is left to decay on the forest floor. The current regulations in BC require pile burning
in the winter following harvest. This practice releases methane from incomplete combustion and
nitrous oxide. These emissions are currently included in Canada’s National GHG Inventory Report.
These emissions have been added to GHGenius using the emission factors reported by Akagi et al
(2011). These emission factors for methane and nitrous oxide are similar to the factors used in the
National Inventory Report but the report also provides a more complete set of emission factors for
other contaminants. The emissions for slash burning are shown in the following Table 47.
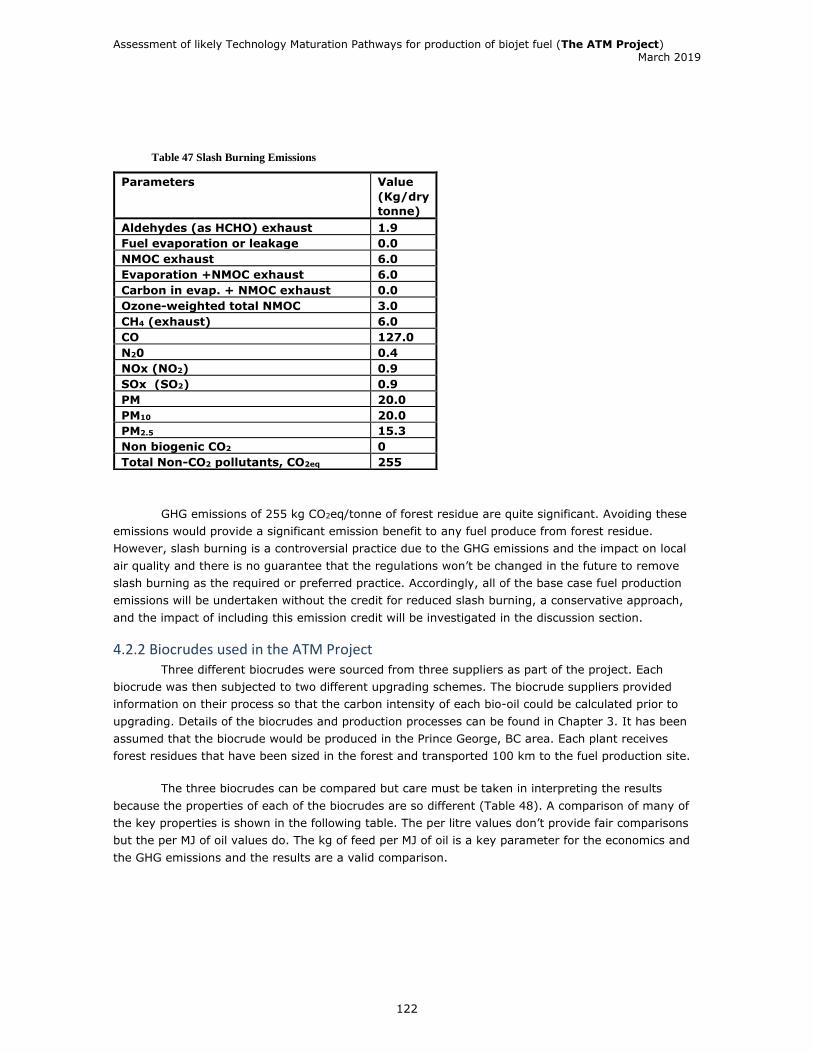
Assessment of likely Technology Maturation Pathways for production of biojet fuel (The ATM Project) March 2019
122
Table 47 Slash Burning Emissions
GHG emissions of 255 kg CO2eq/tonne of forest residue are quite significant. Avoiding these
emissions would provide a significant emission benefit to any fuel produce from forest residue.
However, slash burning is a controversial practice due to the GHG emissions and the impact on local
air quality and there is no guarantee that the regulations won’t be changed in the future to remove
slash burning as the required or preferred practice. Accordingly, all of the base case fuel production
emissions will be undertaken without the credit for reduced slash burning, a conservative approach,
and the impact of including this emission credit will be investigated in the discussion section.
4.2.2 Biocrudes used in the ATM Project Three different biocrudes were sourced from three suppliers as part of the project. Each
biocrude was then subjected to two different upgrading schemes. The biocrude suppliers provided
information on their process so that the carbon intensity of each bio-oil could be calculated prior to
upgrading. Details of the biocrudes and production processes can be found in Chapter 3. It has been
assumed that the biocrude would be produced in the Prince George, BC area. Each plant receives
forest residues that have been sized in the forest and transported 100 km to the fuel production site.
The three biocrudes can be compared but care must be taken in interpreting the results
because the properties of each of the biocrudes are so different (Table 48). A comparison of many of
the key properties is shown in the following table. The per litre values don’t provide fair comparisons
but the per MJ of oil values do. The kg of feed per MJ of oil is a key parameter for the economics and
the GHG emissions and the results are a valid comparison.
Parameters Value
(Kg/dry
tonne)
Aldehydes (as HCHO) exhaust 1.9 Fuel evaporation or leakage 0.0 NMOC exhaust 6.0 Evaporation +NMOC exhaust 6.0 Carbon in evap. + NMOC exhaust 0.0 Ozone-weighted total NMOC 3.0 CH4 (exhaust) 6.0 CO 127.0 N20 0.4 NOx (NO2) 0.9 SOx (SO2) 0.9 PM 20.0 PM10 20.0 PM2.5 15.3 Non biogenic CO2 0 Total Non-CO2 pollutants, CO2eq 255
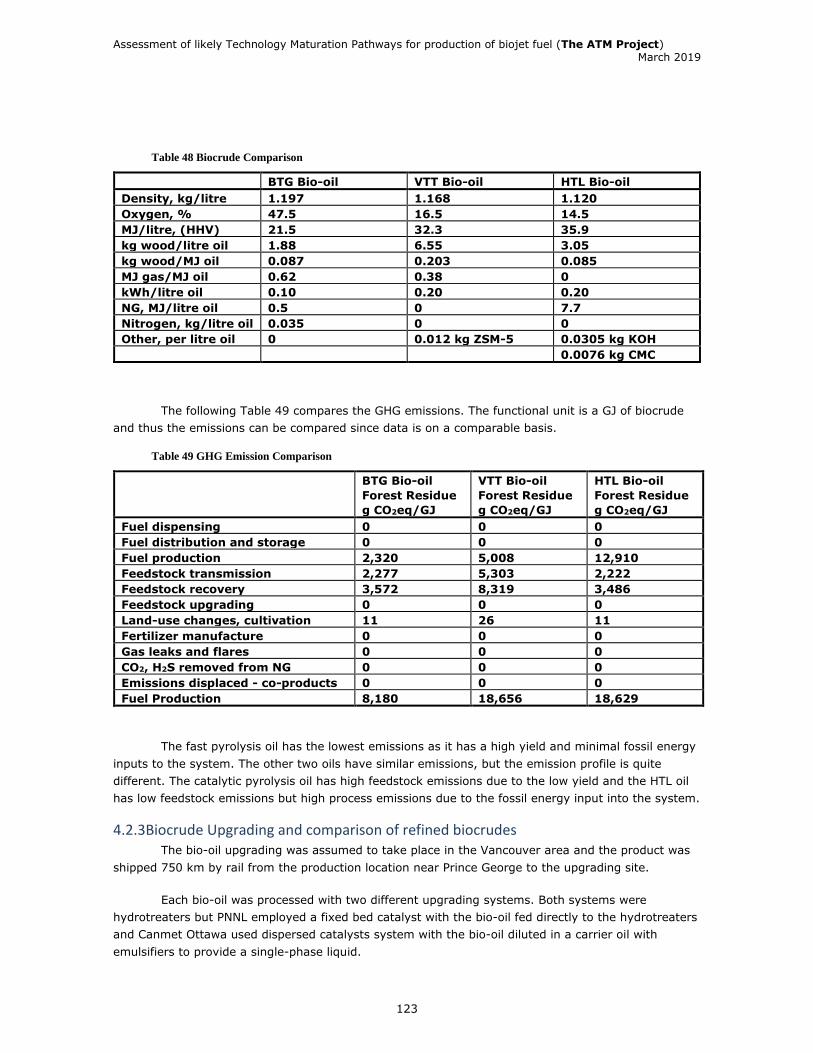
Assessment of likely Technology Maturation Pathways for production of biojet fuel (The ATM Project) March 2019
123
Table 48 Biocrude Comparison
The following Table 49 compares the GHG emissions. The functional unit is a GJ of biocrude
and thus the emissions can be compared since data is on a comparable basis.
Table 49 GHG Emission Comparison
The fast pyrolysis oil has the lowest emissions as it has a high yield and minimal fossil energy
inputs to the system. The other two oils have similar emissions, but the emission profile is quite
different. The catalytic pyrolysis oil has high feedstock emissions due to the low yield and the HTL oil
has low feedstock emissions but high process emissions due to the fossil energy input into the system.
4.2.3Biocrude Upgrading and comparison of refined biocrudes The bio-oil upgrading was assumed to take place in the Vancouver area and the product was
shipped 750 km by rail from the production location near Prince George to the upgrading site.
Each bio-oil was processed with two different upgrading systems. Both systems were
hydrotreaters but PNNL employed a fixed bed catalyst with the bio-oil fed directly to the hydrotreaters
and Canmet Ottawa used dispersed catalysts system with the bio-oil diluted in a carrier oil with
emulsifiers to provide a single-phase liquid.
BTG Bio-oil VTT Bio-oil HTL Bio-oil
Density, kg/litre 1.197 1.168 1.120
Oxygen, % 47.5 16.5 14.5
MJ/litre, (HHV) 21.5 32.3 35.9
kg wood/litre oil 1.88 6.55 3.05
kg wood/MJ oil 0.087 0.203 0.085
MJ gas/MJ oil 0.62 0.38 0
kWh/litre oil 0.10 0.20 0.20
NG, MJ/litre oil 0.5 0 7.7
Nitrogen, kg/litre oil 0.035 0 0
Other, per litre oil 0 0.012 kg ZSM-5 0.0305 kg KOH
0.0076 kg CMC
BTG Bio-oil
Forest Residue
g CO2eq/GJ
VTT Bio-oil
Forest Residue
g CO2eq/GJ
HTL Bio-oil
Forest Residue
g CO2eq/GJ
Fuel dispensing 0 0 0 Fuel distribution and storage 0 0 0 Fuel production 2,320 5,008 12,910 Feedstock transmission 2,277 5,303 2,222 Feedstock recovery 3,572 8,319 3,486 Feedstock upgrading 0 0 0 Land-use changes, cultivation 11 26 11 Fertilizer manufacture 0 0 0 Gas leaks and flares 0 0 0 CO2, H2S removed from NG 0 0 0 Emissions displaced - co-products 0 0 0 Fuel Production 8,180 18,656 18,629
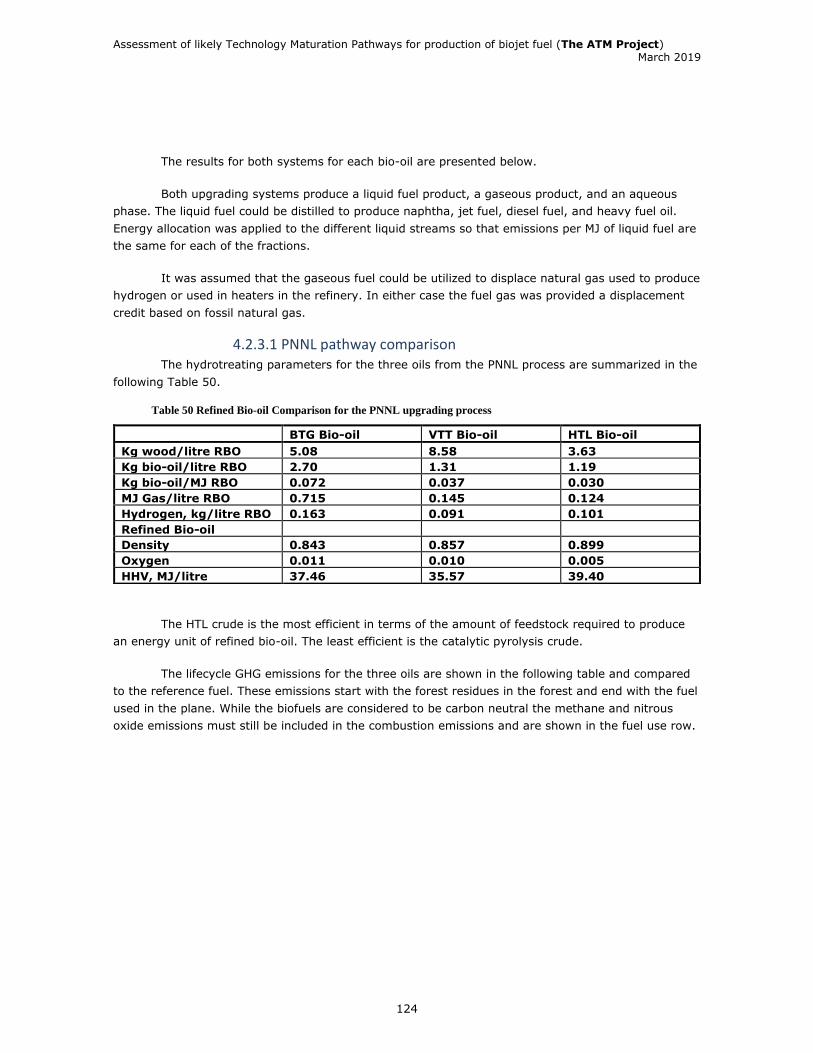
Assessment of likely Technology Maturation Pathways for production of biojet fuel (The ATM Project) March 2019
124
The results for both systems for each bio-oil are presented below.
Both upgrading systems produce a liquid fuel product, a gaseous product, and an aqueous
phase. The liquid fuel could be distilled to produce naphtha, jet fuel, diesel fuel, and heavy fuel oil.
Energy allocation was applied to the different liquid streams so that emissions per MJ of liquid fuel are
the same for each of the fractions.
It was assumed that the gaseous fuel could be utilized to displace natural gas used to produce
hydrogen or used in heaters in the refinery. In either case the fuel gas was provided a displacement
credit based on fossil natural gas.
4.2.3.1 PNNL pathway comparison The hydrotreating parameters for the three oils from the PNNL process are summarized in the
following Table 50.
Table 50 Refined Bio-oil Comparison for the PNNL upgrading process
The HTL crude is the most efficient in terms of the amount of feedstock required to produce
an energy unit of refined bio-oil. The least efficient is the catalytic pyrolysis crude.
The lifecycle GHG emissions for the three oils are shown in the following table and compared
to the reference fuel. These emissions start with the forest residues in the forest and end with the fuel
used in the plane. While the biofuels are considered to be carbon neutral the methane and nitrous
oxide emissions must still be included in the combustion emissions and are shown in the fuel use row.
BTG Bio-oil VTT Bio-oil HTL Bio-oil
Kg wood/litre RBO 5.08 8.58 3.63
Kg bio-oil/litre RBO 2.70 1.31 1.19
Kg bio-oil/MJ RBO 0.072 0.037 0.030
MJ Gas/litre RBO 0.715 0.145 0.124
Hydrogen, kg/litre RBO 0.163 0.091 0.101
Refined Bio-oil
Density 0.843 0.857 0.899
Oxygen 0.011 0.010 0.005
HHV, MJ/litre 37.46 35.57 39.40

Assessment of likely Technology Maturation Pathways for production of biojet fuel (The ATM Project) March 2019
125
Table 51 GHG Emission Comparison for the PNNL upgrading process
The fast pyrolysis oil produces five to six as much gas as the other two oils. It has been
assumed that this gas is available to displace natural gas and thus the emission credit for this pathway
is quite large and more than offsets the extra hydrogen required for the upgrading.
All of the bio-oil pathways for the PNNL upgrading pathway show significant GHG emission
reductions.
4.2.3.2 Canmet pathway Comparison The comparison of the three bio-oils processed by Canmet is shown below in Table 52. Up to
25% of the hydrogen consumption in the Canmet system is consumed by the reaction medium and
not the bio-oil.
Table 52 Refined Bio-oil Comparison- Canmet
Jet fuel BTG Bio-oil VTT Bio-oil HTL Bio-oil
Crude Oil Forest
Residue
Forest
Residue
Forest
Residue
g CO2eq/GJ
Fuel dispensing 91 95 94 96 Fuel distribution and
storage 642 626 636 652 Fuel production 6,383 51,617 28,467 30,463 Feedstock transmission 78 3,892 5,446 2,454 Feedstock recovery 5,647 4,629 7,843 3,230 Feedstock upgrading 4,720 3,006 4,722 11,961 Land-use changes,
cultivation 210 14 24 10 Fertilizer manufacture 0 0 0 0 Gas leaks and flares 2,280 0 0 0 CO2, H2S removed from NG 0 0 0 0 Emissions displaced - co-
products -138 -42,038 -10,846 -7,603 Fuel Production 19,913 21,841 36,386 41,263
Fuel Use 67,637 626 626 626
Total 87,550 22,467 37,027 42,889
% change -74.3 -57.7 -51.0
BTG Bio-oil VTT Bio-oil HTL Bio-oil
Kg wood/litre RBO 4.14 8.19 3.27
Kg bio-oil/litre RBO 2.21 1.25 1.07
Kg bio-oil/MJ RBO 0.058 0.032 0.033
MJ Gas/litre RBO 12.37 9.2 5.65
Hydrogen, kg/litre RBO
0.180 0.115 0.070
Refined Bio-oil
Density 0.829 0.857 0.839
Oxygen 0.005 0.010 0.018
HHV, MJ/litre 37.72 38.39 36.24
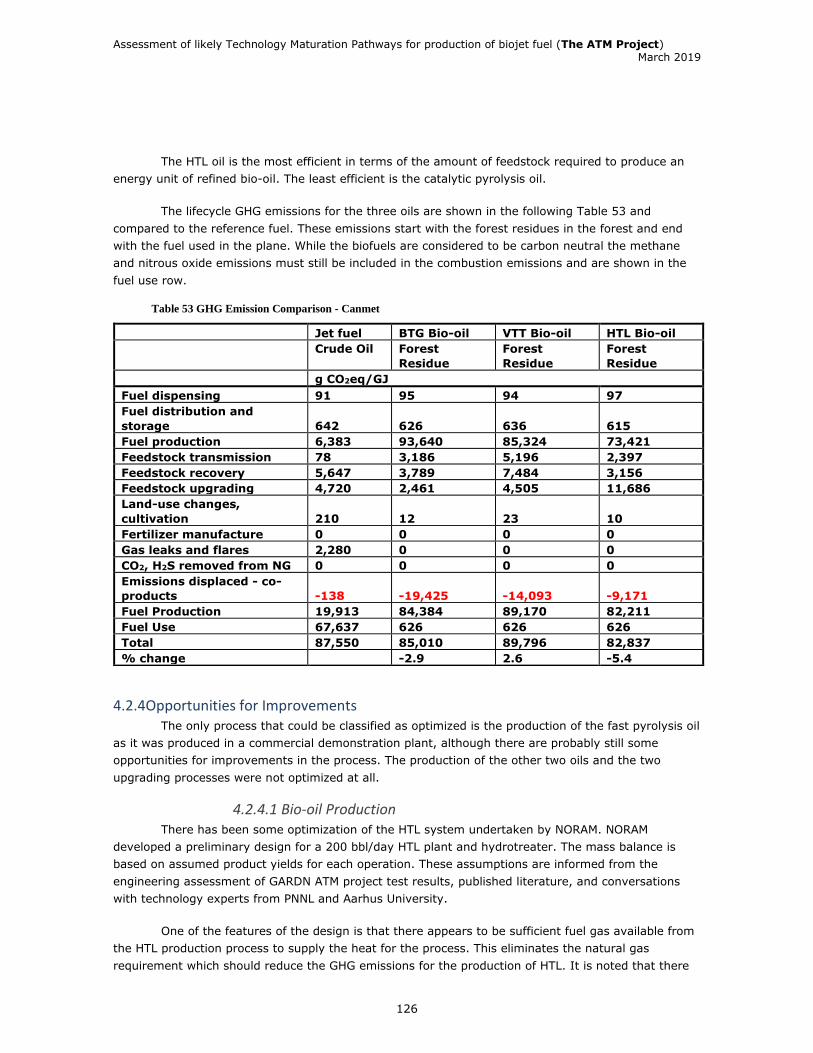
Assessment of likely Technology Maturation Pathways for production of biojet fuel (The ATM Project) March 2019
126
The HTL oil is the most efficient in terms of the amount of feedstock required to produce an
energy unit of refined bio-oil. The least efficient is the catalytic pyrolysis oil.
The lifecycle GHG emissions for the three oils are shown in the following Table 53 and
compared to the reference fuel. These emissions start with the forest residues in the forest and end
with the fuel used in the plane. While the biofuels are considered to be carbon neutral the methane
and nitrous oxide emissions must still be included in the combustion emissions and are shown in the
fuel use row.
Table 53 GHG Emission Comparison - Canmet
4.2.4Opportunities for Improvements The only process that could be classified as optimized is the production of the fast pyrolysis oil
as it was produced in a commercial demonstration plant, although there are probably still some
opportunities for improvements in the process. The production of the other two oils and the two
upgrading processes were not optimized at all.
4.2.4.1 Bio-oil Production There has been some optimization of the HTL system undertaken by NORAM. NORAM
developed a preliminary design for a 200 bbl/day HTL plant and hydrotreater. The mass balance is
based on assumed product yields for each operation. These assumptions are informed from the
engineering assessment of GARDN ATM project test results, published literature, and conversations
with technology experts from PNNL and Aarhus University.
One of the features of the design is that there appears to be sufficient fuel gas available from
the HTL production process to supply the heat for the process. This eliminates the natural gas
requirement which should reduce the GHG emissions for the production of HTL. It is noted that there
Jet fuel BTG Bio-oil VTT Bio-oil HTL Bio-oil
Crude Oil Forest
Residue
Forest
Residue
Forest
Residue
g CO2eq/GJ
Fuel dispensing 91 95 94 97
Fuel distribution and
storage 642 626 636 615
Fuel production 6,383 93,640 85,324 73,421
Feedstock transmission 78 3,186 5,196 2,397
Feedstock recovery 5,647 3,789 7,484 3,156
Feedstock upgrading 4,720 2,461 4,505 11,686
Land-use changes,
cultivation 210 12 23 10
Fertilizer manufacture 0 0 0 0
Gas leaks and flares 2,280 0 0 0
CO2, H2S removed from NG 0 0 0 0
Emissions displaced - co-
products -138 -19,425 -14,093 -9,171
Fuel Production 19,913 84,384 89,170 82,211
Fuel Use 67,637 626 626 626
Total 87,550 85,010 89,796 82,837
% change -2.9 2.6 -5.4
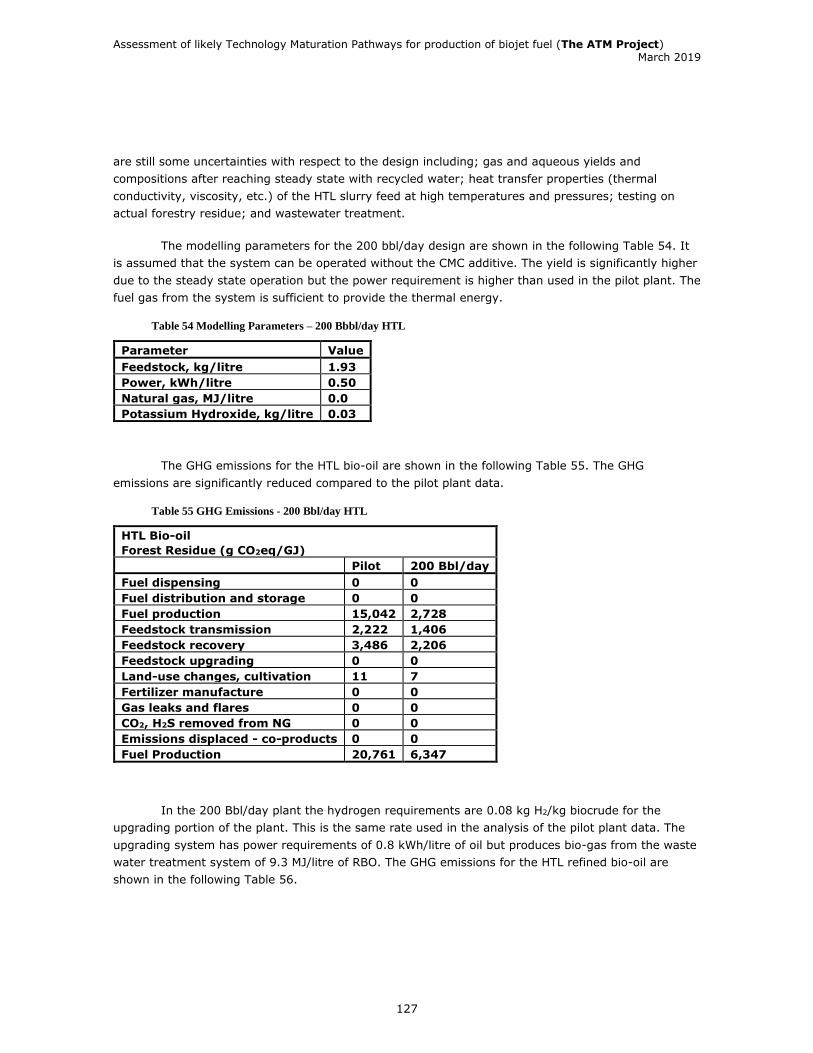
Assessment of likely Technology Maturation Pathways for production of biojet fuel (The ATM Project) March 2019
127
are still some uncertainties with respect to the design including; gas and aqueous yields and
compositions after reaching steady state with recycled water; heat transfer properties (thermal
conductivity, viscosity, etc.) of the HTL slurry feed at high temperatures and pressures; testing on
actual forestry residue; and wastewater treatment.
The modelling parameters for the 200 bbl/day design are shown in the following Table 54. It
is assumed that the system can be operated without the CMC additive. The yield is significantly higher
due to the steady state operation but the power requirement is higher than used in the pilot plant. The
fuel gas from the system is sufficient to provide the thermal energy.
Table 54 Modelling Parameters – 200 Bbbl/day HTL
The GHG emissions for the HTL bio-oil are shown in the following Table 55. The GHG
emissions are significantly reduced compared to the pilot plant data.
Table 55 GHG Emissions - 200 Bbl/day HTL
In the 200 Bbl/day plant the hydrogen requirements are 0.08 kg H2/kg biocrude for the
upgrading portion of the plant. This is the same rate used in the analysis of the pilot plant data. The
upgrading system has power requirements of 0.8 kWh/litre of oil but produces bio-gas from the waste
water treatment system of 9.3 MJ/litre of RBO. The GHG emissions for the HTL refined bio-oil are
shown in the following Table 56.
Parameter Value
Feedstock, kg/litre 1.93
Power, kWh/litre 0.50
Natural gas, MJ/litre 0.0
Potassium Hydroxide, kg/litre 0.03
HTL Bio-oil
Forest Residue (g CO2eq/GJ)
Pilot 200 Bbl/day
Fuel dispensing 0 0
Fuel distribution and storage 0 0
Fuel production 15,042 2,728 Feedstock transmission 2,222 1,406 Feedstock recovery 3,486 2,206 Feedstock upgrading 0 0 Land-use changes, cultivation 11 7 Fertilizer manufacture 0 0
Gas leaks and flares 0 0
CO2, H2S removed from NG 0 0
Emissions displaced - co-products 0 0
Fuel Production 20,761 6,347
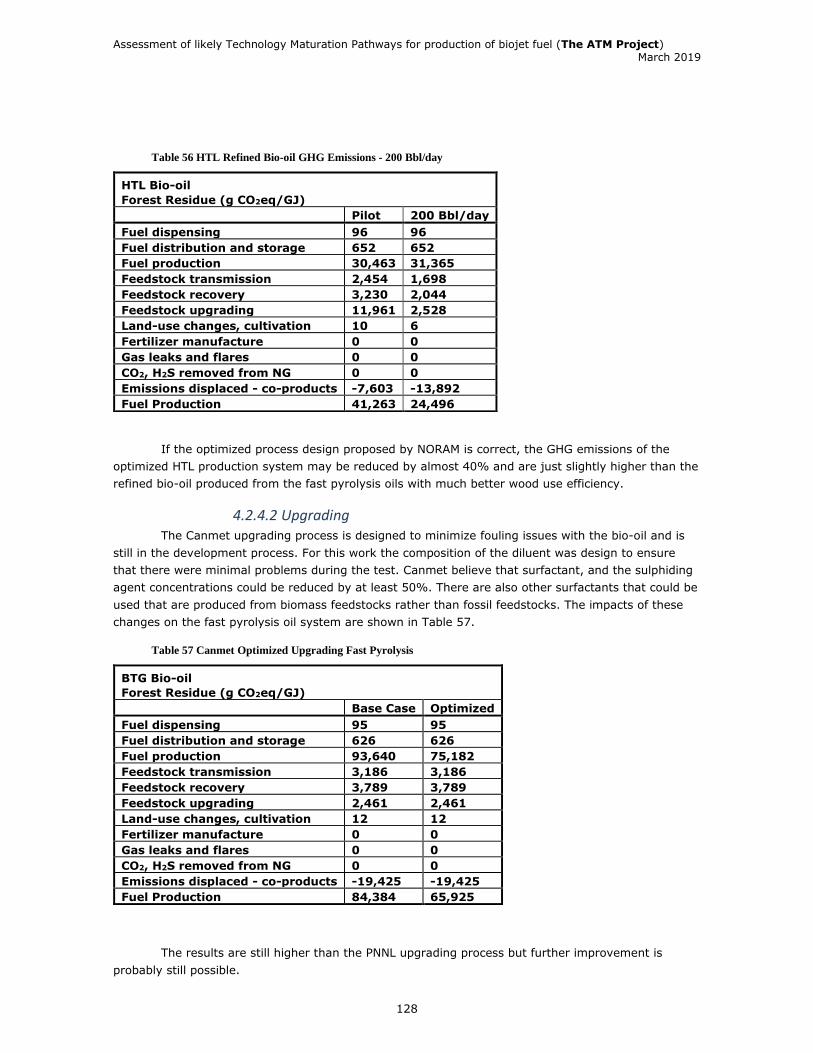
Assessment of likely Technology Maturation Pathways for production of biojet fuel (The ATM Project) March 2019
128
Table 56 HTL Refined Bio-oil GHG Emissions - 200 Bbl/day
If the optimized process design proposed by NORAM is correct, the GHG emissions of the
optimized HTL production system may be reduced by almost 40% and are just slightly higher than the
refined bio-oil produced from the fast pyrolysis oils with much better wood use efficiency.
4.2.4.2 Upgrading The Canmet upgrading process is designed to minimize fouling issues with the bio-oil and is
still in the development process. For this work the composition of the diluent was design to ensure
that there were minimal problems during the test. Canmet believe that surfactant, and the sulphiding
agent concentrations could be reduced by at least 50%. There are also other surfactants that could be
used that are produced from biomass feedstocks rather than fossil feedstocks. The impacts of these
changes on the fast pyrolysis oil system are shown in Table 57.
Table 57 Canmet Optimized Upgrading Fast Pyrolysis
The results are still higher than the PNNL upgrading process but further improvement is
probably still possible.
HTL Bio-oil
Forest Residue (g CO2eq/GJ)
Pilot 200 Bbl/day
Fuel dispensing 96 96 Fuel distribution and storage 652 652 Fuel production 30,463 31,365 Feedstock transmission 2,454 1,698 Feedstock recovery 3,230 2,044 Feedstock upgrading 11,961 2,528 Land-use changes, cultivation 10 6 Fertilizer manufacture 0 0 Gas leaks and flares 0 0 CO2, H2S removed from NG 0 0 Emissions displaced - co-products -7,603 -13,892 Fuel Production 41,263 24,496
BTG Bio-oil
Forest Residue (g CO2eq/GJ)
Base Case Optimized
Fuel dispensing 95 95 Fuel distribution and storage 626 626 Fuel production 93,640 75,182 Feedstock transmission 3,186 3,186 Feedstock recovery 3,789 3,789 Feedstock upgrading 2,461 2,461 Land-use changes, cultivation 12 12 Fertilizer manufacture 0 0 Gas leaks and flares 0 0 CO2, H2S removed from NG 0 0 Emissions displaced - co-products -19,425 -19,425 Fuel Production 84,384 65,925
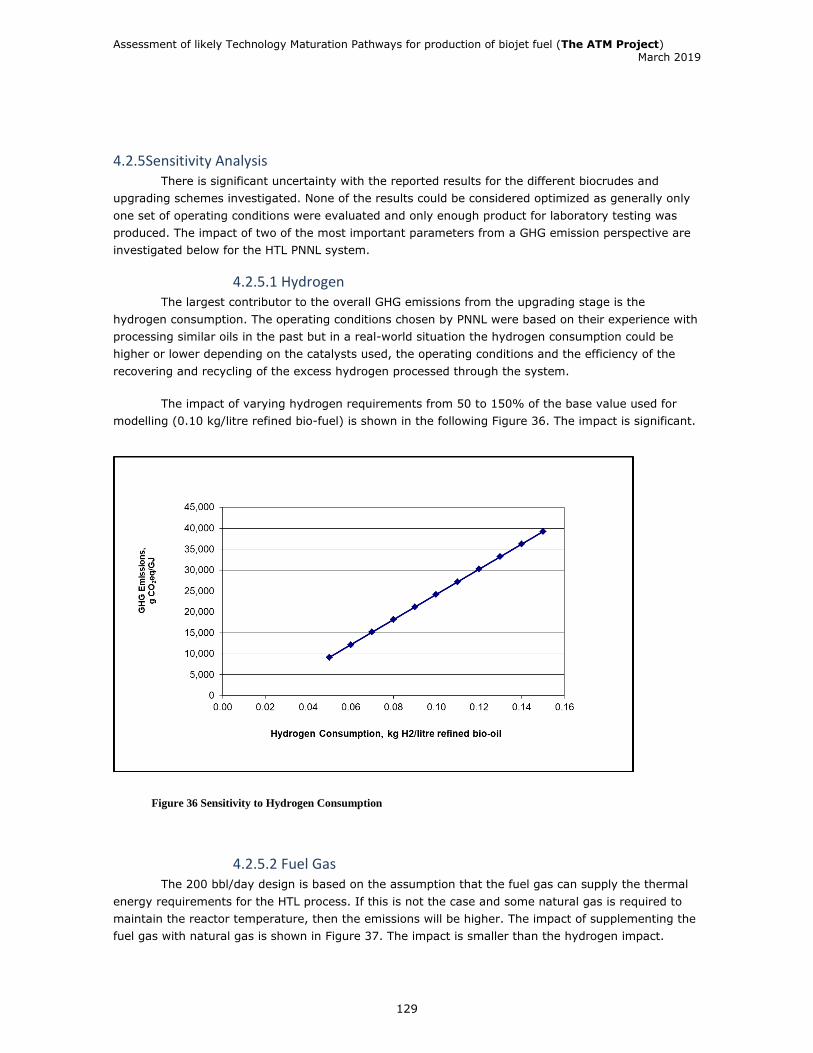
Assessment of likely Technology Maturation Pathways for production of biojet fuel (The ATM Project) March 2019
129
4.2.5Sensitivity Analysis There is significant uncertainty with the reported results for the different biocrudes and
upgrading schemes investigated. None of the results could be considered optimized as generally only
one set of operating conditions were evaluated and only enough product for laboratory testing was
produced. The impact of two of the most important parameters from a GHG emission perspective are
investigated below for the HTL PNNL system.
4.2.5.1 Hydrogen The largest contributor to the overall GHG emissions from the upgrading stage is the
hydrogen consumption. The operating conditions chosen by PNNL were based on their experience with
processing similar oils in the past but in a real-world situation the hydrogen consumption could be
higher or lower depending on the catalysts used, the operating conditions and the efficiency of the
recovering and recycling of the excess hydrogen processed through the system.
The impact of varying hydrogen requirements from 50 to 150% of the base value used for
modelling (0.10 kg/litre refined bio-fuel) is shown in the following Figure 36. The impact is significant.
Figure 36 Sensitivity to Hydrogen Consumption
4.2.5.2 Fuel Gas The 200 bbl/day design is based on the assumption that the fuel gas can supply the thermal
energy requirements for the HTL process. If this is not the case and some natural gas is required to
maintain the reactor temperature, then the emissions will be higher. The impact of supplementing the
fuel gas with natural gas is shown in Figure 37. The impact is smaller than the hydrogen impact.

Assessment of likely Technology Maturation Pathways for production of biojet fuel (The ATM Project) March 2019
130
Figure 37 Sensitivity to Natural Gas Use
The impact of both variables is shown in Figure 38.
Figure 38 Sensitivity to Both Variables

Assessment of likely Technology Maturation Pathways for production of biojet fuel (The ATM Project) March 2019
131
4.2.6 Discussion of LCA Results The lowest GHG emissions are produced by the fast pyrolysis oil system although there is
more opportunity for improvements in the other systems as they are at earlier stages of development.
The development work undertaken for the 200 Bbl/day HTL system suggests that it can produce GHG
emissions at the same level as the fast pyrolysis system, although there is some uncertainty
associated with the 200 Bbl/day design, particularly around the heating value of the off-gas.
The PNNL hydrotreating system results in lower GHG emissions than the Canmet system. The
chemicals that are added to the Canmet system have a significant impact on the GHG emissions of the
refined bio-oil as they are not recovered and recycled. When the dosage rates are compared to the
bio-oil almost 0.75 kg of chemicals are added for every kg of refined bio-oil produced. In addition to
the negative impact on the GHG emissions it is likely to have an unattractive cost.
The GHG emissions for the refined bio-oil systems, using the PNNL approach, show up to a
75% reduction in GHG emissions compared to fossil jet fuel. These large emission reductions are
achieved by the fast pyrolysis system and the optimized HTL system. The emissions summary is
shown in Table 58.
Table 58 GHG Emission Comparison
Jet fuel BTG
Bio-oil
VTT Bio-oil HTL Bio-oil
Crude Oil Forest Residue
Pilot Forecast 200
Bbl/day
g CO2eq/GJ
Fuel dispensing 91 95 94 96 96 Fuel distribution
and storage 642 626 636 652 652 Fuel production 6,383 51,617 28,467 30,463 31,365 Feedstock
transmission 78 3,892 5,446 2,454 1,698 Feedstock recovery 5,647 4,629 7,843 3,230 2,044 Feedstock
upgrading 4,720 3,006 4,722 11,961 2,528 Land-use changes,
cultivation 210 14 24 10 6 Fertilizer
manufacture 0 0 0 0 0 Gas leaks and
flares 2,280 0 0 0 0 CO2, H2S removed
from NG 0 0 0 0 0 Emissions
displaced - co-
products -138 -
42,038 -10,846 -7,603 -13,892 Fuel Production 19,913 21,841 36,386 41,263 24,496
Fuel Use 67,637 626 626 626 626
Total 87,550 22,467 37,027 42,889 25,112
% change -74.3 -57.7 -51.0 -71.3
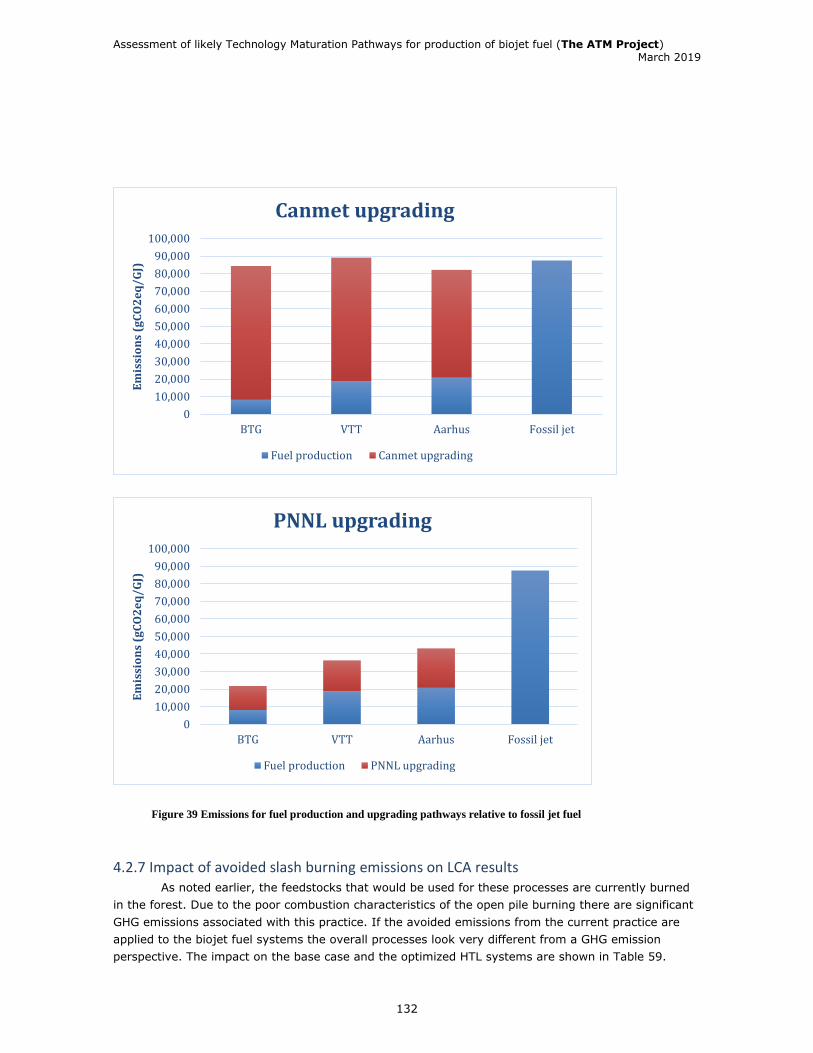
Assessment of likely Technology Maturation Pathways for production of biojet fuel (The ATM Project) March 2019
132
Figure 39 Emissions for fuel production and upgrading pathways relative to fossil jet fuel
4.2.7 Impact of avoided slash burning emissions on LCA results As noted earlier, the feedstocks that would be used for these processes are currently burned
in the forest. Due to the poor combustion characteristics of the open pile burning there are significant
GHG emissions associated with this practice. If the avoided emissions from the current practice are
applied to the biojet fuel systems the overall processes look very different from a GHG emission
perspective. The impact on the base case and the optimized HTL systems are shown in Table 59.
0
10,000
20,000
30,000
40,000
50,000
60,000
70,000
80,000
90,000
100,000
BTG VTT Aarhus Fossil jet
Em
issi
on
s (g
CO
2e
q/
GJ)
Canmet upgrading
Fuel production Canmet upgrading
0
10,000
20,000
30,000
40,000
50,000
60,000
70,000
80,000
90,000
100,000
BTG VTT Aarhus Fossil jet
Em
issi
on
s (g
CO
2e
q/
GJ)
PNNL upgrading
Fuel production PNNL upgrading

Assessment of likely Technology Maturation Pathways for production of biojet fuel (The ATM Project) March 2019
133
Table 59 HTL Refined Bio-oil GHG Emissions – Avoided Forest Burning Emissions
The emission profile of the optimized 200 Bbl/day plant now indicates an 86% reduction in
GHG emissions compared to fossil jet fuel on a full lifecycle basis. The improvement on some of the
other pathways will be even larger since they require more feedstock per unit of fuel produced and
thus will have even higher avoided GHG emission reductions.
The other two biocrude oils consume more feedstock per unit of refined bio-oil produced and
thus the avoided emissions are greater. Since the avoided emissions are greater than the collection
and processing emissions there is effectively a GHG incentive for the less efficient conversion
processes. The GHG emissions for the BTG and VTT oils upgraded using the PNNL approach are shown
in the following table.
Table 60 Avoided Forest Burning Emissions – BTG and VTT Refined Bio-Oil
The inclusion of the avoided slash burning emissions results in negative emissions for both of
these pathways due to the low conversion of the feedstock to refined bio-oil. The high feedstock use
has negative implications for the economics and the total quantity of fuel that can be produced.
HTL Bio-oil
Forest Residue
Pilot 200 Bbl/day
g CO2eq/GJ
Fuel dispensing 96 96 Fuel distribution and storage 652 652 Fuel production 30,463 31,365 Feedstock transmission 2,454 1,698 Feedstock recovery 3,230 2,044 Feedstock upgrading 13,936 2,528 Land-use changes, cultivation 10 6 Fertilizer manufacture 0 0 Gas leaks and flares 0 0 CO2, H2S removed from NG 0 0 Emissions displaced - co-products -27,687 -26,600 Fuel Production 23,154 11,787
BTG VTT
Forest Residue
g CO2eq/GJ
Fuel dispensing 95 94
Fuel distribution and storage 626 636
Fuel production 51,617 28,467
Feedstock transmission 3,892 5,446
Feedstock recovery 4,629 7,843
Feedstock upgrading 3,006 4,722
Land-use changes, cultivation 14 24
Fertilizer manufacture 0 0
Gas leaks and flares 0 0
CO2, H2S removed from NG 0 0
Emissions displaced - co-products -70,822 -59,620
Fuel Production -6,943 -12,388

Assessment of likely Technology Maturation Pathways for production of biojet fuel (The ATM Project) March 2019
134
CHAPTER 5 – TECHNO-ECONOMIC ANALYSIS
This Techno-Economic Assessment (TEA) was developed as part of the ATM project. The
purpose of this work was to assess the techno-economic performance of six pathways as outlined in
the Background section. These pathways are based on the combination of the three different biocrude
production technologies and two (hydrotreating) upgrading technologies, as has been already detailed
in previous sections of this report.
Although none of the pathways are currently ASTM certified for use in commercial aviation,
the TEA assumes the fuel (naphtha, jet, diesel and fuel oil) could be delivered to its final markets. As
discussed in Chapter 3 biocrude production and upgrading was not optimized and upgraders used
existing protocols for hydrotreatment. Maximum jet fuel production was not specifically targeted, but
rather maximum production of total upgraded products. Further optimization of upgrading will be
required to meet exact specifications of fuel products. This TEA will focus on the total volume of the
upgraded bio-oil products (jet, diesel and the heavy fraction) and assess the parameters influencing
the pathways and finding promising pathways with potential for further (technical) development.
Figure 40 shows the set-up of the TEA model and the main boundaries and sources used as
input for the assumptions. In the next section the main assumptions and output components of the
TEA will be further elaborated upon. This is followed by detailed results of each pathway and
concluded by final recommendations for further research.
Figure 40 Schematic representation of the supply chain and most important sources used
Final productsFeedstockBio-crude
technologyUpgrading technology
Logistics
Bo
un
da
ry o
f an
aly
sis
Sou
rce
s
▪ Feedstock price▪ Delivered at gate
ready to be converted by bio-crude technologies
▪ BTG, VTT and Aarhus delivered bio-crude ▪ Yields + needed
utilities to upgrade woody biomass
▪ 100 km assumed distance▪ Assumed railing,
as is most efficient for continuous supply
▪ PNNL and CANMET yields + needed utilities for upgrading the bio-crude
▪ Revenues from naphtha, jet, diesel and fuel oil based on fossil prices▪ Assessed MFSP of
upgraded products
The six supply chain scenarios are modelled using an excel valuation model.
▪ Feedstock price from feedstock analysis, part of the ATM project
▪ BTG, VTT and Aarhus input and output data▪ Scientific
literature▪ British Colombia
specific utility data
▪ Data from SkyNRG’sexperience in transporting SAF
▪ Data from PNNL and CANMET on upgrading ▪ Aligned with
other ATM analysis ▪ British Colombia
specific utility data
▪ 2018 prices for natural gas, diesel, jet and heavy fuel oil in Vancouver area or North America
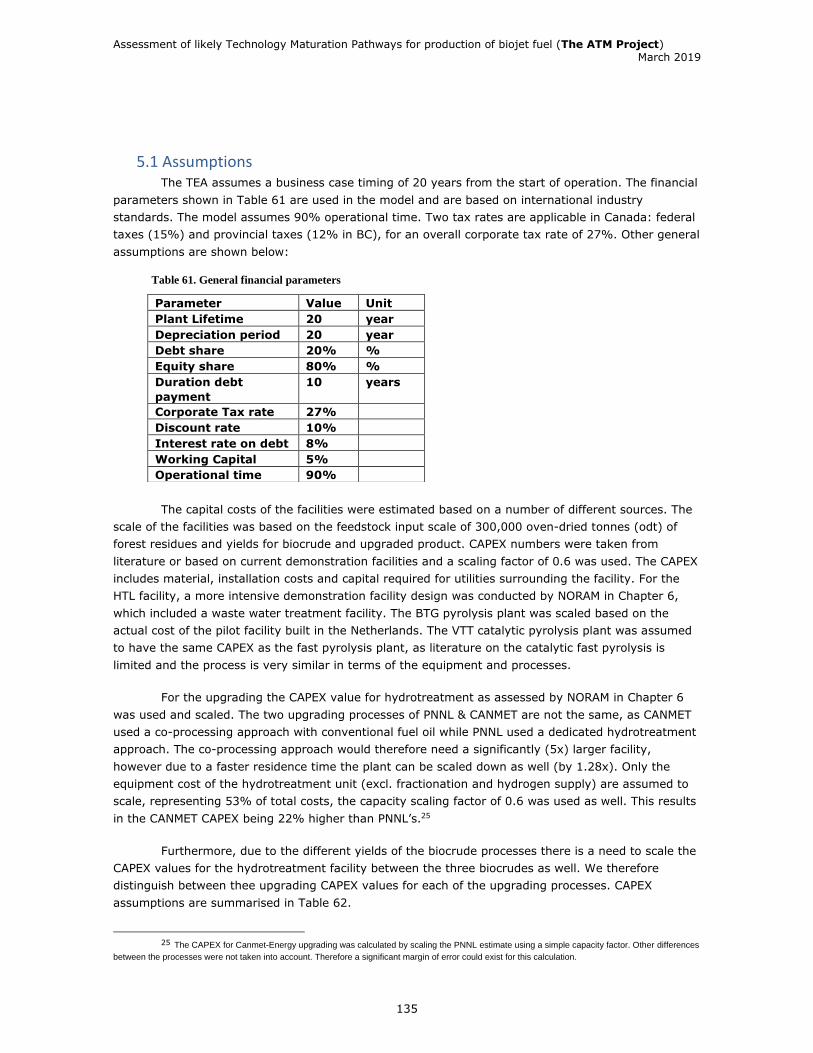
Assessment of likely Technology Maturation Pathways for production of biojet fuel (The ATM Project) March 2019
135
5.1 Assumptions The TEA assumes a business case timing of 20 years from the start of operation. The financial
parameters shown in Table 61 are used in the model and are based on international industry
standards. The model assumes 90% operational time. Two tax rates are applicable in Canada: federal
taxes (15%) and provincial taxes (12% in BC), for an overall corporate tax rate of 27%. Other general
assumptions are shown below:
Table 61. General financial parameters
The capital costs of the facilities were estimated based on a number of different sources. The
scale of the facilities was based on the feedstock input scale of 300,000 oven-dried tonnes (odt) of
forest residues and yields for biocrude and upgraded product. CAPEX numbers were taken from
literature or based on current demonstration facilities and a scaling factor of 0.6 was used. The CAPEX
includes material, installation costs and capital required for utilities surrounding the facility. For the
HTL facility, a more intensive demonstration facility design was conducted by NORAM in Chapter 6,
which included a waste water treatment facility. The BTG pyrolysis plant was scaled based on the
actual cost of the pilot facility built in the Netherlands. The VTT catalytic pyrolysis plant was assumed
to have the same CAPEX as the fast pyrolysis plant, as literature on the catalytic fast pyrolysis is
limited and the process is very similar in terms of the equipment and processes.
For the upgrading the CAPEX value for hydrotreatment as assessed by NORAM in Chapter 6
was used and scaled. The two upgrading processes of PNNL & CANMET are not the same, as CANMET
used a co-processing approach with conventional fuel oil while PNNL used a dedicated hydrotreatment
approach. The co-processing approach would therefore need a significantly (5x) larger facility,
however due to a faster residence time the plant can be scaled down as well (by 1.28x). Only the
equipment cost of the hydrotreatment unit (excl. fractionation and hydrogen supply) are assumed to
scale, representing 53% of total costs, the capacity scaling factor of 0.6 was used as well. This results
in the CANMET CAPEX being 22% higher than PNNL’s.25
Furthermore, due to the different yields of the biocrude processes there is a need to scale the
CAPEX values for the hydrotreatment facility between the three biocrudes as well. We therefore
distinguish between thee upgrading CAPEX values for each of the upgrading processes. CAPEX
assumptions are summarised in Table 62.
25 The CAPEX for Canmet-Energy upgrading was calculated by scaling the PNNL estimate using a simple capacity factor. Other differences
between the processes were not taken into account. Therefore a significant margin of error could exist for this calculation.
Parameter Value Unit
Plant Lifetime 20 year
Depreciation period 20 year
Debt share 20% %
Equity share 80% %
Duration debt
payment
10 years
Corporate Tax rate 27%
Discount rate 10%
Interest rate on debt 8%
Working Capital 5%
Operational time 90%
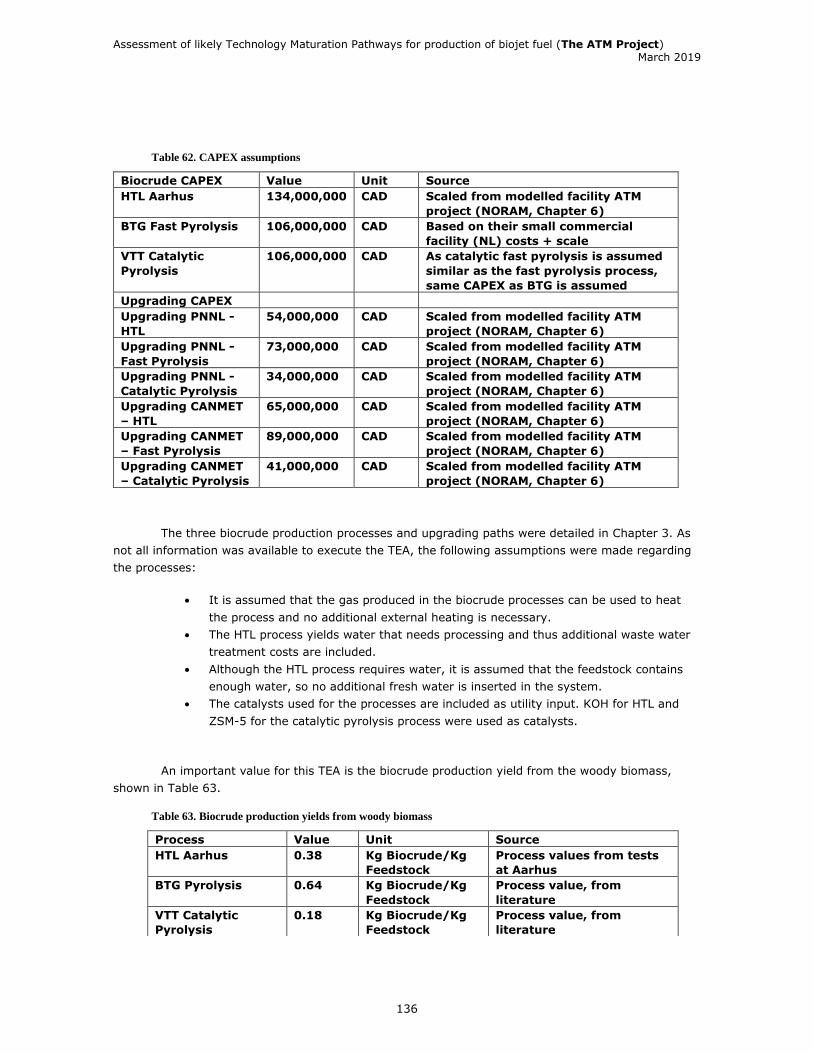
Assessment of likely Technology Maturation Pathways for production of biojet fuel (The ATM Project) March 2019
136
Table 62. CAPEX assumptions
The three biocrude production processes and upgrading paths were detailed in Chapter 3. As
not all information was available to execute the TEA, the following assumptions were made regarding
the processes:
• It is assumed that the gas produced in the biocrude processes can be used to heat
the process and no additional external heating is necessary.
• The HTL process yields water that needs processing and thus additional waste water
treatment costs are included.
• Although the HTL process requires water, it is assumed that the feedstock contains
enough water, so no additional fresh water is inserted in the system.
• The catalysts used for the processes are included as utility input. KOH for HTL and
ZSM-5 for the catalytic pyrolysis process were used as catalysts.
An important value for this TEA is the biocrude production yield from the woody biomass,
shown in Table 63.
Table 63. Biocrude production yields from woody biomass
Biocrude CAPEX Value Unit Source
HTL Aarhus 134,000,000 CAD Scaled from modelled facility ATM
project (NORAM, Chapter 6)
BTG Fast Pyrolysis 106,000,000 CAD Based on their small commercial
facility (NL) costs + scale
VTT Catalytic
Pyrolysis
106,000,000 CAD As catalytic fast pyrolysis is assumed
similar as the fast pyrolysis process,
same CAPEX as BTG is assumed
Upgrading CAPEX
Upgrading PNNL -
HTL
54,000,000 CAD Scaled from modelled facility ATM
project (NORAM, Chapter 6)
Upgrading PNNL -
Fast Pyrolysis
73,000,000 CAD Scaled from modelled facility ATM
project (NORAM, Chapter 6)
Upgrading PNNL -
Catalytic Pyrolysis
34,000,000 CAD Scaled from modelled facility ATM
project (NORAM, Chapter 6)
Upgrading CANMET
– HTL
65,000,000 CAD Scaled from modelled facility ATM
project (NORAM, Chapter 6)
Upgrading CANMET
– Fast Pyrolysis
89,000,000 CAD Scaled from modelled facility ATM
project (NORAM, Chapter 6)
Upgrading CANMET
– Catalytic Pyrolysis
41,000,000 CAD Scaled from modelled facility ATM
project (NORAM, Chapter 6)
Process Value Unit Source
HTL Aarhus 0.38 Kg Biocrude/Kg
Feedstock
Process values from tests
at Aarhus
BTG Pyrolysis 0.64 Kg Biocrude/Kg
Feedstock
Process value, from
literature
VTT Catalytic
Pyrolysis
0.18 Kg Biocrude/Kg
Feedstock
Process value, from
literature

Assessment of likely Technology Maturation Pathways for production of biojet fuel (The ATM Project) March 2019
137
The biocrudes are upgraded in the model by a hydroprocessing facility, assumed to be in the
Vancouver area and co-located with an existing refinery. Both PNNL and CANMET have upgraded the
three biocrude sources into a hydrocarbon mixture of different fuel fractions which can be separated
by distillation. Hydrotreating of the biocrudes also produce gas and aqueous-phase liquid. The
aqueous phase is assumed to be disposed in the waste water treatment facility of the refinery, and no
additional CAPEX is assumed. The gas is assumed to be sold at an equivalent price to natural gas. The
yields of the 6 pathways are shown in Table 64-69.
The values for CANMET (*) are based on the bio-carbon fractions. CANMET uses a fossil fuel
as a diluent during upgrading (Chapter 3), which caused measurement irregularities in its yield from
the biocrude. By tracking the biocarbon (C14 analysis) the mass percentage yields were estimated.
Table 64. Yields upgrading PNNL-HTL
Table 65. Yields upgrading PNNL-Pyrolysis (BTG)
Table 66. Yields upgrading PNNL-Catalytic Pyrolysis (VTT)
Yields from biocrude Value (wt%)
Oil-phase liquids 70.20%
Aqueous-phase liquids 19.30%
Gas 9.70%
Distillation cuts from oil-phase
Naphtha (lights) 18.80%
Jet fuels 22.90%
Diesel (heavy middle distillates) 28.80%
Heavy fuel oil 29.50%
Yields from biocrude Value (wt%)
Oil-phase liquids 29.40%
Aqueous-phase liquids 43.90%
Gas 25.20%
Distillation cuts from oil-phase
Naphtha (lights) 30.40%
Jet fuels 24.70%
Diesel (heavy middle distillates) 24.40%
Heavy fuel oil 20.50%
Yields from biocrude Value (wt%)
Oil-phase liquids 61.60%
Aqueous-phase liquids 27.10%
Gas 10.40%
Distillation cuts from oil-phase
Naphtha (lights) 27.00%
Jet fuels 36.60%
Diesel (heavy middle distillates) 25.60%
Heavy fuel oil 10.30%

Assessment of likely Technology Maturation Pathways for production of biojet fuel (The ATM Project) March 2019
138
Table 67. Yields upgrading CANMET-HTL
Yields from biocrude Value (wt%)
Oil-phase liquids 72.2%*
Aqueous-phase liquids 17.40%*
Solids 9.30%*
Gas 1.10%*
Distillation cuts from oil-phase
Naphtha (lights) 2.70%*
Jet fuels 29.80%*
Diesel (heavy middle distillates) 40.50%*
Heavy fuel oil 26.90%*
Table 68. Yields upgrading CANMET-Pyrolysis (BTG)
Table 69. Yields upgrading CANMET-Catalytic Pyrolysis (VTT)
Revenues
Fossil values: The revenue for the fuel products is based on the refinery gate with no further
logistics assumed towards the final markets. Current values of fossil fuel products, based on a 2018
average, are shown in Table 70.
Yields from biocrude Value (wt%)
Oil-phase liquids 37.30%*
Aqueous-phase liquids 52.40%*
Solids 1.20%*
Gas 9.10%*
Distillation cuts from oil-phase
Naphtha (lights) 19.60%*
Jet fuels 19.80%*
Diesel (heavy middle distillates) 47.30%*
Heavy fuel oil 13.30%*
Yields from biocrude Value (wt%)
Oil-phase liquids 69.10%*
Aqueous-phase liquids 25.00%*
Solids 2.60%*
Gas 3.30%*
Distillation cuts from oil-phase
Naphtha (lights) 15.50%*
Jet fuels 32.80%*
Diesel (heavy middle distillates) 34.90%*
Heavy fuel oil 20.20%*
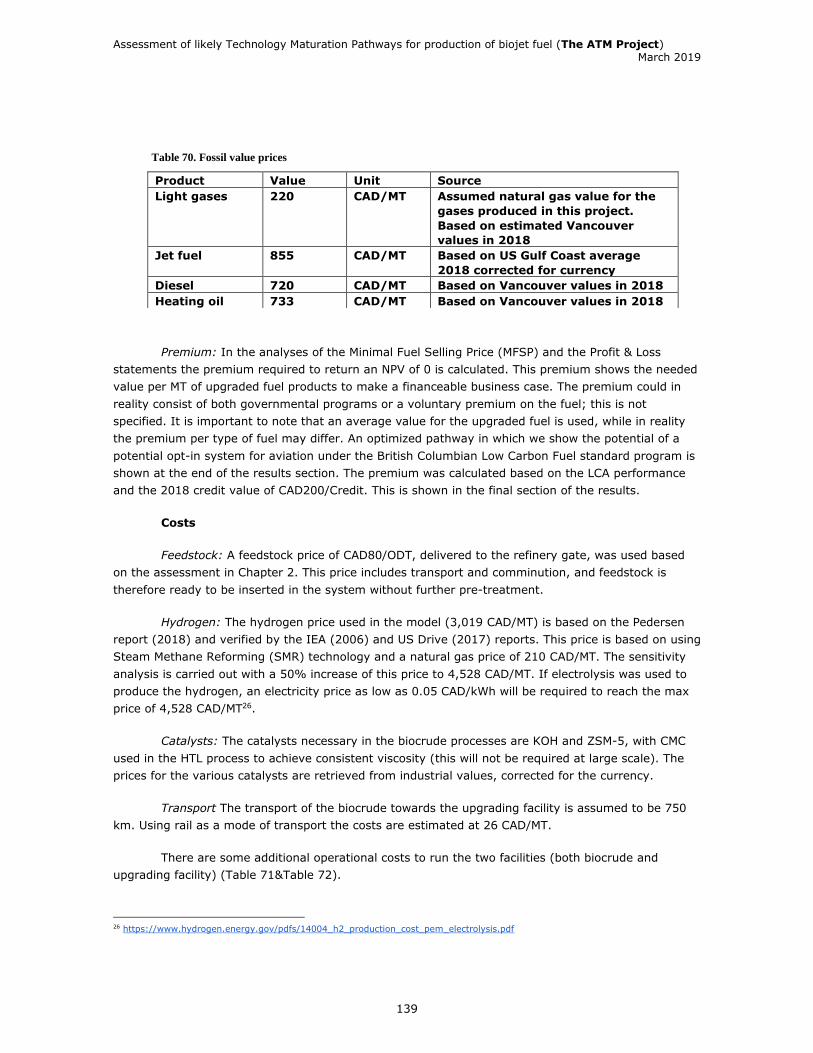
Assessment of likely Technology Maturation Pathways for production of biojet fuel (The ATM Project) March 2019
139
Table 70. Fossil value prices
Premium: In the analyses of the Minimal Fuel Selling Price (MFSP) and the Profit & Loss
statements the premium required to return an NPV of 0 is calculated. This premium shows the needed
value per MT of upgraded fuel products to make a financeable business case. The premium could in
reality consist of both governmental programs or a voluntary premium on the fuel; this is not
specified. It is important to note that an average value for the upgraded fuel is used, while in reality
the premium per type of fuel may differ. An optimized pathway in which we show the potential of a
potential opt-in system for aviation under the British Columbian Low Carbon Fuel standard program is
shown at the end of the results section. The premium was calculated based on the LCA performance
and the 2018 credit value of CAD200/Credit. This is shown in the final section of the results.
Costs
Feedstock: A feedstock price of CAD80/ODT, delivered to the refinery gate, was used based
on the assessment in Chapter 2. This price includes transport and comminution, and feedstock is
therefore ready to be inserted in the system without further pre-treatment.
Hydrogen: The hydrogen price used in the model (3,019 CAD/MT) is based on the Pedersen
report (2018) and verified by the IEA (2006) and US Drive (2017) reports. This price is based on using
Steam Methane Reforming (SMR) technology and a natural gas price of 210 CAD/MT. The sensitivity
analysis is carried out with a 50% increase of this price to 4,528 CAD/MT. If electrolysis was used to
produce the hydrogen, an electricity price as low as 0.05 CAD/kWh will be required to reach the max
price of 4,528 CAD/MT26.
Catalysts: The catalysts necessary in the biocrude processes are KOH and ZSM-5, with CMC
used in the HTL process to achieve consistent viscosity (this will not be required at large scale). The
prices for the various catalysts are retrieved from industrial values, corrected for the currency.
Transport The transport of the biocrude towards the upgrading facility is assumed to be 750
km. Using rail as a mode of transport the costs are estimated at 26 CAD/MT.
There are some additional operational costs to run the two facilities (both biocrude and
upgrading facility) (Table 71&Table 72).
26 https://www.hydrogen.energy.gov/pdfs/14004_h2_production_cost_pem_electrolysis.pdf
Product Value Unit Source
Light gases 220 CAD/MT Assumed natural gas value for the
gases produced in this project.
Based on estimated Vancouver
values in 2018
Jet fuel 855 CAD/MT Based on US Gulf Coast average
2018 corrected for currency
Diesel 720 CAD/MT Based on Vancouver values in 2018
Heating oil 733 CAD/MT Based on Vancouver values in 2018
Assessment of likely Technology Maturation Pathways for production of biojet fuel (The ATM Project) March 2019
140
Table 71. Utility prices assumed
Table 72. Other fixed operational costs.
5.2 Results
The performance of each pathway is discussed according to three metrics: the Minimum Fuel
Selling Price (MFSP), Profit & Loss statement (P&L) and a sensitivity analysis, discussed in more detail
below.
Profit & Loss Statement: The P&L will show the main revenue and costs components of the
process. This will also give an indication of the profitability of the process. It is important to note that
this P&L is generated with an NPV of 0, as with the MFSP method explained below.
MFSP: The contribution of each cost element (e.g. feedstock, utilities, CAPEX, etc.) is summed
towards a total minimal fuel selling price (MFSP) of the hydrotreated biocrude (jet, diesel and fuel oil).
The results are presented in a waterfall graph to show the relative contribution of each element. Each
cost component is summed and averaged over the lifetime of the plant and calculated per metric
tonne (MT) of upgraded biocrude product. As none of the cases can currently compete with the fossil
prices, the NPV is set to 0 by using ‘Goal Seek’ and adjusting the price premium until the NPV is found
to be 0.
NPV & Sensitivities: The net present value (NPV) is used as an indicator of the economic
viability of the six different pathways. The NPV method is a valuation tool that calculates how much
value a project adds with regards to the investment made in the project. To get the NPV, the future
cash flows of the project’s lifetime are discounted for the devaluation of money over time. The sum of
these discounted cashflows (including the investment in year 0), results in the NPV. The influence of
the most important assumptions is tested on the NPV by using the following percentual changes.
Where the min case is the worst case and the max case is the best-case scenario.
Parameter Value Unit
Electricity 0.07 CAD/kWh
Natural Gas Price 220 CAD/MT
Water price 0.06 CAD/M3
Waste Water
Treatment
0.73 CAD/MT
Element Value Unit Source
Operating labor 20 CAD/MT Other TEA´s used (PNNL,
SkyNRG 2017, Jones et al. 2013)
Maintenance 4% % of
CAPEX
Industry values for TEA
Overhead 2% % of
CAPEX
Industry values for TEA
Insurances, permits and
local taxes
3% % of
CAPEX
Industry values for TEA

Assessment of likely Technology Maturation Pathways for production of biojet fuel (The ATM Project) March 2019
141
Before further discussion of the specific results of each pathway it is important to note that
results from single data sets were used to compile this report. The various pathways, both biocrude
production and upgrading, are still in development and extensive optimization is likely to take place
over time. Technologies for biocrude production and (co-processed) upgrading are also not all at the
same level of technological readiness and thus caution should be used in drawing rigid conclusions.
Looking at the overall techno-economic performance of the various pathways it is apparent that they
are significantly influenced by the overall performance of the combined yield from woody biomass to
upgraded oil products. The HTL pathway combined with the PNNL and CANMET upgrading process
performed best with an overall efficiency of 27%, see Table 73 below.
Table 73. Overall yields in wt% of biocrude production and upgrading
5.2.1 HTL – PNNL pathway Producing biocrude with the HTL technology and upgrading with PNNL’s process is the overall best performing pathway. This can be attributed to the highest combined yield from woody feedstock towards upgraded oil products (27% red.). This results in significant income based on a fossil-equivalent price as well as a high impact on the business case when adding a premium on the fuel products. Due to the more robust HTL biocrude process there is an initial lower wood to biocrude yield (38%), however also a relatively low oxygen content (15%). This reduces the volume of biocrude to be transported between the biocrude facility (close to the forest) and the upgrading facility (Vancouver
area). Due to the low oxygen content, the hydrogen use is therefore reduced in this pathway. The main cost contributors compared to the other pathways is the high CAPEX, which is also reflected in the ‘other fixed costs’ category, which is almost 14 million CAD per year. A profit and loss (P&F) analysis over a 5-year period is shown in Table 74.
Bio-crude Upgrading Total
HTL (Aarhus) 38% 70% 27%
Fast Pyro (BTG) 64% 29% 19%
Cat Pyro (VTT) 18% 62% 11%
PNNL
Bio-crude Upgrading Total
HTL (Aarhus) 38% 72% 27%
Fast Pyro (BTG) 64% 37% 24%
Cat Pyro (VTT) 18% 69% 12%
CANMET
Assumption Worst - case Best - case
CAPEX biocrude 50% -50%
CAPEX upgrading 50% -50%
Yield biocrude from woody
biomass
-30% 30%
Feedstock costs 25% -50%
Hydrogen costs 50% -50%
Hydrotreatment catalyst 50% -50%
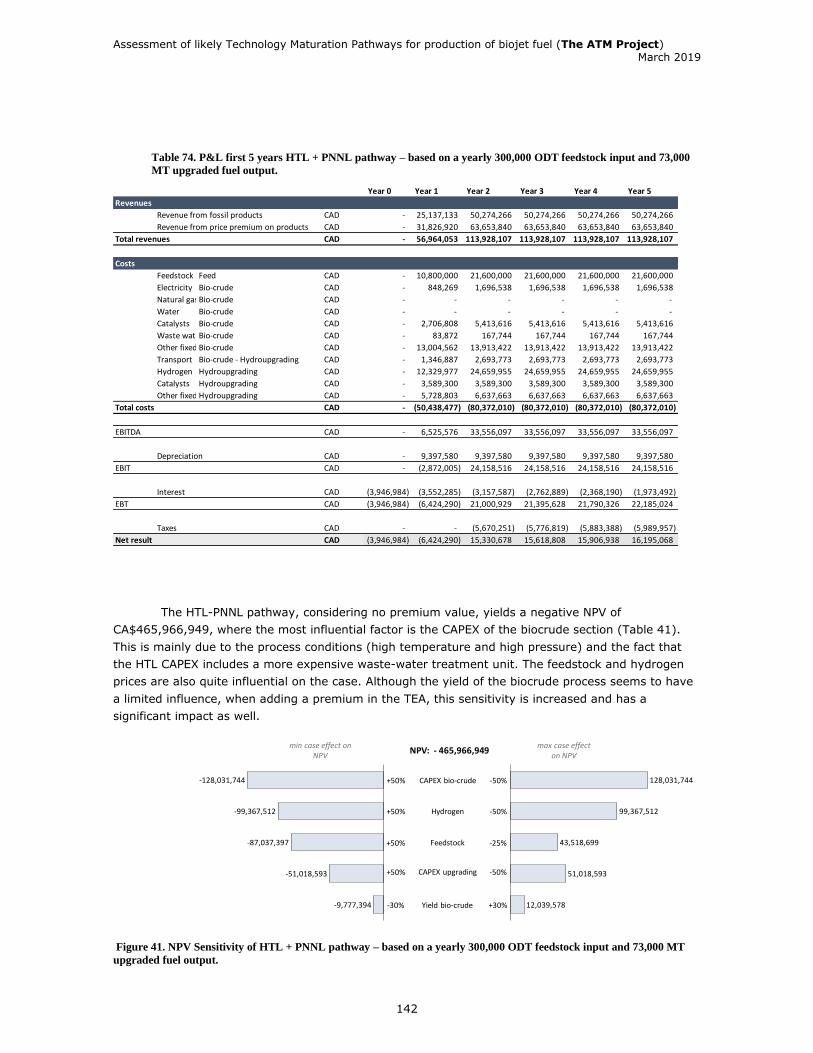
Assessment of likely Technology Maturation Pathways for production of biojet fuel (The ATM Project) March 2019
142
Table 74. P&L first 5 years HTL + PNNL pathway – based on a yearly 300,000 ODT feedstock input and 73,000
MT upgraded fuel output.
The HTL-PNNL pathway, considering no premium value, yields a negative NPV of
CA$465,966,949, where the most influential factor is the CAPEX of the biocrude section (Table 41).
This is mainly due to the process conditions (high temperature and high pressure) and the fact that
the HTL CAPEX includes a more expensive waste-water treatment unit. The feedstock and hydrogen
prices are also quite influential on the case. Although the yield of the biocrude process seems to have
a limited influence, when adding a premium in the TEA, this sensitivity is increased and has a
significant impact as well.
Figure 41. NPV Sensitivity of HTL + PNNL pathway – based on a yearly 300,000 ODT feedstock input and 73,000 MT
upgraded fuel output.
Year 0 Year 1 Year 2 Year 3 Year 4 Year 5
Revenues
Revenue from fossil products CAD - 25,137,133 50,274,266 50,274,266 50,274,266 50,274,266
Revenue from price premium on products CAD - 31,826,920 63,653,840 63,653,840 63,653,840 63,653,840
Total revenues CAD - 56,964,053 113,928,107 113,928,107 113,928,107 113,928,107
Costs
Feedstock costsFeed CAD - 10,800,000 21,600,000 21,600,000 21,600,000 21,600,000
Electricity Bio-crude CAD - 848,269 1,696,538 1,696,538 1,696,538 1,696,538
Natural gasBio-crude CAD - - - - - -
Water Bio-crude CAD - - - - - -
Catalysts Bio-crude CAD - 2,706,808 5,413,616 5,413,616 5,413,616 5,413,616
Waste water treatmentBio-crude CAD - 83,872 167,744 167,744 167,744 167,744
Other fixed costsBio-crude CAD - 13,004,562 13,913,422 13,913,422 13,913,422 13,913,422
Transport Bio-crude - Hydroupgrading CAD - 1,346,887 2,693,773 2,693,773 2,693,773 2,693,773
Hydrogen Hydroupgrading CAD - 12,329,977 24,659,955 24,659,955 24,659,955 24,659,955
Catalysts Hydroupgrading CAD - 3,589,300 3,589,300 3,589,300 3,589,300 3,589,300
Other fixed costsHydroupgrading CAD - 5,728,803 6,637,663 6,637,663 6,637,663 6,637,663
Total costs CAD - (50,438,477) (80,372,010) (80,372,010) (80,372,010) (80,372,010)
EBITDA CAD - 6,525,576 33,556,097 33,556,097 33,556,097 33,556,097
Depreciation CAD - 9,397,580 9,397,580 9,397,580 9,397,580 9,397,580
EBIT CAD - (2,872,005) 24,158,516 24,158,516 24,158,516 24,158,516
Interest CAD (3,946,984) (3,552,285) (3,157,587) (2,762,889) (2,368,190) (1,973,492)
EBT CAD (3,946,984) (6,424,290) 21,000,929 21,395,628 21,790,326 22,185,024
Taxes CAD - - (5,670,251) (5,776,819) (5,883,388) (5,989,957)
Net result CAD (3,946,984) (6,424,290) 15,330,678 15,618,808 15,906,938 16,195,068
128,031,744
99,367,512
43,518,699
51,018,593
12,039,578
-128,031,744
-99,367,512
-87,037,397
-51,018,593
-9,777,394
CAPEX bio-crude -50%+50%
Yield bio-crude +30%-30%
Hydrogen -50%+50%
CAPEX upgrading -50%+50%
Feedstock -25%+50%
NPV: - 465,966,949max case effect
on NPVmin case effect on
NPV
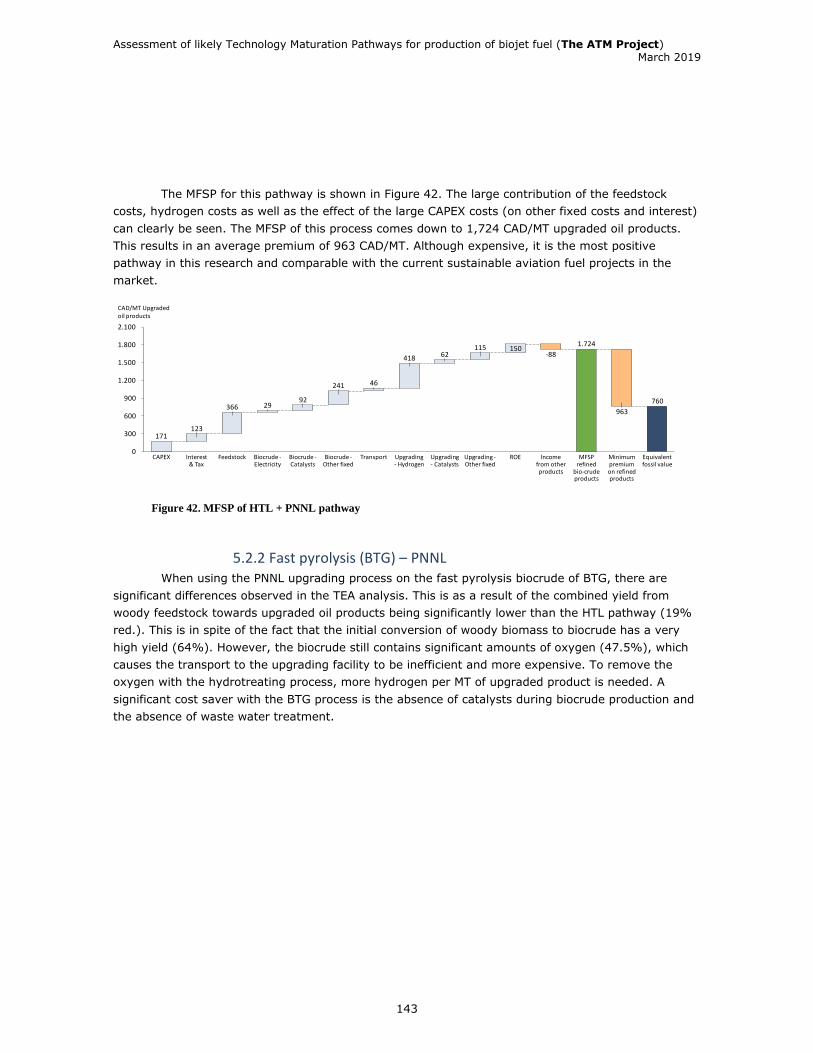
Assessment of likely Technology Maturation Pathways for production of biojet fuel (The ATM Project) March 2019
143
The MFSP for this pathway is shown in Figure 42. The large contribution of the feedstock
costs, hydrogen costs as well as the effect of the large CAPEX costs (on other fixed costs and interest)
can clearly be seen. The MFSP of this process comes down to 1,724 CAD/MT upgraded oil products.
This results in an average premium of 963 CAD/MT. Although expensive, it is the most positive
pathway in this research and comparable with the current sustainable aviation fuel projects in the
market.
Figure 42. MFSP of HTL + PNNL pathway
5.2.2 Fast pyrolysis (BTG) – PNNL When using the PNNL upgrading process on the fast pyrolysis biocrude of BTG, there are
significant differences observed in the TEA analysis. This is as a result of the combined yield from
woody feedstock towards upgraded oil products being significantly lower than the HTL pathway (19%
red.). This is in spite of the fact that the initial conversion of woody biomass to biocrude has a very
high yield (64%). However, the biocrude still contains significant amounts of oxygen (47.5%), which
causes the transport to the upgrading facility to be inefficient and more expensive. To remove the
oxygen with the hydrotreating process, more hydrogen per MT of upgraded product is needed. A
significant cost saver with the BTG process is the absence of catalysts during biocrude production and
the absence of waste water treatment.
171
760
123
366 2992
241 46
418 62115 150
963
1.800
1.200
300
900
1.500
0
600
2.100
Biocrude -Electricity
CAPEX Upgrading - Hydrogen
Upgrading - Catalysts
Upgrading -Other fixed
ROE Income from other products
Feedstock MFSP refined
bio-crude products
Interest & Tax
Equivalent fossil value
Transport Minimum premium on refined products
Biocrude -Other fixed
Biocrude -Catalysts
-88
1.724
CAD/MT Upgraded oil products

Assessment of likely Technology Maturation Pathways for production of biojet fuel (The ATM Project) March 2019
144
Table 75. P&L first 5 years Pyrolysis (BTG) + PNNL pathway – based on a yearly 300,000 ODT feedstock input
and 51,000 MT upgraded fuel output.
Looking at the sensitivity of the NPV of the fast pyrolysis pathway, a higher dependency on
the hydrogen for upgrading is observed. Together with this additional hydrogen requirement, the
sensitivity towards upgrading CAPEX becomes more apparent due to the larger scale upgrading facility
required to deal with the larger amount of biocrude to be upgraded compared to the HTL pathway.
Figure 43. NPV sensitivity analysis of pyrolysis (BTG) + PNNL – based on a yearly 300,000 ODT feedstock
input and 51,000 MT upgraded fuel output.
Figure 44 shows the MFSP of the BTG + PNNL pathway, at CAD2,518 this fuel is about 3.5
times the price of the fossil equivalent. Although this is more expensive than the HTL pathway, it is
still reasonable compared with many other alternative fuel pathways. Especially, considering the lack
Year 0 Year 1 Year 2 Year 3 Year 4 Year 5
Revenues
Revenue from fossil products CAD - 20,056,702 40,113,405 40,113,405 40,113,405 40,113,405
Revenue from price premium on products CAD - 35,493,473 70,986,945 70,986,945 70,986,945 70,986,945
Total revenues CAD - 55,550,175 111,100,350 111,100,350 111,100,350 111,100,350
Costs
Feedstock costsFeed CAD - 10,800,000 21,600,000 21,600,000 21,600,000 21,600,000
Electricity Bio-crude CAD - 720,215 1,440,430 1,440,430 1,440,430 1,440,430
Natural gasBio-crude CAD - - - - - -
Water Bio-crude CAD - - - - - -
Catalysts Bio-crude CAD - - - - - -
Waste water treatmentBio-crude CAD - - - - - -
Other fixed costsBio-crude CAD - 10,172,195 10,803,963 10,803,963 10,803,963 10,803,963
Transport Bio-crude - Hydroupgrading CAD - 2,235,534 4,471,068 4,471,068 4,471,068 4,471,068
Hydrogen Hydroupgrading CAD - 14,750,988 29,501,977 29,501,977 29,501,977 29,501,977
Catalysts Hydroupgrading CAD - 3,589,300 3,589,300 3,589,300 3,589,300 3,589,300
Other fixed costsHydroupgrading CAD - 7,164,157 7,795,925 7,795,925 7,795,925 7,795,925
Total costs CAD - (49,432,390) (79,202,663) (79,202,663) (79,202,663) (79,202,663)
EBITDA CAD - 6,117,785 31,897,687 31,897,687 31,897,687 31,897,687
Depreciation CAD - 8,929,342 8,929,342 8,929,342 8,929,342 8,929,342
EBIT CAD - (2,811,557) 22,968,344 22,968,344 22,968,344 22,968,344
Interest CAD (3,750,324) (3,375,291) (3,000,259) (2,625,227) (2,250,194) (1,875,162)
EBT CAD (3,750,324) (6,186,849) 19,968,085 20,343,118 20,718,150 21,093,183
Taxes CAD - - (5,391,383) (5,492,642) (5,593,901) (5,695,159)
Net result CAD (3,750,324) (6,186,849) 14,576,702 14,850,476 15,124,250 15,398,023
118,878,485
100,984,427
43,518,699
69,144,660
21,492,159
-118,878,485
-100,984,427
-87,037,397
-69,144,660
-18,426,257
NPV: - 527,379,579
CAPEX bio-crude -50%+50%
Yield bio-crude - 30%+30%
Hydrogen -50%+50%
CAPEX upgrading -50%+50%
Feedstock -25%+50%
max case effect on NPV
min case effect on NPV
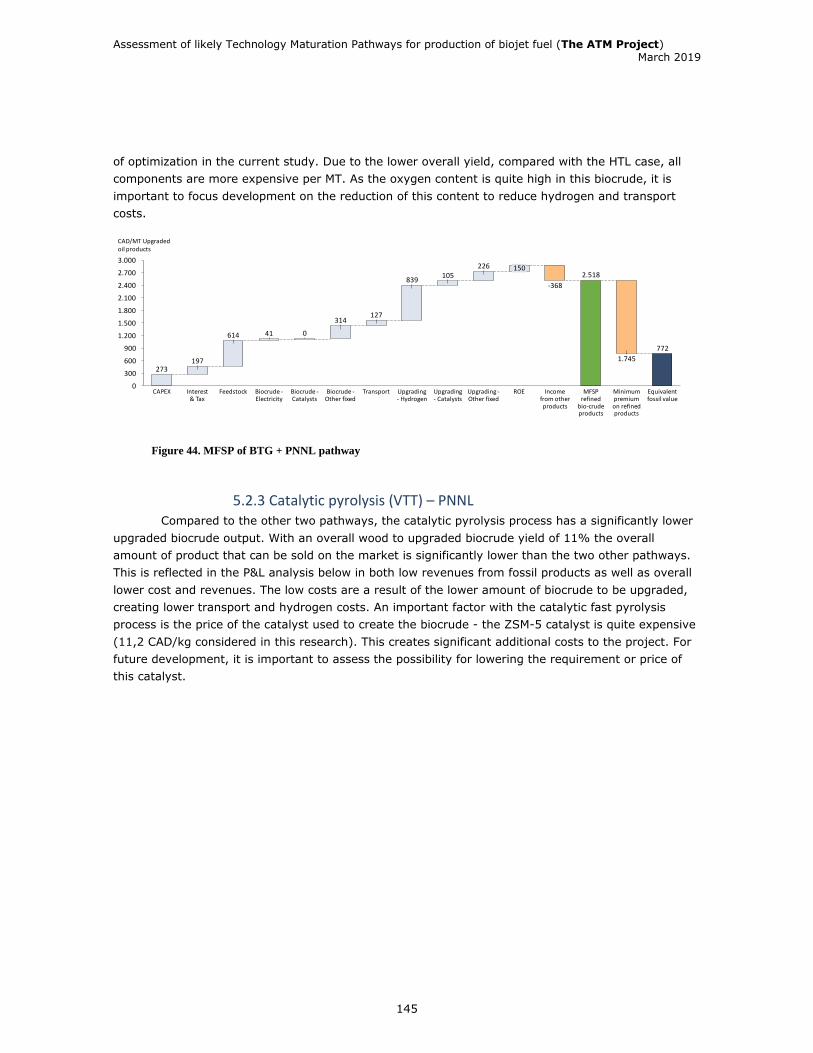
Assessment of likely Technology Maturation Pathways for production of biojet fuel (The ATM Project) March 2019
145
of optimization in the current study. Due to the lower overall yield, compared with the HTL case, all
components are more expensive per MT. As the oxygen content is quite high in this biocrude, it is
important to focus development on the reduction of this content to reduce hydrogen and transport
costs.
Figure 44. MFSP of BTG + PNNL pathway
5.2.3 Catalytic pyrolysis (VTT) – PNNL Compared to the other two pathways, the catalytic pyrolysis process has a significantly lower
upgraded biocrude output. With an overall wood to upgraded biocrude yield of 11% the overall
amount of product that can be sold on the market is significantly lower than the two other pathways.
This is reflected in the P&L analysis below in both low revenues from fossil products as well as overall
lower cost and revenues. The low costs are a result of the lower amount of biocrude to be upgraded,
creating lower transport and hydrogen costs. An important factor with the catalytic fast pyrolysis
process is the price of the catalyst used to create the biocrude - the ZSM-5 catalyst is quite expensive
(11,2 CAD/kg considered in this research). This creates significant additional costs to the project. For
future development, it is important to assess the possibility for lowering the requirement or price of
this catalyst.
273
772
197
614 41
314127
839105
226
2.100
3.000
0
1.800
2.400
900
600
1.200
1.500
300
2.700
Biocrude -Electricity
MFSP refined
bio-crude products
0
Upgrading - Hydrogen
Biocrude -Catalysts
Upgrading -Other fixed
Biocrude -Other fixed
Interest & Tax
Upgrading - Catalysts
150
ROE Income from other products
2.518
Equivalent fossil value
1.745
Minimum premium on refined products
Feedstock Transport
-368
CAPEX
CAD/MT Upgraded oil products
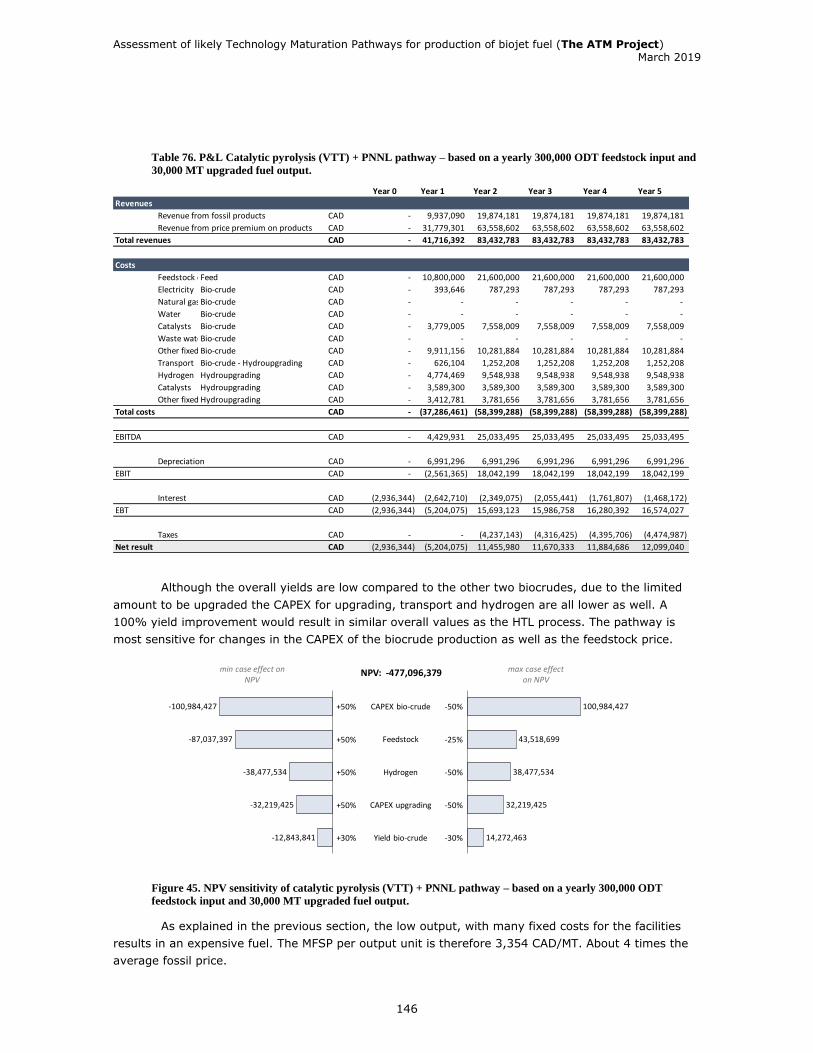
Assessment of likely Technology Maturation Pathways for production of biojet fuel (The ATM Project) March 2019
146
Table 76. P&L Catalytic pyrolysis (VTT) + PNNL pathway – based on a yearly 300,000 ODT feedstock input and
30,000 MT upgraded fuel output.
Although the overall yields are low compared to the other two biocrudes, due to the limited
amount to be upgraded the CAPEX for upgrading, transport and hydrogen are all lower as well. A
100% yield improvement would result in similar overall values as the HTL process. The pathway is
most sensitive for changes in the CAPEX of the biocrude production as well as the feedstock price.
Figure 45. NPV sensitivity of catalytic pyrolysis (VTT) + PNNL pathway – based on a yearly 300,000 ODT
feedstock input and 30,000 MT upgraded fuel output.
As explained in the previous section, the low output, with many fixed costs for the facilities
results in an expensive fuel. The MFSP per output unit is therefore 3,354 CAD/MT. About 4 times the
average fossil price.
Year 0 Year 1 Year 2 Year 3 Year 4 Year 5
Revenues
Revenue from fossil products CAD - 9,937,090 19,874,181 19,874,181 19,874,181 19,874,181
Revenue from price premium on products CAD - 31,779,301 63,558,602 63,558,602 63,558,602 63,558,602
Total revenues CAD - 41,716,392 83,432,783 83,432,783 83,432,783 83,432,783
Costs
Feedstock costsFeed CAD - 10,800,000 21,600,000 21,600,000 21,600,000 21,600,000
Electricity Bio-crude CAD - 393,646 787,293 787,293 787,293 787,293
Natural gasBio-crude CAD - - - - - -
Water Bio-crude CAD - - - - - -
Catalysts Bio-crude CAD - 3,779,005 7,558,009 7,558,009 7,558,009 7,558,009
Waste water treatmentBio-crude CAD - - - - - -
Other fixed costsBio-crude CAD - 9,911,156 10,281,884 10,281,884 10,281,884 10,281,884
Transport Bio-crude - Hydroupgrading CAD - 626,104 1,252,208 1,252,208 1,252,208 1,252,208
Hydrogen Hydroupgrading CAD - 4,774,469 9,548,938 9,548,938 9,548,938 9,548,938
Catalysts Hydroupgrading CAD - 3,589,300 3,589,300 3,589,300 3,589,300 3,589,300
Other fixed costsHydroupgrading CAD - 3,412,781 3,781,656 3,781,656 3,781,656 3,781,656
Total costs CAD - (37,286,461) (58,399,288) (58,399,288) (58,399,288) (58,399,288)
EBITDA CAD - 4,429,931 25,033,495 25,033,495 25,033,495 25,033,495
Depreciation CAD - 6,991,296 6,991,296 6,991,296 6,991,296 6,991,296
EBIT CAD - (2,561,365) 18,042,199 18,042,199 18,042,199 18,042,199
Interest CAD (2,936,344) (2,642,710) (2,349,075) (2,055,441) (1,761,807) (1,468,172)
EBT CAD (2,936,344) (5,204,075) 15,693,123 15,986,758 16,280,392 16,574,027
Taxes CAD - - (4,237,143) (4,316,425) (4,395,706) (4,474,987)
Net result CAD (2,936,344) (5,204,075) 11,455,980 11,670,333 11,884,686 12,099,040
100,984,427
43,518,699
38,477,534
32,219,425
14,272,463
-100,984,427
-87,037,397
-38,477,534
-32,219,425
-12,843,841
NPV: -477,096,379
CAPEX bio-crude -50%+50%
Yield bio-crude -30%+30%
Hydrogen -50%+50%
CAPEX upgrading -50%+50%
Feedstock -25%+50%
max case effect on NPV
min case effect on NPV

Assessment of likely Technology Maturation Pathways for production of biojet fuel (The ATM Project) March 2019
147
Figure 46. MFSP of catalytic pyrolysis + PNNL pathway
5.2.4 HTL (Aarhus) - CANMET The HTL biocrude combined with CANMET’s co-processing upgrading approach yields the best
result compared to the other two biocrudes processed with this upgrading approach. Although the
performance is financially better than the PNNL approach, the de-oxygenation and the quality of the
output products is lower. Some differences can be noted compared to the PNNL approach. The
hydrogen use of this pathway is significantly lower than with the PNNL approach (hence the lower de-
oxygenation levels) and the yield towards valuable products is also high, as almost no lights are
produced. This could have multiple reasons, e.g. due to the co-processing approach the hydrogen
numbers as well as the green carbon yields might be skewed. As a different fuel oil batch was used in
the co-processing of the HTL-crude, comparison with the other pathways is difficult and should be
done with caution. Although the HTL biocrude had the lowest oxygen content to start with, the
resulting oil-phase is only deoxygenated with 47%, whereas the FP and CFP biocrudes where
deoxygenated with 93% and 72% respectively. This implies that too little hydrogen has been used to
upgrade the biocrude.
350
790252
37
351
490 58
444171
180
0
1.500
500
1.000
2.000
3.000
3.500
2.500
Revenue from fossil products
Biocrude -Other fixed
Transport Upgrading - Hydrogen
Upgrading - Catalysts
ROE MFSP refined
bio-crude products
Feedstock
2.564
Minimum premium on refined products
1.005
Interest + Tax
CAPEX Upgrading -Other fixed
Income from other products
Biocrude -Catalysts
Biocrude -Electricity
-134
3.354150
CAD/MT upgraded oil products

Assessment of likely Technology Maturation Pathways for production of biojet fuel (The ATM Project) March 2019
148
Table 77. P&L HTL + CANMET pathway – based on a yearly 300,000 ODT feedstock input and 75,000 MT
upgraded fuel output.
Without any premium on the output products the NPV of the HTL + CANMET approach is
better than the PNNL approach, mainly as a result of the lower hydrogen consumption and the high
yield to upgraded middle distillates. Similarly, the CAPEX of the biocrude component is very sensitive
to price changes as is the feedstock price.
Figure 47. NPV sensitivity of HTL + CANMET pathway – based on a yearly 300,000 ODT feedstock input and
75,000 MT upgraded fuel output.
Looking at the MFSP in Figure 48, some interesting insights are shown. The feedstock and
Year 0 Year 1 Year 2 Year 3 Year 4 Year 5
Revenues
Revenue from fossil products CAD - 28,162,713 56,325,427 56,325,427 56,325,427 56,325,427
Revenue from price premium on products CAD - 27,513,180 55,026,361 55,026,361 55,026,361 55,026,361
Total revenues CAD - 55,675,894 111,351,788 111,351,788 111,351,788 111,351,788
Costs
Feedstock costsFeed CAD - 10,800,000 21,600,000 21,600,000 21,600,000 21,600,000
Electricity Bio-crude CAD - 848,269 1,696,538 1,696,538 1,696,538 1,696,538
Natural gasBio-crude CAD - - - - - -
Water Bio-crude CAD - - - - - -
Catalysts Bio-crude CAD - 2,706,808 5,413,616 5,413,616 5,413,616 5,413,616
Waste water treatmentBio-crude CAD - 83,872 167,744 167,744 167,744 167,744
Other fixed costsBio-crude CAD - 13,030,455 13,965,209 13,965,209 13,965,209 13,965,209
Transport Bio-crude - Hydroupgrading CAD - 1,346,887 2,693,773 2,693,773 2,693,773 2,693,773
Hydrogen Hydroupgrading CAD - 9,417,525 18,835,049 18,835,049 18,835,049 18,835,049
Catalysts Hydroupgrading CAD - 3,589,300 3,589,300 3,589,300 3,589,300 3,589,300
Other fixed costsHydroupgrading CAD - 6,814,149 7,747,967 7,747,967 7,747,967 7,747,967
Total costs CAD - (48,637,264) (75,709,196) (75,709,196) (75,709,196) (75,709,196)
EBITDA CAD - 7,038,630 35,642,592 35,642,592 35,642,592 35,642,592
Depreciation CAD - 9,986,685 9,986,685 9,986,685 9,986,685 9,986,685
EBIT CAD - (2,948,055) 25,655,907 25,655,907 25,655,907 25,655,907
Interest CAD (4,194,408) (3,774,967) (3,355,526) (2,936,085) (2,516,645) (2,097,204)
EBT CAD (4,194,408) (6,723,022) 22,300,381 22,719,822 23,139,263 23,558,703
Taxes CAD - - (6,021,103) (6,134,352) (6,247,601) (6,360,850)
Net result CAD (4,194,408) (6,723,022) 16,279,278 16,585,470 16,891,662 17,197,853
128,031,744
43,518,699
75,896,002
62,242,683
36,679,429
-128,031,744
-87,037,397
-75,896,002
-62,242,683
-33,919,564
CAPEX bio-crude -50%+50%
Yield bio-crude +30%-30%
Hydrogen -50%+50%
CAPEX upgrading -50%+50%
Feedstock -25%+50%
NPV: - 393,525,333max case effect
on NPVmin case effect on
NPV
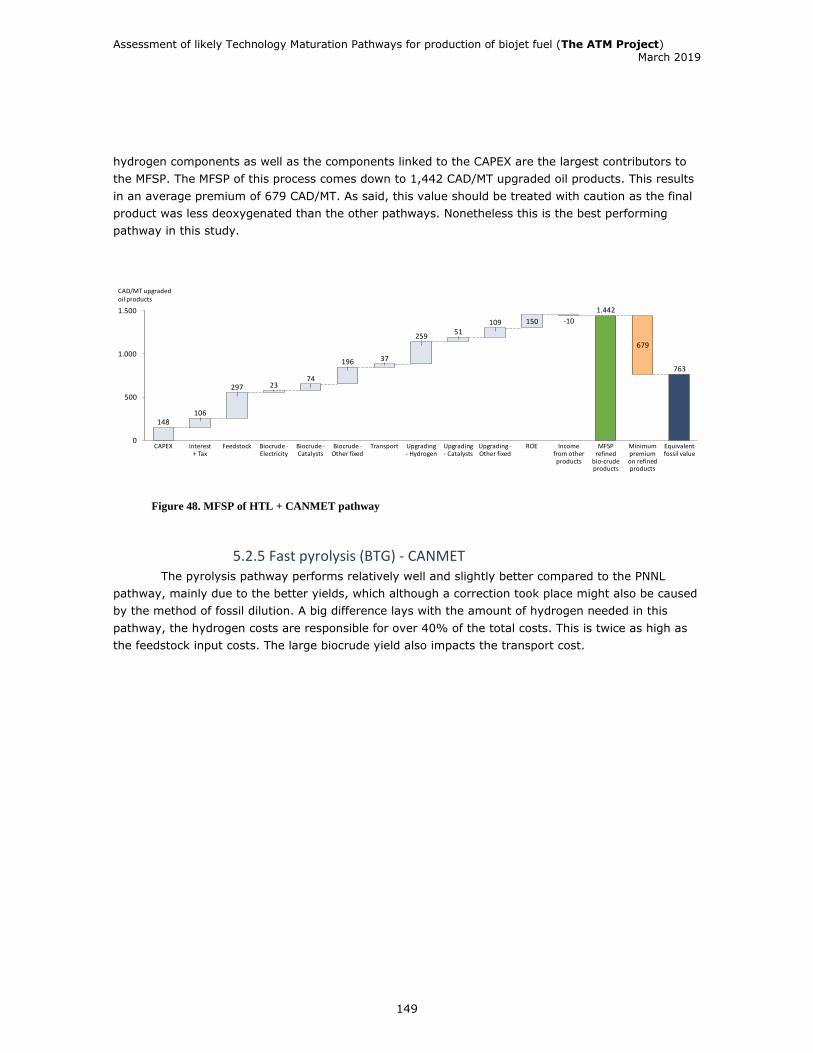
Assessment of likely Technology Maturation Pathways for production of biojet fuel (The ATM Project) March 2019
149
hydrogen components as well as the components linked to the CAPEX are the largest contributors to
the MFSP. The MFSP of this process comes down to 1,442 CAD/MT upgraded oil products. This results
in an average premium of 679 CAD/MT. As said, this value should be treated with caution as the final
product was less deoxygenated than the other pathways. Nonetheless this is the best performing
pathway in this study.
Figure 48. MFSP of HTL + CANMET pathway
5.2.5 Fast pyrolysis (BTG) - CANMET The pyrolysis pathway performs relatively well and slightly better compared to the PNNL
pathway, mainly due to the better yields, which although a correction took place might also be caused
by the method of fossil dilution. A big difference lays with the amount of hydrogen needed in this
pathway, the hydrogen costs are responsible for over 40% of the total costs. This is twice as high as
the feedstock input costs. The large biocrude yield also impacts the transport cost.
148
763
106
297 2374
196 37
25951
109 150
6791.000
500
0
1.500
Upgrading - Hydrogen
Interest + Tax
Feedstock Minimum premium on refined products
Upgrading - Catalysts
Income from other products
Biocrude -Electricity
ROE Equivalent fossil value
Biocrude -Catalysts
CAPEX Upgrading -Other fixed
1.442
Biocrude -Other fixed
MFSP refined
bio-crude products
Transport
-10
CAD/MT upgraded oil products

Assessment of likely Technology Maturation Pathways for production of biojet fuel (The ATM Project) March 2019
150
Table 78. P&L of pyrolysis (BTG) – CANMET – based on a yearly 300,000 ODT feedstock input and 64,000 MT
upgraded fuel output.
Looking at the sensitivities of the NPV we can conclude that due to the large amount of
hydrogen needed to upgrade the pyrolysis oil, the NPV is very sensitive to price changes of the
hydrogen, compared to the other pathways. Other elements such as the CAPEX and upgrading yields
show relatively similar sensitivities to the other pathways assessed.
Figure 49. NPV sensitivity of Pyrolysis (BTG)- CANMET pathway – based on a yearly 300,000 ODT feedstock
input and 64,000 MT upgraded fuel output.
The MFSP of this process comes to a total of 2,209 CAD/MT of upgraded oil product. With a
premium of approximately 3x the fossil value this is on the high end compared with other biojet
Year 0 Year 1 Year 2 Year 3 Year 4 Year 5
Revenues
Revenue from fossil products CAD - 22,606,306 45,212,612 45,212,612 45,212,612 45,212,612
Revenue from price premium on products CAD - 41,680,401 83,360,803 83,360,803 83,360,803 83,360,803
Total revenues CAD - 64,286,707 128,573,415 128,573,415 128,573,415 128,573,415
Costs
Feedstock costsFeed CAD - 10,800,000 21,600,000 21,600,000 21,600,000 21,600,000
Electricity Bio-crude CAD - 720,215 1,440,430 1,440,430 1,440,430 1,440,430
Natural gasBio-crude CAD - - - - - -
Water Bio-crude CAD - - - - - -
Catalysts Bio-crude CAD - - - - - -
Waste water treatmentBio-crude CAD - - - - - -
Other fixed costsBio-crude CAD - 10,341,956 11,143,484 11,143,484 11,143,484 11,143,484
Transport Bio-crude - Hydroupgrading CAD - 2,235,534 4,471,068 4,471,068 4,471,068 4,471,068
Hydrogen Hydroupgrading CAD - 21,015,541 42,031,081 42,031,081 42,031,081 42,031,081
Catalysts Hydroupgrading CAD - 3,589,300 3,589,300 3,589,300 3,589,300 3,589,300
Other fixed costsHydroupgrading CAD - 8,771,043 9,572,572 9,572,572 9,572,572 9,572,572
Total costs CAD - (57,473,589) (93,847,936) (93,847,936) (93,847,936) (93,847,936)
EBITDA CAD - 6,813,118 34,725,479 34,725,479 34,725,479 34,725,479
Depreciation CAD - 9,727,746 9,727,746 9,727,746 9,727,746 9,727,746
EBIT CAD - (2,914,627) 24,997,733 24,997,733 24,997,733 24,997,733
Interest CAD (4,085,653) (3,677,088) (3,268,523) (2,859,957) (2,451,392) (2,042,827)
EBT CAD (4,085,653) (6,591,715) 21,729,211 22,137,776 22,546,342 22,954,907
Taxes CAD - - (5,866,887) (5,977,200) (6,087,512) (6,197,825)
Net result CAD (4,085,653) (6,591,715) 15,862,324 16,160,577 16,458,829 16,757,082
169,364,626
100,984,427
43,518,699
84,356,485
46,958,474
-169,364,626
-100,984,427
-87,037,397
-84,356,485
-43,218,074
NPV: - 623,153,341
CAPEX bio-crude -50%+50%
Yield bio-crude +30%-30%
Hydrogen -50%+50%
CAPEX upgrading -50%+50%
Feedstock -25%+50%
max case effect on NPV
min case effect on NPV
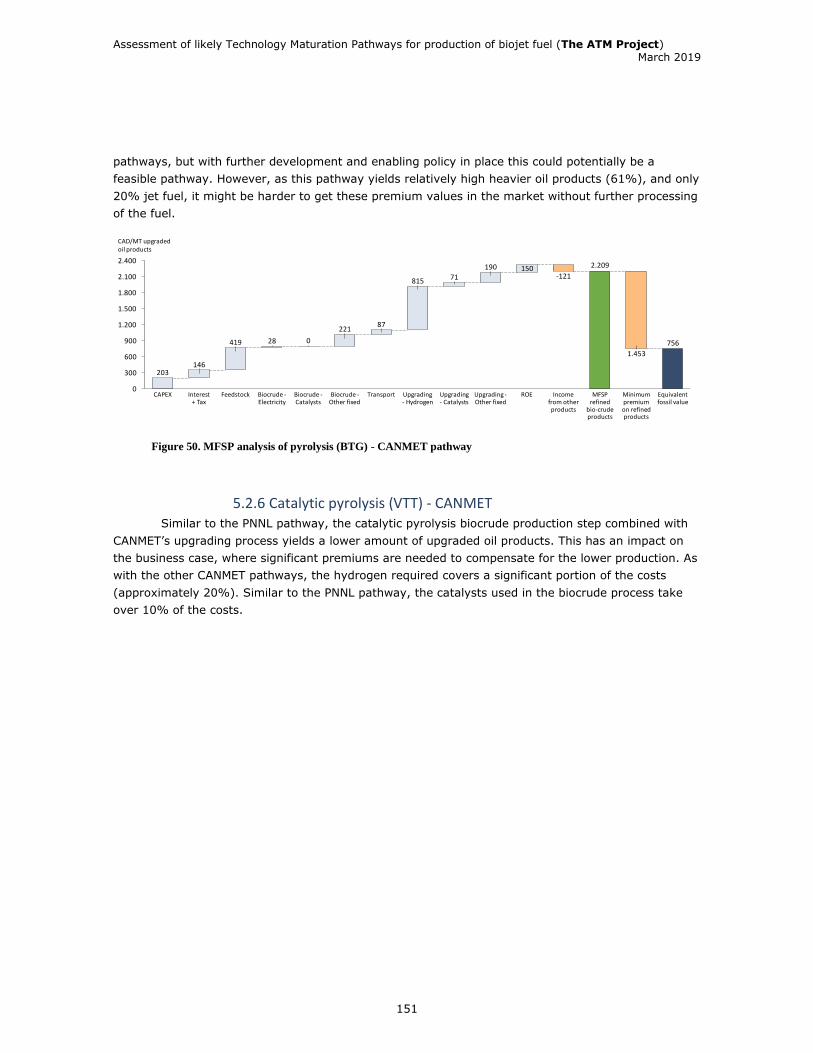
Assessment of likely Technology Maturation Pathways for production of biojet fuel (The ATM Project) March 2019
151
pathways, but with further development and enabling policy in place this could potentially be a
feasible pathway. However, as this pathway yields relatively high heavier oil products (61%), and only
20% jet fuel, it might be harder to get these premium values in the market without further processing
of the fuel.
Figure 50. MFSP analysis of pyrolysis (BTG) - CANMET pathway
5.2.6 Catalytic pyrolysis (VTT) - CANMET Similar to the PNNL pathway, the catalytic pyrolysis biocrude production step combined with
CANMET’s upgrading process yields a lower amount of upgraded oil products. This has an impact on
the business case, where significant premiums are needed to compensate for the lower production. As
with the other CANMET pathways, the hydrogen required covers a significant portion of the costs
(approximately 20%). Similar to the PNNL pathway, the catalysts used in the biocrude process take
over 10% of the costs.
203
756
146
419 28
22187
815 71
190 1502.400
2.100
0
1.500
900
300
1.200
600
1.800
Biocrude -Other fixed
Transport
2.209
CAPEX Minimum premium on refined products
1.453
Upgrading - Hydrogen
Upgrading - Catalysts
Upgrading -Other fixed
ROE
0
Biocrude -Electricity
Feedstock
-121
MFSP refined
bio-crude products
Biocrude -Catalysts
Interest + Tax
Equivalent fossil value
Income from other products
CAD/MT upgraded oil products

Assessment of likely Technology Maturation Pathways for production of biojet fuel (The ATM Project) March 2019
152
Table 79. P&L of Catalytic pyrolysis (VTT) - CANMET pathway – based on a yearly 300,000 ODT feedstock
input and 33,000 MT upgraded fuel output.
Figure 51. NPV sensitivity of Catalytic pyrolysis (VTT) - CANMET pathway – based on a yearly 300,000 ODT
feedstock input and 33,000 MT upgraded fuel output.
The overall low yield of the catalytic pyrolysis + CANMET pathway results in a MFSP per ton of
upgraded product of 2,845 CAD. This is similar but slightly better than the catalytic pyrolysis pathway
combined with the PNNL upgrading technology. Main elements of improvement are the biocrude yield
and hydrogen consumption on the upgrading side.
Year 0 Year 1 Year 2 Year 3 Year 4 Year 5
Revenues
Revenue from fossil products CAD - 11,630,645 23,261,290 23,261,290 23,261,290 23,261,290
Revenue from price premium on products CAD - 33,135,323 66,270,646 66,270,646 66,270,646 66,270,646
Total revenues CAD - 44,765,968 89,531,936 89,531,936 89,531,936 89,531,936
Costs
Feedstock costsFeed CAD - 10,800,000 21,600,000 21,600,000 21,600,000 21,600,000
Electricity Bio-crude CAD - 393,646 787,293 787,293 787,293 787,293
Natural gasBio-crude CAD - - - - - -
Water Bio-crude CAD - - - - - -
Catalysts Bio-crude CAD - 3,779,005 7,558,009 7,558,009 7,558,009 7,558,009
Waste water treatmentBio-crude CAD - - - - - -
Other fixed costsBio-crude CAD - 9,956,293 10,372,159 10,372,159 10,372,159 10,372,159
Transport Bio-crude - Hydroupgrading CAD - 626,104 1,252,208 1,252,208 1,252,208 1,252,208
Hydrogen Hydroupgrading CAD - 6,738,668 13,477,336 13,477,336 13,477,336 13,477,336
Catalysts Hydroupgrading CAD - 3,589,300 3,589,300 3,589,300 3,589,300 3,589,300
Other fixed costsHydroupgrading CAD - 4,129,015 4,544,465 4,544,465 4,544,465 4,544,465
Total costs CAD - (40,012,032) (63,180,771) (63,180,771) (63,180,771) (63,180,771)
EBITDA CAD - 4,753,936 26,351,165 26,351,165 26,351,165 26,351,165
Depreciation CAD - 7,363,329 7,363,329 7,363,329 7,363,329 7,363,329
EBIT CAD - (2,609,393) 18,987,836 18,987,836 18,987,836 18,987,836
Interest CAD (3,092,598) (2,783,338) (2,474,079) (2,164,819) (1,855,559) (1,546,299)
EBT CAD (3,092,598) (5,392,731) 16,513,757 16,823,017 17,132,277 17,441,537
Taxes CAD - - (4,458,714) (4,542,215) (4,625,715) (4,709,215)
Net result CAD (3,092,598) (5,392,731) 12,055,043 12,280,803 12,506,562 12,732,322
100,984,427
43,518,699
54,307,050
39,307,699
18,755,801
-100,984,427
-87,037,397
-54,307,050
-39,307,699
-17,012,882
NPV: - 497,113,415
CAPEX bio-crude -50%+50%
Yield bio-crude +30%-30%
Hydrogen -50%+50%
CAPEX upgrading -50%+50%
Feedstock -25%+50%
max case effect on NPV
min case effect on NPV

Assessment of likely Technology Maturation Pathways for production of biojet fuel (The ATM Project) March 2019
153
Figure 52. MFSP analysis of catalytic pyrolysis (VTT) - CANMET pathway
5.3 Review of the results When looking at the financial performance of the six pathways (Table 80 & Table 81), we can
see that the overall yield is reflected in the amount of upgraded fuel output as well as the lowest MFSP
of the pathways. What also becomes apparent is that although the catalytic pyrolysis process of VTT
has an overall yield lower than the fast pyrolysis and HTL processes, the jet output on a volume basis
is still quite substantial. This is due to the fact that the jet cut of the VTT process (considering PNNL
upgrading) yields 37% compared with 25% from BTG’s biocrude and 23% of the HTL biocrude.
A final note on these TEA results show that the HTL and BTG processes have a high CAPEX
value, for HTL due to the more expensive biocrude facility, while the BTG process and CANMET’s
process in general, is impacted by its high biocrude yield requiring a larger upgrader. This estimate is
still uncertain which needs to be considered when assessing the results (for the PNNL upgrading
process NORAM has done a Class 5 estimate with a -50% +100% uncertainty).
Table 80. PNNL pathways overview of results
Table 81. CANMET pathways overview of results
282
774
203
768 28
269
378 45
479131
165
1.000
2.000
2.500
0
500
3.000
1.500
ROECAPEX Biocrude -Other fixed
Transport Upgrading - Hydrogen
Feedstock Upgrading - Catalysts
Equivalent fossil value
Upgrading -Other fixed
2.071
150
Biocrude -Catalysts
MFSP refined
bio-crude products
Minimum premium on refined products
Biocrude -Electricity
Income from other products
Interest + Tax
2.845
-53
CAD/MT upgraded oil products
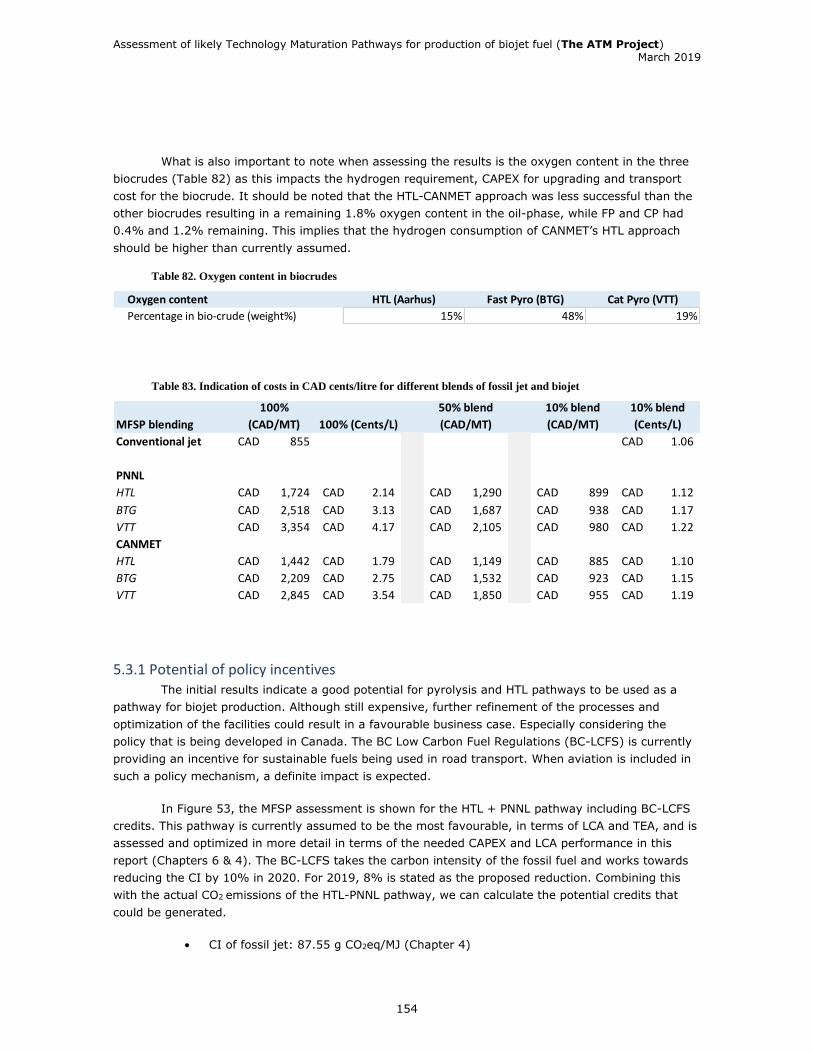
Assessment of likely Technology Maturation Pathways for production of biojet fuel (The ATM Project) March 2019
154
What is also important to note when assessing the results is the oxygen content in the three
biocrudes (Table 82) as this impacts the hydrogen requirement, CAPEX for upgrading and transport
cost for the biocrude. It should be noted that the HTL-CANMET approach was less successful than the
other biocrudes resulting in a remaining 1.8% oxygen content in the oil-phase, while FP and CP had
0.4% and 1.2% remaining. This implies that the hydrogen consumption of CANMET’s HTL approach
should be higher than currently assumed.
Table 82. Oxygen content in biocrudes
Table 83. Indication of costs in CAD cents/litre for different blends of fossil jet and biojet
5.3.1 Potential of policy incentives The initial results indicate a good potential for pyrolysis and HTL pathways to be used as a
pathway for biojet production. Although still expensive, further refinement of the processes and
optimization of the facilities could result in a favourable business case. Especially considering the
policy that is being developed in Canada. The BC Low Carbon Fuel Regulations (BC-LCFS) is currently
providing an incentive for sustainable fuels being used in road transport. When aviation is included in
such a policy mechanism, a definite impact is expected.
In Figure 53, the MFSP assessment is shown for the HTL + PNNL pathway including BC-LCFS
credits. This pathway is currently assumed to be the most favourable, in terms of LCA and TEA, and is
assessed and optimized in more detail in terms of the needed CAPEX and LCA performance in this
report (Chapters 6 & 4). The BC-LCFS takes the carbon intensity of the fossil fuel and works towards
reducing the CI by 10% in 2020. For 2019, 8% is stated as the proposed reduction. Combining this
with the actual CO2 emissions of the HTL-PNNL pathway, we can calculate the potential credits that
could be generated.
• CI of fossil jet: 87.55 g CO2eq/MJ (Chapter 4)
Oxygen content HTL (Aarhus) Fast Pyro (BTG) Cat Pyro (VTT)
Percentage in bio-crude (weight%) 15% 48% 19%
MFSP blending
100%
(CAD/MT) 100% (Cents/L)
50% blend
(CAD/MT)
10% blend
(CAD/MT)
10% blend
(Cents/L)
Conventional jet 855CAD 1.06CAD
PNNL
HTL 1,724CAD 2.14CAD 1,290CAD 899CAD 1.12CAD
BTG 2,518CAD 3.13CAD 1,687CAD 938CAD 1.17CAD
VTT 3,354CAD 4.17CAD 2,105CAD 980CAD 1.22CAD
CANMET
HTL 1,442CAD 1.79CAD 1,149CAD 885CAD 1.10CAD
BTG 2,209CAD 2.75CAD 1,532CAD 923CAD 1.15CAD
VTT 2,845CAD 3.54CAD 1,850CAD 955CAD 1.19CAD
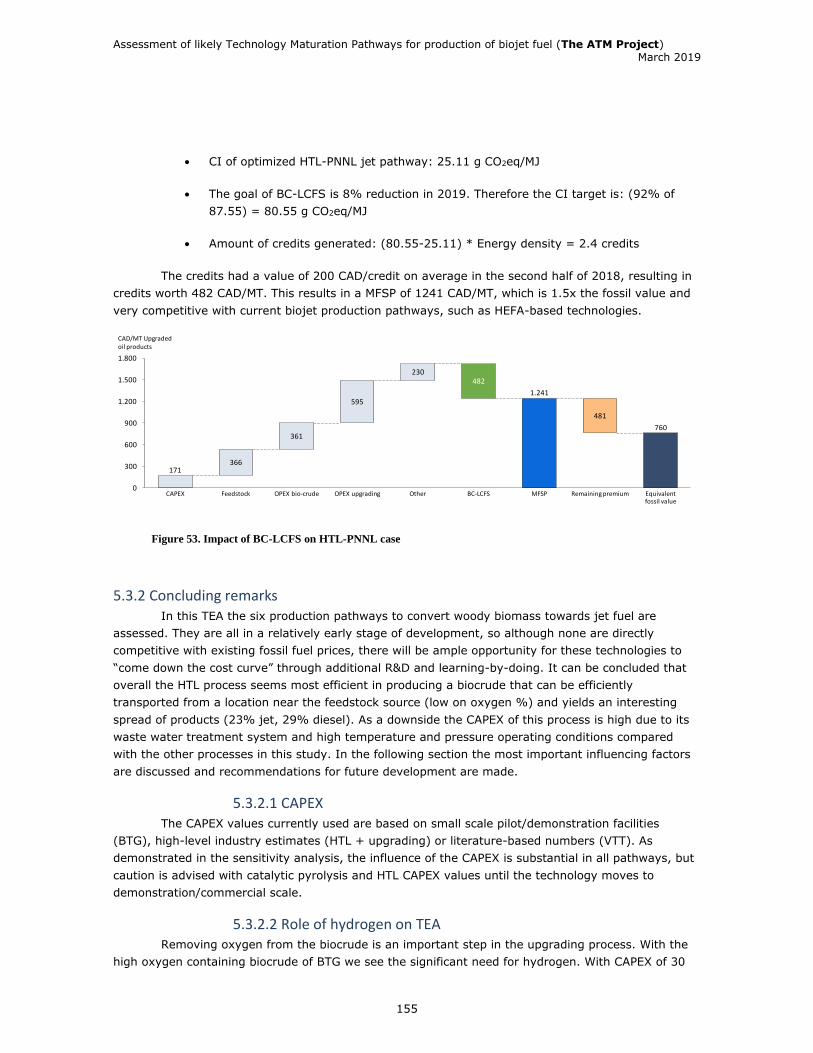
Assessment of likely Technology Maturation Pathways for production of biojet fuel (The ATM Project) March 2019
155
• CI of optimized HTL-PNNL jet pathway: 25.11 g CO2eq/MJ
• The goal of BC-LCFS is 8% reduction in 2019. Therefore the CI target is: (92% of
87.55) = 80.55 g CO2eq/MJ
• Amount of credits generated: (80.55-25.11) * Energy density = 2.4 credits
The credits had a value of 200 CAD/credit on average in the second half of 2018, resulting in
credits worth 482 CAD/MT. This results in a MFSP of 1241 CAD/MT, which is 1.5x the fossil value and
very competitive with current biojet production pathways, such as HEFA-based technologies.
Figure 53. Impact of BC-LCFS on HTL-PNNL case
5.3.2 Concluding remarks In this TEA the six production pathways to convert woody biomass towards jet fuel are
assessed. They are all in a relatively early stage of development, so although none are directly
competitive with existing fossil fuel prices, there will be ample opportunity for these technologies to
“come down the cost curve” through additional R&D and learning-by-doing. It can be concluded that
overall the HTL process seems most efficient in producing a biocrude that can be efficiently
transported from a location near the feedstock source (low on oxygen %) and yields an interesting
spread of products (23% jet, 29% diesel). As a downside the CAPEX of this process is high due to its
waste water treatment system and high temperature and pressure operating conditions compared
with the other processes in this study. In the following section the most important influencing factors
are discussed and recommendations for future development are made.
5.3.2.1 CAPEX The CAPEX values currently used are based on small scale pilot/demonstration facilities
(BTG), high-level industry estimates (HTL + upgrading) or literature-based numbers (VTT). As
demonstrated in the sensitivity analysis, the influence of the CAPEX is substantial in all pathways, but
caution is advised with catalytic pyrolysis and HTL CAPEX values until the technology moves to
demonstration/commercial scale.
5.3.2.2 Role of hydrogen on TEA Removing oxygen from the biocrude is an important step in the upgrading process. With the
high oxygen containing biocrude of BTG we see the significant need for hydrogen. With CAPEX of 30
171
760
366
361
595
230482
481
1.200
1.500
0
300
600
900
1.800
CAPEX Feedstock OPEX bio-crude OPEX upgrading Other Remaining premium Equivalent fossil value
MFSP
1.241
BC-LCFS
CAD/MT Upgraded oil products

Assessment of likely Technology Maturation Pathways for production of biojet fuel (The ATM Project) March 2019
156
MCAD and 42 MCAD for the PNNL and CANMET upgrading processes, this has a significant impact on
the overall financial performance of these pathways. We assumed the use of a steam methane
reforming (SMR) process for hydrogen production, which uses natural gas as input and influences the
LCA performance (Chapter 4). Looking at the future, the development of electrolysis in combination
with large scale implementation of low-cost sustainable electricity (<3 CAD/kWh) might be a game
changer for these pathways, both in terms of economics as well as LCA.
5.3.2.3 Hydrotreatment and potential of co-processing in an existing refinery
During the assessment of the various pathways, the successful removal of oxygen and
upgrading towards the right jet specifications was in some cases challenging. To reach the right jet
fuel characteristics and work towards a better techno-economic performance, an alternative approach
which could be considered is to perform a lighter (dedicated) hydrotreatment step to upgrade the
biocrude up to a level where it could be co-processed in existing fossil refinery infrastructure. In this
case significant investments in new infrastructure could be avoided. It would be very interesting for
future projects to specifically assess this pathway in more detail, as there is (over)capacity in fossil
refineries. Making them ready for new feedstocks such as biocrudes might be beneficial on multiple
fronts.

Assessment of likely Technology Maturation Pathways for production of biojet fuel (The ATM Project) March 2019
157
CHAPTER 6 – POTENTIAL FEASIBILITY OF ESTABLISHING A DEMONSTRATION SCALE PRODUCTION AND UPGRADING FACILITY IN BRITISH COLUMBIA
6.1 Background and design guidelines The purpose of this part of the ATM project was to conduct a preliminary engineering
assessment (or “scoping study”) for a demonstration-scale facility to produce bio-jet from
lignocellulosic feedstock via one of the processing routes identified in the GARDN ATM project. This
study includes a block diagram, preliminary flow sheets, a capital cost estimate, and an assessment of
the engineering uncertainty and challenges.
The ATM project consortium agreed to the following design guidelines for the demonstration
facility:
• Processing capacity of 200 bbl/d biocrude;
• Located in BC, Canada;
• Chosen technology - sub-critical hydrothermal liquefaction (HTL) for biocrude
production according to the method practiced at the Aarhus University pilot plant;
• Catalytic hydrotreating of the HTL biocrude on a solid catalyst without dilution
according to the method practiced by the Pacific Northwest National Laboratory
(PNNL) and CanmetENERGY;
• Inclusion of auxiliary operations (e.g. gas processing, hydrogen production,
wastewater treatment), as required;
• Co-location with existing facilities, e.g. petroleum refinery, where appropriate and
reasonable.
Flow sheets were developed for a 200 bbl/d technology demonstration, including facilities for
biocrude production by subcritical hydrothermal liquefaction (HTL), HTL wastewater treatment by
anaerobic and aerobic biological treatment, and biocrude upgrading by hydrotreatment. The 200 bbl/d
technology demonstration plant could produce enough jet fuel for up to 10 medium-haul flights per
day as a 10% blend.
The HTL production facility and associated wastewater treatment plant were assumed to be
greenfield developments located in Prince George, BC, Canada, with permits to discharge pre-treated
wastewater to the municipal sanitary sewer.

Assessment of likely Technology Maturation Pathways for production of biojet fuel (The ATM Project) March 2019
158
Figure 54 Simplified block diagram for the hydrothermal liquefaction facility design
The biocrude upgrading facility is assumed to be co-located with an existing petroleum
refinery in the Lower Mainland region of BC, Canada. This is so the plant can “piggyback” on the
various utilities and operations already available at a refinery, such as fractionation columns, a
catalytic cracker, hydrogen supply, cooling water, sour water treatment, sour gas treatment, product
distribution network, etc. This allows the new technology to be demonstrated at a fraction of the cost
of installing all of these services separately.

Assessment of likely Technology Maturation Pathways for production of biojet fuel (The ATM Project) March 2019
159
Figure 55. Simplified block diagram showing the upgrading facility design
The installed fixed capital cost of a 200 bbl/d technology demonstration project is estimated
to be 62 M CAD (2018). This Class 5 (-50%/+100%) estimate was made using a factored equipment
cost approach, and includes major equipment, equipment erection, piping, instrumentation, electrical,
buildings, basic site development, design and engineering, and a 10% contingency. It also includes
the cost of installing utilities (cooling water, steam, electrical) at the Prince George locations, but not
at the upgrading facility, as it is assumed that utilities will already exist at the chosen site. Upgrading
wastewater treatment is excluded on the assumption that no modification to the existing refinery’s
wastewater system is required.
Future engineering development work on HTL (further expanded in Table 79) should focus on
the following uncertainties: gas and aqueous yields and compositions after reaching steady state with
recycled water; heat transfer properties (thermal conductivity, viscosity, etc.) of the HTL slurry feed at
high temperatures and pressures; testing on actual forestry residue; and wastewater treatment.
Future engineering development work on upgrading should focus on the following uncertainties:
catalyst type, physical arrangement, and lifetime; and recycling of gas oil back to the hydrotreater.
The overall mass and carbon balances for the demonstration-scale flow sheet are summarized
in Table 84, and represented graphically in Figure 56. In total, 53% of the carbon in the feed forestry
residue reports to liquid fuel products (jet, naphtha, and gas oil), 33% reports to fuel gases that can
be burned on site for energy (but not easily transported), and the remainder reports to residues and
waste water.
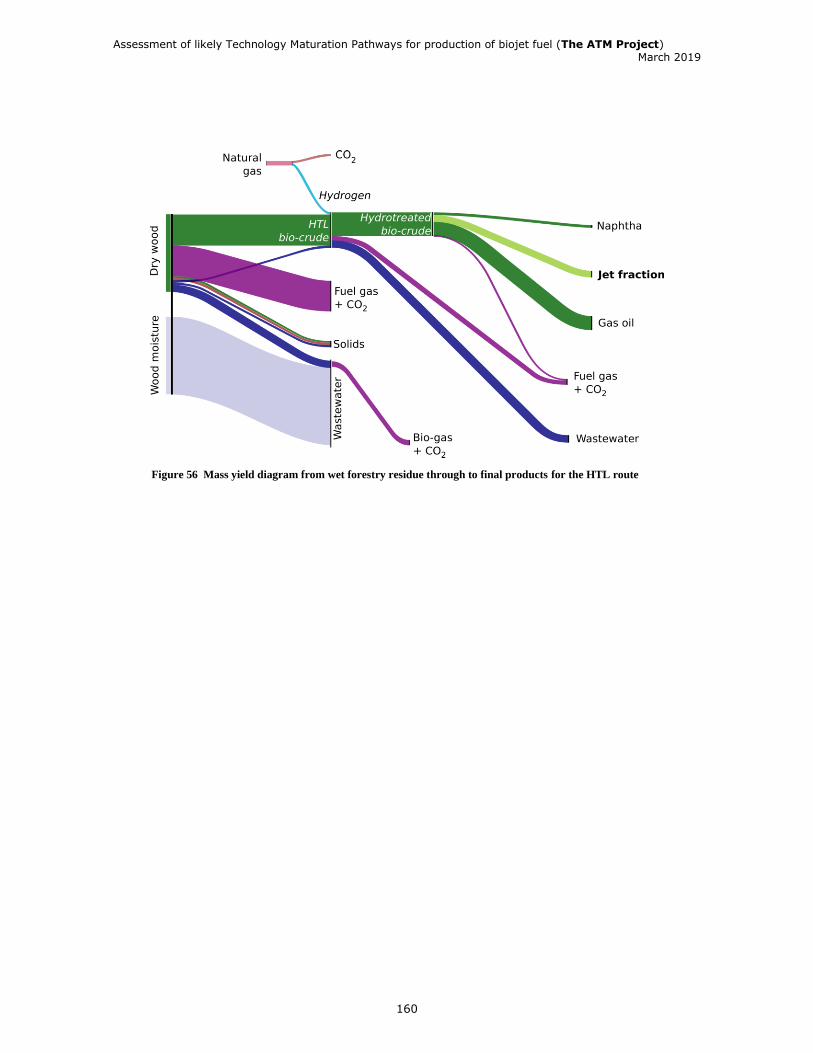
Assessment of likely Technology Maturation Pathways for production of biojet fuel (The ATM Project) March 2019
160
Figure 56 Mass yield diagram from wet forestry residue through to final products for the HTL route

Assessment of likely Technology Maturation Pathways for production of biojet fuel (The ATM Project) March 2019
161
Table 84 Overall process mass and carbon balance for a 200 bbl/d technology demonstration
Table 85 shows the overall Class 5 cost estimate for a complete 200 bbl/d HTL production and
upgrading facility, including wastewater treatment.
Table 85. Overall Class 5 (-50%/+100%) cost estimate for a complete 200 bbl/d HTL biocrude production,
upgrading, and wastewater treatment demonstration project (M CAD)
Mass balance
(kg/h)
Carbon balance
(kg/h)
Input Output Input Output Notes
Location 1: HTL biocrude production and wastewater treatment
Forestry waste (wet) 7005 1783 50% moisture
Combustion oxygen 570
Biocrude 1549 1116
Solids / char 213 111
Fuel gas 2085 443 Combusted to provide heat
Bio-gas 149 77 22 MJ/kg
Pre-treated
wastewater + sludge
3577 35
Total* 7575 7573 1783 1782
Location 2: Biocrude upgrading
Biocrude 1549 1116
Hydrogen 115 -
Jet fraction 307 266
Fuel gas 209 149
Naphtha fraction 125 106
Gas oil fraction 638 575
Solids / char 39 11
Pre-treated
wastewater + sludge
341 9
Total* 1664 1659 1116 1116
* Stream compositions were based on actual sample analysis from the GARDN ATM project, and
the mass balance was closed using a “carbon tie.” As a result, the overall mass balance may
not close perfectly for all operations.
Area
Equipment
cost (M CAD)
Avg. installation
factor
Installed cost
(M CAD)
Hydrothermal liquefaction 2.3 4.9 11.2
HTL wastewater treatment 9.8 2.9† 28.4
Biocrude upgrading 3.6 4.0 14.4
Biocrude upgrading wastewater treatment* - - -
Hydrogen production 1.9 4.0 7.6
Total 61.6
* Biocrude upgrading wastewater treatment is assumed to rely on existing refinery infrastructure for
the 200 bbl/d demonstration plant. Therefore no additional capital expenditure is required. A full-
scale, independent facility would require the construction of a wastewater treatment plant.
† A lower installation factor is used for wastewater treatment because the equipment price shown is
for a quoted package system, which as a pre-engineered system is generally less costly to engineer
and install than a comparable custom-designed system.

Assessment of likely Technology Maturation Pathways for production of biojet fuel (The ATM Project) March 2019
162
6.2 Discussion
6.2.1 Analysis of capital cost Roughly half of the estimated installed capital cost for a 200 bbl/d technology demonstration
is for an HTL wastewater treatment plant by anaerobic and aerobic biological treatment. Although the
relative cost of wastewater treatment should decline with scale, it is nevertheless clear that it will be a
costly component of the overall process. The cost reflects the very high BOD loading of this waste
stream compared to a typical wastewater treatment application and serves to emphasize that
wastewater processing will be a major challenge for the HTL technology. It also highlights the
importance of focusing research and development on this area, since any reduction in wastewater
loading, whether through improved biocrude or gas yields, precipitation as solid residue, the recovery
of byproducts, or the application of an innovative technology like catalytic hydrothermal gasification
(CHG), could have an immense impact on the economic viability of the overall process.
The cost of the HTL portion may be underestimated because it does not account for the
inevitable challenges that accompany the first trial of a new technology. In particular, it may be
necessary to add or replace equipment for inline solids filtration and phase separation, since
continuous systems for these steps have not received much attention so far in pilot testing. It may
also be necessary to add a process to purify the fuel gas or bio-gas, depending on the requirements of
the fired heater and the composition of the gas, which is yet to be confirmed.
The capital costs of biocrude upgrading and hydrogen production can be viewed with
somewhat more confidence because these operations are based on well-understood operations from
the petroleum industry. The main uncertainties can be considered operational costs, such as catalyst
regeneration and replacement. However, the cost will likely be higher than forecast if there are other
operational requirements that have not been considered here, such as feed flexibility (e.g. pyrolysis
oil, other biocrudes).
6.2.2 Integration at a Canadian airport The 200 bbl/d technology demonstration facility described in this report is capable of
producing enough jet fuel for up to 10 medium-haul flights per day as a 10% blend.27 The fuel could
be transported to the airport using the same infrastructure currently in use, directly from the
upgrading facility. This volume of fuel could easily be consumed by domestic flights from the
Vancouver airport. The bio-jet could also be blended at a lower or higher fraction, as regulations and
testing requirements dictate.
6.2.3 Scientific and engineering challenges The 200 bbl/d technology demonstration described in this report is ambitious and complex.
Neither HTL production or biocrude upgrading have previously been demonstrated on this scale, with
the HTL technology in particular still in the earliest stages of commercial development. This adds
significant risk and uncertainty to the proposed technology demonstration.
The flow sheets for this project were constructed by relying on a number of critical
assumptions, some of which could have a major impact on the outcome. Before proceeding to a 200
bbl/d technology demonstration, NORAM strongly recommends validating these assumptions in the
laboratory, and preferably also in targeted pilot testing. A non-exhaustive list of outstanding gaps and
27 Assuming 7400 kg/d jet fuel production, 2700 km flight distance, and 2.75 kg per km fuel burn. This is approximately equivalent to
a flight between Calgary and Toronto on a new, efficient plane. Assumes 100% operational uptime with 24/7 operation. Actual
production will be lower.
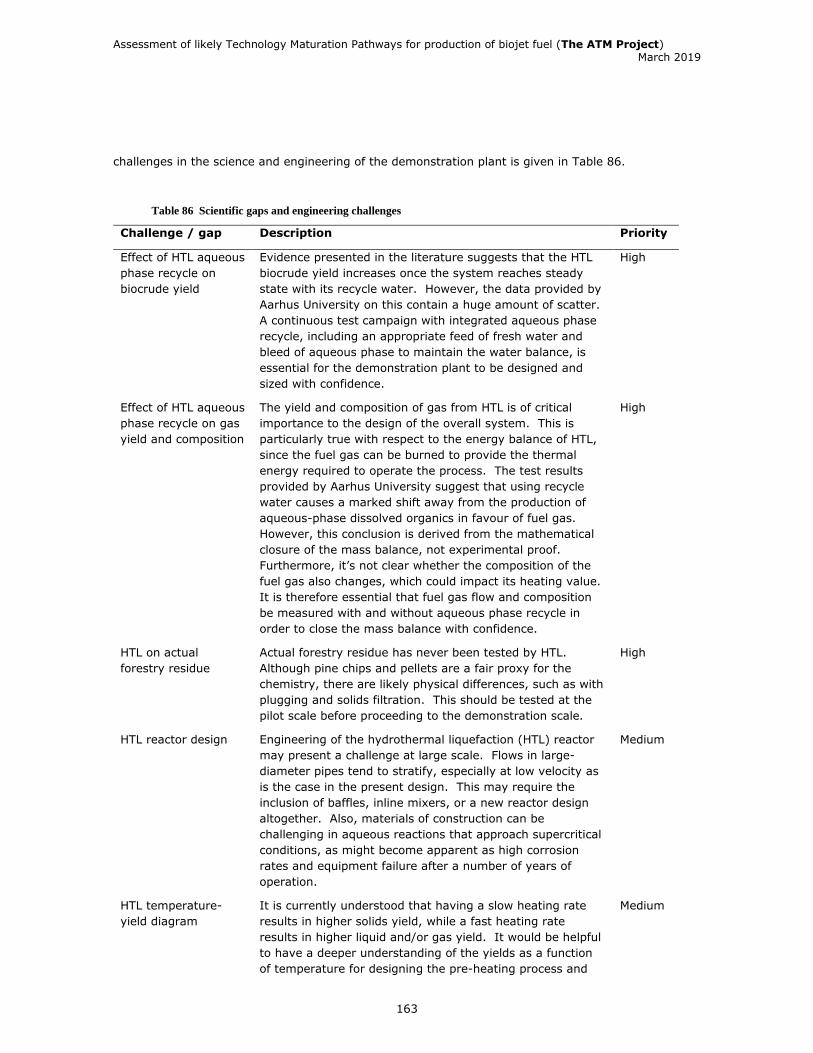
Assessment of likely Technology Maturation Pathways for production of biojet fuel (The ATM Project) March 2019
163
challenges in the science and engineering of the demonstration plant is given in Table 86.
Table 86 Scientific gaps and engineering challenges
Challenge / gap Description Priority
Effect of HTL aqueous
phase recycle on
biocrude yield
Evidence presented in the literature suggests that the HTL
biocrude yield increases once the system reaches steady
state with its recycle water. However, the data provided by
Aarhus University on this contain a huge amount of scatter.
A continuous test campaign with integrated aqueous phase
recycle, including an appropriate feed of fresh water and
bleed of aqueous phase to maintain the water balance, is
essential for the demonstration plant to be designed and
sized with confidence.
High
Effect of HTL aqueous
phase recycle on gas
yield and composition
The yield and composition of gas from HTL is of critical
importance to the design of the overall system. This is
particularly true with respect to the energy balance of HTL,
since the fuel gas can be burned to provide the thermal
energy required to operate the process. The test results
provided by Aarhus University suggest that using recycle
water causes a marked shift away from the production of
aqueous-phase dissolved organics in favour of fuel gas.
However, this conclusion is derived from the mathematical
closure of the mass balance, not experimental proof.
Furthermore, it’s not clear whether the composition of the
fuel gas also changes, which could impact its heating value.
It is therefore essential that fuel gas flow and composition
be measured with and without aqueous phase recycle in
order to close the mass balance with confidence.
High
HTL on actual
forestry residue
Actual forestry residue has never been tested by HTL.
Although pine chips and pellets are a fair proxy for the
chemistry, there are likely physical differences, such as with
plugging and solids filtration. This should be tested at the
pilot scale before proceeding to the demonstration scale.
High
HTL reactor design Engineering of the hydrothermal liquefaction (HTL) reactor
may present a challenge at large scale. Flows in large-
diameter pipes tend to stratify, especially at low velocity as
is the case in the present design. This may require the
inclusion of baffles, inline mixers, or a new reactor design
altogether. Also, materials of construction can be
challenging in aqueous reactions that approach supercritical
conditions, as might become apparent as high corrosion
rates and equipment failure after a number of years of
operation.
Medium
HTL temperature-
yield diagram
It is currently understood that having a slow heating rate
results in higher solids yield, while a fast heating rate
results in higher liquid and/or gas yield. It would be helpful
to have a deeper understanding of the yields as a function
of temperature for designing the pre-heating process and
Medium
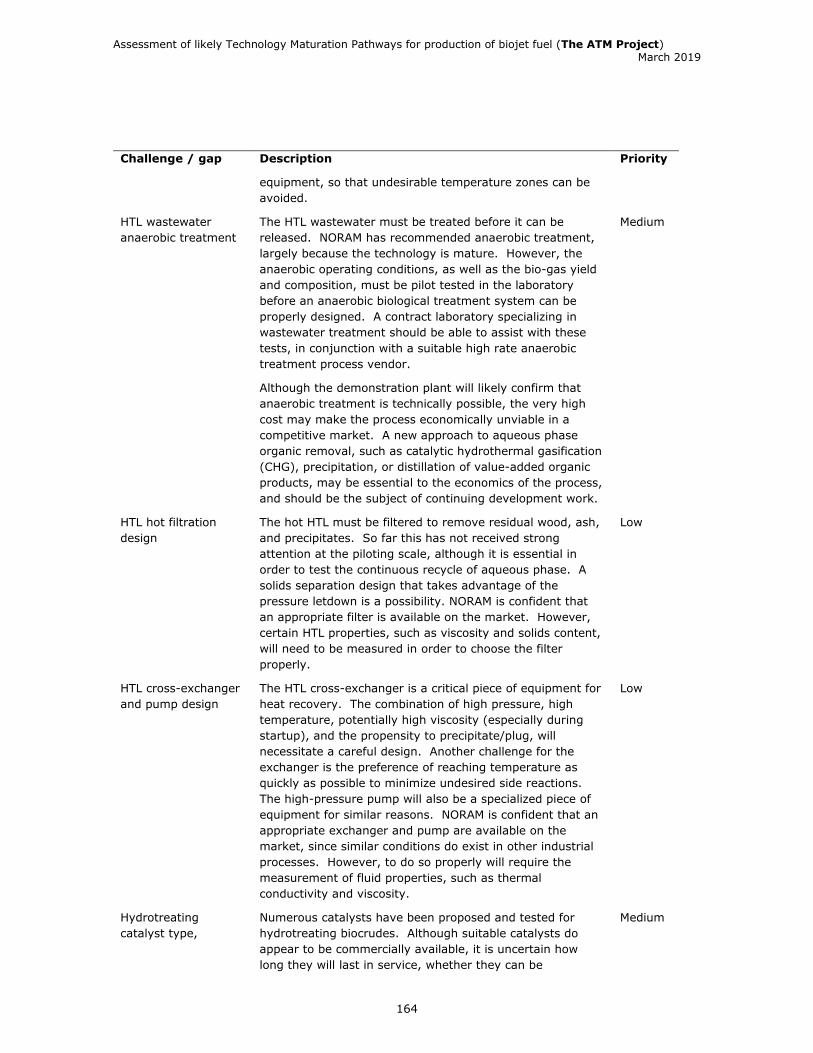
Assessment of likely Technology Maturation Pathways for production of biojet fuel (The ATM Project) March 2019
164
Challenge / gap Description Priority
equipment, so that undesirable temperature zones can be
avoided.
HTL wastewater
anaerobic treatment
The HTL wastewater must be treated before it can be
released. NORAM has recommended anaerobic treatment,
largely because the technology is mature. However, the
anaerobic operating conditions, as well as the bio-gas yield
and composition, must be pilot tested in the laboratory
before an anaerobic biological treatment system can be
properly designed. A contract laboratory specializing in
wastewater treatment should be able to assist with these
tests, in conjunction with a suitable high rate anaerobic
treatment process vendor.
Although the demonstration plant will likely confirm that
anaerobic treatment is technically possible, the very high
cost may make the process economically unviable in a
competitive market. A new approach to aqueous phase
organic removal, such as catalytic hydrothermal gasification
(CHG), precipitation, or distillation of value-added organic
products, may be essential to the economics of the process,
and should be the subject of continuing development work.
Medium
HTL hot filtration
design
The hot HTL must be filtered to remove residual wood, ash,
and precipitates. So far this has not received strong
attention at the piloting scale, although it is essential in
order to test the continuous recycle of aqueous phase. A
solids separation design that takes advantage of the
pressure letdown is a possibility. NORAM is confident that
an appropriate filter is available on the market. However,
certain HTL properties, such as viscosity and solids content,
will need to be measured in order to choose the filter
properly.
Low
HTL cross-exchanger
and pump design
The HTL cross-exchanger is a critical piece of equipment for
heat recovery. The combination of high pressure, high
temperature, potentially high viscosity (especially during
startup), and the propensity to precipitate/plug, will
necessitate a careful design. Another challenge for the
exchanger is the preference of reaching temperature as
quickly as possible to minimize undesired side reactions.
The high-pressure pump will also be a specialized piece of
equipment for similar reasons. NORAM is confident that an
appropriate exchanger and pump are available on the
market, since similar conditions do exist in other industrial
processes. However, to do so properly will require the
measurement of fluid properties, such as thermal
conductivity and viscosity.
Low
Hydrotreating
catalyst type,
Numerous catalysts have been proposed and tested for
hydrotreating biocrudes. Although suitable catalysts do
appear to be commercially available, it is uncertain how
long they will last in service, whether they can be
Medium
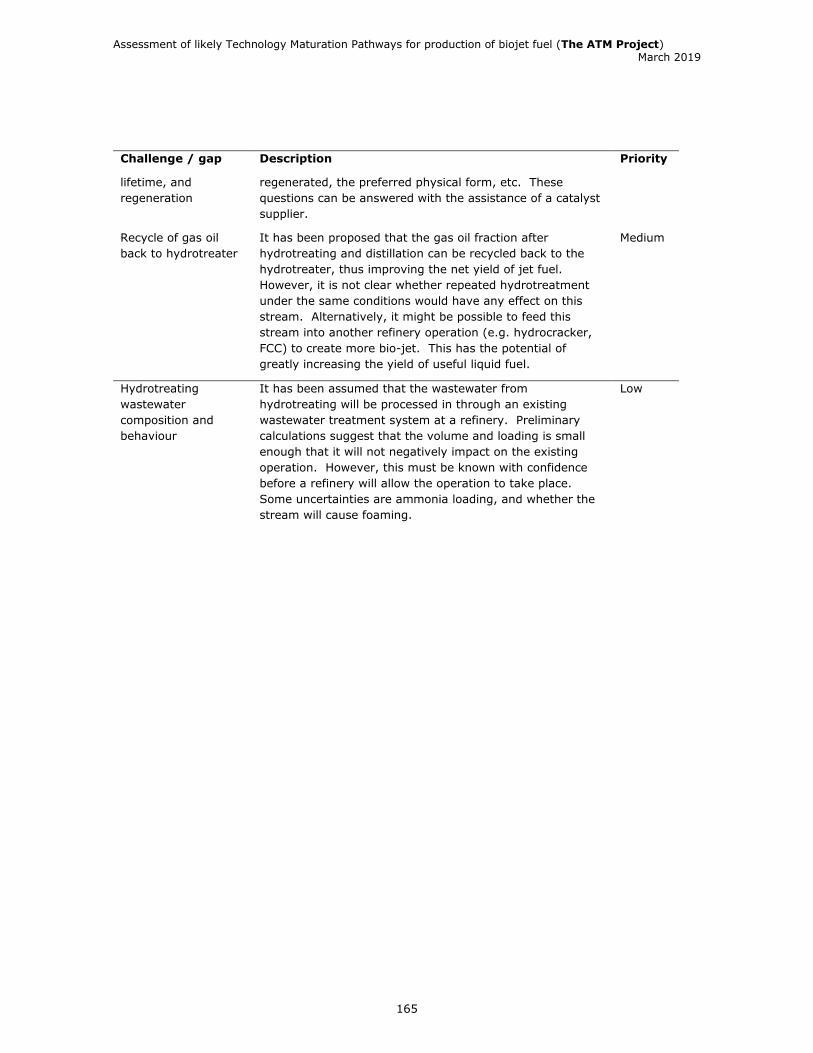
Assessment of likely Technology Maturation Pathways for production of biojet fuel (The ATM Project) March 2019
165
Challenge / gap Description Priority
lifetime, and
regeneration
regenerated, the preferred physical form, etc. These
questions can be answered with the assistance of a catalyst
supplier.
Recycle of gas oil
back to hydrotreater
It has been proposed that the gas oil fraction after
hydrotreating and distillation can be recycled back to the
hydrotreater, thus improving the net yield of jet fuel.
However, it is not clear whether repeated hydrotreatment
under the same conditions would have any effect on this
stream. Alternatively, it might be possible to feed this
stream into another refinery operation (e.g. hydrocracker,
FCC) to create more bio-jet. This has the potential of
greatly increasing the yield of useful liquid fuel.
Medium
Hydrotreating
wastewater
composition and
behaviour
It has been assumed that the wastewater from
hydrotreating will be processed in through an existing
wastewater treatment system at a refinery. Preliminary
calculations suggest that the volume and loading is small
enough that it will not negatively impact on the existing
operation. However, this must be known with confidence
before a refinery will allow the operation to take place.
Some uncertainties are ammonia loading, and whether the
stream will cause foaming.
Low

Assessment of likely Technology Maturation Pathways for production of biojet fuel (The ATM Project) March 2019
166
CHAPTER 7 – THE POLICY ENVIRONMENT AND POLICY RECOMMENDATIONS
The ATM Project specifically targets the production of biojet fuels that can be used in the
aviation sector to reduce emissions. The focus of this policy section is therefore primarily concerned
with aviation and the use of policies to promote the production and usage of biojet fuels in this sector.
Policies that are generally used to promote all types of biofuels will be briefly discussed.
Chapter 1 gave an overview of the aviation sector and the rationale behind emission reduction
targets and the essential role of biojet fuels to achieve these objectives. The results from this study
(Chapter 4) demonstrated that very high emission reductions (between 50-80%) could be achieved
based on the feedstock and technology pathways considered in this project. However, compared to
the current price of conventional jet fuel, biojet fuel via this technology route will only be economical
to produce if a significant premium is paid for the biojet. Arguably, the key to bridging the gap
between conventional jet and biojet is the right type of policies.
The International Energy Agency has shown that subsidization of fossil fuels is quite
significant and that one of the first ways to create a level playing field is the removal of such
subsidies. The IEA calculated that annual subsidies to fossil fuels amounted to over $300 billion dollars
in 2017 28.
The next important approach is putting a price on carbon in the form of a carbon tax or
similar mechanism such as an emissions trading scheme, cap and trade scheme or carbon offset
mechanisms, etc. The impact of this price on the negative externalities of emissions depend on the
price placed on emissions. It should be high enough to modify behavior and motivate companies to
reduce emissions through technology, optimization or any other suitable measures. While many
believe that a price on carbon alone will be sufficient for all sectors, this is not considered by all to be
effective in the transportation sector where policy measures such as low carbon fuel standards are
more appropriate. Offsets may be cheaper than technology required to bring about real change in the
aviation sector. However, limited availability of offsets and limited “real” impact of such offsets
requires that technologies for biojet production be developed and commercialized if long-term
emission reductions are to be achieved.
This section will briefly look at existing policy measures for promoting the production and
consumption of biojet fuel, additional policies that can be considered and recommendations based on
this project. Firstly we have to look at the unique context of the aviation sector and its implications for
policies and regulations.
7.1 Aviation perspective Emissions from aviation, although only 3% of total global emissions, are considered a
significant problem due to the fast growth of the industry and the inevitable increase in emissions to
2050. It is also recognized that biojet fuels will be essential for reducing emissions in this sector.
However, the sector falls under the jurisdiction of the International Civil Aviation Organisation (ICAO)
28 https://www.iea.org/newsroom/news/2018/october/hard-earned-reforms-to-fossil-fuel-subsidies-are-coming-under-threat.html

Assessment of likely Technology Maturation Pathways for production of biojet fuel (The ATM Project) March 2019
167
and did not form part of the Paris agreement on emission reductions. ICAO is expected to agree to
their own targets and mechanisms for decreasing emissions in this sector. The sector previously had
set their own voluntary targets for reductions in emissions, including carbon neutral growth by 2020
and a 50% reduction by 2050. The agreement on the Carbon Offsetting and Reduction Scheme in
International Aviation (CORSIA) was a significant step in the sector to formally regulate emissions
from aviation.
The jurisdiction of ICAO is limited to international aviation and this essentially creates two
systems of regulating emissions from aviation. On the one hand, domestic flights within a country fall
under national regulation by each country and through signing the Paris agreement, countries have
undertaken to address these emissions. Included in domestic emissions are the take off and landing
emissions that take place within a certain distance from an airport, even when an international flight.
On the other hand, emissions from international aviation fall under ICAO and is regulated by
agreements at this level. At national level, further differences could apply between provinces, for
example British Columbia applies a carbon tax to internal flights but not to interprovincial flights. This
creates increased complexity for airlines, but also makes a systematic approach to emission reduction
challenging for the policy maker in the aviation sector.
Any policy recommendations must take into account these tiers of policy and regulations, how
they interact and whether they achieve the desired objective – to incentivize the production and
consumption of biojet fuels and achieve emission reductions in the aviation sector.
7.2 Policy at international level and likely effectiveness for achieving objectives In 2016, the International Civil Aviation Organization (ICAO) adopted the Carbon Offsetting
and Reduction Scheme for International Aviation (CORSIA) to address CO2 emissions from
international aviation. CORSIA aims to stabilize net CO2 emissions from international civil aviation at
2020 levels in line with previous targets. The aviation sector is committed to advances in technology,
operations and infrastructure to continue to reduce the sector’s carbon emissions and offsetting is not
intended to replace these efforts.
CORSIA is intended to complement emissions reduction initiatives within the aviation sector.
The sector is committed to reduce its net CO2 emissions to half of what they were in 2005, by 2050
and this will require continued investment in new technologies and strong support mechanisms for the
deployment of sustainable aviation fuels.
Offsets can take the form of projects for wind energy, clean cook stove, methane capture and
other emissions-reducing or avoidance projects. To ensure the environmental integrity of CORSIA,
ICAO will adopt a list of emissions units that can be used for compliance. It is estimated that CORSIA
will mitigate around 2.5 billion tonnes of CO2 between 2021 and 2035.
How does CORSIA promote the production and consumption of biojet fuels? Will this be
sufficient to set up the long-term development of biojet fuels for the aviation sector? ICAO’s
Alternative Fuels Task Force (AFTF) is in the process of determining how an airline can reduce their
offsetting requirements under CORSIA through the use of sustainable alternative fuels. Emission
credits could potentially be generated by sustainable alternative fuels projects and the credits used
under CORSIA. However, CORSIA alone will not be sufficient to promote production and use of
sustainable aviation fuels as indicated in the following statement from Michael Gill, IATA Director

Assessment of likely Technology Maturation Pathways for production of biojet fuel (The ATM Project) March 2019
168
Aviation Environment29:
“The next step is to move into large-scale production in order to create a lasting and
increasing reduction in aviation’s carbon emissions. This is where public policy becomes crucial.
Biofuels for the automotive sector have long received encouragement or even outright subsidy from
the public sector to incentivise production. It is now high time that SAF is put on the same pedestal.
This is all the more crucial as aviation, unlike automotive, has no alternative to liquid-energy fuels in
the short-medium term. Hitherto, fuel refiners have not had sufficient incentive to generate aviation
fuels at price levels the industry could afford. Why should they, when the policies encouraged them to
go for automotive biofuels? Slowly, this is changing. In the United States, policies exist to ensure that
a proportion of alternative fuels refined must be for aviation use. And in Europe, the Renewable
Energy Directive is being revised. Already the European Parliament has indicated that aviation biofuels
should be encouraged. Now we’re urging the European Commission and the European Council to agree
to this enhancement.
• In addition, globally we are calling for measures including:
• Implementing the policy to de-risk investments into SAF production plants, including
loan guarantees and capital grants for production facilities;
• Support for brokering aviation off-take agreements;
• Support for SAF demonstration plants and supply chain research and development;
• Tax incentives for public-private partnerships for early-stage plant development and;
• Developing a harmonised transport and energy policy including inter-department
coordination, such as agriculture, transport, energy and military.” (Michael Gill, IATA
Director Aviation Environment)30
Thus, there seems to be a clear acknowledgement that policies at national level should
support development of biojet fuels, which has not been the case in the past. However, some
jurisdictions are finding policy solutions for promoting biojet fuels.
7.3 Policy at national level and likely effectiveness for achieving objectives Policy support for biofuels have been used for decades. This has included volumetric
mandates, loan guarantees, producer incentives, etc. More recently, low carbon fuel standards, linking
incentives with emission reductions and penalizing failure to meet reduction targets, have been used
in jurisdictions such as California and British Columbia. Germany also introduced legislation for specific
emission reduction targets for fossil fuels, with blending of biofuels one way of achieving these
targets.
Canada currently has renewable fuel regulations that require fuel producers and importers to
have an average renewable fuel content of 5% (gasoline) and 2% (diesel and heating distillate oil).
Provinces can introduce higher blend levels and this is done in many cases. Importantly, kerosene and
aviation has never been part of these regulations.
More recently, the federal government has proposed a Federal Clean Fuel Standard with a far
greater scope. We will briefly look at the proposed CFS and then discuss its potential impact on
29 https://www.openaccessgovernment.org/sustainable-aviation-fuels-the-next-frontier-for-air-transport/44547/ 30 https://www.openaccessgovernment.org/sustainable-aviation-fuels-the-next-frontier-for-air-transport/44547/

Assessment of likely Technology Maturation Pathways for production of biojet fuel (The ATM Project) March 2019
169
aviation.
7.3.1 Federal Clean Fuel Standard The Government of Canada announced in late 2016 that it would consult with provinces and
territories, Indigenous peoples, industries, and non-governmental organizations to develop a Clean
Fuel Standard to reduce Canada’s greenhouse gas emissions (GHG) through the increased use of
lower carbon fuels, energy sources and technologies. The intent is that the Clean Fuel Standard would
be a performance-based approach that would incent the use of a broad range of low carbon fuels,
energy sources and technologies, such as electricity, hydrogen, and renewable fuels, including
renewable natural gas. It would establish lifecycle carbon intensity requirements separately for liquid,
gaseous and solid fuels, and would go beyond transportation fuels to include those used in industry
and buildings. The approach would not differentiate between crude oil types produced in Canada or
imported. The Clean Fuel Standard would complement the pan-Canadian approach to pricing carbon
pollution. The objective of the Clean Fuel Standard is to achieve 30 megatonnes of annual reductions
in GHG emissions by 2030.
Implementation:
• for liquid fuels: publish proposed regulations in spring 2019 and final regulations in
2020, with requirements coming into force by 2022.
• for gaseous and solid fuels: publish proposed regulations in fall 2020, final
regulations in 2021 with requirements coming into force by 2023
The Clean Fuel Standard will achieve reductions from each of the transportation, building and
industry sectors. Reductions will be achieved by setting separate carbon intensity requirements for
subsets of fuels, as well as through rules on credit trading.
The Clean Fuel Standard will set separate carbon intensity requirements for liquid, gaseous
and solid fuel streams. This approach will lead to emission reductions from fuels used in industries and
buildings. For gaseous fuels, consideration will be given to setting volumetric requirements for
renewable content or a hybrid approach, such as volumetric requirements with GHG performance
standards.
Approximately 80% of liquid fuels are used for transportation. Setting a separate carbon
intensity target for liquid fuels will ensure GHG reductions are achieved from transportation fuels.
Consideration may be given to further groupings of fuel types within fuel streams (e.g.
grouping transportation fuels together in the liquid fuel stream). Some trading of credits between the
fuel streams will be considered. This approach offers compliance flexibility to regulated parties to
achieve emission reductions across the fuel types within the separate fuel streams.
The Clean Fuel Standard will complement the Pan- Canadian approach to pricing carbon
pollution. The Clean Fuel Standard will focus on reducing carbon intensity across the lifecycle of fuels,
from production to use, reducing GHGs along the value chain of individual fuels and incenting
innovation and technology. Carbon pricing will price fossil fuels, as well as emissions from industrial
activities, to send a price signal to markets and end users and further incent GHG emission reductions.
Assessment of likely Technology Maturation Pathways for production of biojet fuel (The ATM Project) March 2019
170
In the short term, the volumetric requirements in the federal Renewable Fuels Regulations will
be maintained but will be replaced in the long term.
The Clean Fuel Standard will provide a range of pathways for complying other than reducing
the carbon intensity of the fuel produced or imported for use in Canada. A key pathway for fossil fuel
suppliers will be to include renewable fuel content in their product.
It will also be possible to generate compliance credits for actions that improve carbon
intensity throughout the lifecycle of the fuel. One issue to be determined is whether to specify a
minimum threshold for process improvements that qualify for credit creation. It will also be possible to
generate credits through fuel switching and the deployment of energy sources and technologies that
displace fossil fuels, such as electric vehicles.
Credits will be tradeable among regulated parties within each stream of fuels (liquid, gaseous,
solid). There will also be limited banking of credits. Consideration is being given to allowing some use
of credits across streams of fuels.
Jet fuel that is used domestically will be subject to the Clean Fuel Standard but jet fuel that is
used for international flights will not. Renewable or other low-carbon intensity aviation fuel produced
and imported will be eligible to generate credits under the Clean Fuel Standard. Consideration is being
given to the use of a multiplying factor for low carbon aviation fuel credits.
7.3.2 Evaluation of the CFS in the context of this project The CFS will be applicable to domestic aviation with carbon intensity requirements for these
fuels. However, development of domestic production capacity and infrastructure of biojet fuels must
take place as global availability of these fuels is very small so unless domestic production is developed
the ability of the aviation sectors to decarbonize will be restricted. Brand new facilities will require
billions in investment and will come at a higher cost that ethanol and biodiesel production facilities due
to the greater complexity of the technology. Unless policy targets the specific development of drop-in
biofuel production (that produces jet fuel as part of their product suite) it will be very difficult for fuel
suppliers to meet the carbon intensity requirements (unless offsets can be used).
One possible alternative is the use of refinery integration through a co-processing strategy
which could overcome some of the obstacles for large financial investment, specifically for the
upgrading of liquid intermediates into finished fuels. Fuel producers or importers, including refiners,
can comply with the CFS through taking steps to reduce the carbon intensity of fuels, clearly providing
an avenue for co-processing under the CFS. It is not clear whether co-processing will be included in
the CFS.
7.4 Policy at provincial level and likely effectiveness for achieving objectives The federal Renewable Fuel Regulations specify blending levels for ethanol and biodiesel into
the gasoline and diesel pools respectively. In parallel to the federal mandate, some Canadian
provinces currently have their own biofuels mandates which, in most cases, are more ambitious than
those put in place by the federal government. As the ATM Project focused on a supply chain and
Assessment of likely Technology Maturation Pathways for production of biojet fuel (The ATM Project) March 2019
171
production based in British Columbia, only the policies in this province will be considered. Arguably,
BC has the most advanced policies for promotion of drop-in biofuel production and consumption, with
further policy additions for specific promotion of biojet fuel production under consideration.
Provincial biofuels mandates have been operational in BC since 2010, with a target for 5%
annual average renewable content in gasoline and a 4% (initially 3%) annual average renewable
content in diesel (the highest blending mandate in the country). Although BC produces some biodiesel
it has no commercial-scale ethanol production capacity. BC has a low carbon fuel standard in the form
of Renewable and Low Carbon Fuel Requirements. The carbon intensity of transportation fuels is
reduced through two major requirements: Part 2 of the Fuel Requirement (Renewable) makes
provision for blending mandates for gasoline (5% renewable content) and diesel (4% renewable
content). In addition, Part 3 of the Fuel Requirement (Low Carbon) provides for a 10% reduction in
carbon intensity by 2020. Under Part 3 of the regulations, anyone can apply to become a “Part 3 fuel
supplier”. Such suppliers have three ways to ensure compliance with the low carbon fuel standard.
First, through the supply of low carbon fuels, i.e. by reducing the overall carbon intensity of supplied
fuels to below the prescribed limit in each compliance period. Second, through credit trading, whereby
they acquire credits from other suppliers. Finally, and/or through “Part 3 Agreements”:
“Part 3 Agreements promote innovation, diversity and greater uptake of lower carbon
transportation fuels – all contributing to accelerated market transformation. Projects and activities
supported by Part 3 Agreements should reduce, or enable reductions of, GHG emissions resulting from
the use Part 3 fuels. It is expected that Part 3 Agreements will help fuel suppliers undertake actions
that are not otherwise economically viable, and that will help create future pathways for compliance.
For example, the lack of demand certainty has been cited as a barrier to E85 supply initiatives.
Supplying E85 under a Part 3 Agreement could establish this as a fuel that contributes to the supply of
more low carbon fuel”.31
Part 3 fuels are currently limited to gasoline and diesel class fuels and renewable substitutes,
but this may be expanded to also include biojet fuels on a voluntary basis under a Part 3 agreement.
This will allow a fuel supplier of jet fuel which includes biojet to earn credits under the regulations,
without these fuels forming part of the compulsory reductions in carbon intensity which could result in
penalties if not met. Jet fuel for international aviation does not fall under the jurisdiction of provincial
or national jurisdictions and therefore a voluntary opt-in system is the most feasible way to incentivize
biojet fuel development.
British Columbia was North America’s first jurisdiction to introduce a carbon tax, currently at
$35 per tonne of CO2eq. The tax has a broad base and is paid by all fossil fuel consumers in the
province, including jet fuel for intra-provincial flights. Practically all emissions from fuel combustion in
BC (as measured by Environment Canada’s National Inventory Report) are taxed, thereby covering
70% of all carbon emissions in the province. Nonetheless, there are a few fuels which are exempt
from the tax, which include:
• Jet fuel purchased by an international air service that is a registered consumer (also
exempt from motor fuel tax);
• Fuel purchased by a registered consumer (e.g. inter-provincial air services), a
31 British Columbia Ministry of Energy and Mines, Part 3 Agreements (2015).
http://www.empr.gov.bc.ca/RET/RLCFRR/Documents/BC%20RLCFRR%20Part%203%20Agreements%202015.pdf

Assessment of likely Technology Maturation Pathways for production of biojet fuel (The ATM Project) March 2019
172
registered air service or a registered marine service;
Therefore, jet fuel purchased by international airlines, as well as jet fuel for inter-provincial
flights, is exempt from the carbon tax, but domestic flights between two points within BC are subject
to carbon tax.
Potential application of current BC policy could involve inclusion of jet fuel under BC
regulations and using of Part 3 agreements to specifically promote development of drop-in biofuels
(including jet fuel), as well as to promote co-processing of biobased intermediates at refinery level. In
this way, low carbon intensity jet fuel with renewable content could be produced.
7.5 Policy conclusions and Recommendations Those jurisdictions where biofuels have been produced and used have all had benefited from
strong policies and mandates that have “encouraged” their production and use. Volumetric mandates
for bioethanol and biodiesel have been used worldwide in over 60 countries. More recently,
jurisdictions such as California and BC have developed policies such as low carbon fuel standards that
set targets for emission reductions and place emphasis on the carbon intensity of the biofuel, not
simply the volume. It is highly likely that policies such as low carbon fuel standards will provide the
basis of effective decarbonisation and incentivise biofuel production. In addition, the broad provisions
described in the Part 3 agreements under current BC policy have proven to be important for the
launching of various initiatives, such as co-processing.
Conventional policies such as grants and loan guarantees will continue to play an essential
role in promoting drop-in biofuels and biojet by overcoming some of the risk associated with
investment in these new technologies. On a broader level, supply chain policies that can improve the
access to and cost of feedstock (as discussed in Chapter 2) will form an important element of the
policy framework.
British Columbia is well positioned to put in place flexible policies to promote the production
and use of biojet fuels (as part of drop-in biofuel production). The federal CFS will only come into force
in 2022 for liquid fuels and some of the drawbacks may be ironed out. However, BC has the distinct
advantage of existing policies that have been in place for several years and have been shown to be
effective in reducing emissions from transportation. Building on these existing policies are therefore
likely to have a quicker and more direct impact on the province. The BC regulations should serve as an
excellent example to other provinces of an effective and viable policy system.
Specific proposals and recommendations based on the BC regulations can therefore be
highlighted. A co-processing strategy could be very effective to decarbonize transportation, including
lowering the carbon intensity of current liquid fuels and lowering the carbon intensity of fuel
production. The existing regulations could be expanded to include incentives for production of specific
low carbon fuels such as biojet fuels. While the aviation sector is regulated at international level, it has
become apparent that incentives could be used for this sector without clashing with international
regulations that prohibit taxation of fuel for international flights.
Key policy issues that should be considered include:
• Specific recommendations for inclusion of biojet fuels under the LCFS, taking into
account both domestic and international flights;
Assessment of likely Technology Maturation Pathways for production of biojet fuel (The ATM Project) March 2019
173
• Specific provisions for co-processing in existing refineries that regulate life cycle
assessment and calculation of carbon intensity for the purpose of calculating credits.
The policy measures at all three levels will make a significant contribution to bridging the
price gap between fossil fuel and biofuel as set out in the techno-economic assessment. However, this
may not be sufficient and further novel policies should be considered. A charge per passenger per
flight is one example and has been introduced in Sweden.

Assessment of likely Technology Maturation Pathways for production of biojet fuel (The ATM Project) March 2019
174
CHAPTER 8 – RESULTS AND DISCUSSION
8.1 Comparison of biocrudes and upgrading approaches
The following Table 87 shows a comparison of the different pathways and key data while
Table 88 is an evaluation of the different pathways for specific factors.
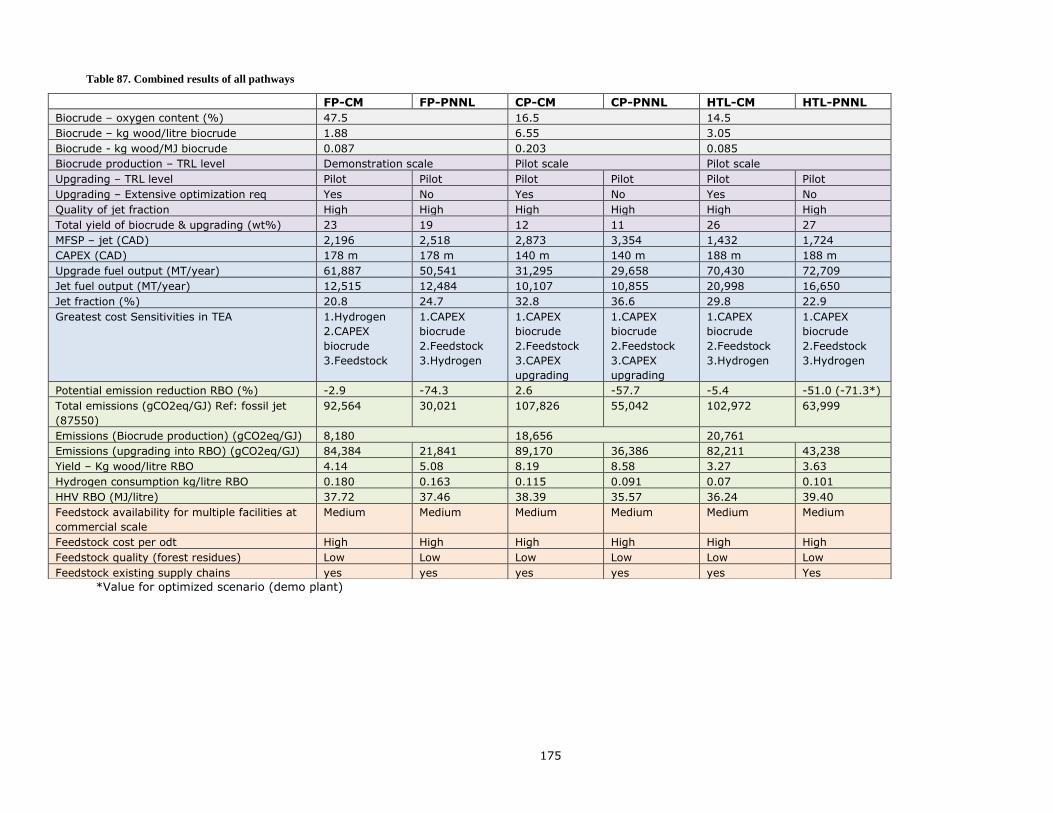
175
Table 87. Combined results of all pathways
*Value for optimized scenario (demo plant)
FP-CM FP-PNNL CP-CM CP-PNNL HTL-CM HTL-PNNL
Biocrude – oxygen content (%) 47.5 16.5 14.5
Biocrude – kg wood/litre biocrude 1.88 6.55 3.05
Biocrude - kg wood/MJ biocrude 0.087 0.203 0.085
Biocrude production – TRL level Demonstration scale Pilot scale Pilot scale
Upgrading – TRL level Pilot Pilot Pilot Pilot Pilot Pilot
Upgrading – Extensive optimization req Yes No Yes No Yes No
Quality of jet fraction High High High High High High
Total yield of biocrude & upgrading (wt%) 23 19 12 11 26 27
MFSP – jet (CAD) 2,196 2,518 2,873 3,354 1,432 1,724
CAPEX (CAD) 178 m 178 m 140 m 140 m 188 m 188 m
Upgrade fuel output (MT/year) 61,887 50,541 31,295 29,658 70,430 72,709
Jet fuel output (MT/year) 12,515 12,484 10,107 10,855 20,998 16,650
Jet fraction (%) 20.8 24.7 32.8 36.6 29.8 22.9
Greatest cost Sensitivities in TEA 1.Hydrogen
2.CAPEX
biocrude
3.Feedstock
1.CAPEX
biocrude
2.Feedstock
3.Hydrogen
1.CAPEX
biocrude
2.Feedstock
3.CAPEX
upgrading
1.CAPEX
biocrude
2.Feedstock
3.CAPEX
upgrading
1.CAPEX
biocrude
2.Feedstock
3.Hydrogen
1.CAPEX
biocrude
2.Feedstock
3.Hydrogen
Potential emission reduction RBO (%) -2.9 -74.3 2.6 -57.7 -5.4 -51.0 (-71.3*)
Total emissions (gCO2eq/GJ) Ref: fossil jet
(87550)
92,564 30,021 107,826 55,042 102,972 63,999
Emissions (Biocrude production) (gCO2eq/GJ) 8,180 18,656 20,761
Emissions (upgrading into RBO) (gCO2eq/GJ) 84,384 21,841 89,170 36,386 82,211 43,238
Yield – Kg wood/litre RBO 4.14 5.08 8.19 8.58 3.27 3.63
Hydrogen consumption kg/litre RBO 0.180 0.163 0.115 0.091 0.07 0.101
HHV RBO (MJ/litre) 37.72 37.46 38.39 35.57 36.24 39.40
Feedstock availability for multiple facilities at
commercial scale
Medium Medium Medium Medium Medium Medium
Feedstock cost per odt High High High High High High
Feedstock quality (forest residues) Low Low Low Low Low Low
Feedstock existing supply chains yes yes yes yes yes Yes

176
Table 88. Comparison of pathways with respect to specific factors
8.2 Analysis of jet fractions and suitability of thermochemical liquefaction and hydrotreating as a strategy to produce biojet fuel
After upgrading of the biocrudes used in this study, distillation was carried out to separate
product fractions based on their boiling point. The jet fraction was the oil phase distillation
fraction between 155o-250oC.
For use in commercial aviation, a biojet fuel has to go through a rigorous approval
process as described in Chapter 1. Once approved for commercial use, the specification for the
particular alternative technology and upgrading pathway is published as part of ASTM D7566.
The pathways used in this study are not currently included in ASTM D7566, but in order to
evaluate the jet fractions generated in this study, general specifications and analytical procedures
specified in ASTM D7566 were used to make a broad assessment as to the suitability of these
technology and upgrading pathways for production of biojet fuel.
Table 1 in ASTM D7566 lists the minimum and maximum specifications of the biojet fuels
listed in the Annexes after blending with conventional jet fuel (already certified through ASTM
D1655) according to the blending limits specified in the standard. Once the blended fuel has met
all the specifications in Table 1, it is considered equivalent to ASTM D1655 for conventional jet
fuel.
Every “batch” of biojet fuels, that are listed in the Annexes of D7566, have to be certified
after production according to batch requirements listed in each Annex. After the batch
certification, blending with conventional jet fuel takes place according to the specified blending
limits and recertification of the blend in accordance with Table 1 of ASTM D7566.
Table 89 below shows the results of the jet fraction analyses from the ATM Project, each
biocrude and upgrading pathway yielded a jet fraction that was analysed to determine how well
the jet fraction compared with a conventional jet/biojet blended fuel. This will provide insight into
the suitability of these pathways to produce biojet fuels.
It should be noted that the upgrading processes in this study was not optimized.
Upgraders used standard in-house protocols to carry out the upgrading before fractionation and
TRL level
Biocrude prod
TRL level
upgrading
Significant
Jet fraction
(>20%)
>50%
emission
reduction
MFSP <
CAD2000 /MT
FT-CM Demo/comm Pilot
FT-PNNL Demo/comm Pilot
CP-CM Pilot Pilot
CP-PNNL Pilot Pilot
HTL-CM Pilot Pilot
HTL-PNNL Pilot pilot

Assessment of likely Technology Maturation Pathways for production of biojet fuel (The ATM Project) March 2019
177
analysis was done. It should also be noted that the Canmet upgrading results reflect the co-
hydrotreated product and is therefore a mixture of biofuel and fossil fuel. Due to limited sample
volumes, all tests from Table 1 of ASTM D7566 could not be performed, e.g. thermal stability.
Based on the results shown in Table 89, it can be concluded that this study has been very
successful in demonstrating that thermochemical liquefaction and upgrading through
hydrotreatment is very suitable for production of biojet fuel from woody biomass. Deviations from
Table 1 specifications are relatively minor and could be overcome through further optimization of
the hydrotreating and additional polishing steps. As the parameters for these specifications are
based on the blended fuel, the batch specifications for the specific technology pathway may differ.
We will briefly examine some of the main specifications below and examine the extent to which
biojet “batches” as contained in the Annexes vary with respect to the required minimum or
maximum, as well as additional analyses that may be required based on previous examples.
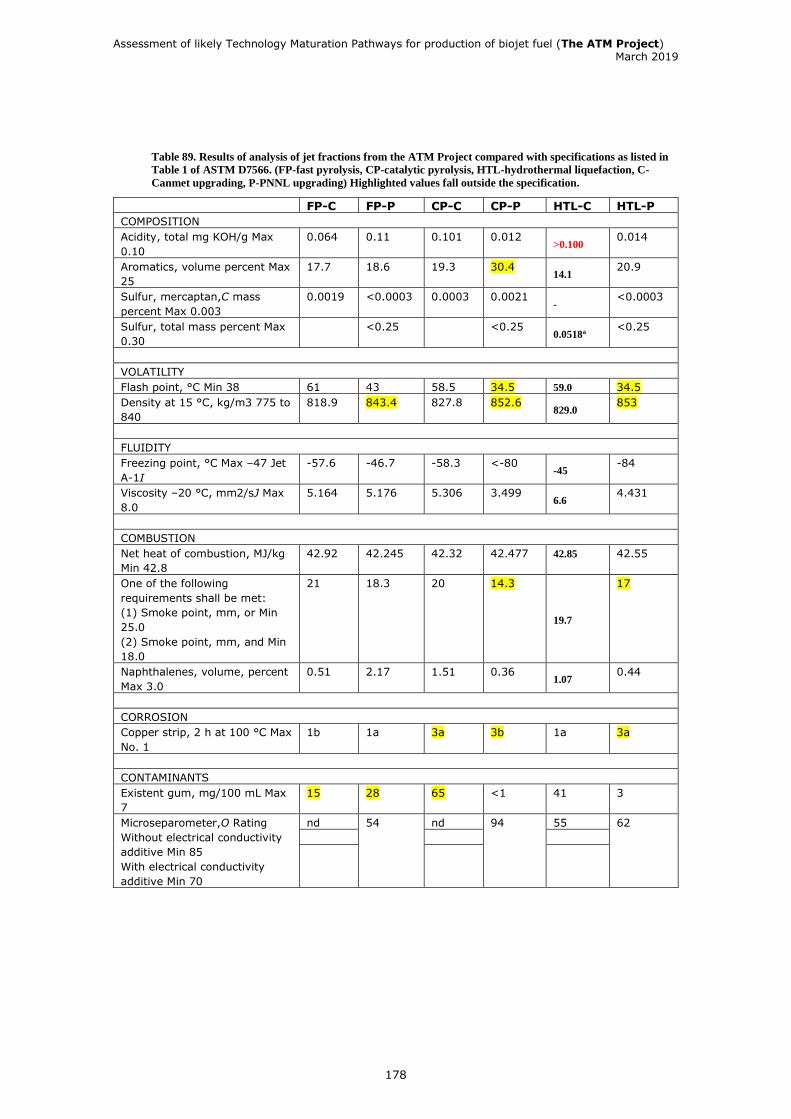
Assessment of likely Technology Maturation Pathways for production of biojet fuel (The ATM Project) March 2019
178
Table 89. Results of analysis of jet fractions from the ATM Project compared with specifications as listed in
Table 1 of ASTM D7566. (FP-fast pyrolysis, CP-catalytic pyrolysis, HTL-hydrothermal liquefaction, C-
Canmet upgrading, P-PNNL upgrading) Highlighted values fall outside the specification.
FP-C FP-P CP-C CP-P HTL-C HTL-P
COMPOSITION
Acidity, total mg KOH/g Max
0.10
0.064 0.11 0.101 0.012 >0.100
0.014
Aromatics, volume percent Max
25
17.7 18.6 19.3 30.4 14.1
20.9
Sulfur, mercaptan,C mass
percent Max 0.003
0.0019 <0.0003 0.0003 0.0021 -
<0.0003
Sulfur, total mass percent Max
0.30
<0.25 <0.25 0.0518a
<0.25
VOLATILITY
Flash point, °C Min 38 61 43 58.5 34.5 59.0 34.5
Density at 15 °C, kg/m3 775 to
840
818.9 843.4 827.8 852.6 829.0
853
FLUIDITY
Freezing point, °C Max –47 Jet
A-1I
-57.6 -46.7 -58.3 <-80 -45
-84
Viscosity –20 °C, mm2/sJ Max
8.0
5.164 5.176 5.306 3.499 6.6
4.431
COMBUSTION
Net heat of combustion, MJ/kg
Min 42.8
42.92 42.245 42.32 42.477 42.85 42.55
One of the following
requirements shall be met:
(1) Smoke point, mm, or Min
25.0
(2) Smoke point, mm, and Min
18.0
21 18.3 20 14.3
19.7
17
Naphthalenes, volume, percent
Max 3.0
0.51 2.17 1.51 0.36 1.07
0.44
CORROSION
Copper strip, 2 h at 100 °C Max
No. 1
1b 1a 3a 3b 1a 3a
CONTAMINANTS
Existent gum, mg/100 mL Max
7
15 28 65 <1 41 3
Microseparometer,O Rating
Without electrical conductivity
additive Min 85
With electrical conductivity
additive Min 70
nd 54 nd 94 55 62

Assessment of likely Technology Maturation Pathways for production of biojet fuel (The ATM Project) March 2019
179
Table 89shows that there are only small variations from the specifications that should not
be difficult to correct. While sulfur levels appear to meet specifications, the oxygen and nitrogen
components are notable. Nitrogen limits are contained in the Annexes at 2 mg/kg. Oxygen could
be reduced to a lower level through optimization of the hydrotreater operation and this will also
improve the density and heat of combustion. Excellent results were obtained with freeze points.
The flash point is a little low in the HTL case, but it is likely a function of the distillation cut point.
Removing some of the lower boiling components will raise the flash point. Variations from spec in
the smoke point is likely due to high levels of aromatics and additional hydrogenation could reduce
the aromatic content.
8.3 Specific considerations and specifications relevant to biojet fuels In some cases, the specification for a biojet fuel varies from the standard specification as
found in Table 1 of the ASTM D7566. Initial certification of batches has to follow the standards
listed in the Annexes, which take into account the specific process and characteristics of the biojet
fuel prior to blending. Some of the differences with Table 1 of ASTM D7566 are listed below:
➢ Density – Standard specification 775-840 kg/m3 • Variations
o Fischer-Tropsch biojet and HEFA-SPK – 730-770 kg/m3 o SIP (farnesane) – 765-780 kg/m3 o SPK/A – 755-800 kg/m3 o ATJ – 730-770 kg/m3
➢ Maximum freezing point – Standard specification Maximum -47oC • Variations
o FT and HEFA-SPK – Maximum -40oC o SIP - -60oC o SPK/A - -40oC o ATJ - -40oC
➢ Aromatics – part of standard specification 8.4-26.5% by volume • Variations
o FT and HEFA-SPK – Maximum aromatic mass content 0.5% o SIP – Maximum 0.5% mass content o SPK/A – Maximum aromatic mass content 20% o ATJ – 0.5%
➢ Cycloparaffins, paraffins and olefins are not specified in the main standard and variations included in the Annexes are
• FT, HEFA-SPK – maximum cycloparaffin mass content 15% • SIP – Maximum olefin mass content 300 mg (Br)/100g • SPK/A – maximum cycloparaffin content – 15% • ATJ – 15%
➢ Nitrogen is not included in the standard specification for conventional or blended fuels,
but included in Annexes – Maximum 2 mg/kg
➢ Water – maximum 75 mg/kg
Select analytical
results
FP-C FP-P CP-C CP-P HTL-C HTL-P
Nitrogen, mg/kg
Max 2
270 9.7 <0.75 81
Water, mg/kg Max
75
138ppm 440 159 66 74
Sulfur, mg/kg Max
15
480 11 423 39.3 0.0518
Oxygen wt % 0.3 1.08 1.18 <0.01 Nd 0.13

Assessment of likely Technology Maturation Pathways for production of biojet fuel (The ATM Project) March 2019
180
➢ Metals (Al, Ca, Co, Cr, Cu, Fe, K, Li, Mg, Mn, Mo, Na, Ni, P, Pb, Pd, Pt, Sn, Sr, Ti, V, Zn) -
Maximum 0.1 mg/kg per metal
➢ Halogens – Maximum 1 mg/kg
➢ Flash point – Minimum 38oC for most Annexes except SIP – 100oC ➢ FAME (fatty acid methyl esters) in HEFA-SPK <5 ppm ➢ Thermal stability measurements – standard carried out at 260oC
• Variations o FT, HEFA-SPK – at 325oC o SIP at 355oC o SPK/A at 325oC o ATJ at 325oC
One important parameter that is worth discussing is the level of aromatics. While the
blended fuel can contain between 8-25% aromatics, it is notable that the approved biojet fuels in
FT, HEFA, SIP and ATJ have a limit of 0.5% aromatics. These biojet fuels generally contain low
levels of aromatics, but this will not be the case with thermochemical liquefaction-based fuels that
generate a lot of aromatics based on the lignin content in the lignocellulosic biomass feedstock.
The only current approved biojet fuel with aromatics is SPK/A in Annex 4 which is based on
blending of FT-SPK with aromatics before further processing. The limit on aromatics for the biojet
batch is at 20%. If this limit is also adopted for thermochemical liquefaction based biojet fuels, the
only results in this study that far exceeds this is the Catalytic pyrolysis biocrude as upgraded by
PNNL. But as earlier mentioned, aromatics can be reduced through more aggressive hydrotreating.
In conclusion, the ATM Project has shown that biojet fuel could be produced through
upgrading of biocrudes and this can pave the way for obtaining ASTM certification. Additional
optimization could correct slight deviations from specifications. Although not all tests were carried
out due to limited volumes available, the results are very positive and clearly illustrate that biojet
production via these pathways could be successfully pursued.

Assessment of likely Technology Maturation Pathways for production of biojet fuel (The ATM Project) March 2019
181
CHAPTER 9 – CONCLUSIONS AND RECOMMENDATIONS
9.1 Conclusions
GHG emissions is a significant threat to our planet. One of the biggest contributors to
these emissions is the transportation sector which contributes 23% to global emissions. While
electrification is viewed as one of the most promising ways to decarbonize, this technology has
limited application in a sector such as aviation. It is recognized that aviation requires drop-in
biofuels that are functionally equivalent to existing, conventional jet fuels and able to make use of
existing infrastructure such as airplanes and fueling infrastructure. Drop-in biojet fuels can deliver
significant emission reductions to meet climate objectives of the sector towards 2050.
However, current production of biojet fuels is limited, with one technology pathway,
hydrotreated esters and fatty acids (HEFA) supplying the vast majority of biojet fuels using
feedstocks such as used cooking oil, fats and vegetable oils. High sustainability demands in the
sector limit the use of food feedstocks for biofuel production, but the supply of alternative, waste
feedstocks such as used cooking oil, fats and greases is restricted. The most feasible solution for
significant volumes of biojet fuel production is the development of technologies that can use
feedstocks such as lignocellulosic biomass, including forest residues that are available in large
quantities on a global scale and often underutilized. Thermochemical technologies based on these
feedstocks have been shown to be very promising. Gasification combined with synthesis of fuels
through Fischer-Tropsch has obtained ASTM certification for use as a biojet fuel, although
commercial production of these fuels has been slow, partly due to the very high investment costs
required. The other type of thermochemical technology, thermochemical liquefaction, produces a
liquid intermediate that can be catalytically upgraded into finished biofuels through
hydrotreatment or catalytic cracking. Due to the high oxygen content of these liquid
intermediates, addition of hydrogen is generally needed for deoxygenation.
Thermochemical liquefaction technologies have not been commercially demonstrated to
produce biojet fuels and have not received ASTM certification as a biojet fuel. As explained above,
such fuels are produced in two distinct stages, the production of a liquid intermediate, followed by
the upgrading into finished fuels. Commercial development of the liquid intermediate production
has been quite advanced, particularly fast pyrolysis that has reached small commercial stage.
Other technologies, such as catalytic pyrolysis and hydrothermal liquefaction is at a less advanced
stage of commercialization. However, the upgrading stage to produce finished fuels has been
technically challenging and the production of biojet fuels via this route has not been
demonstrated.
One of the key objectives of the ATM Project was to demonstrate that biojet production
through thermochemical technologies and upgrading through hydrotreatment is feasible from a
technical perspective, but also from an economic perspective provided the right policies are
implemented. In addition, the ability of these biofuels to provide significant emission reductions
was evaluated.
Key conclusions from this project are:
Biocrudes produced through thermochemical liquefaction technologies, including fast
pyrolysis, catalytic pyrolysis and hydrothermal liquefaction can be successfully used to produce a
Assessment of likely Technology Maturation Pathways for production of biojet fuel (The ATM Project) March 2019
182
significant volume of biojet fuel.
Several other fuel products were produced simultaneously that can be used in gasoline,
diesel and marine or heating fuels.
The jet fractions were analysed and demonstrated a high level of compliance with general
standards for jet fuel based on ASTM certification. Some minor off-spec results could be corrected
with further upgrading. As none of the upgrading processes were optimised for jet production,
these results were significant.
Assessment of potential emission reductions of these pathways through life cycle analysis
demonstrated that significant emission reductions were possible with most of the pathways.
The highest potential emission reductions could be achieved with the fast pyrolysis and
dedicated hydrotreating approach (81%). Optimization of the hydrothermal liquefaction process
could achieve similar levels of emission reductions. In British Columbia, forest residues are
currently burnt in slash piles and inclusion of the avoided emissions would make a significant
contribution to potential emission reductions in all the pathways.
Dedicated hydrotreatment was more successful with respect to emission reductions
compared with a co-processing hydrotreatment approach. Although the co-processing
hydrotreatment approach could be further optimised, the main challenge was caused by the
additional chemicals required to ensure miscibility of the liquid bio-intermediate with the fossil fuel
fraction. Reduction of these chemicals through optimization or substitution with renewable
alternatives could significantly improve the life cycle performance of the co-processing
hydrotreatment pathway. It should be noted that the approach to co-processing followed by
CanmetEnergy-Ottawa is just one of several co-processing methods and other methods may
perform differently with regards to LCA assessment.
A thorough techno-economic analysis of all the pathways demonstrated that the minimum
fuel selling price (MFSP) was higher compared with fossil jet fuel, given the current state of the
technologies The best performing pathway was based on hydrothermal liquefaction and dedicated
hydrotreating with an MFSP of CAD1,724.
Yield of the liquid intermediates based on mass of feedstock and yield after upgrading
were significant factors in the TEA with catalytic pyrolysis having the lowest yield of biocrude and
hydrothermal liquefaction the overall highest yield.
The CAPEX of the hydrothermal liquefaction was quite a bit higher than the fast pyrolysis
or catalytic pyrolysis due to higher pressures used. A sensitivity analysis demonstrated that the
CAPEX of the liquefaction stage (production of the liquid intermediate was one of the biggest cost
factors and reduction would have an influence on the overall net present value (NPV).
A sensitivity analysis of all the pathways revealed that the greatest sensitivities were with
respect to CAPEX of biocrude production, feedstock and hydrogen price.
A feedstock supply chain analysis was carried out for British Columbia with respect to
availability and cost. Significant feedstock is available in the region, with a large price variation. A
supply chain was selected in the Prince George region and based on a 200 bbl/day biocrude
facility, sufficient feedstock was available at an average cost of CAD80 (delivered and
comminuted).
An 80 dollar feedstock cost is quite high and makes the economics challenging, and larger
Assessment of likely Technology Maturation Pathways for production of biojet fuel (The ATM Project) March 2019
183
facilities might have to access feedstock at an even higher cost. Reduction of feedstock cost
should be an important goal for domestic biofuel production in BC and various policy changes are
suggested that could make access to and cost of feedstock in the region more economical.
Sustainability across the entire supply chain is absolutely essential for the aviation sector.
British Columbia and Canada has a forest sector with extensive sustainability certification (largest
in the world). However, the use of forest residues does not currently fall under forest certification
schemes and some changes will have to be implemented to extend forest certification to in-forest
residue collection and utilisation.
As the liquid intermediates produced contain high amounts of oxygen, significant volumes
of hydrogen are required for deoxygenation. The majority of hydrogen is currently produced
through steam methane reforming of natural gas and this is the cheapest and most economical
pathway. The TEA demonstrated that the NPV is highly sensitive to the cost of hydrogen and until
renewable hydrogen production technologies such as electrolysis becomes cheaper (or natural gas
becomes very expensive), current production methods will continue to be used for the near future.
However, the source of hydrogen is one of the biggest factors in the life cycle analysis
with a linear relationship between kg of H2 used for upgrading and CO2 emissions generated.
Suitable biojet fuel pathways have to find a balance between economically viable routes that also
produce significant emission reductions.
While technical feasibility of a pathway is a necessary first step in production of biojet
fuels, this cannot be considered sufficient on its own, as a matrix of factors must inform the
overall suitability of a pathway. The ATM Project was able to assess the entire matrix of factors
over the entire supply chain, offering a unique insight into biojet fuel production through the
thermochemical technology pathways.
As all pathways demonstrated technical feasibility for the production of biojet fuels, and
all pathways were based on the same feedstock supply chain, the two factors considered most
significant were the potential emission reductions based on a life cycle assessment and the NPV
and MFSP of the different pathways.
Based on an assessment across all factors, the HTL process combined with dedicated
hydrotreatment was selected for development and design of a demonstration scale facility based
in British Columbia, with production of biocrude in Prince George and upgrading taking place in the
Lower Mainland co-located with an existing refinery for access to over-the-fence hydrogen and
integration with downstream polishing steps and distribution. This allows biocrude production
situated in proximity to the feedstock, allowing a densified intermediate to be transported for
separate upgrading and distribution of biojet in proximity to a major airport. The selection of the
lower mainland as a location for upgrading is due to the fact that the refinery is the only jet
producer in BC, but theoretically the engineering designs could be applied in any location adjacent
to a refinery.
The results from the techno-economic analysis clearly demonstrates that production of
biojet fuels according to this pathway, based on current conditions such as oil price, will require a
substantial premium to make it equivalent to conventional fossil jet fuel. Due to the high demand
and low availability of biojet fuels, current biojet is purchased at a much higher price than
conventional jet and the premium is thus simply an indication of equivalence.
The right policies will be essential to help bridge the price gap between conventional jet
fuel and biojet fuel. Policy support has played a crucial role in the development of biofuels and
Assessment of likely Technology Maturation Pathways for production of biojet fuel (The ATM Project) March 2019
184
similar policies can be used, including volumetric blending mandates, producer incentives, loan
guarantees and grants for development of facilities, etc. However, the aviation sector, operating
across borders, has unique considerations under international law with separate emission
reduction targets agreed under ICAO, including an offsetting scheme (CORSIA) that will come into
effect in 2021.
Three tiers of policy are applicable to production of biojet fuels in British Columbia, at
international, national and provincial level. A synergistic relationship between policies at different
levels is ideal, but this is not currently the case. The proposed federal Clean Fuel Standard (CFS)
will come into effect in 2022 and could have a positive impact on the production and consumption
of biojet fuels.
Currently, British Columbia has the most advanced policy environment for the production
and consumption of biojet fuels based on a low carbon fuel standard which includes the flexibility
of Part 3 agreements to have a substantial impact on development of technologies for reduction of
emissions from transportation fuels. Expansion of these policies to include aviation under the low
carbon fuel standard, and proposed inclusion of co-processing, which is currently under
consideration, could contribute significantly to promotion of biojet production and consumption.
9.2 Recommendations
Based on the results of the ATM Project, it is recommended that the production of biojet
fuels through thermochemical liquefaction and upgrading should be further pursued. From a
technical point of view upgrading seems feasible as two completely disparate upgrading methods
were successfully used. While the focus is often placed on technical challenges this is not adequate
to determine the overall potential of a pathway and should be combined with life cycle assessment
and techno-economic analysis which provides a broader and more complete assessment of a
technology pathway. The LCA and TEA results are important tools to inform the optimization and
improvement of the technical aspects.
Forest residue feedstock is available in significant quantities in British Columbia (and
Canada) but the average cost for a biocrude production facility is CAD80. The TEA demonstrated
that feedstock cost has a significant impact on the NPV and that reduction of this cost should be
targeted. Specific factors that influence cost of feedstock in the region was examined and showed
that various policy measures could increase access to feedstock and reduce the cost of such
feedstock. A big advantage of basing a biojet production facility in Canada (and BC) is the
sustainability of their forests, verified through third-party certification. However, forest residues
are not currently part of the in-forest certification standards and ensuring a sustainable supply
chain for biojet fuels require additional modules to be added to certification standards that will
include in-forest certification of residues and their removal and utilization.
The LCA demonstrated that significant emission reductions could be obtained through
many of the biojet pathways. The results could inform biocrude producers and upgraders of the
factors that influence the potential emission reductions to allow optimization of these processes.
The central importance of emission reductions in biojet fuel consumption means that pathways
that are technically feasible but does not produce emission reductions will have limited opportunity
for commercialization. Hydrogen consumption and the source of hydrogen has a large impact on
the LCA and renewable sources of hydrogen, e.g. electrolysis, or the use of waste industrial gases
as a feedstock, could have a significant impact on potential emission reductions. However, at low
natural gas prices, the cost of current steam reforming methods is an important consideration.
Improving the LCA by using renewable or waste feedstocks could utilize the same technology
(steam reforming) but reduce the impact on the overall process.

Assessment of likely Technology Maturation Pathways for production of biojet fuel (The ATM Project) March 2019
185
The TEA showed a wide range of possible minimum fuel selling prices, although they were
all higher than the current price for conventional jet fuel (based on current oil prices). This is not
unexpected as the technologies being assessed are still under development and have ample
opportunity for further optimization and enhancement of key performance metrics. Yield of
biocrude from feedstock and overall yield of upgraded/refined biocrude was an important factor in
the TEA, with catalytic pyrolysis delivering the lowest yields. The overall yield of the hydrothermal
liquefaction and dedicated hydrotreatment process was the highest, making this pathway the best
performer. Thus it is recommended that improvement of yields should be an important target of
optimization. The factors contributing the most in the sensitivity analysis are CAPEX of biocrude,
feedstock cost and hydrogen cost and these factors could be targeted for improvement. The
CAPEX of HTL biocrude production is greatly impacted by the need for a waste-water treatment
facility and this is recommended for further study and optimization.
While not considered as part of the hands-on research in this project, more extensive
refinery integration through co-processing could have a significant impact on CAPEX of upgrading.
Co-processing through hydrotreatment is expected to have miscibility problems similar to what
was experienced in this project and this will have to be considered. Co-processing through
catalytic cracking and separate injection might be more suitable for liquid intermediates and has
been demonstrated to some extent, but not for biojet production and further study will have to be
conducted to determine is this could be a suitable route for biojet fuel production. A combination
of dedicated hydrotreatment and co-processing could be very effective, with partial upgrading
carried out in a small hydrotreater and final upgrading as a co-processing approach.
The engineering design for a demonstration facility based on hydrothermal liquefaction
and dedicated hydrotreatment is based on several assumptions as no real-world data exists for
this technology at this scale. Recommendations include further study and testing of these
assumptions to improve the accuracy of the data used.
It is apparent that an essential component for the successful development of biojet fuel
production will be the right policies. The proposed ICAO off-setting scheme (CORSIA) in
international aviation is not expected to have a big impact on biojet development as purchase of
offsets is expected to be much cheaper. However, ICAO is still developing some of its regulations
with respect to use of biojet fuels under CORSIA. The proposed Canadian federal Clean Fuel
Standard could potentially have a positive impact on development of biojet fuel production and
consumption in Canada based on inclusion of aviation fuel and a proposed fuel multiplier. To the
extent that the CFS may promote drop-in biofuel production, this could also have a spin-off effect
on biojet fuels where a blendstock with a jet fraction is produced. But refineries can make
selective cuts so that the jet fraction could be diverted into the gasoline and diesel fraction unless
there is an incentive to make jet fuel. The further impact that the CFS may have on refineries to
consider and pursue a co-processing strategy to reduce fuel emissions, could also result in a spin-
off effect for biojet production. However, as the CFS implementation is only in 2022, BC is
considered the most favourable jurisdiction in Canada for biojet development as it already has
good policies in place. It is recommended that the current low carbon fuel regulations be
expanded to include aviation fuels to allow earning of credits for production of biojet fuels. In
addition, it is recommended that the Part 3 agreements be expanded to incorporate co-processing
in refineries and separate production of biocrudes and upgrading of biocrudes. This could be used
as a temporary measure to boost the development of biojet fuels. It is also recommended that
additional studies are carried out to explore novel policy solutions which could help bridge the
price gap between conventional and biojet fuels which could initially be trialled at one airport prior
to expansion at other airports. As biojet production is further developed with commercial
availability of biojet volumes, a mandate could be considered. It is not recommended that a
volumetric mandate alone is used and that an emission reduction approach is adopted.
Assessment of likely Technology Maturation Pathways for production of biojet fuel (The ATM Project) March 2019
186
9.3 Significance of this project to advancing biojet fuels As shown in chapter 1, several technology pathways have received ASTM certification for
biojet fuel to be used in commercial aviation. However, the majority of biojet fuels currently
available at commercial scale is limited to HEFA jet fuel, produced through the hydrotreatment of
fats and oils, with only one company producing dedicated volumes of biojet fuels. The feedstocks
used, such as tallow or used cooking oil, has limited availability on a global scale. In order to
produce the significant volumes required in terms of climate targets (>200 BL/year) will require
the development and commercialisation of multiple technologies. Technologies based on
lignocellulosic feedstocks such as wood waste will play a significant role in delivering large
volumes of drop-in biofuels and biojet. This is due to the widespread availability and significant
volumes of such feedstocks globally. Potentially, the lignocellulosic feedstocks could also be
cheaper than other types of feedstocks such as vegetable oils and sugars.
Thermochemical technology pathways can use the lignocellulosic feedstocks and are most
appropriate for the production of drop-in biofuels and biojet. These technologies can be broadly
grouped into gasification and liquefaction. While gasification with Fischer-Tropsch synthesis was
the first type of biojet to receive ASTM certification, the commercial development of this
technology based on lignocellulosic feedstocks has been slow due to technical and cost challenges
(very high CAPEX).
Alternatively, thermochemical liquefaction technologies show great promise for lower
CAPEX commercialisation and economically competitive fuel prices. However, several technical
challenges remain, particularly with respect to the upgrading of the liquid intermediates into
finished fuels. Overcoming key challenges could make a significant contribution to development
and commercialisation of these technologies. This was the primary objective of the ATM Project, to
advance the knowledge and address some of the challenges associated with the thermochemical
liquefaction technologies and upgrading of liquid intermediates.
The further unique aspect of the ATM Project is the simultaneous assessment of technical,
life cycle and techno-economic parameters from the same dataset which will allow for a more
comprehensive evaluation of pathways. Taking into account the impact of multiple factors
simultaneously allows for comprehensive optimisation of processes and clear recommendations
could be made from the results of this project.
The ATM Project demonstrated that biojet fuels could be successfully produced through
thermochemical liquefaction technology and a hydrotreating upgrading approach. Many of the
pathways could result in significant emission reductions to achieve the objectives of the aviation
sector. The outcomes of this project could be used worldwide by researchers, biofuel companies
and the aviation sector for decision-making.
9.4 Benefits of this project to Canada Canada’s aviation sector forms an important and essential component of transportation in
the country. Reducing emissions from this sector is imperative for Canada’s commitments under
climate agreements, and essential for airlines such as Westjet and Air Canada in order to reduce
the financial burden of the carbon offsetting scheme under ICAO that will come into effect.
While Canada has several facilities that produce ethanol and biodiesel, there are no
domestic facilities producing drop-in biofuels (and potentially biojet fuels). As the production of jet

Assessment of likely Technology Maturation Pathways for production of biojet fuel (The ATM Project) March 2019
187
fuel is one of multiple products, fractionated through distillation from a fuel blendstock, drop-in
biofuels production is considered essential for the development of biojet fuels. Jet fuel and other
fuels are produced simultaneously and the other fuel products are also important for improving
the economic viability of a facility.
Canada has a commercial gasification facility, Enerkem, that produces fuels from the
gasification of municipal solid waste. However, the company only produces methanol and ethanol
and not drop-in biofuels.
With regards to thermochemical liquefaction technology, Canada has companies such as
Ensyn, using fast pyrolysis of woody biomass to produce pyrolysis oil which can be upgraded into
drop-in biofuels, including biojet. In addition, two hydrothermal liquefaction companies, Steeper
Energy and Licella are both actively developing their technology in Canada, with progress
underway to build small-scale pilot/demo facilities in Alberta and British Columbia for production of
HTL biocrudes. These biocrudes will still need upgrading into finished fuels and the results from
the ATM project could assist these companies in furthering the commercialisation of their
technology through freestanding upgrading or co-processing.
Canada has extensive resources of sustainable forests that could contribute as a feedstock
to drop-in biofuel/biojet production. In many cases the forest residues wastes are not currently
used and burnt in slash piles. Utilisation of these residues through fuel production could reduce
the emissions from slash burning, while also contributing to the economic development of the
forest sector through new products.
While the ATM project focused on forest residues as a feedstock, technologies such as
hydrothermal liquefaction can utilise a large variety of wet feedstocks such as sewage sludge,
manure, etc. The results from the ATM project could also make a significant contribution in this
respect as the engineering designs for a demonstration scale facility and upgrading could be
adjusted for any feedstock.

Assessment of likely Technology Maturation Pathways for production of biojet fuel (The ATM Project) March 2019
188
REFERENCES BY CHAPTER
Background to the ATM project
Karatzos, S., McMillan, J.D. and Saddler, J.N., 2014. The potential and challenges of drop-
in biofuels. Report for IEA Bioenergy Task, 39.
Chapter 1
Akhtar, J. and Amin, N. A. S. (2011) ‘A review on process conditions for optimum bio-oil
yield in hydrothermal liquefaction of biomass’, Renewable and Sustainable Energy Reviews.
Elsevier Ltd, 15(3), pp. 1615–1624. doi: 10.1016/j.rser.2010.11.054.
Arbogast, S. et al. (2017) ‘Commercialization of pyrolysis oil in existing refineries - Part
1’, Hydrocarbon Processing, 2017(JANUARY).
Auld, G., Gulbrandsen, L. H. and McDermott, C. L. (2008) ‘Certification Schemes and the
Impacts on Forests and Forestry’, Annual Review of Environment and Resources, 33(1), pp. 187–
211. doi: 10.1146/annurev.environ.33.013007.103754.
Balat, M. et al. (2009) ‘Main routes for the thermo-conversion of biomass into fuels and
chemicals. Part 1: Pyrolysis systems’, Energy Conversion and Management. Elsevier Ltd, 50(12),
pp. 3147–3157. doi: 10.1016/j.enconman.2009.08.014.
Bayar, T. (2013) ‘Sweden’s Bioenergy Success Story’, Renewable Energy World, March.
Berndes, G. et al. (2016) Forest biomass, carbon neutrality and climate change
mitigation. doi: 10.13140/RG.2.2.20407.52646.
Bezergianni, S. et al. (2018) ‘Refinery co-processing of renewable feeds’, Progress in
Energy and Combustion Science, 68, pp. 29–64. doi: 10.1016/j.pecs.2018.04.002.
Bloomberg Magazine (2017) ‘With End of Subsidies in Sight, Green Backers Move
Cautiously’, Bloomberg Technology, September.
Bridgwater, A. V. (2012) ‘Review of fast pyrolysis of biomass and product upgrading’,
Biomass and Bioenergy. Elsevier Ltd, 38, pp. 68–94. doi: 10.1016/j.biombioe.2011.01.048.
Bryden, K., Weatherbee, G. and Habib Jr, E. T. (2013) ‘FCC Pilot Plant Results with
Vegetable Oil and Pyrolysis Oil Feeds’. Biomass.
BTG (2012) Biomass Technology Group - official website, Technologies/Fast pyrolysis.
Butler, E. et al. (2011) ‘A review of recent laboratory research and commercial
developments in fast pyrolysis and upgrading’, Renewable and Sustainable Energy Reviews.
Elsevier Ltd, 15(8), pp. 4171–4186. doi: 10.1016/j.rser.2011.07.035.
Canfor Inc. (2016) ‘Canfor Pulp Products Inc. and Licella Fibre Fuels Pty. Ltd. enter into a
biofuels-biochemicals joint venture agreement’, May.

Assessment of likely Technology Maturation Pathways for production of biojet fuel (The ATM Project) March 2019
189
Centeno, A., Laurent, A. and Delmon, B. (1995) ‘Influence of the Support of CoMo Sulfide
Catalysts and of the Addition of Potassium and Platinum on the Catalytic Performances for the
Hydrodeoxygenation of Carbonyl, Carboxyl, and Guaiacol-Type Molecules’, Journal of Catalysis,
154(2), pp. 288–298. doi: 10.1006/jcat.1995.1170.
Choudhary, T. V. and Phillips, C. B. (2011) ‘Renewable fuels via catalytic
hydrodeoxygenation’, Applied Catalysis A: General. Elsevier B.V., 397(1–2), pp. 1–12. doi:
10.1016/j.apcata.2011.02.025.
Corma, A. et al. (2007) ‘Processing biomass-derived oxygenates in the oil refinery:
Catalytic cracking (FCC) reaction pathways and role of catalyst’, Journal of Catalysis, 247(2), pp.
307–327. doi: 10.1016/j.jcat.2007.01.023.
Czernik, S. and Bridgwater, A. (2004) ‘Overview of applications of biomass fast pyrolysis
oil’, Energy & Fuels, (12), pp. 590–598.
Dahmen, N. et al. (2012) ‘The bioliq® bioslurry gasification process for the production of
biosynfuels, organic chemicals, and energy’, Energy, Sustainability and Society. Springer Open
Ltd, 2(1), pp. 1–44. doi: 10.1186/2192-0567-2-3.
Diebold, J. and Czernik, S. (1997) ‘Additives to lower and stabilize the viscosity of
pyrolysis oils during storage’, Energy & Fuels, 0624(10), pp. 1081–1091.
Diebold, J. P. (2000) A Review of the Chemical and Physical Mechanisms of the Storage
Stability of Fast Pyrolysis Bio-Oils. Golden, CO, USA.
Drax Group plc (2015) A reliable , renewable future , today the way in the generation:
Annual report and accounts.
Dynamotive (2009) Dynamotive | Dynamotive Upgrades BioOil from Multiple Biomass
Sources to a Uniform Hydrocarbon Product. Provides Update on Upgraded BioOil® Corroborating
Analysis.
EIA (2009) Annual Energy Outlook 2009 with projections to 2030. Washington, DC, USA.
EIA (2013) Annual Energy Outlook 2013: Early Release Overview. Washington, DC, USA.
Elliott, D. C. (2007) ‘Historical developments in hydroprocessing bio-oils’, Energy and
Fuels, 21(3), pp. 1792–1815. doi: 10.1021/ef070044u.
Elliott, D. C. et al. (2015) ‘Hydrothermal liquefaction of biomass: Developments from
batch to continuous process’, Bioresource Technology. Elsevier Ltd, 178, pp. 147–156. doi:
10.1016/j.biortech.2014.09.132.
Ensyn (2013) Ensyn - official website, projects/renfrew-ontario.
Ericsson, K. and Werner, S. (2016) ‘The introduction and expansion of biomass use in
Swedish district heating systems’, Biomass and Bioenergy. Pergamon, 94, pp. 57–65. doi:
10.1016/J.BIOMBIOE.2016.08.011.
European Parliament and the Council of the European Union (2009) Directive 2009/28/EC
of the European Parliament and of the Council. European Parliament.

Assessment of likely Technology Maturation Pathways for production of biojet fuel (The ATM Project) March 2019
190
Ferrari, M. et al. (2001) ‘CoMo/carbon hydrodeoxygenation catalysts: influence of the
hydrogen activity of a CoMo/carbon catalyst’, Catalysis Today, 65(2–4), pp. 257–264.
Fogassy, G. et al. (2010) ‘Biomass derived feedstock co-processing with vacuum gas oil
for second-generation fuel production in FCC units’, Applied Catalysis B: Environmental. Elsevier
B.V., 96(3–4), pp. 476–485. doi: 10.1016/j.apcatb.2010.03.008.
Forest Practices Board (2015) Fuel Management in the Wildland Urban Interface.
Fortum (2013) Fortum’s bio-oil plant commissioned in Joensuu - first of its kind in the
world, Press releases.
Friesen, C. (2016) Kamloops Timber Supply Area Biomass Availability Estimation.
Vancouver.
Friesen, C. and Goodison, A. (2011) Estimating Quesnel Biomass Supply Using
FPInterface. Vancouver.
Furimsky, E. and Massoth, F. (1999) ‘Deactivation of hydroprocessing catalysts’, Catalysis
Today, 52.
Goudrian, F. and Peferoen, D. G. R. (1990) ‘Liquid fuels form biomass via a hydrothermal
process’, Chemical Engineering Science, 45(8), pp. 2729–2734.
Government of British Columbia (1996) Forest Act. Victoria: Government of British
Columbia.
Government of British Columbia (2002) Forest and Range Practices Act. SBC 2002.
Victoria: Government of British Columbia.
Government of British Columbia (2008) BC Bioenergy Strategy: Growing our natural
energy advantage.
Government of British Columbia (2016) Forest Fiber Action Plan.
Government of Canada (2017) Pricing carbon pollution in Canada: how it will work.
Green Fuel Nordic (2013) Green Fuel Nordic - official website, various sections.
Greig, M. and Bull, G. (2009) ‘Carbon Management in British Columbia’s Forests:
Opportunities and Challneges’, Forum American Bar Association, p. 55.
Hennenberg, K. J. et al. (2010) ‘The power of bioenergy-related standards to protect
biodiversity.’, Conservation biology : the journal of the Society for Conservation Biology, 24(2),
pp. 412–23. doi: 10.1111/j.1523-1739.2009.01380.x.
Hoberg, G. et al. (2016) ‘Forest carbon mitigation policy: A policy gap analysis for British
Columbia’, Forest Policy and Economics. Elsevier, 69, pp. 73–82. doi:
10.1016/J.FORPOL.2016.05.005.
ICAO (2016) ‘ICAO Environmental Report 2016’, p. 250. doi:
10.1017/CBO9781107415324.004.

Assessment of likely Technology Maturation Pathways for production of biojet fuel (The ATM Project) March 2019
191
IndexMundi (2013) Commodity Prices - Price Charts, Data, and News - IndexMundi.
InvestmentMine (2013) Commodity and Metal Prices, Metal Price Charts -
InvestmentMine.
Jones, S. et al. (2009) ‘Production of gasoline and diesel from biomass via fast pyrolysis’.
KiOR (2013) KiOR, Inc. - official website, various sections.
Landalv, I. (2013) Status report on Demonstration Plants for Advances Biofuels
Production - Thermochemical Pathways.
Lappas, A. A., Bezergianni, S. and Vasalos, I. A. (2009) ‘Production of biofuels via co-
processing in conventional refining processes’, Catalysis Today, 145(1–2), pp. 55–62. doi:
10.1016/j.cattod.2008.07.001.
Lehto, J. et al. (2013) Fuel oil quality and combustion of fast pyrolysis bio-oils, vtt.fi.
Lin, Y. et al. (2011) ‘Catalytic Hydrodeoxygenation of Guaiacol on Rh-Based and Sulfided
CoMo and NiMo Catalysts’, Energy & Fuels, pp. 890–896. doi: dx.doi.org/10.1021/ef101521z.
Meier, D. et al. (2013) ‘State-of-the-art of fast pyrolysis in IEA bioenergy member
countries’, Renewable and Sustainable Energy Reviews. Elsevier, 20, pp. 619–641. doi:
10.1016/j.rser.2012.11.061.
de Miguel Mercader, F. et al. (2010) ‘Production of advanced biofuels: Co-processing of
upgraded pyrolysis oil in standard refinery units’, Applied Catalysis B: Environmental. Elsevier
B.V., 96(1–2), pp. 57–66. doi: 10.1016/j.apcatb.2010.01.033.
de Miguel Mercader, F. et al. (2010) ‘Pyrolysis oil upgrading by high pressure thermal
treatment’, Fuel, 89(10), pp. 2829–2837.
Mortensen, P. M. et al. (2011) ‘A review of catalytic upgrading of bio-oil to engine fuels’,
Applied Catalysis A: General. Elsevier B.V., 407(1–2), pp. 1–19. doi:
10.1016/j.apcata.2011.08.046.
Murray, G. (2015) ‘Status Update : Canadian Wood Pellet Industry’.
Natural Resources Canada (2017) Forest Certification in Canada.
Nielsen, R. P., Olofsson, G. and Søgaard, E. G. (2012) ‘CatLiq – High pressure and
temperature catalytic conversion of biomass: The CatLiq technology in relation to other
thermochemical conversion technologies’, Biomass and Bioenergy, 39, pp. 399–402. doi:
10.1016/j.biombioe.2012.01.035.
NSF (2011) Developing New Paradigms for Biofuel Separations to Enable an Alternative
Fuels Future (Based on the April 4-5, 2011 Workshop at Arlington, VA). Arlington, VA, USA.
Oasmaa, A. and Czernik, S. (1999) ‘Fuel Oil Quality of Biomass Pyrolysis Oils: State of the
Art for the End Users’, Energy & Fuels, 13, pp. 914–921.
Pearlson, M. N. (2011) A techno-economic and environmental assessment of
hydroprocessed renewable distillate fuels (Master Thesis). Massachusetts Institute of Technology.

Assessment of likely Technology Maturation Pathways for production of biojet fuel (The ATM Project) March 2019
192
Peterson St-Laurent, G., Hagerman, S. and Hoberg, G. (2017) ‘Emergence and influence
of a new policy regime: The case of forest carbon offsets in British Columbia’, Land Use Policy, 60,
pp. 169–180. doi: 10.1016/j.landusepol.2016.10.025.
Pinho, A. D. R. et al. (2015) ‘Co-processing raw bio-oil and gasoil in an FCC Unit’, Fuel
Processing Technology. Elsevier B.V., 131, pp. 159–166. doi: 10.1016/j.fuproc.2014.11.008.
Pinho, A. de R. et al. (2017) ‘Fast pyrolysis oil from pinewood chips co-processing with
vacuum gas oil in an FCC unit for second generation fuel production’, Fuel. The Authors, 188, pp.
462–473. doi: 10.1016/j.fuel.2016.10.032.
Pledger, S. (2016) Simulation Modeling of Forest Biomass Operations and Harvest Residue
Moisture Content. University of British Columbia.
Programme for Endorsed Forest Certifications (2015) PEFC to Develop Mechanism for the
Transfer of GHG Emission Data.
Ringer, M., Putsche, V. and Scahill, J. (2006) ‘Large-Scale Pyrolysis Oil Production: A
Technology Assessment and Economic Analysis’, Nrel/Tp-510-37779, (November), pp. 1–93. doi:
10.2172/894989.
Rosenbaum, K. L., Schoene, D. and Mekouar, A. (2006) Climate change and the forest
sector. Possible national and subnational legislation, FAO Forestry Paper. doi: ISBN:
9789251052006.
Sitzmann, J. (2009) Upgrading of fast pyrolysis oils by hot filtration. Aston University, UK.
Solantausta, Y. (2011) ‘BIOCOUP, Co-processing of upgraded bio-liquids in standard
refinery units, Final Activity Report’, pp. 1–38. Available at:
http://www.biocoup.com/uploads/media/BIOCOUP_Publishable_final_activity_report_01.pdf.
St-laurent, G. P. et al. (2017) Evaluating options for managing British Columbia’s forest
sector to mitigate climate change.
Starck, J. (2012) ‘Green Fuel Nordic’, IEA bioenergy Task 34 Newsletter #32, July, pp. 5–
6.
Stefanidis, S. D., Kalogiannis, K. G. and Lappas, A. A. (2017) ‘Co-processing bio-oil in the
refinery for drop-in biofuels via fluid catalytic cracking’, Wiley Interdisciplinary Reviews: Energy
and Environment, (October), p. e281. doi: 10.1002/wene.281.
Stephen, J. D., Mabee, W. E. and Saddler, J. (2010) ‘Biomass logistics as a determinant of
second- generation biofuel facility scale , location and technology’, Biofuels Bioproducts &
Bioerefining, 4(5), pp. 513–518. doi: 10.1002/bbb.
Stupak, I. et al. (2011) ‘Criteria and indicators for sustainable forest fuel production and
harvesting: A review of current standards for sustainable forest management’, Biomass and
Bioenergy, 35(8), pp. 3287–3308. doi: 10.1016/j.biombioe.2010.11.032.
U.S. Department of Commerce (2015) International Trade Association: Renewable Fuels
Top Markets Report.
U.S. EIA (2007) Refinery outages, description and potential impact on petroleum product

Assessment of likely Technology Maturation Pathways for production of biojet fuel (The ATM Project) March 2019
193
prices. Washington, DC: Energy Information Administration. US Department of Energy.
Upham, P., Tomei, J. and Dendler, L. (2011) ‘Governance and legitimacy aspects of the
UK biofuel carbon and sustainability reporting system’, Energy Policy, 39(5), pp. 2669–2678. doi:
10.1016/j.enpol.2011.02.036.
Venderbosch, R. and Prins, W. (2011) ‘Fast Pyrolysis’, in Brown, R. C. (ed.)
Thermochemical Processing of Biomass: Conversion into Fuels, Chemicals and Power. 1st edn.
Hoboken, NJ, USA: Wiley-VCH, pp. 144–176.
Vispute, T. P. et al. (2010) ‘Renewable chemical commodity feedstocks from integrated
catalytic processing of pyrolysis oils.’, Science (New York, N.Y.), 330(6008), pp. 1222–7. doi:
10.1126/science.1194218.
Wang, H., Male, J. and Wang, Y. (2013) ‘Recent Advances in Hydrotreating of Pyrolysis
Bio-Oil and Its Oxygen-Containing Model Compounds’, ACS Catalysis, 3(5), pp. 1047–1070. doi:
10.1021/cs400069z.
Weyen, R. (2012) ‘A Refiner ’ s Perspective on Advanced Biofuels’, NABC Highlights, p. 4.
Available at: http://www.nabcprojects.org/pdfs/refiner_perspective_advanced_biofuels.pdf.
Wildschut, B. J. (no date) Pyrolysis Oil Upgrading to Transportation Fuels by Catalytic
Hydrotreatment.
Wildschut, J. et al. (2009) ‘Hydrotreatment of Fast Pyrolysis Oil Using Heterogeneous
Noble-Metal Catalysts’, Industrial & Engineering Chemistry, 48(23), pp. 10324–10334.
Wildschut, J. et al. (2010) ‘Insights in the hydrotreatment of fast pyrolysis oil using a
ruthenium on carbon catalyst’, Energy & Environmental Science, 3, pp. 962–970.
Wildschut, J., Melian-Cabrera, I. and Heeres, H. J. (2010) ‘Catalyst studies on the
hydrotreatment of fast pyrolysis oil’, Applied Catalysis B: Environmental, 99(1–2), pp. 298–306.
Wright, M. M. et al. (2010) ‘Techno-economic analysis of biomass fast pyrolysis to
transportation fuels’, (November), p. 62. doi: 10.1016/j.fuel.2010.07.029.
Zacher, A. (2015) ‘DOE Bioenergy Technologies Office ( BETO ) 2015 Project Peer Review
Optimizing Co-Processing of Bio-Oil in Refinery Unit Operations Using a Davison Circulating Riser
(DCR)’.
Chapter 2
Agriculture and Agri-Food Canada, 2012. Biomass Inventory Mapping and Analysis Tool &
Related activities. Prepared by Stumborg, M., Townley-Smith, L., and Lee, D. Access from
http://www.ontariobiomass.com/resources/Documents/Presentations/Can%20International%20Fa
rm%20Show%20BIMAT%202012%20.pdf on July 2018.
AEBIOM European Biomass Association, BC Bioenergy Network, U.S. Industrial Pellet
Association and Wood Pellet Association of Canada, 2013. Forest Sustainability and Carbon

Assessment of likely Technology Maturation Pathways for production of biojet fuel (The ATM Project) March 2019
194
Balance of EU Importation of North American Forest Biomass for Bioenergy Production.
Biomass Inventory Mapping and Analysis Tool (BIMAT), 2018. Access from
http://www.agr.gc.ca/atlas/bimat on May 2018.
Bradburn, K., 2014 .2014 CanBio report on the status of bioenergy in Canada.
Canadian Council of forest ministers, 2016. Sustainable forest management policies in
Canada.
Canadian Council of forest ministers, 2018. Overview- Canada’s Forests. Access from
http://www.sfmcanada.org/en/canada-s-forests on July 2018.
FPInnovations, 2010. Bio-energy and Bio-chemicals Synthesis Report. FPAC Bio-Pathways
Project Phase II.
FPInnovations, 2018a. Estimating Williams Lake TSA biomass supply using FPInterface.
FPInnovations technical reports. Prepared by Friesen, C.
FPInnovations, 2018b. Estimating Prince George TSA biomass supply using FPInterface.
FPInnovations technical reports. Prepared by Friesen, C.
Government of Alberta, 2014. Sustainable forest management- 2013 Facts and Statistics:
General Boundary Information. Environment and sustainable resource development, ISBN 978-1-
4601-1950-1.
IEA Bioenergy, 2018. Country Report: Canada 2018 update Bioenergy policies and status
of implementation. Prepared by MacLeod, A. and Pelkmans L.
Industrial Forestry Service Ltd., M.D.T. Ltd. and Murray Hall Consulting Ltd., 2015. Wood
Biomass Energy Potential of British Columbia. 2015 Resource Options Report Update. Prepared for
BC Hydro’s Integrated Resource Planning Process.
International Wood Markets Group Inc., 2014. Wood products business case options for
the Fort Nelson area. Prepared for Northern Rockies Regional Municipality.
Li, X., Mupondwa, E., Panigrahi, S., Tabil, L., Sokhansanj, S., Stumborg, M., 2012. A
review of agricultural crop residue supply in Canada for cellulosic ethanol production. Renewable
and Sustainable Energy Reviews, 16, 2954-2965.
Mobini, 2015. On the design and analysis of forest biomass to biofuel and bioenergy
supply chains. Ph.D. thesis, The University of British Columbia.
Murray, G., 2010. Lillooet Biomass Energy Corporation: Business plan for a wood pellet
plant.
National Forestry Database, 2017. Annual harvest versus wood supply. Access from
http://nfdp.ccfm.org/en/data/woodsupply.php on June 2018.
Natural Resources Canada, 2018. Inventory and land-use change. Access from
http://www.nrcan.gc.ca/forests/climate-change/carbon-accounting/13111 on June 2018.
Natural Resources Canada, 2016. Renewable energy facts. Access from

Assessment of likely Technology Maturation Pathways for production of biojet fuel (The ATM Project) March 2019
195
https://www.nrcan.gc.ca/energy/facts/renewable-energy/20069 on June 2018.
Nicholls, D., 2016. Kamloops Timber Supply Area. Ministry of Forests, Lands, Natural
Resource Operations and Rural Development.
Nicholls, D., 2017. Prince George Timber Supply Area. Ministry of Forests, Lands, Natural
Resource Operations and Rural Development.
Pinnacle Renewable Energy Inc., 2014. Sustaining the growth of British Columbia’s wood
pellet industry.
Roach, J. and S.M. Berch. 2014. A compilation of forest biomass harvesting and related
policy in Canada. Prov. B.C., Victoria, B.C. Tech. Rep. 081.
Timberline Natural Resource Group Ltd., 2009. Fibre use and fibre supply study: Merritt
TSA. Prepared for the Southern Interior Beetle Action Coalition.
Timmenga & Associates Inc., 2008. Potential for bioenergy in the Dawson Creek area.
Draft Final Report - Inventory & Analysis. Prepared for City of Dawson Creek.
Statistics Canada, 2016. Disposal of waste, by source. Access from
https://www150.statcan.gc.ca/t1/tbl1/en/tv.action?pid=3810003201 on March 2018.
Strauss, W., 2016. The industrial pellet export sector: the keys to successful projects.
Future Metrics publications.
US Department of Agriculture (USDA), 2018. Canada Biofuels Annual- 2017. Prepared by
USDA Foreign Agricultural Service- Global Agricultural Information Network.
Wang, Y., Ebadian, M., Sokhansanj, S., Webb, E., Lau, A., 2017. Impact of the biorefinery
size on the logistics of corn stover supply – A scenario analysis. Journal of Applied Energy, 198,
360-376.
Pacific Institute for Climate Solutions (2010). The Potential of BC’s Waste and By-Product Hydrogen. Produced by ISIS – A Research Centre, Sauder School of Business, University of British Columbia.
Air Products, 2010. Air Products’ Heartland Hydrogen Pipeline in Canada Commercialized. Available at http://www.airproducts.com/Company/news-center/2010/11/1108-air-products-heartland-hydrogen-pipeline-in-canada-commercialized.aspx.
Air Products, 2016. Air Products Cuts Ribbon on New World-Scale Hydrogen Plant in Fort Saskatchewan, Canada. Available at
http://www.airproducts.ca/Company/news-center/2016/07/0707-air-products-cuts-ribbon-on-new-world-scale-hydrogen-plant-in-scotford-canada.aspx
Cohen, M. and Snow, G.C., 2008. Hydrogen Delivery and Storage Options For Backup Power and Off-Grid Primary Power Fuel Cell Systems. Published in IEEE Intelec 2008 Proceedings.
Dalcor Consultants Ltd. & Intuit Strategies Inc., in consultation with Deligianis, G., Fairlie, M. and Potter, I., 2004. Canadian Hydrogen – Current Status and Future Prospects. Prepared for Natural Resources Canada.

Assessment of likely Technology Maturation Pathways for production of biojet fuel (The ATM Project) March 2019
196
Fortis BC, 2017. Government of Canada Invests in Renewable Natural Gas. Available at https://www.fortisbc.com/MediaCentre/NewsReleases/2017/Pages/Government-of-Canada-Invests-in-Renewable-Natural-Gas.aspx
Hydrogen Systems Project Team (Canadian Hydrogen Association and Natural Resources Canada), 2005. A Discussion Paper for Greenhouse Gas Reduction and Economic Growth.
IHS, 2015. Chemical Economics Handbook: Hydrogen. Available at
https://www.ihs.com/products/hydrogen-chemical-economics-handbook.html
International Energy Agency (IEA), 2007. Hydrogen Production & Distribution.
Lipman, T., 2011. An Overview of Hydrogen Production and Storage Systems with Renewable Hydrogen Case Studies. Conducted under US DOE Grant DE-FC3608GO18111 A000, Office of Energy Efficiency and Renewable Energy Fuel Cell Technologies Program.
Natural Resource Canada, 2015. Hydrogen and oxygen production: advanced integrated processes for hydrogen and oxygen production. Available at https://www.nrcan.gc.ca/energy/coal/carbon-capture-storage/4309
Philibert, C., 2017. Producing ammonia and fertilizers: new opportunities from renewables. Renewable Energy Division, International Energy Agency.
Sustainable Development Technology Canada (STDC), 2006. Renewable Fuel- Hydrogen. Sustainable Development business case report, BC_RFH_V7.12.1_EG_061123.
Chapter 3
Canmet references
Al-Marshed, A., Hart, A., Leeke, G., Greaves, M. and Wood, J., “Effectiveness of Different
Transition Metal Dispersed Catalysts for In Situ Heavy Oil Upgrading”, Ind. Eng. Chem. Res. 2015, 54
(43), 10645-10655.
Ardiyanti, A.R., Gutierrez, A., Honkela, M.L., Krause, A.O.I. and Heeres, H.J., “Hydroteatment
of wood-based pyrolysis oil using zirconia-supported mono- and bimetallic (Pd, Pd, Rh) catalysts”Appl.
Catal., A 2011, 407 (1-2), 56-66.
Baldauf, W., Balfanz, U., and Rupp, M., “Upgrading of flash pyrolysis oil and utilization in
refineries”, Biomass Bioenergy 1994, 7 (1), 237-244.
Butler, E., Devlin, G., Meier, D., and McDonnell, K., “A review of recent laboratory research and
commercial developments in fast pyrolysis and upgrading”, Renew. Sustainable Energy Rev. 2011, 15
(8), 4171-4186.
Ikura, M., Mirmiran, S., Stanciulescu, M. and Sawatzky, H., “Pyrolysis liquid-in-diesel oil
microemulsions”, U.S. Patent 5,820,640, October, 13, 1998.
Ikura, M., Stanciulescu, M. and Kelly, J.F., “Production of highly dispersed hydrogenation
catalyst”, U.S. Patent 5,283,217, February 1, 1994.
Ikura, M., Stanciulescu, M., and Hogan, E., “Emulsification of pyrolysis derived bio-oil in diesel
fuel”, Biomass Bioenergy 2003, 24, 221–232.
Assessment of likely Technology Maturation Pathways for production of biojet fuel (The ATM Project) March 2019
197
Monnier, J., Zhang Y. and Ikura, M., “Hydroprocessing of Bio-oils using Highly Dispersed MoS2
Catalysts”, 24th Canadian Symposium on Catalysis, Ottawa, ON, May 9, 2016.
Monnier, J., Zhang, Y. and Ikura, M., “Hydroprocessing of bio-oils using highly dispersed
catalysts”, 24th North American Catalysis Society Meeting, Pittsburgh, Pennsylvania, USA, June 17, 2015.
Mortensen, P.M., Grunwaldt, J.-D., Jensen, P.A., Knudsen, K.G. and Jensen, A.D., “A review of
catalytic upgrading of bio-oil to engine fuels”, Appl. Catal., A 2011, 407 (1-2), 1-19.
Panariti, N., Del Bianco, A., Del Piero, G. and Marchionna, M., “Petroleum residue upgrading
with dispersed catalysts. Part 1. Catalysts activity and selectivity”, Appl. Catal., A 2000, 204 (2), 203-
213.
Tian, K.P., Mohamed, A.R. and Bhatia, S., “Catalytic upgrading of petroleum residual oil by
hydrotreating catalysts: A comparison between dispersed and supported catalysts”, Fuel 1998, 77 (11),
1221-1227.
Tye, C.T. and Smith, K.J., “Cold Lake bitumen upgrading using exfoliated MoS2”, Catal. Lett.
2004, 95 (3-4), 203-209.
Chapter 4
References
Agusdinata, D.B., Zhao, F., Ileleji, K. and DeLaurentis, D. 2011. Life cycle assessment of
potential biojet fuel production in the United States. Environmental Science & Technology 45,
9133-9143.
Alberici, S. and Spoettle, M. 2016. Roadmap for a meta-standard for sustainable
alternative jet fuels. Final report. ECOFYS Germany GmbH, Berlin, Germany. Retrieved 27 Sept.
2017 from https://www.ecofys.com/files/files/ecofys-2016-roadmap-meta-standard-sust-alt-jet-
fuels.pdf
International Air Transport Association (IATA). 2009. Halving emissions by 2050: Aviation
brings its targets to Copenhagen. Press Release No: 54. IATA. Retrieved 26 Sept. 2017 from
http:// www.iata.org/pressroom/pr/Pages/2009-12-08-01. aspx
International Air Transport Association (IATA). 2012. IATA guidance material for biojet
fuel management. Montreal, Canada. Retrieved 28 Nov. 2017 from
https://www.iata.org/publications/Documents/guidance-biojet-management.pdf
International Air Transport Association (IATA). 2017. Improving environmental
performance. Retrieved 26 Sept. 2017 from
http://www.iata.org/whatwedo/environment/pages/index.aspx
Roundtable on Sustainable Biomaterials. 2014. RSB GHG Calculation Methodology, RSB
reference code: RSB-STD-01-003-01 (Version 2.1). Roundtable on Sustainable Biomaterials,
Geneva, Switzerland. Retrieved 26 Sept. 2017 from https://rsb.org/wp-
content/uploads/2017/02/12-12-20-RSB-STD-01-003-01-RSB-GHG-Calculation-Methodology-
v2.1.pdf
Assessment of likely Technology Maturation Pathways for production of biojet fuel (The ATM Project) March 2019
198
Roundtable on Sustainable Biomaterials (RSB). 2011. Consolidated RSB EU RED Principles
& Criteria for Sustainable Biofuel Production, RSB reference code: [RSB-STD-11-001-01-001
(Version 2.1)]. Retrieved 26 Sept. 2017 from http://rsb.org/pdfs/ standards/RSB-EU-RED-
Standards/13-03-01- RSB-STD-11-001-01-001%20vers%202.1%20
Consolidated%20RSB%20EU%20RED%20 PCs.pdf
ICAO. 2017. Guidance Document for the Calculation and Submission of Alternative Jet
Fuel Lifecycle Analysis Data for Default Values under the Global Market-based Measure. Prepared
by the International Civil Aviation Organization – Committee on Aviation Environmental Protection
Alternative Fuels Task Force (ICAO-CAEP AFTF)
References
Brander, M., Tipper, R., Hutchinson, C., Davis, G., 2009. Consequential and Attributional
Approaches to LCA: a Guide to Policy Makers with Specific Reference to Greenhouse Gas LCA of
Biofuels. http://d3u3pjcknor73l.cloudfront.net/assets/media/pdf/approachesto_LCA3_technical.pdf
Akagi, S. K., Yokelson, R. J., Wiedinmyer, C., Alvarado, M. J., Reid, J. S., Karl, T., Crounse, J. D., and Wennberg, P. O. 2017. Emission factors for
open and domestic biomass burning for use in atmospheric models, Atmos. Chem. Phys., 11, 4039-4072, https://doi.org/10.5194/acp-11-4039-2011
Chapter 5
References
Pedersen, T. H., Hansen, N. H., Pérez, O. M., Cabezas, D. E. V., & Rosendahl,
L. A. (2018). Renewable hydrocarbon fuels from hydrothermal liquefaction: A techno‐
economic analysis. Biofuels, Bioproducts and Biorefining, 12(2), 213-223.
US Drive, 2017. Hydrogen Delivery Roadmap. Retrieved from:
https://www.energy.gov/sites/prod/files/2017/11/f46/HPTT%20Roadmap%20FY17%20
Final_Nov%202017.pdf
Jones, S. B., Valkenburg, C., Walton, C. W., Elliott, D. C., Holladay, J. E.,
Stevens, D. J., ... & Czernik, S. (2009). Production of gasoline and diesel from biomass
via fast pyrolysis, hydrotreating and hydrocracking: a design case (No. PNNL-18284
Rev. 1). Pacific Northwest National Lab.(PNNL), Richland, WA (United States).
Assessment of likely Technology Maturation Pathways for production of biojet fuel (The ATM Project) March 2019
199
APPENDIX A
Co-processing of biocrudes in existing refineries
Insertion of bio-oils/biocrudes in the fluid catalytic cracker Recently Stefanidis et al. (2017) (Bezergianni et al., 2018) discussed the possible
insertion of bio-oil/biocrudes in the fluid catalytic cracker. These authors suggested that increased
coking and reactor plugging due to char and coke formation made raw bio-oil unsuitable for co-
processing unless the bio-oil was first upgraded through hydrotreatment to remove oxygen.
However, they also indicated that these findings were a result of the experimental set-up as the
conditions did not resemble a real FCC as different conclusions were obtained when using a pilot
scale FCC under more realistic conditions. In related work de Rezende Pinho et al. (2015, 2017)
(Pinho et al., 2015, 2017) looked at the co-processing of bio-oil in the FCC after appropriate
reactor modifications, including separate injection of bio-oil. However, other workers (F. de Miguel
Mercader et al., 2010) have argued that only the most reactive compounds and functional groups
needed to be stabilised and thus, up to a 28% oxygen can be tolerated.
Despite these differences in opinion, there seems to be a general consensus that partial
deoxygenation of bio-oil is probably required before insertion, if potential suppliers are to meet the
minimum requirements of the refinery. However, complete deoxygenation of bio-oil is expensive
since deoxygenation gets disproportionately costlier when approaching an oxygen-free status.
(Ringer, Putsche and Scahill, 2006; Elliott, 2007; Arbogast et al., 2017) Catalytic pyrolysis bio-oils
and biocrudes from hydrothermal liquefaction are already partially deoxygenated and could
potentially bypass intermediate steps prior to catalytic cracking. However, many partially
deoxygenated bio-oils and HTL biocrudes have very high viscosities, making pumping difficult.
(Elliott, 2007; Choudhary and Phillips, 2011; Elliott et al., 2015)
Earlier FCC-based trials which looked at co-processing bio-oil in blends with vacuum gas
oil (VGO) demonstrated that lower H/C ratio products were produced when compared to
processing VGO alone. (Corma et al., 2007; Lappas, Bezergianni and Vasalos, 2009) It was also
concluded that heavier (coke and tar) and lighter (gasoline and gases) fractions were produced at
the expense of middle distillates while the gasoline produced was generally poorer in saturates
and richer in aromatics. (Lappas, Bezergianni and Vasalos, 2009)
In related studies, a mixture of 20% HDO bio-oil (at 20% oxygen) was co-processed in an
FCC with petroleum VGO (Fogassy et al., 2010) while de Miguel Mercader et al. (2010) (F. de
Miguel Mercader et al., 2010) co-processed an HDO bio-oil (28% oxygen) with a Long Residue
heavy petroleum feed. Both of these studies reported a decrease in the coking propensity of HDO
bio-oils when they were blended as compared to fossil feeds catalytic cracking. This was attributed
to the transfer of hydrogen from the petroleum to the biomass feed during co-processing.
In more recent work, where FCC co-processing of raw bio-oils with a 51% oxygen content
was tested, (Pinho et al., 2015, 2017) the oxygen was primarily removed as H2O, while CO yields
were higher than CO2 yields. Co-processing resulted in gasoline and diesel products with some
renewable content, as determined by 14C isotopic measurement. A 10 wt% blend of bio-oil
resulted in a 2% renewable content in the total liquid product. (Pinho et al., 2015) It was also
concluded that oxygen removal took place through hydrogen transfer from the fossil feed
molecules. This resulted in a higher aromatic content in the final products, with higher levels of
phenolics found in the naphtha product. It is important to note the experimental set-up for this
FCC demonstration study, in contrast to the many previous laboratory/pilot scale tests, featured a
Assessment of likely Technology Maturation Pathways for production of biojet fuel (The ATM Project) March 2019
200
circulating riser with different feed nozzles. This allowed the separate insertion of the bio-oil (at
50oC) at a higher point in the riser, compared with the temperature of the VGO at 220-280oC. It
also resulted in lower coke formation than the FCC labscale test using Micro Activity Testing (MAT)
where the feed was blended and heated prior to insertion into the reactor. Thus, de Rezende Pinho
et al (2015) (Pinho et al., 2015) concluded that lab-scale testing was not adequately able to
predict the behaviour of co-processing of bioblends in an FCC, as it was difficult to replicate real
reactor conditions. Bezergianni et al. (Bezergianni et al., 2018) came to a similar conclusion,
although they thought the observation was mostly applicable to raw bio-oil cracking. However, in
earlier work, Bryden et al. (2013) (Bryden, Weatherbee and Habib Jr, 2013) found increased coke
formation in spite of using a pilot-scale circulating riser reactor and modified feed delivery system.
This was similar to the subsequent results reported by Zacher et al. (2015) (Zacher, 2015) where
changes in yield of products were also reported, specifically a reduced gasoline yield.
Other related work has suggested that the co-processing of hydrogen deficient bio-oils
with hydrogen-rich petroleum feeds can have a positive synergistic effect in mitigating the
production of solid by-products. (Stefanidis, Kalogiannis and Lappas, 2017) This indicated that the
characteristics of the fossil feed will impact potential synergy, as hydrogen transfer between the
fossil feed and bio-components takes place.
In summary, while catalytic cracking of raw pyrolysis oil is possible, when certain
modifications are made to overcome miscibility problems, the processing of hydrodeoxygenated
oils (HDO) and catalytic pyrolysis oils (CPO) is usually easier. (Stefanidis, Kalogiannis and Lappas,
2017)
Insertion of bio-oils/biocrudes into the hydrotreater The lack of miscibility of bio-oils with the fossil feed is a key problem as hydrotreating
cannot take place unless mixing takes place. However, most studies on co-processed
hydrotreatment have used model compound and the results have therefore been difficult to apply
to real bio-oils. (Bezergianni et al., 2018)
As mentioned earlier, hydrotreatment units are sensitive to oxygen and unlikely to be
used to process bio-oils with an oxygen content that exceeds about 5% at blending ratios of less
than 10%. (Solantausta, 2011) Depending on the molecular weight distribution of the bio-oil,
cracking of molecules may be required, although this is not usually carried out in the hydrotreater
as mild conditions are used. However, hydrocracking typically follows hydrotreating in an oil
refinery and it is even less tolerant to oxygen than hydrotreatment (due to higher pressures and
temperatures).
There is limited experimental data on co-feeding of real bio-oils with petroleum feeds in
hydrotreating units. This is not unexpected as problems such as increased coking and catalyst
deactivation, increased hydrogen demand and potential irregular hydrogen pressure drops inside
the reactor can be anticipated. (Butler et al., 2011).
It is apparent that both FCCs and hydroprocessing refinery units can accept bio-oils that
have been partially deoxygenated (HDOs). However, the two facilities differ in their relative
suitability for biofeed insertion (Table 86). It has been shown that FCCs can handle lower grade
(up to 20% oxygen) HDOs without the need for hydrogen and this results in low conversion yields,
large amounts of waste energy production and lower value end products (low H/C ratio) which will
contribute mostly to marine and bunker fuel blendstocks. In this regard FCC can be viewed as the
“workhorse” of bio-oil co-processing. Alternatively, hydroprocessing could be considered the
refinery’s “boutique” upgrading unit as it requires more deoxygenated bio-oil co-feed (max of 3-
5%) and it is designed to produce higher grade diesel and jet fuels.
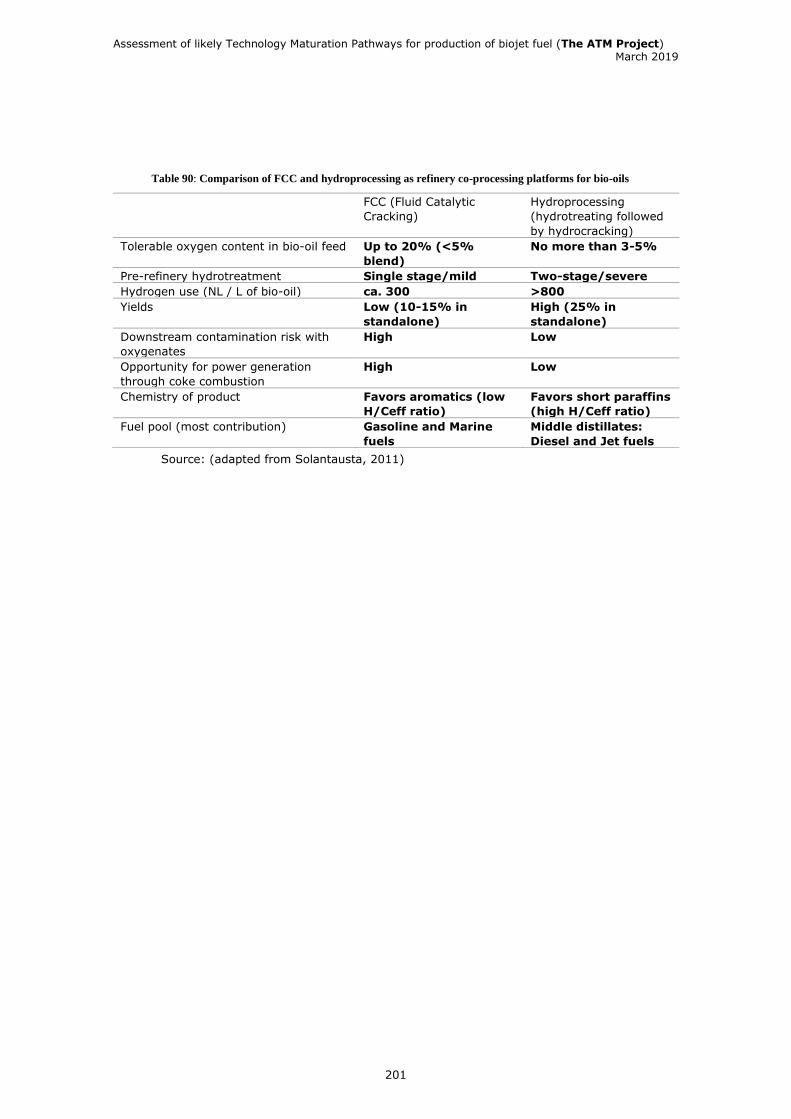
Assessment of likely Technology Maturation Pathways for production of biojet fuel (The ATM Project) March 2019
201
Table 90: Comparison of FCC and hydroprocessing as refinery co-processing platforms for bio-oils
Source: (adapted from Solantausta, 2011)
FCC (Fluid Catalytic
Cracking)
Hydroprocessing
(hydrotreating followed
by hydrocracking)
Tolerable oxygen content in bio-oil feed Up to 20% (<5%
blend)
No more than 3-5%
Pre-refinery hydrotreatment Single stage/mild Two-stage/severe
Hydrogen use (NL / L of bio-oil) ca. 300 >800
Yields Low (10-15% in
standalone)
High (25% in
standalone)
Downstream contamination risk with
oxygenates
High Low
Opportunity for power generation
through coke combustion
High Low
Chemistry of product Favors aromatics (low
H/Ceff ratio)
Favors short paraffins
(high H/Ceff ratio)
Fuel pool (most contribution) Gasoline and Marine
fuels
Middle distillates:
Diesel and Jet fuels

Assessment of likely Technology Maturation Pathways for production of biojet fuel (The ATM Project) March 2019
202
APPENDIX B Source and cost of hydrogen
Introduction Hydrogen supply is generally divided into “captive” hydrogen, produced at refineries for
production of fuels and chemicals, and “merchant” hydrogen, produced for trading purposes. While
both use similar methods for hydrogen production, merchant hydrogen has the added cost of
compression or liquefaction and transportation due to its low energy density. This can add a
significant cost as specialized equipment and containers are required. Therefore hydrogen is used
as close to the source of production as possible.
As a biofuel production facility will require large volumes of hydrogen, options for sourcing
include:
• Building its own infrastructure for production of hydrogen based on a variety of
different technologies;
• Purchasing merchant hydrogen from a trader;
• Co-location of the biofuel facility next to a petroleum refinery or facility with
excess hydrogen production capacity, called “over-the-fence” hydrogen;
• Sourcing by-product hydrogen, which is produced as a waste product from an
industrial facility and is usually flared and not utilized for further value addition.
This will likely require purification of the hydrogen before use.
While the cost of different production technologies will play a role in selection, the
environmental impact of the hydrogen production must play an important role if production of
biofuels with low carbon intensity is the objective. The environmental impact of hydrogen
production is based on the feedstock used, as well as the source of electricity. Natural gas is the
most common feedstock used for hydrogen production, but other feedstocks could include coal,
biomass or renewable natural gas. Coal is considered the least environmentally friendly feedstock.
Electrolysis of water can be very sustainable provided renewable electricity (solar, wind, hydro) is
used.
On a global scale, about 96% of all hydrogen is derived from fossil fuels, with natural gas
being by far the most prominent source at an estimated 49%, followed by liquid hydrocarbons at
29%, 18% from coal, and about 4% from electrolysis and other by-product sources of hydrogen
(IHS, 2015) (Figure 66).
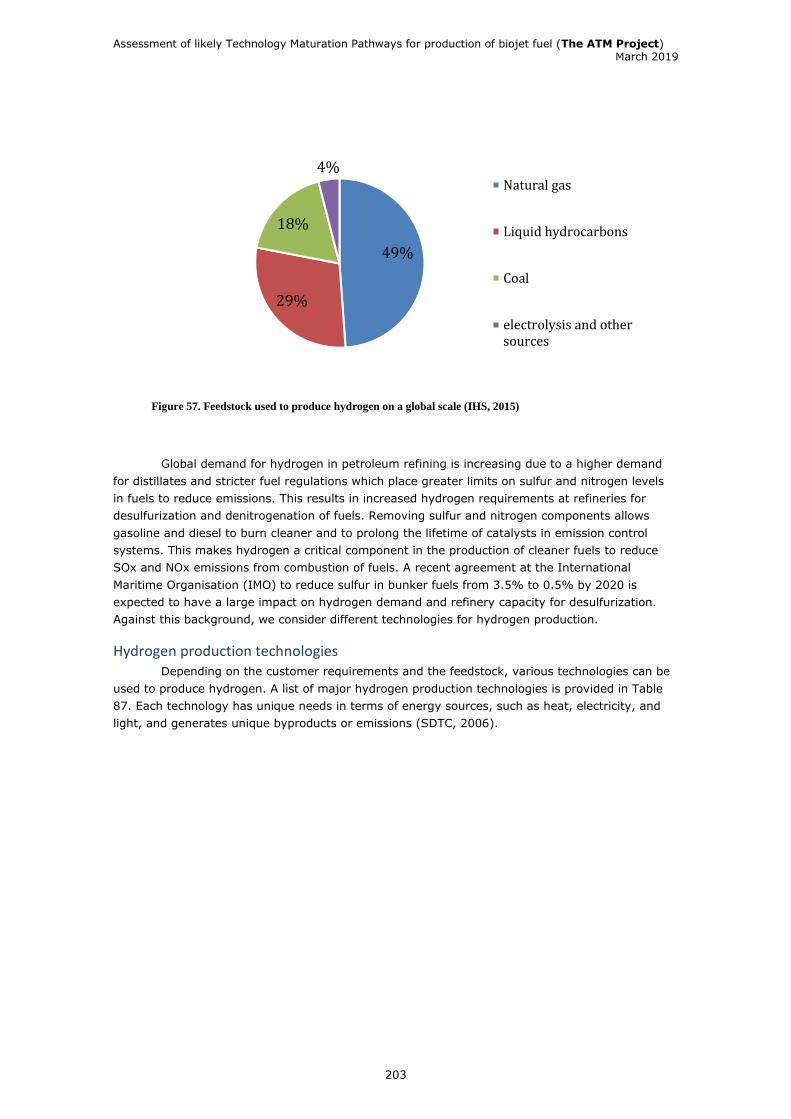
Assessment of likely Technology Maturation Pathways for production of biojet fuel (The ATM Project) March 2019
203
Figure 57. Feedstock used to produce hydrogen on a global scale (IHS, 2015)
Global demand for hydrogen in petroleum refining is increasing due to a higher demand
for distillates and stricter fuel regulations which place greater limits on sulfur and nitrogen levels
in fuels to reduce emissions. This results in increased hydrogen requirements at refineries for
desulfurization and denitrogenation of fuels. Removing sulfur and nitrogen components allows
gasoline and diesel to burn cleaner and to prolong the lifetime of catalysts in emission control
systems. This makes hydrogen a critical component in the production of cleaner fuels to reduce
SOx and NOx emissions from combustion of fuels. A recent agreement at the International
Maritime Organisation (IMO) to reduce sulfur in bunker fuels from 3.5% to 0.5% by 2020 is
expected to have a large impact on hydrogen demand and refinery capacity for desulfurization.
Against this background, we consider different technologies for hydrogen production.
Hydrogen production technologies Depending on the customer requirements and the feedstock, various technologies can be
used to produce hydrogen. A list of major hydrogen production technologies is provided in Table
87. Each technology has unique needs in terms of energy sources, such as heat, electricity, and
light, and generates unique byproducts or emissions (SDTC, 2006).
49%
29%
18%
4%Natural gas
Liquid hydrocarbons
Coal
electrolysis and othersources
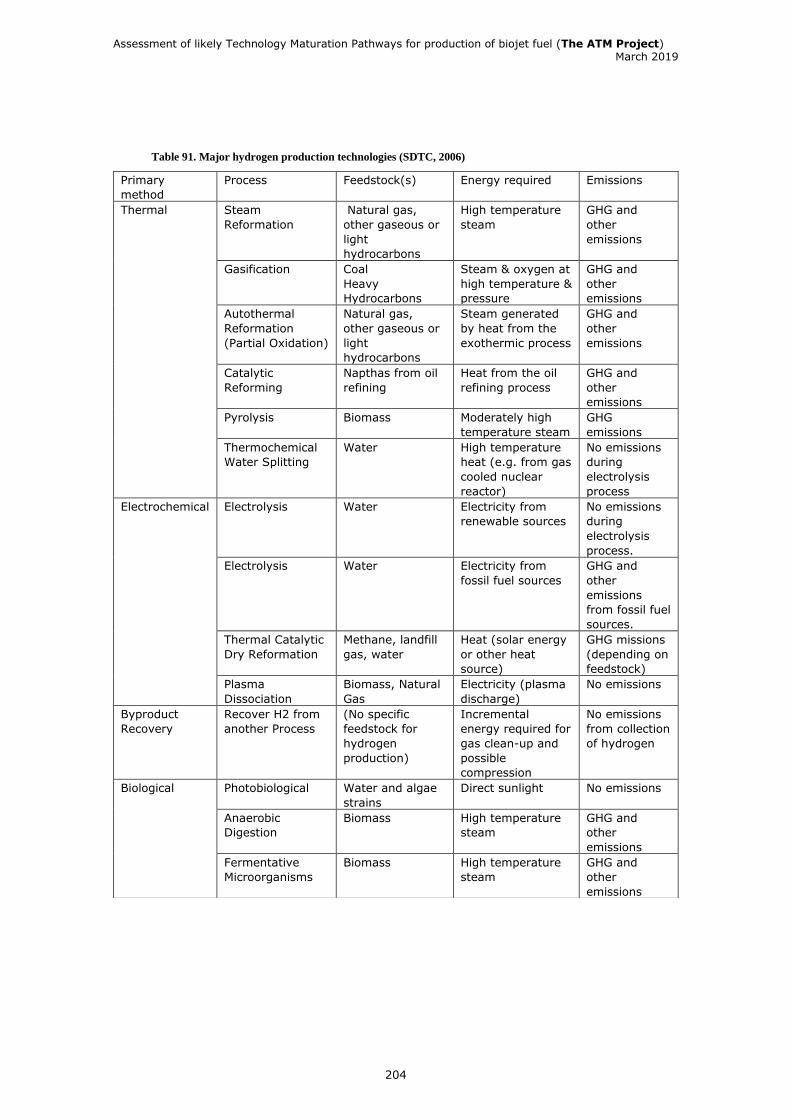
Assessment of likely Technology Maturation Pathways for production of biojet fuel (The ATM Project) March 2019
204
Table 91. Major hydrogen production technologies (SDTC, 2006)
Primary
method
Process Feedstock(s) Energy required Emissions
Thermal Steam
Reformation
Natural gas,
other gaseous or
light
hydrocarbons
High temperature
steam
GHG and
other
emissions
Gasification Coal
Heavy
Hydrocarbons
Steam & oxygen at
high temperature &
pressure
GHG and
other
emissions
Autothermal
Reformation
(Partial Oxidation)
Natural gas,
other gaseous or
light
hydrocarbons
Steam generated
by heat from the
exothermic process
GHG and
other
emissions
Catalytic
Reforming
Napthas from oil
refining
Heat from the oil
refining process
GHG and
other
emissions
Pyrolysis Biomass Moderately high
temperature steam
GHG
emissions
Thermochemical
Water Splitting
Water High temperature
heat (e.g. from gas
cooled nuclear
reactor)
No emissions
during
electrolysis
process
Electrochemical Electrolysis Water Electricity from
renewable sources
No emissions
during
electrolysis
process.
Electrolysis Water Electricity from
fossil fuel sources
GHG and
other
emissions
from fossil fuel
sources.
Thermal Catalytic
Dry Reformation
Methane, landfill
gas, water
Heat (solar energy
or other heat
source)
GHG missions
(depending on
feedstock)
Plasma
Dissociation
Biomass, Natural
Gas
Electricity (plasma
discharge)
No emissions
Byproduct
Recovery
Recover H2 from
another Process
(No specific
feedstock for
hydrogen
production)
Incremental
energy required for
gas clean-up and
possible
compression
No emissions
from collection
of hydrogen
Biological Photobiological Water and algae
strains
Direct sunlight No emissions
Anaerobic
Digestion
Biomass High temperature
steam
GHG and
other
emissions
Fermentative
Microorganisms
Biomass High temperature
steam
GHG and
other
emissions
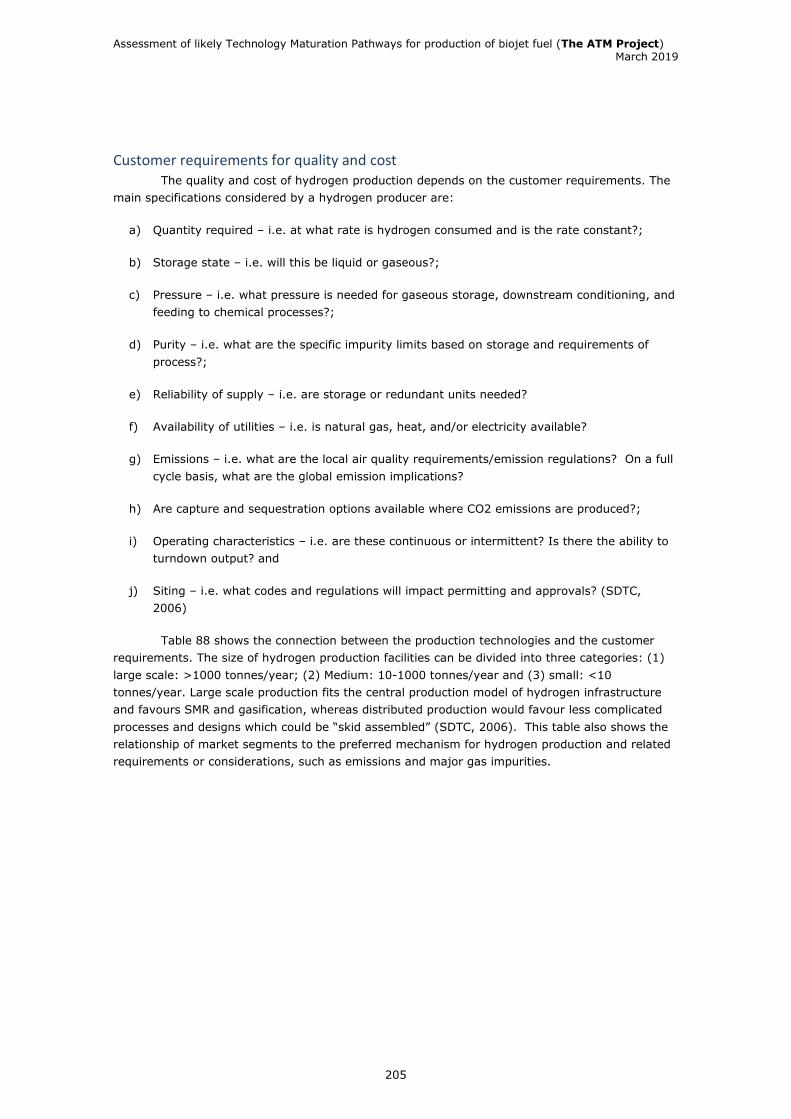
Assessment of likely Technology Maturation Pathways for production of biojet fuel (The ATM Project) March 2019
205
Customer requirements for quality and cost The quality and cost of hydrogen production depends on the customer requirements. The
main specifications considered by a hydrogen producer are:
a) Quantity required – i.e. at what rate is hydrogen consumed and is the rate constant?;
b) Storage state – i.e. will this be liquid or gaseous?;
c) Pressure – i.e. what pressure is needed for gaseous storage, downstream conditioning, and
feeding to chemical processes?;
d) Purity – i.e. what are the specific impurity limits based on storage and requirements of
process?;
e) Reliability of supply – i.e. are storage or redundant units needed?
f) Availability of utilities – i.e. is natural gas, heat, and/or electricity available?
g) Emissions – i.e. what are the local air quality requirements/emission regulations? On a full
cycle basis, what are the global emission implications?
h) Are capture and sequestration options available where CO2 emissions are produced?;
i) Operating characteristics – i.e. are these continuous or intermittent? Is there the ability to
turndown output? and
j) Siting – i.e. what codes and regulations will impact permitting and approvals? (SDTC,
2006)
Table 88 shows the connection between the production technologies and the customer
requirements. The size of hydrogen production facilities can be divided into three categories: (1)
large scale: >1000 tonnes/year; (2) Medium: 10-1000 tonnes/year and (3) small: <10
tonnes/year. Large scale production fits the central production model of hydrogen infrastructure
and favours SMR and gasification, whereas distributed production would favour less complicated
processes and designs which could be “skid assembled” (SDTC, 2006). This table also shows the
relationship of market segments to the preferred mechanism for hydrogen production and related
requirements or considerations, such as emissions and major gas impurities.
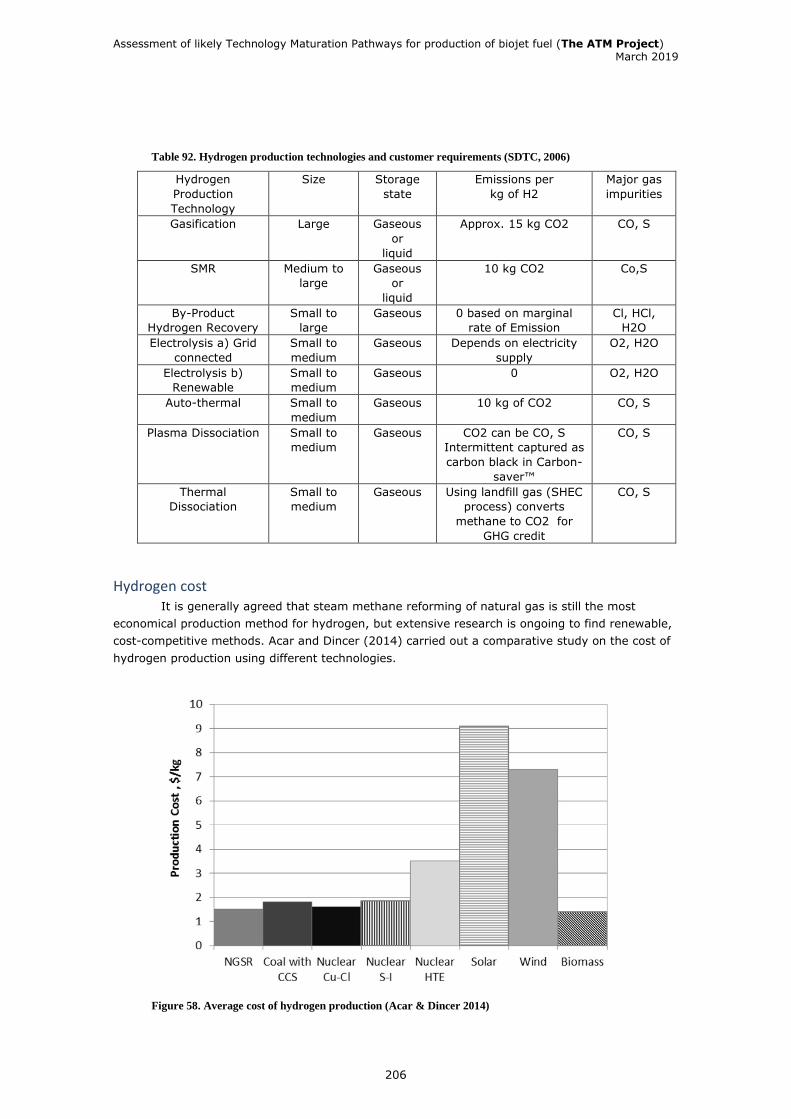
Assessment of likely Technology Maturation Pathways for production of biojet fuel (The ATM Project) March 2019
206
Table 92. Hydrogen production technologies and customer requirements (SDTC, 2006)
Hydrogen
Production
Technology
Size Storage
state
Emissions per
kg of H2
Major gas
impurities
Gasification Large Gaseous
or
liquid
Approx. 15 kg CO2 CO, S
SMR Medium to
large
Gaseous
or
liquid
10 kg CO2 Co,S
By-Product
Hydrogen Recovery
Small to
large
Gaseous 0 based on marginal
rate of Emission
Cl, HCl,
H2O
Electrolysis a) Grid
connected
Small to
medium
Gaseous Depends on electricity
supply
O2, H2O
Electrolysis b)
Renewable
Small to
medium
Gaseous 0 O2, H2O
Auto-thermal Small to
medium
Gaseous 10 kg of CO2 CO, S
Plasma Dissociation Small to
medium
Gaseous CO2 can be CO, S
Intermittent captured as
carbon black in Carbon-
saver™
CO, S
Thermal
Dissociation
Small to
medium
Gaseous Using landfill gas (SHEC
process) converts
methane to CO2 for
GHG credit
CO, S
Hydrogen cost It is generally agreed that steam methane reforming of natural gas is still the most
economical production method for hydrogen, but extensive research is ongoing to find renewable,
cost-competitive methods. Acar and Dincer (2014) carried out a comparative study on the cost of
hydrogen production using different technologies.
Figure 58. Average cost of hydrogen production (Acar & Dincer 2014)
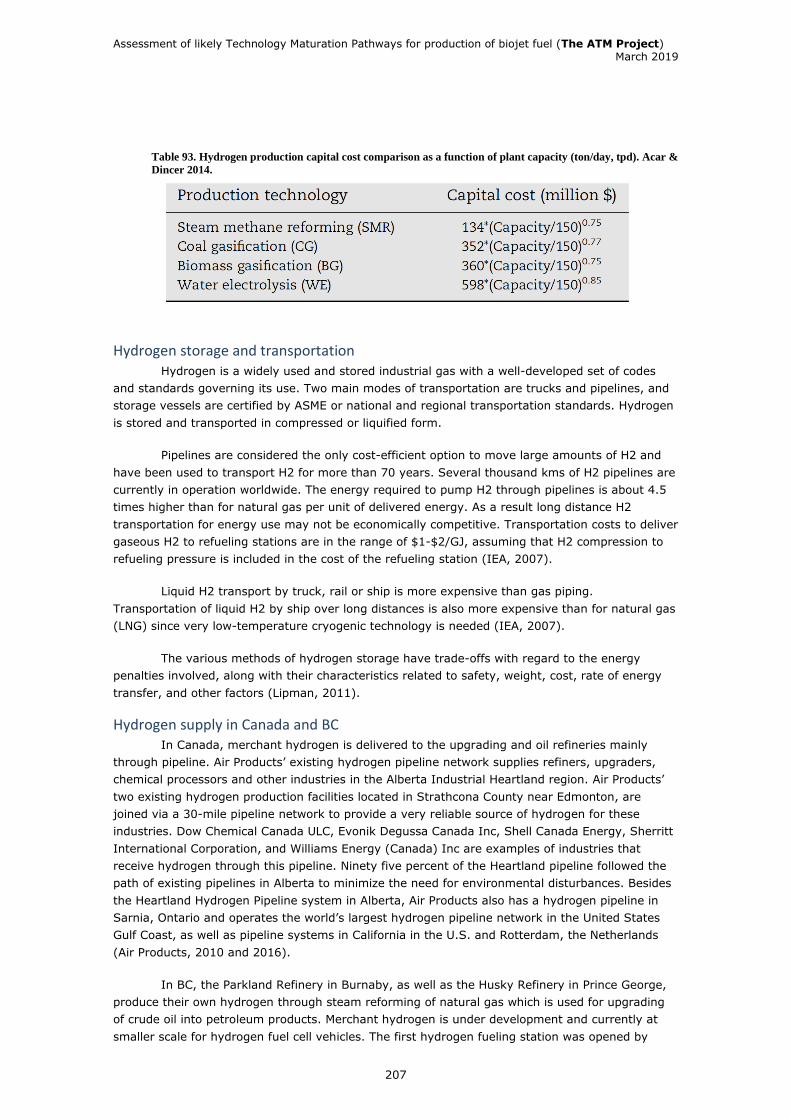
Assessment of likely Technology Maturation Pathways for production of biojet fuel (The ATM Project) March 2019
207
Table 93. Hydrogen production capital cost comparison as a function of plant capacity (ton/day, tpd). Acar &
Dincer 2014.
Hydrogen storage and transportation Hydrogen is a widely used and stored industrial gas with a well-developed set of codes
and standards governing its use. Two main modes of transportation are trucks and pipelines, and
storage vessels are certified by ASME or national and regional transportation standards. Hydrogen
is stored and transported in compressed or liquified form.
Pipelines are considered the only cost-efficient option to move large amounts of H2 and
have been used to transport H2 for more than 70 years. Several thousand kms of H2 pipelines are
currently in operation worldwide. The energy required to pump H2 through pipelines is about 4.5
times higher than for natural gas per unit of delivered energy. As a result long distance H2
transportation for energy use may not be economically competitive. Transportation costs to deliver
gaseous H2 to refueling stations are in the range of $1-$2/GJ, assuming that H2 compression to
refueling pressure is included in the cost of the refueling station (IEA, 2007).
Liquid H2 transport by truck, rail or ship is more expensive than gas piping.
Transportation of liquid H2 by ship over long distances is also more expensive than for natural gas
(LNG) since very low-temperature cryogenic technology is needed (IEA, 2007).
The various methods of hydrogen storage have trade-offs with regard to the energy
penalties involved, along with their characteristics related to safety, weight, cost, rate of energy
transfer, and other factors (Lipman, 2011).
Hydrogen supply in Canada and BC In Canada, merchant hydrogen is delivered to the upgrading and oil refineries mainly
through pipeline. Air Products’ existing hydrogen pipeline network supplies refiners, upgraders,
chemical processors and other industries in the Alberta Industrial Heartland region. Air Products’
two existing hydrogen production facilities located in Strathcona County near Edmonton, are
joined via a 30-mile pipeline network to provide a very reliable source of hydrogen for these
industries. Dow Chemical Canada ULC, Evonik Degussa Canada Inc, Shell Canada Energy, Sherritt
International Corporation, and Williams Energy (Canada) Inc are examples of industries that
receive hydrogen through this pipeline. Ninety five percent of the Heartland pipeline followed the
path of existing pipelines in Alberta to minimize the need for environmental disturbances. Besides
the Heartland Hydrogen Pipeline system in Alberta, Air Products also has a hydrogen pipeline in
Sarnia, Ontario and operates the world’s largest hydrogen pipeline network in the United States
Gulf Coast, as well as pipeline systems in California in the U.S. and Rotterdam, the Netherlands
(Air Products, 2010 and 2016).
In BC, the Parkland Refinery in Burnaby, as well as the Husky Refinery in Prince George,
produce their own hydrogen through steam reforming of natural gas which is used for upgrading
of crude oil into petroleum products. Merchant hydrogen is under development and currently at
smaller scale for hydrogen fuel cell vehicles. The first hydrogen fueling station was opened by

Assessment of likely Technology Maturation Pathways for production of biojet fuel (The ATM Project) March 2019
208
Shell in Vancouver in June 201832. HTEC is a hydrogen fuel supplier with a presence in BC33 with
technology based on electrolysis and by-product hydrogen purification.
Production of renewable natural gas (RNG) and hydrogen from biomass streams such as
agricultural wastes and forest residues (and landfills) have been pursued by some pioneering
companies in BC such as G4 Insights (Fortis BC, 2017). G4 Insights is a renewable energy
producer that transforms waste products from Canada’s forestry industry into a valuable fuel
product. However, the low price of natural gas for the foreseeable future and immaturity of the
existing clean conversion technologies make the production of RNG and hydrogen uneconomical,
especially at commercial scales. The growth of this sector can diversify Canada’s energy mix,
reduce greenhouse gas emissions, improve industrial efficiency and create new economic
opportunities for Canadian companies and good middle-class jobs that benefit rural communities
(Fortis BC, 2017).
Hydrogen is also produced as waste or as an industrial by-product. Such hydrogen
streams are often disposed of through venting or flaring, or otherwise are burned to generate
heat. These hydrogen streams can be harnessed as a fuel for power generation, transportation
and for the removal of oxygen in hydrotreatment processes. British Columbia is well situated to
take advantage of this industrial by-product by simply re-positioning the hydrogen that is already
being produced without the need for expensive infrastructure investments. Currently, BC has
three chemical industrial plants in Prince George, North Vancouver and Nanaimo that produce
hydrogen as an industrial by-product. These companies have been trying to capture the hydrogen
in their production processes and use it as a source of clean energy or feedstock for fuel-cells. The
hydrogen required by the entire fleet for one day is produced in less than one hour by the North
Vancouver plant (PICS, 2010).
By-product or waste hydrogen from industrial facilities throughout BC is currently
underutilised. Using these hydrogen streams for the removal of oxygen from feedstock and to
obtain hydrocarbon molecules with a high effective hydrogen to carbon ration offers a ready
opportunity for significant energy savings and cost recovery. Moreover, hydrogen consumers can
gain a reliable fuel supply (PICS, 2010).
32 https://www.cbc.ca/news/canada/british-columbia/hydrogen-fuel-pump-opens-in-vancouver-1.4709016 33 https://www.htec.ca/

Assessment of likely Technology Maturation Pathways for production of biojet fuel (The ATM Project) March 2019
209
APPENDIX C
Approach to Life Cycle Analysis in this project
The concept of life cycle assessment (LCA) emerged in the late 1980’s from competition
among manufacturers attempting to persuade users about the superiority of one product choice
over another. As more comparative studies were released with conflicting claims, it became
evident that different approaches were being taken related to the key elements in the LCA
analysis:
• Boundary conditions (the “reach” or “extent” of the product system);
• Data sources (actual vs. modeled); and
• Definition of the functional unit.
ISO 14040
In order to address these issues and to standardize LCA methodologies and streamline the
international marketplace, the International Standards Organization (ISO) has developed a series
of international LCA standards, specifications, and technical reports under its ISO 14000
Environmental Management series. In the 1997-2000 period, ISO developed a set of four
standards that established the principles and framework for lifecycle assessment (ISO
14040:1997) and the requirements for the different phases of LCA (ISO 14041-14043). The main
contribution of these ISO standards was the establishment of the LCA framework that involves the
four phases in an iterative process:
Phase 1 - Goal and Scope Definition;
Phase 2 - Inventory Analysis;
Phase 3 - Impact Assessment; and
Phase 4 – Interpretation
By 2006, these LCA standards were consolidated and replaced by two current standards:
one for LCA principles (ISO 14040:2006); and one for LCA requirements and guidelines (ISO
14044:2006). Additionally, ISO has published guidance documents and technical reports (ISO
14047-14049) to help illustrate good practice in applying LCA concepts.
The ISO 14040:2006 standard describes the principles and framework for life cycle
assessment including: definition of the goal and scope of the LCA, the life cycle inventory analysis
(LCI) phase, the life cycle impact assessment (LCIA) phase, the life cycle interpretation phase,
reporting and critical review of the LCA, limitations of the LCA, the relationship between the LCA
phases, and conditions for use of value choices and optional elements. ISO 14040:2006 covers life
cycle assessment (LCA) studies and life cycle inventory (LCI) studies. It does not describe the LCA
technique in detail, nor does it specify methodologies for the individual phases of the LCA. The
intended application of LCA or LCI results is considered during definition of the goal and scope, but
the application itself is outside the scope of this International Standard.

Assessment of likely Technology Maturation Pathways for production of biojet fuel (The ATM Project) March 2019
210
ISO Principles
It is useful to consider seven basic principles in the design and development of life cycle
assessments as a measure of environmental performance. The seven principles outlined below are
the basis of ISO Standard 14040:2006:
• Life Cycle Perspective (the entire stages of a product or service);
• Environmental Focus (addresses environmental aspects);
• Relative Approach and Functional Unit (analysis is relative to a functional unit);
• Iterative Approach (phased approach with continuous improvement)
• Transparency (clarity is key to properly interpret results)
• Comprehensiveness (considers all attributes and aspects)
• Priority of Scientific Approach (preference for scientific-based decisions).
LCA Modelling Issues
Even with the ISO Principles and Guidelines for undertaking life cycle assessments there
are different approaches that have been used for modelling fuel systems and these can lead to
different results from different studies.
Attributional vs. Consequential
There are many different types of Life Cycle Assessments that can be utilized to
determine the emissions output for any given product. These different types of LCAs can produce
dramatically different results that are largely dependent on the defined system boundaries within
the selected LCA mode. Two of these LCAs that can, and often will, produce very different results
are the Attributional and Consequential LCAs.
Attributional LCA (ALCA) provides the user with information about the impacts of the
production, consumption, and disposal of a product, without considering any indirect emissions
that may occur, whereas a Consequential LCA (CLCA) models the causal relationships that
originate from a decision to change the level of output and are highly dependent upon economic
models that represent the relationship between demand, supply, price elasticity, and market
effects of co-products. ALCA is useful for consumption based carbon accounting because it
provides information on the average unit of a product. CLCA models the consequences of a change
in output by considering effects both inside and outside of the life cycle of the product. The table
below outlines key differences between these two systems. (Brander et. al, 2009).

Assessment of likely Technology Maturation Pathways for production of biojet fuel (The ATM Project) March 2019
211
Table 94 Comparison of Attributional and Consequential LCAs
Attributional LCA Approaches From the literature there appear to be two primary means of determining the emissions
that are embedded in energy production facilities: a process-chain analysis (PCA) and an
input/output analysis (IOA). The PCA calculates the energy embedded in and the emission-
equivalents caused by the production of materials used in the application. The IOA works with
Attributional LCA Consequential LCA
Question the
method aims to
answer
What are the total emissions from
the processes and the material
flows directly used in the life cycle
of a product?
What is the change in total
emissions as a result of a
marginal change in the production
(and consumption and disposal) of
a product?
Application ALCA is applicable for
understanding the emissions
directly associated with the life
cycle of a product. ALCA is also
appropriate for consumption-based
emissions accounting.
ALCA is not an appropriate
approach for quantifying the
change in total emissions resulting
from policies that change the
output of certain products.
CLCA is applicable for informing
consumers and policy-makers on
the change in total emissions from
a purchasing or policy decision.
CLCA is not appropriate for
consumption-based emissions
accounting.
System boundary The processes and material flows
directly used in the production,
consumption and disposal of the
product. The vehicle may be an
important consideration for some
fuels.
All processes and material flows,
which are directly or indirectly
affected by a marginal change in
the output of a product (e.g.
through market effects,
substitution, use of constrained
resources etc).
Marginal or average
data
ALCA tends to use average data,
e.g. the average carbon intensity
of the electricity grid. Though,
some models offer a choice.
CLCA tends to use marginal data
e.g. the marginal carbon intensity
of the electricity grid.
Market effects ALCA does not consider the market
effects of the production and
consumption of the product.
CLCA considers the market effects
of the production and
consumption of the product.
Allocation methods ALCA allocates emissions and
process energy inputs to co-
products based on either economic
value, energy content, co-product
energy displacement, or mass.
CLCA uses system expansion to
quantify the effect of co-products
on emissions.
Time-scales, means
by which change is
promoted, and
magnitude of the
change
ALCA aims to quantify the
emissions attributable to a product
at a given level of production at a
given time.
CLCA aims to quantify the change
in emissions, which result from a
change in production. It is
necessary to specify the time-
scale of the change, the means by
which the change is promoted,
and the magnitude of the change.
Uncertainty ALCA has low uncertainty because
the relationships between inputs
and outputs are generally
stoichiometric.
CLCA is nearly always highly
uncertain because it relies on
models that seek to represent
complex socio-economic systems
that include feedback loops and
random elements.

Assessment of likely Technology Maturation Pathways for production of biojet fuel (The ATM Project) March 2019
212
economic sectors related to the manufacturing activities. The PCA approach requires some
knowledge of the materials included in the facility whereas the IOA only requires an understanding
of the costs of construction and the economic structure of the country or region where the
construction is occurring.
Consequential LCAs The practice of consequential LCA has gained prominence over the past decade. The topic
of indirect land use from biofuels is one that can only be addressed through consequential LCA.
Since economic modelling is at the core of a consequential analysis, most of the developing CLCA
models are built upon existing macro-economic models that are modified to consider physical
changes or environmental impacts. Brander et al (2009) suggest that CLCA models should not be
used for consumption based carbon accounting as CLCA is less well defined than ALCA, and
therefore allows a much greater degree of interpretation.