Assessment of left ventricular twist mechanics by speckle ... · tachycardia (NSVD) that may lead...
10
ORIGINAL PAPER Assessment of left ventricular twist mechanics by speckle tracking echocardiography reveals association between LV twist and myocardial fibrosis in patients with hypertrophic cardiomyopathy Hong-Ju Zhang • Hao Wang • Tao Sun • Min-Jie Lu • Nan Xu • Wei-Chun Wu • Xin Sun • Wu-Gang Wang • Qiong-Wen Lin Received: 31 March 2014 / Accepted: 29 July 2014 / Published online: 9 August 2014 Ó The Author(s) 2014. This article is published with open access at Springerlink.com Abstract We aimed to investigate whether left ventric- ular (LV) twist analysis can detect the extent of myocardial fibrosis in patients with hypertrophic cardiomyopathy (HCM). This prospective case–control study recruited 81 consecutive patients with HCM examined between January 2012 and April 2013. Data of 76 patients were analyzed after excluding 5 patients whose echocardiographic images were of poor quality. Healthy volunteers (n = 46) served as controls. Both groups underwent comprehensive echo- cardiographic examination (i.e., Bas-Rotation, AP-Rota- tion, LVEF, LADs, IVST, LAVi, E/Em, LVMI, advanced LV-twist analysis by speckle tracking echocardiography) and magnetic resonance imaging. Between-group differ- ences were analyzed by independent t test; logistic regression analysis was performed to identify effect fac- tors. No significant differences were found between base- line characteristics of HCM and control groups (all p [ 0.05). HCM patients had significantly higher Bas- Rotation, AP-Rotation, LV Twist, LVEF, LADs, IVST, LAVi, E/Em and LVMI than controls (all p \ 0.0001) and significantly lower LVDd and E/A (both p \ 0.001). Bas- Rotation, AP-Rotation, LV-Twist, LADs, IVST, LAVi, E/Em and LVMI were significantly higher in HCM patients with fibrosis than in those without fibrosis (p \ 0.001), but no significant differences in other echocardiographic parameters were found between those with and without fibrosis. Age, Bas-Rotation, AP-Rotation, LV twist, LADs, IVST, LAVi, E/A, E/Em, and LVMI were significant effect factors for fibrosis. AUROC analysis showed that LV twist had high discriminatory power to detect extent of myo- cardial fibrosis (AUC 0.996, 95 % CI 0.989–1.004, p \ 0.001). Left ventricular twist mechanics are associated with the extent of myocardial fibrosis. LV-twist assessment by STE may be clinically useful. Keywords Hypertrophic cardiomyopathy Á Cardiac magnetic resonance Á Speckle tracking echocardiography Á Myocardial fibrosis Introduction Myocardial fibrosis is a pathological entity associated with extracellular matrix remodeling, which may lead to increased myocardial stiffness and left ventricular systolic and diastolic dysfunction [1, 2]. Late gadolinium enhancement (LGE) by cardiovascular magnetic resonance imaging (CMRI) is frequently observed in patients with hypertrophic cardiomyopathy (HCM) and allows in vivo quantification of myocardial fibrosis [3, 4]. Previous stud- ies in large HCM cohorts have noted that delayed enhancement by CMRI such as LGE is associated with left ventricular (LV) systolic and diastolic dysfunction, including increased risk of non-sustained ventricular Hong-Ju Zhang and Tao Sun are co-first Authors Electronic supplementary material The online version of this article (doi:10.1007/s10554-014-0509-6) contains supplementary material, which is available to authorized users. H.-J. Zhang Á H. Wang (&) Á M.-J. Lu Á N. Xu Á W.-C. Wu Á X. Sun Á W.-G. Wang Á Q.-W. Lin Department of Ultrasound, State Key Laboratory of Cardiovascular Disease, Fuwai Hospital, National Center for Cardiovascular Diseases, Chinese Academy of Medical Sciences and Peking Union Medical College, No. 167, Bei Lishi Road, Xicheng District, Beijing 100037, People’s Republic of China e-mail: [email protected] T. Sun Division of Cardiology, Beijing Anzhen Hospital, Capital Medical University, Beijing 100029, People’s Republic of China 123 Int J Cardiovasc Imaging (2014) 30:1539–1548 DOI 10.1007/s10554-014-0509-6
Transcript of Assessment of left ventricular twist mechanics by speckle ... · tachycardia (NSVD) that may lead...
ORIGINAL PAPER
Assessment of left ventricular twist mechanics by speckle trackingechocardiography reveals association between LV twistand myocardial fibrosis in patients with hypertrophiccardiomyopathy
Hong-Ju Zhang • Hao Wang • Tao Sun •
Min-Jie Lu • Nan Xu • Wei-Chun Wu •
Xin Sun • Wu-Gang Wang • Qiong-Wen Lin
Received: 31 March 2014 / Accepted: 29 July 2014 / Published online: 9 August 2014
� The Author(s) 2014. This article is published with open access at Springerlink.com
Abstract We aimed to investigate whether left ventric-
ular (LV) twist analysis can detect the extent of myocardial
fibrosis in patients with hypertrophic cardiomyopathy
(HCM). This prospective case–control study recruited 81
consecutive patients with HCM examined between January
2012 and April 2013. Data of 76 patients were analyzed
after excluding 5 patients whose echocardiographic images
were of poor quality. Healthy volunteers (n = 46) served
as controls. Both groups underwent comprehensive echo-
cardiographic examination (i.e., Bas-Rotation, AP-Rota-
tion, LVEF, LADs, IVST, LAVi, E/Em, LVMI, advanced
LV-twist analysis by speckle tracking echocardiography)
and magnetic resonance imaging. Between-group differ-
ences were analyzed by independent t test; logistic
regression analysis was performed to identify effect fac-
tors. No significant differences were found between base-
line characteristics of HCM and control groups (all
p [ 0.05). HCM patients had significantly higher Bas-
Rotation, AP-Rotation, LV Twist, LVEF, LADs, IVST,
LAVi, E/Em and LVMI than controls (all p \ 0.0001) and
significantly lower LVDd and E/A (both p \ 0.001). Bas-
Rotation, AP-Rotation, LV-Twist, LADs, IVST, LAVi,
E/Em and LVMI were significantly higher in HCM patients
with fibrosis than in those without fibrosis (p \ 0.001), but
no significant differences in other echocardiographic
parameters were found between those with and without
fibrosis. Age, Bas-Rotation, AP-Rotation, LV twist, LADs,
IVST, LAVi, E/A, E/Em, and LVMI were significant effect
factors for fibrosis. AUROC analysis showed that LV twist
had high discriminatory power to detect extent of myo-
cardial fibrosis (AUC 0.996, 95 % CI 0.989–1.004,
p \ 0.001). Left ventricular twist mechanics are associated
with the extent of myocardial fibrosis. LV-twist assessment
by STE may be clinically useful.
Keywords Hypertrophic cardiomyopathy � Cardiac
magnetic resonance � Speckle tracking echocardiography �Myocardial fibrosis
Introduction
Myocardial fibrosis is a pathological entity associated with
extracellular matrix remodeling, which may lead to
increased myocardial stiffness and left ventricular systolic
and diastolic dysfunction [1, 2]. Late gadolinium
enhancement (LGE) by cardiovascular magnetic resonance
imaging (CMRI) is frequently observed in patients with
hypertrophic cardiomyopathy (HCM) and allows in vivo
quantification of myocardial fibrosis [3, 4]. Previous stud-
ies in large HCM cohorts have noted that delayed
enhancement by CMRI such as LGE is associated with left
ventricular (LV) systolic and diastolic dysfunction,
including increased risk of non-sustained ventricular
Hong-Ju Zhang and Tao Sun are co-first Authors
Electronic supplementary material The online version of thisarticle (doi:10.1007/s10554-014-0509-6) contains supplementarymaterial, which is available to authorized users.
H.-J. Zhang � H. Wang (&) � M.-J. Lu � N. Xu � W.-C. Wu �X. Sun � W.-G. Wang � Q.-W. Lin
Department of Ultrasound, State Key Laboratory of
Cardiovascular Disease, Fuwai Hospital, National Center for
Cardiovascular Diseases, Chinese Academy of Medical Sciences
and Peking Union Medical College, No. 167, Bei Lishi Road,
Xicheng District, Beijing 100037, People’s Republic of China
e-mail: [email protected]
T. Sun
Division of Cardiology, Beijing Anzhen Hospital, Capital
Medical University, Beijing 100029, People’s Republic of China
123
Int J Cardiovasc Imaging (2014) 30:1539–1548
DOI 10.1007/s10554-014-0509-6
tachycardia (NSVD) that may lead to adverse cardiac
events such as sudden cardiac death, fatal arrhythmia, or
worsening heart failure in HCM patients [3, 4]. Thus, it
becomes important to identify HCM patients at higher risk
for ventricular arrhythmias and sudden cardiac death [1].
However, although contrast-enhanced cardiovascular MRI
like LGE is able to identify the underlying abnormal
myocardial substrate that comprises fibrosis [3], the clinical
significance of these findings is still not well understood
[4]. Besides the prognostic value of delayed contrast
enhancement in CMRI [5], evaluation of other parameters
may be needed to accurately evaluate risk in HCM patients.
Speckle tracking echocardiography (STE), which is based
on tracking and measurement of tissue displacement, has the
potential to accurately and reliably assess myocardial
mechanics, providing a relatively simple, noninvasive
approach to the study of LV rotation and twist [6–9]. LV twist
represents the mean longitudinal gradient of the difference in
clockwise and counter-clockwise rotation of the left ventric-
ular apex and base, a phenomenon that links systolic con-
traction with diastolic relaxation and plays a major role in
cardiac physiology [10]. Choudhury et al. [11] reported that
regional myocardial strain and wall thickening were affected
by regional myocardial fibrosis in patients with HCM. LV
rotation occurs when myocardial fibers contract and, as such,
impaired LV twist mechanics may be the basis of LV dys-
function in the presence of acute increase in afterload [12].
However, the association between LV twist and the extent of
myocardial fibrosis is unknown, and the clinical significance
of LV twist mechanics remains unclear in HCM patients. To
the best of our knowledge, studies examining the relationship
between LV twist mechanics and the extent of myocardial
fibrosis have not been published. We hypothesized that the
presence of greater myocardial twist may be associated with a
greater degree of myocardial fibrosis in patients with HCM
and that LV twist mechanics assessment may help differen-
tiate the presence of fibrosis. We expected that the relationship
between LV twist and myocardial fibrosis could be confirmed
by using STE in conjunction with other echocardiographic
parameters and MRI imaging. Therefore, the aim of this study
was to investigate whether assessment of LV twist mechanics
by STE is able to detect the extent of myocardial fibrosis and
serve as a novel prognostic parameter in HCM patients.
Methods
Patients
This prospective case–control study recruited a total of 81
consecutive patients with HCM who were examined in our
department between January 2012 and April 2013. The
diagnosis of HCM was made by echocardiography based on
the criteria of the World Health Organization/International
Society and Federation of Cardiology. All patients had also
undergone MRI examination. Patients’ medical records
were thoroughly reviewed to ensure that there was no his-
tory of hypertension, and no patient presented with hyper-
tension during the study period. Patients were excluded if
they had poor resolution of echocardiographic images;
obstructive HCM (LV outflow tract gradients [30 mmHg
under basal conditions or after Valsalva maneuver); left
ventricular ejection fraction (LVEF)\50 % as assessed by
echocardiography; cardiac muscle disease secondary to any
known systemic condition; atrial fibrillation, implantation
of a pacemaker or defibrillator; significant valvular heart
disease; or known coronary artery disease (lesions [50 %
on angiogram). Finally, after five patients were excluded
because their echocardiographic images were of poor
quality and not suitable for the present study, the data from
76 patients were retained for subsequent analysis.
Patients were classified as having asymmetric septal
hypertrophy if wall thickness in the basal or mid anterior/
inferior septum was [1.3 cm and septal/lateral wall thick-
ness ratio was [1.3. Patients were classified as having a
septal bulge if the proximal anterior/inferior septum was
[1.3 cm and the mid or apical anterior/inferior septum was
\1.3 cm. Apical hypertrophy was diagnosed if the ratio of
maximal segmental wall thickness of the apex and the rest of
the ventricle was[1.5. All patients were in sinus rhythm.
All drugs were discontinued at least 24 h before echo-
cardiography and MRI evaluation, as previously recom-
mended [13]. Patient history of syncope (transient and
complete loss of consciousness) and family history of sudden
cardiac death in a first-degree relative were recorded.
For the purpose of analysis, the HCM group (n = 76)
was further divided (after imaging and echocardiographic
examinations described below) into a fibrosis group and a
non-fibrosis group.
In addition, a group of 46 healthy volunteers who
underwent advanced LV-twist analysis by echocardiogra-
phy served as controls. These subjects had no documented
history of cardiovascular disease, including hypertension or
HCM. These subjects did not undergo MRI evaluation.
Ethical considerations
This study was reviewed and approved by the hospital’s
Institutional Review Board. All included patients and
control subjects provided signed informed consent.
MRI examination and image analysis
Magnetic resonance imaging examination was performed
within 2 weeks of echocardiographic examination. MRI
was performed using a 1.5-T Sonata scanner (Siemens
1540 Int J Cardiovasc Imaging (2014) 30:1539–1548
123
Corporation, Erlangen, Germany). Electro cardio-gating
breath-holding sequential scanning was carried out with the
patient in the dorsal position. Axial and sagittal single-shot
turbo spin echo imaging was carried out on the basis of
conventional axial, sagittal and coronal phases. Cine-
imaging was carried out for left ventricular two-chamber
and four-chamber longitudinal planes as well as LV out-
flow tract planes and LV shot-axis view for 6–8 layers, and
the scanning sequence was retrospective ECG gating true
fast imaging, as described previously [14]. The left ven-
tricular mass at end-diastole was semi-automatically cal-
culated on the basis of Simpson’s rule, using a work station
and manual revision by visual assessment. The left ven-
tricular mass was normalized to body surface area. Images
for LGE diagnostics were acquired 10 min after the
injection of gadopentetate dimeglumine 0.2 mmol/kg
(Magnevist; Schering Corporation, Berlin, Germany) with
breath-hold segmented inversion-recovery sequences
acquired in the same view. Myocardial perfusion and
delayed scanning were analyzed according to the 17-seg-
ment method for the left ventricle recommended by the
American Heart Association (AHA) [15]. The presence of
late enhancement within each segment was assessed
semiquantitatively using a 17-segment model of the LV
[16]. LGE of the LV was considered present if the signal
intensity of hyperenhanced myocardium was [5 standard
deviations above the mean signal intensity of vital myo-
cardium. MRI analysis was completely blinded from the
echocardiographic and clinical analysis.
Echocardiography examination
Echocardiography was carried out using the Phillips iE33
Color Doppler Ultrasound System with probe frequency
3.5 MHz (Philips Healthcare, Andover, MA, USA). The
Qlab multiparameter analysis workstation (Phillips) was
equipped with STE analysis software. The second-har-
monic B-mode images of apical (4-chamber, 2-chamber)
and short-axis (at the mitral valve and apical level) views
were obtained. The frame rate was more than 50 frames/s.
The LV endocardial border was manually traced at the end-
systolic frame and the speckle tracking region of interest
was automatically selected. The width of the region of
interest was adjusted as necessary to accommodate the total
thickness of the LV wall [17]. The computer automatically
tracked stable objects in each frame using the sum of
absolute differences algorithm. After these steps, the work
station computed and generated strain curves, as previously
described [18].
The peak values of basal rotation were defined as the
maximum negative values of the curves from the short-axis
view at the mitral valve level. The peak values of apical
rotation were defined as the maximum positive values of
the curves from the short-axis view at the apical level [19].
Every view considered was divided into six segments,
giving six different values from which mean values were
determined. LV twist was defined as the difference
between the mean values of the peak rotation at the apical
and mitral valve level (twist = mean peak apical rota-
tion - mean peak basal rotation) [10].
Standard two-dimensional measurements were obtained
using standard methods. LVEF was calculated using the
two-dimensional Simpson’s biplane method. LV mass was
assessed with the two-dimensional area-length method and
the left ventricular mass was normalized to body surface
area, as previously described [20]. Left ventricular diameter
in end-diastolic (LVDd), inter-ventricular septal thickness
(IVST), left ventricular posterior wall thickness (LVPWT),
and relative wall thickness (RWT) were measured accord-
ing to criteria of the American Society of Echocardiogra-
phy. Left atrium end-systolic dimensions (LADs) were
measured at end-systolic, and LA volume was calculated
using the prolate ellipsoid model. The LA volume index
(LAVi) was calculated as LA volume divided by body
surface area, reported as milliliters per square meter. The
following variables were measured at the tips of the mitral
valve leaflets from the apical 4-chamber view using pulsed-
wave Doppler: peak early (E) and late (A) diastolic veloc-
ities, and E/A ratio were measured. Finally, by pulsed tissue
Doppler, peak early diastolic velocity on the septal part of
the mitral annulus was measured (Em) and E/Em ratio was
calculated as previously described [20].
Statistical analysis
Continuous variables were presented as mean and standard
deviation, with independent t test used to compare differ-
ences between groups. Categorical variables were pre-
sented as counts and percentages, with Fisher’s exact tests
used to compare differences between groups. Logistic
regression was performed to detect which factor provides
the strongest influence among myocardial fibrosis groups.
Factors that were significant in univariate logistic regres-
sion were included in multivariate logistic regression, with
stepwise model selection used to select the best factor to
detect myocardial fibrosis. The receiver operating charac-
teristic (ROC) curve was used to examine the factor per-
formance in fibrosis and non-fibrosis groups. The cut-off
value of factors that may distinguish myocardial fibrosis or
not were selected using Youden index, which was defined
as sensitivity ? specificity - 1. Area under ROC curve
with null hypothesis: AUC = 0.5 was performed using the
Wilcoxon rank sum test. All statistical analyses were per-
formed with SPSS software version 17 (SPSS Inc, Chicago,
IL, USA), and two-tailed p \ 0.05 indicated statistical
significance.
Int J Cardiovasc Imaging (2014) 30:1539–1548 1541
123
Results
Comparison of baseline characteristics in HCM
and control groups
Patients’ baseline characteristics in HCM and control
groups are presented in Table 1. Among 122 subjects
enrolled in this study, 76 were HCM patients and 46 were
healthy subjects, including 82 males and 40 females with a
mean age of 46.1 years. Mean heart rate was 70.5 beats/
min, mean BSA was 1.7 m2, mean BMI was 23. 9 kg/m2,
mean SBP was 122.5 mmHg andmean DBP was
80.4 mmHg. In the HCM group, 26.3 % had a history of
HCM and 13.2 % had unexplained syncope.
No significant differences were found between the HCM
and control group in age, gender, heart rate, BSA and BMI
(p [ 0.05). The means of SBP and DBP were significantly
higher in the HCM group than in the control group (SBP:
124.3 vs. 119.5, p \ 0.001; DBP: 81.8 vs. 78, p \ 0.001).
The HCM group had more patients with a history of HCM
and unexplained syncope than the control group (history of
HCM: 20 vs. 0, p \ 0.001; unexplained syncope: 10 vs. 0,
p \ 0.001) (Table 1).
Comparison of echocardiography parameters in HCM
and control groups
Comparisons of echocardiography parameters between
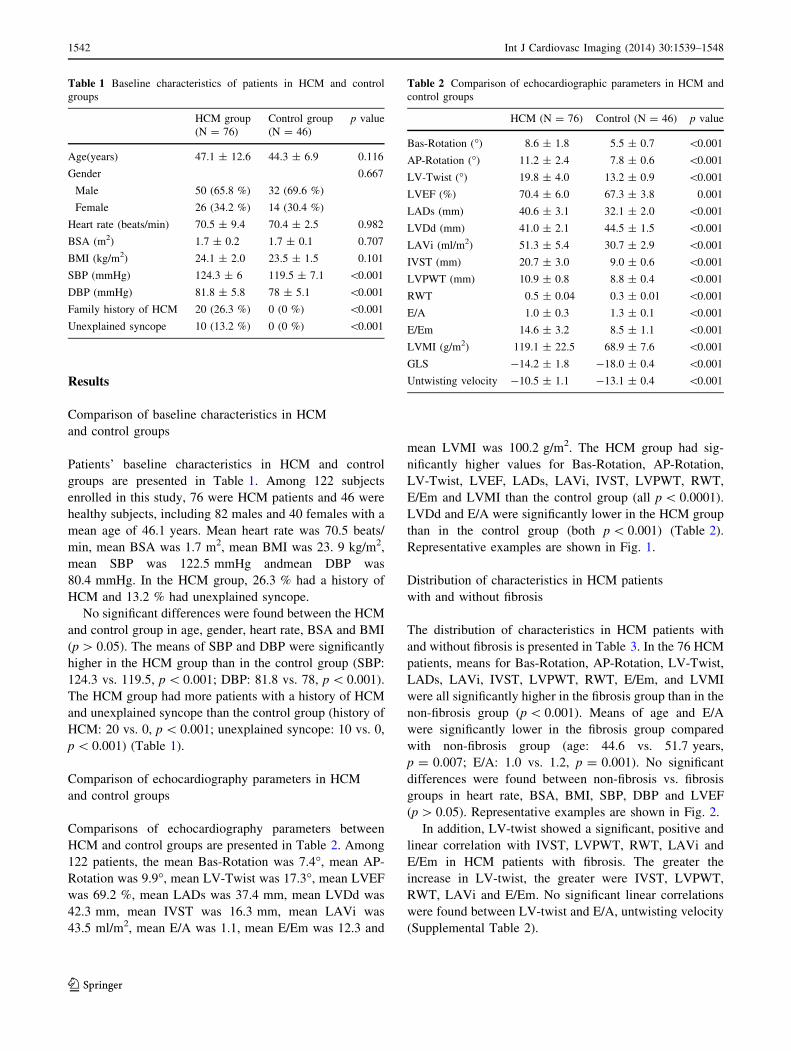
HCM and control groups are presented in Table 2. Among
122 patients, the mean Bas-Rotation was 7.4�, mean AP-
Rotation was 9.9�, mean LV-Twist was 17.3�, mean LVEF
was 69.2 %, mean LADs was 37.4 mm, mean LVDd was
42.3 mm, mean IVST was 16.3 mm, mean LAVi was
43.5 ml/m2, mean E/A was 1.1, mean E/Em was 12.3 and
mean LVMI was 100.2 g/m2. The HCM group had sig-
nificantly higher values for Bas-Rotation, AP-Rotation,
LV-Twist, LVEF, LADs, LAVi, IVST, LVPWT, RWT,
E/Em and LVMI than the control group (all p \ 0.0001).
LVDd and E/A were significantly lower in the HCM group
than in the control group (both p \ 0.001) (Table 2).
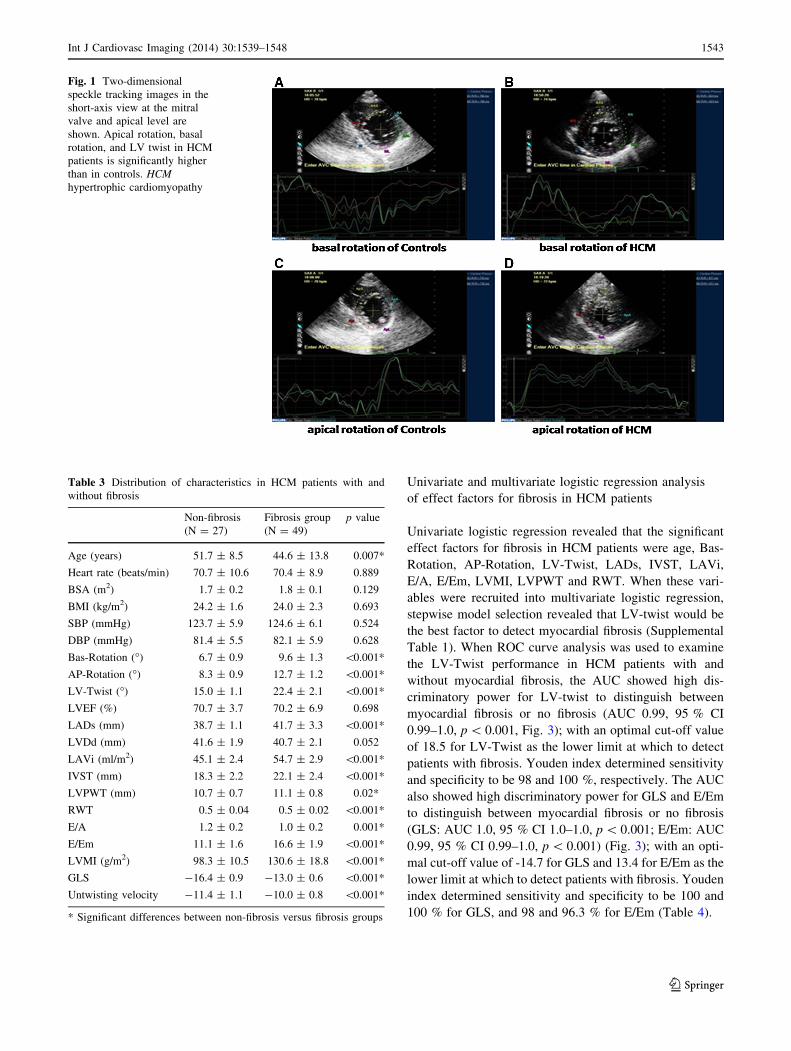
Representative examples are shown in Fig. 1.
Distribution of characteristics in HCM patients
with and without fibrosis
The distribution of characteristics in HCM patients with
and without fibrosis is presented in Table 3. In the 76 HCM
patients, means for Bas-Rotation, AP-Rotation, LV-Twist,
LADs, LAVi, IVST, LVPWT, RWT, E/Em, and LVMI
were all significantly higher in the fibrosis group than in the
non-fibrosis group (p \ 0.001). Means of age and E/A
were significantly lower in the fibrosis group compared
with non-fibrosis group (age: 44.6 vs. 51.7 years,
p = 0.007; E/A: 1.0 vs. 1.2, p = 0.001). No significant
differences were found between non-fibrosis vs. fibrosis
groups in heart rate, BSA, BMI, SBP, DBP and LVEF
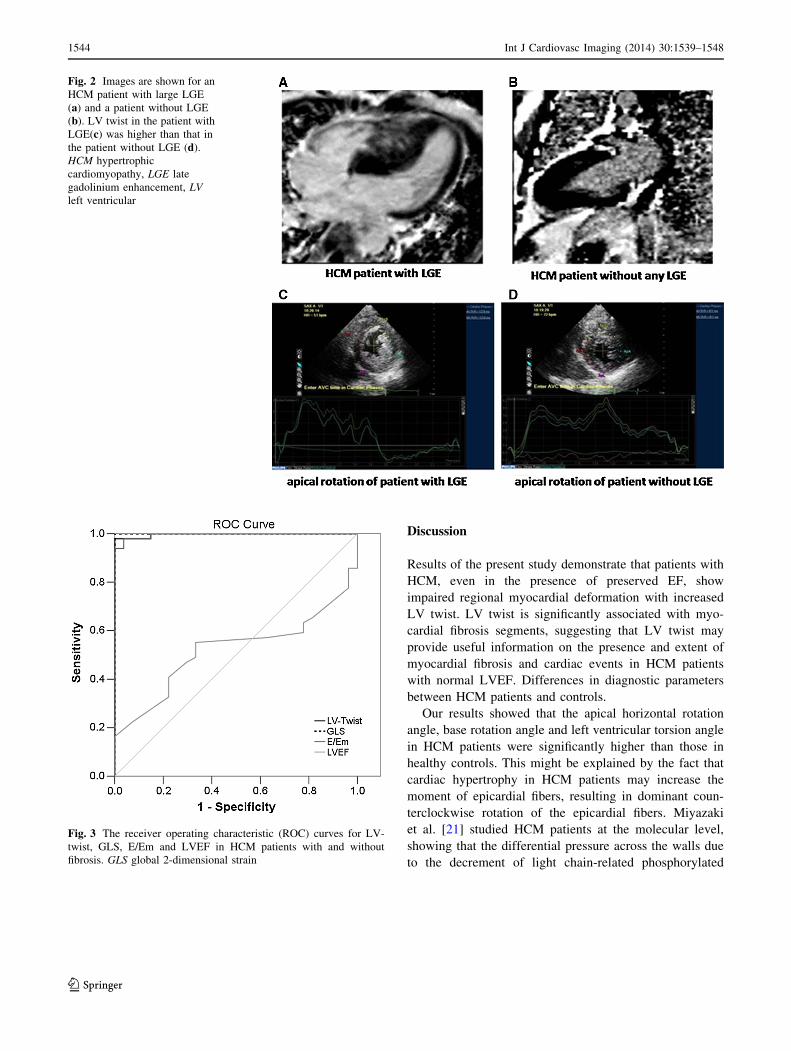
(p [ 0.05). Representative examples are shown in Fig. 2.
In addition, LV-twist showed a significant, positive and
linear correlation with IVST, LVPWT, RWT, LAVi and
E/Em in HCM patients with fibrosis. The greater the
increase in LV-twist, the greater were IVST, LVPWT,
RWT, LAVi and E/Em. No significant linear correlations
were found between LV-twist and E/A, untwisting velocity
(Supplemental Table 2).
Table 1 Baseline characteristics of patients in HCM and control
groups
HCM group
(N = 76)
Control group
(N = 46)
p value
Age(years) 47.1 ± 12.6 44.3 ± 6.9 0.116
Gender 0.667
Male 50 (65.8 %) 32 (69.6 %)
Female 26 (34.2 %) 14 (30.4 %)
Heart rate (beats/min) 70.5 ± 9.4 70.4 ± 2.5 0.982
BSA (m2) 1.7 ± 0.2 1.7 ± 0.1 0.707
BMI (kg/m2) 24.1 ± 2.0 23.5 ± 1.5 0.101
SBP (mmHg) 124.3 ± 6 119.5 ± 7.1 \0.001
DBP (mmHg) 81.8 ± 5.8 78 ± 5.1 \0.001
Family history of HCM 20 (26.3 %) 0 (0 %) \0.001
Unexplained syncope 10 (13.2 %) 0 (0 %) \0.001
Table 2 Comparison of echocardiographic parameters in HCM and
control groups
HCM (N = 76) Control (N = 46) p value
Bas-Rotation (�) 8.6 ± 1.8 5.5 ± 0.7 \0.001
AP-Rotation (�) 11.2 ± 2.4 7.8 ± 0.6 \0.001
LV-Twist (�) 19.8 ± 4.0 13.2 ± 0.9 \0.001
LVEF (%) 70.4 ± 6.0 67.3 ± 3.8 0.001
LADs (mm) 40.6 ± 3.1 32.1 ± 2.0 \0.001
LVDd (mm) 41.0 ± 2.1 44.5 ± 1.5 \0.001
LAVi (ml/m2) 51.3 ± 5.4 30.7 ± 2.9 \0.001
IVST (mm) 20.7 ± 3.0 9.0 ± 0.6 \0.001
LVPWT (mm) 10.9 ± 0.8 8.8 ± 0.4 \0.001
RWT 0.5 ± 0.04 0.3 ± 0.01 \0.001
E/A 1.0 ± 0.3 1.3 ± 0.1 \0.001
E/Em 14.6 ± 3.2 8.5 ± 1.1 \0.001
LVMI (g/m2) 119.1 ± 22.5 68.9 ± 7.6 \0.001
GLS -14.2 ± 1.8 -18.0 ± 0.4 \0.001
Untwisting velocity -10.5 ± 1.1 -13.1 ± 0.4 \0.001
1542 Int J Cardiovasc Imaging (2014) 30:1539–1548
123
Univariate and multivariate logistic regression analysis
of effect factors for fibrosis in HCM patients
Univariate logistic regression revealed that the significant
effect factors for fibrosis in HCM patients were age, Bas-
Rotation, AP-Rotation, LV-Twist, LADs, IVST, LAVi,
E/A, E/Em, LVMI, LVPWT and RWT. When these vari-
ables were recruited into multivariate logistic regression,
stepwise model selection revealed that LV-twist would be
the best factor to detect myocardial fibrosis (Supplemental
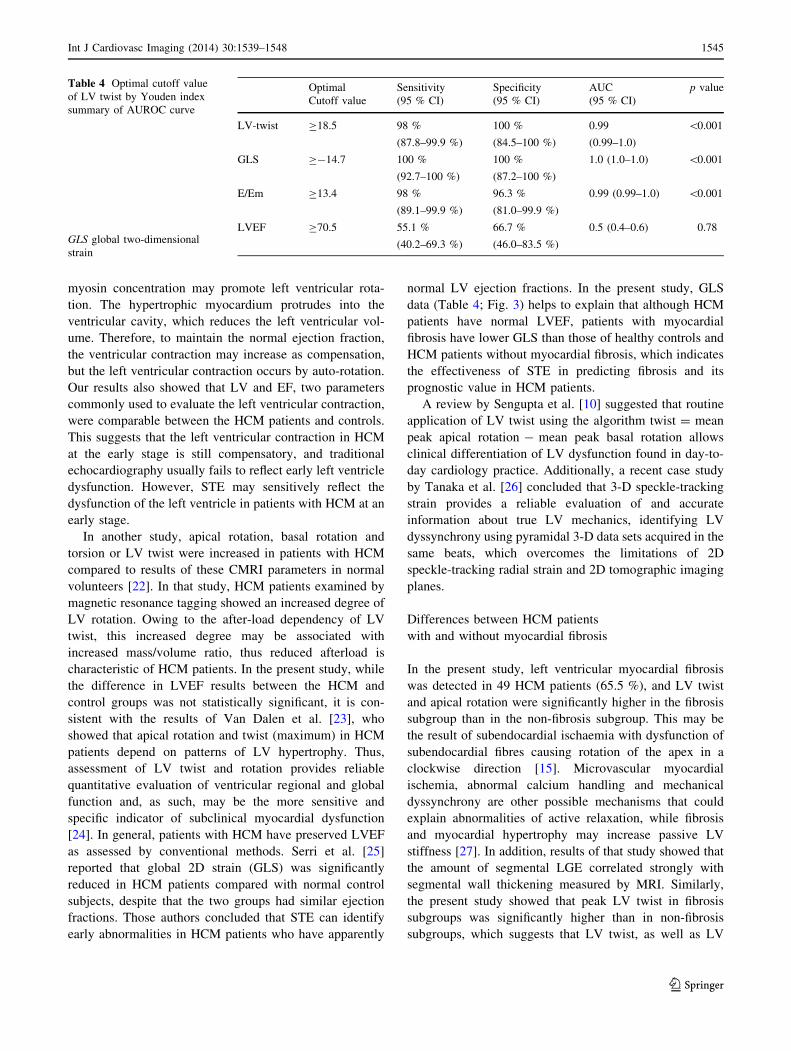
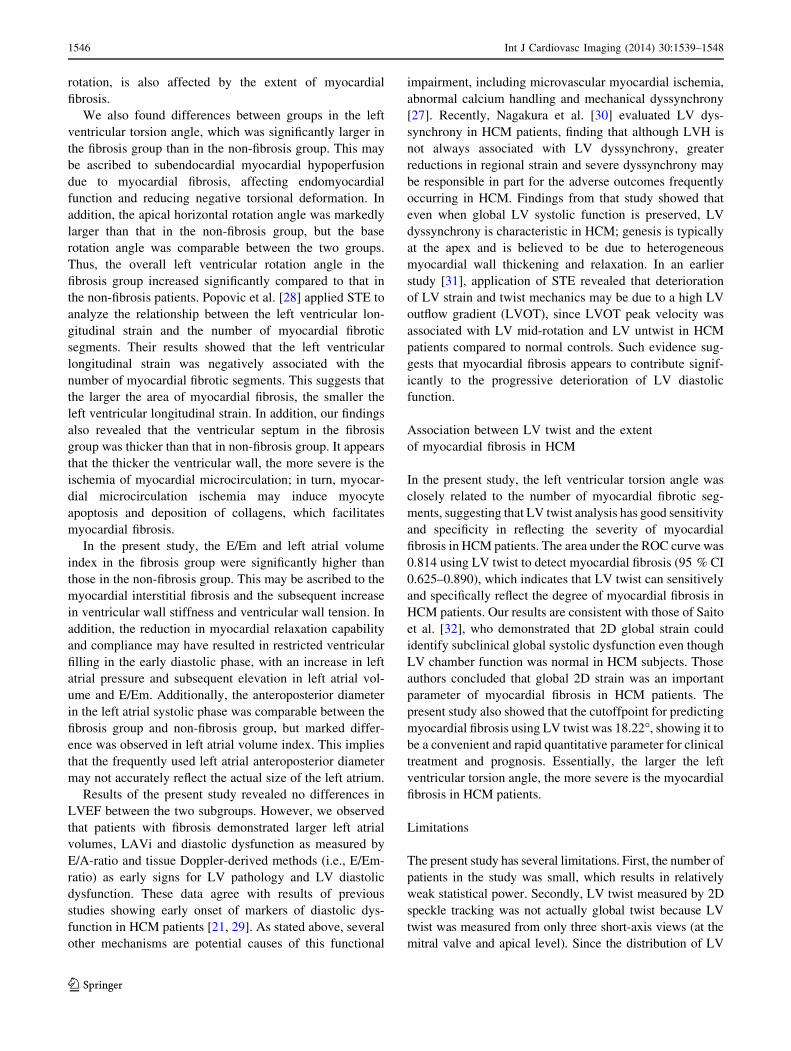
Table 1). When ROC curve analysis was used to examine
the LV-Twist performance in HCM patients with and
without myocardial fibrosis, the AUC showed high dis-
criminatory power for LV-twist to distinguish between
myocardial fibrosis or no fibrosis (AUC 0.99, 95 % CI
0.99–1.0, p \ 0.001, Fig. 3); with an optimal cut-off value
of 18.5 for LV-Twist as the lower limit at which to detect
patients with fibrosis. Youden index determined sensitivity
and specificity to be 98 and 100 %, respectively. The AUC
also showed high discriminatory power for GLS and E/Em
to distinguish between myocardial fibrosis or no fibrosis
(GLS: AUC 1.0, 95 % CI 1.0–1.0, p \ 0.001; E/Em: AUC
0.99, 95 % CI 0.99–1.0, p \ 0.001) (Fig. 3); with an opti-
mal cut-off value of -14.7 for GLS and 13.4 for E/Em as the
lower limit at which to detect patients with fibrosis. Youden
index determined sensitivity and specificity to be 100 and
100 % for GLS, and 98 and 96.3 % for E/Em (Table 4).
Fig. 1 Two-dimensional
speckle tracking images in the
short-axis view at the mitral
valve and apical level are
shown. Apical rotation, basal
rotation, and LV twist in HCM
patients is significantly higher
than in controls. HCM
hypertrophic cardiomyopathy
Table 3 Distribution of characteristics in HCM patients with and
without fibrosis
Non-fibrosis
(N = 27)
Fibrosis group
(N = 49)
p value
Age (years) 51.7 ± 8.5 44.6 ± 13.8 0.007*
Heart rate (beats/min) 70.7 ± 10.6 70.4 ± 8.9 0.889
BSA (m2) 1.7 ± 0.2 1.8 ± 0.1 0.129
BMI (kg/m2) 24.2 ± 1.6 24.0 ± 2.3 0.693
SBP (mmHg) 123.7 ± 5.9 124.6 ± 6.1 0.524
DBP (mmHg) 81.4 ± 5.5 82.1 ± 5.9 0.628
Bas-Rotation (�) 6.7 ± 0.9 9.6 ± 1.3 \0.001*
AP-Rotation (�) 8.3 ± 0.9 12.7 ± 1.2 \0.001*
LV-Twist (�) 15.0 ± 1.1 22.4 ± 2.1 \0.001*
LVEF (%) 70.7 ± 3.7 70.2 ± 6.9 0.698
LADs (mm) 38.7 ± 1.1 41.7 ± 3.3 \0.001*
LVDd (mm) 41.6 ± 1.9 40.7 ± 2.1 0.052
LAVi (ml/m2) 45.1 ± 2.4 54.7 ± 2.9 \0.001*
IVST (mm) 18.3 ± 2.2 22.1 ± 2.4 \0.001*
LVPWT (mm) 10.7 ± 0.7 11.1 ± 0.8 0.02*
RWT 0.5 ± 0.04 0.5 ± 0.02 \0.001*
E/A 1.2 ± 0.2 1.0 ± 0.2 0.001*
E/Em 11.1 ± 1.6 16.6 ± 1.9 \0.001*
LVMI (g/m2) 98.3 ± 10.5 130.6 ± 18.8 \0.001*
GLS -16.4 ± 0.9 -13.0 ± 0.6 \0.001*
Untwisting velocity -11.4 ± 1.1 -10.0 ± 0.8 \0.001*
* Significant differences between non-fibrosis versus fibrosis groups
Int J Cardiovasc Imaging (2014) 30:1539–1548 1543
123
Discussion
Results of the present study demonstrate that patients with
HCM, even in the presence of preserved EF, show
impaired regional myocardial deformation with increased
LV twist. LV twist is significantly associated with myo-
cardial fibrosis segments, suggesting that LV twist may
provide useful information on the presence and extent of
myocardial fibrosis and cardiac events in HCM patients
with normal LVEF. Differences in diagnostic parameters
between HCM patients and controls.
Our results showed that the apical horizontal rotation
angle, base rotation angle and left ventricular torsion angle
in HCM patients were significantly higher than those in
healthy controls. This might be explained by the fact that
cardiac hypertrophy in HCM patients may increase the
moment of epicardial fibers, resulting in dominant coun-
terclockwise rotation of the epicardial fibers. Miyazaki
et al. [21] studied HCM patients at the molecular level,
showing that the differential pressure across the walls due
to the decrement of light chain-related phosphorylated
Fig. 2 Images are shown for an
HCM patient with large LGE
(a) and a patient without LGE
(b). LV twist in the patient with
LGE(c) was higher than that in
the patient without LGE (d).
HCM hypertrophic
cardiomyopathy, LGE late
gadolinium enhancement, LV
left ventricular
Fig. 3 The receiver operating characteristic (ROC) curves for LV-
twist, GLS, E/Em and LVEF in HCM patients with and without
fibrosis. GLS global 2-dimensional strain
1544 Int J Cardiovasc Imaging (2014) 30:1539–1548
123
myosin concentration may promote left ventricular rota-
tion. The hypertrophic myocardium protrudes into the
ventricular cavity, which reduces the left ventricular vol-
ume. Therefore, to maintain the normal ejection fraction,
the ventricular contraction may increase as compensation,
but the left ventricular contraction occurs by auto-rotation.
Our results also showed that LV and EF, two parameters
commonly used to evaluate the left ventricular contraction,
were comparable between the HCM patients and controls.
This suggests that the left ventricular contraction in HCM
at the early stage is still compensatory, and traditional
echocardiography usually fails to reflect early left ventricle
dysfunction. However, STE may sensitively reflect the
dysfunction of the left ventricle in patients with HCM at an
early stage.
In another study, apical rotation, basal rotation and
torsion or LV twist were increased in patients with HCM
compared to results of these CMRI parameters in normal
volunteers [22]. In that study, HCM patients examined by
magnetic resonance tagging showed an increased degree of
LV rotation. Owing to the after-load dependency of LV
twist, this increased degree may be associated with
increased mass/volume ratio, thus reduced afterload is
characteristic of HCM patients. In the present study, while
the difference in LVEF results between the HCM and
control groups was not statistically significant, it is con-
sistent with the results of Van Dalen et al. [23], who
showed that apical rotation and twist (maximum) in HCM
patients depend on patterns of LV hypertrophy. Thus,
assessment of LV twist and rotation provides reliable
quantitative evaluation of ventricular regional and global
function and, as such, may be the more sensitive and
specific indicator of subclinical myocardial dysfunction
[24]. In general, patients with HCM have preserved LVEF
as assessed by conventional methods. Serri et al. [25]
reported that global 2D strain (GLS) was significantly
reduced in HCM patients compared with normal control
subjects, despite that the two groups had similar ejection
fractions. Those authors concluded that STE can identify
early abnormalities in HCM patients who have apparently
normal LV ejection fractions. In the present study, GLS
data (Table 4; Fig. 3) helps to explain that although HCM
patients have normal LVEF, patients with myocardial
fibrosis have lower GLS than those of healthy controls and
HCM patients without myocardial fibrosis, which indicates
the effectiveness of STE in predicting fibrosis and its
prognostic value in HCM patients.
A review by Sengupta et al. [10] suggested that routine
application of LV twist using the algorithm twist = mean
peak apical rotation - mean peak basal rotation allows
clinical differentiation of LV dysfunction found in day-to-
day cardiology practice. Additionally, a recent case study
by Tanaka et al. [26] concluded that 3-D speckle-tracking
strain provides a reliable evaluation of and accurate
information about true LV mechanics, identifying LV
dyssynchrony using pyramidal 3-D data sets acquired in the
same beats, which overcomes the limitations of 2D
speckle-tracking radial strain and 2D tomographic imaging
planes.
Differences between HCM patients
with and without myocardial fibrosis
In the present study, left ventricular myocardial fibrosis
was detected in 49 HCM patients (65.5 %), and LV twist
and apical rotation were significantly higher in the fibrosis
subgroup than in the non-fibrosis subgroup. This may be
the result of subendocardial ischaemia with dysfunction of
subendocardial fibres causing rotation of the apex in a
clockwise direction [15]. Microvascular myocardial
ischemia, abnormal calcium handling and mechanical
dyssynchrony are other possible mechanisms that could
explain abnormalities of active relaxation, while fibrosis
and myocardial hypertrophy may increase passive LV
stiffness [27]. In addition, results of that study showed that
the amount of segmental LGE correlated strongly with
segmental wall thickening measured by MRI. Similarly,
the present study showed that peak LV twist in fibrosis
subgroups was significantly higher than in non-fibrosis
subgroups, which suggests that LV twist, as well as LV
Table 4 Optimal cutoff value
of LV twist by Youden index
summary of AUROC curve
GLS global two-dimensional
strain
Optimal Sensitivity Specificity AUC p value
Cutoff value (95 % CI) (95 % CI) (95 % CI)
LV-twist C18.5 98 %
(87.8–99.9 %)
100 %
(84.5–100 %)
0.99
(0.99–1.0)
\0.001
GLS C-14.7 100 %
(92.7–100 %)
100 %
(87.2–100 %)
1.0 (1.0–1.0) \0.001
E/Em C13.4 98 %
(89.1–99.9 %)
96.3 %
(81.0–99.9 %)
0.99 (0.99–1.0) \0.001
LVEF C70.5 55.1 %
(40.2–69.3 %)
66.7 %
(46.0–83.5 %)
0.5 (0.4–0.6) 0.78
Int J Cardiovasc Imaging (2014) 30:1539–1548 1545
123
rotation, is also affected by the extent of myocardial
fibrosis.
We also found differences between groups in the left
ventricular torsion angle, which was significantly larger in
the fibrosis group than in the non-fibrosis group. This may
be ascribed to subendocardial myocardial hypoperfusion
due to myocardial fibrosis, affecting endomyocardial
function and reducing negative torsional deformation. In
addition, the apical horizontal rotation angle was markedly
larger than that in the non-fibrosis group, but the base
rotation angle was comparable between the two groups.
Thus, the overall left ventricular rotation angle in the
fibrosis group increased significantly compared to that in
the non-fibrosis patients. Popovic et al. [28] applied STE to
analyze the relationship between the left ventricular lon-
gitudinal strain and the number of myocardial fibrotic
segments. Their results showed that the left ventricular
longitudinal strain was negatively associated with the
number of myocardial fibrotic segments. This suggests that
the larger the area of myocardial fibrosis, the smaller the
left ventricular longitudinal strain. In addition, our findings
also revealed that the ventricular septum in the fibrosis
group was thicker than that in non-fibrosis group. It appears
that the thicker the ventricular wall, the more severe is the
ischemia of myocardial microcirculation; in turn, myocar-
dial microcirculation ischemia may induce myocyte
apoptosis and deposition of collagens, which facilitates
myocardial fibrosis.
In the present study, the E/Em and left atrial volume
index in the fibrosis group were significantly higher than
those in the non-fibrosis group. This may be ascribed to the
myocardial interstitial fibrosis and the subsequent increase
in ventricular wall stiffness and ventricular wall tension. In
addition, the reduction in myocardial relaxation capability
and compliance may have resulted in restricted ventricular
filling in the early diastolic phase, with an increase in left
atrial pressure and subsequent elevation in left atrial vol-
ume and E/Em. Additionally, the anteroposterior diameter
in the left atrial systolic phase was comparable between the
fibrosis group and non-fibrosis group, but marked differ-
ence was observed in left atrial volume index. This implies
that the frequently used left atrial anteroposterior diameter
may not accurately reflect the actual size of the left atrium.
Results of the present study revealed no differences in
LVEF between the two subgroups. However, we observed
that patients with fibrosis demonstrated larger left atrial
volumes, LAVi and diastolic dysfunction as measured by
E/A-ratio and tissue Doppler-derived methods (i.e., E/Em-
ratio) as early signs for LV pathology and LV diastolic
dysfunction. These data agree with results of previous
studies showing early onset of markers of diastolic dys-
function in HCM patients [21, 29]. As stated above, several
other mechanisms are potential causes of this functional
impairment, including microvascular myocardial ischemia,
abnormal calcium handling and mechanical dyssynchrony
[27]. Recently, Nagakura et al. [30] evaluated LV dys-
synchrony in HCM patients, finding that although LVH is
not always associated with LV dyssynchrony, greater
reductions in regional strain and severe dyssynchrony may
be responsible in part for the adverse outcomes frequently
occurring in HCM. Findings from that study showed that
even when global LV systolic function is preserved, LV
dyssynchrony is characteristic in HCM; genesis is typically
at the apex and is believed to be due to heterogeneous
myocardial wall thickening and relaxation. In an earlier
study [31], application of STE revealed that deterioration
of LV strain and twist mechanics may be due to a high LV
outflow gradient (LVOT), since LVOT peak velocity was
associated with LV mid-rotation and LV untwist in HCM
patients compared to normal controls. Such evidence sug-
gests that myocardial fibrosis appears to contribute signif-
icantly to the progressive deterioration of LV diastolic
function.
Association between LV twist and the extent
of myocardial fibrosis in HCM
In the present study, the left ventricular torsion angle was
closely related to the number of myocardial fibrotic seg-
ments, suggesting that LV twist analysis has good sensitivity
and specificity in reflecting the severity of myocardial
fibrosis in HCM patients. The area under the ROC curve was
0.814 using LV twist to detect myocardial fibrosis (95 % CI
0.625–0.890), which indicates that LV twist can sensitively
and specifically reflect the degree of myocardial fibrosis in
HCM patients. Our results are consistent with those of Saito
et al. [32], who demonstrated that 2D global strain could
identify subclinical global systolic dysfunction even though
LV chamber function was normal in HCM subjects. Those
authors concluded that global 2D strain was an important
parameter of myocardial fibrosis in HCM patients. The
present study also showed that the cutoffpoint for predicting
myocardial fibrosis using LV twist was 18.22�, showing it to
be a convenient and rapid quantitative parameter for clinical
treatment and prognosis. Essentially, the larger the left
ventricular torsion angle, the more severe is the myocardial
fibrosis in HCM patients.
Limitations
The present study has several limitations. First, the number of
patients in the study was small, which results in relatively
weak statistical power. Secondly, LV twist measured by 2D
speckle tracking was not actually global twist because LV
twist was measured from only three short-axis views (at the
mitral valve and apical level). Since the distribution of LV
1546 Int J Cardiovasc Imaging (2014) 30:1539–1548
123
twist and hypertrophy in the left ventricular is not uniform in
HCM, it is possible that LV twist did not completely reflect the
extent of LV myocardial fibrosis. The further development of
three-dimensional (3D) speckle tracking might resolve this
issue, as suggested by other authors [33]. Thirdly, the acqui-
sition of orbicular LV short-axis images from base to apex is
often technically difficult and may be settled by continued
advances in 3D speckle tracking as previously suggested [34].
Fourthly, all the systolic parameters (apical rotation, basal
rotation, LV twist) were heart-rate-independent because we
measured peak values and did not measure timing. Finally, the
ROI width at the hypertrophic segment might not cover the
entire wall, because we adjusted the ROI to the thinner side of
the myocardial wall. However, in the present study, LV twist
did not depend on the LGE location in the myocardial wall.
The development of software that can precisely trace the
epicardial border might resolve this issue [33]. More clinical
studies with larger patient populations are needed to confirm
the validity of LV twist as a marker for myocardial fibrosis and
as a predictor of major cardiac events. Future studies with
larger sample-size will include patient follow-up to further
confirm the relationship between left ventricular torsion angle
and the severity of myocardial fibrosis. We would aim to
elucidate whether the left ventricular torsion angle may be
used to evaluate myocardial fibrosis or is independent of
myocardial fibrosis, and whether it may predict prognosis for
HCM patients. If so, LV twist analysis may serve as a simple,
convenient indicator for clinical risk stratification and evalu-
ation of therapeutic efficacy.
Conclusions
In conclusion, LV twist and rotation in patients with HCM
can be accurately measured using STE and results may be
relevant to making clinical decisions. LV twist evaluation
may provide useful information on myocardial fibrosis and
cardiac events in HCM patients with normal chamber
function. This clinically promising parameter may be
useful for risk stratification in patients with HCM.
Conflict of interest None.
Open Access This article is distributed under the terms of the
Creative Commons Attribution License which permits any use, dis-
tribution, and reproduction in any medium, provided the original
author(s) and the source are credited.
References
1. Leonardi S, Raineri C, De Ferrari GM, Ghio S, Scelsi L, Pasotti
M, Tagliani M, Valentini A, Dore R, Raisaro A, Arbustini E
(2009) Usefulness of cardiac magnetic resonance in assessing the
risk of ventricular arrhythmias and sudden death in patients with
hypertrophic cardiomyopathy. Eur Heart J 30:2003–2010
2. Green JJ, Berger JS, Kramer CM, Salerno M (2012) Prognostic
value of late gadolinium enhancement in clinical outcomes for
hypertrophic cardiomyopathy. JACC Cardiovasc Imaging
5:370–377
3. Salerno M, Kramer CM (2010) Prognosis in hypertrophic car-
diomyopathy with contrast-enhanced cardiac magnetic reso-
nance: the future looks bright. J Am Coll Cardiol 56:888–889
4. Adabag AS, Maron BJ, Appelbaum E, Harrigan CJ, Buros JL,
Gibson CM, Lesser JR, Hanna CA, Udelson JE, Manning WJ,
Maron MS (2008) Occurrence and frequency of arrhythmias in
hypertrophic cardiomyopathy in relation to delayed enhancement
on cardiovascular magnetic resonance. J Am Coll Cardiol
51:1369–1374
5. Kramer CM (2006) The expanding prognostic role of gadolinium
enhanced cardiac magnetic resonance. JACC 48:1986–1987
6. Faber L, Prinz C, Welge D, Hering D, Butz T, Oldenburg O,
Bogunovic N, Horstkotte D (2011) Peak systolic longitudinal
strain of the lateral left ventricular wall improves after septal
ablation for symptomatic hypertrophic obstructive cardiomyop-
athy: a follow-up study using speckle tracking echocardiography.
Int J Cardiovasc Imaging 27:325–333
7. Helle-Valle T, Crosby J, Edvardsen T, Lyseggen E, Amundsen
BH, Smith HJ, Rosen BD, Lima JA, Torp H, Ihlen H, Smiseth
OA (2005) New noninvasive method for assessment of left
ventricular rotation: speckle tracking echocardiography. Circu-
lation 112:3149–3156
8. Chetboul V, Serres F, Gouni V, Tissler R, Pouchelon JL (2008)
Noninvasive assessment of systolic left ventricular torsion by
2-dimensional speckle tracking imaging in the awake dog: re-
peatabiity, reproducibiity, and comparison with tissue Doppler
imaging variables. J Vet Intern Med 22:242–250
9. Amundsen BH, Helle-Valle T, Edvardsen T, Torp H, Crosby J,
Lyseggen E, Støylen A, Ihlen H, Lima JA, Smiseth OA, Slørdahl
SA (2006) Noninvasive myocardial strain measurement by
speckle tracking echocardiography validation against sonomic-
rometry and tagged magnetic resonance imaging. J Am Coll
Cardiol 47:789–793
10. Sengupta PP, Tajik AJ, Chandrasekaran K, Khandheria BK
(2008) Twist mechanics of the left ventricle: principles and
application. JACC Cardiovasc Imaging 1:366–376
11. Choudhury L, Mahrholdt H, Wagner A, Choi KM, Elliott
MD, Klocke FJ, Bonow RO, Judd RM, Kim RJ (2002)
Myocardial scarring in asymptomatic or mildly symptomatic
patients with hypertrophic cardiomyopahty. J Am Coll Cardiol
40:2156–2164
12. Weiner RB, Weyman AE, Kim JH, Wang TJ, Picard MH, Bag-
gish AL (2008) The impact of isometric handgrip testing on left
ventricular twist mechanics. J Physiol 590:5141–5150
13. Saito M, Okayama H, Yoshii T, Hiasa G, Sumimoto T, Inaba S,
Nishimura K, Inoue K, Ogimoto A, Ohtsuka T, Funada J, Shig-
ematsu Y, Higaki J (2011) The differences in left ventricular tor-
sional behavior between patients with hypertrophic cardiomyopathy
and hypertensive heart disease. Int J Cardiol 150:301–306
14. Popovic ZB, Kwon DH, Mishra M, Buakhamsri A, Greenberg
NL, Thamilarasan M, Flamm SD, Thomas JD, Lever HM, Desai
MY (2008) Association between regional ventricular function
and myocardial fibrosis in hypertrophic cardiomyopathy assessed
by speckle tracking echocardiography and delayed hyperen-
hancement magnetic resonance imaging. J Am Soc Echocardiogr
21:1299–1305
15. Prinz C, van Buuren F, Faber L, Bitter T, Bogunovic N, Burchert
W, Horstkotte D (2012) Myocardial fibrosis is associated with
biventricular dysfunction in patients with hypertrophic cardio-
myopathy. Echocardiography 294:438–444
Int J Cardiovasc Imaging (2014) 30:1539–1548 1547
123
16. Pacileo G, Baldini L, Limongelli G, Di Salvo G, Iacomino M,
Capogrosso C, Rea A, D’Andrea A, Russo MG, Calabro R (2011)
Prolonged left ventricular twist in cardiomyopathies: a potential
link between systolic and diastolic dysfunction. Eur J Echocar-
diogr 12:841–849
17. Wang C, Deng YB, Zhu Y, Liu YN, Bi XJ (2012) Evaluation of
subtle myocardial noncompaction by contrast echocardiography
in patients with hypertrophic cardiomyopathy and its relationship
with regional ventricular systolic dysfunction. J Ultrasound Med
31(10):1551–1557
18. Saito M, Okayama H, Yoshii T, Hiasa G, Sumimoto T, Inaba S,
Nishimura K, Inoue K, Ogimoto A, Shigematsu Y, Funada J,
Hamada M, Higaki J (2011) Myocardial fibrosis attenuates the
effect of cibenzoline on left ventricular diastolic function in
patients with hypertrophic cardiomyopathy. J Cardiovasc Phar-
macol 57:207–212
19. Phelan D, Collier P, Thavendiranathan P, Popovic ZB, Hanna M,
Plana JC, Marwick TH, Thomas JD (2012) Relative apical
sparing of longitudinal strain using two-dimensional speckle-
tracking echocardiography is both sensitive and specific for the
diagnosis of cardiac amyloidosis. Heart 98:1442–1448
20. Nagueh SF, Appleton CP, Gillebert TC, Marino PN, Oh JK,
Smiseth OA, Waggoner AD, Flachskampf FA, Pellikka PA,
Evangelista A (2009) Recommendations for the evaluation of left
ventricular diastolic function by echocardiography. Guidelines
and standards. J Am Soc Echocardiol 22:107–133
21. Miyazaki S, Daimon M, Miyazaki T, Onishi Y, Koiso Y,
Nishizaki Y, Ichikawa R, Chiang SJ, Makinae H, Suzuki H,
Daida H (2011) Global longitudinal strain in relation to the
severity of aortic stenosis: a two-dimensional speckle-tracking
study. Echocardiography 28:703–708
22. Young AA, Kramer CM, Ferrari VA, Axel L, Reichek N (1994)
Three-dimensional left ventricular deformation in hypertrophic
cardiomyopathy. Circulation 90:854–867
23. Van Dalen BM, Kauer F, Soliman OI, Vletter WB, Michels M,
Ten Cate FJ, Geleijnse ML (2009) Influence of the pattern of
hypertrophy on left ventricular twist in hypertrophic cardiomy-
opathy. Heart 95:657–661
24. Urbano Moral JA, Arias Godinez JA, Maron MS, Malik R, Eagan
JE, Patel AR, Pandian NG (2011) Left ventricular twist
mechanics in hypertrophic cardiomyopathy assessed by three-
dimensional speckle tracking echocardiography. Am J Cardiol
108:1788–1795
25. Serri K, Reant P, Lafitte M, Berhouet M, LeBouffos V, Roudaut
R, Lafite S (2006) Global and regional myocardial function
quantification by two-dimensional strain: application in hyper-
trophic cardiomyopathy. J Am Coll Cardiol 47:1175–1181
26. Tanaka H, Tatsumi K, Matsumoto K, Kawai H, Hirata K (2013)
Emerging role of three-dimensional speckle tracking strain for
accurate quantification of left ventricular dyssnchrony. Echocar-
diography 30:E292–E295
27. Maron BJ (2010) Contemporary insights and strategies for risk
stratification and prevention of sudden death in hypertrophic
cardiomyopathy. Circulation 121:445–456
28. Popovic ZB, Kwon DH, Mishra M, Buakhamsri A, Greenberg
NL, Thamilarasan M, Flamm SD, Thomas JD, Lever HM, Desai
MY (2008) Association between regional ventricular function
and myocardial fibrosis in hypertrophic cardiomyopathy assessed
by speckle tracking echocardiography and delayed hyperen-
hancement magnetic resonance imaging. J Am Soc Echocardiol
21:1299–1305
29. Huang J, Ni XD, Hu YP, Song ZW, Yang WY, Xu R (2011) Left
ventricular longitudinal rotation changes in patients with dilated
cardiomyopathy detected by two-dimensional speckle tracking
imaging. Zhonghua Xin Xue Guan Bing Za Zhi 39:920–924
30. Nagakura T, Takeuchi M, Yoshitani H, Nakai H, Nishikage T,
Kokumai M, Otani S, Yoshiyama M, Yoshikawa J (2007)
Hypertrophic cardiomyopathy is associated with more severe left
ventricular dyssychrony than is hypertensive left ventricular
hypertrophy. Echocardiography 24:677–684
31. Tigen K, Sunbul M, Karaahmet T, Dundar C, Ozben B, Guler A,
Cincin A, Bulut M, Sari I, Basaran Y (2013) Left ventricular and
atrial functions in hypertrophic cardiomyopathy patients with
very high LVOT gradient: a speckle tracking echocardiographic
study. Echocardiography. doi:10.1111/echo.12482
32. Saito M, Okayama H, Yoshii T, Higashi H, Morioka H, Hiasa G,
Sumimoto T, Inaba S, Nishimura K, Inoue K, Ogimoto A,
Shigematsu Y, Hamada M, Higaki J (2012) Clinical significance
of global two-dimensional strain as a surrogate parameter of
myocardial fibrosis and cardiac events in patients with hyper-
trophic cardiomyopathy. Eur Heart J Cardiovasc Imaging
13:617–623
33. Reant P, Dijos M, Donal E, Mignot A, Ritter P, Bordachar P, Dos
Santos P, Leclercq C, Roudaut R, Habib G, Lafitte S (2010)
Systolic time intervals as simple echocardiographic parameters of
left ventricular systolic performance: correlation with ejection
fraction and longitudinal two-dimensional strain. Eur J Echo-
cardiogr 11:834–844
34. Nishikage T, Nakai H, Mor-Avi V, Lang RM, Salgo IS, Settle-
mier SH, Husson S, Takeuchi M (2009) Quantitative assessment
of left ventricular volume and ejection fraction using two-
dimensional speckle tracking echocardiography. Eur J Echocar-
diogr 10:82–88
1548 Int J Cardiovasc Imaging (2014) 30:1539–1548
123