Assessment of iron and zinc intake and related biochemical parameters in an adult Mediterranean...
7
Assessment of iron and zinc intake and related biochemical parameters in an adult Mediterranean population from southern Spain: influence of lifestyle factors ☆ Cristina Sánchez, María López-Jurado, Elena Planells, Juan Llopis ⁎ , Pilar Aranda Institute of Nutrition and Food Technology and Department of Physiology, Campus Cartuja, University of Granada, E-18071 Granada, Spain Received 10 July 2007; received in revised form 12 December 2007; accepted 20 December 2007 Abstract This study assessed factors influencing iron and zinc intake and associated biochemical parameters in an adult population from southern Spain to identify patterns of intake and groups at risk for deficiency. A cross-sectional survey was done in Andalusia (southern Spain) to study nutrient intakes in a random sample of 3421 subjects (1747 men, 1674 women, age between 25 and 60 years). Blood samples were obtained for biochemical assays in a random subsample of 354 subjects (170 men, 184 women). Food consumption was assessed by 48-h recall. In blood samples, we measured red blood cells, haemoglobin (Hb), haematocrit, total iron binding capacity (TIBC) and plasma concentration of Fe and Zn. Information about educational level, smoking habit, alcohol consumption and physical exercise was collected with a structured questionnaire. Intakes were below two thirds of the recommended dietary allowances (RDA) in 22.45% of the sample for Fe and in 56.45% for Zn. Iron deficiency [two or more abnormal values for plasma Fe, TIBC, transferrin saturation and mean cell volume (MCV)] was found in 12.7% of the sample, and iron-deficient anaemia (low values for Hb, MCV, mean cell Hb and mean corpuscular Hb concentration) was found in 2.1%. In smokers, plasma levels of Fe were higher, and MCV was lower than in nonsmokers. Plasma Zn concentrations were below the reference value in 17.8% of the persons. Age and body mass index correlated inversely with plasma Zn (P b.01). Gender, age, obesity, smoking, alcohol consumption and physical activity were associated with differences in nutrient intakes. Logistic regression analysis showed that female gender and older age were associated with the risk of low intakes of Fe and Zn. © 2009 Elsevier Inc. All rights reserved. Keywords: Iron; Zinc; Adult; Status; Southern Spain 1. Introduction Abundant information is available on dietary habits of the Spanish population and on the intakes of different foods and nutrients [1,2]. However, information on the influence of educational level, obesity, smoking habit, alcohol consump- tion and physical exercise on mineral status in the adult Spanish population is scarce, especially for Zn intake. The aims of this study were to evaluate the influence of demographic characteristics and lifestyle factors on nutri- tional status of Fe and Zn in the adult population in Andalusia (a western Mediterranean region in southern Spain), document the patterns of nutrient intake, identify groups at risk for dietary deficiency and suggest factors that may influence the status of these nutrients. It is hoped that this information will be useful in designing future health interventions aimed at modifying dietary habits. 2. Methods 2.1. Participants The data reported here were obtained within the frame- work of a large-scale study in the region of Andalusia Available online at www.sciencedirect.com Journal of Nutritional Biochemistry 20 (2009) 125 – 131 ☆ This study was supported by the Dirección General de Salud Pública and the Health Council of the Andalusian Regional Government. ⁎ Corresponding author. Departamento de Fisiología Facultad de Farmacia Campus Cartuja Universidad de Granada, E-18071 Granada, Spain. Tel.: +34 958 243885; fax: +34 958 248959. E-mail address: [email protected] (J. Llopis). 0955-2863/$ – see front matter © 2009 Elsevier Inc. All rights reserved. doi:10.1016/j.jnutbio.2007.12.008
-
Upload
cristina-sanchez -
Category
Documents
-
view
214 -
download
1
Transcript of Assessment of iron and zinc intake and related biochemical parameters in an adult Mediterranean...

Available online at www.sciencedirect.com
istry 20 (2009) 125–131
Journal of Nutritional BiochemAssessment of iron and zinc intake and related biochemical parameters inan adult Mediterranean population from southern Spain:
influence of lifestyle factors☆
Cristina Sánchez, María López-Jurado, Elena Planells, Juan Llopis⁎, Pilar ArandaInstitute of Nutrition and Food Technology and Department of Physiology, Campus Cartuja, University of Granada, E-18071 Granada, Spain
Received 10 July 2007; received in revised form 12 December 2007; accepted 20 December 2007
Abstract
This study assessed factors influencing iron and zinc intake and associated biochemical parameters in an adult population from southernSpain to identify patterns of intake and groups at risk for deficiency. A cross-sectional survey was done in Andalusia (southern Spain) tostudy nutrient intakes in a random sample of 3421 subjects (1747 men, 1674 women, age between 25 and 60 years). Blood samples wereobtained for biochemical assays in a random subsample of 354 subjects (170 men, 184 women). Food consumption was assessed by 48-hrecall. In blood samples, we measured red blood cells, haemoglobin (Hb), haematocrit, total iron binding capacity (TIBC) and plasmaconcentration of Fe and Zn. Information about educational level, smoking habit, alcohol consumption and physical exercise was collectedwith a structured questionnaire. Intakes were below two thirds of the recommended dietary allowances (RDA) in 22.45% of the sample for Feand in 56.45% for Zn. Iron deficiency [two or more abnormal values for plasma Fe, TIBC, transferrin saturation and mean cell volume(MCV)] was found in 12.7% of the sample, and iron-deficient anaemia (low values for Hb, MCV, mean cell Hb and mean corpuscular Hbconcentration) was found in 2.1%. In smokers, plasma levels of Fe were higher, and MCV was lower than in nonsmokers. Plasma Znconcentrations were below the reference value in 17.8% of the persons. Age and body mass index correlated inversely with plasma Zn(Pb.01). Gender, age, obesity, smoking, alcohol consumption and physical activity were associated with differences in nutrient intakes.Logistic regression analysis showed that female gender and older age were associated with the risk of low intakes of Fe and Zn.© 2009 Elsevier Inc. All rights reserved.
Keywords: Iron; Zinc; Adult; Status; Southern Spain
1. Introduction
Abundant information is available on dietary habits of theSpanish population and on the intakes of different foods andnutrients [1,2]. However, information on the influence ofeducational level, obesity, smoking habit, alcohol consump-tion and physical exercise on mineral status in the adultSpanish population is scarce, especially for Zn intake.
☆ This study was supported by the Dirección General de Salud Públicaand the Health Council of the Andalusian Regional Government.
⁎ Corresponding author. Departamento de Fisiología Facultad deFarmacia Campus Cartuja Universidad de Granada, E-18071 Granada,Spain. Tel.: +34 958 243885; fax: +34 958 248959.
E-mail address: [email protected] (J. Llopis).
0955-2863/$ – see front matter © 2009 Elsevier Inc. All rights reserved.doi:10.1016/j.jnutbio.2007.12.008
The aims of this study were to evaluate the influence ofdemographic characteristics and lifestyle factors on nutri-tional status of Fe and Zn in the adult population inAndalusia (a western Mediterranean region in southernSpain), document the patterns of nutrient intake, identifygroups at risk for dietary deficiency and suggest factors thatmay influence the status of these nutrients. It is hoped thatthis information will be useful in designing future healthinterventions aimed at modifying dietary habits.
2. Methods
2.1. Participants
The data reported here were obtained within the frame-work of a large-scale study in the region of Andalusia
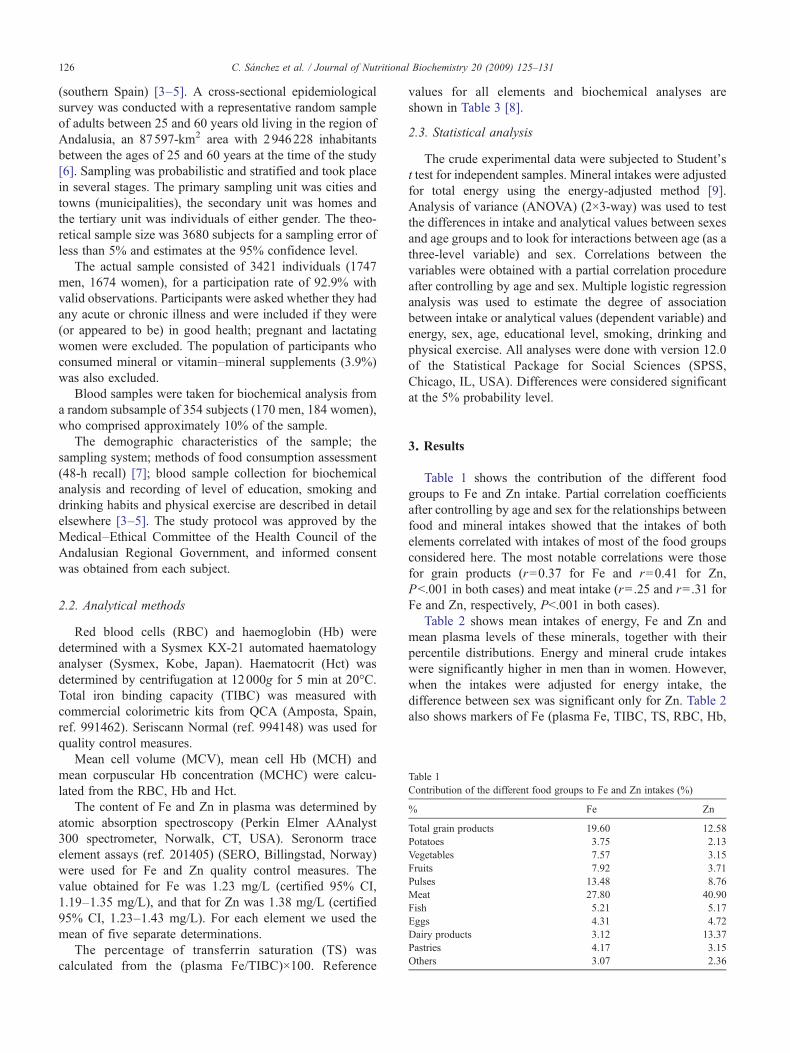
Table 1Contribution of the different food groups to Fe and Zn intakes (%)
% Fe Zn
Total grain products 19.60 12.58Potatoes 3.75 2.13Vegetables 7.57 3.15Fruits 7.92 3.71Pulses 13.48 8.76Meat 27.80 40.90Fish 5.21 5.17Eggs 4.31 4.72Dairy products 3.12 13.37Pastries 4.17 3.15Others 3.07 2.36
126 C. Sánchez et al. / Journal of Nutritional Biochemistry 20 (2009) 125–131
(southern Spain) [3–5]. A cross-sectional epidemiologicalsurvey was conducted with a representative random sampleof adults between 25 and 60 years old living in the region ofAndalusia, an 87597-km2 area with 2946228 inhabitantsbetween the ages of 25 and 60 years at the time of the study[6]. Sampling was probabilistic and stratified and took placein several stages. The primary sampling unit was cities andtowns (municipalities), the secondary unit was homes andthe tertiary unit was individuals of either gender. The theo-retical sample size was 3680 subjects for a sampling error ofless than 5% and estimates at the 95% confidence level.
The actual sample consisted of 3421 individuals (1747men, 1674 women), for a participation rate of 92.9% withvalid observations. Participants were asked whether they hadany acute or chronic illness and were included if they were(or appeared to be) in good health; pregnant and lactatingwomen were excluded. The population of participants whoconsumed mineral or vitamin–mineral supplements (3.9%)was also excluded.
Blood samples were taken for biochemical analysis froma random subsample of 354 subjects (170 men, 184 women),who comprised approximately 10% of the sample.
The demographic characteristics of the sample; thesampling system; methods of food consumption assessment(48-h recall) [7]; blood sample collection for biochemicalanalysis and recording of level of education, smoking anddrinking habits and physical exercise are described in detailelsewhere [3–5]. The study protocol was approved by theMedical–Ethical Committee of the Health Council of theAndalusian Regional Government, and informed consentwas obtained from each subject.
2.2. Analytical methods
Red blood cells (RBC) and haemoglobin (Hb) weredetermined with a Sysmex KX-21 automated haematologyanalyser (Sysmex, Kobe, Japan). Haematocrit (Hct) wasdetermined by centrifugation at 12000g for 5 min at 20°C.Total iron binding capacity (TIBC) was measured withcommercial colorimetric kits from QCA (Amposta, Spain,ref. 991462). Seriscann Normal (ref. 994148) was used forquality control measures.
Mean cell volume (MCV), mean cell Hb (MCH) andmean corpuscular Hb concentration (MCHC) were calcu-lated from the RBC, Hb and Hct.
The content of Fe and Zn in plasma was determined byatomic absorption spectroscopy (Perkin Elmer AAnalyst300 spectrometer, Norwalk, CT, USA). Seronorm traceelement assays (ref. 201405) (SERO, Billingstad, Norway)were used for Fe and Zn quality control measures. Thevalue obtained for Fe was 1.23 mg/L (certified 95% CI,1.19–1.35 mg/L), and that for Zn was 1.38 mg/L (certified95% CI, 1.23–1.43 mg/L). For each element we used themean of five separate determinations.
The percentage of transferrin saturation (TS) wascalculated from the (plasma Fe/TIBC)×100. Reference
values for all elements and biochemical analyses areshown in Table 3 [8].
2.3. Statistical analysis
The crude experimental data were subjected to Student'st test for independent samples. Mineral intakes were adjustedfor total energy using the energy-adjusted method [9].Analysis of variance (ANOVA) (2×3-way) was used to testthe differences in intake and analytical values between sexesand age groups and to look for interactions between age (as athree-level variable) and sex. Correlations between thevariables were obtained with a partial correlation procedureafter controlling by age and sex. Multiple logistic regressionanalysis was used to estimate the degree of associationbetween intake or analytical values (dependent variable) andenergy, sex, age, educational level, smoking, drinking andphysical exercise. All analyses were done with version 12.0of the Statistical Package for Social Sciences (SPSS,Chicago, IL, USA). Differences were considered significantat the 5% probability level.
3. Results
Table 1 shows the contribution of the different foodgroups to Fe and Zn intake. Partial correlation coefficientsafter controlling by age and sex for the relationships betweenfood and mineral intakes showed that the intakes of bothelements correlated with intakes of most of the food groupsconsidered here. The most notable correlations were thosefor grain products (r=0.37 for Fe and r=0.41 for Zn,Pb.001 in both cases) and meat intake (r=.25 and r=.31 forFe and Zn, respectively, Pb.001 in both cases).
Table 2 shows mean intakes of energy, Fe and Zn andmean plasma levels of these minerals, together with theirpercentile distributions. Energy and mineral crude intakeswere significantly higher in men than in women. However,when the intakes were adjusted for energy intake, thedifference between sex was significant only for Zn. Table 2also shows markers of Fe (plasma Fe, TIBC, TS, RBC, Hb,

Table 3Percentage of the population with intakes below two thirds of the RDA [47]and Zn, Fe and Hb concentrations, Hct, mean corpuscular volume, TIBC andpercent TS below the reference values
Total Men Women
Intake b2/3 RDAn 3421 1747 1674Fea 22.45 2.63 43.13Zna 56.45 44.36 69.06
Biochemical parameters% of the population with values below the reference valuesb
n 354 170 184FeHb (men b13; women b12 mg/dl) 5.93 2.35 9.23Hct (men b40%; women b36%) 1.41 1.76 1.09MCH b27 (pg) 8.47 7.65 9.24MCV b80 (fl) 3.14 1.76 4.35Plasma Fe b60 μg/dl 29.50 25.00 33.70TIBC N400 μg/dl 1.69 1.76 1.63TS (%) b16 (%) 9.89 8.82 10.90Iron deficiencyc 12.7 10.3 14.5Iron deficient anaemiad 2.1 0.8 3.0ZnPlasma Zn b70 μg/dlb 17.80 17.06 18.48
a The RDA for the Spanish population were used as reference values[47].
b Reference values [8].c Defined as the existence of at least two abnormal values between four
markers of iron status (plasma Fe, TIBC, TS and MCV).d Defined as below-normal values for Hb, MCV, MCH and MCHC.
Table 2Mean intakes and biochemical parameters for Fe and Zn
Total Men Women
Mean S.D. Mean S.D. P25 P50 P75 Mean S.D. P25 P50 P75
IntakeN 3421 1747 1674Energy (MJ/day) 9.25 3.50 10.51 3.75 7.96 10.03 12.43 7.92 2.62b 6.01 7.66 9.41Fe (mg/day) 13.65 6.92 15.42 7.80 11.10 14.30 18.18 11.73 4.61b 8.61 11.24 14.01
13.72 5.01a 13.50 4.91a
Zn (mg/day) 10.72 6.40 12.24 7.16 8.08 10.64 14.53 9.07 4.40b 6.27 8.22 10.7710.88 5.02a 10.49 5.03a,b
Biochemical parametersn 354 170 184FeRBC×103/mm3 4745 455 4956 418 4716 4920 5164 4567 4110b 4300 4555 4760Hb (mg/dl) 14.39 2.26 15.39 2.80 14.38 15.18 15.98 13.68 1.37b 12.90 13.90 14.40Hct (%) 45.84 4.52 48.71 4.31 45.85 48.65 51.12 43.78 3.41b 41.40 44.30 45.63MCV (fl) 97.31 9.16 98.65 9.19 93.19 97.84 104.87 96.39 9.05b 90.67 96.68 102.3MCH (pg) 30.52 4.14 31.11 5.02 29.15 30.66 32.12 30.10 3.30 28.60 30.46 31.90MCHC (g/dl) 31.48 4.47 31.70 5.82 29.95 31.51 32.52 31.34 3.18 29.88 31.50 32.71Plasma Fe (μg/dl) 99.10 48.16 104.37 47.97 60.00 100.00 145.00 95.54 48.07 55.00 90.00 125.0TIBC (μg/dl) 271.59 72.15 274.15 72.50 219.0 282.0 317.3 270.53 71.45 219.0 279.0 309.0TS (%) 38.40 21.29 39.61 20.70 24.27 35.58 50.85 37.54 21.80 21.16 32.68 47.00ZnPlasma Zn (μg/dl) 110.00 41.95 114.30 43.65 90.00 110.00 143.75 106.69 40.61 80.00 100.00 125.0
P indicates percentile.a Mean values adjusted for energy intake.b Mean values were significantly different from those for the men (Pb.05).
127C. Sánchez et al. / Journal of Nutritional Biochemistry 20 (2009) 125–131
Hct, MCV, MCH and MCHC) and Zn status (plasma Zn)[10] together with their percentile distributions. Meanbiochemical values were within normal limits in both sexes.
Energy intake controlling by age and sex correlated withthe intakes of Fe and Zn (r=0.64 and r=0.56, respectively,Pb.01 in both cases) and with RBC and Hb (r=0.12 andr=0.14, respectively, Pb.05 in both cases).
The occasional correlations between biochemical para-meters and food intakes were weak. Iron intake correlatedwith RBC count (r=0.13), Hb (r=0.18) and Hct values(r=0.12), with Pb.05 in all cases.
Table 3 shows the percentages of our study populationwith intakes below two thirds of the recommended dietaryallowance (RDA). The percentage of the population withlow Zn intake was greater than the percentage with low Feintake. Of note was the higher percentage of women thanmen at risk for deficient Fe intake. However, thepercentages of men and women with plasma Fe concentra-tions below the reference value were higher than thepercentages of both sexes with low plasma Zn concentra-tion. As found for Fe intake, the proportion of participantswith deficient plasma Fe levels was greater in women thanin men.
Table 3 also shows the percentages of the population withlaboratory results below the reference values. Based on thesuggestion that the use of different markers simultaneouslycan provide a more accurate measure of Fe status [11], we

Table 4Effect of age, educational level, obesity, smoking, drinking and physical exercise on mean daily crude intakes and plasma concentrations of Fe and Zn
N Intake (mg/day) N Biochemical parameters
Fe (mg/day) Zn (mg/day) Hb (g/dl) MCV (fl) MCH (pg) Plasma Fe (μg/dl) TS % Plasma Zn (μg/dl)
Age groups (years)25–39 1720 13.9±6.44 11.4±6.77 164 14.1±1.51 98.4±9.48 30.6±3.08 98.9±48.43 39.4±21.95 117.0±43.0540–49 806 13.6±5.77 10.3±6.03† 80 14.6±3.83 95.9±9.55 30.5±6.70 93.8±42.93 37.2±22.25 108.9±42.7550–60 895 13.5±7.10 9.7±4.87† 110 14.5±1.45 97.1±8.53 30.4±2.87 98.9±49.83 38.1±20.16 102.5±39.82†
Educational levelUniversity 643 13.6±6.44 10.7±6.13 49 14.2±1.73 96.0±10.77 29.7±3.46 96.7±50.41 35.6±17.56 104.3±41.14Secondary 812 13.8±5.77 11.4±6.88 75 14.1±1.27 98.9±8.76 30.4±2.74 105.7±42.04 40.4±21.29 113.3±34.56Primary/no schooling 1966a 13.6±7.10 10.4±5.82 230b 14.5±2.52 97.1±8.98 30.7±4.53 98.0±49.49 38.4±22.03 109.7±43.66
ObesityObesec 645 13.2±8.51 9.93±5.83 70 15.0±3.87 96.7±8.83 31.0±6.76 103.8±51.29 38.4±18.22 101.8±39.64Nonobese 2776 13.7±6.20 10.8±6.17◊ 284 14.2±1.53 97.6±9.23 30.4±3.07 98.2±43.09 38.5±22.20 112.0±42.62
Smoking habitCurrent smokers 1443 14.3±7.28 11.2±6.72 131 14.8±3.73 100.5±8.96 30.8±3.47 89.6±42.36 35.9±20.82 111.9±41.10Nonsmokersd 1978 13.1±6.20‡ 10.2±5.69‡ 223 14.3±1.39 96.2±8.97‡ 30.2±2.88 102.5±49.72‡ 39.3±21.44 109.2±42.32
Alcohol consumptionDrinkers 1684 14.8±7.22 11.5±6.22 169 14.6±2.89 98.1±8.61 30.8±4.98 98.4±44.83 39.3±22.12 109.8±42.10Nondrinkerse 1737 12.5±5.92∥ 9.9±6.02∥ 185 14.2±1.45 96.6±9.60 30.3±3.21 99.7±51.11 37.7±20.58 110.0±41.95
Physical exerciseSedentaryf 2222 13.3±6.74 10.3±5.88 225 14.4±2.58 97.7±9.61 30.7±4.73 99.3±48.62 38.9±21.72 107.4±40.31Active 1199 14.2±6.53¶ 11.4±6.56¶ 129 14.4±1.44 96.7±8.21 30.2±2.55 99.2±47.43 37.5±20.62 114.8±45.00
Mean values were significantly different from †25–39 years, ◊obese, ‡smokers, ║drinkers and ¶sedentary (Pb.05).a One thousand eight hundred eighty persons with elementary school education only and 86 persons with no formal schooling.b Two hundred twenty persons with elementary school education only and 10 persons with no formal schooling.c Obese: BMI N30 kg/m2.d “Never” and “former” smokers.e Never drinks or drinks only on special occasions.f Sedentary: less than 1 h/week spent on leisure-time physical exercise.
128 C. Sánchez et al. / Journal of Nutritional Biochemistry 20 (2009) 125–131
considered individuals to be Fe-deficient if at least two of thefollowing indicators were abnormal: plasma Fe, TIBC, TSand MCV. Individuals were considered to have iron-deficientanaemia if they had below-normal values for Hb, MCV,MCH and MCHC. As expected, the percentage of the iron-deficient population was notably higher than the percentagepopulation with iron-deficient anaemia. Moreover, thepercentage of women with iron deficiency and iron-deficientanaemia was higher than the corresponding percentagesin men.
When we compared mineral intakes across age groups(Table 4), we found that the oldest age group (50–60 years)had the lowest crude intake of Fe. However, mean plasma Feconcentration, Hb, MCV, MCH and percentage TS showedno significant changes with ageing.
Crude Zn intake decreased with age. In plasma,significant differences were found for Zn, with lowest valuesin the 50–60-year-old group (Table 4). Analysis of variancerevealed a significant interaction only between age and sexfor plasma Zn (Pb.05). In addition, plasma Zn concentrationcorrelated inversely with age (r=−0.14, Pb.01).
We also examined the possible effect of educational level,obesity, smoking habit, alcohol consumption and physicalactivity on the status of these minerals (Table 4). Accordingto our results, Zn intake was lower in obese persons. PlasmaZn correlated inversely with body mass index (BMI) (r=−0.13, Pb.01). In smokers, drinkers and active people (those
who devoted less than 1 h/week to physical exercise), higherintakes were found for Fe and Zn than in nonsmokers,nondrinkers and sedentary persons.
In contrast to the differences for intake when wecompared participants for lifestyle variables, the results ofthe biochemical analyses showed the only significantdifferences to be higher plasma levels of Fe and lowerMCV in nonsmokers than in smokers (Table 4).
Alcohol intake correlated with intakes of Fe (r=0.29,Pb.01) and Zn (r=0.20, Pb.01) and with Hb level (r=0.12,Pb.05). The number of cigarettes smoked per day alsocorrelated with Zn intake (r=0.14, Pb.05) and MCV(r=0.17, Pb.01).
Table 5 shows the associations (odds ratio and 95% CIs)for Fe and Zn intake with energy intake, demographic andlifestyle factors. In addition to these results, we estimated thedegree of association between biochemical parameters(dependent variables: plasma Fe, Hb, MCV, MCH, percen-tage TS and plasma Zn) and energy intake, demographic andlifestyle factors. The model adjusted for all variables failed todetect any significant associations.
4. Discussion
In southern Spain, as in other western countries, dietaryFe and Zn are provided mainly by grain products and meat

Table 5Odds ratios and 95% confidence intervals, adjusted for all variables in thetable, for Fe and Zn intakes according energy intake, demographic andlifestyle factors
Fe Zn
Energy intake OR (95% CI) OR (95% CI)RDA b100% 1.00 1.00RDA ≥100% 0.13 (0.10–0.17)⁎ 0.09 (0.07–0.12)⁎
GenderMale 1.00 1.00Female 37.21(29.23–47.38)⁎ 4.31 (3.35–5.52)⁎
Age (years)25-39 1.00 1.0040-49 1.25 (0.98–1.60) 1.72 (1.29–2.31)⁎
50-60 0.21 (0.16–0.28)⁎ 2.13 (1.57–2.88)⁎
ObesityBMI b30 kg/m2 1.00 1.00BMI ≥30 kg/m2 0.73 (0.57–0.95) 0.96 (0.70–1.30)
Educational levelUniversity 1.00 1.00Secondary 1.10 (0.82–1.47) 0.66 (0.47–0.92)⁎
Primary/no schooling 1.02 (0.78–1.33) 0.75 (0.55–1.02)Smoking habitNonsmokersa 1.00 1.00Smokers 1.19 (0.96–1.47) 0.89 (0.71–1.12)Alcohol consumptionNondrinkersb 1.00 1.00Drinkers 0.75 (0.61–0.91)⁎ 1.17 (0.93–1.47)Physical exerciseActivec 1.00 1.00Sedentary 1.18 (0.95–1.46) 1.08 (0.85–1.38)
OR indicates odds ratios; CI, confidence intervals. All variables are adjustedfor other variables in the table.
⁎ Pb.05.a Nonsmokers and former smokers.b Never drinks or drinks only on special occasions.c Active: more than 1 h per week spent on leisure-time physical exercise.
129C. Sánchez et al. / Journal of Nutritional Biochemistry 20 (2009) 125–131
(Table 1) [12–16]. The correlations between energy intakeand the intake of Fe [17] and Zn support the notion thatgreater mineral intake was related with greater energy intake.
The intakes of Fe in southern Spain were similar to themean values reported for the adult population of Spainoverall [1], Sweden [18] and France [19]. However, Feintakes in our study were slightly higher than those observedin adults in the Netherlands [18], Belgium [20], UK [14] andChile [16] and slightly lower than in Denmark [18] and theUnited States [21,22]. In women, Fe intake was lower thanthe values reported in Germany [18], Russia [23] and Ireland[12] and was higher than in women from developingcountries such as Nigeria [24].
The intakes of Zn in southern Spain were similar to themean values reported for the adult population of Spainoverall [1], Germany, Netherlands [18], the United States[25] and France [18,26] but were slightly higher than thoseobserved in adults in Sweden [18], Ireland [12], the UnitedKingdom [14] and Chile [16] and slightly lower than theintakes in Denmark [18].
The higher energy-adjusted Zn intakes in men reflectedtheir greater consumption of meat and grain products.Although the differences in crude Fe and Zn intakes between
men and women were significant, plasma concentrationswere similar (Table 2).
The percentage of persons at risk for inadequate intake(b2/3 or 66.6% RDA) of Fe in Andalusia (southern Spain)was lower than in Catalonia (northeastern Spain) [27] and theCanary Islands [28]. A high percentage (39.3%) of thepopulation in the United States was also found to be at riskfor intakes lower than 70% of the RDA [25].
The association between Fe intake and Hb in the adultpopulation studied here has also been described by others inchildren aged 6–12 months [29] and in a study withparticipants ranging in age from 6 months to 97 years [30].The prevalence of anaemia (Hb b12 mg/dl), as expected, washigher in women because of menstrual losses. The prevalenceof anaemia among women in Andalusia is slightly lower thanin women in Nepal [31], Japan [32] and Ireland, similar to theprevalence in the UK but higher than that in other Europeancountries [33]. However, we note that participants in ourstudy population ranged in age from 25 to 60 years, whereasthe results reported by Hercberg et al. [33] were obtained inmenstruating women only. When we analysed the data onlyfor women younger than 45 years, the prevalence of anaemiain our study population increased to 13.8%.
In the present study, the prevalence of iron-deficientanaemia (Table 3) was similar to that reported by Deeganet al. [34] in adolescents and lower than the prevalence foundby Waldamann et al. [35] in adult vegetarian women.
It is currently accepted that plasma Zn concentration is avalid indicator of whole-body Zn status in the absence ofconfounding factors, such as infection or stress [36]. Meanplasma Zn concentrations in the Andalusian population weresimilar to those reported in other regions of Spain [28,37].However, the prevalence of low plasma Zn concentrations insouthern Spain (Table 3) was lower than in Catalonia(northeastern Spain) [27] and in Mexican women [38] butmuch higher than the prevalence reported in the NationalHealth and Nutrition Examination Survey II (NHANES II)study [39] and in the Canary Islands [28]. In the latter study,the reference value (60 μg/dl) was lower than the referencevalue we used (70 μg/dl), which may account for part of theconsiderable differences in prevalence between our studypopulation and earlier studies.
The decrease in crude Zn intake with age (Table 3)reflects mainly the decreased intake of meat in older agegroups, as the intake of dairy products changes little withage. We found that in southern Spain, traditional dietaryhabits are stronger in older age groups, as has also beenreported for a southern French population [40]. The decreasein Zn intake with age is reflected by lower plasmaconcentrations in older age groups [41,42] and by theinverse correlation between plasma Zn concentration and age(see Results) [43]. The results of logistic regression analysis(Table 5) confirmed this finding.
In the present study, Fe status was not affected by obesity,but Zn status differed depending on BMI (Table 4). Thehigher Zn intake in the nonobese population reflected the

130 C. Sánchez et al. / Journal of Nutritional Biochemistry 20 (2009) 125–131
greater consumption of grain and dairy products, whichwould account for the slightly higher mean values for plasmaZn concentration in this subgroup and for the inversecorrelation between plasma Zn levels and BMI (see Results).This correlation was also described in pregnant womenduring the early weeks of gestation [44] and in children aged3–14 years [45].
A possible explanation for the higher crude intakes of Feand Zn in smokers (Table 4) is that energy intake was higheramong smokers [9.90 (S.D., 3.79) MJ/day vs. 8.78 (S.D.,3.20) MJ/day; Pb.001 for smokers and nonsmokers,respectively] because of their greater consumption ofgrain products and meat. The correlations between crudeenergy intake, total grain products and meat and crudeintakes of each of the two elements (see Results) supportthis explanation. However, nonsmokers had higher meanplasma Fe concentrations than smokers, a finding that maybe related with the higher vitamin C intake in nonsmokers[125.38 (S.D., 93.73) mg/day vs. 148.57 (S.D., 104.33) mg/day; Pb.001 for smokers and non-smokers, respectively].
The greater MCV in smokers (Table 4) was the result ofthe higher Hct [47.1 (S.D., 5.0) v. 45.4 (S.D., 4.3); Pb.01 insmokers and non-smokers, respectively]. Moreover, thenumber of cigarettes smoked per day correlated directlywith MCV. These findings reflect the smoking-induceddecrease pulmonary function.
As noted above with regard to the findings in thesubgroup of persons who smoked, the greater crude intakesof the two elements in persons who drank (Table 4) reflectedthe greater energy intake in this population subgroup[drinkers 10.14 (S.D., 3.59) MJ/day v. non-drinkers 8.40(S.D., 3.18) MJ/day; Pb.001].
The moderate mean intakes of alcohol in our population(one to two drinks per day) may help explain why noimpairment was found in MCV among alcohol drinkers [3].
The greater energy intake in the active population (i.e.,persons who spent more than 1 h per week on leisure-timephysical activity) [active 9.76 (S.D., 3.35) MJ/day vs.sedentary 8.98 (S.D., 3.70) MJ/day; Pb.001] accounted forthe greater intakes of Fe and Zn in this subgroup. However,we should note that consumption of dairy products was alsoslightly higher in the active population [46,47].
Although the interpretation of data from survey studiescan be complex, our results provide an initial estimate of thenutritional status for Fe and Zn in the adult population ofsouthern Spain. The percentages of persons found to be atrisk for inadequate intake of Fe and Zn were worrisome(Table 3). Gender, age, obesity, smoking, alcohol consump-tion and physical activity were associated with differences innutrient intakes. However, logistic regression analysisshowed that the risk of low intake of Fe and Zn wasassociated only with energy intake, female gender and olderage groups, and that the risks of Fe deficiency (in 12.7% ofthe population we studied), iron-deficient anaemia (2.1%)and hypozincemia (2.17%) were not associated with any ofthe other factors we investigated.
We therefore suggest that the intake of these minerals beincreased in both genders and that recommendations toincrease physical activity are in order. These measuresshould be aimed particularly at women of reproductive age,in whom menstrual blood loss increases the risk of irondeficiency and anaemia.
Acknowledgments
We thank the Escuela Andaluza de Salud Pública inGranada, Spain, and K. Shashok for translating significantparts of the manuscript into English.
References
[1] Varela G, Moreiras O, Carbajal A, Campo M. Encuestas depresupuestos familiares 1990-1991: Estudio nacional de nutricional yalimentación 1991. Madrid: Instituto Nacional de Estadística; 1995.
[2] Ministerio de Agricultura Pesca y Alimentación (MAPA). Laalimentación en España. Madrid: Ministerio de Agricultura Pesca yAlimentación. Dirección General de Alimentación; 2000.
[3] Mataix J, Aranda C, Sánchez C, Montellano M, Planells E, Llopis J.Assessment of thiamin (vitamin B1) and riboflavin (vitamin B2) statusin an adult Mediterranean population. Brit J Nutr 2003;90:661–6.
[4] Mataix J, López-Frías M, Martínez de Victoria E, López-Jurado M,Aranda P, Llopis J. Factors associated with obesity in an adultMediterranean population: Influence on plasma lipid profile. J Am CollNutr 2005;24:456–65.
[5] Mataix J, Aranda C, López-Jurado, Sánchez C, Planells E, Llopis J.Factors influencing the intake and plasma levels of calcium,phosphorus and magnesium in southern Spain. Eur J Nutr 2006;45:349–54.
[6] Instituto de Estadística de Andalucía (IEA). Andalucía. Datos Básicos.Sevilla: Consejería de Economía y Hacienda, Junta de Andalucía;2001. http://www.juntadeandalucia.es/institutodeestadistica/.
[7] Cameron ME, Van Staveren WA, editors. Manual on methodologyfor food consumption studies. Oxford: Oxford University Press;1988. p. 83.
[8] Sauberlich HE. In: Wolinsky I, editor. Laboratory tests for theassessment of nutritional status. Boca Raton (fla): CRC Press; 1999.p. 313.
[9] Willett WC, Stampfer MJ. Total energy intake: implications forepidemiologic analyses. Am J Epidemiol 1986;124:17–27.
[10] Fidanza F, editor. Nutritional status assessment. London: Chapman &Hall; 1991. p. 355–95.
[11] Gibson R. Principles of nutritional assessment. Oxford (NY): OxfordUniversity Press; 2005.
[12] Hannon EM, Kiely M, Harrington KE, Robson PJ, Strain JJ, Flynn A.The North/South Ireland food consumption survey: mineral intakes in18–64 years-old adults. Public Health Nutr 2001;4:1081–8.
[13] Lombardi-Boccia G, Aguzzi A, Cappelloni M, Di Lullo G, Lucarini M.Total-diet study: dietary intakes of macro elements and trace elementsin Italy. Br J Nutr 2003;90:1117–21.
[14] Henderson L, Irving K, Gregory J. The national diet and nutritionsurvey: adults aged 19 to 64 years. Vitam Miner Intake Urin Analytes2003. http://www.food.gov.uk/multimedia/pdfs/ndnsv3.pdf.
[15] Lati-Koski M, Valsta LM, Alfthan G, Tapanainen H, Aro A. Iron statusof adults in the capital area of Finland. Eur J Nutr 2003;42:287–92.
[16] Olivares M, Pizarro F, de Pablo S, Araya M, Uauy R. Iron, zinc andcooper: contents in common Chilean foods and daily intakes inSantiago, Chile. Nutrition 2004;20:205–12.
[17] Galan P, Hercberg S, Soustre Y, Dop MC, Dupin H. Factors affectingiron stores in French females students. Hum Nutr Clin Nutr 1985;39:279–87.

131C. Sánchez et al. / Journal of Nutritional Biochemistry 20 (2009) 125–131
[18] van Dokkum W. The intake of selected minerals and trace elements inEuropean countries. Ntr Res Rev 1995;8:271–302.
[19] Hercberg S, Estaqui C, Czernichow S, Mennen L, Noisette N,Bertrais S, et al. Iron status and risk of cancers in the SU.VI.MAXcohort. J Nutr 2005;135:2664–8.
[20] Van Cauwenbrgh R, Hendrix P, Robberecht H, Deelstra H. Dailydietary iron in Belgium using duplicate portion sampling. Z LebensmUnters Forsch A 1997;205:401–6.
[21] Hajjar I, Kotchen T. Regional variations of blood pressure in theUnited States are associated with regional variations in dietary intakes:The NHANES-III data. J Nutr 2003;133:211–4.
[22] Townsend MS, Fulgoni III VL, Stern JS, Adu-Afarwuah S, McCarronDA. Low mineral intake is associated with high systolic blood pressurein the third and fourth National Health and Nutrition ExaminationSurvey. Am J Hypertension 2005;18:261–9.
[23] Tseng M, Chakraborty H, Robinson DT, Mendez M, Kohlmeier L.Adjustment of iron intake for dietary enhancers and inhibitors inpopulation studies: bioavailable iron in rural and urban residingRussian women and children. J Nutr 1997;127:1456–68.
[24] Oguntona CR, Tella TO. Street foods and dietary intakes of Nigeriaurban market women. Int J Food Sci Nutr 1999;50:383–90.
[25] Briefel RR, Bialostosky K, Kennedy-Stephenson J, McDowell MA,Ervin RB, Wright JD. Zinc intake of the U.S. population: findings fromthe Third National Health and Nutrition Examination Survey, 1988–1994. J Nutr 2000;130:1367S–73S.
[26] Noël L, Leblanc JC, Guerin T. Determination of several elements induplicate meals from catering establishments using closed vesselmicrowave digestion with inductively coupled plasma mass spectro-metry detection: estimation of daily dietary intake. Food Addit Contam2003;20:44–56.
[27] Serra-Majem L, Ribas L, García R, Ramón JM, Salvador G, Farran A,et al. The evaluation of nutritional status in Catalonia, Spain (1992-93).Barcelona: Departament de Sanitat i Seguretat Social. Generalitat deCatalunya; 1996.
[28] Henriquez P, Díaz C, Rodríguez E, López F, Álvarez E, Díaz J, et al.Biochemical assessment of nutritional status in the Canary Islandpopulation. Archiv Latinoam Nutr 2000;50(Suppl 1):43–53.
[29] Lind T, Hernell O, Lönnerdal B, Stenlund H, Domellöf M, PerssonLA. Dietary iron intake is positively associated with haemoglobinconcentration during infancy but not during the second year of life.J Nutr 2004;134:1064–70.
[30] Preziosi P, Hercberg S, Galan P, Devanlay M, Cherouvrier F, Dupin H.Iron status of a healthy French population: factors determiningbiochemical markers. Ann Nutr Metab 1994;38:192–202.
[31] Chandyo RK, Strand TA, Ulvik RJ, Adhikari RK, Ulan M, Dixit H,et al. Prevalence of iron deficiency and anemia among healthy womenof reproductive age in Bhaktapur, Nepal. Eur J Clin Nutr 2007;61:262–9.
[32] Kusumi E, Shoji M, Endou S, Kishi Y, Shibata T, Murashige N, et al.Prevalence of anemia among healthy women in 2 metropolitan areas ofJapan. Int J Hematol 2006;84:217–9.
[33] Hercberg S, Preziosi P, Galan P. Iron deficiency in Europe. PublicHealth Nutr 2001;4:537–45.
[34] Deegan HE, Bates H, McCargar L. Assessment of iron status inadolescents: dietary biochemical, and lifestyle determinants. J AdolescHealth 2005;37:75–7.
[35] Waldmann A, Koschizke JW, Leitzmann C, Hahn A. Dietary ironintake and iron status of German female vegans: results of the GermanVegan Study. Ann Nutr Metabol 2004;48:103–8.
[36] Lowe NM, Woodhouse LR, Sutherland B, Shames DM, Burri BJ,Abrams SA, et al. Kinetic parameters and plasma Zinc concentrationscorrelate well with net loss and gain of Zinc from men. J Nutr 2004;134:2178–81.
[37] Schuhmacher MS, Domingo JL, Corbella J. Zinc and copper levels inserum and urine: relationship to biological, habitual and environmentalfactors. Sci Total Environ 1994;148:67–72.
[38] Villalpando S, García-Guerra A, Ramírez-Silva I, Mejía-Rodríguez F,Matute G, Shamah-Levy T, et al. Iron, zinc and iodide in Mexicanchildren under 12 years and women 12–49 years of age. A probabilisticnational survey. Salud Pública Mex 2003;4S:S520–9.
[39] Pilch SM, Senti FR. Assessment of the zinc nutritional status of the U.S. population based on data collected in the second National Healthand Nutrition Examination Survey. 1976-1980. Bethesda (Md): LifeSciences Research Office, Federation of American Societies forExperimental Biology; 1984.
[40] Scali J, Richard A, Gerber M. Diet profiles in a population sample fromMediterranean southern France. Public Health Nutr 2001;4:173–82.
[41] Speich M, Gelot S, Auget JL. Plasma and erythrocyte magnesium,calcium, zinc, copper, phosphorus and cholesterols in a population of1050 healthy-adults — new statistical approach and interpretations.Mag Bull 1995;17:62–9.
[42] Hotz C, Peerson J, Brown KH. Suggested lower cutoffs of serum zincconcentrations for assessing zinc status: reanalysis of the secondNational Health and Nutrition Examination Survey data (1976–1980).Am J Clin Nutr 2003;78:756–64.
[43] Mariani E, Cornacchiola V, Polidori M, Mangialasche F, Malavolta M,Cecchetti R, et al. Antioxidant enzyme activities in healthy old subjects:influence of age, gender and zinc status. Biogerontology 2006;7:391–8.
[44] Tamura T, Goldemberg RL, Johnston KE, Chapman VR. Relationshipbetween pre-pregnancy BMI and plasma Zn concentrations in earlypregnancy. Br J Nutr 2004;91:773–7.
[45] Arvanitidou V, Voskaki I, Tripsianis G, Athanasopoulo H, Tsalkidis A,Filippidis S, et al. Serum cooper and zinc concentrations in healthychildren aged 3–14 years in Greece. Biol Trace Element Res 2007;115:1–12.
[46] Beitz R, Mensink G, Henschel Y, Fischer B, Erbersdobler HF. Dietarybehaviour of German adults differing in levels of sport activity. PublicHealth Nutr 2004;7:45–51.
[47] Moreiras O, Carbajal A, Cabrera L, Cuadrado C. In: Moreiras O,Carbajal A, Cabrera L, Cuadrado C, editors. Ingestas recomendadas deenergía y nutrientes para la población española (revisadas 2002).Ediciones Pirámide,Madrid: Tablas de composición de alimentos; 2004.