Hydroclimatic Reconstruction of the Arbuckle–Simpson Aquifer using Tree Rings
Assessment of Hydroclimatic Condition in Extensive Groundwater Mining Area, Southern India
301
Assessment of Hydroclimatic Condition in Extensive Groundwater Mining Area, Southern India
Anbazhagan S* and Jothibasu ACentre for Geoinformatics and Planetary Studies, Department of Geology,
Periyar University, Salem – 636 011, India.*Corresponding Author :[email protected]
ABSTRACTThe study highlights the climatic water balance, drought assessment and agricultural potentiality of Uppar Odai sub-basin located in the Southern part of India, Tamil Nadu state. The average annual precipitation in the sub-basin is 625 mm, which is much lower than the state average rainfall (970 mm). It has been observed that the intensive agricultural practices and extensive groundwater mining lead to the groundwater decline in the sub-basin. Rainfall data were collected from 1971-2011 for five rain gauge stations. The hydroclimatic potentialities such as precipitation, temperature and water holding capacity are the three primary parameters considered to derive water balance parameters. The secondary water balance components, namely potential evapotranspiration (PET), actual evapotranspiration (AET), water deficit (WD) and water surplus (WS) were derived from these primary parameters. The PET and AET were calculated using Thornthwait’s (1948) and Thornthwaite and Mather (1955) methods respectively. Four water balance indices, namely index of aridity (Ia), index of humidity (Ih), index of moisture (Im) and index of moisture adequacy (Ima) were calculated from secondary water balance components. From the derived indices, drought condition, climatic shift and agricultural potentiality were assessed. The results have indicated that drought condition prevails during every alternate year in the sub-basin.
INTRODUCTION
The hydroclimatic potentialities include precipitation, temperature, water holding capacity, potential evapotranspiration, actual evapotranspiration, water surplus and water deficit. These parameters control the agricultural activities right from nursery to harvesting. Precipitation plays a major role in modulating the climate stress. The quantified annual rainfall in India is estimated as 4000 cubic km. About 3000 cubic km is derived from southwest monsoon that prevails for a period of 18 weeks (Sharma and Sivaram, 2011). The hydroclimatic aspects over India for the monsoon period is based on weekly temperature and rainfall data through the revised water balance model of Thornthwaite & Mather (1955). Climatic water balance studies, especially the drought assessment were conducted in parts of South India (Subrahmanyam and Subramanyam, 1964; Subrahmanyam and Sastri, 1969). Sreedevi (2002) conducted climatic water balance study for understanding the drought condition and recommended suitable drought resistant crops in the Pageru river basin, Andhra Pradesh. The concept of hydroclimatic potentialities focuses on understanding the moisture status of a region. It also reveals that how climate changed in a region over a period of time. The adopted procedure helped us to evaluate the ‘water need’, ‘water use’, ‘water surplus’ and ‘water deficit’ in the study area. This was done climatologically by analyzing monthly meteorological data over a certain time period for different meteorological stations. In the present
study, Uppar Odai sub-basin is identified to address the specific problem cited above. Though the available canal water supply in the basin is significant, major portion still depends on groundwater source. The relatively inadequate rainfall (625 mm) and extensive groundwater pumping lead to stress on water table condition. The hydroclimatic study was conducted with an objective to assess periodic drought condition and climatic shift in the sub-basin.
STUDY AREA
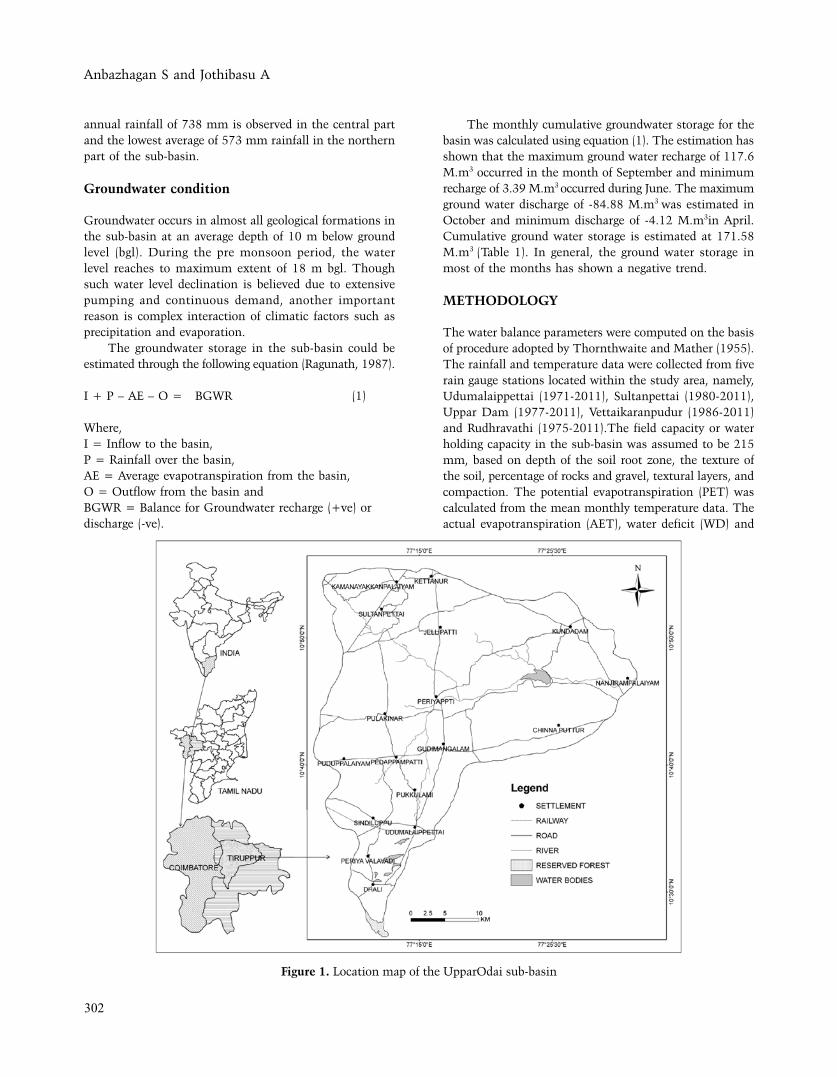
The study area Uppar Odai sub-basin is in part of Amaravati river basin and covered by 1280 sq.km area, located in between longitudes 77°06’36’’E to 77°32’24’’E and latitudes 10°26’40’’N to 10°55’48’’N. The sub-basin falls in Tiruppur and Coimbatore districts of Tamil Nadu, India (Fig.1). Uppar odai sub-basin is mostly covered by Precambrian gneissic terrain. The major rock types in the sub-basin are calc gneiss, charnockite, ultrabasic rocks, migmatite, granite, felsic porphyry and hornblende boitite gneiss (Narayanasamy, 1975). Subtropical climate prevails throughout the region. The maximum temperature ranges from 27°C to 35°C and minimum temperature vary from 17°Cto 23°C. There are four distinct seasons namely southwest monsoon, northeast monsoon, winter season and hot weather period prevailing in the study area. However, the precipitation is slightly higher in the central and western part of the sub-basin and less in the northern and eastern part of the sub-basin. The highest average
J. Ind. Geophys. Union ( July 2015 )v.19, no.3, pp:301-311
Anbazhagan S and Jothibasu A
302
annual rainfall of 738 mm is observed in the central part and the lowest average of 573 mm rainfall in the northern part of the sub-basin.
Groundwater condition
Groundwater occurs in almost all geological formations in the sub-basin at an average depth of 10 m below ground level (bgl). During the pre monsoon period, the water level reaches to maximum extent of 18 m bgl. Though such water level declination is believed due to extensive pumping and continuous demand, another important reason is complex interaction of climatic factors such as precipitation and evaporation.
The groundwater storage in the sub-basin could be estimated through the following equation (Ragunath, 1987).
I + P – AE – O = BGWR (1)
Where, I = Inflow to the basin, P = Rainfall over the basin, AE = Average evapotranspiration from the basin, O = Outflow from the basin and BGWR = Balance for Groundwater recharge (+ve) or discharge (-ve).
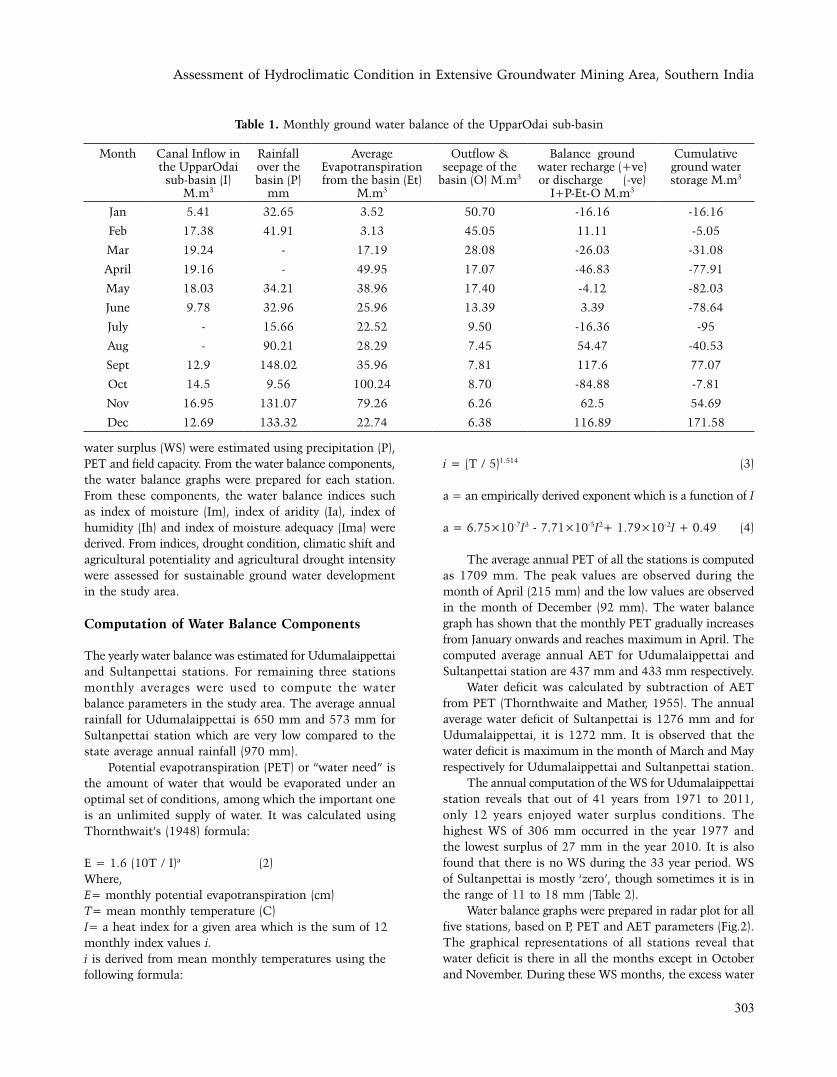
The monthly cumulative groundwater storage for the basin was calculated using equation (1). The estimation has shown that the maximum ground water recharge of 117.6 M.m3 occurred in the month of September and minimum recharge of 3.39 M.m3 occurred during June. The maximum ground water discharge of -84.88 M.m3 was estimated in October and minimum discharge of -4.12 M.m3in April. Cumulative ground water storage is estimated at 171.58 M.m3 (Table 1). In general, the ground water storage in most of the months has shown a negative trend.
METHODOLOGY
The water balance parameters were computed on the basis of procedure adopted by Thornthwaite and Mather (1955). The rainfall and temperature data were collected from five rain gauge stations located within the study area, namely, Udumalaippettai (1971-2011), Sultanpettai (1980-2011), Uppar Dam (1977-2011), Vettaikaranpudur (1986-2011) and Rudhravathi (1975-2011).The field capacity or water holding capacity in the sub-basin was assumed to be 215 mm, based on depth of the soil root zone, the texture of the soil, percentage of rocks and gravel, textural layers, and compaction. The potential evapotranspiration (PET) was calculated from the mean monthly temperature data. The actual evapotranspiration (AET), water deficit (WD) and
Figure 1. Location map of the UpparOdai sub-basin
Assessment of Hydroclimatic Condition in Extensive Groundwater Mining Area, Southern India
303
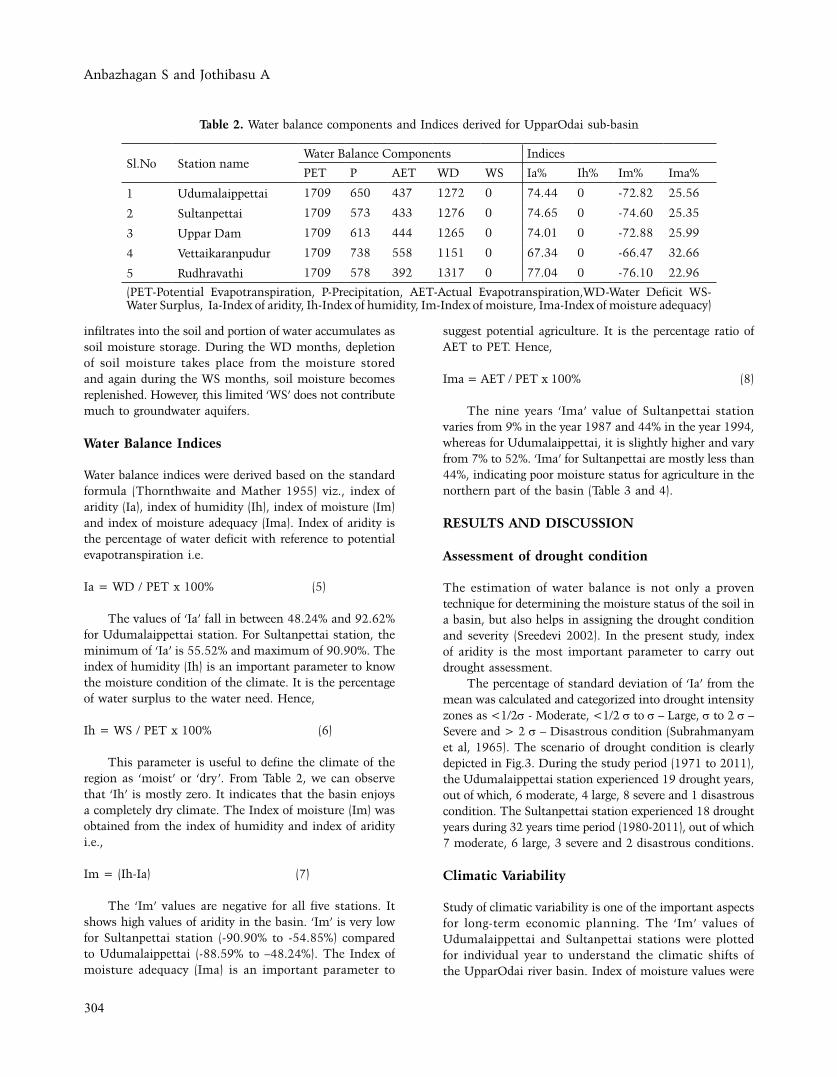
water surplus (WS) were estimated using precipitation (P), PET and field capacity. From the water balance components, the water balance graphs were prepared for each station. From these components, the water balance indices such as index of moisture (Im), index of aridity (Ia), index of humidity (Ih) and index of moisture adequacy (Ima) were derived. From indices, drought condition, climatic shift and agricultural potentiality and agricultural drought intensity were assessed for sustainable ground water development in the study area.
Computation of Water Balance Components
The yearly water balance was estimated for Udumalaippettai and Sultanpettai stations. For remaining three stations monthly averages were used to compute the water balance parameters in the study area. The average annual rainfall for Udumalaippettai is 650 mm and 573 mm for Sultanpettai station which are very low compared to the state average annual rainfall (970 mm).
Potential evapotranspiration (PET) or “water need” is the amount of water that would be evaporated under an optimal set of conditions, among which the important one is an unlimited supply of water. It was calculated using Thornthwait’s (1948) formula:
E = 1.6 (10T / I)a (2)Where,E= monthly potential evapotranspiration (cm)T= mean monthly temperature (C)I= a heat index for a given area which is the sum of 12 monthly index values i.i is derived from mean monthly temperatures using the following formula:
i = (T / 5)1.514 (3)
a = an empirically derived exponent which is a function of I
a = 6.75×10⁻⁷I3 - 7.71×10⁻⁵I2+ 1.79×10⁻²I + 0.49 (4)
The average annual PET of all the stations is computed as 1709 mm. The peak values are observed during the month of April (215 mm) and the low values are observed in the month of December (92 mm). The water balance graph has shown that the monthly PET gradually increases from January onwards and reaches maximum in April. The computed average annual AET for Udumalaippettai and Sultanpettai station are 437 mm and 433 mm respectively.
Water deficit was calculated by subtraction of AET from PET (Thornthwaite and Mather, 1955). The annual average water deficit of Sultanpettai is 1276 mm and for Udumalaippettai, it is 1272 mm. It is observed that the water deficit is maximum in the month of March and May respectively for Udumalaippettai and Sultanpettai station.
The annual computation of the WS for Udumalaippettai station reveals that out of 41 years from 1971 to 2011, only 12 years enjoyed water surplus conditions. The highest WS of 306 mm occurred in the year 1977 and the lowest surplus of 27 mm in the year 2010. It is also found that there is no WS during the 33 year period. WS of Sultanpettai is mostly ‘zero’, though sometimes it is in the range of 11 to 18 mm (Table 2).
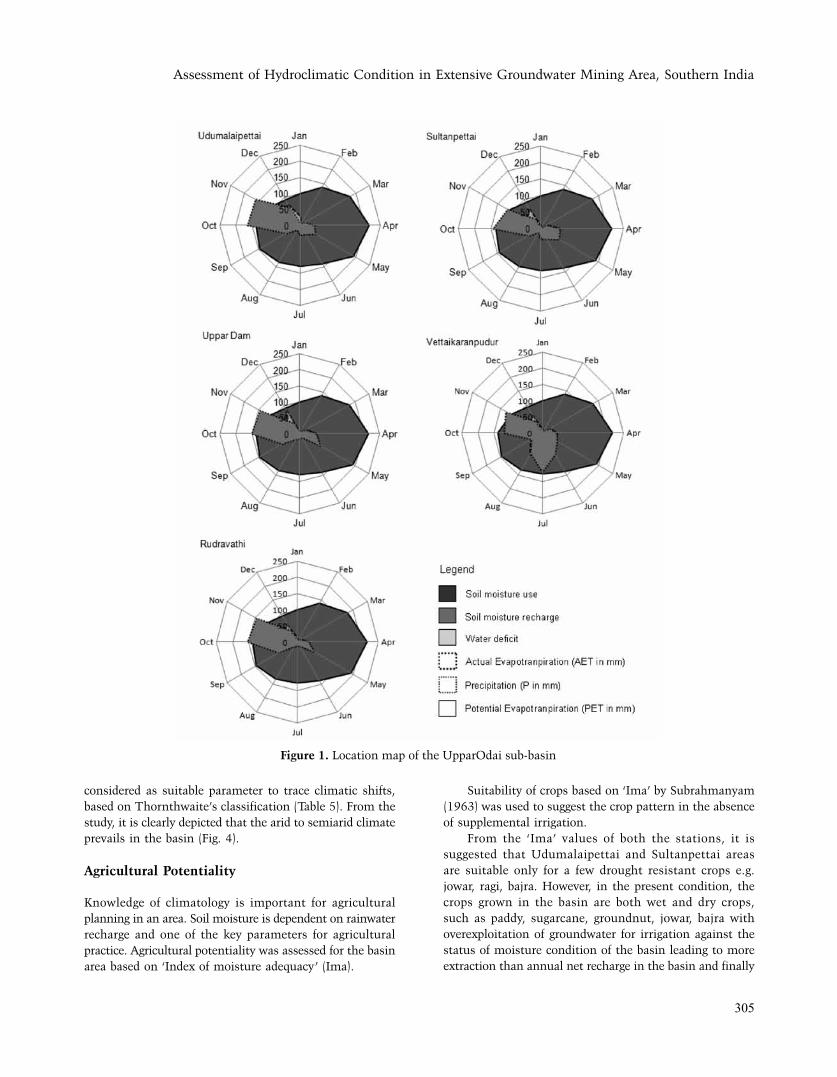
Water balance graphs were prepared in radar plot for all five stations, based on P, PET and AET parameters (Fig.2). The graphical representations of all stations reveal that water deficit is there in all the months except in October and November. During these WS months, the excess water
Table 1. Monthly ground water balance of the UpparOdai sub-basin
Month Canal Inflow in the UpparOdai
sub-basin (I) M.m3
Rainfall over the basin (P)
mm
Average Evapotranspiration from the basin (Et)
M.m3
Outflow & seepage of the
basin (O) M.m3
Balance ground water recharge (+ve) or discharge (-ve)
I+P-Et-O M.m3
Cumulative ground water storage M.m3
Jan 5.41 32.65 3.52 50.70 -16.16 -16.16
Feb 17.38 41.91 3.13 45.05 11.11 -5.05
Mar 19.24 - 17.19 28.08 -26.03 -31.08
April 19.16 - 49.95 17.07 -46.83 -77.91
May 18.03 34.21 38.96 17.40 -4.12 -82.03
June 9.78 32.96 25.96 13.39 3.39 -78.64
July - 15.66 22.52 9.50 -16.36 -95
Aug - 90.21 28.29 7.45 54.47 -40.53
Sept 12.9 148.02 35.96 7.81 117.6 77.07
Oct 14.5 9.56 100.24 8.70 -84.88 -7.81
Nov 16.95 131.07 79.26 6.26 62.5 54.69
Dec 12.69 133.32 22.74 6.38 116.89 171.58
Anbazhagan S and Jothibasu A
304
infiltrates into the soil and portion of water accumulates as soil moisture storage. During the WD months, depletion of soil moisture takes place from the moisture stored and again during the WS months, soil moisture becomes replenished. However, this limited ‘WS’ does not contribute much to groundwater aquifers.
Water Balance Indices
Water balance indices were derived based on the standard formula (Thornthwaite and Mather 1955) viz., index of aridity (Ia), index of humidity (Ih), index of moisture (Im) and index of moisture adequacy (Ima). Index of aridity is the percentage of water deficit with reference to potential evapotranspiration i.e.
Ia = WD / PET x 100% (5)
The values of ‘Ia’ fall in between 48.24% and 92.62% for Udumalaippettai station. For Sultanpettai station, the minimum of ‘Ia’ is 55.52% and maximum of 90.90%. The index of humidity (Ih) is an important parameter to know the moisture condition of the climate. It is the percentage of water surplus to the water need. Hence,
Ih = WS / PET x 100% (6)
This parameter is useful to define the climate of the region as ‘moist’ or ‘dry’. From Table 2, we can observe that ‘Ih’ is mostly zero. It indicates that the basin enjoys a completely dry climate. The Index of moisture (Im) was obtained from the index of humidity and index of aridity i.e.,
Im = (Ih-Ia) (7)
The ‘Im’ values are negative for all five stations. It shows high values of aridity in the basin. ‘Im’ is very low for Sultanpettai station (-90.90% to -54.85%) compared to Udumalaippettai (-88.59% to –48.24%). The Index of moisture adequacy (Ima) is an important parameter to
suggest potential agriculture. It is the percentage ratio of AET to PET. Hence,
Ima = AET / PET x 100% (8)
The nine years ‘Ima’ value of Sultanpettai station varies from 9% in the year 1987 and 44% in the year 1994, whereas for Udumalaippettai, it is slightly higher and vary from 7% to 52%. ‘Ima’ for Sultanpettai are mostly less than 44%, indicating poor moisture status for agriculture in the northern part of the basin (Table 3 and 4).
RESULTS AND DISCUSSION
Assessment of drought condition
The estimation of water balance is not only a proven technique for determining the moisture status of the soil in a basin, but also helps in assigning the drought condition and severity (Sreedevi 2002). In the present study, index of aridity is the most important parameter to carry out drought assessment.
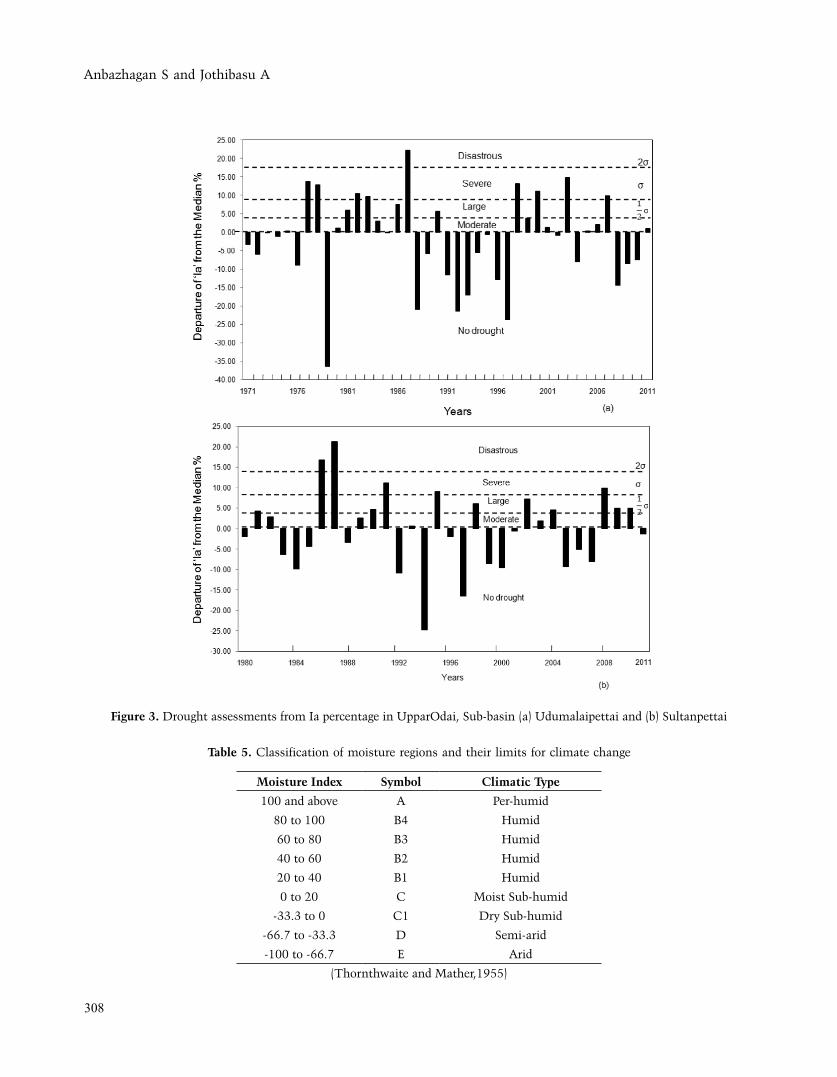
The percentage of standard deviation of ‘Ia’ from the mean was calculated and categorized into drought intensity zones as <1/2σ - Moderate, <1/2 σ to σ – Large, σ to 2 σ – Severe and > 2 σ – Disastrous condition (Subrahmanyam et al, 1965). The scenario of drought condition is clearly depicted in Fig.3. During the study period (1971 to 2011), the Udumalaippettai station experienced 19 drought years, out of which, 6 moderate, 4 large, 8 severe and 1 disastrous condition. The Sultanpettai station experienced 18 drought years during 32 years time period (1980-2011), out of which 7 moderate, 6 large, 3 severe and 2 disastrous conditions.
Climatic Variability
Study of climatic variability is one of the important aspects for long-term economic planning. The ‘Im’ values of Udumalaippettai and Sultanpettai stations were plotted for individual year to understand the climatic shifts of the UpparOdai river basin. Index of moisture values were
Table 2. Water balance components and Indices derived for UpparOdai sub-basin
Sl.No Station nameWater Balance Components Indices
PET P AET WD WS Ia% Ih% Im% Ima%
1 Udumalaippettai 1709 650 437 1272 0 74.44 0 -72.82 25.56
2 Sultanpettai 1709 573 433 1276 0 74.65 0 -74.60 25.35
3 Uppar Dam 1709 613 444 1265 0 74.01 0 -72.88 25.99
4 Vettaikaranpudur 1709 738 558 1151 0 67.34 0 -66.47 32.66
5 Rudhravathi 1709 578 392 1317 0 77.04 0 -76.10 22.96
(PET-Potential Evapotranspiration, P-Precipitation, AET-Actual Evapotranspiration,WD-Water Deficit WS-Water Surplus, Ia-Index of aridity, Ih-Index of humidity, Im-Index of moisture, Ima-Index of moisture adequacy)
Assessment of Hydroclimatic Condition in Extensive Groundwater Mining Area, Southern India
305
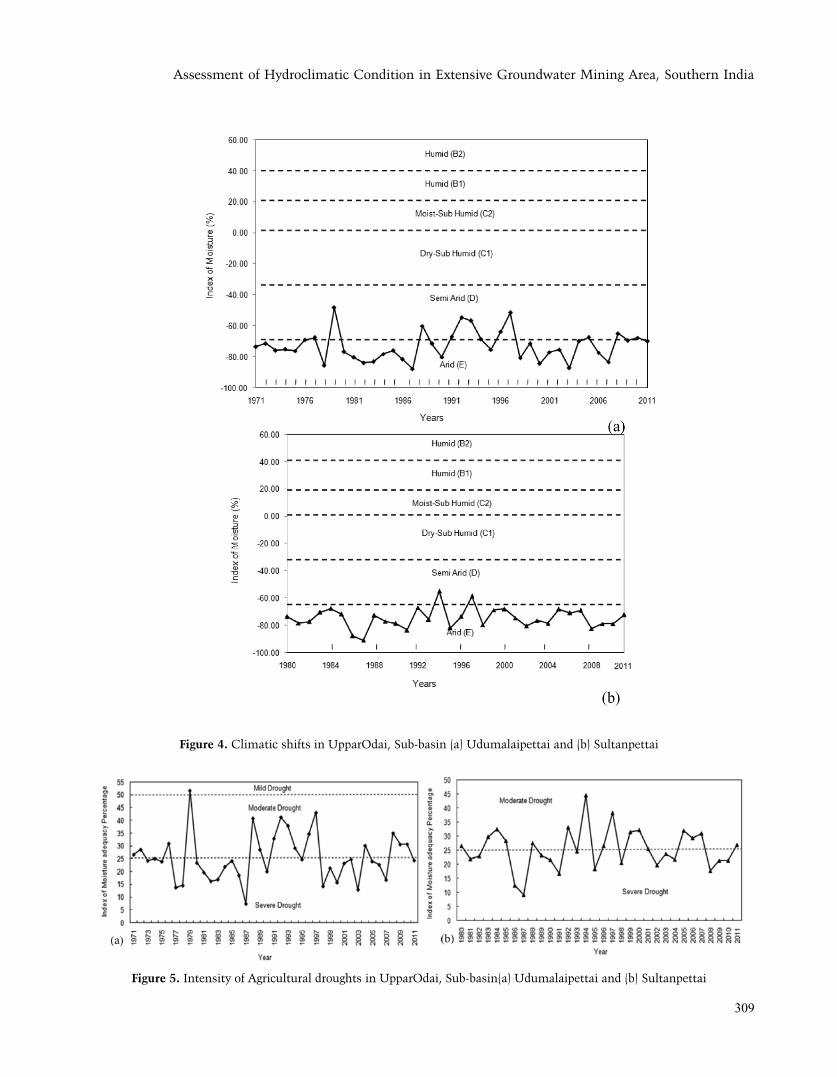
considered as suitable parameter to trace climatic shifts, based on Thornthwaite’s classification (Table 5). From the study, it is clearly depicted that the arid to semiarid climate prevails in the basin (Fig. 4).
Agricultural Potentiality
Knowledge of climatology is important for agricultural planning in an area. Soil moisture is dependent on rainwater recharge and one of the key parameters for agricultural practice. Agricultural potentiality was assessed for the basin area based on ‘Index of moisture adequacy’ (Ima).
Suitability of crops based on ‘Ima’ by Subrahmanyam (1963) was used to suggest the crop pattern in the absence of supplemental irrigation.
From the ‘Ima’ values of both the stations, it is suggested that Udumalaipettai and Sultanpettai areas are suitable only for a few drought resistant crops e.g. jowar, ragi, bajra. However, in the present condition, the crops grown in the basin are both wet and dry crops, such as paddy, sugarcane, groundnut, jowar, bajra with overexploitation of groundwater for irrigation against the status of moisture condition of the basin leading to more extraction than annual net recharge in the basin and finally
Figure 1. Location map of the UpparOdai sub-basin
Anbazhagan S and Jothibasu A
306
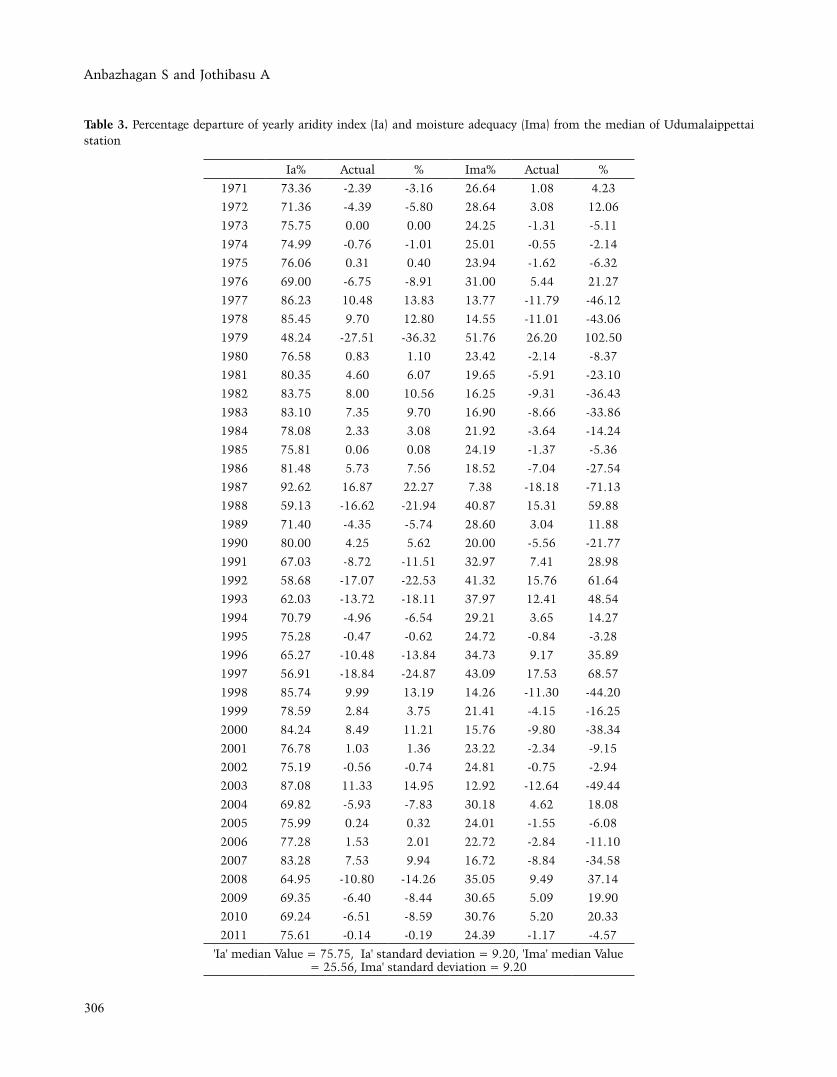
Table 3. Percentage departure of yearly aridity index (Ia) and moisture adequacy (Ima) from the median of Udumalaippettai station
Ia% Actual % Ima% Actual %
1971 73.36 -2.39 -3.16 26.64 1.08 4.23
1972 71.36 -4.39 -5.80 28.64 3.08 12.06
1973 75.75 0.00 0.00 24.25 -1.31 -5.11
1974 74.99 -0.76 -1.01 25.01 -0.55 -2.14
1975 76.06 0.31 0.40 23.94 -1.62 -6.32
1976 69.00 -6.75 -8.91 31.00 5.44 21.27
1977 86.23 10.48 13.83 13.77 -11.79 -46.12
1978 85.45 9.70 12.80 14.55 -11.01 -43.06
1979 48.24 -27.51 -36.32 51.76 26.20 102.50
1980 76.58 0.83 1.10 23.42 -2.14 -8.37
1981 80.35 4.60 6.07 19.65 -5.91 -23.10
1982 83.75 8.00 10.56 16.25 -9.31 -36.43
1983 83.10 7.35 9.70 16.90 -8.66 -33.86
1984 78.08 2.33 3.08 21.92 -3.64 -14.24
1985 75.81 0.06 0.08 24.19 -1.37 -5.36
1986 81.48 5.73 7.56 18.52 -7.04 -27.54
1987 92.62 16.87 22.27 7.38 -18.18 -71.13
1988 59.13 -16.62 -21.94 40.87 15.31 59.88
1989 71.40 -4.35 -5.74 28.60 3.04 11.88
1990 80.00 4.25 5.62 20.00 -5.56 -21.77
1991 67.03 -8.72 -11.51 32.97 7.41 28.98
1992 58.68 -17.07 -22.53 41.32 15.76 61.64
1993 62.03 -13.72 -18.11 37.97 12.41 48.54
1994 70.79 -4.96 -6.54 29.21 3.65 14.27
1995 75.28 -0.47 -0.62 24.72 -0.84 -3.28
1996 65.27 -10.48 -13.84 34.73 9.17 35.89
1997 56.91 -18.84 -24.87 43.09 17.53 68.57
1998 85.74 9.99 13.19 14.26 -11.30 -44.20
1999 78.59 2.84 3.75 21.41 -4.15 -16.25
2000 84.24 8.49 11.21 15.76 -9.80 -38.34
2001 76.78 1.03 1.36 23.22 -2.34 -9.15
2002 75.19 -0.56 -0.74 24.81 -0.75 -2.94
2003 87.08 11.33 14.95 12.92 -12.64 -49.44
2004 69.82 -5.93 -7.83 30.18 4.62 18.08
2005 75.99 0.24 0.32 24.01 -1.55 -6.08
2006 77.28 1.53 2.01 22.72 -2.84 -11.10
2007 83.28 7.53 9.94 16.72 -8.84 -34.58
2008 64.95 -10.80 -14.26 35.05 9.49 37.14
2009 69.35 -6.40 -8.44 30.65 5.09 19.90
2010 69.24 -6.51 -8.59 30.76 5.20 20.33
2011 75.61 -0.14 -0.19 24.39 -1.17 -4.57
'Ia' median Value = 75.75, Ia' standard deviation = 9.20, 'Ima' median Value = 25.56, Ima' standard deviation = 9.20
Assessment of Hydroclimatic Condition in Extensive Groundwater Mining Area, Southern India
307
to drastic decline of groundwater table. In Uppar Odai sub-basin, supplementary water is available through canal water irrigation system. However, it is not sufficient.
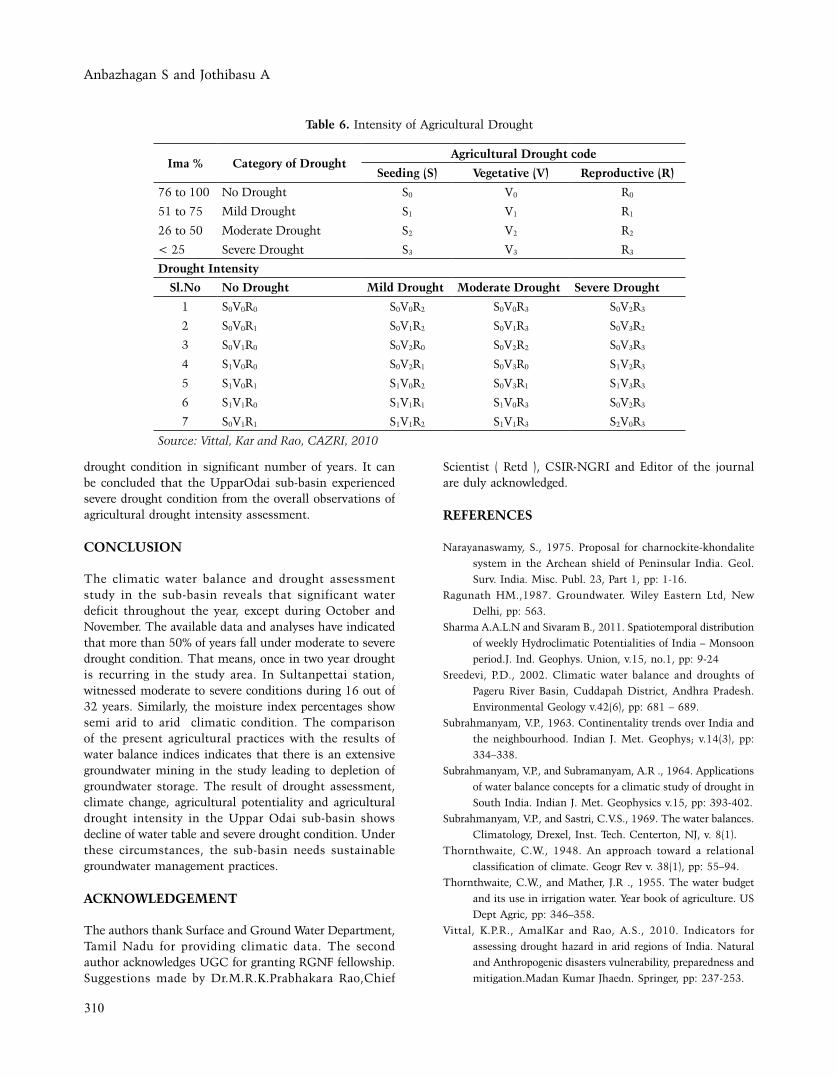
Agricultural Drought Intensity
Many meteorologists and agricultural scientists suggested that the Index of moisture adequacy (Ima) is one of the standard monitoring tools, which could be applied in combination for drought declaration. ‘Ima’ values are critical to ascertain agricultural drought (Vittal et al., 2010). The drought impact is related to moisture availability
at certain crop growth stages. The categories of ‘Ima’ at different growth stages are integrated into a single index value to identify drought impact on a particular crop. The Central Arid Zone Research Institute (CAZRI), Jodhpur monitors agricultural drought in the Indian regions by using ‘Ima’ (Table 6). Graphs showing the ‘Ima’ percentage of Udumalaipettai and Sultanpettai stations (Fig.5) help us to assess agricultural drought intensity using Table 6. In most of the years, severe drought conditions prevailed in Udumalaipettai station (few years shown as moderate drought and only one year as mild drought condition). The Sultanpettai station was also affected by severe
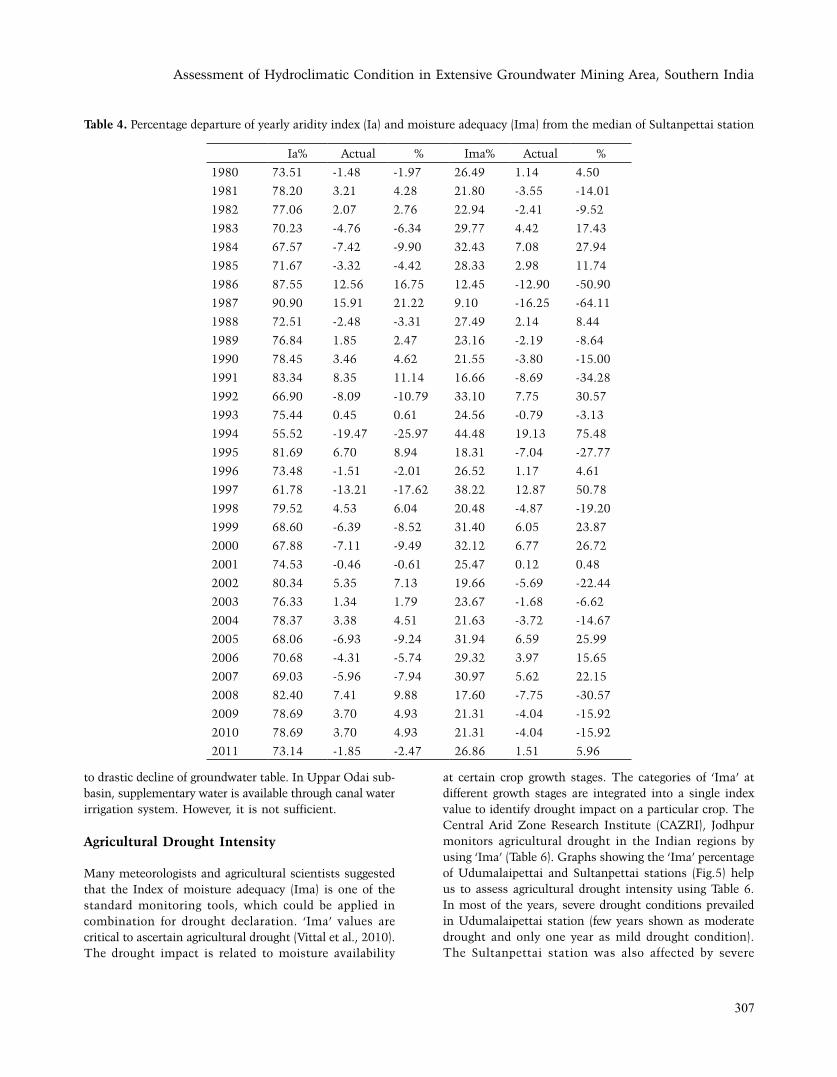
Table 4. Percentage departure of yearly aridity index (Ia) and moisture adequacy (Ima) from the median of Sultanpettai station
Ia% Actual % Ima% Actual %
1980 73.51 -1.48 -1.97 26.49 1.14 4.50
1981 78.20 3.21 4.28 21.80 -3.55 -14.01
1982 77.06 2.07 2.76 22.94 -2.41 -9.52
1983 70.23 -4.76 -6.34 29.77 4.42 17.43
1984 67.57 -7.42 -9.90 32.43 7.08 27.94
1985 71.67 -3.32 -4.42 28.33 2.98 11.74
1986 87.55 12.56 16.75 12.45 -12.90 -50.90
1987 90.90 15.91 21.22 9.10 -16.25 -64.11
1988 72.51 -2.48 -3.31 27.49 2.14 8.44
1989 76.84 1.85 2.47 23.16 -2.19 -8.64
1990 78.45 3.46 4.62 21.55 -3.80 -15.00
1991 83.34 8.35 11.14 16.66 -8.69 -34.28
1992 66.90 -8.09 -10.79 33.10 7.75 30.57
1993 75.44 0.45 0.61 24.56 -0.79 -3.13
1994 55.52 -19.47 -25.97 44.48 19.13 75.48
1995 81.69 6.70 8.94 18.31 -7.04 -27.77
1996 73.48 -1.51 -2.01 26.52 1.17 4.61
1997 61.78 -13.21 -17.62 38.22 12.87 50.78
1998 79.52 4.53 6.04 20.48 -4.87 -19.20
1999 68.60 -6.39 -8.52 31.40 6.05 23.87
2000 67.88 -7.11 -9.49 32.12 6.77 26.72
2001 74.53 -0.46 -0.61 25.47 0.12 0.48
2002 80.34 5.35 7.13 19.66 -5.69 -22.44
2003 76.33 1.34 1.79 23.67 -1.68 -6.62
2004 78.37 3.38 4.51 21.63 -3.72 -14.67
2005 68.06 -6.93 -9.24 31.94 6.59 25.99
2006 70.68 -4.31 -5.74 29.32 3.97 15.65
2007 69.03 -5.96 -7.94 30.97 5.62 22.15
2008 82.40 7.41 9.88 17.60 -7.75 -30.57
2009 78.69 3.70 4.93 21.31 -4.04 -15.92
2010 78.69 3.70 4.93 21.31 -4.04 -15.92
2011 73.14 -1.85 -2.47 26.86 1.51 5.96
Anbazhagan S and Jothibasu A
308
Figure 3. Drought assessments from Ia percentage in UpparOdai, Sub-basin (a) Udumalaipettai and (b) Sultanpettai
Table 5. Classification of moisture regions and their limits for climate change
Moisture Index Symbol Climatic Type
100 and above A Per-humid
80 to 100 B4 Humid
60 to 80 B3 Humid
40 to 60 B2 Humid
20 to 40 B1 Humid
0 to 20 C Moist Sub-humid
-33.3 to 0 C1 Dry Sub-humid
-66.7 to -33.3 D Semi-arid
-100 to -66.7 E Arid
(Thornthwaite and Mather,1955)
Assessment of Hydroclimatic Condition in Extensive Groundwater Mining Area, Southern India
309
Figure 4. Climatic shifts in UpparOdai, Sub-basin (a) Udumalaipettai and (b) Sultanpettai
Figure 5. Intensity of Agricultural droughts in UpparOdai, Sub-basin(a) Udumalaipettai and (b) Sultanpettai
Anbazhagan S and Jothibasu A
310
drought condition in significant number of years. It can be concluded that the UpparOdai sub-basin experienced severe drought condition from the overall observations of agricultural drought intensity assessment.
CONCLUSION
The climatic water balance and drought assessment study in the sub-basin reveals that significant water deficit throughout the year, except during October and November. The available data and analyses have indicated that more than 50% of years fall under moderate to severe drought condition. That means, once in two year drought is recurring in the study area. In Sultanpettai station, witnessed moderate to severe conditions during 16 out of 32 years. Similarly, the moisture index percentages show semi arid to arid climatic condition. The comparison of the present agricultural practices with the results of water balance indices indicates that there is an extensive groundwater mining in the study leading to depletion of groundwater storage. The result of drought assessment, climate change, agricultural potentiality and agricultural drought intensity in the Uppar Odai sub-basin shows decline of water table and severe drought condition. Under these circumstances, the sub-basin needs sustainable groundwater management practices.
ACKNOWLEDGEMENT
The authors thank Surface and Ground Water Department, Tamil Nadu for providing climatic data. The second author acknowledges UGC for granting RGNF fellowship. Suggestions made by Dr.M.R.K.Prabhakara Rao,Chief
Scientist ( Retd ), CSIR-NGRI and Editor of the journal are duly acknowledged.
REFERENCES
Narayanaswamy, S., 1975. Proposal for charnockite-khondalite
system in the Archean shield of Peninsular India. Geol.
Surv. India. Misc. Publ. 23, Part 1, pp: 1-16.
Ragunath HM.,1987. Groundwater. Wiley Eastern Ltd, New
Delhi, pp: 563.
Sharma A.A.L.N and Sivaram B., 2011. Spatiotemporal distribution
of weekly Hydroclimatic Potentialities of India – Monsoon
period.J. Ind. Geophys. Union, v.15, no.1, pp: 9-24
Sreedevi, P.D., 2002. Climatic water balance and droughts of
Pageru River Basin, Cuddapah District, Andhra Pradesh.
Environmental Geology v.42(6), pp: 681 – 689.
Subrahmanyam, V.P., 1963. Continentality trends over India and
the neighbourhood. Indian J. Met. Geophys; v.14(3), pp:
334–338.
Subrahmanyam, V.P., and Subramanyam, A.R ., 1964. Applications
of water balance concepts for a climatic study of drought in
South India. Indian J. Met. Geophysics v.15, pp: 393-402.
Subrahmanyam, V.P., and Sastri, C.V.S., 1969. The water balances.
Climatology, Drexel, Inst. Tech. Centerton, NJ, v. 8(1).
Thornthwaite, C.W., 1948. An approach toward a relational
classification of climate. Geogr Rev v. 38(1), pp: 55–94.
Thornthwaite, C.W., and Mather, J.R ., 1955. The water budget
and its use in irrigation water. Year book of agriculture. US
Dept Agric, pp: 346–358.
Vittal, K.P.R., AmalKar and Rao, A.S., 2010. Indicators for
assessing drought hazard in arid regions of India. Natural
and Anthropogenic disasters vulnerability, preparedness and
mitigation.Madan Kumar Jhaedn. Springer, pp: 237-253.
Table 6. Intensity of Agricultural Drought
Ima % Category of DroughtAgricultural Drought code
Seeding (S) Vegetative (V) Reproductive (R)
76 to 100 No Drought S0 V0 R0
51 to 75 Mild Drought S1 V1 R1
26 to 50 Moderate Drought S2 V2 R2
< 25 Severe Drought S3 V3 R3
Drought Intensity
Sl.No No Drought Mild Drought Moderate Drought Severe Drought
1 S0V0R0 S0V0R2 S0V0R3 S0V2R3
2 S0V0R1 S0V1R2 S0V1R3 S0V3R2
3 S0V1R0 S0V2R0 S0V2R2 S0V3R3
4 S1V0R0 S0V2R1 S0V3R0 S1V2R3
5 S1V0R1 S1V0R2 S0V3R1 S1V3R3
6 S1V1R0 S1V1R1 S1V0R3 S0V2R3
7 S0V1R1 S1V1R2 S1V1R3 S2V0R3
Source: Vittal, Kar and Rao, CAZRI, 2010
Assessment of Hydroclimatic Condition in Extensive Groundwater Mining Area, Southern India
311
Dr. S. Anbazhagan is Professor & Head, Department of Geology and also Director, Centre for Geoinformatics and Planetary Studies at Periyar University. He is a recipient of Alexander Von Humbolt Fellowship for his Post Doctoral Research in Germany. He specialized in Geoinformatics applications, Groundwater, Disaster mapping and applied geomorphology.
Dr. A. Jothibasu, UGC Post Doctoral Fellow in the Centre for Geoinformatics and Planetary Studies, Department of Geology, Periyar University. He awarded RGNF fellowship for his research programme on sustainable groundwater development. His current research interests are remote sensing & GIS applications in hydrogeology, sustainable development, water balance model and climate change.