Assessment of habitat for the potential reintroduction of ...
13
Assessment of habitat for the potential reintroduction of tule elk to the San Joaquin Valley, California PATRICK R. HUBER, STEVEN E. GRECO, AND JOE HOBBS Department of Environmental Design, University of California Davis, One Shields Avenue, Davis, CA 95616, USA (PRH, SEG) Wildlife Branch, California Department of Fish and Game, 1812 Ninth Street, Sacramento, CA 95814, USA (JH) * Correspondent: [email protected] Reintroductions of wildlife populations to their former range in California are often undertaken without systematic, spatially-explicit habitat analyses as part of feasibility studies. This has been true for the tule elk (Cervus elaphus nannodes), a California endemic subspecies brought to the brink of extinction a century ago. We evaluated the Grasslands Ecological Area of Merced County as potential habitat for a future free-ranging herd. The study area was modeled using three variables: cover/forage, habitat diversity, and human impacts. Within 11,650 ha of likely usable habitat, we found two large areas of very high quality habitat (totaling 4,638 ha). These areas contained forage and cover in close proximity, low levels of human disturbance, and a variety of habitats for use by elk. Carrying capacity of these areas was estimated at 180-320 individuals. We suggest that this type of systematic evaluation should be a component of future reintroduction efforts for tule elk and other native species of California wildlife. Key words: California, Central Valley, Cervus elaphus, elk, Grasslands Ecological Area, habitat assessment, reintroduction, tule elk ________________________________________________________________________ An increasingly important strategy for wildlife conservation is reintroduction of a species to portions of historical range from which it has been extirpated (Seddon and Soorae 1999, Fischer and Lindenmayer 2000, Noss 2001, Morrison 2002). These efforts have met with varying success. Several studies of this strategy have called for careful planning and increased scientific rigor in conception and execution of reintroduction programs (Fischer and Lindenmayer 2000, Morrison 2009). An important facet of successful reintroductions includes the evaluation of the potential habitat within a project area and its relation to the number of individuals that area can actually support (i.e., carrying capacity). Some reintroduction California Fish and Game 97(3):117-129; 2011
Transcript of Assessment of habitat for the potential reintroduction of ...

117Summer 2011
Assessment of habitat for the potential reintroduction of tule elk to the San Joaquin Valley, California
Patrick r. huber, steven e. Greco, and Joe hobbs
Department of Environmental Design, University of California Davis, One Shields Avenue, Davis, CA 95616, USA (PRH, SEG)
Wildlife Branch, California Department of Fish and Game, 1812 Ninth Street, Sacramento, CA 95814, USA (JH)
* Correspondent: [email protected]
Reintroductions of wildlife populations to their former range in California are often undertaken without systematic, spatially-explicit habitat analyses as part of feasibility studies. This has been true for the tule elk (Cervus elaphus nannodes), a California endemic subspecies brought to the brink of extinction a century ago. We evaluated the Grasslands Ecological Area of Merced County as potential habitat for a future free-ranging herd. The study area was modeled using three variables: cover/forage, habitat diversity, and human impacts. Within 11,650 ha of likely usable habitat, we found two large areas of very high quality habitat (totaling 4,638 ha). These areas contained forage and cover in close proximity, low levels of human disturbance, and a variety of habitats for use by elk. Carrying capacity of these areas was estimated at 180-320 individuals. We suggest that this type of systematic evaluation should be a component of future reintroduction efforts for tule elk and other native species of California wildlife.
Key words: California, Central Valley, Cervus elaphus, elk, Grasslands Ecological Area, habitat assessment, reintroduction, tule elk
________________________________________________________________________
An increasingly important strategy for wildlife conservation is reintroduction of a species to portions of historical range from which it has been extirpated (Seddon and Soorae 1999, Fischer and Lindenmayer 2000, Noss 2001, Morrison 2002). These efforts have met with varying success. Several studies of this strategy have called for careful planning and increased scientific rigor in conception and execution of reintroduction programs (Fischer and Lindenmayer 2000, Morrison 2009). An important facet of successful reintroductions includes the evaluation of the potential habitat within a project area and its relation to the number of individuals that area can actually support (i.e., carrying capacity). Some reintroduction
California Fish and Game 97(3):117-129; 2011

CALIFORNIA FISH AND GAME Vol. 97, No. 3118
efforts undertaken over the past decade have included scientific approaches to these topics (e.g., McClafferty and Parkhurst 2001, McShea et al. 2005, Telesco et al. 2007, Daugherty et al. 2008, Olsson and Rogers 2009), but completion of such analyses is not ubiquitous. Within California, few reintroduction efforts have relied on spatially-explicit, systematic, landscape-scale habitat evaluations to identify blocks of potential habitat that could support a population of reintroduced animals.
One endemic California mammal that has been the subject of reintroduction efforts over the past century is the tule elk (Cervus elaphus nannodes; McCullough et al. 1996). Historically widespread across the Central Valley and Central Coast ecoregions of California, the population numbering in the hundreds of thousands was drastically reduced—to a total population of less than ten individuals and perhaps as small as two—in the 50 years after the rapid human population expansion that began with the Gold Rush in the mid-nineteenth century (McCullough 1969, McCullough et al. 1996, Williams et al. 2004, Greco et al. 2009). Since the population demise in the late nineteenth century, a number of translocations have been undertaken to either reintroduce tule elk to their historical range, or to establish new populations outside that range. While recent efforts have generally been more successful than early attempts (McCullough 1969), they have still relied on knowledge of agency personnel and ad hoc opportunities rather than systematic analyses as part of the planning process.
Here, we present the first systematic evaluation of potential habitat for reintroduction of this subspecies of elk in central California. We adapted a model developed for the analysis of potential elk habitat in upstate New York (Didier and Porter 1999) to reflect the characteristics of both the subspecies and the study area in the Central Valley. The geospatial model combined cover and forage factors, habitat diversity, and human impacts to classify the study region into categories of tule elk habitat quality. Using these variables and demographic data from another population of tule elk (O’Connor 1988), we assessed the carrying capacity of the study area in order to evaluate the feasibility of reintroducing these native ungulates to the planning region.
study area
The Grasslands Ecological Area (GEA) is located in central Merced County in the Central Valley ecoregion of California, USA (Figure 1). The Central Valley is part of California’s Mediterranean climate regime, with annual rainfall of approximately 29.3 cm, most of which occurs in the winter months. Summers are hot and dry, winters cool and wet. The GEA and the associated Grasslands Wildlife Management Area (GWMA) contain some of the largest contiguous blocks of wetlands and grasslands remaining in the Central Valley. The GEA encompasses approximately 91,000 ha (~225,000 acres), of which about 52,000 ha (or roughly 57%) can be considered natural land cover (as defined by the California Wildlife Habitat Relationship [CWHR] System land cover classification system [Mayer and Laudenslayer 1988]). The GEA land cover types (Appendix) can be broadly classified as annual grassland (AGS; primarily found in the northern and eastern section of the GEA), freshwater emergent wetland (FEW; concentrated in the western and southern portion of the GEA), and valley and foothill riparian forest (VRI; found mostly in the San Joaquin River corridor in the northern section of the GEA). Most of the remaining land cover consists of agricultural land (including orchards, hay, rice, and vineyards), while less than 1% of the total GEA extent is urban. A subset of the natural annual grassland area is also used for cattle and sheep grazing; thus, more than half of the GEA is currently used for some agricultural purpose.

119Summer 2011
While the GEA and GWMA are areas designated by the U.S. Congress for potential protection of natural resources, the ownership pattern is a mosaic subject to varying management regimes. Federal and state government agencies concerned with natural resource management together own slightly more than 20,000 ha in fee title (22.7% of the GEA). Additionally, they hold conservation easements on roughly 31,000 ha (34.4% of the GEA). Thus roughly 57% of the GEA is currently under at least some management or protection by federal and state agencies. Much of the area under conservation easement is comprised of waterfowl hunting clubs. These private lands consist largely of seasonal wetlands and are managed to facilitate the conservation of migratory waterfowl and their winter habitat. Thus, while there is considerable natural vegetation on these parcels (mostly wetlands), there is also a high level of seasonal human disturbance. Duck clubs comprise roughly 15,800 ha (17.3%) of the GEA. Several other important anthropogenic features in the GEA are highways and canals: four highways cross portions of the GEA. Highway 165 traverses the GEA for more than 30 km, while the others intersect the GEA for a combined length of slightly more than 15 km. Two large, concrete-lined canals also are present in the GEA and are potentially hazardous to elk and other ungulates (Latham and Verzuh 1971). Experience in other locations has shown that elk that enter these types of canals generally are incapable of escaping or exiting due to the steep slopes of the canal walls, resulting in drowning.
Figure 1.—The study area at Grasslands Ecological Area, Merced County, California. The location of the existing enclosure containing 40-50 tule elk is shown.
TULE ELK HABITAT ASSESSMENT

CALIFORNIA FISH AND GAME Vol. 97, No. 3120
There is currently a small herd of elk (40-50 individuals) in an enclosure (~320 ha) at San Luis National Wildlife Refuge in the GEA (Figure 1). These are the animals that would be used for future introductions.
Methods
We considered three major components comprising a habitat suitability analysis for tule elk: cover and forage presence, habitat diversity, and human impacts (Didier and Porter 1999). Elk require habitat containing large amounts of cover and forage. Further, cover is most suitable that is in proximity to forage, and forage in proximity to cover (Lyon 1984, Van Deelen et al. 1999); elk also prefer those areas comprised of a mosaic of different suitable habitat types in order to enable exploitation of many resources. We considered those areas most suitable for occupancy by elk to be those that experienced the least amount of disturbance by humans. These disturbances include roads and the associated road effects zone (Forman 2000) as well as competing and potentially conflicting land uses, which in the study area include field crops, grazing, and duck hunting clubs. We combined these variables into a geospatial model for the GEA, the output of which would identify areas of high potential habitat suitability for tule elk. All spatial analyses were conducted using raster and vector formats in a geographic information system (ArcGIS 9.3 software; ESRI 2009). The land cover dataset used for these analyses was an amalgam of three existing datasets: the California Department of Water Resources (CDWR) land use dataset for Merced County (CDWR 2002a), the National Wetland Inventory dataset (USFWS 2010), and CDWR’s San Joaquin River riparian vegetation dataset (CDWR 2002b). These were then converted to a raster grid (30-m cell size) for the subsequent analyses.
Cover and forage.—One key component of habitat for elk is the relationship between cover and forage. Those areas that have a high concentration of cover near forage and a high concentration of forage near cover are most suited to elk use.
Modified values were calculated for both cover (FEW, VRI) and forage (AGS, FEW). Mean cover and forage scores across all vegetation types were calculated within a moving window with a 2.711 km radius for each cell in a raster dataset (30-m cell size). This radius was used in all density calculations and was based on the average home range size of tule elk in the Cache Creek herd (O’Connor 1988), a free-ranging population in the Coast Range bordering the Sacramento Valley. Cover and forage habitat ratings were derived from modified CWHR scores for elk. The CWHR system is a database that provides a habitat value for three life requisites for all of California’s terrestrial vertebrate species for each major habitat type. These habitat values are rated separately for each life requisite (forage, reproduction, and cover), as well as an overall score (an average value of the three life requisite values). The current CWHR system (version 8) contains composite habitat values for all three subspecies of elk in California (i.e., as a species only; CDFG 2002); therefore, California Department of Fish and Game (CDFG) biologists used professional judgement to modify them to better represent the needs of solely the tule elk subspecies for this study (see Appendix 1).
The two density calculations (with values ranging from 0 to 1 representing mean cover and forage scores within the search radius) were then multiplied by a modifier based on the distance to the closest occurrence of the other habitat components (e.g., cover density modified by distance to forage) in order to arrive at a modified cover value and modified forage value (in a range of values from 0.0-1.0). Forage scores were multiplied by 1.0 when

121Summer 2011
the distance to cover was 0-150 m, by 0.6 when distance to cover was 150-300 m, by 0.1 when the distance was 300-450 m, and by 0.0 when the distance was greater than 450 m. Cover scores were multiplied by 1.0 when forage was within 8 km. At distances greater than 8 km, the forage modifier was defined as y = -.09x + 1.73, where y is the modifier, and x is the distance to forage (Didier and Porter 1999).
The overall cover-forage value was determined for each 30-m raster cell by taking the lower (the minimum) of the two scores. This approach yielded a conservative estimate of cover-forage value for the entire study area. Note that freshwater wetland is considered to serve as both cover and forage for elk; thus, all wetlands received high cover-forage scores.
Habitat diversity.—Another component of habitat suitability for elk is habitat diversity (sensu Didier and Porter 1999). Elk are a generalist species, so access to a variety of habitat types is considered to be a beneficial landscape characteristic (Van Deelen et al. 1999). The three major vegetation types in the GEA are AGS, FEW, and VRI; we assumed ideal habitat for tule elk would include all of these.
Calculation of habitat diversity is a three-step process. First, an ideal ratio of the three land cover types was calculated by respectively dividing each of the average CWHR habitat type values (as defined for elk) by the sum of the habitat values for all three types. This calculation indicated that an ideal tule elk home range in the GEA would consist of 33% AGS, 36% FEW, and 31% VRI. The second step derived a density score for each respective habitat type. Densities for each of the land cover types were calculated using the 2.711 km radius. These densities were converted to values ranging from 0 (0% of the area contains any of the land cover types) to 1 (equal to or higher than the respective ideal proportion for each of the CWHR habitat types identified above). The third step was to calculate the habitat diversity value by taking the arithmetic mean of the density values for each of the three land cover types. We used the arithmetic mean in this analysis because, while having many habitat types would be ideal for elk, they would not be precluded from using an area of potential habitat due to the absence of one or more of these vegetation types.
Human impacts.—While previous elk reintroduction feasibility studies have focused on road density as the major component of human impacts (Van Deelen et al. 1997, Didier and Porter 1999), we elected to include information on management regime and land use as well to gain a more complete understanding of how potential tule elk habitat could be affected by human activities. Disturbances (such as gunfire, dogs, or vehicles) at the hunting clubs could be detrimental to elk that might utilize wetland habitat in which the duck clubs were located (for at least a portion of the year). Managers at Grizzly Island (the location of another elk herd) anecdotally reported that daily movement patterns of elk are affected by hunting activities (P. Graham, CDFG, personal communication 2009). Similarly, there are concerns that the presence of grazing livestock can negatively impact tule elk. Thus, data on parcel ownership, grazing patterns, and duck clubs were combined with road density calculations to derive an overall human impact score.
Road density was calculated as a function of the average tule elk home range size using a radius of 2.711 km as determined by O’Connor (1988). Roads were weighted for their respective impact on tule elk based on type of road and expected traffic volume. The weightings were 10, 5, 3, 1, and 0 for highways, heavily used public roads, other public roads, refuge roads open to the public, and private roads, respectively, and these weights were included in the road density calculation. Elk habitat suitability values were then assigned to road-density scores (km of road/km²) for each raster cell based on relationships determined in previous studies (Van Deelen et al. 1997, Didier and Porter 1999). These values ranged from
TULE ELK HABITAT ASSESSMENT

CALIFORNIA FISH AND GAME Vol. 97, No. 3122
0 (densities higher than 4.5 km/km²) for high impact to 1 (0.0 km/km²) for low or no impact. High human impact values resulted in low elk habitat suitability scores and vice-versa.
The first component of the land use score (parcel ownership) was divided into four types and each given an elk habitat suitability value: public land, 1.0; private land with conservation easement and no grazing, 0.66; private land with conservation easement but with grazing, 0.33; and private land having no conservation easement, 0.0. These scores were based on the expert opinion of both elk and land managers; we could not find data-derived values in the literature. To calculate the effect of duck clubs, we first used National Agricultural Imagery Program (NAIP) aerial imagery to identify the locations of duck club headquarters within parcels identified as “duck club” in land use status. We assumed that human disturbance at the duck clubs is generally highest in immediate vicinity of the headquarters. Distances to the nearest duck club headquarters were calculated, and elk habitat suitability scores were assigned based on the following distances to duck club headquarters: 0-1 km, 0.0; 1-2 km, 0.2; 2-3 km, 0.4; 3-4 km, 0.6; 4-5 km, 0.8; and, >5 km, 1.0. Raster cells within duck club parcels were given the lower of the land use and duck club distance scores (i.e., the score representing the highest level of human disturbance). An overall human impact score was calculated by taking the arithmetic mean of the road density and land use scores.
Final suitability value.—The final suitability value (FSV) was calculated by using a geometric mean with equal weight for (1) the cover/forage score; (2) the habitat diversity score; and, (3) the human impact score. The FSV ranged from 0.0-1.0, with the higher values indicating areas with greater habitat suitability (or “higher quality” habitat) for supporting tule elk. Use of the geometric mean in this instance produced a conservative value for potential tule elk habitat suitability for each raster cell in the study area.
Carrying capacity.—We calculated the range of the expected number of elk that could be supported by existing habitat in the GEA. This range was identified by calculating the mean area per individual elk of the subgroup home ranges for the free-ranging Cache Creek herd (O’Connor 1988). These home ranges were estimated using two methods (modified minimum area and convex polygon), resulting in areas of 36.4 ha (modified minimum area) and 64.7 ha (convex polygon) per elk.
results
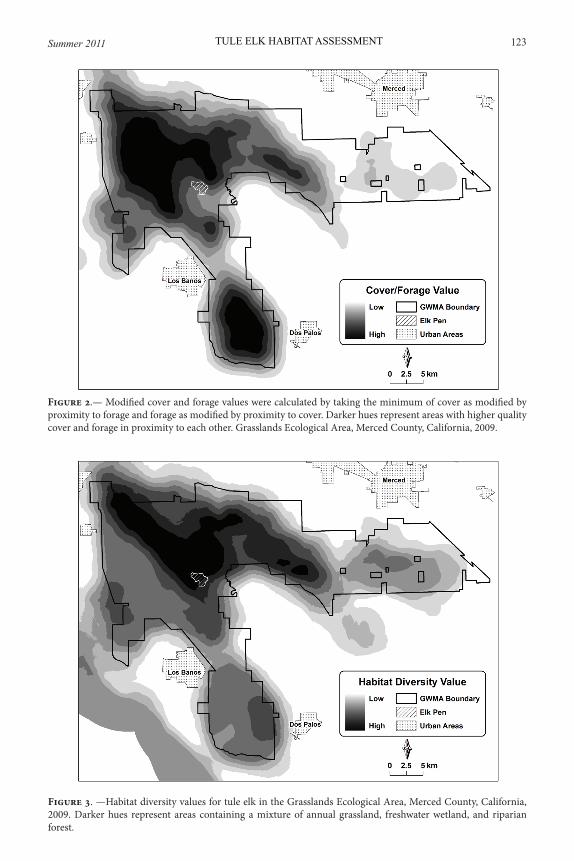
High cover/forage scores were found throughout the Kesterson Unit (northwest) and the San Luis-Bear Creek Units (northeast) portions of the study area (Figure 2). High scores were also found to a lesser extent in the private duck club lands in the southern portion of the GEA.
High habitat diversity scores were found in portions of the Kesterson Unit as well as the San Luis/Bear Creek Units (Figure 3). Diversity scores were somewhat limited and focused in portions of the study area near the San Joaquin River; this is the main location of high quality riparian forest in the GEA.
Areas of low human impact (i.e., human impact scores near 1.0) were distributed throughout the GEA (Figure 4). Some notable concentrations included the Kesterson, San Luis, and Bear Creek units.
In this study, we considered ratings of “high” or “very high” to be usable elk habitat (Didier and Porter 1999). Thus, we estimated that there are approximately 11,650 ha of potential elk habitat within the GEA. Of this, 4,638 ha were considered very high quality
123Summer 2011
Figure 2.— Modified cover and forage values were calculated by taking the minimum of cover as modified by proximity to forage and forage as modified by proximity to cover. Darker hues represent areas with higher quality cover and forage in proximity to each other. Grasslands Ecological Area, Merced County, California, 2009.
Figure 3. —Habitat diversity values for tule elk in the Grasslands Ecological Area, Merced County, California, 2009. Darker hues represent areas containing a mixture of annual grassland, freshwater wetland, and riparian forest.
TULE ELK HABITAT ASSESSMENT

CALIFORNIA FISH AND GAME Vol. 97, No. 3124
Figure 4.—Human impacts dataset combining road density, duck club, and grazing impacts in the Grasslands Ecological Area, Merced County, California, 2009. Darker hues represent areas with low combined human im-pacts; note that low human impact values result in high elk habitat suitability values in the model.
Figure 5.—Final habitat suitability zones for tule elk in the Grasslands Ecological Area, Merced County, Califor-nia, 2009. “Very High” habitat quality areas (dark) represent areas with high quality cover and forage in proximity, a diversity of vegetation types preferred by elk, and low levels of human impact.

125Summer 2011
habitat (Figure 5). These areas generally were public land, formed a mosaic of grasslands, freshwater wetlands, and riparian forest, and were isolated from public roads. We estimated the carrying capacity of the GEA’s 11,650 ha of identified potential elk habitat to be 180-320 elk.
Two areas, the San Luis and East Bear Creek Units of the San Luis National Wildlife Refuge, and the Kesterson Unit of the San Luis National Wildlife Refuge yielded the highest elk suitability scores (Figure 5). The San Luis and East Bear Creek cluster included areas centered on the riparian forest adjacent to the San Joaquin River, as well as an annual grassland-freshwater wetland mosaic immediately northeast of the current elk enclosure. The Kesterson cluster was centered on the area between the San Joaquin River and Mud Slough with its associated riparian forest. These two clusters were embedded within, and connected by, a larger zone of high suitability, but this connection was bisected by Highway 165.
discussion
The approach described in this paper systematically identified the best potential habitat for tule elk in the GEA. The results indicated portions of the San Luis and East Bear Creek Units, as well as the Kesterson Unit, could provide tule elk introduced to the GEA with high quality habitat. Both of these areas have adequate cover and forage in proximity to each other, a diversity of habitat types (although it is greater in the San Luis and East Bear Creek zone due to riparian forests near the San Joaquin River), and are largely free from detrimental human impacts. The combined areas of these zones could provide enough habitat to support a relatively large herd of elk. Thus, it is recommended that any introduction sites be located within one or more of these high quality habitat zones. If elk are subsequently introduced to these areas, we expect the elk population to quickly increase in this landscape (Gogan and Barrett 1987). A somewhat similar environment at Grizzly Island supports a thriving herd in an area substantially smaller than the GEA.
While we believe that our calculation of the carrying capacity for elk in the GEA is a reasonable estimate, it should be noted that home range sizes vary widely among herds. For example, home ranges of tule elk at Point Reyes are generally several hundred ha in area (Howell et al. 2002), but those at Carrizo Plain can be larger than 10,000 ha (Penrod et al. 2010). Much of this variation likely stems from climate differences between locations, and resulting resource availability and habitat quality. We chose to use population parameters from the Cache Creek herd (O’Connor 1988) as a middle course between these extremes. Because potential elk habitat in the study area is likely higher quality than that at Cache Creek, our population numbers should be interpreted as conservative estimates (i.e., less area/individual is probably required in the GEA).
The locations of these habitat zones suggest several potentially hazardous areas for tule elk in the GEA, including (1) private duck clubs; (2) the San Luis Drain; (3) California Highway 165; and, (4) agricultural fields. The Kesterson habitat zone is directly adjacent to a number of private duck clubs located to the southwest of this unit. Disturbances could be detrimental to elk in this area (at least for a portion of the year). The San Luis Drain, a concrete-lined canal carrying agricultural run-off through the middle of the Kesterson zone, could prove lethal to elk. Another potentially lethal landscape feature is Highway 165, running north-south through the middle of the GEA. Roads are a well-known hazard for elk (Dodd et al. 2007) and other species, and collisions could further result in human injury or death. Adequate measures to mitigate for these hazards (e.g., funnel fencing techniques or road crossing structures) should be implemented as part of any reintroduction program, and will
TULE ELK HABITAT ASSESSMENT

CALIFORNIA FISH AND GAME Vol. 97, No. 3126
be especially important if elk movement between high quality habitat on opposite sides of the highway proves vital for population viability. Finally, the entire GEA is surrounded by agricultural fields. If elk move into these fields, farmers could suffer crop loss and fence damage (Rosatte et al. 2007). Programs to erect elk-proof fencing or implement hazing techniques in high risk areas could help alleviate these potential problems (Walter et al. 2010).
We modified methods used by other researchers studying elk in another part of the United States (Didier and Porter 1999) and augmented those with new methods to make this study more appropriate for the GEA and the subspecies in question. This methodology could be used in future tule elk habitat assessments in California. Elk are habitat generalists and a diversity of habitats can be beneficial (Sawyer et al. 2007) by providing a variety of resources that can vary both seasonally and annually. Lacking site-specific field studies that quantify ideal habitat diversity for tule elk can be problematic. Nonetheless, the habitat diversity scoring method described in this paper likely allows for an approximation of this variable even in the absence of empirical data from the GEA.
We also modified the human impacts input variable to better reflect the characteristics of the study area. Duck clubs and grazing are two land-use issues that we expected to be important factors affecting elk management in the GEA. By giving the combined values of these two variables a weight equal to that of road density, we better represented the impacts of humans to elk in the planning area. This framework can be used in other locations, with specific non-road variables determined by the geographic particulars of the given area.
The habitat analysis framework that we implemented produced useful model results for refuge management and decision-making, but we note some caveats. While some input variables were scored in accordance with field study results or systematically-derived expert opinion, several were estimates based on our knowledge of the study region. For example, the specific effects of duck clubs on elk have not been formally investigated; thus, the impacts associated with them (as part of the human impacts variable) are assumptions based on anecdotal evidence from refuge managers. Similarly, the updated tule elk-specific land cover habitat scores were based on the expert opinion of the author (Hobbs) with the most experience managing tule elk. Finally, the land-use scores were based on our specific knowledge of the study area and tule elk.
The next step in the process of introducing tule elk to the GEA includes designing and assessing release scenarios, and determining which locations within the very high quality habitat zones would be most appropriate and minimize potential negative interactions with humans. Adaptive management through the analysis of actual elk habitat use post-release would serve as a valuable management tool and feedback to the model presented in this paper, allowing for model assessment and modification (Larkin et al. 2004). We recommend that this reintroduction modeling framework be incorporated into future tule elk reintroduction efforts. We also suggest this approach be adopted for restoration of other native species that have been extirpated from their native historical range in California, such as pronghorn (Antilocapra americana).
acknowledgMents
We thank the Rocky Mountain Elk Foundation, CDFG, and the U.S. Fish and Wildlife Service (USFWS) for financial support. In addition, we thank K. Stromayer and B. Parris (USFWS) and J. Garcia (CDFG) for their efforts in support of this project. Finally, we thank the three reviewers and the associate editor for providing suggestions that improved the quality of this paper.

127Summer 2011
literature cited
cdfG (california dePartMent of fish and GaMe). 2002. California wildlife habitat relationships (cWhr) system, Version 8 personal computer program. California Department of Fish and Game, Sacramento, USA.
cdWr (california dePartMent of Water resources). 2002a. Merced County land cover dataset. California Department of Water Resources, Sacramento, USA.
cdWr. 2002b. San Joaquin River riparian vegetation dataset. California Department of Water Resources, Sacramento, USA.
dauGherty, d. J., t. M. sutton, and r. f. elliott. 2008. Potential for reintroduction of lake sturgeon in five northern Lake Michigan tributaries: a habitat suitability perspective. Aquatic Conservation: Marine and Freshwater Ecosystems 18:692-702.
didier, k. a., and W. f. Porter. 1999. Large-scale assessment of potential habitat to restore elk to New York State. Wildlife Society Bulletin 27:409-418.
dodd, n. l., J. W. GaGnon, s. boe, and r. e. schWeinsburG. 2007. Assessment of elk highway permeability by using global positioning system telemetry. Journal of Wildlife Management 71:1107-1117.
esri (environMental systeMs research institute). 2009. ArcGIS version 9.3 software. Environmental Systems Research Institute, Redlands, California, USA.
fischer, J., and d. b. lindenMayer. 2000. An assessment of the published results of animal relocations. Biological Conservation 96:1-11.
forMan, r. t. t. 2000. Estimate of the area affected ecologically by the road system in the United States. Conservation Biology 14:31-35.
GoGan, P. J. P., and r. h. barrett. 1987. Comparative dynamics of introduced tule elk populations. Journal of Wildlife Management 51:20-27.
Greco, s. e., P. r. huber, J. hobbs, J. Garcia, k. stroMayer, and r. Parris. 2009. Grasslands Ecological Area tule elk reintroduction feasibility study (Year 1 final report). Rocky Mountain Elk Foundation, Missoula, Montana, USA.
hoWell, J. a., G. c. brooks, M. seMenoff-invinG, and c. Greene. 2002. Population dynamics of tule elk at Point Reyes National Seashore, California. Journal of Wildlife Management 66:478-490.
larkin, J. l., J. J. cox, M. W. WichroWski, M. r. dzialak, and d. s. Maehr. 2004. Influences on release-site fidelity of translocated elk. Restoration Ecology 12:97-105.
lathaM, h. s., and J. M. verzuh. 1971. Reducing hazards to people and animals on reclamation canals: open and closed conduit systems program. REC-ERC-71-36. U.S. Bureau of Reclamation, Denver, Colorado, USA.
lyon, l. J. 1984. Field tests of elk/timber coordination guidelines. Research Paper INT-325. U.S. Forest Service, Intermountain Forest and Range Experimental Station, Ogden, Utah, USA.
Mayer, k. e., and W. f. laudenslayer, Jr. (editors). 1988. A guide to the wildlife habitats of California. California Department of Forestry and Fire Protection, Sacramento, USA.
Mcclafferty, J. a., and J. a. Parkhurst. 2001. Using public surveys and geographic information systems to determine the feasibility of restoring elk to Virginia. Pages 83-98 in D. S. Maehr, R. F. Noss, and J. L. Larkin, editors. Large mammal restoration: ecological and sociological challenges in the 21st century. Island Press, Washington, DC, USA.
TULE ELK HABITAT ASSESSMENT

CALIFORNIA FISH AND GAME Vol. 97, No. 3128
MccullouGh, d. r. 1969. The tule elk: its history, behavior, and ecology. University of California Publications in Zoology 88:1-209.
MccullouGh, d. r., J. k. fischer, and J. d. ballou. 1996. From bottleneck to metapopulation: recovery of tule elk in California. Pages 375-403 in D. R. McCullough, editor. Metapopulations and wildlife conservation. Island Press, Washington, DC, USA.
Mcshea, W. J., k. koy, t. cleMents, a. Johnson, c. vonGkhaMhenG, and M. aunG. 2005. Finding a needle in a haystack: regional analysis of suitable Eld’s deer (Cervus eldi) forest in Southeast Asia. Biological Conservation 125:101-111.
Morrison, M. l. 2002. Wildlife restoration. Island Press, Washington, DC, USA.Morrison, M. l. 2009. Restoring wildlife: ecological concepts and practical applications.
Island Press, Washington, DC, USA.noss, r. f. 2001. Why restore large mammals? Pages 1-21 in D. S. Maehr, R. F. Noss, and
J. L. Larkin, editors. Large mammal restoration. Island Press, Washington, DC, USA.o’connor, P. M. 1988. Home range and habitat use by tule elk at Cache Creek, California.
M.S. Thesis, Humboldt State University, Arcata, California, USA.olsson, o., and d. J. roGers. 2009. Predicting the distribution of a suitable habitat for
the white stork in southern Sweden: identifying priority areas for reintroduction and habitat restoration. Animal Conservation 12:62-70.
Penrod, k., W. sPencer, e. rubin, and c. PaulMan. 2010. Habitat connectivity planning for selected focal species in the Carrizo Plain. Science and Collaboration for Connected Wildlands, Fair Oaks, California, USA.
rosatte, r., J. haMr, J. younG, i. filion, and h. sMith. 2007. The restoration of elk (Cervus elaphus) in Ontario, Canada: 1998-2005. Restoration Ecology 15:34-43.
saWyer, h., r. M. nielson, f. G. lindzey, l. keith, J. h. PoWell, and a. a. abrahaM. 2007. Habitat selection of Rocky Mountain elk in a nonforested environment. Journal of Wildlife Management 71:868-874.
seddon, P. J., and P. s. soorae. 1999. Guidelines for subspecific substitutions in wildlife restoration projects. Conservation Biology 13:177-184.
telesco, r. l., f. t. vanManen, J. d. clark, and M. c. cartWriGht. 2007. Identifying sites for elk restoration in Arkansas. Journal of Wildlife Management 71:1393-1403.
usfWs (united states fish and Wildlife service). 2010. National wetlands inventory dataset. U.S. Fish and Wildlife Service, Washington, DC, USA.
vandeelen, t. r., l. b. Mckinney, M. G. Joselyn, and J. e. buhnerkeMPe. 1997. Can we restore elk to southern Illinois? The use of existing digital land-cover data to evaluate potential habitat. Wildlife Society Bulletin 25:886-894.
Walter, W. d., M. J. lavelle, J. W. fischer, t. l. Johnson, s. e. hyGnstroM, and k. c. vercauteren. 2010. Management of damage by elk (Cervus elaphus) in North America: a review. Wildlife Research 37:630-646.
WilliaMs, c. l., b. lundriGan, and o. e. rhodes, Jr. 2004. Microsatellite DNA variation in tule elk. Journal of Wildlife Management 68:109-119.
zeiner, d. c., W. f. laudenslayer, k. e. Mayer, and M. White. 1990. California’s wildlife. Volume III: mammals. California Department of Fish and Game, Sacramento, USA.
Submitted 17 March 2011Accepted 22 June 2011Associate Editor was J. Villepique

129Summer 2011
app
en
dix
: e
lk
ha
bit
at M
od
el r
atin
gs
The “
Exis
ting
Cal
iforn
ia W
ildlif
e Hab
itat R
elat
ions
hips
(CW
HR
) Elk
Mod
el” i
s a g
ener
aliz
ed m
odel
fo
r all
elk
subs
peci
es fo
und
in C
alifo
rnia
that
is cu
rren
tly in
use
in th
e CW
HR
syst
em, v
ersi
on 8
.1. T
he “T
ule
Elk-
Spec
ific M
odel
” is a
mod
el d
evel
oped
for t
his s
tudy
by
proj
ect b
iolo
gists
and
was
spec
ifica
lly d
esig
ned
to
rate
hab
itat f
or th
e tul
e elk
subs
peci
es. T
he ar
ithm
etic
mea
n w
as u
sed
to ca
lcul
ate t
he av
erag
e hab
itat v
alue
s.
Lan
d C
over
E
xist
ing
CW
HR
Elk
Mod
el
Tule
Elk
-Spe
cific
Mod
el
Rep
ro.
Fora
geC
over
Mea
nR
epro
.Fo
rage
Cov
erM
ean
Ann
ual g
rass
land
(AG
S)0.
000.
330.
330.
220.
661.
000.
750.
80O
rcha
rd (D
OR
)0.
000.
110.
000.
040.
000.
330.
000.
11Eu
caly
ptus
(EU
C)
0.33
0.45
0.33
0.39
0.33
0.50
0.64
0.49
Fres
hwat
er w
etla
nd (F
EW)
0.66
1.00
0.66
0.77
0.83
1.00
0.83
0.89
Irrig
ated
gra
in (I
GR
)0.
001.
000.
000.
330.
001.
000.
000.
33Ir
rigat
ed c
rops
(IR
F)0.
001.
000.
000.
330.
001.
000.
000.
33Ir
rigat
ed h
ay (I
RH
)0.
001.
000.
000.
330.
001.
000.
000.
33Pa
stur
e (P
AS)
0.00
1.00
0.00
0.33
0.00
1.00
0.00
0.33
Urb
an (U
RB
)0.
000.
660.
000.
220.
000.
000.
000.
00V
iney
ard
(VIN
)0.
000.
660.
000.
220.
000.
660.
000.
22R
ipar
ian
fore
st (V
RI)
0.49
0.72
0.68
0.63
0.54
0.82
0.92
0.76
TULE ELK HABITAT ASSESSMENT