Assessment of Genetic Diversity among Wheat Varieties in ... et al.pdf · Assessment of Genetic...
24
Int.J.Curr.Microbiol.App.Sci (2015) 4(8): 671-694 671 Original Research Article Assessment of Genetic Diversity among Wheat Varieties in Aurangabad Using RAPD Analysis V.M.Shukre 1 * N.S.Chavan 1 and Y.K.Patil 2 1 MGM College of Agricultural Biotechnology, Dist.- Aurangabad (M.S.), India 2 MGM KVK, Gandheli, India *Corresponding author ABSTRACT Introduction Wheat (Triticum aestivum) is an important cereal food crop in the world. Most of the wheat varieties/genotypes are related with each other. All the wheat varieties share International Journal of Current Microbiology and Applied Sciences ISSN: 2319-7706 Volume 4 Number 8 (2015) pp. 671-694 http://www.ijcmas.com Assessment of genetic diversity among wheat varieties in Aurangabad using RAPD analysis under invitro condition was studied at MGM College of Agricultural Biotechnology & MGM-Institute of Biosciences and Technology, Aurangabad. The Genetic diversity of eleven different wheat (Triticum aseitivium) varieties (Mrugnayani chandoshi, Hathi sharbati, Mini sharbati, 147 Best loose, Loose lokwan grade 1, Loose sharbati grade 1, Standard 147, Agni sharbati, Narmada 496, Vishnu padma chandoshi, HD 2189)was assessed using the RAPD primers and PCR- Polymerase chain reaction. Electrophoretic analysis of amplified products revealed higher incidence of polymerase in 11 varieties. Pair wise comparisons of unique and shared polymorphic amplification products were used to generate Jaccards coefficients. In the present investigation of molecular marker analysis in wheat was carried out using RAPD primer for assessment of parental variability. It was carried out using following points: DNA isolation was carried out of different (11) wheat variety using CTAB DNA extraction method and it was confirmed using Agarose gel electrophoresis fig 1. DNA purification was carried out by treating the DNA suspended in TE buffer with RNase A to remove the RNA contamination from the DNA and it was checked using agarose gel electrophoresis Quantification of purified DNA was carried out by two methods: UV spectrophotometer by using 260 and 280 ratio and Eye ball estimation using standard DNA. RAPD amplification was done using PCR with primer 3 universal random primer i.e. RPI 3 was used for study and 26 RAPD amplification bands were generated. Among all eleven wheat 147 best loose and HD 2189 variety gave more amplification than other. Polymorphic and Monomorphic banding pattern was studied. Polymorphic pattern was obtained. Polymorphic present was calculated in 11 wheat varieties using primer three and it was found to be 80.76 % RAPD. These were employed to construct the phenograms using an unweighted pair group method with arithmetical averages (UPGMA). Analysis of RAPD data appears to be helpful in determining the genetic relationships among the genotypes. Keywords Silver nanoparticles, Antibacterial, Zone of inhibition, Chemical synthesis, Sodium borohydride
Transcript of Assessment of Genetic Diversity among Wheat Varieties in ... et al.pdf · Assessment of Genetic...

Int.J.Curr.Microbiol.App.Sci (2015) 4(8): 671-694
671
Original Research Article
Assessment of Genetic Diversity among Wheat Varieties in
Aurangabad Using RAPD Analysis
V.M.Shukre
1* N.S.Chavan
1 and Y.K.Patil
2
1MGM College of Agricultural Biotechnology, Dist.- Aurangabad (M.S.), India
2MGM KVK, Gandheli, India
*Corresponding author
A B S T R A C T
Introduction
Wheat (Triticum aestivum) is an important
cereal food crop in the world. Most of the
wheat varieties/genotypes are related with
each other. All the wheat varieties share
International Journal of Current Microbiology and Applied Sciences ISSN: 2319-7706 Volume 4 Number 8 (2015) pp. 671-694
http://www.ijcmas.com
Assessment of genetic diversity among wheat varieties in Aurangabad using RAPD
analysis under invitro condition was studied at MGM College of Agricultural Biotechnology & MGM-Institute of Biosciences and Technology, Aurangabad. The
Genetic diversity of eleven different wheat (Triticum aseitivium) varieties
(Mrugnayani chandoshi, Hathi sharbati, Mini sharbati, 147 Best loose, Loose
lokwan grade 1, Loose sharbati grade 1, Standard 147, Agni sharbati, Narmada 496, Vishnu padma chandoshi, HD 2189)was assessed using the RAPD primers
and PCR- Polymerase chain reaction. Electrophoretic analysis of amplified
products revealed higher incidence of polymerase in 11 varieties. Pair wise comparisons of unique and shared polymorphic amplification products were used
to generate Jaccards coefficients. In the present investigation of molecular marker
analysis in wheat was carried out using RAPD primer for assessment of parental
variability. It was carried out using following points: DNA isolation was carried out of different (11) wheat variety using CTAB DNA extraction method and it was
confirmed using Agarose gel electrophoresis fig 1. DNA purification was carried
out by treating the DNA suspended in TE buffer with RNase A to remove the RNA contamination from the DNA and it was checked using agarose gel electrophoresis
Quantification of purified DNA was carried out by two methods: UV
spectrophotometer by using 260 and 280 ratio and Eye ball estimation using standard DNA. RAPD amplification was done using PCR with primer 3 universal
random primer i.e. RPI 3 was used for study and 26 RAPD amplification bands
were generated. Among all eleven wheat 147 best loose and HD 2189 variety gave
more amplification than other. Polymorphic and Monomorphic banding pattern was studied. Polymorphic pattern was obtained. Polymorphic present was calculated in
11 wheat varieties using primer three and it was found to be 80.76 % RAPD. These
were employed to construct the phenograms using an unweighted pair group method with arithmetical averages (UPGMA). Analysis of RAPD data appears to
be helpful in determining the genetic relationships among the genotypes.
K ey wo rd s
Silver nanoparticles,
Antibacterial,
Zone of inhibition,
Chemical
synthesis,
Sodium
borohydride

Int.J.Curr.Microbiol.App.Sci (2015) 4(8): 671-694
672
same gene pool in India due to transfer of
dwarfing gene into cultivated varieties and
later these varieties acquitted with the
different resistance genes. The use of
random amplified polymorphic DNAs as a
molecular marker for diversity assessment is
a reliable and important tool in modern era.
Now a day it has become necessary to assess
the diversity among different genotypes to
know the extent of similarity and
dissimilarity at genetic level. Wheat is the
most important food grain of the temperate
zones - both north and south. World acreage
in wheat is estimated at near 500 million
with near 60 million acres in the United
States. Production in the United States was
1,524,340,000 bushels in 1967.
Wheat classification
Kingdom: Plantae-Plants
Subkingdom: tracheobionta-Vascularplants
Super division: Spermatophyta-Seedplants
Division: Magnoliophyta-Floweringplants
Class: Liliopsida-Monocotyledons
Subclass: Commelinidae
Order: Cyperales
Family: Poaceae-Grassfamily
Genus: Triticum-wheat
Species: Triticum aestivum - common wheat
The information at genetic and molecular
level infers about the variation in characters
among genotypes. An attempt was made to
know the relatedness among eighteen bread
wheat varieties to detect the variations
among the wheat genotypes during 2005-06.
Standard protocols were used for the
isolation of DNA and RAPD analysis. It is
stable diet for more than one third of world’s
population and contributes more calories
and proteins to the world’s diet than any
other cereal crops. Nowadays in Egypt there
is an urgent need to increase the productivity
level of wheat to reduce the food gap
resulting from population increase. The
breeders have to develop a new set of
varieties with higher production.
The true knowledge of gene action of
various Durum wheat traits is useful in
making decision with regard to appropriate
breeding system effects were played the
major role in controlling the genetic
variation in the days to flowering, one
thousand grain weight and grain yield per
plant. It was reported that the importance of
both additive and dominance gene effects in
the inheritance of one thousand grain
weight.
However the dominance gene effects were
more than in magnitude favorable condition.
Conventional breeding has accomplished a
remarkable success in development of high
yielding varieties. However, use of other
non conventional approaches may further
accelerate the progress of such a breeding
program. Wheat (Triticum aestivum L.) is an
important cereal crop widely cultivated in
India and world providing ample food
calories and proteins to the human
population. It is the second most important
cereal crop after rice grown under diverse
agro climatic conditions. Wheat is important
winter cereal crop contributing about 32% of
the total food grain production in India. It is
staple food crops in at least 43 countries.
Wheat (Triticum sp) is one of the most
important cereal crops which constitute a
very important source of food to a vast
population. Bread wheat is an important
cereal crop in global agricultural economy is
cultivated in a range of mega environments
of the world. It is most widely grown and
consumed food crop of the world cultivated
on larger area and produce more tonnage of
food than any other cereals.
Triticum aestivum, common bread wheat,
contains 3 different but genetically related
genomes (A, B and D) with a total genomic

Int.J.Curr.Microbiol.App.Sci (2015) 4(8): 671-694
673
size of 1.7x10¹⁰ base pairs, which is about
500 times larger than that of rice1
illustrating the complex nature of wheat
genome. Wheat has been a food crop for
mankind since the beginning of agriculture.
Carbonized grains dating to at least as early
as 6750 B.C. have been found in Iraq and
many other findings in Eastern
Mediterranean countries are nearly as old.
The Middle East is probably the area of
origin, and wheat apparently spread
throughout Europe not later than the Stone
Age. Wheat is essentially a cool season crop
that thrives best at preharvest temperatures
averaging around 60 F. The minimum frost-
free growing season is about 100 days. In
continental United States wheat is grown in
every state although production in New
England is minor. From 15 to 20 or more
inches of precipitation are necessary for
annual cropping. In some areas with not
more than 10 to 15 inches of precipitation
wheat is grown once in 2 years, with the
land kept free of vegetation one of the years
to accumulate moisture in the soil. The
wheat plant is an annual grass. It is mainly
grown as a winter annual in milder climates,
with seeding in the fall and harvest from
June through August depending on the
length of the winter. In areas with rigorous
winter climates it is mainly spring seeded.
Planting is as early as soil can be worked,
and harvest is in late summer and early fall.
In early growth stages the wheat plant
consists of a much compressed stem or
crown and numerous narrowly linear or
linear-lanceolate leaves. Leaves are mainly
near glabrous. Buds in the leaf axils below
the soil surface grow into lateral branches
termed tillers. From both the main crown
and the tillers, elongated stems develop later
and terminate in a spike or head in which the
flowers, and finally the seed or grain,
develop. In fall-seeded wheat the plant
usually remains in the rosette stage
throughout the fall and winter, sending up
the elongated stems in late spring. In spring-
seeded wheat the rosette period may be
short, and tillering is usually much less than
in fall plantings. During late fall and early
spring, fall-seeded wheat can be lightly
pastured without greatly reducing grain
yields, and this is frequently done. The
pasturage at this stage is nutritious and
highly palatable. Stems of wheat reach from
18 inches to 4 or more feet in height
depending on kind and growing conditions.
The spike or head may be from less than 2
inches to 4 or 5 inches long. Both stems and
spikes from the latest- formed tillers are
usually somewhat smaller than those of the
earlyformed tillers. Wheat is an annual plant
belongs to trip tritiace subfamily poodiaceae
of family pooaceae. Wheat is having seven
pair of chromosome. The different species
of Triticum are grouped into diploid and
tetraploid and hexaploid. Out of 50 wild
species 3 species are being cultivated in
India Triticum dicoccum it is also called as
emmer wheat, Triticum durum as macaroni
wheat and Triticum aestivium as bread
wheat. About 87 % of total wheat
production is of bread wheat 12% of durum
wheat and very less i.e. 1 % of dicoccum
wheat.
Wheat is having therapeutic value. It is
having wider adaptability ie tropical
subtropical as well as temperate zone. It can
tolerate severe cold as well as snow and
resume growth with grain setting in a warm
weathers in spring. Wheat is naturally self
pollinated cro0p which is usually grown to a
height of about 3 feet and completing life
cycle within 120-130 days. Inflorescence of
wheat is made up of spikelets enclosed by
outer lemma and palea, spike takes several
days to complete flowering and opening of
the flower stars from the lower spikelet and
continued towards top, it requires seldom 20
minutes. Another dehiscence takes placed
within two to three minutes.

Int.J.Curr.Microbiol.App.Sci (2015) 4(8): 671-694
674
Wheat has grown since pre historic time so
long ago that the origin of wheat is still a
matter of speculation. All available records
and evidence reveal its origin from south
western Asia, where wild forms of wheat
were cultivated as early as 10000-15000
B.C. In world wheat occupies an average
area of 215.26 million ha with total
production of 584.76 million tones with
productivity of 2715 kg/ha. Maximum area
under wheat is China followed by India,
Russia, and USA. In production China ranks
first. In India, during 2010-11 area under
cultivation was 27.50 ha with the annual
production of 80.58 metric tons. In other
words about only fifth of global production
of wheat comes from India and now
occupies second position in wheat Gujarat,
Haryana Madhya Pradesh
Punjab and Uttar Pradesh are major wheat
growing states in country. Through the
maximum acreage and production of wheat
is in UP but Punjab gives highest average
yield followed by Haryana. In Maharashtra
it occupied an area of 10.21 million ha with
production of 14.83 metric tons with an
average production of 14052 q/ha. While in
Vidharba it occupies 2.81 million ha area
with a production of 3.51 metric ton having
productivity of 13.387 q/ha. Wheat is
manually used as a human food. It is
nutritious, concentrated, easily stored and
transported and processed into various types
of food. It is good source of protein minerals
vitamins (Riboflavin, Thiamine), sugars and
fats. Protein in the wheat varies from 7-24
%, wheat protein contains glutin which is
responsible for providing framework for
spongy texture of bread and bakery
products. It is mostly consumed in the form
of chapatti puri paratha upma and suji or suji
halwa prepared from atta maida or suji of
aesitivium wheat. Besides mainly bakery
products such as biscuits, bread, cake and
pastries. Durum wheat is used for making
instant food such as macaroni, semolina,
noodles, vermicelli, spegathii and other
pasta products. Common wheat is seriously
damaged by different diseases most
dangerous disease of leaf rust, stem rust,
fusarium head blight and powdery mildew
of these fungal disease specially leaf rust is
often the most serious disease which can
reduce total yield by about 1% for each 1%
increase of infection.
RAPD marker analysis provides virtually
unlimited no of markers to compare
individual genotypes and considering easy
handling and cheaper cost per assay, it is
possible to carry out large scale training for
breeding population and genetic resources.
The present study aims to determine the
types of gene action effects controlling
morphological traits, yield and its
component as well as estimating heterosis,
heritability, inbreeding depression and
genotypic variability coefficient of the
studied traits. Moreover the study aims to
detect the genetic variation of the wheat
genotypes under the study using RAPD PCR
marker technique. RAPD is PCR based
technology. Arbitrarily primed PCR and
RAPD are essentially same techniques most
molecular biologists like more frequently
RAPD’S: RAPD technique does not require
any previous knowledge of target genome
and is relatively simple and rapid to carry
out genetic analysis of bio diversity and
study of relationship among species at
different level the technique has been
applied to identify cultivars and revealing
phylogenetic relationship among them.
RAPD technique has great potential in
finding DNA marker for breeding programs
and in their use OPA, OPB AND OPC
primers used in RAPD reaction for analysis
of genetic diversity in various crop i.e.
wheat, sorghum, chili, tomato and cotton.
These primers are universal primers.

Int.J.Curr.Microbiol.App.Sci (2015) 4(8): 671-694
675
Different showed variations in their ability
to detect polymorphism.
Application of RAPD markers
The RAPD is that is the fast technique, easy
to perform and comparatively cheap. It is
immediately applicable to the analysis of
most of organism because universal sets of
primers are used without any need for prior
sequence information.
·0 Analysis and individual specific genotype
·1 RAPD used for genetic identity to study
closely related species.
·2 It is used for gene mapping
·3 Used for fingerprinting
·4 It is used for gene tagging
·5 Preparation of genetic map
·6 RAPD marker technology is widely used
to find marker related to target gene.
Taking the advantage of evolutionary
background of wheat and the available
molecular tools, an attempt has been made
to reveal the genetic variability of 11
accessions. The effort were made to the
diversity analysis in the wheat cultivars with
the following
objectives
·7 Analysis of genetic diversity using PCR
based molecular marker.
ISSR marker and agronomical
characterization and 25 cotton germ plasm
45 ISSR primers and 40 RAPD primers
were used to amplified the germ plasm.
(Dongare et al., 2003) 19 scorable ISSR
markers generated 90 marker while 21
reproducible RAPD primer generated 150
marker of which markers from ISSR and
markers from RAPD were scored as
polymorphic. Dendrogram were developed
from ISSR and RAPD analysis by using
NTSYS PC software.
Genetic diversity was identified in Korean
tomato cultivars by RAPD marker with the
usage of molecular marker for cultivar
identification and protection of plant
breeders and intellectual property rights
(Man kyu Huh et al., 2011).
Ten bread wheat varieties were assessed
using RAPD marker and genetic diversity of
wheat using RAPD was studied (Esra
Ayodgyan et al., 2012).
Genetic diversity among cucumber varieties
available in Karnataka was studied using
RAPD analysis to extracting the DNA (Asif
Ali Khan et al., 2010)
DNA analysis of musk Rose with RAPD
was carried. The genetics of different rose
varieties were compared by RAPD (Karla
Fredrick et al., 2012). All varieties were
found to be extremely similar if not identical
except for “BREMO”.
Materials and Methods
Plant material
Experimental material consists of varieties
of Triticum aesitivium all those materials
collected from local market are as given
below:-
Methods
Plant samples: - Eleven varieties from local
market was collected information regarding
their common name was also collected as
per table no 1. Seed of wheat were grown in
11 different pots under shade condition
where sufficient amount of light is available.
Seeds were germinated to form seedlings
within 6-7 days.
Description of different varieties: These
plants were grown to good heights to form
mature leaves. Different variety showed

Int.J.Curr.Microbiol.App.Sci (2015) 4(8): 671-694
676
variation in their heights and leaves color.
Some showed dark green leaves, some
showed light green in color, some showed
medium range, within two weeks plants
were grown to a good height and were ready
for extraction of DNA.
DNA extraction: The plant genomic DNA
was extracted by following method.
Reagent for DNA extraction buffer
A) DNA extraction buffer
200 mM Tris HCl
250 mM NaCl
25 mM EDTA
0.5% SDS
2% beta mercaptoethanol
All these chemicals are added to distilled
water to make up the volume to 100 ml.
B) Chloroform: Isoamyl alcohol (24:1)
C) 70% ethanol
D) TE buffer pH-8
E) RNase A stock (10mg/ml)
DNA isolation
Total genomic DNA of each variety was
extracted from all eleven varieties of wheat.
Extraction of DNA was performed using
CTAB extraction method ( Deepak Kumar
et al., 2012).To obtain the clean DNA
sample the extraction procedure included the
addition, per each 50µl DNA sample
resuspended in TE buffer. 0.5 µl of RNase A
was added to the sample and were incubated
at 37 0 c for half an hour for purification.
Agarose gel electrophoresis: The quality of
DNA checked by quality of wheat genomic
DNA USING 0.8% of agarose gels.
Procedure for gel electrophoresis
1X electrophoresis buffer was prepared. An
appropriate amount of agarose gel was
weighed to the appropriate volume of 1 X
electrophoresis buffer in conical flask
solution was heated in a microwave oven
flask was rotated occasionally until the
agarose was dissolved.
Allowed the gel to cool near about 55-60 o c
and ETBR was added and mixed properly.
With the help of comb wells were prepared
on the molten agarose. Gel was poured on
assembly and allowed to fix with comb.
Wells were prepared after 20-30 minutes
after removing the comb.
Care to be taken of interference of air
bubbles fill the assembly with buffer. One
volume of sample with five volume of
loading dye was loaded on the gel and the
sample was applied on the wells in the gel.
Electrode was connected and current (1-10
volts/cm) was supplied until the dye has
migrated and appropriate distance in gel.
Analysis of gel
DNA purification
Purification of DNA is essential to removed
RNA, proteins and polysaccharides which
are consider to be the major containments in
DNA based PCR. Inclusion of SDS in DNA
extraction buffer helps elimination of
polysaccharides RNA was removes by
RNase. Sterile distilled water (500 µl) was
added and mixed. RNAse A (0.5 µl) added
and kept at room temperature for 30
minutes. Then it was treated with
chloroform: isoamyl alcohol until it turns
milky. Centrifuged at 10000 rpm for 10 min
at 40 C. Aqueous layer was collected and
one tenth volume of 3 M Sodium acetate
was added slowly and mixed equal volume
of ice chilled isopropanol added fallowed by
centrifugation of 10000 rpm for 15 minutes
at 4oC. Pellet obtained washed with ethanol
was suspended in 50 or 100 µl of TE.

Int.J.Curr.Microbiol.App.Sci (2015) 4(8): 671-694
677
DNA quantification
DNA obtained after extraction was
confirmed by running it on 0.8% agarose gel
containing Et Br (10µl) in electrophoresis
system. Five micro lit of genomic DNA with
Five micro lit loading dye in each well.
After completion of 5 cm run the gel was
observed under UV light and the DNA yield
and quality was confirmed.
Spectrometric analysis
The ratio between reading at 260 nm and
280 nm provided and estimated for the
purity of nucleic acid any sample showing
the ratio below 1.8 or above 2 was further
subjected to purification.
Measurement of DNA concentration
The concentration of DNA was estimated by
the measurement of the UV radiation
observed by nucleic acid basis. The
spectrophotometer meter was calibrated
using 1000 µl of TE in quartz cuvette at 260
and 280 nm 10 µl of DNA sample was
added to 1990 µl to TE, mixed well and
absorbance was taken. Te concentration of
the DNA in the sample was estimated by
multiplying OD at 260 nm with dilution
factor and coefficient of DNA (50).
Eye ball estimation
A particular amount of DNA with its
capability to intercalate a particular quantity
of Et Br there for under UV radiation the
inflorescence intensity reflects the amount
of DNA present in each spot depending
upon the intensity of the film the DNA
amount was quantified as compare with
standard DNA electrophoresis is technique
of separation of charged molecules under the
influence of electric field so that they
migrate in direction wearing the opposite
charge.
DNA sample 2 µl was loaded on gel with
dye for electrophoresis alone with standard
DNA and electrophoresis was carried out
estimation was done by comparing the result
with standard DNA.
Dilution of DNA
DNA sample 50 µland diluted with 500 µl
sterile distilled water.
PCR based amplification with RAPD
primers
DNA from each variety used to amplify with
universal primer each contain in a volume of
(final concentration) dNTPs (10 mM),PCR
assay buffer (10 X), Mgcl2 (25 mM),
primers (5 p mol ), Taq DNA polymerase (3
U /µl), DNA ( 60 ng) and sterile water to
make the volume
The reaction was carried out in thermo
cycler using an initial cycle of denaturation
at 94 oC per 2 min. Second denaturation at
94oC at 30 sec annealing at 37oC for 30
seconds extension for 5 minutes at 72oC.
and final extension at 72o C with 35 cycles
repeats.
The fragments obtained were thin analyzed
by electrophoresis in gel with 1.5% agarose
gel carried out at 100 V for 3 hrs. Gels were
then visualized under UV light. The profiles
were then obtained and analysis was carried
out.
Clustering
The molecular weight marker gene ruler
100bp DNA ladder was used as a standard
and to determine the size of polymorphic
fragments. After electrophoresis, gel was
visualized under UV transillumination and
was photographed using gel doc system.
DNA fragment was done using inbuilt
software and by scoring photographs.
Int.J.Curr.Microbiol.App.Sci (2015) 4(8): 671-694
678
Individual bands with lanes were assigned to
a particular molecular weight comparing
with DNA molecular weight marker. Total
no of bands within each; lanes and number
of polymorphic bands were noted.
Data scoring and analysis
RAPD amplified bands were scored as
present (1) and absent (0) for each primer
population combination.
The data entry was in a binary data matrix as
discrete variable with Jaccards coefficient
similarity was calculated and dendrogram
was generated based on similarity
coefficient by using paired group method.
Most efficient primers were selected on the
extent of polymorphism.
Similarity coefficient
Selected genotype\e was compared with the
rest of genotypes for similarity coefficient.
Greater the value of coefficient compared
variety will be more similar to selected
variety.In addition to this the value of co
efficient also signifies about the extent of
similarity between two varieties.
Nxy = No of bands common in sample a and
b
Nt = total no of bands present in all samples.
N2 =no of bands not present in samples a or
b but found in either samples
The similarity matrix was subjected to
generate a dendrogram using software
program NTSYS PC version 2.1, Exter
software.
Analysis of result using NTSYS software
Generated excel data sheet was given as an
input in dissimilarity or similarity matrix.
Genetic distance was calculated using J & C
coefficient results are then computed and
output file was generated. The output file is
then used as an input for cluster analysis
SAHN tool. Thus, after computing second
output file gets generated which was given
as an input for tree plot generation. Thus, a
clustered tree plot is obtained and analysis
was carried out
Result and Discussion
In the present investigation of molecular
marker analysis in wheat was carried out
using RAPD primer for assessment of
parental variability. It was carried out using
following points:
DNA isolation was carried out of different
(11) wheat variety using CTAB DNA
extraction method and it was confirmed
using Agarose gel electrophoresis (Fig. 1).
DNA purification was carried out by treating
the DNA suspended in TE buffer with
RNase A to remove the RNA contamination
from the DNA and it was checked using
agarose gel electrophoresis (Fig. 2).
Quantification of purified DNA was carried
out by two methods. UV spectrophotometer
by using 260 and 280 ratio. Eye ball
estimation using standard DNA. Gel picture
for quantification is given in (Fig. 3).
RAPD amplification was done using PCR
with primer 3 universal random primer i.e.
RPI 3 was used for study and 26 RAPD
amplification bands were generated. Among
all eleven wheat 147 best loose and HD
2189 variety gave more amplification than
other. Polymorphic and Monomorphic
banding pattern was studied. Polymorphic
pattern was obtained by calculating the
polymorphic percentage it is given by the
following formula

Int.J.Curr.Microbiol.App.Sci (2015) 4(8): 671-694
679
Polymorphic percentage (%) =
polymorphic bands x 100
Total no of bands
21polymorphic bands were present
Polymorphic present was calculated in 11
wheat variety using primer three and it was
found to be 80.76 % RAPD
Analysis of wheat variety
The genetic relationship between wheat
genotype was determined on the basis of
Jaccards pairwise similarity coefficient
values. The value of similarity coefficient
ranged from 0.088 to 9999.00. The variety
Hati sharbati and Mrugnayani chandoshi
showing highly similarity where value is
0.088 and high similarity between Agni
shrbati and HD 2189 whose value is 9999.00
The value of similarity coefficient is 0.088 is
found between Mini sharbati Mrugnayani
chandoshi, Hati sharbati and 147 best loose.
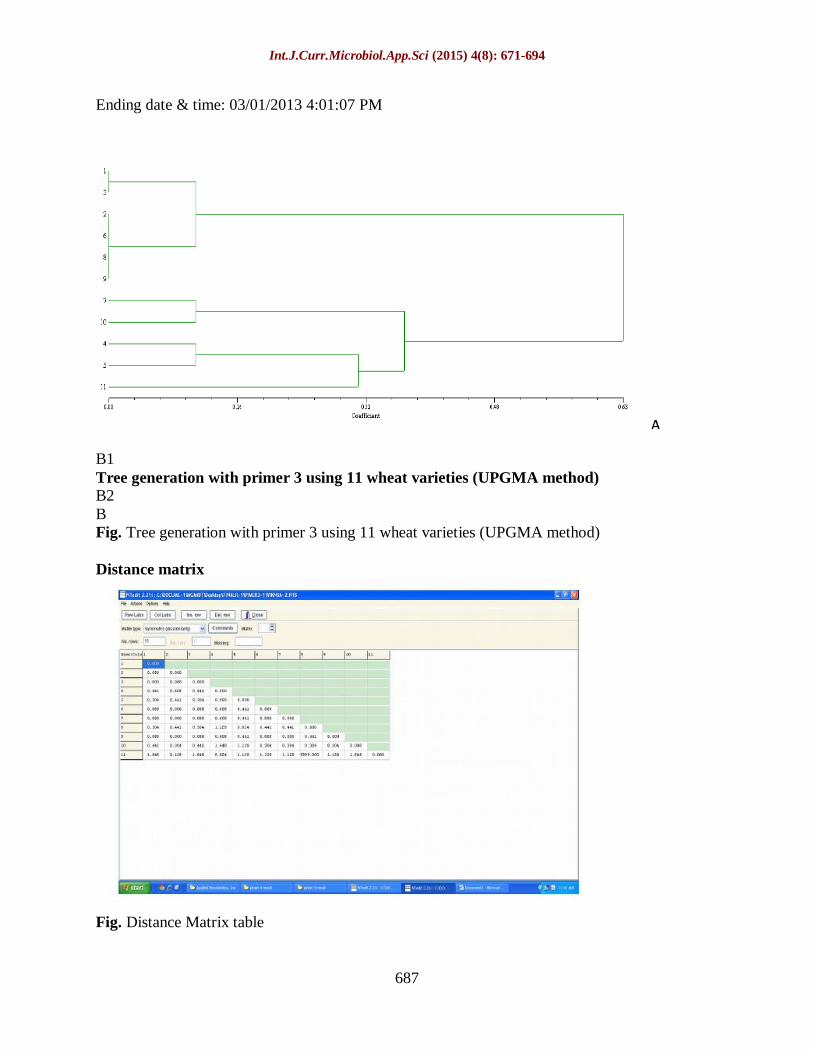
Cluster analysis
A dendrogram was generated by UPGMA
cluster analysis based on Jaccards similarity
coefficient. The dendrogram is shown in
figure: 4 and cluster analysis on the basis of
coefficient value the accessions could be
divided into two groups A and B i.e. A and
B In which cluster A consists of 6 genotypes
and B consists of 5 genotypes.
The cluster A is divided into two sub
clusters i.e AI and A2. The cluster A1
consists 2 genotypes A2 consists 4
genotypes n which varieties Mrugnayani
chandoshi and Mini sharbati ,Hati sharbati
,Agni sharbati are closely related to each
other. related and variety. The cluster B is
also divided in B1 And B2.the cluster
B1consist of subgroup B1a and B2a in that
B1 consist 2 genotypesB2 is consist ofB2a
and B2b. In B2a consist of subgroupB2a1
and B2a2 having 2 genotypes B2b asolitary
cluster having single genotype Which 147
best loose lokewan grade 1 and HD 2189
In the present investigation Random
Amplified Polymorphism DNA (RAPD)
markers were used to study the DNA
fingerprinting of 11 wheat varieties. One
single primer was used having accession no.
AM773310, Amplification of genomic DNA
of 11 genotypes, using RAPD primers
yielded 26 fragments that could be scored of
which 21were polymorphic. Percentage of
polymorphism was calculated for eleven
varieties using primer 3 which was found to
be 80.76%.
The variety 4 & 11(147 best loose and
HD2189) showed high amplification. The
dendrogram obtained from unweighted pair
wise group method for Arithmetic mean of
cluster analysis using Jaccards Similarity
matrix through NTSYS software revealed
two clusters. The highest similarity
coefficient similarity was found between
genotype Mrugnayani chandoshi Mini
sharbati and Vishnu padma chandoshi and
Narmada496 and the genotypes having less
similarity coefficient was between HD 2189
and Agni sharbati.
Single primers were showed polymorphic
bands primer1(80.76 %)primer 3 this could
be attribute the selection of primers,
amplification protocol used genotypes of the
Groundnut accessions and were found to be
best suites for finger printing of wheat germ
plasm and assessing genetic diversity.
Present investigation revealved that RAPD
marker is potentially rapid, simple reliable
and effective method of detecting
polymorphism for assessing genetic
diversity between genotype and these help in
selection of parent for hybridization.

Int.J.Curr.Microbiol.App.Sci (2015) 4(8): 671-694
680
RAPD technique is useful in areas of genetic
diversity and DNA fingerprinting analysis.
As the need to protect proprietary germ
plasm as it is likely to increase in the future,
RAPD will have an important role in
securing a plant variety right by virtue of its
unique efficiency is distinguishing closely
related germ plasm.
II) RAPD analysis with multiple primers
Among RAPD marker primer 5 produce
maximum number of bands i.e. 66 in all
wheat variety followed by primer 1 and
primer 3 generated maximum number of
bands 52 and 26 while RAPD marker primer
4 and primer 8 generated minimum number
of bands in the genomic pool.
In primer 1 Agni sharbati and Narmada 496
variety gave more amplification than other
variety 37 polymorphic bands were present.
The polymorphic percentage of primer 1,
primer 3,primer 4,primer 5,primer 8 is
71.15%, 80.76%, 76.92%, 15.15%, 12.5%
respectively according to the table of RAPD
analysis.
Distance matrix analysis: similarity based
on Jaccards coefficient. The genetic
relationship between wheat genotypes was
determined on the basic of Jaccards
coefficient values. The value of similarity
coefficient ranged from 0.056 to 1.155.The
variety HD-2189 and Agni sharbati
represents lowest average similarity
coefficient value is 1.155.The variety loose
lokwan grade 1 and 147 best loose showing
the highly similarity its value 0.056 and high
similarity between Mrugnayani chandosi
and loose sharbati grade 1 whose value is
0.116.
Cluster analysis
A dendrogram was generated by UPGMA
cluster analysis based on 1 Jaccards
similarity coefficient. The cluster analysis
on the basis of coefficient value the
accessions could be divided into two group
A and B i.e. A and B in which cluster a
consist of 10 genotypes and B consists of 1
genotypes.
The cluster A divided into two sub cluster
i.e A1 and A2.The cluster A1 consists of sub
groups.A1a and A1b in that A1 has 9
genotypes and A1a consist of 7 genotypes
which Mrugnayani chandoshi and loose
sharbati grade 1 are closely related with
Hathi sharbati,Mini sharbati,standard,147
best loose and loose lokwan grade 1.
In which the A1b Narmada 496.Vishnu
padma chandosi these two variety are
closely related with each other. The cluster
B is also having single genotype HD-2189.
RAPD markers were used to study the DNA
fingerprinting of 11 wheat variety. Five
primers were used having its accession
no.(AM765819), (AM773310),
(AM773769), (AM773770), (AM773773),
Amplification of genomic DNA of 11
genotypes using RAPD primers yielded 173
fragments that could be scored of which 80
were polymorphic bands. Percentage of
polymorphism was calculated for eleven
wheat varieties using the 5 primers which
was found to be 46.24%.
The dendrogram obtained from unweighted
pair wise group method for arithmetic mean
of cluster analysis using Jaccards similarity
matrix through NTSYS software revealed
two clusters. The highest similarity
coefficient similarity was found between
genotypes Mrugnayani chandosi,loose
sharbati grade 1 and Narmada 496.Vishnu
padma chandosi. The genotypes having less
similarity coefficient was HD 2189 and
Agni sharbati.
Five primers were showed polymorphic
bands primer 1(71.05%), primer 3(80,76%),

Int.J.Curr.Microbiol.App.Sci (2015) 4(8): 671-694
681
primer 4(76.925), primer 5 (15.15%) and
primer 8(12.5%) this could be attributed to
the selection of primers amplification
protocol used the genotypes wheat and were
found to be best suited for fingerprinting of
wheat germ-plasm and assessing genetic
diversity.
RAPD marker is simple rapid reliable and
effective method of detecting polymorphism
for assessing genetic diversity between
genotypes and these help in the selection of
parent for hybridization. RAPD technique is
useful in area of genetic diversity and DNA
fingerprinting analysis as the need to protect
proprietary germ plasm as it is likely to
increase in the future RAPD will have an
important role in securing a plant variety
right by virtue of its unique efficiency in
distinguishing closely related germ plasm.
Table 1
Analysis of wheat variety

Int.J.Curr.Microbiol.App.Sci (2015) 4(8): 671-694
682
RAPD analysis table
Image of DNA isolation
RNA contamination
Pure DNA Band
Fig.1 DNA isolation
Bigger circle from right indicates the contamination Of RNA
Smaller circle indicates the pure DNA band.
Int.J.Curr.Microbiol.App.Sci (2015) 4(8): 671-694
683
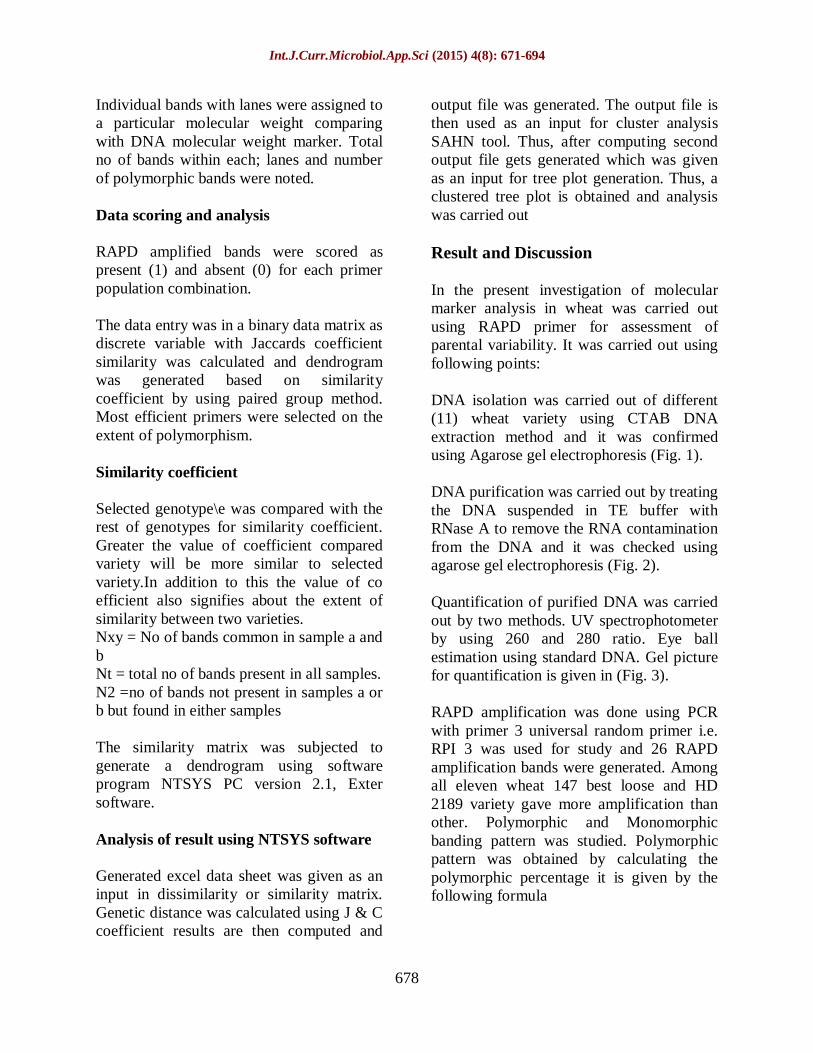
Image of DNA purification
RNA band
DNA band
Fig.2 DNA purification The smaller band indicates the presence of pure DNA band
The bigger circle indicates the presence of contamination of RNA.
Image of DNA Quantification
Pure DNA bands
Standard DNA
Fig. DNA quantification
The upper circle indicates the presence of standard DNA
The lower circle indicates the presence of pure DNA bands.

Int.J.Curr.Microbiol.App.Sci (2015) 4(8): 671-694
684
RAPD Analysis
DNA LADDER
Monomorphic band
Fig. RAPD analysis
The right side circle indicates the presence of DNA ladder
The next circle indicates the presence of monomorphic DNA bands.
Report generate
Primer 3 Report 1
Simgend: NTSYSpc 2.21o, (C) 1986-2011, Applied Biostatistics Inc.
Date & time: 03/01/2013 3:55:28 PM
----------------------------------------
Input parameters
Read input from file: C:\Documents and Settings\MGMIBT\Desktop\vikas and sachin d.xlsx
Compute by: cols
Save results in output file: C:\Documents and Settings\MGMIBT\Desktop\vikas n sachin
output.NTS
Coefficient: J&C
Reading spreadsheet: Sheet1
Comments:
Matrix type = 1, size = 12 by 11, missing value code = "none" (rectangular)
Genetic distance matrix (11 by 11) saved in file: C:\Documents and
Settings\MGMIBT\Desktop\vikas n sachin output.NTS
Ending date & time: 03/01/2013 3:55:28 PM
Report 2
SAHN: NTSYSpc 2.21o, (C) 1986-2011, Applied Biostatistics Inc.
Date & time: 03/01/2013 4:01:07 PM
----------------------------------------
Input parameters
Int.J.Curr.Microbiol.App.Sci (2015) 4(8): 671-694
685
Read input from file: C:\Documents and Settings\MGMIBT\Desktop\vikas n sachin output.NTS
Save result tree in output file: C:\Documents and Settings\MGMIBT\Desktop\vikas n sachin
output 2.NTS
Clustering method: UPGMA
In case of ties: find all tied trees
Max. no. tied trees: 25
Comments:
SIMGEND[2.21o]: input=C:\Documents and Settings\MGMIBT\Desktop\vikas and sachin
d.xlsx, coeff=J&C, dir=cols
Matrix type = 2, size = 11 by 11, missing value code = "none" (dissimilarity)
Results will be stored in file: C:\Documents and Settings\MGMIBT\Desktop\vikas n sachin
output 2.NTS
Searching for all tied trees
Solution tree number 1
Sorting tree nodes. ..
none needed.
Solution tree number 2
Sorting tree nodes. ..
done.
Solution tree number 3
Sorting tree nodes. ..
done.
Solution tree number 4
Sorting tree nodes. ..
done.
Solution tree number 5
Sorting tree nodes. ..
done.
Solution tree number 6
Sorting tree nodes. ..
done.
Solution tree number 7
Sorting tree nodes. ..
none needed.
Solution tree number 8
Sorting tree nodes. ..
done.
Solution tree number 9
Sorting tree nodes. ..
done.
Solution tree number 10
Sorting tree nodes. ..
done.
Solution tree number 11
Sorting tree nodes. ..
done.

Int.J.Curr.Microbiol.App.Sci (2015) 4(8): 671-694
686
Solution tree number 12
Sorting tree nodes. ..
done.
Solution tree number 13
Sorting tree nodes. ..
done.
Solution tree number 14
Sorting tree nodes. ..
done.
Solution tree number 15
Sorting tree nodes. ..
done.
A total of 15 tied trees were found
written to file: C:\Documents and Settings\MGMIBT\Desktop\vikas n sachin output 2.NTS
(note: some trees may be duplicates)
Report 3
matrix(11objects)savedinfile:C:\Documentsand Settings\MGMIBT\Desktop\vikas n sachin
output 2.NTS
matrix(11objects)savedinfile:C:\Documentsand Settings\MGMIBT\Desktop\vikas n sachin
output 2.NTS
matrix(11objects)savedinfile:C:\Documentsand Settings\MGMIBT\Desktop\vikas n sachin
output 2.NTS
matrix(11objects)savedinfile:C:\Documentsand Settings\MGMIBT\Desktop\vikas n sachin
output 2.NTS
matrix(11objects)savedinfile:C:\Documentsand Settings\MGMIBT\Desktop\vikas n sachin
output 2.NTS
matrix(11objects)savedinfile:C:\Documentsand Settings\MGMIBT\Desktop\vikas n sachin
output 2.NTS
matrix(11objects)savedinfile:C:\Documentsand Settings\MGMIBT\Desktop\vikas n sachin
output 2.NTS
matrix(11objects)savedinfile:C:\Documentsand Settings\MGMIBT\Desktop\vikas n sachin
output 2.NTS
matrix(11objects)savedinfile:C:\Documentsand Settings\MGMIBT\Desktop\vikas n sachin
output 2.NTS
matrix(11objects)savedinfile:C:\Documentsand Settings\MGMIBT\Desktop\vikas n sachin
output 2.NTS
matrix(11objects)savedinfileC:\Documents and Settings\MGMIBT\Desktop\vikas n sachin
output 2.NTS
matrix(11objects)savedinfile:C:\Document and Settings\MGMIBT\Desktop\vikas n sachin
output 2.NTS
matrix(11objects)savedinfile:C:\Document and Settings\MGMIBT\Desktop\vikas n
sachin output 2.NTS
matrix(11objects)savedinfile:C:\Document and Settings\MGMIBT\Desktop\vikas n sachin
output 2.NTS
matrix(11objects)savedinfile:C:\Document and Settings\MGMIBT\Desktop\vikas n sachin
output 2.NTS
Int.J.Curr.Microbiol.App.Sci (2015) 4(8): 671-694
687
Ending date & time: 03/01/2013 4:01:07 PM
B1
Tree generation with primer 3 using 11 wheat varieties (UPGMA method)
B2
B
Fig. Tree generation with primer 3 using 11 wheat varieties (UPGMA method)
Distance matrix
Fig. Distance Matrix table

Int.J.Curr.Microbiol.App.Sci (2015) 4(8): 671-694
688
Result for primer 1
Polymorphic band
DNA ladder
Monomorphic band
Fig.RAPD using primer 1
The first cicle of right side indicates the presence of monomorphic bands
The centre circle indicates the presence of polymorphic band
The next circle indicates the presence of DNA ladder.
Result for Primer 3
Polymorphic Band
DNA Ladder
Monomorphic band
Fig.RAPD using primer 3
The right side band indicates the presence of DNA ladder
The centre circle indicates the presence of Polymorphic band
The arrow indicates the presence of Monomorphic band.

Int.J.Curr.Microbiol.App.Sci (2015) 4(8): 671-694
689
Result for Primer 4
Polymorphic DNA
Monomorphic DNA
DNA LADDER
Fig.RAPD using primer 4
The right circle indicated the presence of DNA ladder
The middle circle indicates the presence of polymorphic band.
The next circle indicates the presence of monomorphic band.
Result for Primer 5
Polymorphic band
Monomorphic band
DNA Ladder
Fig.RAPD using primer 5

Int.J.Curr.Microbiol.App.Sci (2015) 4(8): 671-694
690
The arrow represents the DNA ladder
The first circle indicates the presence of polymorphic band
The second circle indicates the presence of monomorphic band.
Result for Primer 8
Polymorphic band
Monomorphic band
DNA ladder
Fig.RAPD using primer 8
The arrow indicates the presence of DNA ladder
The Centre circle indicates the presence of Polymorphic band
The right circle indicates the presence of Monomorphic band.
Report 1
Simgend: NTSYSpc 2.21o, (C) 1986-2011, Applied Biostatistics Inc.
Date & time: 03/08/2013 10:27:35 AM
Input parameters
Read input from file: C:\Documents and Settings\MGMIBT\My Documents\excel
file of p1-p4.xlsx
Compute by: cols
Save results in output file: C:\Documents and Settings\MGMIBT\My
Documents\file of p1-p4 output.NTS
Coefficient: J&C
Reading spreadsheet: Sheet1
Comments:
Matrix type = 1, size = 56 by 11, missing value code = "none" (rectangular)
Genetic distance matrix (11 by 11) saved in file: C:\Documents and
Settings\MGMIBT\My Documents\file of p1-p4
output.NTS

Int.J.Curr.Microbiol.App.Sci (2015) 4(8): 671-694
691
Ending date & time: 03/08/2013 10:27:35 AM
Report 2
SAHN: NTSYSpc 2.21o, (C) 1986-2011, Applied Biostatistics Inc.
Date & time: 03/08/2013 10:29:58 AM
Input parameters
Read input from file: C:\Documents and Settings\MGMIBT\My Documents\fileof
p1-p4 output.NTS
Save result tree in output file: C:\Documents and Settings\MGMIBT\My
Documents\file of p1-p5 output 2.NTS
Clustering method: UPGMA
In case of ties: find all tied trees
Max. no. tied trees: 25
Comments:
SIMGEND[2.21o]: input=C:\Documents and Settings\MGMIBT\My
Documents\excel file of p1-p4.xlsx, coeff=J&C,
dir=cols
Matrix type = 2, size = 11 by 11, missing value code = "none" (dissimilarity)
Results will be stored in file: C:\Documents and Settings\MGMIBT\My
Documents\file of p1-p5 output 2.NTS
Searching for all tied trees
Solution tree number 1
Sorting tree nodes. ..
none needed.
Solution tree number 2
Sorting tree nodes. ..
done.
A total of 2 tied trees were found
written to file: C:\Documents and Settings\MGMIBT\My Documents\file of p1p5
output 2.NTS
(note: some trees may be duplicates)
matrix (11 objects) saved in file: C:\Documents and Settings\MGMIBT\My
Documents\file of p1-p5 output 2.NTS
matrix (11 objects) saved in file: C:\Documents and Settings\MGMIBT\My
Documents\file of p1-p5 output 2.NTS
Ending date & time: 03/08/2013 10:29:58 AM
Report 3
Tree: NTSYSpc 2.21o, (C) 1986-2011, Applied Biostatistics Inc.
Input parameters
Read input from file: C:\Documents and Settings\MGMIBT\My Documents\
fileof
p1-p5 output 2.NTS
Comments:

Int.J.Curr.Microbiol.App.Sci (2015) 4(8): 671-694
692
SIMGEND[2.21o]: input=C:\Documents and Settings\MGMIBT\My
Documents\excel file of p1-p4.xlsx, coeff=J&C,
dir=cols
SAHN[2.21o]: input=C:\Documents and Settings\MGMIBT\My Documents\fil of
p1-p4 output.NTS,
method=UPGMA, tie=FIND
Solution tree number 1
Matrix type = 5, size = 11 by 2, missing value code = "none" (tree (dissimilarity))---
- next dataset ----
Comments:
SIMGEND [2.21o]: input=C:\Documents and Settings\MGMIBT\My
Documents\excel file of p1-p4.xlsx, coeff=J&C,
dir=cols
SAHN [2.21o]: input=C: \Documents and Settings\MGMIBT\My Documents\file of
P1-p4 output.NTS,
Method=UPGMA, tie=FIND
Solution tree number 2
Matrix type = 5, size = 11 by 2, missing value code = "none” (tree (dissimilarity))
Ending date & time: 03/08/2013 10:31:01 AM
Final Tree generated
A1a.22
A1a.1
A1b
A2
B
A
A1
A1a

Int.J.Curr.Microbiol.App.Sci (2015) 4(8): 671-694
693
Distance matrix table generation by J & C co-efficient
Fig. Distance Matrix table

Int.J.Curr.Microbiol.App.Sci (2015) 4(8): 671-694
694
References
Boardman, N.K. 1980. Energy from the
biological conversion of solar energy.
Phil. Trans. R. Soc. London A
295:477–489.
Briggle, L.W. 1980. Introduction to energy
use in wheat production. p. 109–116.
In: Pimenter, D. (ed.), Handbook of
energy utilization inagriculture.
CRC Press, Inc. Boca Raton, FL.
Briggle, L.W. 1981. Wheat. Triticum
aestivum. p. 67–70. In: McClure, T.A.
and Lipinsky, E.S. (eds.), CRC
handbook of biosolar resources. Vol.
11. Resource materials. CRC Press,
Inc. Boca Raton, FL.
C.S.I.R. (Council of Scientific and Industrial
Research). 1948–1976. The wealth of
India. 11 vols. New Delhi.
Dibb, D.W. 1983. Agronomic systems to
feed the next generation. Crops and
Soils Mag. (Nov):5–6.
Duke, J.A. 1978. The quest for tolerant
germplasm. p. 1–61. In: ASA Special
Symposium 32, Crop tolerance to
suboptimal land conditions. Am. Soc.
Agron. Madison, WI.
Duke, J.A. 1981b. The gene revolution.
Paper 1. p. 89–150. In: Office of
Technology Assessment, Background
papers for innovative biological
technologies for lesser developed
countries. USGPO. Washington.
Duke, J.A. and Wain, K.K. 1981. Medicinal
plants of the world. Computer index
with more than 85,000 entries. 3 vols.
Gohl, B. 1981. Tropical feeds. Feed
information summaries and nutritive
values. FAO Animal Production and
Health Series 12. FAO, Rome.
Hartwell, J.L. 1967–1971. Plants used
against cancer. A survey. Lloydia 30–
34.
Jenkins, B.M. et al., 1985. Thermo chemical
properties of biomass fuels. Calif.
Agric. 39(5/6):14–16.
Kvech, O. 1979. The importance of crop
residues in rotations of an intense
farming system. Rostlinna Vyroba
25(10):1013–1022.
Palz, W. and Chartier, P. (eds.). 1980.
Energy from biomass in Europe.
Applied Science Publishers Ltd.,
London. 14. Reed, C.F. 1976.
Information summaries on 1000
economic plant Typescripts submitted
to the USDA.
Stewart, G.A., Gartside, G., Gifford, R.M.,
Nix, H.A., Rawlins, W.H.M.,and
Siemon, J.R. 1979. The potential for
liquid fuels from agriculture and
forestry in Australia. CSIRO.
Alexander Bros., Mentone, Victoria,
Australia.