Assessment of Fruit and Vegetable Dealers Awareness about ... · fruit and vegetable dealer’s...
19
International Journal of Scientific and Research Publications, Volume 7, Issue 12, December 2017 509 ISSN 2250-3153 www.ijsrp.org Assessment of Fruit and Vegetable Dealers Awareness about Lead Contamination at Bahri Locality, Khartoum North Nagwa B. Elhag 1 , Somiya Gutbi Salim Mohammed 2 1 Assistant Professor, Department of Food Hygiene and Safety, College of Public & Environmental Health, University of Bahri, Khartoum North, Sudan. 2 Associate professor, Department of Epidemiology, College of Public &Environmental Health, University of Bahri, Khartoum North, Sudan. Abstract: Fresh fruits and vegetables are rich in vitamins, minerals, mineral salts, proteins, carbohydrates and fiber. All these nutrients are very essential for health maintenance and diseases prevention. Also they play an important role in neutralizing acidic substances produced during digestion. These products will be used either fresh or for culinary purposes. Recently, fruits and vegetables free of heavy metals contamination have a great concern by the consumers worldwide. Long-term use of contaminated fruits and vegetables with lead will be a health threats for humans. Thus the aim of this research is to assess fruit and vegetable dealer’s awareness about lead contamination at the areas of heavy traffic density at Bahri locality in Khartoum North. Descriptive systematic method used for the assessment. The study was based on the primary data collected from 150 fruit and vegetables sellers using structured questionnaire. The age group of 21-40 recorded the highest percent (58%). Results showed that most of the respondents (73.3%) received medium to low level of education and the illiteracy level among them was 24.7%. All interviewees displayed their products uncovered to the street on the shelves, tables ground, in wooden boxes, carton and plastic boxes near heavy traffic areas. They did not have special place for fruits and vegetables storage at their places. More than third (37.3%) of the participants re-displayed the remaining fruits and vegetables in the next day. Generally, all fruit and vegetable vendors had a poor knowledge about hygienic practices and procedures that followed during displaying and selling of their products. The majority (98.7%) of them they did not know anything about fruits and vegetables contamination with lead. However, there were no regulations to control fruits and vegetables displaying and selling. These products are exposed to the pollution at the areas of heavy traffic and are considered as a potentially health hazards for the consumers. Long consumption may lead to the accumulation of this element and then death. Therefore, food regulations should prohibit selling and displaying of foods in such areas. Health education lectures are recommended to increase fruit and vegetable sellers’ awareness. Keywords: Bahri locality, Fruits and vegetables, Khartoum North, Lead, Heavy Metals. Introduction Fruits and vegetables are nutritious products that enhance human health and it can be used to improve soup quality particularly leafy vegetables (Sobukola et al., 2010). Heavy metals are dangerous contaminants resulted in a great risk of health due to their bioaccumulation in human body (Bhagure and Mirgane, 2010). Generally, heavy metals are not biodegradable substances, have long biological half-lives, and have a potential effect on human body due to their accumulation in different body organs, leading to serious health problems (Järup, 2003; Sathawara et al., 2004). Different plants parts absorb heavy metals from air in polluted environments as
Transcript of Assessment of Fruit and Vegetable Dealers Awareness about ... · fruit and vegetable dealer’s...

International Journal of Scientific and Research Publications, Volume 7, Issue 12, December 2017 509 ISSN 2250-3153
www.ijsrp.org
Assessment of Fruit and Vegetable Dealers Awareness about Lead Contamination at Bahri Locality, Khartoum
North Nagwa B. Elhag1, Somiya Gutbi Salim Mohammed2
1Assistant Professor, Department of Food Hygiene and Safety,
College of Public & Environmental Health, University of Bahri, Khartoum North, Sudan. 2Associate professor, Department of Epidemiology, College of Public &Environmental Health,
University of Bahri, Khartoum North, Sudan.
Abstract: Fresh fruits and vegetables are rich in vitamins, minerals, mineral salts, proteins, carbohydrates and fiber. All these
nutrients are very essential for health maintenance and diseases prevention. Also they play an important role in neutralizing acidic
substances produced during digestion. These products will be used either fresh or for culinary purposes. Recently, fruits and
vegetables free of heavy metals contamination have a great concern by the consumers worldwide. Long-term use of contaminated
fruits and vegetables with lead will be a health threats for humans. Thus the aim of this research is to assess fruit and vegetable
dealer’s awareness about lead contamination at the areas of heavy traffic density at Bahri locality in Khartoum North. Descriptive
systematic method used for the assessment. The study was based on the primary data collected from 150 fruit and vegetables sellers
using structured questionnaire. The age group of 21-40 recorded the highest percent (58%). Results showed that most of the
respondents (73.3%) received medium to low level of education and the illiteracy level among them was 24.7%. All interviewees
displayed their products uncovered to the street on the shelves, tables ground, in wooden boxes, carton and plastic boxes near heavy
traffic areas. They did not have special place for fruits and vegetables storage at their places. More than third (37.3%) of the
participants re-displayed the remaining fruits and vegetables in the next day. Generally, all fruit and vegetable vendors had a poor
knowledge about hygienic practices and procedures that followed during displaying and selling of their products. The majority
(98.7%) of them they did not know anything about fruits and vegetables contamination with lead. However, there were no regulations
to control fruits and vegetables displaying and selling. These products are exposed to the pollution at the areas of heavy traffic and are
considered as a potentially health hazards for the consumers. Long consumption may lead to the accumulation of this element and
then death. Therefore, food regulations should prohibit selling and displaying of foods in such areas. Health education lectures are
recommended to increase fruit and vegetable sellers’ awareness.
Keywords: Bahri locality, Fruits and vegetables, Khartoum North, Lead, Heavy Metals.
Introduction
Fruits and vegetables are nutritious products that enhance human health and it can be used to improve soup quality particularly leafy
vegetables (Sobukola et al., 2010). Heavy metals are dangerous contaminants resulted in a great risk of health due to their
bioaccumulation in human body (Bhagure and Mirgane, 2010). Generally, heavy metals are not biodegradable substances, have long
biological half-lives, and have a potential effect on human body due to their accumulation in different body organs, leading to serious
health problems (Järup, 2003; Sathawara et al., 2004). Different plants parts absorb heavy metals from air in polluted environments as

International Journal of Scientific and Research Publications, Volume 7, Issue 12, December 2017 510 ISSN 2250-3153
www.ijsrp.org
well as from contaminated soils through roots. Water used for irrigation may contaminate fruits and vegetables with heavy metals (Al
Jassir et al., 2005).
Lead is wildly distributed in different habitats due to the increase of population activities, the application of new technologies,
industrial and urban areas where it can be introduced into food items from different sources. These sources include petrol containing
alkalyl which combusted and emitted into the atmosphere causing contamination in roadside, soil and air (Fernandes et al., 2000;
Beavington et al., 2004). Moreover, manufacturing processes, incineration of refuse and combustion of coal considered as another
sources of environments pollution. Age, sex, route of exposure, level of intake, solubility, metal oxidation state, retention percentage,
duration of exposure, frequency of intake, absorption rate as well as the mechanisms and efficiency of excretion determine lead
toxicity and its effect (Mertz, 1986). In addition, the inhalation of lead can permanently lower intelligence quotients (IQ), damage
emotional stability, cause hyperactivity, poor school performance and hearing loss (Goyer, 1996).
Fruits and vegetables are safety for human consumption but the consumption of fruits and vegetables contaminated with lead for a
long time will lead to the accumulation of these hazards in human bodies and it results in serious health problems. Accumulation of
lead in edible plant products has been reported by many researchers. In Tika in Kenya, vegetables grown in urban areas revealed
higher levels of lead, zinc and cadmium than that established by World Health Organization Standard (Inoti et al., 2012). Another
study conducted by Elbagermi et al., (2012) who found that fruits and vegetables samples collected from different areas in Misurata in
Libya contained measurable level of heavy metals within the permissible level set by WHO1999. Zied (2010) reported that lead can
be found everywhere in the environment and the long exposure to lead is an important health concern worldwide. Also he revealed
that lead can reach all food items through air, water, soil, during cultivation, processing and packaging.
In Sudan, few researches about vended foods e.g. fruits and vegetables contaminated with lead were conducted. Ehsan (2003) found
that 76.19% of vended food investigated samples were contaminated with Lead (Pb). She claimed that 38.10% of the examined
samples had higher level of lead than in other foods. Fruits and vegetables are very essential food items for health maintenance and
diseases prevention for both children and adults. Sudanese food vendors and hawkers like other vendors in developing countries. Most
of them display food products near heavy traffic areas (Plate 1, 2, 3). They have a poor knowledge, poor hygienic practices and lack
of awareness about food contamination from different sources. Assessment of awareness data about food items contaminated with
lead in Sudan is not available; therefore the aim of this research is to assess the awareness of vendors and hawkers about fruits and
vegetables contamination with lead in area of heavy traffic.
Materials and Methods
Study area
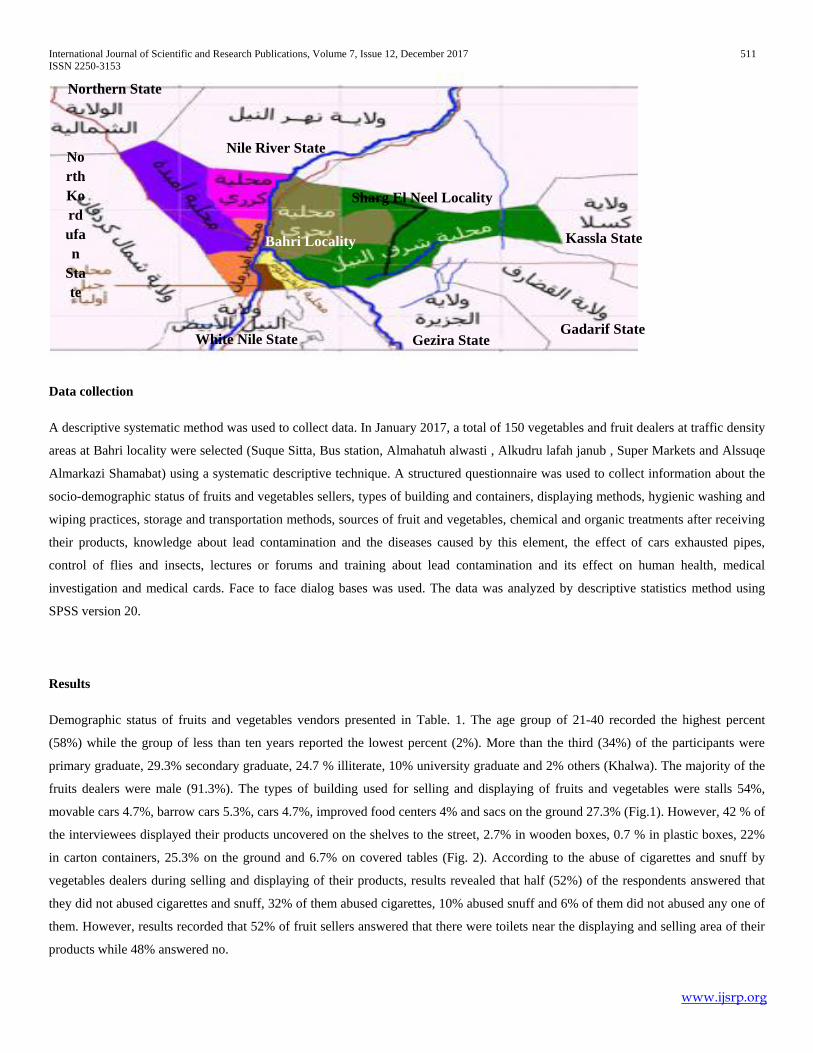
This study was conducted at Bahri locality which located at the Northern part of Khartoum State at altitudes 8-15 and longitudes 24-
25 and 31-16. It bordered with Nile State from the North, Blue Nile State from the South, Sharg El Neel locality from the East and the
Nile River from the West. The estimated area is 455907Km2 with total population of 9040749. The main activities of the residents at
this area are the agriculture and industrial activities beside the other economical activities. It composed of 10 administrative units
including Bahri El Kubra, Bahri Shreg, El Safia, Halfiat El Mulook, El Sambrab, Drdoug, Droasahb, El Kadro, El Selate and El Jili
unit.
International Journal of Scientific and Research Publications, Volume 7, Issue 12, December 2017 511 ISSN 2250-3153
www.ijsrp.org
Data collection
A descriptive systematic method was used to collect data. In January 2017, a total of 150 vegetables and fruit dealers at traffic density
areas at Bahri locality were selected (Suque Sitta, Bus station, Almahatuh alwasti , Alkudru lafah janub , Super Markets and Alssuqe
Almarkazi Shamabat) using a systematic descriptive technique. A structured questionnaire was used to collect information about the
socio-demographic status of fruits and vegetables sellers, types of building and containers, displaying methods, hygienic washing and
wiping practices, storage and transportation methods, sources of fruit and vegetables, chemical and organic treatments after receiving
their products, knowledge about lead contamination and the diseases caused by this element, the effect of cars exhausted pipes,
control of flies and insects, lectures or forums and training about lead contamination and its effect on human health, medical
investigation and medical cards. Face to face dialog bases was used. The data was analyzed by descriptive statistics method using
SPSS version 20.
Results
Demographic status of fruits and vegetables vendors presented in Table. 1. The age group of 21-40 recorded the highest percent
(58%) while the group of less than ten years reported the lowest percent (2%). More than the third (34%) of the participants were
primary graduate, 29.3% secondary graduate, 24.7 % illiterate, 10% university graduate and 2% others (Khalwa). The majority of the
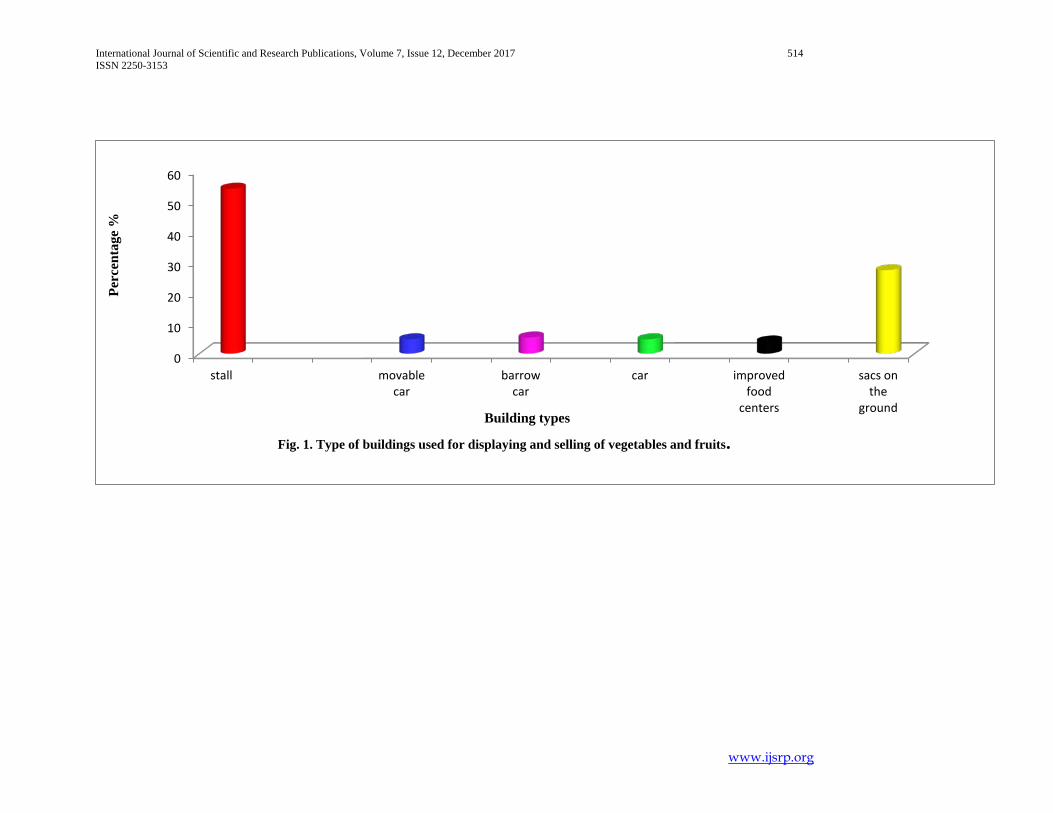
fruits dealers were male (91.3%). The types of building used for selling and displaying of fruits and vegetables were stalls 54%,
movable cars 4.7%, barrow cars 5.3%, cars 4.7%, improved food centers 4% and sacs on the ground 27.3% (Fig.1). However, 42 % of
the interviewees displayed their products uncovered on the shelves to the street, 2.7% in wooden boxes, 0.7 % in plastic boxes, 22%
in carton containers, 25.3% on the ground and 6.7% on covered tables (Fig. 2). According to the abuse of cigarettes and snuff by
vegetables dealers during selling and displaying of their products, results revealed that half (52%) of the respondents answered that
they did not abused cigarettes and snuff, 32% of them abused cigarettes, 10% abused snuff and 6% of them did not abused any one of
them. However, results recorded that 52% of fruit sellers answered that there were toilets near the displaying and selling area of their
products while 48% answered no.
Nile River State
Kassla State
Gadarif State Gezira State White Nile State
Northern State
North Kordufan
State
Bahri Locality
Sharg El Neel Locality

International Journal of Scientific and Research Publications, Volume 7, Issue 12, December 2017 512 ISSN 2250-3153
www.ijsrp.org
Regarding the hygienic washing and wiping practices, results showed that 58.7% of the fruits and vegetables vendors answered that
there was no specific places for hands washing and all of them washed their hands before touching fruits and vegetables. Additionally,
the majority (98%) of them answered that they washed their hands after using toilets. With regards to the washing methods of the
fruits and vegetables, 47.3% of the participants washed fruits and vegetables once, 12.7% two times, 6.7% three times and 4% washed
them more than three times. Fifty eight of the interviewees used water public network for washing their fruits and vegetables.
Generally, more than third (37.3%) of the fruits and vegetables dealers wiped these products with clean cloths, 2% used clean cloth
and oil for wiping, 1.3% used piece of cloth that used to clean serving tables, 0.1% used handkerchief and 16% used others ways as
wiping with their hands and their clothes (Table 2). All fruits and vegetables vendors and hawkers did not have a uniform for selling
their products.
Results reported in Fig 3 shows the types of containers that used for fruits and vegetables washing. The majority (90%) of the
respondents used plastic containers for washing, 8% of them used metal containers and 2% used wooden containers.
As it can be observed from the results, 51.3% obtained their fruits and vegetables from local market, 38% Wholesales, 7% from farm
and 3% from refrigerator (Table 3). Survey claimed that 3.3% of the participants used organic compounds to treat fruits and
vegetables that purchased from farms, 2% of them used chemical substance and 2% answered that they did not know. However, most
of the fruits and vegetables dealers (69.3%) answered that they did not store their products; while 30.7% answered that they stored
them. The storage methods followed by sellers recorded that 6% of them stored their fruits and vegetables uncovered at the ordinary
room, 6.7% in the refrigerator, 4% on the table, 2.7% in carton, 9.3% in packages and 2% in plastic sacks (Table 3).
Table 1. Demographic status of fruits and vegetables dealers.
Age
Age group Frequency Percentage
less than 10 year 3 2.0
11-20 years 22 14.7
21- 40 year 87 58.0
more than 40 38 25.3
Total 150 100.0
Education level
Education level Frequency Percentage
Illiterate 37 24.7
Primary 51 34.0
Secondary 44 29.3
University 15 10.0
Others 3 2.0
Total 150 100.0
Sex Gender Frequency Percentage

International Journal of Scientific and Research Publications, Volume 7, Issue 12, December 2017 513 ISSN 2250-3153
www.ijsrp.org
Female 13 8.7 Male 137 91.3 Total 150 100.0
International Journal of Scientific and Research Publications, Volume 7, Issue 12, December 2017 514 ISSN 2250-3153
www.ijsrp.org
0
10
20
30
40
50
60
stall movable car
barrow car
car improved food
centers
sacs on the
ground
Perc
enta
ge %
Building types
Fig. 1. Type of buildings used for displaying and selling of vegetables and fruits.

International Journal of Scientific and Research Publications, Volume 7, Issue 12, December 2017 515 ISSN 2250-3153
www.ijsrp.org
0
10
20
30
40
50
on shelves
displayed to the street
in wooden
boxes
in plastic boxes on
the street
in carton on the street
on a covered tables
on the ground on the street
Perc
enta
ge %
types of containers
Fig. 2 .Types of containers for displaingy and selling of fruits and vegetables.

International Journal of Scientific and Research Publications, Volume 7, Issue 12, December 2017 516 ISSN 2250-3153
www.ijsrp.org
Table. 2. Hygienic washing and wiping practices of hands, fruits and vegetables. Specific place for hand washing
Answers Frequency Percentage % Yes 62 41.3 No 88 58.7 Total 150 100.0
Do you wash your hands after using toilet? Answers Frequency Percentage
Yes 147 98.0 No 3 2.0 Total 150 100.0
Do you wash your hand before dealing with vegetables and fruits? Answers Frequency Percentage
Yes 150 100.0
If the answer is yes. how do you wash your hands? Method of washing Frequency Percentage
only with water 147 98.0 with water and soap 3 2.0 Total 150 100.0
Do you wash fruits and vegetables before selling? Answers Frequency Percentage
Yes 106 70.7 No 44 29.3 Total 150 100.0
How many times do you wash them? Times Frequency Percentage
Once 71 47.3 two times 19 12.7 Three times 10 6.7 more than three times 6 4.0 Missing 44 29.3 Total 150 100.0

International Journal of Scientific and Research Publications, Volume 7, Issue 12, December 2017 517 ISSN 2250-3153
www.ijsrp.org
Con. Table. 2. Hygienic washing and wiping practices of hands, fruits and vegetables. Sources of washing water
Source Frequency Percentage
Water network 87 58.0 Water stored in barrels 34 22.7 Missing 29 19.3 Total 150 100.0
Do you wipe fruits and vegetables at your shop? Methods of wiping Frequency Percentage %
clean piece of clothes 56 37.3 clean clothes+ oil 3 2.0 clean clothes that used to clean the serving tables
2 1.3
Handkerchief 1 0.7 Others 24 16.0 Missing 64 42.7 Total 150 100.0
Metal 8%
0% wooden 2%
0%
Plastic 90%
Fig. 3. Types of containers used for fruits and vegetables washing.

International Journal of Scientific and Research Publications, Volume 7, Issue 12, December 2017 518 ISSN 2250-3153
www.ijsrp.org
Table. 3. Sources, treatment with chemical compounds, storage and transportation of fruits and vegetables.
Fruits and vegetables sources Source Frequency Percentage
Farm 11 7.3
Wholesales 57 38.0
local markets 77 51.3
Refrigerator 5 3.3
Total 150 100.0 If the answer is from the farm, do they treat their products with chemicals or organic materials?
Answer Frequency Percentage
Chemical 3 2.0
Organic materials 5 3.3
I do not know 2 1.3
Total 10 6.7
Missing 140 93.3
Total 150 100.0
If the answer is wholesales trader are fruits and vegetables stored or directly transported from the farm? Answer Frequency Percentage
Stored 29 19.3
Directly transported from farm 30 20.0
Missing 91 60.7
Total 150 100.0

International Journal of Scientific and Research Publications, Volume 7, Issue 12, December 2017 519 ISSN 2250-3153
www.ijsrp.org
Con. Table. 3. Sources, treatment with chemical compounds, storage and transportation of fruits and vegetables.
Do you store vegetable Answer Frequency Percentage
Yes 46 30.7
No 104 69.3
Total 150 100.0 How vegetables are stored in your place
Storage Frequency Percentage
Ordinary room 9 6.0
Refrigerators 10 6.7
On tables 6 4.0
In cartons 4 2.7
Packages 14 9.3
In plastic sacks 3 2.0
Missing 104 69.3
Total 150 100.0
How the vegetables are transported from the source Transported Frequency Percentage
Uncovered cars 110 73.3
Covered car 30 20.0
Freezing refrigerators 3 2.0
Rickshaw 7 4.7
Total 150 100.0

International Journal of Scientific and Research Publications, Volume 7, Issue 12, December 2017 520 ISSN 2250-3153
www.ijsrp.org
With respect to the selling and rejection of fruits and vegetables, results recorded that 66.7% of fruits and
vegetables dealers answered yes that they consumed and sold the whole quantity of fruits and vegetables, 33.3% of
them answered they did not consume the whole quantity of the fruits and vegetables. Generally, 29.3% of them
answered that they stored the remaining fruits and vegetables, while 5.3% of the rejected their products (Table 4).
Regarding the displaying of their products next day, results declared that 37.3% of the participants stored the
remaining products and displayed them next day, while 5.3% of them answered that they did not display the
remaining one. Additionally, 26% of the participants answered that they separated the fresh fruits and vegetables
from the old ones, while 20% of them they did not. More than half (58%) of the respondents get rid of the
remained fruits and vegetables by organized way, 18% they rejected them by the random way on the street and
7.3% of them used the remaining one for the personal consumption.
Results reported in Table.5 reveals the awareness about lead and pesticides contamination. The majority of the the
participants (98.7%) answered that they did not know anything about the pollution of fruits and vegetables with lead
substance. However, all fruits and vegetables venders didn’t know any information about the diseases that caused by
lead and they did not know that cars exhausted pipes will contaminate fruits and vegetables with lead. The majority
(94.7%) of them answered that there was no smell of remaining pesticides in fruits and vegetables, while 5.3% of
them smell the remaining pesticides.
The majority (96.7%) of fruits and vegetables venders did not spray their places with pesticides while 3.3% of them
use pesticides for pest control. Information about legislations that set for hygienic selling and displaying were
presented in Table 6. All fruits and vegetables dealers answered that there was no regulations and lows set to control
selling and displaying. Most of them (77.3%) answered that there was a place for garbage collection and half of
them suffered from flies and insects presents. Additionally, 65.3% of the interviewees had a health card and 34.7%
had not. Generally, results revealed that 60.7% of the participants renewed their cards every six months, 58.7% of
them answered that they did the medical investigation, and14.7% they did not (Table6). However all fruits and
vegetables sellers answered that there was no training about fruits and vegetables hygiene, safety, awareness about
heavy metals contamination and no any sector responsible for this training.
Discussion
Results showed that the aged group of 21-40 years recorded the highest percentage (58%) among fruits and
vegetables sellers, while the group of less than ten years reported the lowest percent (2%) which was higher than
that obtained by Elhaj et al., (2012) who found that the majority of food vendors of age group 21-30 comprises 40%
in Gizan, Saudi Arabia. It is a fact that both knowledge and experience increases with the age. Generally, results
revealed that most of the participants (65.3%) had a low to medium education level, while the illiterate level was
24.7% among them. Similar result obtained by Federal Ministry of Health (2011) who recorded that the most of the
participants (80%) of the Sudanese communities attained low to medium level of education. These findings may be
referred to the socio-economical conditions of the fruits and vegetables handlers. High percent of illiteracy among
the respondents reflected the poor knowledge and awareness about the prober hygienic practices, lead

International Journal of Scientific and Research Publications, Volume 7, Issue 12, December 2017 521 ISSN 2250-3153
www.ijsrp.org
Table. 4. Selling and hygienic rejection of fruits and vegetable.
Do you consume or sell all the available quantity of vegetables and fruits at your place? Answer Frequency Percentage
Yes 100 66.7 No 50 33.3 Total 150 100.0
Do you store the remaining fruits and vegetables or do you reject it? Answer Frequency Percentage
Stored the item 44 29.3 get rid of the item 8 5.3 Missing 98 65.3 Total 150 100.0
If they are stored, how they are stored? Storage Frequency Percentage
ordinary room 18 12.0 Refrigerator 10 6.7 Others 19 12.7 Missing 103 68.7 Total 150 100.0
Are the stored vegetables will be displayed for the next day? Answer Frequency Percentage
Yes 56 37.3 No 8 5.3 Missing 86 57.3 Total 150 100.0
Do you separate the fresh vegetables from old ones? Answer Frequency Percentage
Yes 39 26.0 No 30 20.0 Missing 81 54.0 Total 150 100.0
How do you get rid of the useless fruits and vegetables? Answer Frequency Percentage
In a well-organized way 87 58.0 In random way 27 18.0 Personal consumption 11 7.3 Others 17 11.3 Missing 8 5.3 Total 150 100.0

International Journal of Scientific and Research Publications, Volume 7, Issue 12, December 2017 522 ISSN 2250-3153
www.ijsrp.org
Table.5. Awareness of fruits and vegetables dealers about lead and pesticides pollution.
Do you know anything about fruits and vegetables pollution with lead substance Answer Frequency Percentage
Yes 2 1.3 No 148 98.7 Total 150 100.0
Do you know that lead causes diseases? Answer Frequency Percentage
No 150 100.0
If your answer is yes mention these diseases? Answer Frequency Percentage
Missing 150 100.0
Do you think that cars exhaust pipes contaminate fruits and vegetables with lead/ Answer Frequency Percentage
No 150 100.0
Do you observe any smell of remaining pesticides in fruits and vegetables? Answer Frequency Percentage
Yes 8 5.3 No 142 94.7 Total 150 100.0
Do you spray your place by pesticides? Answer Frequency Percentage
Yes 5 3.3 No 145 96.7 Total 150 100.0

International Journal of Scientific and Research Publications, Volume 7, Issue 12, December 2017 523 ISSN 2250-3153
www.ijsrp.org
Table.6. Legislations and laws set for hygienic selling of fruits and vegetables.
Are there any regulations and laws to control fruits and vegetables selling? Answer Frequency Percentage
No 150 100.0 Are there any places for garbage collection?
Answer Frequency Percentage Yes 116 77.3 No 34 22.7 Total 150 100.0
Do you have a health card? Answer Frequency Percentage
Yes 98 65.3 No 52 34.7 Total 150 100.0
If the answer is yes do you renew it every six months? Answer Frequency Percentage
Yes every six months 91 60.7 No 20 13.3 Every year 39 26.0 Total 150 100.0
Is there a periodic medical check Answer Frequency Percentage
Yes 88 58.7 No 22 14.7 Missing 40 26.7 Total 150 100.0

International Journal of Scientific and Research Publications, Volume 7, Issue 12, December 2017 524 ISSN 2250-3153
www.ijsrp.org
contamination and their effect on human health. Moreover, 42 % of the respondents displayed their products on the
shelves to the street in wooden boxes, in plastic boxes, in carton, on the ground and on covered tables. The way of
displaying these products may enhance the absorption of Pb from polluted air on the side road of heavy traffic. High
percentage (32%) of the respondents abusing cigarettes also may contaminate the air inside the shops and lead to the
products contamination. Levels of lead in indoor air are affected by the presence of cigarette smoke (Reilly, 1980).
The presence of toilet near the fruits and vegetables retail outlets considered as source of contamination with
microorganisms, flies and insects.
However, more than half (58%) of the fruits and vegetables vendors had not specific place for hands washing, while
2% did not wash their hands after using the toilet. Unwashed hands and improper hands washing practice may
increase the probability of fruits and vegetables contamination. Most of the containers used in fruits and vegetables
washing were made of plastic materials and some of them use metal containers. Metal containers may affect fruits
and vegetables quality. After the receiving of fruits and vegetables from farm 5.3% of the participants treated their
products with organic and chemical substances. These treatments may introduced different elements (as Pb) into
fruits and vegetables and then increase the level of these elements. These products could also be contaminated by
various substances including traces of metals as farmers wash them with unhygienic water before bringing them into
the market (Divrikli et al., 2006).
The result showed that third of the participants stored their fruits and vegetables and redisplay and re-sell them on
the next day. This unhygienic practice may lead to the prolonging subjection of these products to the polluted air
which leads to the accumulation of lead inside the products. Vegetables and fruits absorb lead from the soil
(Mapanda et al., 2005) contaminated irrigation water (Demirezen, and Ahmet, 2006) and polluted air. Khairiah et
al., (2004) reported that the most important source of contamination is the atmospheric pollution from industrial or
motor vehicle emission, where it represents 73 to 95% of the total lead in plants (Delenberg and Van Dried, 1994).
Generally, 70%.3 of fruit and vegetable vendors transport their products by open car and this lead to the exposure of
fruits and vegetables to the dust, house fly, vehicles exhaustion and increase the level of lead in these products. On
the other hand, vegetables and fruits grown near highways or downwind of industrial plants may contain lead
(Abou-Arab et al., 2011). It was also observed that these foods are sold and displayed adjacent to the exhaust
emission in areas of heavy traffic which lead to more deposition and absorption of Pb. There is relationship between
the displaying distance and the degree of lead contamination. As the food products displayed close to the heavy
traffic areas more lead will be absorbed by these products and vis versa (Hassan and Gewifed (1998). Abou-Arab et
al., (2015) found that the highest levels of lead was detected in samples collected from industrial areas and the
lowest level was found in samples collected from rural areas.
The majority of fruit and vegetable dealers did not know any things about the fruits and vegetables pollution by lead
and all of them did not know that lead causes disease. Moreover, they did not know that car exhaustion pipes

International Journal of Scientific and Research Publications, Volume 7, Issue 12, December 2017 525 ISSN 2250-3153
www.ijsrp.org
contaminated fruit and vegetable with lead. Similar results reported by Shafie et al., (2016) who found that the level
of awareness regarding the presence of toxic metals in daily-consumed rice was low in 78.2% and moderate in
21.8% of the participants in Iran. The lack of awareness among fruits and vegetables sellers in this research may be
attributed to both medium level of education and the high level of illiteracy among them. is alarming sings for health
authorities to set and conduct programs on the risk factors that affect vegetables and fruits safety. Additionally, half
of them suffered from flies and other insects. The presence and the increase number of flies and insects at the area of
selling may lead to the increase of pesticides use, thus it increases the contamination with lead and other chemicals.
Lead is poisonous compounds can enter human body via inhalation or swallowing and it affect the internal organs.
This element is harmful for all humans particularly children and fetuses because it interferes with the development
of the nervous system. It is dangerous for human health even at low levels in the blood. Low levels of lead may
cause nervous system and kidney damage, learning disabilities, attention deficit disorder, and decreased intelligence,
while high levels have devastating effects on children, including seizures, unconsciousness and in some times lead
to death (USEPA, 1985). The accumulation of lead have damaging effects on the hematopoetical, hematic, renal and
gastrointestinal systems (Correia et al., 2000). In addition, lead has been associated with various forms of cancer,
nephrotoxicity, central nervous system effects and cardiovascular diseases in human (Ryan et al., 2000).
Result reported that all fruits and vegetable vendors had no regulations to control fruits and vegetables displaying
and selling. The lack of the regulations and lows may increase the physical, microbiological and chemical
contamination. However, 22.7% had not specific place for garbage collection and this may lead to the soil and
environment contamination, production of bad odor, insects, rodents, and microorganisms multiplication. With
regards to the health cards, results showed that more than third (34%) of the interviewees have no health card and
this can transmit different diseases from vendors to vegetables and fruits and lastly to the consumers.
References
A. A. K. Abou-Arab, M. A. Abou Donia, Sherif R. Mohamed, A. K. Enab. Risk Assessment of Lead in Egyptian Vegetables and Fruits from
Different Environments. World Academy of Science, Engineering and Technology International Journal of Biological, Biomolecular,
Agricultural, Food and Biotechnological Engineering Vol:9, No:3, 2015.
M. S. Al Jassir, A. Shaker, and M. A. Khaliq, “Deposition of heavy metals on green leafy vegetables sold on roadsides of Riyadh City, Saudi
Arabia,” Bulletin of Environmental Contamination and Toxicology, vol. 75, no. 5, pp. 1020–1027, 2005. View at Publisher · View at
Google Scholar · View at Scopus.
F. Beavington, P.A. Cawes, and A. Wakenshaw, “Comparative studies of atmospheric trace elements: improvement in air quality near copper
smelters,” Total Environ., vol. 332, pp. 39-49, 2004.
G.R. Bhagure, and S.R. Mirgane. Heavy metal concentrations in ground waters and soils of Thane Region of Maharashtra, India. Environmental
Monitoring and Assessment, 173(1-4), 643-652. 2010.
K. Chojnacha, Chojnacki, A. Gorecka, H. and H. Gorecki. “Bioavailability of heavy metals from polluted soils to plants,” Sci.Total Environ, vol.
337, no.13, pp. 175-185. 2005.
P.R.M. Correia, E. Oliveira, and P.V. Oliveira, “Simultaneous determination of Cd and Pb in foodstuffs by electrothermal atomic absorption
spectrometry,” Analytica Acta, vol. 405, pp. 405-211, 2000.

International Journal of Scientific and Research Publications, Volume 7, Issue 12, December 2017 526 ISSN 2250-3153
www.ijsrp.org
D. Demirezen, and A. Ahmet, “Heavy metal levels in vegetables in turkey are within safe limits for Cu, Zn, Ni and exceeded for Cd and pb,”
J. Food Qual., vol. 29, pp.252-265, 2006.
J.W. Delenberg and W. Van Dried. “Netherlands J. Agriculture Science,” vol.38, pp. 369-379., Cabrera et al., 1994, J. of Association Official
Analytical Chemistry International, vol.17, no. 5, pp. 1249-1252, 1990.
U. Divikli, N. Horzum, M. Soylak, and L. Elci, (2006). Trace heavy metal contents of some spices and herbal plants from western Anatolia,
Turkey. International Journal of Food Science and Technology 41: 712-716.
M. A. Elbagermi, H. G. M. Edwards, and A. I. Alajtal. (2012).Monitoring of Heavy Metal Content in Fruits and Vegetables Collected from
Production and Market Sites in the Misurata Area of Libya. ISRN Analytical Chemistry.Volume 2012 (2012), Article ID 827645, 5
pages. http://dx.doi.org/10.5402/2012/827645
Ehsan Bashir Ali (2003). The Content of Lead in Foods Vended in the Vicinity of Heavy Traffic in El saug Elarbi (Khartoum Governorate).
M.Sc. Food Hygiene and Safety, Faculty of Public and Environmental Health, University of Khartoum.
M. Elhag, S. Siham, A. Mohammed. Surveillance of food safety practices of food safety practices of street food-vendors in Gizan Saudi Arabia.
Agriculture & Forestry, vol. 58. (4): 119-128. 2012.
Federal Ministry of Health."Knowledge, Attitudes and Practices (KAP) in the Sudanese communities for their Economics, Research &
Information, 2011 Federal Ministry of Health.
A.G. Fernandes, M.Ternero, and G.F. Barragan, “An approach to characterization of sources of urban air born particles through heavy metal
speciation,” Chemosphere, vol.2, pp.123-136, 2000.
R.A. Goyer, “Results of lead research: prenatal exposure and neurological consequences,” Environmental Health Perspectives, vol.104, pp.
1050-1054, 1996.
I. A. Hassan, and I. M. Gewifel. Heavy metals in Egyptian Soils. Egyptian Journal of Botony. 38: 119 – 129. 1998.
K. J. Inoti, F. Kawaka, G. Orinda, and P. Okemo. Assessment of heavy metal concentrations in urban grown vegetables in Thika Town, Kenya.
African Journal of Food Science, 6(3), 41-46. 2012.
L. Järup, “Hazards of heavy metal contamination,” British Medical Bulletin, vol. 68, pp. 167–182, 2003. View at Google Scholar · View at
Scopus.
T. Khairiah, M.K. Zalifah, Y.H. Yin, and A. Aminnah. The uptake of heavy metals by fruits type vegetables grown in selected agricultural areas,”
Pak. J. Biol. Sci., vol. 7, no.8, pp. 1438-1442. 2004.
F. Mapanda, E.N. Mangwayana, J. Nyamangara, and K.E. Giller, “The effect of long-term irrigation using wastewater on heavy contents of soils
under vegetables in Harare,” Zimbabwe. Agric. Ecosys. Environ., vol.107, pp. 151-165, 2005.
W. ED. Mertz, “Trace Elements in Human and Animal Nutrition,” Vol. 1 and II, 5th ed. Academic Press, New York, 1986.
C. ReillyMetal Contamination of Food, 1st Ed. London: Applied Science Publisher Ltd.(1980).
P.B. Ryan, N. Huet and D.L. Maclntosh. “Longitudinal investigation of exposure to arsenic, cadmium and lead in drinking water,” Environmental
Health Perspectives, vol. 108, pp. 731-735, 2000.
N. G. Sathawara, D. J. Parikh, and Y. K. Agarwal, “Essential heavy metals in environmental samples from Western India,” Bulletin of
Environmental Contamination and Toxicology, vol. 73, no. 4, pp. 756–761, 2004. View at Publisher · View at Google Scholar · View
at Scopus.
L. Shafiei, P. Taymoori, K. Yazdanshenas. Awareness and attitude assessment regarding toxic metal-contaminated rice based on the Health
Belief Model. J Adv Environ Health Res 2016; 4(2): 78-87.

International Journal of Scientific and Research Publications, Volume 7, Issue 12, December 2017 527 ISSN 2250-3153
www.ijsrp.org
O.P. Sobukola, M.O., Adeniran, A.A. Odedairo, and O.E Kajihausa,. Heavy metal levels of some fruits and vegetables from selected markets in
Lagos, Nigeria. African Journal of Food Science 4: 389-393. 2010.
USEPA. 1985. Cost and benefit of reducing lead in gasoline, final regulatory impact analysis:
http://yosemite.epa.gov/ee/epa/eermfile.nsf/vwAN/EE-0034-1.pdf/$file/EE-0034-1.pdf> Accessed 2006 Jan.15.
A.A. Zeid. Lead Contamination in Selected Foods from Riyadh City Market and Estimation of the Daily Intake, Molecules. 15, 7482-7497;
doi:10.3390/molecules15107482. 2010.
Plate 1. Displaying and selling of vegetables in a car. Plate. 2. Displaying and selling near heavy traffic areas.
Plate. 3. Displaying and selling in the market near bus station.