
Assessment of Energy Potential and Benefit under the ...
14
Research Article Assessment of Energy Potential and Benefit under the Ground Source Heat Pump Air Conditioning System in Anqing Area of Eastern China Qing Zhang, Yunfeng Li, Jian Hua , Xiaonan Niu, Lili Hou, Zongfang Chen, and Weiya Ge Nanjing Geological Survey Center, China Geological Survey, Nanjing 210000, China Correspondence should be addressed to Jian Hua; [email protected] and Weiya Ge; [email protected] Received 15 June 2021; Revised 20 August 2021; Accepted 7 October 2021; Published 9 November 2021 Academic Editor: Martina Zucchi Copyright © 2021 Qing Zhang et al. This is an open access article distributed under the Creative Commons Attribution License, which permits unrestricted use, distribution, and reproduction in any medium, provided the original work is properly cited. Now ground source heat pump is a more efficient way to develop and utilize shallow geothermal energy because it is clean and environmentally friendly and has a relatively low energy cost. In order to optimize the planning layout and geographical space development in the eastern new town of Anqing city, which can realize the transformation and upgrading of real space and urban sustainable development, the exploration for shallow geothermal energy will be carried out in this area, so as to find out the comprehensive thermophysical parameters of the shallow rock-soil body and the heat transfer capacity of the vertical heat exchanger, etc. This paper takes the CBD in the eastern new town of Anqing as an example to provide the basis for the feasibility construction of the ground source heat pump project in the study area and evaluate the economic and environmental benefits of the expected project. According to the simulation test data of 5 working conditions of 4 geothermal exploration holes in the study area, we can clearly know that the energy cost per square meter of the ground source heat pump is 11.8 yuan for a building of one hundred thousand square meters in which the heat removal power is expected to be 9481 kW in summer and 3070 kW in winter. And the annual emission of carbon dioxide, sulfur dioxide, nitrogen oxides, suspended dust, and other air pollutants to the atmosphere can be reduced by 1442.5 t, and the solid waste ash and slag can be reduced by 59.7 t. The annual environmental treatment cost will be saved by 166000 yuan. 1. Introduction Geothermal is a clean and renewable resource, which can be used as an effective substitute for fossil fuels [1]. Among the various technologies and methods that can be used to obtain geothermal energy, ground source heat pump (GSHP) sys- tem is considered an efficient and main means [2]. The concept of “ground source heat pump” was first put forward by Swiss experts in 1912, and this technology was first put forward in Britain and the United States. Nordic countries mainly focus on winter heating, while the United States focuses on combined winter and summer heating. In recent years, the application of ground source heat pump technology for heating in China has been favored, and the application of ground source heat pump system in 2016 has been nearly six times larger than that in 2007 [3, 4]. Ground source heat pump system is considered an efficient geothermal energy acquisition technology because of its high efficiency and low operating cost, but its high initial cost limits the development of this technology. Many scholars have done a lot of research work on the ground source heat pump system in consideration of the performance [5, 6] and economy [7]. In terms of the performance of the ground source heat pump, Nouri et al. [8] suggested the vacuum tube collector and VGHP should be combined to meet the heating, cooling, and hot water demand of a residential building in Tabriz. Balbay and Esen [9, 10] carried out a preliminary feasibility study on the application of VGHP in snow melting of pavement and bridge deck for the first time. The results show that the snow on the pavement and bridge deck is effectively melted. For the economy of ground source heat pump, Esen et al. [5] reported the comparison Hindawi Geofluids Volume 2021, Article ID 3271884, 14 pages https://doi.org/10.1155/2021/3271884
Transcript of Assessment of Energy Potential and Benefit under the ...

Research ArticleAssessment of Energy Potential and Benefit under the GroundSource Heat Pump Air Conditioning System in Anqing Area ofEastern China
Qing Zhang, Yunfeng Li, Jian Hua , Xiaonan Niu, Lili Hou, Zongfang Chen,and Weiya Ge
Nanjing Geological Survey Center, China Geological Survey, Nanjing 210000, China
Correspondence should be addressed to Jian Hua; [email protected] and Weiya Ge; [email protected]
Received 15 June 2021; Revised 20 August 2021; Accepted 7 October 2021; Published 9 November 2021
Academic Editor: Martina Zucchi
Copyright © 2021 Qing Zhang et al. This is an open access article distributed under the Creative Commons Attribution License,which permits unrestricted use, distribution, and reproduction in any medium, provided the original work is properly cited.
Now ground source heat pump is a more efficient way to develop and utilize shallow geothermal energy because it is clean andenvironmentally friendly and has a relatively low energy cost. In order to optimize the planning layout and geographical spacedevelopment in the eastern new town of Anqing city, which can realize the transformation and upgrading of real spaceand urban sustainable development, the exploration for shallow geothermal energy will be carried out in this area, so as tofind out the comprehensive thermophysical parameters of the shallow rock-soil body and the heat transfer capacity of thevertical heat exchanger, etc. This paper takes the CBD in the eastern new town of Anqing as an example to provide thebasis for the feasibility construction of the ground source heat pump project in the study area and evaluate the economicand environmental benefits of the expected project. According to the simulation test data of 5 working conditions of 4geothermal exploration holes in the study area, we can clearly know that the energy cost per square meter of the groundsource heat pump is 11.8 yuan for a building of one hundred thousand square meters in which the heat removal power isexpected to be 9481 kW in summer and 3070 kW in winter. And the annual emission of carbon dioxide, sulfur dioxide,nitrogen oxides, suspended dust, and other air pollutants to the atmosphere can be reduced by 1442.5 t, and the solidwaste ash and slag can be reduced by 59.7 t. The annual environmental treatment cost will be saved by 166000 yuan.
1. Introduction
Geothermal is a clean and renewable resource, which can beused as an effective substitute for fossil fuels [1]. Among thevarious technologies and methods that can be used to obtaingeothermal energy, ground source heat pump (GSHP) sys-tem is considered an efficient and main means [2].
The concept of “ground source heat pump” was first putforward by Swiss experts in 1912, and this technology wasfirst put forward in Britain and the United States. Nordiccountries mainly focus on winter heating, while the UnitedStates focuses on combined winter and summer heating. Inrecent years, the application of ground source heat pumptechnology for heating in China has been favored, and theapplication of ground source heat pump system in 2016has been nearly six times larger than that in 2007 [3, 4].
Ground source heat pump system is considered an efficientgeothermal energy acquisition technology because of its highefficiency and low operating cost, but its high initial costlimits the development of this technology. Many scholarshave done a lot of research work on the ground source heatpump system in consideration of the performance [5, 6] andeconomy [7]. In terms of the performance of the groundsource heat pump, Nouri et al. [8] suggested the vacuumtube collector and VGHP should be combined to meet theheating, cooling, and hot water demand of a residentialbuilding in Tabriz. Balbay and Esen [9, 10] carried out apreliminary feasibility study on the application of VGHPin snow melting of pavement and bridge deck for the firsttime. The results show that the snow on the pavement andbridge deck is effectively melted. For the economy of groundsource heat pump, Esen et al. [5] reported the comparison
HindawiGeofluidsVolume 2021, Article ID 3271884, 14 pageshttps://doi.org/10.1155/2021/3271884

between ground source heat pump system and ACHP sys-tem from the perspective of technology and economy. Luet al. [11] used some economic indicators to compare thefinancial attractiveness of GSHP and ASHP in residentialheating and cooling in Melbourne, and the results showedthat the ground source heat pump system provided morebenefits than the ASHP system for systems with more than
40 years of operation. Ground source heat pump systemcan extract geothermal energy for building heating and cool-ing. Compared with the traditional air-water heat pump(AWHP) and air-air heat pump (AAHP) system, the ther-mal performance of ground source heat pump system is usu-ally higher, because the ground temperature is higher thanthe ambient air temperature in the heating season and lower
Anqing city
Xiyue c
ount
y
Qiansh
an
Tong
chen
g
Huain
ing d
istric
t
Taihu countyDaguan district Study area
Yixiu
distr
ict
Wangjiang county
Susong county
Yingjiang district
Figure 1: Geographical location and general situation of the study area.
Depth
–0.7 m
–16.0 m
–19.7 m–20.2 m
–25.1 m
–29.0 m
–38.8 m–39.7 m–40.3 m
–60.0 m
Depth
–0.7 m
–16.0 m
–19.7 m–20.2 m
–25.1 m
–29.0 m
–38.8 m–39.7 m–40.3 m
–60.0 m–58.95 m
Borehole location plan
192K11 bare log 192K12 bare log
Petrographic description
Artificial fill
Clay
Mucky clay
Clay
Silt
Clay
Silt
Fine sand
Round gravel layer
Silty mudstone
Artificial fill
Clay
Mucky clay
Clay
Silt
Clay
Silt
Fine sand
Round gravel layer
Moderately weatheredsilty mudstone
Moderately weatheredargillaceous siltstone
Borehole location plan Petrographic description
Figure 2: General situation of strata in the study area.
2 Geofluids

than the ambient air temperature in the cooling season [12].The ground source heat pump (GSHP) is a central heatingand air conditioning system, which is composed of a waterground source heat pump unit, geothermal energy exchangesystem, and building system, with the rock-soil body, stratumsoil, groundwater, or surface water as a low-temperature heatsource. Therefore, it is very important to accurately grasp thethermal conductivity and other parameters of the heat source
in situ for the evaluation and construction of a long-termeffective operation geothermal heat pump system.
Shallow geothermal energy investigation and groundsource heat pump suitability zoning research have been car-ried out in many cities in China [13, 14]. However, due tothe differences in geotechnical conditions, groundwater condi-tions, and climatic conditions in different regions, the resourcecharacteristics of different regions have their unique character-istics [15, 16]. Moreover, the research content mostly focuseson the distribution characteristics of shallow geothermalresources, and the research on environmental benefit evalua-tion is less [17, 18]. In this paper, the self-developed equip-ment called FTPT11 for field thermal response test was usedin the four geothermal wells, carrying out the simulation testof five working conditions, including the initial mean groundtemperature test (case 1), high-power constant heat flux test(case 2), low-power constant heat flux test (case 3), simulatedconstant temperature test in summer (case 4), and simulatedconstant temperature test in winter (case 5). In this way, thedevelopment potential of shallow geothermal energy will beanalyzed and calculated. What is more, the economic andenvironmental benefits of the proposed ground source heat
(a) (b)
Figure 3: Core drilling of K11 and K14 (a) and testing process (b).
1.7
1.6
1.5
1.4
1.3
1.2
Spec
ific h
eat c
apac
ity (K
J/(Kg
·K))
1.1
1.00 5 10 15 20
Depth (m)25 30 4035 0 5 10 15 20
Depth (m)(a) (b)
25 30 4035
3.5
3.0
2.5
2.0
1.5
1.0
Ther
mal
cond
uctiv
ity (W
/(m
·K))
0.5
1.0
19ZK1419ZK11
Figure 4: Variation curve of specific heat capacity (a) and thermal conductivity (b) of the rock-soil body around K11 and K14 with depth.
Figure 5: Installation of vertical heat exchanger.
3Geofluids

pump systemmay be evaluated to provide a reference for laterengineering construction.
2. Summary
2.1. Project Summary. The study area is located in the centralbusiness district (CBD) of the eastern new town of AnqingCity, Anhui Province, Southeast China, with a total area of1812mu, as shown in Figure 1. Anqing is located in the mid-dle and low latitudes with four distinct seasons. It is hot insummer and cold in winter. In order to realize the sustain-able development of the new urban area, it is planned tomake large-scale use of “ground source heat pump air condi-tioning” technology to reduce the proportion of fossil fuelsused in the new urban area.
At present, there are four geothermal exploration bore-holes in the study area, namely, 192k11, 192k12, 192k13,and 192k14. A large number of field tests and laboratorytests were carried out to obtain the formation parametersand geothermal distribution characteristics in the study area,so as to study the potential of vertical buried pipe heatexchange system.
2.2. Stratigraphic System. The strata in Anqing city aredivided into two stratigraphic areas by the Tan Lu fault.The Dabie Mountains stratigraphic area is in the northwestwhile the Anqing stratigraphic area is in the southeast. Theformer consists of the metamorphic rocks of the DabieMountains group, Upper Archean, the metamorphic rocksof the Foziling group, Lower Proterozoic, and the middlebasic volcanic rocks of the Upper Jurassic of the Mesozoic.The total thickness of the latter strata is more than12000m, but the outcrop is not good. It is sporadicallydistributed in Silurian, Devonian, Carboniferous, Permian,Triassic, Jurassic, Cretaceous, and tertiary. The Quaternarystrata are widely distributed; the lithologic characteristicsare shown in Figure 2.
The rock of the Xuannan group, Upper Cretaceous(K2x), is purple-red; it covers medium-thick conglomerate,
fine conglomerate, gravel bearing coarse sandstone, andargillaceous siltstone, which are interbedded. The gravelgrain size is 1-50mm, with general sorting and roundness.The gravels have a bedding structure and are arranged alongthe dip direction.
In this study, cores of K11 and K14 geothermal holes wereobtained for laboratory tests and analysis (Figure 3). Theresults show that the average thermal conductivity of the holeK11 is 1.104~1.997W/(m·K), and the average specific heatcapacity is 0.95~1.697 kJ/(kg·K), while the average thermalconductivity of the hole K14 is 1.107~1.755W/(m·K), andthe average specific heat capacity is 1.074~1.589kJ/(kg·K).On the whole, except for a few points, the specific heat capac-ity of the rock-soil body in the range of drilling depth has littlechange with depth, and the thermal conductivity has no obvi-ous change with depth (Figure 4). Furthermore, due to the factthat holes K11 and K12 are near while holes K13 and K14 arenear, the lithology of the stratum is consistent. Therefore, theaverage thermal conductivity of the whole hole section calcu-lated by thickness weighting in the study area is about1.575W/(m·K), which is suitable for geothermal exploitation.
3. Thermal Response Test
3.1. Installation of Vertical Heat Exchanger. Four groups ofvertical heat exchangers were arranged in this survey, all ofwhich were installed after secondary reaming of the coringhole (Figure 5). The depth of coring in holes 192K11 and192K12 is 60m, and double-U-shaped PE pipe heatexchangers of 54m and 60m are installed, respectively.Besides, the depth of coring in holes 192K13 and 192K14 is100m, and 100m double-U-shaped PE pipe heat exchangersare installed. The PE pipe should be left about 1m long on theground considering the need of connecting the thermalresponse test instrument.
3.2. Thermal Response Test
3.2.1. Introduction to the Test. The main performanceparameters of the equipment (Figure 6) which is self-
(a) (b)
Figure 6: Main machine (a) and refrigeration auxiliary machine (b).
Table 1: Performance parameters of test equipment.
Equipment model Maximum heating capacity Maximum cooling capacity Maximum power Circulating water flow Range
FTPT11 8 kW 7kW 12 kW 1.8m3/h 10m
4 Geofluids

developed named FTPT11 for field thermal response test areshown in Table 1. The test equipment is mainly composed ofa heat pump system, electric heater, water-replenishing tank,circulating pump, circulating pipeline, temperature and flowdetection elements, etc. The flow meter is installed at thewater supply pipe of the vertical buried pipe, and the tem-perature detection points are arranged at the water supplypipe, return pipe, and circulating pipe, which is used to auto-matically record the flow and temperature of circulatingwater in the pipe.
Four groups of thermal response tests have been com-pleted in this exploration, and each group includes the initialmean ground temperature test (case 1), high-power constantheat flux test (case 2), low-power constant heat flux test (case3), simulated constant temperature test in summer (case 4),and simulated constant temperature test in winter (case 5).
The purpose of the low-power constant heat flux test andhigh-power constant heat flux test is to obtain the compre-hensive thermal conductivity of the rock-soil body in thedepth range of the vertical heat exchanger. The purpose ofthe simulated constant temperature test in summer and sim-ulated constant temperature test in winter is to obtain theheat transfer power per meter length of the vertically buried
tube heat exchanger under specific heat transfer conditions.Combined with the initial average ground temperature testresults, the relationship between heat transfer power per unitlength and medium temperature of vertical heat exchanger isfurther fitted, and the effective heat transfer coefficient ofvertically buried tube heat exchanger is obtained.
3.2.2. Results and Analysis
(1) The Initial Average Temperature of the Rock-Soil Body(Case 1). Figure 7 shows the test curve of the average initialtemperature of the rock-soil body in the four geothermalholes. After a certain period of system circulation, the finalstable average water temperature (initial average tempera-ture of the rock-soil body) at the outlet of four test holes is21.9°C, 20.8°C, 20.5°C, and 20.5°C, respectively.
(2) High- and Low-Power Constant Heat Flux Test (Case 2and Case 3). The test duration, heating power, and flow rateof each test hole are 48 h, 1.910 kW, and 1.117m3/h, respec-tively, in the low-power constant heat flux test. According tothe test data, the curve of the temperature at the inlet andoutlet of the buried pipe with time is drawn as shown in
32
30
28
26
Tem
pera
ture
(°C
)
24
22
20
32
30
28
26
Tem
pera
ture
(°C
)
24
22
20
0 60 120
180
240
300
360
420
480
Time (min)
192K11 borehole 192K12 borehole
192K13 borehole
Inlet temperature of buried pipeOutlet temperature of buried pipe
192K14 borehole
Time (min)54
060
066
072
078
084
0 0 200 400 600 800 1000 1200 1400
Time (min)0 200 400 600 800 1000 1200 1400
Time (min)0 200 400 600 800 1000 1200
28
26
27
Tem
pera
ture
(°C
)
24
25
22
23
20
21
19
28
26
27
Tem
pera
ture
(°C
)
24
25
22
23
20
21
30
28
26
Tem
pera
ture
(°C
)
24
22
20
0 60 120
180
240
300
360
420
480
Time (min)
192K13 borehole
Inlet temperature of buried pipeOutlet temperature of buried pipe
192K14 borehole
Time (min)54
060
066
072
078
084
0 0 200 400 600 800 1000 1200 1400
Time (min)0 200 400 600 800 1000 1200 140
Time (min)0 200 400 600 800 1000 1200
28
26
27
Tem
pera
ture
(°C
)
24
25
22
23
20
21
Figure 7: Initial average temperature of the rock-soil body in 4 geothermal test holes.
5Geofluids

Figure 8. Each temperature measurement curve can bedivided into two obvious stages: rapid temperature rise(stage I) and stable temperature (stage II). Stage I is in thefirst ten hours of the test, the temperature at the inlet andoutlet of the buried pipe changes rapidly, and the tempera-ture in the borehole (backfill material) rises rapidly. StageII shows that the temperature change in the boreholedecreases with the heating time, which can be regarded asa steady-state heat conduction process.
The linear source model proposed by Hellström [16] isselected to calculate the thermal conductivity. The meantemperature of the circulating medium at time τ can beexpressed as follows:
T f = T ff + ql ⋅ Rb +1
4πλs⋅ Ei
d2bρscs16λsτ
!" #, ð1Þ
where T f is the mean temperature of circulating medium(°C), T ff is the undisturbed ground temperature (°C), q1 isthe heat flux per length (W), ρs is the mean density of theground surrounding the BHE (kg/m3), τ is the time (s), csis the mean specific heat capacity of the ground surrounding
the BHE (J/(kgK)), db is the borehole diameter (m), and λsis the thermal conductivity of the ground surrounding theborehole (W/(mK)).
When the heating time is sufficiently long, the followingequation is obtained:
Eid2bρscs16λsτ
!≈ ln 16λsτ
d2bρscs
!− γ: ð2Þ
Linear regression is presented between the borehole walltemperature and logarithmic time. Equation (4) can be sim-plified to
T f =m ln tð Þ + n, ð3Þ
where m is the slope of the linear regression between tem-perature and logarithmic time.
The equations determine the heat exchange between thecirculating medium and the surrounding ground. Thus, theground thermal conductivity λs can be determined. Accord-ing to the test data of the temperature stable section of eachtest hole, the curve of constant heat flow heating T f versusln ðtÞ of each test hole is drawn as Figure 9.
32
34
30
28
26
Tem
pera
ture
(°C
)
24
22
200 500 1000 1500
Time (min)
192K11 borehole
Stage I Stage II Stage I Stage II
Stage I Stage IIStage I Stage II
192K12 borehole
192K13 borehole 192K14 borehole
2000 2500 3000 0 500 1000 1500Time (min)
2000 2500 3000
30
28
26
Tem
pera
ture
(°C
)
24
22
20
32
30
28
26
Tem
pera
ture
(°C
)
24
22
20
32
30
28
26Te
mpe
ratu
re (°C
)
24
22
20
0 500 1000 1500Time (min)
2000 25000 300 600 900Time (min)
1200 1500 1800
Inlet temperature of buried pipeOutlet temperature of buried pipe
0 500 1000 1500Time (min)
Stage I Stage II Stage I Stage II
Stage I Stage IIStage I Stage II
192K13 borehole 192K14 borehole
2000 2500 3000 0 500 1000 1500Time (min)
2000 2500 3
30
28
26
Tem
pera
ture
(°C
)
24
22
20
32
30
28
26Te
mpe
ratu
re (°C
)
24
22
20
0 500 1000 1500Time (min)
2000 25000 300 600 900Time (min)
1200 1500 1800
Inlet temperature of buried pipeOutlet temperature of buried pipe
Figure 8: Results of low-power constant heat flux test in four geothermal holes.
6 Geofluids

The test duration, heating power, and flow rate of eachtest hole are 48 h, 3.725 kW, and 1.046m3/h, respectively,in the high-power constant heat flux test. According to thetest data, draw the curve of the temperature at the inletand outlet of the buried pipe with time, as shown inFigure 10. It can be seen from the curve that the shape ofthe curve is basically the same as that of the low-power con-stant heat flow test. In the first ten hours, the temperaturechanges at the inlet and outlet of the buried pipe are rela-tively fast, and the temperature rises rapidly in the borehole(backfill material). With continuous heating, the range oftemperature change is reduced in the hole decreases, andthe heat transfer process in the hole is similar to thesteady-state heat conduction process.
According to the test data of the temperature stable sec-tion of each test hole, the curve of constant heat flow heatingT f with ln ðtÞ is drawn in Figure 11, and the average thermalconductivity of the rock-soil body is calculated.
In conclusion, the average thermal conductivity of therock-soil body at the four exploration holes (Table 2) is cal-culated based on the results of the high-power and low-power constant heat flow test, so as to predict the effect ofgeothermal exploitation in the study area more accurately.The results show that the average thermal conductivity ofK11 and K12 is close, while the value of K13 and K14 isclose. This is because the holes K11 and K12 are near while
holes K13 and K14 are near, and the difference of lithologybetween adjacent boreholes is small.
(3) Simulated Constant Temperature Test in Summer andWinter (Case 4 and Case 5). Because the ground source heatpump project is used for cooling in summer and heating inwinter in the study area, it is necessary to test the operationeffect of the heat pump system under reservoir conditions inthe early stage of the construction. The variation of the tem-perature at the inlet and outlet of the buried pipe with timein the simulated winter and summer conditions of the fourgeothermal wells is shown in Figure 12. Among them, thesimulation test time, the water supply temperature, and theflow rate are 24 h, 38.94°C, and 1.28m3/h, respectively, insummer, while those are 50 h, 7.04°C, and 1.22m3/h inwinter. In the later stage of the test, the temperature and heattransfer at the inlet and outlet of the buried pipe are basicallystable, which shows that the simulation test time meets therequirements. According to equation (2), the data within12~24h after the temperature curve reaches stable are takento calculate the heat injection and extraction per unit ofspecific hole location.
According to the results of case 1, case 4, and case 5, therelationship curve between heat transfer q with the averagetemperature T f is determined, as shown in Figure 13(a).
192K11 borehole
y=1.6229x+12.134 (R2=0.9954) y=2.3797x+7.5551 (R2=0.99989)
y=1.700x+8.730 (R2=0.9979)y=1.5704x+12.271 (R2=0.9984)
32.0
31.5
31.0
30.5
30.0
29.0
10.4 10.6 10.8 11.0 11.2 11.4ln (t)
11.6 11.8 12.0 12.2 10.4 10.6 10.8 11.0 11.2 11.4ln (t)
11.6 11.8 12.0 12.2
29.5
192K12 borehole
192K13 borehole 192K14 borehole
Tem
pera
ture
(°C
)
28.8
29.029.2
29.4
29.6
29.8
30.0
30.2
30.4
30.6
Tem
pera
ture
(°C
)
36.5
35.5
36.0
35.0
34.5
34.0
32.0
32.5
33.5
33.0Tem
pera
ture
(°C
)
26.5
27.0
27.5
28.0
28.5
29.5
29.0
Tem
pera
ture
(°C
)
10.4 10.6 10.8 11.0 11.2 11.4ln (t)
11.6 11.8 12.0 12.210.6 10.8 11.0 11.2 11.4ln (t)
11.6
Figure 9: The variation curve of low-power constant heat flow heating T f with ln ðtÞ in four geothermal test holes.
7Geofluids
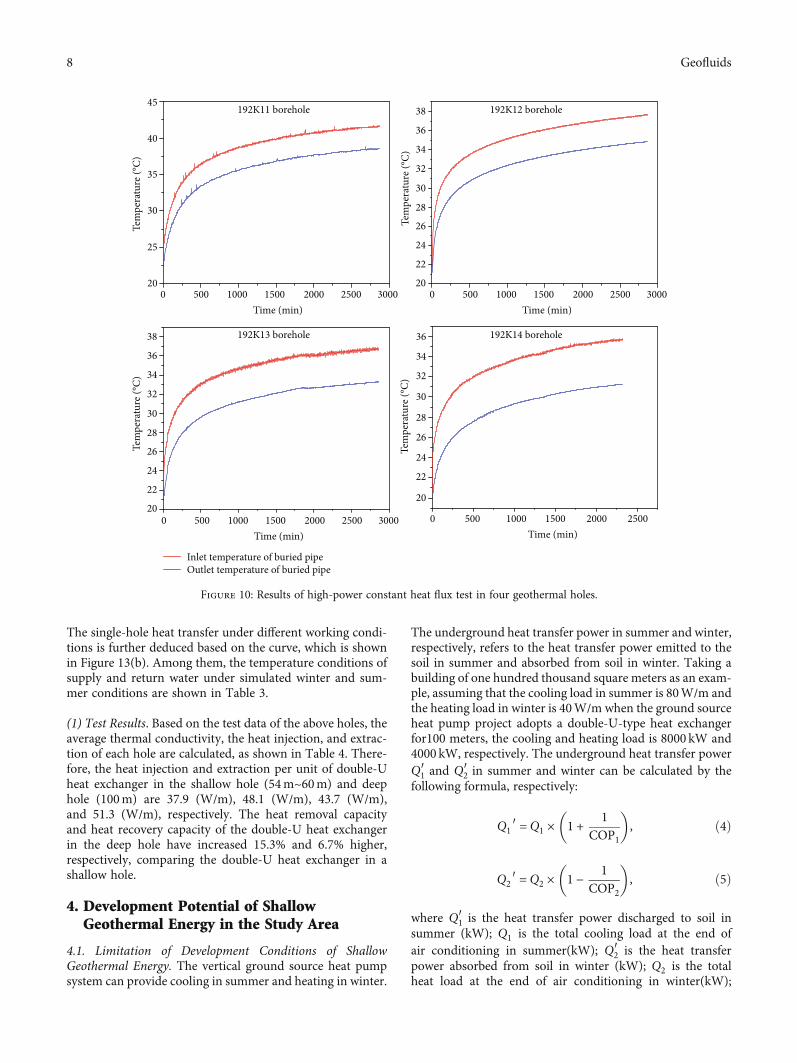
The single-hole heat transfer under different working condi-tions is further deduced based on the curve, which is shownin Figure 13(b). Among them, the temperature conditions ofsupply and return water under simulated winter and sum-mer conditions are shown in Table 3.
(1) Test Results. Based on the test data of the above holes, theaverage thermal conductivity, the heat injection, and extrac-tion of each hole are calculated, as shown in Table 4. There-fore, the heat injection and extraction per unit of double-Uheat exchanger in the shallow hole (54m~60m) and deephole (100m) are 37.9 (W/m), 48.1 (W/m), 43.7 (W/m),and 51.3 (W/m), respectively. The heat removal capacityand heat recovery capacity of the double-U heat exchangerin the deep hole have increased 15.3% and 6.7% higher,respectively, comparing the double-U heat exchanger in ashallow hole.
4. Development Potential of ShallowGeothermal Energy in the Study Area
4.1. Limitation of Development Conditions of ShallowGeothermal Energy. The vertical ground source heat pumpsystem can provide cooling in summer and heating in winter.
The underground heat transfer power in summer and winter,respectively, refers to the heat transfer power emitted to thesoil in summer and absorbed from soil in winter. Taking abuilding of one hundred thousand square meters as an exam-ple, assuming that the cooling load in summer is 80W/m andthe heating load in winter is 40W/m when the ground sourceheat pump project adopts a double-U-type heat exchangerfor100 meters, the cooling and heating load is 8000 kW and4000 kW, respectively. The underground heat transfer powerQ1′ and Q2′ in summer and winter can be calculated by thefollowing formula, respectively:
Q1 ′ =Q1 × 1 + 1COP1
� �, ð4Þ
Q2 ′ =Q2 × 1 − 1COP2
� �, ð5Þ
where Q1′ is the heat transfer power discharged to soil insummer (kW); Q1 is the total cooling load at the end ofair conditioning in summer(kW); Q2′ is the heat transferpower absorbed from soil in winter (kW); Q2 is the totalheat load at the end of air conditioning in winter(kW);
Tem
pera
ture
(°C)
25
20
35
30
45
40
32
34
36
30
28
26
Tem
pera
ture
(°C)
24
22
20
32
34
36
38
30
28
26Tem
pera
ture
(°C)
24
22
20
32
34
36
38
30
28
26Tem
pera
ture
(°C)
24
22
20
0 500 1000 1500Time (min)
2000 2500 30000 500 1000 1500Time (min)
2000 2500 3000
0 500 1000 1500Time (min)
2000 2500 3000 0 500 1000 1500Time (min)
2000 2500
192K11 borehole 192K12 borehole
192K13 borehole 192K14 borehole
Inlet temperature of buried pipeOutlet temperature of buried pipe
Figure 10: Results of high-power constant heat flux test in four geothermal holes.
8 Geofluids

COP1 is the refrigeration coefficient of water source heatpump unit under design condition; the value is 5.4; andCOP2 is the heating coefficient of water source heat pumpunit under design condition; the value is 4.3. According tothe results, by calculating equations (4) and (5), it can be seenthat the summer heat removal power should be 9481 kW, andthe winter heat extraction power is 3070 kW, so as to meetthe design target.
4.2. Layout of Geothermal Well. According to the results ofvarious hot holes presented in Table 4, it can be seen thatthe heat transfer capacity of a double-U heat exchanger inthe shallow hole (54m~60m) is lower than that of thedeep hole (100m). Considering the need to reduce thefloor area of a vertically buried pipe heat exchanger byimproving the heat exchange capacity or the heatexchange capacity of the single hole, it is recommendedto use a 100m double-U-type heat exchanger in the later
ground source heat pump project. Therefore, in order tomeet the demand of cooling and heating if the coolingand heating load is calculated as 8000 kW and 4000 kW,respectively, of a building with an area of one hundredthousand square meters, the number of heat source wellsto be arranged is shown in Table 5. To meet the heatingand cooling requirements of the target area, about 2170similar geothermal wells are required to operate in sum-mer, while at least 600 geothermal wells are required tooperate at the same time in winter.
The heating system runs for 90 days in winter and 18hours a day. In summer, the refrigeration system operatesfor 120 days and 12 hours a day, and the load factor is0.75 in winter and summer.
The accumulated heat discharge in summer is Q1 =9481 × 12 × 120 × 0:75 × 3:6/1000 = 36862GJ.
The accumulated heat discharge in winter is Q2 =3070 × 18 × 90 × 0:75 × 3:6/1000 = 13428GJ.
41.0
40.0
39.0
38.0
37.0
35.0
36.0
Tem
pera
ture
(°C)
10.4 10.6 10.8 11.0 11.2 11.4ln (t)
11.6 11.8 12.0 12.2 10.4 10.6 10.8 11.0 11.2 11.4ln (t)
11.6 11.8 12.0 12.2
10.6 10.8 11.0 11.2 11.4ln (t)
11.6 11.8 12.010.4 10.6 10.8 11.0 11.2 11.4ln (t)
11.6 11.8 12.0 12.2
35.5
35.0
34.5
34.0
32.0
31.5
32.5
33.5
33.0Tem
pera
ture
(°C)
33.0
33.5
32.0
32.5
31.0
31.5
30.5
Tem
pera
ture
(°C)
29.5
29.0
28.5
27.5
28.0Tem
pera
ture
(°C)
192K11 borehole 192K12 borehole
192K13 borehole 192K14 borehole
y=2.8888x+5.3624 (R2=0.99743)y=1.4117x+12.6193 (R2=0.99826)
y=2.4527x+4.4866 (R2=0.99845)y=2.0402x+10.5017 (R2=0.99494)
Figure 11: The variation curve of high-power constant heat flow heating T f with ln ðtÞ in four geothermal test holes.
Table 2: Average thermal conductivity of rock-soil body under the high- and low-power constant heat flux test.
Test type 192K11 192K12 192K13 192K14
Low-power constant heat 1.93W/(m·°C) 1.80W/(m·°C) 2.04W/(m·°C) 2.10W/(m·°C)High-power constant heat 1.90W/(m·°C) 1.80W/(m·°C) 2.08W/(m·°C) 2.08W/(m·°C)
9Geofluids

42.0
41.5
41.0
40.5
40.0
39.5
39.0
38.5
38.0
37.5
39.0
38.5
38.0
37.5
37.0
36.5
36.0
35.5
35.0
34.5
40.0
39.0
38.0
37.0
36.0
35.0
34.0
33.0
32.0
37.0
Tem
pera
ture
(°C)
25.0
20.0
15.0
10.0
26
24
22
20
18
16
14
12
10
8
6
0 500 1000 1500Time (min)
2000 30002500
0 500 1000 1500Time (min)
2000 300025000 200 400 600Time (min)
800 14001000 1200
0 200 400 600Time (min)
800 14001000 1200
0 200 400 600Time (min)
800 14001000 1200
0 200 400 600Time (min)
800 14001000 1200
0 500 1000 1500Time (min)
2000 30002500
0 500 1000 1500Time (min)
2000 30002500
5.0
30.0
Tem
pera
ture
(°C)
Tem
pera
ture
(°C)
Tem
pera
ture
(°C)
Tem
pera
ture
(°C)
20.0
30.0
25.0
10.0
5.0
15.0
Tem
pera
ture
(°C)
42.0
41.0
40.0
39.0
38.0
37.0
36.0
35.0
34.0
Tem
pera
ture
(°C) 20.0
25.0
10.0
5.0
15.0
Tem
pera
ture
(°C)
192K11 borehole (heat rejection) 192K11 borehole (heat extraction)
192K12 borehole (heat rejection) 192K12 borehole (heat extraction)
192K13 borehole (heat rejection) 192K13 borehole (heat extraction)
192K14 borehole (heat rejection) 192K14 borehole (heat extraction)
25.0
20.0
15.0
10.0
26
24
22
20
18
16
14
12
10
8
6
0 500 1000 1500Time (min)
2000 3002500
0 500 1000 1500Time (min)
2000 30025000 200 400 600Time (min)
800 14001000 1200
0 200 400 600Time (min)
800 14001000 1200
0 200 400 600Time (min)
800 14001000 1200
0 200 400 600Time (min)
800 14001000 1200
0 500 1000 1500Time (min)
2000 3002500
0 500 1000 1500Time (min)
2000 3002500
5.0
30.0
TeTTm
pera
ture
(°C)
TeTTm
pera
ture
(°C)
20.0
30.0
25.0
10.0
5.0
15.0
TeTTm
pera
ture
(°C)
20.0
25.0
10.0
5.0
15.0
TeTTm
pera
ture
(°C)
192K12 borehole (heat rejection) 192K12 borehole (heat extraction)
192K13 borehole (heat rejection) 192K13 borehole (heat extraction)
192K14 borehole (heat rejection) 192K14 borehole (heat extraction)
Inlet temperature of buried pipeOutlet temperature of buried pipe
Figure 12: The variation of temperature with time of four geothermal holes under Case 4 and Case 5.
10 Geofluids

Table 3: The temperature conditions of supply and return water under simulated winter and summer conditions.
ConditionsThe temperature of supply
water (°C)The temperature of return
water (°C)The average temperature of supply and
return water (°C)
Summer
35 30 32.5
33 28 30.5
30 25 27.5
Winter5 10 7.5
5 8 6.5
Table 4: Test results of each test hole.
NameDepth(m)
Backfillmethod
Initialtemperature
(°C)
Low-powerthermal
conductivity(W/m·°C)
High-powerthermal
conductivity(W/m·°C)
Average powerthermal
conductivity(W/m·°C)
The reference valueof heat discharge
(W/m)
The reference valueof calorificvalue (W/m)
192K11 54Bottom-upgrouting
21.9 1.93 1.90 1.92 37.6 -51.1
192K12 60Bottom-upgrouting
20.8 1.80 1.80 1.80 38.1 -45.0
192K13 100Bottom-upgrouting
20.5 2.04 2.08 2.06 42.3 -48.4
192K14 100Bottom-upgrouting
20.5 2.10 2.08 2.09 45.0 -54.2
Table 5: Number of heat source wells required for a building with an area of one hundred thousand square meters.
Cooling loadin summer(kW)
Heat load inwinter (kW)
Heatremoval
power (kW)
Heatingextractionpower (kW)
Heat removal insingle hole (kW)
Heat extractionin single hole
(kW)
Number of wellsrequired insummer
Number of wellsrequired inwinter
8000 4000 9481 3070 4.37 5.13 2170 600
192K11
60
40
20
–20
–40
–60
05 10 15 20 25 3530 35
Hea
t tra
nsfe
r per
uni
t hol
e dep
th (W
/m) 6000
4000
2000
–2000
–4000
–6000
0
Hea
t tra
nsfe
r cap
acity
of s
ingl
e hol
e (W
)
192K12192K13
(a) (b)
192K14
Average temperature ( °C)5 10 15 20 25 30 35
Average temperature ( °C)
Figure 13: Relationship between the average temperature of supply water and heat transfer per unit hole depth of four test holes (a) and therelationship between the average temperature of supply water and single-hole heat transfer of four test holes (b). Note: “-”means taking heatfrom underground.
11Geofluids

5. Economic and Environmental Benefits
5.1. Economic Evaluation. The operating economy of theground source heat pump can be indirectly reflected bythe energy consumption cost. Table 6 shows the compari-son of the costs of pure electric heating; boiler heating bycoal fire, oil fire, and gas fire; traditional central air condi-tioning (dual-use cooling and heating); and ground sourceheat pump heating. From the perspective of energy conver-sion, 1 kWh electric energy can only produce 1 kWh of heatenergy, and the thermal efficiency of a gas-fired boiler isonly 70%~90%, which means it needs 4000~5143 kJ toproduce the same heat. The traditional central air condi-tioning system in which COP is about 2.2~2.3 only needs1565~1636 kJ energy to produce the same heat while857~1091 kJ heat is needed to produce the same heat bythe ground source heat pump air conditioning system inwhich COP is about 3.3~4.2.
Suppose the heating area of the building is one hundredthousand square meters, and the total heat load in winter is4000 kW. Taking the average load rate of the whole heatingseason as 0.75, the total heat demand in the heating season
is 17496 (GJ). On this basis, the energy costs of differentheating modes are calculated as shown in Table 6.
Comparing energy cost per square meter which is shownin Figure 14, the cost of using coal-fired boiler is the lowest,followed by ground source heat pump, gas-fired boiler,central air conditioning, and electric heating. However, thecoal-fired boiler will make the environmental pollution moreserious by producing air pollutants and solid waste pollut-ants. The energy cost per square meter of the ground sourceheat pump is the lowest of the other three methods, and it isvery good to protect the environment. At the same time, theground source heat pump is a cold and heat source type inline with the national energy development direction, whichcan not only heat but also cool. Compared with other coldand heat source types, it should be vigorously promotedbecause of its obvious energy conservation.
5.2. Environmental Benefit. The environmental evaluation iscarried out. Table 7 shows the reference coefficient of con-verting various energy into standard coal, and the standardcoal quantity (M) saved by using shallow geothermal energyto replace traditional coal for heating in winter is evaluated.
Based on the data of saving standard coal (M) calculatedby formula (6), the social and environmental benefitsbrought from coal saving under the same calorific valueare evaluated. The calculation of emission reduction andtreatment cost saving of air pollutants and solid wastes fromcoal combustion is shown in Table 8.
M = ∑Wt
4:1868/7 : ð6Þ
Suppose the heating area of the building is one hundredthousand square meters and the heating load is 4000 kW, the
Table 6: Energy cost of different heating modes.
Type Price ConsumptionCost(yuan)
Energy cost per squaremeter (yuan/m2)
Remarks
Electricity 0.8 (yuan/kWh) 4860000 (kWh) 3888000 38.9 Thermal efficiency is 1
Coal 600 (yuan/kg) 1116172 (kg) 669703 6.7 Thermal efficiency is 0.75
Natural gas 3 (yuan/m3) 607500 (Nm3) 1822500 18.2 Thermal efficiency is 0.8
Central air-conditioning(CAC)
0.8 (yuan/kWh) 2113043 (kWh) 1690430 16.9 Comprehensive energy efficiency is 2.3
Ground source heatpump (GSHP)
0.8 (yuan/kWh) 1472727 (kWh) 1178180 11.8 Comprehensive energy efficiency is 3.3
Remarks: electricity price is 0.8 yuan/kWh. Natural gas price is 3.0 yuan/m3, and its calorific value is 36.0MJ/m3. The calorific value of coal is 20.9MJ/kg. Theheating season is 90 days, and the average load rate is 0.75.
40
35
30
25
Ener
gy co
st (Y
/m2 )
20
15
10
Electricity Coal Natural gas GAC GASHPEnergy type
5
0
Figure 14: Heating cost of various energy sources.
Table 7: The reference coefficient of converting various energy intostandard coal.
Name The reference coefficient Mean calorific value
Raw coal 0.7143 kgce/kg 20908 kJ/kg
Thermal power(equivalent value)
/ 0.03412 kgce/MJ
12 Geofluids

evaluation results of environmental benefits brought by thedevelopment and utilization of shallow geothermal energyfor heating in winter are shown in Tables 9 and 10.
It can be seen that the development and utilization of shal-low geothermal energy resources for winter heating instead ofconventional energy can reduce 59.7 tons of solid waste ashand the emission of 1442.5 tons of air pollutants such as car-bon dioxide, sulfur dioxide, nitrogen oxides, and suspendeddust every year when the heating area of the building is onehundred thousand square meters. Therefore, 166000 yuancan be saved on the environmental treatment (Figure 15).
6. Conclusions
Based on the analysis and calculation of the above testresults, the following conclusions can be obtained, whichcan provide the basis for the later engineering construction:
(1) The initial average temperature of the shallow stratafrom 54m to 60m in the study area is20.9°C~21.9°C. The average comprehensive thermalconductivity (average results of high- and low-power tests) of the strata is 1.80~1.92W/(m. °C).The initial average temperature of the layer shal-lower than 100m is about 20.5°C, and the averagecomprehensive thermal conductivity (average resultsof high- and low-power tests) of the rock-soil bodyin this layer is 2.06~2.09w/(m·°C)
(2) The heat removal capacity and heat recovery capac-ity of the double-U heat exchanger in the deep holehave increased 15.3% and 6.7% higher, respectively,comparing the double-U heat exchanger in the shal-low hole
(3) The energy cost per square meter of the ground sourceheat pump is 11.8 yuan for a building of one hundredthousand square meters which the heat removal poweris expected to be 9481kW in summer and 3070kW inwinter. And the annual emission of carbon dioxide, sul-fur dioxide, nitrogen oxides, suspended dust, and otherair pollutants to the atmosphere can be reduced by1442.5 t, and the solid waste ash and slag can be reducedby 59.7 t. The annual environmental treatment cost willbe saved by 166000 yuan
Data Availability
The data used to support the study are available within thearticle.
Conflicts of Interest
The authors declare no conflicts of interest.
Table 8: Pollutant emission reduction and cost-saving.
Item CO2 SO2 NOx Suspended dust Coal ash residue
ReductionUnit t/a t/a t/a t/a t/a
Formula (1Þ = 2:386M 2ð Þ = 1:7%M 3ð Þ = 0:6%M 4ð Þ = 0:8%M 5ð Þ = 0:1M
CostUnit Ten thousand yuan Ten thousand yuan Ten thousand yuan Ten thousand yuan /
Formula 0.1 yuan/kg 1.1 yuan/kg 2.4 yuan/kg 0.8 yuan/kg Freight costs
Table 9: Evaluation results of saving standard coal.
Project Heating load in winter (kW) Heat requirement for heating in winter (GJ) Saving standard coal (t)
Heating 4000 17496 597
Table 10: Evaluation results of emission reduction and cost-saving.
Item CO2 SO2 NOx Suspended dust Coal ash residue
Reduction (t/a) 1424 10.1 3.6 4.8 59.7
Cost (ten thousand yuan/a) 14.2 1.11 0.86 0.38 Freight costs
16001424
1400
1200
1000
800
600
Emiss
ioin
redu
ctio
n (t/
a)
400
200
010.1
CO2 SO2 NOXReducing emissions of pollutants
Dust Coal residue
3.6 4.8 59.7
Figure 15: Reducing emissions of pollutants.
13Geofluids

References
[1] W. Wang, J. Wang, Y. Luo, and Y. Zhang, “Assessment ofthree types of shallow geothermal resources and ground-source heat-pump applications in provincial capitals in theYangtze River Basin, China,” Renewable and SustainableEnergy Reviews, vol. 111, pp. 392–421, 2019.
[2] R. M. Singh, A. K. Sani, and T. Amis, “An overview of ground-source heat pump technology,” inManaging Global Warming,pp. 455–485, Elsevier Ltd, 2019.
[3] W. Xu, China Ground Source Heat Pump DevelopmentResearch Report (2018), China Architecture & Building Press,2019.
[4] K. Zhou, J. Mao, Y. Li, and H. Zhang, “Performance assess-ment and techno-economic optimization of ground sourceheat pump for residential heating and cooling: a case studyof Nanjing, China,” Sustainable Energy Technologies andAssessments, vol. 40, article 100782, 2020.
[5] H. Esen, M. Inalli, and M. Esen, “A techno-economic compar-ison of ground-coupled and air-coupled heat pump system forspace cooling,” Building and Environment, vol. 42, no. 5,pp. 1955–1965, 2007.
[6] H. Esen, M. Inalli, M. Esen, and K. Pihtili, “Energy and exergyanalysis of a ground-coupled heat pump system with two hor-izontal ground heat exchangers,” Building and Environment,vol. 42, no. 10, pp. 3606–3615, 2007.
[7] H. Esen, M. Inalli, andM. Esen, “Technoeconomic appraisal ofa ground source heat pump system for a heating season in east-ern Turkey,” Energy Conversion and Management, vol. 47,no. 9-10, pp. 1281–1297, 2006.
[8] G. Nouri, Y. Noorollahi, and H. Yousefi, “Designing and opti-mization of solar assisted ground source heat pump system tosupply heating, cooling and hot water demands,” Geothermics,vol. 82, pp. 212–231, 2019.
[9] A. Balbay and M. Esen, “Experimental investigation of usingground source heat pump system for snow melting on pave-ments and bridge decks,” Scientific Research and Essays,vol. 5, pp. 3955–3966, 2010.
[10] A. Balbay and M. Esen, “Temperature distributions in pave-ment and bridge slabs heated by using vertical ground-sourceheat pump system,” Acta Scientiarum-Technology, vol. 35,pp. 677–685, 2013.
[11] Q. Lu, G. A. Narsilio, G. R. Aditya, and I. W. Johnston, “Eco-nomic analysis of vertical ground source heat pump systemin Melbourne,” Energy, vol. 125, pp. 107–117, 2017.
[12] M. Esen and T. Yuksel, “Experimental evaluation of using var-ious renewable energy sources for heating a greenhouse,”Energy and Buildings, vol. 65, pp. 340–351, 2013.
[13] Q. Zhang, Y. Zhang, P. Gao, and Z. Yu, “Effect of natural coldsource on groundwater source heat pump according to labora-tory and field geotechnical thermal physical tests,” Energy andBuildings, vol. 84, pp. 557–566, 2014.
[14] Y. Zhang, P. Gao, Z. Yu, J. Fang, and C. Li, “Characteristics ofground thermal properties in Harbin, China,” Energy andBuildings, vol. 69, pp. 251–259, 2014.
[15] Y. Zhang, S. Hao, Z. Yu, J. Fang, J. Zhang, and X. Yu, “Com-parison of test methods for shallow layered rock thermal con-ductivity between in situ distributed thermal response tests
and laboratory test based on drilling in northeast China,”Energy and Buildings, vol. 173, pp. 634–648, 2018.
[16] G. Hellström, “Ground heat storage: thermal analyses of ductstorage system,” Physics & Astronomy, 1991.
[17] X. Zhang, E. Zhai, Y. Wu, D. Sun, and Y. Lu, “Theoreticaland numerical analyses on hydro–thermal–salt–mechanicalinteraction of unsaturated salinized soil subjected to typicalunidirectional freezing process,” International Journal ofGeomechanics, vol. 21, no. 7, article 04021104, 2021.
[18] C. Yavuzturk and J. D. Spitler, “Comparative study to investi-gate operating and control strategies for hybrid ground sourceheat pump sys-tems using a short time-step simulationmodel,” ASHRAE Transactions, vol. 106, no. 2, pp. 192–209,2000.
14 Geofluids