Challenges and opportunities for Nepal’s small and medium ...

Government of NepalMinistry of Forests and Environment
March 2021
Assessment of Electric Cooking Targets for Nepal’s 2020 Nationally Determined Contributions (NDC)

Government of NepalMinistry of Forests and EnvironmentClimate Change Management DivisionSingha Durbar, Kathmandu, Nepal
Phone: (+977-1) 4211567Fax: (+977-1) 4211868Website: www.mofe.gov.npE-mail: [email protected]
© Government of Nepal, Ministry of Forests and Environment (MoFE), March 2021.
Report Prepared by: Climate Analytics under the IMPACT project, supported by the German Federal Ministry for the Environment, Nature Conservation Building and Nuclear Safety; and under the Climate Action Enhancement Package (CAEP) initiative coordinated by the NDC Partnership.
Contributors:Ministry of Forests and Environment: Dr. Radha Wagle, Dr. Maheshwar Dhakal, Raju Sapkota, Dr. Keshab Goutam, Hari Laudari, Shreejana BhusalClimate Analytics: Subarna Prasad Kapali (consultant), Eriko Shrestha, Manjeet Dhakal, Sneha Pandey, Dr. Jan Sindt, Rachel PhamNDC Partnership Support Unit: Abhishek Yadav
Citation: MoFE. 2021. Assessment of Electric Cooking Targets for Nepal’s 2020 Nationally Determined Contributions (NDC), Ministry of Forests and Environment (MoFE), Kathmandu.
Cover Photo Details:Women collecting firewood in rural Nepal. Steinberger, Simon 2010. Open-sourced. Accessed 20 May 2020, < https://pixabay.com/photos/nepal-carrier-baskets-firewood-390/>.
based on a decision of the German Bundestag

Government of NepalMinistry of Forests and Environment
P.O. Box No. 3987Singha Durbar, Kathmandu
Phone: +977 01 4211567 +977 01 4211892
Fax: +977 01 4211868 Email: [email protected]: www.mofe.gov.np
Ref. No.:

Government of NepalMinistry of Forests and Environment
P.O. Box No. 3987Singha Durbar, Kathmandu
Phone: +977 01 4211567 +977 01 4211892
Fax: +977 01 4211868 Email: [email protected]: www.mofe.gov.np
Ref. No.:
| Page 5
Foreword 3
Acknowledgments 4
Acronyms 7
About the Study 9
1. Background 11
2. Socio-Economic Status 12
3. PolicyPrioritiesandStrategies:EnablingEnvironmentforE-Cooking 133.1 TheConstitutionofNepal2015 133.2 PowerSectorPolicies 143.3 RenewableEnergyPolicies 153.4 TheEnergyWhitePaperofMoEWRI 163.5 FederalPeriodicPlans 173.6 ProvincialPeriodicPlansandAnnualBudgets 183.7 SustainableEnergyForAll&SustainableDevelopmentGoals 193.8 ClimateChangePoliciesandCommunications 20
4. PromotionalInitiativesforE-Cooking 204.1 Government 204.2 DevelopmentPartners 214.3 CivilSocietyandPrivateSector 22
5. Energy Scenario 225.1 Electricity 225.2 RenewableEnergy 255.3 PetroleumProducts 265.5 E-CookingAppliances 27
6. OpportunitiesandChallengesforE-CookingPromotion 28
7. E-CookingTargetsinthe2020NDCandBackgroundLEAPAnalysis 297.1 BusinessAsUsual(BAU)Scenario 317.2 AmbitiousE-CookingScenario 337.3 EmissionReductionsAttributabletoAmbitiousE-CookingScenario 35
8. Recommendations 36
References 37AnnexI:ListofExpertsandStakeholdersConsultedDuringtheStudy 39AnnexII:NEA’sEstimationofImpactof500,000InductionStovesonPeakDemand 41
Table of Contents

List of TablesTable1. Macroeconomictargetssetinthe15thPlanApproachPaper 18Table2. TargetssetintheProvincialPeriodicPlans(2019/20-2023/24) 19Table3. TargetsforSEforAll 19Table4. SDG7:Ensureaccesstoaffordable,reliable,sustainableand
modernenergyforall 23Table5. Loadforecast 23Table6. Totalenergyavailableandpeakdemand 23Table7. Electricitysales(GWh) 24Table8. Installedandplannedcapacityofthenationalgrid 24Table9. HighVoltagetransmissionlines 24Table10. Highvoltagegridsubstations 25Table11. Accesstoelectricityatmunicipallevel(FY2018/19) 25Table12. Accesstoelectricity 26Table13. Cumulativeachievementofrenewableenergy 26Table14. Importofpetroleumproductsin2018/19 26Table15. TotalLPGconsumptioninMT 27Table16. Statusofcleancookingpromotion(numbers) 30Table17. Cumulativenumberofhouseholdsadoptingvarious
cookingoptionsbythegivenyearinBAUScenario 33Table18. Cumulativenumberofhouseholdsadoptingvariouscooking
optionsbythegivenyearintheAmbitiousElectricCookingScenario 35
List of Figures
Figure1. Percentageofhouseholdsusingvariouscookingfuel 11Figure2. Sourceofenergyconsumed(L)andtotalenergyconsumed
bysector(R),2020 22Figure3. Percentshareofhouseholdsusingdifferenttypesofcookstoves
from2010to2019 31Figure4. Percentshareofhouseholdsusingdifferenttypesofcookstoves
intheBAUScenario 32Figure5. Percentshareofhouseholdsusingdifferenttypesofcookstoves
intheAmbitiousElectricCookingScenario 34

AEPC AlternativeEnergyPromotionCentre
A Ampere
BAU BusinessAsUsual
BMU FederalMinistryoftheEnvironment,NatureConservationandNuclear Safety(Germany)
CAEP ClimateActionEnhancementPackage
CBS CentralBureauofStatistics
CCA CleanCookingAlliance
CCS4ALL CleanCookingSolutionsforAll
CO2 CarbonDioxide
COVID-19 CoronavirusDisease2019
E-cooking Electriccooking
ERC ElectricityRegulatoryCommission
FY FiscalYear
GCF GreenClimateFund
GDP GrossDomesticProduct
GgCO2e GigagramsofCO2equivalent
GHG GreenhouseGas
GoN GovernmentofNepal
GWh GigawattHours
ICST2 ImprovedCookstovesRankedTier2
ICST3+ ImprovedCookstovesRankedTier3orAbove
IKI InternationalClimateInitiative
IPP IndependentPowerProducers
kL Kilolitres
kV Kilovolt
kW Kilowatt
kWh Kilowatt-hour
LEAP LowEmissionsAnalysisPlatform
Acronyms

LPG LiquefiedPetroleumGas
MoEWRI MinistryofEnergy,WaterResourcesandIrrigation
MoFE MinistryofForestsandEnvironment
MT Metrictons
MToE MillionTonnesofOilEquivalent
MVA Megavoltampere
MW Megawatt
NACEUN NationalAssociationofCommunityElectricityUsers-Nepal
NDC NationallyDeterminedContributions
NDC-P NDCPartnership
NEA NepalElectricityAuthority
NOC NepalOilCorporation
NPC NationalPlanningCommission
PV Photovoltaics
SDG SustainableDevelopmentGoals
SEforALL SustainableEnergyforAll
TCS TraditionalCookstoves
UNFCCC UnitedNationsFrameworkConventiononClimateChange
USD UnitedStatesDollar
WECS WaterandEnergyCommissionSecretariat

| Page 9
About the Study
Nepal, a least developed country, produces very low levels of greenhouse gas (GHG)emissions. As a Party to theUnitedNations Framework Convention on Climate Change(UNFCCC)andtheParisAgreement,Nepalpursuesandsupportsefforts to limitaverageglobaltemperatureriseto1.5°Cabovepre-industrial levels.In2016,NepalsubmitteditsfirstNationallyDeterminedContributions(NDC)totheUNFCCC,outliningvarioustargetsfor2020intheshort-termandfor2050inthelong-run.Amongothertargetsinthe2016NDC,Nepalaimedtoreducedependencyonbiomassbyscalinguprenewableenergyandpromotingfuel-efficientbiomassorbiogascookstoves.In2020,theMinistryofForestsandEnvironment(MoFE)revisedNepal’sNDCfocusingonthetimeframeof2020to2030andupdateditstargetsoncookingfuels.
Throughanalysisofnationalpolicies,markets,technologiesandelectricityavailability,andthrough numerous expert and stakeholder consultations (see Annex I), this report waspreparedtohelp informNepal’s2020NDCtargetsonelectriccooking.Additionally, thisassessmentalsohelpsinformNDCimplementationbyrecognizingcrucialgapsinNepal’spolicy,marketsandenergysectorandidentifyingsolutionstomeetthem.
Chapter1and2giveabriefbackgroundregardingthestatusofcookingtechnologiesandelectricitysupplyinNepalanddiscussthecurrentsocio-economiccontextofthecountry.Chapter 3 identifies federal and provincial policies and strategies related to e-cooking.Chapter4outlinestheinitiativestakenbytheGovernmentofNepal(GoN),developmentpartners, civil society and private sector to promote e-cooking in the country. Chapter5 discusses the current trendsof electricity demand, transmission anddistribution, andcleancookingappliancesadoption.Chapter6 identifieschallengesandopportunities fore-cookingpromotion.Chapter7presents theBusinessAsUsual (BAU) Scenarioand theAmbitious E-Cooking Scenario, both of which informed the 2020 NDC. The AmbitiousE-CookingScenarioinformedthe2020NDCtargetsoncookingtechnologieswhiletheBAUScenarioprovidedabasisforcomparison.Thesescenariosweredesignedtakingthepolicyandtrendanalysispresentedinthisreportintoaccount,aswellastherecommendationsof numerous experts (seeAnnex I), theGoN-appointedNDCWorkingGroup, andotherlineministriesandgovernmentagencies.The2020to2030trendprojectionsoncookingtechnologyadoptionandGHGemissionsunderthesetwoscenariosweredevelopedusingthe LEAP (The Low Emissions Analysis Platform) modeling software. While this reportpresentstheresultsofthisLEAPanalysis,theaccompanyingNepalMitigationAssessmentReport(2021)describestheLEAPmethodologyinmoredetail.Finally,Chapter8providesrecommendationstomeetthe2020NDCtargets.
To supportMoFE inNepal’s 2020NDC revision process, ClimateAnalytics has providedtechnicalservices,includingthise-cookingsectoralassessment,throughtheIMPACTprojectwithfinancialsupportfromtheGermanBMUandIKIcluster,aswellasthroughtheNDCPartnership’sClimateActionEnhancementPackage(CAEP)initiative.


| Page 11
1. Background
InNepal,amajority (52.4%)ofthepopulationstilldependonsolidbiomassforcooking(CBS,2017).Aboutone-third(33.1%)ofthepopulationuseLiquefiedPetroleumGas(LPG)ascookingfuelasshownin Figure 1below.Theuseoffirewoodismoreprevalentinruralareas(65.8%)comparedtotheurbanareas(35.4%).Morethanhalf(54.1%)ofurbanhouseholdsuseLPGforcookingwhileonly16.5%ofruralhouseholdsuseLPG.In2015/16,theproportionoftheurbanpopulationusingelectricityforcookingwas37.9%,whichstoodat33%inthepreviousyear(CBS,2016).Thepracticeofelectriccooking(e-cooking)isgraduallyincreasinginrecentyears,particularlyafterthemegaearthquakeandenergycrisisin20151.
Figure 1. Percentage share of households using various cooking fuelSource:(CBS,2017)
Thereisgrowingpoliticalcommitmentandinterestamongpolicymakers,civilsocietyanddevelopmentpartnerstoreplacetraditionalcookingfuelswithcleanercookingoptionssuchashighlyefficientbiomasscookstoves,aswellasbiogasandelectric cookstoves.Despitebeing thecleanestoption,e-cookingwasnotconsideredapriorityinprogrammessuchasthoseimplementedbyAlternativeEnergyPromotionCentre(AEPC)undertheEnergySectorAssistanceProgrammeandtheNationalRuralandRenewableEnergyProgramme.Incontrasttopasteffortswhichfocusedontechnologies/devicesthatcouldmoreefficientlycombustsolidbiomass,however,newopportunitiesarebeingcreatedforthepromotionofmoderncleancookingfuelssuchaselectricity,biogasandcompressedbiomasspellets/briquettes. As of mid-2019, 425,511 household biogas systems, 247 institutional andcommunity biogas plants, 1,423,242 mud improved cookstoves, and 85,805 metallicimprovedcookstoveshavebeeninstalled(AEPC,2019).
1 To meet its domestic needs, Nepal imports all petroleum products, including LPG, from India. The undeclared economic and transit embargo imposed by India, which began on 23rd September 2015 and lasted for over two months, sharply curtailed the supply of these petroleum products, including LPG, in Nepal. Nepali households reliant on LPG for cooking switched to firewood or electric cookstoves.

| Page 12
Thequalityandreliabilityoftheelectricitysupplyhasgreatlyimprovedinrecentyears,whichisapre-conditionforadoptinge-cooking.ElectricityproductioninNepalisexpected toincreasesignificantlyintheupcomingyears.Nepalhasseveralhydropowerprojectsinpipeline,whichareexpectedtobecompletedintheimminentfuture(suchasthenationalpriorityproject,UpperTamakoshiHydroelectricProjectwiththeinstalledcapacityof456MW).Therearealsoseveralongoingandplannedprojectsonextensionandimprovementoftheelectricitytransmissionanddistributionsystems.
Thecountryhaspoliticalaspirationfore-cookingasitcouldsignificantlyhelpeasethetrade-deficit burden (Chitrakar, 2019) (Nakarmi, 2019).Moreover, several studies have established that cooking on efficient electric appliance (such as induction cookstove) ischeaper than cooking on traditional cookstoves (TCS) and LPG cookstoves (CCA, 2019)(Koirala,2019)(Nakarmi,2019).
IndoorairpollutionisoneofthelargesthealthrisksinNepal.Smokefromcookstoves thatutilizebiomassfuels(firewood,cattledung,oragriculturalwaste)cancausearangeofchronicand acute health effectswith deadly impacts, such as child pneumonia, lung cancer andchronicobstructivepulmonaryandheartdiseases.AWorldHealthOrganizationstudyfoundthatapproximately7,500prematureannualdeathsoccurinNepalduetoindoorairpollution(WorldBank,2014).Switchingtomoreefficientcookstoves,aswellasfuelsourcessuchasbiogasorelectricity,hasthebenefitofreducingpollution-relatedillnessesaswellasreducingdeforestation.Thereisasignificantmarketforbiomass-efficientcookstovestransition,withapproximately3.75millionhouseholdspotentiallyavailabletoswitchtoimprovedbiomasscookstovesintheshortterm,andsome800,000householdstoswitchtodomesticbiogas.TCShaveanefficiencyoflessthan10%;whereasimprovedbiomasscookstoveshaveefficienciesofgreaterthan25%andposelessofathreattotheenvironment.
2. Socio-Economic Status
Demography
By2030,thepopulationofNepalisprojectedtocrossthe33millionmark(CBS,2018).Theaveragehouseholdcontains4.5personswith4.3in urbanand4.7inruralareas.Theproportionofpopulationintheworking-agegroupof15-59yearsis60.5%(CBS,2017).
Literacy
Theoverallliteracyrateis68.3%forthepopulationofage5yearsandabove.Thereisa widegapinmale(76.8%)andthefemale(60.5%)literacyrates.Similarly,theurban-ruraldifferenceinliteracyisfoundnoticeablewith73.8%inurbanand64.3%inrural(CBS,2017).
GDP
AftertheenactmentofthenewConstitutionofNepal2015,theGrossDomesticProduct(GDP)has increased steadilyand remainedhigh compared to theperiodbefore2015.

| Page 13
Duringthe constitutionformulationperiodfrom2008to2015,thepoliticalsituationwasvolatileandtheGDPgrowthrateremainedlowbetween2.97%to5.72%.TheFY2015/16sawthelowestgrowthrateof0.2%duetotheadverseimpactofthemegaearthquakeandtheenergycrisis.TheGDP(atbasicprices)growthratestoodat6.99%in2018/19(CBS,2020).AsalmostallthesectorsofNepal'seconomyhavebeenhitbyCOVID-19pandemic,itisexpectedthattheGDPfornextfewyearswillremainbelowaverage.AccordingtotheforecastbyCBS,GDPisexpectedtofallto2.27%in2020/21duetoCOVID-19(CBS,2020).
The 25 year vision set in the 15th Five-Year Plan (2019/20-2023/24) expects a steadygrowthofGDPduringthisperiod,achievinga10.3%growthratein2024,andthereaftermaintaininga10.5%growthrateintheremainingyears.2Theambitiousmacroeconomictargetssetinthe15thFive-YearPlanareexpected toguideNepalintothedevelopingcountrystatusby2023.
Employment, Income and Poverty
ThepresentunemploymentrateinNepalis11.4%.ThepercapitaincomeofthecountrywasUSD1,047inFY2018/19,whichhassinceincreasedtoUSD1,085inFY2019/20(MoF,2020).Nepal’spovertyisgraduallydecreasing:thepopulationlivingunderabsolutepovertylinehasdecreasedfrom25.2%inFY2011/12(MoF,2012)to16.67%inFY2019/20(MoF,2020).Unemploymenthasalsodecreasedto16.67%inFY2019/20(MoF,2020).Itisexpectedthattheemploymentsectorwillbenegatively impactedbytheCOVID-19pandemic,andthereturnofNepaliworkers,mainlyfromGulfcountries,isprojectedtocausea20%declineofremittances(CBS,2020).
3. Policy Priorities and Strategies: Enabling Environment for E-Cooking
Theexistingpolicyinterventionsonenergyaregearedtowardsensuringnationalenergyself-sufficiencyandenergyaccesstoall.Nepalhasmorethanfivedecadesofexperiencein renewableenergydevelopment.Renewableenergyandcleancookingreceivedpolicyprominencearoundtwodecadesagointhecountry.
3.1 The Constitution of Nepal 2015
Withtheenactmentof theConstitutionofNepal2015on20thSeptember2015,Nepalenteredfederalismwiththreelevelsofgovernance,namely,federal,provincialandlocal.Nepalhas7provinces,6metropolitancities, 11sub-metropolitancities,276municipalitiesand460ruralmunicipalitiesmakeupthelocalgovernment.Thefederal,provincialandlocallevelgovernmentscanmakedecisions,enact laws,prepareand implementpolicies,andprepareplansandannualbudgetswithintheirareasofauthority.
2 Contrary to this vision, the COVID-19 pandemic is expected to adversely impact the economy with substantially slower growth rates for the coming years. The extent of the impacts remains unclear, however.

| Page 14
TheConstitution in itsDirectivePrincipleshasgivenpriority tonational investment inwater resources and renewable energy. The Directive Principles emphasize people’s participation and multi-utility development of water resources including hydropower.Furthermore,ithighlightstheState’sroleinpursuingapolicyofdevelopingandproducingrenewableenergy;ensuringacheap,easilyavailableanddependablesupplyofenergy;andensuringappropriateusagetomeetthebasicneedsofthecitizens(GoN,2015).
As per the Constitution (Schedule 8), the development of alternative (renewable)energy falls under the jurisdiction of the local government. Likewise, the provinciallevel electricity development falls under the jurisdictionof theprovincial government(Schedule 6). Electricity is also a concurrent jurisdictional issue for all three levels ofgovernment (Schedule 9). Local governments can formulate local level policies, laws,standardsandregulations relatingtorenewableenergy.Theyareresponsibleforprojectplanning,implementation,technologydevelopment,technologytransfer,capacitybuildingaswellaspromotionatthelocallevel.
Government jurisdiction on different renewable energy-related projectsProvincialGovernment LocalGovernment Concurrent(Federal,ProvincialandLocal)
Schedule6:no.7Provinciallevelelectricity,irrigationprojects,drinkingwater,transport
Schedule8:no.19Drinkingwater,smallelectricityprojects,alternativeenergy
Schedule9:no.5Serviceslikeelectricity,drinkingwater,irrigation
3.2 Power Sector Policies
VariouspoliciesandlegalinstrumentsareinplaceguidingandregulatingNepal’shydropowerdominatedpowersector.Thepowersectoristransitioningtoaccommodatemoreprivatesectorplayersingenerationanddistributionofelectricitywithhighemphasisbeingplacedonuniversalaccessofelectricityforallcitizens.Asinglenationalgridsystemisthebackbonefordistributingelectricitytothepopulation.Ruralelectrificationthroughgridextensionaswellasthroughtheinstallationofoff-gridmicro-hydroandsolarsystems,includingsolarandwindhybridsystems,hasreceivedhighprominenceinpoliciesandplans.
The Nepal Electricity Authority (NEA), established as an autonomous corporate bodyundertheNepalElectricityAuthorityAct 1984,istheprincipalinstitutionresponsibleforgenerating,transmitting,anddistributingelectricityinanefficient,reliableandconvenientmanner(GoN,1984).AstheownerandmanagerofIntegratedNepalPowerSystem(thegrid),NEAwasalsomandated todetermineelectricity feesandotherelectricity relatedservicecharges.
The HydropowerDevelopmentPolicy2001,which is a revisionof thefirstHydropowerDevelopment Policy (1992), remains in effect till today, and deals with electricityinfrastructureaspects,suchaspowermarkets,transmissionanddistribution,anddemandmanagement.Itemphasizesregular,reliableandsustainablepowersupplyatareasonableprice and low-cost generation, ties up electrification to economic activities and viewselectricityasanexportablecommodity.

| Page 15
AnewdraftofElectricityBill2019isunderdiscussioncurrentlywhichenvisagesamulti-actormarketforelectricity,proposesde-bundlingoftheNEAandprovidesspaceforprivatesectornotonlyingenerationbutalsoinmanagementoflocaliseddistributionsystems.However,thetransmissionsystem(thenationalgrid)andelectricityplanningwillbetheresponsibilityofdedicatedgovernmentinstitutions.Qualityandsafetyofsupplyisemphasizedandbothdomesticandcross-borderelectricity tradeareelaborated.Thisact isexpected tobringaboutaparadigmshiftintheelectricitymarketinthecountry.
Inthemeantime,theGoNhasenactedtheElectricityRegulatoryCommission Act2017. As per the Act, an Electricity Regulatory Commission (ERC) has been created, which is mandated to regulate the market system of generation, transmission, distribution andtradingofelectricity(asenvisagedbythe2019electricitybill).Italsosetsanelectricitytariffthatensuresconsumerwelfarebycreatingacompetitiveenvironment.
3.3 Renewable Energy Policies
Therenewableenergy-relatedpoliciesdiscussedinthissectionhaveprovidedathrustforthepromotionofrenewableenergytechnologies,particularly for lightingandcooking inoff-grid areas. Together, these policies identify community engagement, private sectorparticipation,creditfinancingthroughcommercialbanks,andmicro-financingasimportantfactorstopromoterenewableenergy.Thesepoliciesenvisionimprovedbiomasscookstoves,biogas and solar cooking as clean cooking options. While the policies do not mentione-cooking,theystillguidethepromotionofe-cookingtechnologiesinNepalcurrently.
The RuralEnergyPolicy2006aimedtoensureaccesstoclean,reliableandappropriateenergyin rural areas contributing to rural poverty reduction and environmental conservation. Thepolicyemphasizedreducingdependencyontraditionalenergyandconservingtheenvironmentbyincreasingaccesstocleanandcost-effectiveenergyinruralareas.Thepolicyhasidentifiedvarious renewable energy technologies (RETs) to be promoted including household biogasdigestersandimprovedbiomasscookstovesascookingoptions.Thepolicyprovidedguidanceontechnologydevelopmentandsubsidyprovisionrelatedtobiogas,andadditionallyemphasizedtheimportanceofresearchanddevelopment,aswellasawareness-raisingtoincreasehouseholdandinstitutionaladoptionofimprovedbiomasscookstoves(MoE,2006).
The RenewableEnergySubsidyPolicy2016,currentlyineffect,isthelatestrevisionoftheRenewableEnergySubsidyPolicy2013,whichwasareformulationofthesubsidyprovisionfirstpromulgatedin2000andsubsequentlyrevisedin2006and2008.TheSubsidyPolicy2016aimstoachieveuniversalaccesstoclean,reliableandaffordablerenewableenergysolutions by 2030. The policy aims to reduce dependence on traditional and importedenergybyincreasingaccesstorenewableenergy.Itpresentsrenewableenergyasanoptionto improvethelivelihoodsofpeopleandcreateemploymentopportunities,especially intheruralareas.Thepolicyhasstipulatedsubsidyamounts forvariousrenewableenergyoptions, including for portable metallic biomass rocket cookstoves and the amount ofcreditthatshouldbemobilised.Thepolicyhassetspecialsubsidyforearthquake-affectedhouseholds.Thepolicyalsoseekstoencouragepublic-privatesectorparticipationtohelpreduceprivatesector’sinvestmentrisksandtomobilisecommercialcredit(MoPE,2016).

| Page 16
The SubsidyDeliveryMechanismforRenewableEnergy2016describesthemodalityfordisbursing subsidy as provisioned in the Subsidy Policy 2016. The Delivery Mechanismemphasisessystemoptimizationthroughhighqualityofproducts (i.e. renewableenergysystemcomponents)assuredthroughtestingbyaccreditedinstitutions,reliabilityofsupplythroughmobilizationofcompetentcompaniesandoperationalizationofthegovernmentpublicprocurementlegislation(AEPC,2016).
The NepalInterimBenchmarkforSolidBiomassCookstovesisthefirsttosetatechnicalstandard and protocol for testing performance and safety of solid biomass cookstoves.Themajorparametersdefiningtheperformanceincludethermalefficiencyandemissionsof PM2.5and carbonmonoxide (AEPC, 2016a). The standard has defined criteria to rankcookstovesintofivedifferenttiers,suchthatthehighertierdenotescleanercooking.
The Biomass Energy Strategy 2017 envisions promoting biomass energy as a reliable,affordable and sustainable energy resource to address the increasing energy demand ofNepal.Itaimstopromotecleancookingtechnologiesofatleasttier3toallhouseholdsby2030.TheStrategyinitsmissionstatementhasemphasizedmodernizingtheuseofbiomassenergythroughmarketdevelopment.Oneoftheelaboratedworkingprinciples(Article9.3.3)emphasizesondevelopingappropriatesystemandmarketforcommercializationofbiomassenergy,andensuringthesalesanddistributionoftheproducedbiomassenergy(MoPE,2017).
The National EnergyEfficiencyStrategy2018 is thefirstof its kindpolicydocument thatenvisionsbuildingenergysecuritythroughefficientuseanddistributionofavailableenergy.Ithassetalong-termgoaltodoubletheenergyefficiencyfrom0.84%peryear,whichexistedduringtheperiodof2000-2015,to1.68%peryear in2030.Thestrategyaimstomaintainenvironmental balance and bring positive improvements in health through efficient useof energy.Amongothers, theworkingprinciplesof the strategyalso focusondevelopingminimumenergyperformancestandardsforelectricalandmechanicalequipmentbeingusedinvarioussectors(MoEWRI,2018a).Thescopeoftheprincipleincludescleancookingaswell.
TheNepalCouncil for StandardsendorsedElectricCooktopStandards2018,which setstechnical standards forhousehold inductionhobsandhotplates.Of the four interlinkedstandardsendorsed,thegeneralsafetystandard(NS564)dealswiththesafetyofelectricalappliancesforhouseholdandsimilarpurposes.Theparticularstandards(NS561andNS562)dealswithelectricalsafetyof inductioncooktopandelectrichotplatesrespectively.Thefourthstandard(NS563)hassettheperformancevaluesanddescribedmethodsformeasuringtheperformanceofinductionhobsforhouseholduse.
3.4 The Energy White Paper of MoEWRI
InMay2018,theMinistryofEnergy,WaterResourcesandIrrigation(MoEWRI)releasedthe“PresentSituationandFutureRoadmapofEnergy,WaterResourcesandIrrigationSector(WhitePaper)”,whichprovidespolicydirectionsandsetsphysicaltargetsfortheenergysector.

| Page 17
TheEnergyWhitePaper is thefirstpolicypaper thathasexplicitlyprovidedguidancefor thepromotionofe-cooking ineveryhousehold.Asa result,e-cookinghas receivedprominence insubsequentlyformulated15thFive-YearPlanandinAEPC’sactivityplan.
TheEnergyWhitePaperhasemphasizedimprovementinpolicyregimethroughdevelopmentandpromulgationofIntegratedNationalWaterResourcesPolicyandrevisionofElectricityActandNEAAct.TheElectricityRegulatoryCommissionAct2074isalreadyinplaceandtheERCisfunctional.
TheEnergyWhitePaperalsoprovidesimpetustodevelopandimplementtheRiverBasinandUserMasterPlan,andtheProvinceDistributionMasterPlan.Throughthese,inadditiontomodernizingtheelectricitydistributionsystem,projectsemphasizingrenewableenergyand energy efficiency will also be implemented tomobilize international and domesticcarbonfinancing.
TheEnergyWhitePaperhasformulatedseveralcampaignstoensureprovisionofenergyservices toall including ‘EveryHousehold,EnergyHousehold’, ‘EverySettlement,EnergySettlement’,and‘ElectricStoveinEveryHousehold’.
TheEnergyWhitePaper(2018)hassetsomeambitioustargetsasfollows:
Within Year 3
• Additional3,000MWcapacitywillbeinstalled• Countrywillbeself-sufficientintermsofelectricity• Formanagementandutilizationofwaterresourcesriverbasinplanandotherusefulschemes
willbedeveloped
Within Year 5
• Additional5,000MWcapacitywillbeinstalled• Transmissionanddistributionlineswillbedevelopedtoensureallhouseholdshaveaccess
toelectricity.Wherecentralgridaccessisnotpossible,micro-hydro,solarandwindenergysystemswithbatterystoragewillbeused
• Percapitaelectricityconsumptionwillreach700kWh
WithinYear10 • Additional10,000MWcapacitywillbeinstalled• Percapitaelectricityconsumptionwillreach1500kWh
3.5 Federal Periodic Plans
Federallevelplansthatcurrentlyhavethemostrelevanceforthecleancookingsectorincludethe15thFive-YearPlan(2019/20-2023/24)andCleanCookingSolutionForAllby2017(CCS4ALL).
The 15thFive-YearPlansetsaplanforfiveyearsstartingfromFY2019/20toFY2023/24andpresentsthe25-yearlong-termvisionoftheGoNtoachieve“ProsperousNepal,HappyNepali”.Oneofthekeyaspectsofprosperity,asdefinedinthePlan,includes‘Accessiblemoderninfrastructureandintensiveconnectivity’.‘Increaseinhydropowerandpromotionofgreeneconomy’isconsideredanimportantfactorfortransformationinthisplan.
The15thFive-YearPlanhasastrategicfocusonattractingdomesticandforeigninvestmentonhydropowergeneration,extendingandimprovingtransmissionlinesforthereliablesupplyofelectricity,increasingenergyefficiencyandaccesstoelectricity,diversifyingenergymixandbolsteringenergysecurity,andstrengtheninginstitutionalmechanisms.Onhydropowerdevelopment,theplanaimstoprepareand implementanelectricitydistributionmaster

| Page 18
planfocusingonscaling-upenergydevelopmentandincreasingelectricityconsumption.Theplanhasaworkingpolicytoextendruralelectrificationthroughcommunityparticipationandtosetappropriatetarifftoencouragee-cooking.Theplanfurtheraimstoformulaterenewableenergystrategyandactionplan.
GuidedbythepolicydirectionprovidedintheEnergyWhitePaper,the15thFive-YearPlanhasformulatedstrategicactionstopromotee-cookingthroughinterventionsonelectricitytariffanddevelopmentofe-cookingstandards.Alongwithe-cooking,theplanalsoenvisionsthepromotionofimprovedbiomasscookstoves.Inlinewiththeconstitutionalprovision,theplanaimstocapacitateandassistlocalgovernmentsformobilizationofresourcesforenergydevelopment.ItalsoaimstoestablishinstitutionalstructuressuchastheProvinceEnergy Fund and Local Energy Fund, and provide privileged interest rates on credit forrenewableenergyinvestments.
Themajorelectricity-relatedtarget inthe15thFive-YearPlan isgenerationofmorethan5,000MWofelectricity,provideelectricityaccesstotheentirepopulation,andincreasepercapitaelectricityconsumptionto700kWhby2023/24.
ThePrimeMinisterofNepalannouncedthe“CleanCookingSolutionForAllby2017(CCS4ALL)” in January 2013. The ambitious CCS4ALL has become the guiding strategy for developingsubsequentpoliciesandplansoncleancooking.WhileCCS4ALLdidnotincludee-cookingasacleancookingoptiontopromote,mostlyfocusingonbiogas,efficientbiomasscookstovesandbriquette/pellets,itstillprovidescleancookingaspirationfortheupcomingdecade.
3.6 Provincial Periodic Plans and Annual Budgets
The Provincial Periodic Plans (2019/20-2023/24), prepared for the first time by provincialgovernments,arefocusedon increasingaccesstoelectricity.ThissectionaccessesthecleanenergyrelatedtargetsintheseperiodicplansaswellastheProvincialBudgetsfortheFY2019/20.
Table 1. Targets of provincial periodic plans (2019/20-2023/24) and annual budgets (2019/20)Province Targets
Province1
• By2024,ensureelectricityaccesstoallhouseholds• By2024,ensure1500MWelectricitygenerationthroughhydropower• By2024,produce2MWelectricityfromsmallmicro-hydro,2MWfromsmallsolarenergy,1
MWfromwindenergy• By2024produce200MWelectricityfromsolarenergy• By2024,installbiogasplantsin20,000household• By2024,replaceLPGcookstoveswithe-cookingstoves• ByFY2019/20,ensuresubsidyprovisionforhouseholdsinterestedinpurchasingsolarpanels
Province2
• By 2024, connect at least 2MWof solar power to the grid through private and local levelcooperationand10MWfromtheprovinciallevel
• By 2024, promotemultifunctional technologies of renewable energy and replace cow dungusedforcookingwithcleanenergy
BagmatiProvince
• ByFY2019/20,developruralelectrificationprogramandrenewableenergyprogramtoprovideelectricity and clean energy technology to households so that the federal government cansuccessfullyoperatethe‘BrightNepal’campaign.

| Page 19
Province TargetsGandakiProvince • By2024,increaseinstalledcapacityofhydropowerto3,000MW
LumbiniProvince
• Promotecommercialbiogas,briquetteandbiodiesel• By2024,increaseinstalledcapacityofhydropowerto150MW• By2024,increaseinstalledcapacityofsolarphotovoltaics(PV)systemsto300MW• By2024,ensurethatatleast10industrieswillproducecommercialbiogas
KarnaliProvince • By2024,increaseinstalledcapacityofhydropowerto200MW
SudurpaschimProvince
• ElectrifycommunitiesyetunservedbygridthroughsolarPVsystems• Identifyanddevelophydropowerprojects
3.7 Sustainable Energy For All & Sustainable Development Goals
The international framework of Sustainable Energy for All (SEforALL) and SustainableDevelopment Goals (SDG) have provided long-term vision and goals for energy sectordevelopment.Nepalhasaligneditsperiodicplanandlong-termvisionswiththeseinitiatives.
In 2013, the National Planning Commission (NPC) released the report ‘Nepal: RapidAssessment and Gap Analysis’ which served as a basis for the formulation of Nepal’sSEforALLActionPlan.ThedocumentproposedvarioustargetswhichhavebeenconsideredtheSEforALLtargetsforNepalasshowninTable2below.
Table 2. SEforALL targetsTargets 2020 2025 2030Reducetheproportionofthepopulationthatusesolidfuels 50.4% 30.2% 10%Increaseaccesstoelectricity 83.4% 86.5% 99%Improveuniversaluseofhigh-efficiencyappliances 100%Source:(NPC,2013)
In thereport ‘Nepal'sSDGStatusandRoadmap:2016-2030’,NPCupdatednationalSDGindicatorstoalignwithglobalones3.SDG7concerningtheuniversalaccessofaffordable,reliable, sustainable andmodern energy is key to e-cooking promotion. The targets forseveralSDG7indicatorsareoutlinedinTable3below.
Table 3. SDG 7 Indicators and Nepal’s targetsSDG7Indicators 2015 2019 2022 2025 2030Proportionofhouseholdsusingcleanfuelandtechnologyasprimarysourceofenergyforcooking(%) NA NA NA NA NA
Proportionofhouseholdsusingsolidfuelasprimarysourceofenergyforcooking(%) 74.7 65 55 45 30
ProportionofpopulationusingLPGforcooking(%) 18 23.6 27.8 32 39Proportionofpopulationwithaccesstoelectricity(%) 74 80.7 85.7 90.7 99Electricityconsumption(kWhpercapita) 80 230 542 1027 1500Percapitaenergy(final)consumption(ingigajoules) 16 18.1 19.7 21.3 24Source:(NPC,2017)|NA=Notavailable
3 NPC is the designated agency for planning, budgeting, coordinating and monitoring the implementation of the SDG Roadmap.

| Page 20
The proposed specific targets for SDG 7 include generation of 15,000MW of installedcapacityby2030.
3.8 Climate Change Policies and Communications
The NationallyDeterminedContributions(NDC)communicatedbyNepalin2016recognizesthatbiomassfollowedbyfossilfuelsdominatetheenergymixofthecountry.The2016NDCaimedtoincreasetheshareofrenewablechangeintheenergymixto20%shareby2020.Itstargetsalsoaimedtoreducethecountry’sdependencyonfossilfuelby50%andachieve50%electrificationthroughrenewableenergysourcesby2050.Moreover,itenvisionedthatNepalwouldpursuealow-carboneconomicdevelopmentstrategy.The2016NDChassettargetsforcleancookingoptionssuchasbiomass-basedimprovedcookstovesandbiogascookstoves.
The NationalClimateChangePolicy(2019)aimstocontributetosocio-economicprosperityofthenationbybuildingaclimate-resilientsociety.Itseekstoguidethecountrytowardsagreeneconomybyadoptingthestrategyof low-carboneconomicdevelopment.Waterresourcesandenergyisoneofthepriorityareasidentifiedbythepolicywithenergysecurityasakeypolicyconcern.Thepolicyalsoencouragesproductionanduseofrenewableenergy,anduseofenergy-efficienttechnologies.
The SecondNationalCommunicationofNepal(2014)notedthattheoverallGHGemissionfromtheenergysectorwasincreasingwithatotalemissionof6,894GgCO2efromtheenergysectorinthebaseyear2000/01(MoSTE,2014),whichincreasedto13,331GgCO2eintheyear2011(TU,2017).TheSecondNationalCommunicationidentifiedresidentialsectorasthelargestGHGemitterintheenergysector,accountingforabout71%ofthetotalCO2e emissionfromtheenergysectorin2000/01.Thiscommunicationwasoneofthefirstofficialdocumentstorecognisee-cookingasasolutiontoreduceGHGemissions(MoSTE,2014).
TheNationalAdaptationProgrammeofAction (2010) identifiedurgent and immediatenationaladaptationneeds,recognizedhigherdependencyofthepopulationontraditionalbiomass for energy supply, and called for increased energy access towider population.Oneofthepriorityadaptationoptionsundertheenergysectorcallsforscalingupbiomassenergytechnologiestodecreasefuelwoodconsumption,andpromotingelectricalapplianceatthehouseholdlevel.
4. Promotional Initiatives for E-Cooking
4.1 Government
Establishedin1996throughtheGoN’sFormationOrder,AEPChasbeensuccessfullyleadingthepromotionofrenewableenergytechnologiesincludingcleancookingsolutions.Inthefirstyear (2019/20)of15thFive-YearPlan, theGoN announced the implementationofamulti-year‘TeraiCleanCookingProgramme’.Thisprogrammeaimstoreplacetraditionalfuelssuchasanimaldungwithtier3orbettercookstoves,modernbiomasscookstovesand

| Page 21
biogascookstovesin22districtsoftheTerairegion.ThroughthisinitiativeAEPChas,forthefirsttime,proposede-cookingsystemsasafeasiblecleancookingsolutionaswell.IntheFY2019/20,AEPCplannedtopromoteabout10,000inductioncookstovesand65,700biomasscookstovesintheTeraidistrictsinpartnershipwithinterestedlocalgovernments.Toacceleratethedistribution,AEPChasrequestedthefederalgovernmentforfundingtopromotee-cookingin100,000householdsinFY2020/21.
PotentialAEPCpipelinee-cookingprojectsinclude(AEPC,2020):• Accelerationofcookingsolutionsthroughmodern,climate-friendlyandefficientclean
cooking solution, including electric cooking. Duration of 5 years benefiting 1millionhouseholds,withe-cookingpromotedin0.5millionhouseholds.Currentlyatproposaldevelopment.GreenClimateFund(GCF).
• CleanCookingProgramfundedbyWorldBank/ESMAPDurationof5yearsbenefiting0.7 Million Households. Promotion of e-cooking in all households. Project is still inconceptualstage.TheWorldBankhasnotmadeacommitmentyet.
Somelocalgovernmentshavetakeninitiativestopromotepilotscalee-cookingprojectsbymobilisingtheconditionalgranttheyreceivedfromthefederalgovernment.Examples includeBaijanathRuralMunicipalitythatprovideduserspartialfinancialsupporttomeetupfrontcostin2019,andIlamMunicipalitythathastenderedfor648unitsofinductioncookstoves.
4.2 Development Partners
There is growing interest among international development partners and INGOs one-cooking. International agencies such as Clean Cooking Alliance (CCA) and GIZ haveundertaken some piloting initiatives to promote e-cooking in Nepal. Through the cleancookingproject,‘MaximizingtheHealthBenefitsofCleanHouseholdEnergyinUrbanNepal:ADemonstrationProject’,CCAanditslocalpartnershavepromotede-cooking,andaimedatcombatinghouseholdairpollutionbypromotingsmoke-freekitchencommunities.TheprojectwasimplementedinPanchkhalandMandandeupurMunicipalitiesinKavrepalanchokdistrictsfrom2017to2019.
GIZ’s EnDev programme supported a pilot project entitled ‘Market-Led Promotion ofE-cooking in Timal CommunityRural ElectrificationArea’ from2019-2020. Implementedby local partners, Ajummery Bikas Foundation and National Association of CommunityElectricityUsersNepal (NACEUN), themainobjectiveof thisprojectwas toobserve theimpact of increased induction cooktop usage on a locally managed power distributionsysteminTimalRuralMunicipalityaswellasmonitorforanybehaviourchangeinusers.Underanotherproject,GIZ/EnDevispromotingatleast1000electriccookstovesin2020.
Other INGOs such as Practical Action, Winrock International and SNV NetherlandsDevelopmentOrganisationareactivelylookingatopportunitiestopromotee-cookingbymobilisinginternationalfunds4.
4 This information was obtained through stakeholder consultations conducted to inform this study.

| Page 22
4.3 Civil Society and Private Sector
Some local institutionsdedicated tocommunityelectrificationandcleancookinghavetaken the initiative to promote e-cookingwith the objective of improving health andeconomicbenefits.AjummeryBikas Foundation,NACEUNandRadio Sagarmatha jointlyinitiated a national campaign on 25th January 2019 to encouragemarket-led promotionofe-cooking incommunityelectrificationareas.Thenationalcampaignaimstopromotee-cookinginmorethan500,000communityelectricityconsumersina5-yeartimeframeinpartnershipwithinternationaldevelopmentpartners5.
5. Energy ScenarioTheGoNhasrecognizedenergyaccessasavitalsteptoachieveeconomicprosperity,energysecurity,andcitizenwelfare.Accordingly, producingenoughelectricityfor self-sufficiencyisahighpriorityforthecountrynow.TheGoNhasdrawnattentiontothisnationalaspirationbydeclaring2018to2028asthe‘DecadeofEnergyandHydropower’(MoF,2019).
In2018/19,thetotalenergyconsumptioninallsectorsreached14MToE.Thetotalenergyavailableintheyearwas7551GWhandthetotalelectricityconsumptionwas4683GWh(MoF,2020).Thesourcesofenergyandtotalenergyconsumptionbydifferentsectorsaregivenbelow.
Figure 2. Source of energy consumed (L) and total energy consumed by sector (R), 2020Source:(MoF,2020)
5.1 Electricity
Asignificantgrowthinelectricitysupplyanddemandisexpectedintheupcomingdecade.AsshowninTable4,accordingtoaloadforecastbyNEA,thepeakloadisexpectedtoreach4,519MWin2025and7,542MWin2030.Inbothtargetyears,expecteddemandremainswellbelowtheexpectedpowergenerationcapacityaspiredbythepolicies.
5 This is as per a campaign paper jointly issued by Ajummery Bikas Foundation, NACEUN and Radio Sagarmatha.

| Page 23
Table 4. Load forecastYear Energy(GWh) Peakload(MW) Policyaspiration(MW)2019/20 10,138.28 2,225.7 -2023/24 15,332.65 3,703.3 5,0002025/26 20,585.22 4,519.1 -2030/31 34,355.49 7,542.0 15,000Source:(NEA,2019)
Currentlydomesticenergygenerationisinsufficientandthisscenarioisexpectedtolastfora fewmoreyears.However, thisgapcanbemetby importingpower from India. In2018/19,morethanathird(around37%)ofthetotalenergydemandwasmetbyelectricityimportedfromIndia,asseeninTable5.NEA’slatestannualreportshowsthattheimportofelectricityfromIndiahasdecreasedtoaround22%6in2019/20(NEA,2020).
Table 5. Total electricity availability and peak demandFY2018/19(a) TargetbyendofFY2019/20(b)
Peakdemand(MW) 1,320.28 -NEAgeneration(GWh) 2,548.11 2,964PowerpurchasefromIPP(GWh) 2,190.05 2,901PowerpurchasefromIndia(GWh) 2,813.07 2,792Availableenergy(GWh) 7,551.23 8,657
Source:(a)(NEA,2019);(b)(NEA,2020)
Domesticconsumersconsumethelargestshareoftheavailableenergy.In2018/19around4,157,887domesticconsumersconsumedabout44%(or2,806GWh)ofthetotalavailableenergy.WhileNEAhasexperiencedabouta3%growthintotalelectricitysalessince,theshareofconsumptionbydomesticconsumershasalsoslightlyincreasedtoaround46%in2019/20(NEA,2020)asshowninTable6below.
Table 6. Electricity sales (GWh)Consumersegment FY2018/19(a) TargetbyendofFY2019/20(b)Domestic(includingcommunitysales) 2,806 3,360.39Non-commercial 186 215.72Commercial 466 540.67Industrial 2,422 2,719.29Others 458 460.49Total 6,338 7,296.56
Source:(a)(NEA,2019);(b)(NEA,2020)
Substantialefforts arebeingmade to improve theelectricity generation, transmissionanddistributionsystemsofNepal.Whilecurrentgenerationcapacityhas laggedbehindpeakdemand, necessitatingthecountryto importelectricity fromIndia,a largenumberofprojects (more than2,500)areunderconstructionorhavealreadyachievedfinancialclosure.Table7showsthatifallprojectsunderconstructionarecompletedbythefinalyear(2023/24)ofthe15thFive-YearPlan,thetotalinstalledcapacityof4,759MWwillbemore
6 This is a provisional figure and may be subject to change later.
| Page 24
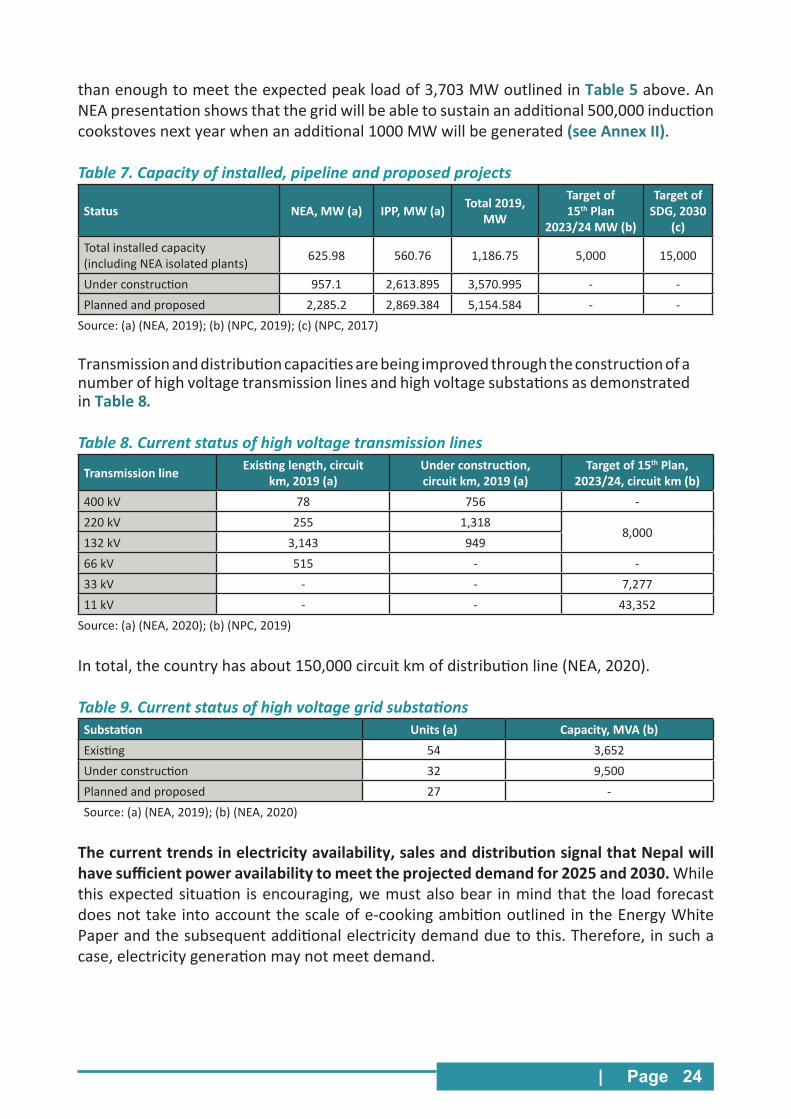
thanenoughtomeettheexpectedpeakloadof3,703MWoutlinedinTable5above.AnNEApresentationshowsthatthegridwillbeabletosustainanadditional500,000inductioncookstovesnextyearwhenanadditional1000MWwillbegenerated(seeAnnexII).
Table 7. Capacity of installed, pipeline and proposed projects
Status NEA,MW(a) IPP,MW(a) Total2019,MW
Targetof15th Plan
2023/24MW(b)
TargetofSDG,2030
(c)Totalinstalledcapacity(includingNEAisolatedplants) 625.98 560.76 1,186.75 5,000 15,000
Underconstruction 957.1 2,613.895 3,570.995 - -Plannedandproposed 2,285.2 2,869.384 5,154.584 - -Source:(a)(NEA,2019);(b)(NPC,2019);(c)(NPC,2017)
TransmissionanddistributioncapacitiesarebeingimprovedthroughtheconstructionofanumberofhighvoltagetransmissionlinesandhighvoltagesubstationsasdemonstratedinTable8.
Table 8. Current status of high voltage transmission lines
Transmissionline Existinglength,circuitkm,2019(a)
Underconstruction,circuitkm,2019(a)
Targetof15thPlan,2023/24,circuitkm(b)
400kV 78 756 -220kV 255 1,318
8,000132kV 3,143 94966kV 515 - -33kV - - 7,27711kV - - 43,352Source:(a)(NEA,2020);(b)(NPC,2019)
Intotal,thecountryhasabout150,000circuitkmofdistributionline(NEA,2020).
Table 9. Current status of high voltage grid substationsSubstation Units(a) Capacity,MVA(b)Existing 54 3,652Underconstruction 32 9,500Plannedandproposed 27 -Source:(a)(NEA,2019);(b)(NEA,2020)
Thecurrenttrendsinelectricityavailability,salesanddistributionsignalthatNepalwillhavesufficientpoweravailabilitytomeettheprojecteddemandfor2025and2030.Whilethisexpected situation isencouraging,wemustalsobear inmindthatthe loadforecastdoesnottakeintoaccountthescaleofe-cookingambitionoutlinedintheEnergyWhitePaperandthesubsequentadditionalelectricitydemandduetothis.Therefore,insuchacase,electricitygenerationmaynotmeetdemand.

| Page 25
According toNEA, grid electricity has reachedaround80%of thepopulation.However,electricityhasnotreachedto91(outof753)municipalitiesasshowninTable10below.
Table 10. Electrification status of municipalities (FY 2018/19)
ProvinceCompletelyelectrified Partiallyelectrified Notelectrified
Urban Rural Urban Rural Urban RuralProvince1 16 9 33 66 0 13Province2 21 16 56 43 0 0Bagmati 27 27 18 41 0 6Gandaki 20 24 7 28 0 6Province5 19 19 17 46 0 8Karnali 0 0 19 17 6 37Sudurpaschim 9 2 19 41 4 11Total 114 97 169 282 10 81Source:(NEA,2020)
FutureelectricityaccessandconsumptionasprojectedbytheSDGRoadmapandthe15thFive-YearPlanispresentedinTable11.
Table 11. Electricity access and consumption past trends and future targetsSDG7Indicators 2015(a) 2019(a) 2022(a) 2023(b) 2025(a) 2030(a)Proportionofpopulationwithaccesstoelectricity(%) 74 80.7 85.7 99 90.7 99
Electricityconsumption(kWhpercapita) 80 230 542 700 1027 1500
Percapitaenergy(final)consumption(ingigajoules) 16 18.1 19.7 - 21.3 24
Source:(a)(NPC,2017);(b)(NPC,2019)
5.2 Renewable Energy
Nepalhasutilizedrenewableenergysourcessuchasmicro-hydroandhouseholdsolarPVsystemstomeetelectriclightingandproductiveenduseneedsofpopulationsthatdonothaveaccesstoreliableelectricityfromthecentralgrid.
In FY 2018/19, about 55MW of electricity was produced frommini/micro-hydro andsolarenergysystemspromotedbyAEPC.Thisrenewableelectricitygenerationhelpedtoservearound18%ofthetotalpopulation(AEPC,2019).Table12showsthecumulativeachievement in the renewableenergy sector. In thepast, such renewableenergywasused to power off-grid households and communities. Today, in addition to this, newopportunitieshaveopeneduptointerconnectrenewableenergysystemswiththecentralgrid.The15thFive-YearPlan,forexample,envisionsconnectingthesolar,windandmicro-hydrominigridstothecentralgridwithanetmeteringarrangement.The15thFive-YearPlanaspires togeneratea totalof13MWofmicro/minihydropowerand137MWofsolar/windpowerinfiveyears.

| Page 26
Table 12. Renewable energy technology status and target2019(a) Targetof15thPlan2023(b)
Solarhomesystem(units) 911,097 -InstitutionalsolarPVsystem(units) 1,993 -Urbansolarhomesystem(units) 21,144 -Solardrinkingwaterandirrigationpump(units) 1,364 -Micro/minihydro(kW) 32,159 13,000Solar/windminigridsystem(kW) 563 137,000Source:(a)(AEPC,2019);(b)15thFive-YearPlan(2019/20-2023/24)
5.3 Petroleum Products
ThedependenceofhouseholdsonimportedLPGforcookingisincreasingovertheyears.TheannualimportofLPGinthelastdecadehasgrownby15%onaverage.In2018/19,thetotalimportofLPGstoodat426,609MT,whichisequivalentto30,042,887canisters(14.2kgeach).Residentialsectorconsumesaround54%ofallLPGimportedintothecountry.
Table 13. Import of petroleum products in 2018/19Fuel QuantityImportedPetrol(inKL) 566,827Diesel(inKL) 1,714,917Kerosene(inKL) 25,004AviationTurbineFuel(inKL) 200,108LPG(inMT) 429,609Source:(NOC,2020)
According toaprojectionby InternationalAtomicEnergyAgency’senergyplanning toolcalledModelforAnalysisofEnergyDemand(MAED),thedemandforLPGisexpectedtogrowby5.56%annuallyineconomicgrowthscenarioandby6.79%insustainablescenario.Table14showstheprojecteddemandofLPG.
Table 14. Total LPG consumption in MTYear Economic Growth Scenario Sustainable Scenario2020 38,7311 432,7112022 437,427 533,1982024 478,035 598,9552026 526,654 668,9122028 584,709 742,7862030 654,349 820,444Source:(Regmi&Manandhar,2019)
| Page 27
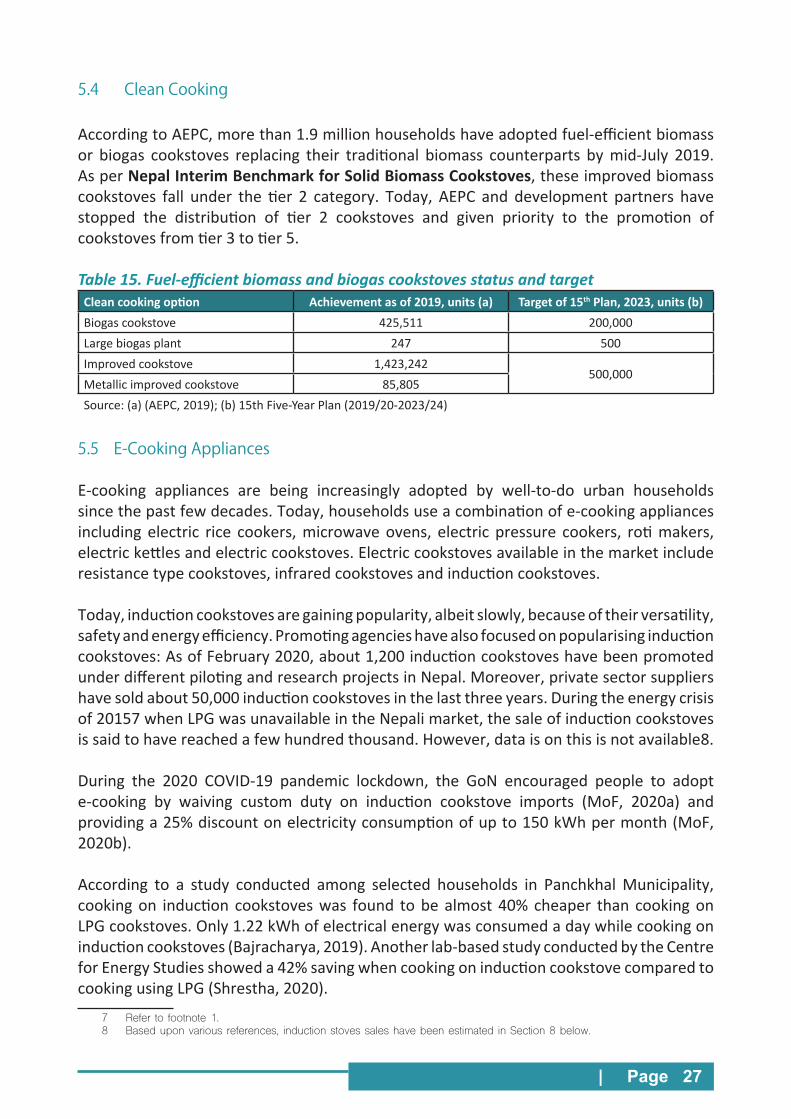
5.4 Clean Cooking
AccordingtoAEPC,morethan1.9millionhouseholdshaveadoptedfuel-efficientbiomassor biogas cookstoves replacing their traditional biomass counterparts bymid-July 2019.AsperNepal InterimBenchmarkforSolidBiomassCookstoves,theseimprovedbiomasscookstoves fall under the tier 2 category. Today, AEPC and development partners havestopped the distribution of tier 2 cookstoves and given priority to the promotion ofcookstovesfromtier3totier5.
Table 15. Fuel-efficient biomass and biogas cookstoves status and target Cleancookingoption Achievementasof2019,units(a) Targetof15thPlan,2023,units(b)Biogascookstove 425,511 200,000Largebiogasplant 247 500Improvedcookstove 1,423,242
500,000Metallicimprovedcookstove 85,805Source:(a)(AEPC,2019);(b)15thFive-YearPlan(2019/20-2023/24)
5.5 E-Cooking Appliances
E-cooking appliances are being increasingly adopted by well-to-do urban householdssincethepastfewdecades.Today,householdsuseacombinationofe-cookingappliancesincluding electric rice cookers,microwaveovens, electric pressure cookers, rotimakers,electrickettlesandelectriccookstoves.Electriccookstovesavailableinthemarketincluderesistancetypecookstoves,infraredcookstovesandinductioncookstoves.
Today,inductioncookstovesaregainingpopularity,albeitslowly,becauseoftheirversatility,safetyandenergyefficiency.Promotingagencieshavealsofocusedonpopularisinginductioncookstoves:AsofFebruary2020,about1,200inductioncookstoveshavebeenpromotedunderdifferentpilotingandresearchprojectsinNepal.Moreover,privatesectorsuppliershavesoldabout50,000inductioncookstovesinthelastthreeyears.Duringtheenergycrisisof20157whenLPGwasunavailableintheNepalimarket,thesaleofinductioncookstovesissaidtohavereachedafewhundredthousand.However,dataisonthisisnotavailable8.
During the 2020 COVID-19 pandemic lockdown, the GoN encouraged people to adopte-cooking by waiving custom duty on induction cookstove imports (MoF, 2020a) andprovidinga25%discountonelectricityconsumptionofupto150kWhpermonth(MoF,2020b).
According to a study conducted among selected households in PanchkhalMunicipality,cookingon induction cookstoveswas found tobealmost40%cheaper than cookingonLPGcookstoves.Only1.22kWhofelectricalenergywasconsumedadaywhilecookingoninductioncookstoves(Bajracharya,2019).Anotherlab-basedstudyconductedbytheCentreforEnergyStudiesshoweda42%savingwhencookingoninductioncookstovecomparedtocookingusingLPG(Shrestha,2020).
7 Refer to footnote 1.8 Based upon various references, induction stoves sales have been estimated in Section 8 below.

| Page 28
6. Opportunities and Challenges for E-Cooking PromotionInthecurrentcontext,e-cookingpromotionworkcancapitalizeonmanyopportunitiesinthecountrybutalsoneedstoaddresscertainchallenges.
Opportunitiesforpromotionofe-cookingareasfollows:
Politicalcommitments• Atthefederallevel,thereisahighlevelofpoliticalcommitmentfore-cookingasdetailed
intheEnergyWhitePaper.Moreover,thepracticeofpromotinge-cookingin100,000householdseveryyearalsodemonstratedpoliticalcommitmentfromMoEWRI.
• The PrimeMinisterwithdrew a Nepal Oil Corporation (NOC) plan to extend an LPGpipelinebetweenNepalandIndia.ThiswasdonetopromoteNepal’shydropowersector.
• E-cooking first received policy prominence in the Energy White Paper and is nowreflectedinthelong-termvision,15thFive-YearPlanandAEPCprogrammes.
• CuttingdownonLPG,whichweimportfromIndia,wouldsignificantlyreduceNepal’stradedeficit.Therefore,theleadersarekeenonpromotinge-cookingtechnologiesthatrunonnationallyproducedhydropowerelectricity.
Availabilityandreliabilityofelectricitysupply• Poweravailabilityisincreasing.Nepal’sgridisexpectedtohavemoreenergyavailable
thantheprojecteddemandinbothfiveyearsandtenyearsscenario.9• Transmissionanddistributionsystemsarebeingimprovedandwillbecomemorereliable
andabletoaccommodatetheuseofelectricalappliancesatalargescale.• Generation, transmissionanddistribution systemcanalreadyaccommodate500,000
inductioncookstoves(Gyawali,2019).
Market readiness• Arangeof importede-cookingappliancesareavailable in themarket.Toensurethe
qualityoftheproducts,electriccooktopstandardsarealreadyinplace.
Social acceptance• Evidences frompilot and research projects show the cost-effectiveness of e-cooking
comparedtoothercookingtechnologiesthatuseLPGandfirewood.• Nepalisocietyisundergoingmodernisationandpeopleareoptingformorecleanand
smarttechnologiesintheirdailylives.Withimprovedliteracyrateandeasieraccesstoinformation,consumerpreferenceforcleancookingisalsorising.Thischangeismorevisibleinurbanareasthaninruralareaswhereliteracyrateandaccesstoinformationarelagging.
• CuttingdownonLPG,whichweimportfromIndia,wouldsignificantlyreduceNepal’stradedeficit.Thus,technologiesthatrunonnationallyproducedhydropowerelectricityare gainingmoregrounds inurbanareaswithhigh literacy rates andeasy access toinformation.
9 This ‘projected demand’ does not take into account the potential increase in demand due to electric cookstoves, however.

| Page 29
Example:A5-membermiddle-classfamilyusesonaverage7LPGcylindersinayear.After adoptinge-cooking, this reduces to 3 LPG cylinders a year (as theyusebothelectricityandLPGforcooking).Withasavingof4cylindersperyearperhousehold,theexisting5.15lakhe-cookinguserswouldhaveavoidedanimportof29,252MTofLPGinFY2018/19(6.8%lessthantheactualLPGimportof429,609MTthatyear).Assuminganadditional10lakhhouseholdswilladopte-cookingby2025,thecountrywillavoidanimportof86,052MTofLPGinthatyear.
However,therearealsomanychallengesthathindertherapidadoptionofe-cooking:• Peakloadmanagementisstillchallengingbecauseofwhichpeoplearenotconfident
aboutthereliabilityofelectricitysupplyduringcookinghours.• Avastnumberofresidentialconsumershavealowlevelofconnectionwith5Ameter
capacity,whichlimitstheuseofheavyappliancesoruseofmultipleappliancesatthesametime.
• Alargenumberofresidentialconsumersdonothaveproperwiringorearthingprotectionwhichcompromiseshouseholdelectricalsafety.
• Local level governments, in general, have not yet formulated policy frameworks(includingpolicies,acts,procedures,guidelines)forpromotingrenewableenergy,cleancookingande-cooking.Hencecleancookingprogrammesdevelopmentislagginginthecountry.
• Thegeneralawarenessofsomepeople,particularlyinruralareas,aboutthebenefitsofe-cookingisstilllow.Manyofthemdonothaveaccesstoinformationregardingthebenefitsofe-cooking.
• Avastnumberofpotentialsupplychainactors,suchasretailersdealingwithkitchenappliancesseemoreriskinthee-cookingbusinessandarethereforereluctanttokeepelectricappliancesinstock.Semi-urbanandruralareaslackenthusiasticsupplychainactorssuchasretailers.
7. E-Cooking Targets in the 2020 NDC and Background LEAP Analysis
Takingintoconsiderationsthefindingsandrecommendationsofthisreport(discussedinthechaptersabove),aswellas thesubsequent feedbackprovidedbynumerousexperts(see Annex 1), the GoN-appointed NDC Working Group, and other line ministries andgovernment agencies, two e-cooking scenarios were developed. The impacts of thesescenariosonresidentialcookingtechnologyshiftandthecorrespondingGHGemissionswasthenmodeledusingtheLEAPsoftware.Thischapterdiscussesinbriefthee-cookingtargetsofthe2020NDCandthescenariosthesetargetswerebasedon.10
Nepal’s 2020 NDC (GoN, 2020) has set the following quantified targets for residentialcookingandbiogassub-sectoroftheenergysector:
10 The LEAP modeling methodology has been described in detail in the accompanying Nepal Mitigation Assessment Report (2021).

| Page 30
• By2030,ensure25%ofallhouseholdsuseelectriccookstovesastheirprimarymodeofcooking.
• By2025,install500,000improvedcookstoves,specificallyinruralareas.• By2025,installanadditional200,000householdbiogasplantsand500largescalebiogas
plants(institutional/industrial/municipal/community).
LEAP modeling software was used to support the 2020 NDC target-setting process.Projectionsweremadeforyear2020(yearofNDCsubmission),2022(whenNepalexpectstograduatetodevelopingcountrystatus),2023(thelastfullyearof15thFive-YearPlan),2025(mid-decade),2028(thefinalyearofEnergyandHydropowerDecade),and2030(thefinaltargetyearofthe2020NDC,SEforALLandSDGRoadmap).
Theprojectionsaremadefortwopossiblescenarios:(i)BusinessAsUsual(BAU)Scenario,and (ii) Ambitious E-Cooking Scenario. The BAU Scenario involves conditions which aresubstantiatedbysomeevidencefromexperienceorcommitmentofconcernedagencies.Itisaconservativescenariothatyieldsminimumachievementinthestipulatedtimeframe.TheAmbitiousE-CookingScenarioisanoptimisticscenariobaseduponaspirationsenvisagedin the policies and programmes of the GoN. The 2020 NDC targets on various cookingtechnologiesarebasedonthisambitiousscenario.TheBAUprojectionswerealsoincludedinthe2020NDCforcomparison.
Table 16. Typology of cookstoves considered in this study
ElectriccookstoveArangeofelectricalcookingappliancessuchasinductioncooktop,infraredcooktop,hotplate,electricpressurecooker,ricecookerwhichareusedforcookingrice,lentils,vegetablesetc.
LPGcookstove AcookstovewithsingleormultipleburnerthatusesLPGstoredinaportablestandardcanister.
Biogascookstove Acookstovewithaburnerthatusesbiogasproducedbyabiogasdigesterofvaryingcapacitye.g.2m3,4m3,6m3or10m3.
Improvedcookstoverankedtier3orabove(ICST3+)
Factorymadeportablecookstove;usessolidbiomassorpellets;efficiencyabove30%;tier3orabove.
Improvedcookstoverankedtier2(ICST2)
Mudcookstovewithachimneyoutletorfactory-madeportablerocketcookstove;usessolidbiomass,loosebiomass,dungcake;efficiencybelow30%;tier1ortier2
Traditionalcookstove(TCS) Threestoneopenfire,mudcookstoves;usessolidbiomass,loosebiomass,ordungcake;efficiencybelow10%,tier0
ThemajordifferencebetweenthesetwoscenariosisthattheAmbitiousE-cookingScenariofavourspolicy interventionsthatpromoteelectriccooking,biogas,and ICST3+overLPGcookstovesandTCS.
AmongusersofLPG,biogas,andelectriccookstoves,cookstoveandenergystacking(i.e.useofmultiplecookstovesandenergysourcesinonehousehold)iscommon.Forexample,whenever biomass is available, households generally use biomass cookstoves as theirprimarycookstove.AstudyconductedbytheWorldBank(WorldBank,2019)foundthatLPGandbiogascookstoveswereusedincombinationwithtraditionalorimprovedbiomasscookstoves inmosthouseholds. In termsof fuel stacking,electricity is foundtobeusedalongwithLPGastheenergysourceforcooking.Toavoiddoublecountingduetofueland

| Page 31
cookstovestacking, thisstudyestimatespercentageshareofhouseholdsbytheprimarycookstove,whichisthemaincookstoveusedonaregularbasisforcooking.
The data for the baseline (2010 -2019) and the two future scenarios (2020 -2030) issynthesizedusingexpertjudgementthroughreferencetoLPGImportStatisticsofNepalOilCorporation,AnnualHouseholdSurvey2016/17oftheCentralBureauofStatistics,ForeignTradeStatisticsofDepartmentofCustoms,ReportsofAlternativeEnergyPromotionCentre,and a peer-reviewed journal articleon LPG (Regmi&Manandhar, 2019). Estimations inbothscenariosaremadeforthetotalpopulationofNepalconsideringanannualpopulationgrowthrateof0.8%(CBS,2014).
The baseline data for percentage share of households using different types of primarycookstovefor2010to2019isestimatedasshowninFigure 3below.
Figure 3. Percentage share of households using different types of primary cookstoves from 2010 to 2019
From 2010 to 2019, the share of households using LPG cookstoves as their primarycookstoves increased rapidly so that LPG cookstoves were the most commonly usedprimarycookstoves in2019.Shareofelectriccookstoves increasedslightly inthistimeperiodbutwasstillverylowin2019.ShareofbiogascookstovesandICST2decreasedslightly,whereasshareof ICST3+ increasedslightly.ShareofTCS,themostcommonlyusedprimarycookstovein2010,decreasedsteadilybutwasstillsignificantin2019.
7.1 Business As Usual (BAU) Scenario
FortheBAUScenario,thepercentageshareofhouseholdsusingdifferenttypesofprimarycookstoves isprojected inFigure 4 below.From2020 to2030, the shareofhouseholdsusingLPGcookstovesastheirprimarycookstoveincreasessteadily.Theshareofelectriccookstoves and ICS T3+ increase slightly, whereas biogas cookstoves remain the same.ShareofTCSdecreasesonlyslightly,whereasICST2isphasedoutentirelysincetheyarenolongerpromotedbytheGoNandhaveashortlifespan.

| Page 32
Figure 4. Percentage share of households using different types of primary cookstoves in the BAU Scenario.Source:LEAPmodeling,2020
The detailed assumptions and the accompanying projections for this scenario arediscussedbelow:
ElectricStoveAlthoughelectriccookinghasreceivedsomepolicyprominence,theGoNhasnoongoingprojects to promote electric cooking. The GoN has halted the promotion of electriccookingunder the Terai CleanCookingProgrammedue to theCOVID-19pandemic andalsoretreatedfromitspoliticalcommitmenttopromote100,000electriccookstoveseveryyear. It isnotknownwhenthesewillberesumed.Thedevelopmentagenciesarestill intheplanningphaseandtheircontribution in theupcomingyears remainsunclear.Thus,e-cookingincreasesonlyslightlyinthisscenario.• Anaverageannualincrementof5%isestimatedfrom2020to2030sothatthepercentage
shareofhouseholdsusingelectriccookstovesastheirprimarymodeofcookingincreasesfrom6%in2020to9%in2030.
LPGStoveTheannualLPGimportoftheGoNisveryhighandincreasingandsubsidyonLPGisbeingprovided.• Anaverageannualincrementof2%isestimatedfrom2020to2030sothatthepercentage
shareofhouseholdsusingLPGcookstovesastheirprimarymodeofcookingincreasesfrom51%in2020to62%in2030.
BiogasStoveBiogasisbeingpromotedbutonaverageusersareswitchingfromhome-basedbiogastocanistersfromlargerbiogasplants.• ThepercentageshareofhouseholdsinNepalthatusebiogascookstovesastheirprimary
modeofcookingremainsconstantfrom2020to2030ataround11%.

| Page 33
ImprovedCookstoveRankedTier3orAbove(ICST3+)ICST3+arecurrentlybeingpromotedbygovernmentagencies.• An average annual increment of 48% is estimated from 2020 to 2030 so that the
percentageshareofhouseholdsusingICST3+astheirprimarymodeofcookingincreasesfrom1.2%in2020to7%in2030.
ImprovedCookstoveRankedTier2(ICST2)ICST2arenolongerbeingpromotedbecauseoftheirlowefficiency,andtheyhaveashortlifespan,sohouseholdsstopusingthemafterafewyears.• An average annual decrement of 10% is estimated from 2020 to 2030 so that the
percentageshareofhouseholdsusingICST2astheirprimarymodeofcookingdecreasesfrom16%in2020to0%in2030.
TraditionalCookstove(TCS)WhileTCSuseisslightlyreducedbythepromotionofcleanercookstoves,itisstillprominent.• An average annual decrement of 2.5% is estimated from 2020 to 2030 so that the
percentageshareofhouseholdsusingTCSastheirprimarymodeofcookingdecreasesfrom14.8%in2020to11.3%in2030.
Finally, the cumulative number of households that adopt various primary cookingtechnologiesfrom2020to2030intheBAUScenarioisestimatedwhilealsotakingintoaccountpopulationgrowth.TheyaregiveninTable17below.
Table 17. Cumulative number of households adopting different primary cooking options in BAU scenario 11
CookingOptions 2020 2022 2023 2025 2028 2030Electriccookstove 373,605 422,809 448,085 512,947 594,627 667,132LPGcookstove 3,175,640 3,408,098 3,526,235 3,864,198 4,233,181 4,595,801Biogascookstove 684,942 698,276 707,845 738,643 759,565 793,146ICST3+ 74,721 153,749 188,326 280,411 413,408 51,881ICST2 996,279 819,994 727,327 547,143 226,525 0TCS 921,558 903,274 896,170 895,947 851,591 837,622Totalhouseholds 6,226,745 6,406,200 6,493,988 6,839,289 7,078,898 7,412,582Source:LEAPmodeling,2020
7.2 Ambitious E-Cooking Scenario
IntheAmbitiousE-CookingScenario,thepercentageshareofhouseholdsusingdifferenttypesofprimarycookstovesisprojectedinFigure 5below.From2020to2030,theshareof households using LPG cookstoves as their primary cookstove decreases significantly.Thesearereplacedby increasingelectric,biogasand ICST3+.UseofTCSalsodecreasessignificantlyduetoadequatepolicyinterventions,whereasICST2iscompletelyphasedout.
11 The average household growth rate depicted in Table 17 and Table 18 is higher than the assumed population growth rate of 0.8% (CBS, 2014) because it takes into account the increasing scale of urbanization in the future. Urban households are on average smaller in size than rural households. So we assume that as more of Nepal becomes urbanized, the average size of Nepali households will decrease, and the total number of households will increase.

| Page 34
Figure 5. Percentage share of households using different primary cooking option in the Ambitious E-Cooking ScenarioSource:LEAPmodeling,2020
Theassumptionsmadeandtheaccompanyingprojectionsforthisscenarioarediscussedbelow:
ElectricStoveThe GoN implements the GCF-supported project on e-cooking and continues with itspoliticalcommitmenttopromote100,000electriccookstoveseveryyear.Someofthelocalgovernments also promote electric cooking on their own every year. The developmentagenciesbringpromotionalprojects.E-cookingisscaledupsignificantlyduetoadequatepolicyinterventions.• An average annual increment of 32% is estimated from 2020 to 2030 so that the
percentage share of households using electric cookstoves as their primarymode ofcookingincreasesfrom6%in2020to25%in2030.
LPGStovePolicyinterventionscurbtheuseofLPGsothatitdecreasessignificantly.• An average annual decrement of 1% is estimated from 2020 to 2030 so that the
percentageshareofhouseholdsusingLPGcookstovesastheirprimarymodeofcookingdecreasesfrom51%in2020to45%in2030.
BiogasStovePromotionalprogramshelptoincreasebiogasadoptionsteadily.• Anaverageannualincrementof5%isestimatedfrom2020to2030sothatthepercentage
shareofhouseholdsusingbiogascookstovesastheirprimarymodeofcookingincreasesfrom11%in2020to16%in2030.

| Page 35
ImprovedCookstoveRankedTier3orAbove(ICST3+)PromotionalprogramshelptoincreaseICST3+adoptionsubstantially.• An average annual increment of 82% is estimated from 2020 to 2030 so that the
percentageshareofhouseholdsusingICST3+astheirprimarymodeofcookingincreasesfrom1.2%in2020to11%in2030.
ImprovedCookstoveRankedTier2(ICST2)ICST2areno longerpromotedbecauseof their lowefficiencyandhouseholdsonlyusethesecookstovesforafewyearsbecauseoftheirshortlifecycle.• An average annual decrement of 10% is estimated from 2020 to 2030 so that the
percentageshareofhouseholdsusingICST2astheirprimarymodeofcookingdecreasesfrom16%in2020to0%in2030.
TraditionalCookstove(TCS)MostTCSarereplacedbycleanercookstovesduetoadequatepolicyinterventions.• An average annual decrement of 8% is estimated from 2020 to 2030 so that the
percentageshareofhouseholdsusingTCSastheirprimarymodeofcookingdecreasesfrom14.80%in2020to3%in2030.
Finally, the cumulative number of households that adopt various primary cookingoptionsfrom2020to2030intheAmbitiousE-CookingScenarioisestimatedwhilealsotakingintoaccountpopulationgrowth.ThesearegivenintheTable18below:
Table 18. Cumulative number of households adopting different primary cooking options in the Ambitious E-Cooking Scenario CookingOptions 2020 2022 2023 2025 2028 2030
Electriccookstove 373,605 627,808 759797 1,060,090 1,500,726 1,853,146LPGcookstove 3,175,640 3,190,288 3,195,042 3,282,859 3,270,451 335,662Biogascookstove 684,942 807,181 870,194 1,025,893 1,104,308 1,186,013ICST3+ 74,721 224,217 305,217 478750 665,416 815,384ICST2 996,279 794,369 688,363 478,750 198,209 0TCS 921,558 762,338 675,375 512,947 339,787 222,378Totalhouseholds 6,226,745 6,406,200 6,493,988 6,839,289 7,078,898 7,412,582Source:LEAPmodeling,2020
7.3 Emission Reductions Attributable to Ambitious E-Cooking Scenario
In the Ambitious E-cooking Scenario, e-cooking technologies primarily replace the use offirewoodandLPGleadingtosubstantialdecreaseinemissionscomparedtotheBAUScenario.Cooking-relatedemissionsintheBAUScenarioisapproximately2,000GgCO2ein2025and2,060GgCO2ein2030,whereas,cooking-relatedemissionsintheAmbitiousE-CookingScenarioisaround1,780GgCO2ein2025and1,600GgCO2ein2030.ComparedtotheBAUScenario,theAmbitiousE-CookingScenarioresultsinadecreaseinemissionsfromthecookingsectorofaround11%in2025and23%in2030.ThismajordecreaseinemissionscomesfromthereplacementofLPG,ICST2andTCSbyelectriccookstoves,ICST3+andbiogascookstoves.

| Page 36
8. Recommendations
Toensuretimelyachievementofthee-cookingtargetsinthe2020NDCthisreportprovidesthefollowingrecommendations:
• Ensureaffordablesupplyofqualitye-cookingproductso Providefinancialincentivesincludingoncustomdutyandvalueaddedtax(VAT)
facilities of e-cooking products (For example, the custom duty on import ofinductioncooktopduringCOVID-19lockdownwaswaived)
o Encouragedomesticmanufacturingofelectriccookstoveso Sethouseholdelectricitytariffsthatencouragespeopletoconsidere-cooking12o GraduallyphaseoutsubsidiesonLPGo Graduallyadoptstandardsonelectriccooktopsonmandatorybasis
• Ensurereliabilityofelectricitysupplyathouseholdlevelo Upgradethecurrent5Aconnectiontohouseholdstoatleast15Ao Ensureelectrical safetyprovisionse.g.housewiringwithqualityproductsand
earthingsystemso Upgrade local distribution systems with appropriately sized transformers to
ensureuninterruptedpowersupply
• Ensureadequateplanningandpromotionmeasureso Providelocalgovernmentssupporttoensureadequateformulationofe-cooking
relatedpolicyandregulatoryprocedureso Conduct mass awareness campaigns on clean cooking, with an emphasis on
e-cooking,highlightingitshealthandeconomicbenefits,andsafetyadvantagesforsustainedbehaviourchange
o So far, the GoN’s approach to e-cooking promotion has been subsidy-drivenor central procurement-based. However, it must also pursue market-basedapproachthatencouragestheprivatesectortoservesemi-urbanandruralmarketsegmentsandprovidetechnicalbackupsupportforitsproducts,includingafter-salesservice.
12 The ERC held a public virtual hearing of electricity tariff proposed by NEA on 25 May 2020. Members of the audience suggested domestic consumer-friendly tariff targeting e-cooking.

| Page 37
ReferencesAEPC. (2016). Subsidy Delivery Mechanism for Renewable Energy, 2016. Kathmandu: Alternative Energy Promotion Centre.AEPC. (2016a). Nepal Interim Benchmark for Solid Biomass Cookstoves. Kathmandu: Alternative Energy Promotion Centre.
AEPC. (2018). Investment Prospectus for Clean Cooking Solutions in Nepal. Kathmandu: Alternative Energy Promotion Centre & The World Bank.
AEPC. (2019). Progress at a Glance: A Year in Review (2018/19). Kathmandu : Alternative Energy Promotion Centre.AEPC. (2020). AEPC’s Interventions in Clean Cooking Solutions and Prospects towards Electric Cooking (Presentation).Kathmandu:
AEPC.Bajracharya, K. (2019). Introduction to the Clean Cooking Alliance (Presentation Slides). Kathmandu: Clean Cooking Alliance.
CBS. (2014) National Population and Housing Census 2011 (Population Projection 2011 – 2031). Central Bureau of Statistics, Kathmandu.
CBS. (2016). Annual Household Survey 2015/16. Kathmandu: Central Bureau of Statistics.CBS. (2017). Annual Household Survey 2016/17. Kathmandu: Central Bureau of Statistics.CBS. (2018). Statistical Year Book Nepal 2017. Kathmandu: Central Bureau of Statistics.CBS. (2019). Statistical Pocket Book of Nepal 2018. Kathmandu: Central Bureau of Statistics.CBS. (2020). Annual Growth Rate of GDP. Kathmandu: Central Bureau of Statistics.
CBS. (2020, February 15). Composition of Gross Domestic Product by Province, 2075/76. Retrieved from CBS: https://cbs. gov.np/regional-provincial-national-accounts-2019/
CBS. (2020). National Accounts Statistics For Fiscal Year 2076/77. Retrieved from CBS: https://cbs.gov.np/wp-content/upLoads/2020/04/CBS-GDP-Press-Release-2077-1-17-new.pdf
CCA. (2019). Induction cooktop and rice cooker usage & behaviour of appliance usage. Modern Energy Cooking Services Workshop. Kathmandu: CRT/GenDev Centre for Research and Innovation.
Chitrakar, A. (2019). Look what’s cooking in Nepal: Using electric rice cookers instead of LPG could save the country a whole lot of money. Retrieved from The Nepali Times: https://www.nepalitimes.com/opinion/look-whats-cooking-in-nepal/
GoN. (1984). Nepal Electricity Authority Act 1984. Kathmandu: Government of Nepal.GoN. (2015). Constitution of Nepal 2015. Kathmandu: Government of Nepal.GoN. (2016). Nationally Determined Contributions. Ministry of Population and Environment, Government of Nepal. Available at:
https://www4.unfccc.int/sites/ndcstaging/PublishedDocuments/Nepal%20First/Nepal%20First%20NDC.pdfGoN. (2017). Electricity Regulation Commission Act, 2074. Kathmandu: Government of Nepal. Available at: https://erc.gov.np/
storage/listies/April2020/erc-act-2017-english.pdf
GoN. (2019). National Climate Change Policy 2076 (2019). Kathmandu: Government of Nepal.GoN. (2020). Second Nationally Determined Contributions. Ministry of Forests and Environment, Government of Nepal. Available at:
https://www4.unfccc.int/sites/ndcstaging/PublishedDocuments/Nepal%20Second/Second%20Nationally%20Determined%20Contribution%20(NDC)%20-%202020.pdf
Gyawali, S. M. (2019). Induction Cookstoves Adoption in National Grid as a Demand Side Management Programme. Kathmandu: Nepal Electricity Authority.
Koirala, S. (2019). Is electricity cheap enough to replace cooking gas? Retrieved from The Kathmandu Post: https://kathmandupost.com/columns/2019/09/03/is-electricity-cheap-enough-to-replace-cooking-gas
MoE. (2006). Rural Energy Policy 2006. Kathmandu: Ministry of Environment.
MoEWRI. (2001). Hydropower Development Policy, 2049. Ministry of Energy, Water Resources and Irrigation, Kathmandu.
MoEWRI. (2018). Present Situation and Future Roadmap of Energy, Water Resources and Irrigation Sector (White Paper). Ministry of Energy, Water Resources and Irrigation, Kathmandu.
MoEWRI. (2018 a). National Energy Efficiency Strategy, 2075 . Kathmandu: Ministry of Energy, Water Resources and Irrigation.MoF. (2012). Economic Survey 2011/12. Kathmandu: Ministry of Finance, Government of Nepal. MoF. (2019). Economic Survey 2018/19. Kathmandu: Ministry of Finance, Government of Nepal.MoF. (2020). Economic Survey 2019/20. Kathmandu: Ministry of Finance, Government of Nepal.
MoF. (2020, February 15). Macroeconomic Chart. Retrieved from Ministry of Finance: https://data.mof.gov.np/macroeconomicChart.aspx
MoF. (2020a). Notice from Ministry of Finance. Nepal Rajpatra, Section 69, Number 52.MoF. (2020b, March 31). Press Release.MoPE. (2016). Renewable Energy Subsidy Policy, 2073 BS. Kathmandu: Ministry of Population and Environment.

| Page 38
MoPE. (2017). Biomass Energy Strategy 2017. Kathmandu: Ministry of Population and Environment.
MoSTE. (2014). Nepal Second National Communication to UNFCCC. Kathmandu: Ministry of Science, Technology and Environment. Nakarmi, A. (2019). Energy Security Issues/Challenges and Transitioning to Cleaner Cooking in Nepal. National Campaign Launching Ceremony of Market-led Promotion of Electric Cooking in Community Rural Electrification Areas. Kathmandu:ABF/NACEUN.
NEA. (2019). Nepal Electricity Authority: A year in review-fiscal year 2018-2019. Kathmandu: Nepal Electricity Authority.NEA. (2020). NEA’s Proposal on Tariff Revision - 2076. Kathmandu: NEA.NEA. (2020). Nepal Electricity Authority: A Year in Review 2019/2020. 2020: Nepal Electricity Authority.
NOC. (2020, March 23). Import of Petroleum Products [in KL except LPG] for 2075/76 (2018-19AD). Retrieved from Nepal Oil Corporation: http://noc.org.np/import
NPC. (2013). Sustainable Energy For All: Rapid Assessment and Gap Analysis. Kathmandu: National Planning Commission, Government of Nepal.
NPC. (2017). Nepal Sustainable Development Goals: Status and Roadmap (2016-2030). Kathmandu: National Planning Commission.
NPC. (2019). 15th Five-Year Plan (2019/20-2023/24). Kathmandu: National Planning Commission, Government of Nepal.NRB. (2019). Macroeconomic Indicators of Nepal November 2019. Kathmandu: Nepal Rastra Bank.Province 1. (2019). Annual budget (2019/20), Ministry of Economic Affairs and Planning, Province 1 Government, Biratnagar. Province 1. (2018). First Periodic Plan (Fiscal Year 2076/77-2080/81) (in Nepali). Provincial Planning Commission, Province 1
Government, Biratnagar.Province 2. (2019). Annual budget (2019/20), Ministry of Economic Affairs and Planning, Province 2 Government, Janakpur.Province 2. (2018). First Periodic Plan (Fiscal Year 2076/77-2080/81) (in Nepali). Provincial Policy and Planning Commission,
Province 2 Government, Janakpur.Province 3. (2019). Annual budget (2019/20), Ministry of Economic Affairs and Planning, Province 3 Government, Hetauda.Province 3. (2018). First Periodic Plan (Fiscal Year 2076/77-2080/81), (in Nepali). Provincial Policy and Planning Commission,
Province 3 Government, Hetauda.Province 4. (2019). Annual budget (2019/20), Ministry of Economic Affairs and Planning, Province 4 Government, Pokhara.Province 4. (2018). First Periodic Plan (Fiscal Year 2076/77-2080/81), (in Nepali). Provincial Policy and Planning Commission,
Province 4 Government, Pokhara.Province 5. (2019). Annual budget (2019/20), Ministry of Economic Affairs and Plannings, Province 5 Government, Deukhuri.Province 5. (2018). First Periodic Plan (Fiscal Year 2076/77-2080/81), (in Nepali). Provincial Planning Commission, Province 5
Government, Deukhuri.Province 6. (2019). Annual budget (2019/20), Ministry of Economic Affairs and Plannings, Province 6 Government, Birendranagar.Province 6. (2018). First Periodic Plan (Fiscal Year 2076/77-2080/81), (in Nepali). Provincial Planning Commission, Province 6
Government, Birendranagar.Province 7. (2019). Annual budget (2019/20), Ministry of Economic Affairs and Planning, Province 7 Government, Godawari.Regmi & Manandhar, B. a. (2019). LPG Demand Analysis of Nepal: 2017-2034. Prabhat, 73-79.
Shrestha, J. N. (2020). Innovations in Electric Cooking Promotion. Kathmandu: Centre for Energy Studies, Institute of Engineering, TU.
Timilsina, G., Sapkota, P., & Steinbuks, J. (2018, June). How Much Has Nepal Lost in the Last Decade Due to Load Shedding? An Economic Assessment Using a CGE Model. Policy Research Working Paper 8468. World Bank.
TU. (2017). Nepal’s GHG Inventory. Kathmandu: Tribhuvan University, Central Department of Environmental Science.WB. (2019). Nepal Beyond Connections: Energy Access Diagnostic Report Based on the Multi-Tier Framework. Kathmandu:
The World Bank.
WECS. (2014). Energy Data Sheet. Kathmandu: Water and Energy Commission Secretariat, Government of Nepal.

| Page 39
Annex I: List of Experts and Stakeholders Consulted During the Study
Person AffiliatedInstitution ModeofconsultationDr.ArunPrakashBhatta MinistryofForestsandEnvironment Focusgroupdiscussion(09/07/2020)ShrijanaShrestha MinistryofForestsandEnvironment Focusgroupdiscussion(09/07/2020)MunaNeupane MinistryofForestsandEnvironment Focusgroupdiscussion(09/07/2020)SomnathGautam MinistryofForestsandEnvironment Focusgroupdiscussion(09/07/2020)YamNathPokharel MinistryofForestsandEnvironment Focusgroupdiscussion(09/07/2020)RamPrasadAwasthi MinistryofForestsandEnvironment Focusgroupdiscussion(09/07/2020)SureshGhimire MinistryofForestsandEnvironment Focusgroupdiscussion(09/07/2020)SubhadraBhattarai MinistryofForestsandEnvironment Focusgroupdiscussion(09/07/2020)
JyotiPrajapati MinistryofEnergy,WaterResourcesandIrrigation(MoEWRI) Focusgroupdiscussion(09/07/2020)
MukeshGhimire AlternativeEnergyPromotionCentre Telephoneconversationandfocusgroupdiscussion(09/07/2020)
RajuLaudari AlternativeEnergyPromotionCentre TelephoneconsultationRanaBahadurThapa AlternativeEnergyPromotionCentre Focusgroupdiscussion(09/07/2020)NarayanKhatiwada NationalPlanningCommission(NPC) Focusgroupdiscussion(09/07/2020)
KiranGautam WaterandEnergyCommissionSecretariat(WECS) Focusgroupdiscussion(09/07/2020)
Prof.Dr.JaganNathShrestha
CenterforEnergyStudies(CES)/InstituteofEngineering(IOE)/TribhuvanUniversity(TU)
Telephoneconsultation,writtenresponseandfocusgroupdiscussion(09/07/2020)
MuhanMaskey UnitedNationsDevelopmentProgramme-Nepal Focusgroupdiscussion(09/07/2020)
AparPaudyal UnitedNationsDevelopmentProgramme-Nepal Focusgroupdiscussion(09/07/2020)
BhushanChandraAdhikari GIZ/EnergisingDevelopment(EnDev) Telephoneconsultationandwrittenresponse
BarshaPandey TheWorldBank OnlineconsultationandwrittenresponseAlishaNoellaPinto TheWorldBank Onlineconsultationandwrittenresponse
PoojaSharma PracticalAction Telephoneconsultation,writtenresponseandfocusgroupdiscussion(09/07/2020)
BadriBaral WinrockInternational Telephoneconsultationandwrittenresponse

| Page 40
Person AffiliatedInstitution Modeofconsultation
KarunaBajracharya CleanCookingAlliance(CCA) Telephoneconsultation,writtenresponseandfocusgroupdiscussion(09/07/2020)
BhushanTuladhar CleanEnergyNepal(CEN) Focusgroupdiscussion(09/07/2020)
SubashDhakal SNVNetherlandsDevelopmentOrganisation Telephoneconsultationandwrittenresponse
PremSagarSubedi DAI/NepalRenewableEnergyProgramme(NREP) Telephoneconsultation
NarayanGyawali NationalAssociationofCommunityElectricityUsers-Nepal(NACEUN) Telephoneconsultation
DhirajPokhrelSocietyforLegalandEnvironmentalAnalysisandDevelopmentResearch(LEADERSNepal)
Writtenresponse
GyanendraRajSharma AjummeryBikasFoundation TelephoneconsultationSureshAcharya ChaudharyGroup(CG) TelephoneconsultationManojGupta HuskPowerPvt.Ltd. Telephoneconsultation

| Page 41
Annex II: NEA’s Estimation of Impact of 500,000 Induction Stoves on Peak Demand
Source:(Gyawali,2019)

Government of NepalMinistry of Forests and Environment