Assessment of Differences between Near-Surface Air and ...
18
City University of New York (CUNY) City University of New York (CUNY) CUNY Academic Works CUNY Academic Works Publications and Research New York City College of Technology 2017 Assessment of Differences between Near-Surface Air and Soil Assessment of Differences between Near-Surface Air and Soil Temperatures for Reliable Detection of High-Latitude Freeze and Temperatures for Reliable Detection of High-Latitude Freeze and Thaw States Thaw States Farjana Shati CUNY New York City College of Technology Satya Prakash CUNY New York City College of Technology Hamid Norouzi CUNY New York City College of Technology Reginald Blake CUNY New York City College of Technology How does access to this work benefit you? Let us know! More information about this work at: https://academicworks.cuny.edu/ny_pubs/204 Discover additional works at: https://academicworks.cuny.edu This work is made publicly available by the City University of New York (CUNY). Contact: [email protected]
Transcript of Assessment of Differences between Near-Surface Air and ...

City University of New York (CUNY) City University of New York (CUNY)
CUNY Academic Works CUNY Academic Works
Publications and Research New York City College of Technology
2017
Assessment of Differences between Near-Surface Air and Soil Assessment of Differences between Near-Surface Air and Soil
Temperatures for Reliable Detection of High-Latitude Freeze and Temperatures for Reliable Detection of High-Latitude Freeze and
Thaw States Thaw States
Farjana Shati CUNY New York City College of Technology
Satya Prakash CUNY New York City College of Technology
Hamid Norouzi CUNY New York City College of Technology
Reginald Blake CUNY New York City College of Technology
How does access to this work benefit you? Let us know!
More information about this work at: https://academicworks.cuny.edu/ny_pubs/204
Discover additional works at: https://academicworks.cuny.edu
This work is made publicly available by the City University of New York (CUNY). Contact: [email protected]

1
Assessment of differences between near-surface air and soil temperatures for
reliable detection of high-latitude freeze and thaw states
Farjana Shati, Satya Prakash*, Hamid Norouzi, and Reginald Blake
New York City College of Technology,
City University of New York,
Brooklyn, NY 11201, USA
*Corresponding author’s email: [email protected]
Cold Regions Science and Technology
Vol. 145, pp. 86-92, doi:10.1016/j.coldregions.2017.10.007

2
Abstract: Near-surface air temperature and the underlying soil temperature are among
the key components of the Earth’s surface energy budget, and they are important
variables for the comprehensive assessment of global climate change. Better
understanding of the difference in magnitude between these two variables over high-
latitude regions is also crucial for accurate detections of freeze and thaw (FT) states.
However, these differences are not usually considered and included in current remote
sensing-based FT detection algorithms. In this study, the difference between near-surface
air temperature at the 2-meter height and soil temperature at the 5-centimeter depth is
assessed using ground-based observations that span a three-year period from 2013 to
2015. Results show noticeable differences between air and soil temperatures over
temporal scales that range from diurnal to seasonal. The study also suggests that the
ground-based upper layer soil temperature may be a better surrogate than the near-surface
air temperature for the reliable detection of FT states at high-latitudes. Furthermore, the
results from this study are particularly useful for better understanding the surface energy
budget that ultimately drives the land surface processes that are embedded within weather
and climate models.
Keywords: Freeze and thaw states; Ground-based observations; Land surface emissivity;
Near-surface air temperature; Soil temperature.
1. Introduction
Near-surface air temperature and soil temperature are among the key variables for
the assessment of global climate change and surface energy budget (Zheng et al., 1993;
Chudinova et al., 2006). These variables also control soil moisture content, which in turn
plays a critical role in ecosystem conditions through the exchange of heat and water
fluxes between the atmosphere and the land surface (Brown et al., 2000; Betts, 2009).
Soil temperature is also crucial for agricultural practices and vegetation health (height
and density), and it is influenced by geographic, climatic, and environmental features.
Since in-situ observations of soil temperatures are rather sparse at the global scale, they
can be estimated through the energy balance equation and empirical methods. However,
the relationships among soil temperature, soil moisture, skin temperature and air

3
temperature are still not adequately explored. These relationships are currently being
copiously studied by the research community.
Although both air and soil temperatures have considerable differences, they are
oftentimes used interchangeably for some specific applications and in algorithms used to
detect high-latitude freeze and thaw (FT) states. Nearly one-third of the global land areas
exhibit seasonal freezing and thawing transitions, and these transitions play vital roles in
hydrological activities, vegetation dynamics, terrestrial carbon and methane budgets, and
in land-atmosphere trace gas exchanges (Jin et al., 2009; Wu et al., 2011; Shahroudi and
Rossow, 2014; Du et al., 2015). Accurate detection of regional FT states and their
variability is also vital for several land surface process applications. Since ground-
observations of FT states in boreal regions are generally sparse and inconsistent, the
effective monitoring of FT processes in these regions is difficult. However, remote
sensing applications in the active and passive microwave bands have produced reliable
FT monitoring over this region (Zhang and Armstrong, 2001; Podest et al., 2014). In the
recent decade, several remote sensing-based FT detection algorithms have been
developed. For instance, long-term (starting from 1979) daily FT records at the global
scale (Kim et al., 2011, 2017) were developed from passive microwave brightness
temperatures. Some of these algorithms use ground-based near-surface air temperature
observations as reference, while others use upper layer soil temperature as reference. The
community, therefore, has yet to reach consensus about which of the two temperatures
(or some combination of both) to use in FT algorithms, and the lack of agreed
consistency on this issue may have far reaching impacts not only on the detection of FT
states, but also on the myriad of other geophysical phenomena that rely on these
interactions.
A main objective, therefore, of this study is to assess the differences between in-
situ near-surface air temperatures and soil temperatures over selected stations of North
America, a region having appreciably good networks of simultaneous air and soil
temperature observations. The study will also make the case that upper layer soil
temperature, and not near-surface air temperature, should be used as the reference
temperature in effective FT state detection algorithms and in the comprehensive study of
related soil characteristics.

4
2. Data and Methods
The relevant in-situ near-surface air temperature (at 2m), soil temperature (at
5cm), and snow depth data were obtained from the Snow Telemetry (SNOTEL) stations
maintained by the National Resources Conservation Service and the National Water
Climate Center (Serreze et al., 1999). Hourly data sets were collected over the span of a
three-year period from 2013 to 2015. Several SNOTEL stations were used to investigate
the differences between both temperatures for distinct weather conditions (e.g., snow
versus no-snow). However, for brevity, only the results from six stations are shown and
discussed in this study. The six stations were chosen so that they cover a wide range of
geographic, topographic, and land cover features (e.g., Fig. 1). The International
Geosphere-Biosphere Programme (IGBP) global land cover type product from the
MODIS (e.g., MCD12C1 version 051) available at 0.05° spatial resolution (Friedl et al.,
2010) is used to determine the vegetation type of the selected stations. Additionally, the
land surface emissivity estimates, recently developed using the Advanced Microwave
Scanning Radiometer – 2 (AMSR2), were used for the year 2015. These instantaneous
land surface emissivity estimates are available at 0.25° spatial resolution (Prakash et al.,
2016). To accurately compute the land surface emissivity from AMSR2 brightness
temperatures at seven frequency channels, near simultaneous infrared-based land surface
temperature, and profiles of air temperature and humidity were used. Furthermore, the
discrepancy between the diurnal cycles of passive microwave brightness temperatures
and infrared-based land surface temperature was minimized using a suitable statistical
method (Norouzi et al., 2012, 2015; Prakash et al., 2016). It was recently demonstrated
(Prakash et al., 2017) that due to its direct interactions with soil characteristics, remote
sensing-based microwave land surface emissivity detects FT states better than brightness
temperature.
Two specific times centered at 1:30 Local Standard Time (LST) and 13:30 LST
were chosen for the analysis, because they were comparable to the AMSR2 equatorial
crossing times. The linear average of 1:00 LST and 2:00 LST observations were
calculated to get observations at 1:30 LST (nighttime/descending), and the linear average
of 13:00 LST and 14:00 LST (the linear interpolation used does not affect the results
considerably) were used to obtain observations of snow depth, air and soil temperatures

5
at 13:30 LST (daytime/ascending). The differences between both parameters (e.g., soil
and air temperatures) were studied for two different soil conditions, i.e., freeze and thaw
states. These differences were computed for soil frozen states with soil temperatures less
than or equal to 0°C and simultaneously for air temperatures greater than 0°C; they were
also computed for soil thawed states with soil temperatures greater than 0°C and
simultaneously for air temperatures less than or equal to 0°C. These differences show the
uncertainty in FT state detection due to the use of near-surface air temperature rather than
the use of upper soil temperature. The seasonal and diurnal variations of the differences
between both temperatures were also examined in this study.
3. Results and Discussions
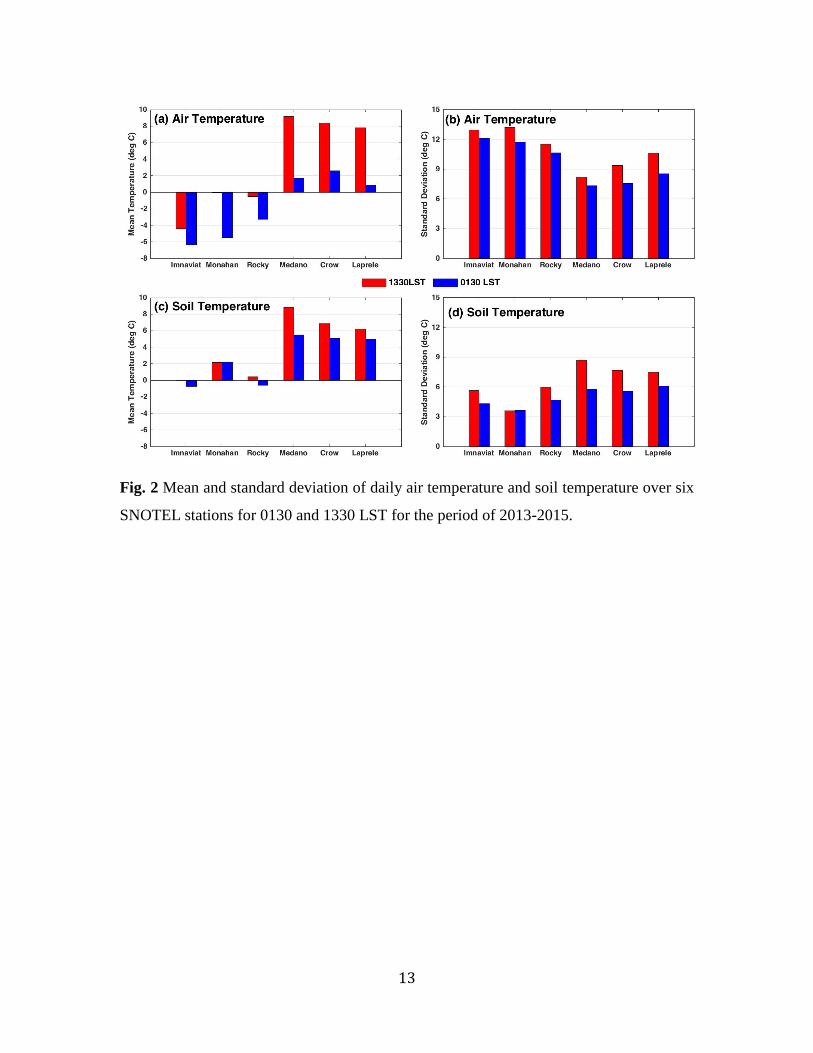
Fig. 2 shows the three-year mean and standard deviation of the near-surface air
temperature and the upper layer soil temperature during day and night times for the six
selected stations. The three Alaskan stations show mean air temperature values less than
0°C. Noticeable differences between the soil and the air temperatures are observed over
all six stations. The differences between daytime and nighttime temperatures are higher
for air than for soil. As expected, lower temperatures during nighttime as compared to
daytime are observed from both variables. These differences are associated with the
diurnal variation of surface energy flux. Typically, surface energy balance is positive
when net shortwave absorption exceeds net longwave loss during the daytime. The
surface emits energy during daytime, while it needs more energy at night due to no
incoming solar shortwave radiation; this results in downward latent and sensible heat flux
from the atmosphere to the surface. Air temperature exhibits larger magnitude of standard
deviation as compared to the soil temperature. During the daytime, standard deviation is
larger than nighttime in both air and soil temperatures.
In order to investigate the differences between air and soil temperatures at the
daily timescale, time-series analysis was performed. Fig. 3 shows daily air and soil
temperatures and their differences during both day and nighttime for the three-year period
for a SNOTEL station located at Colorado. Higher temperatures during the summer and
lower temperatures during the winter for both air and soil correlate well with snowfall
amounts. However, notable differences between both temperatures can be seen. These
6
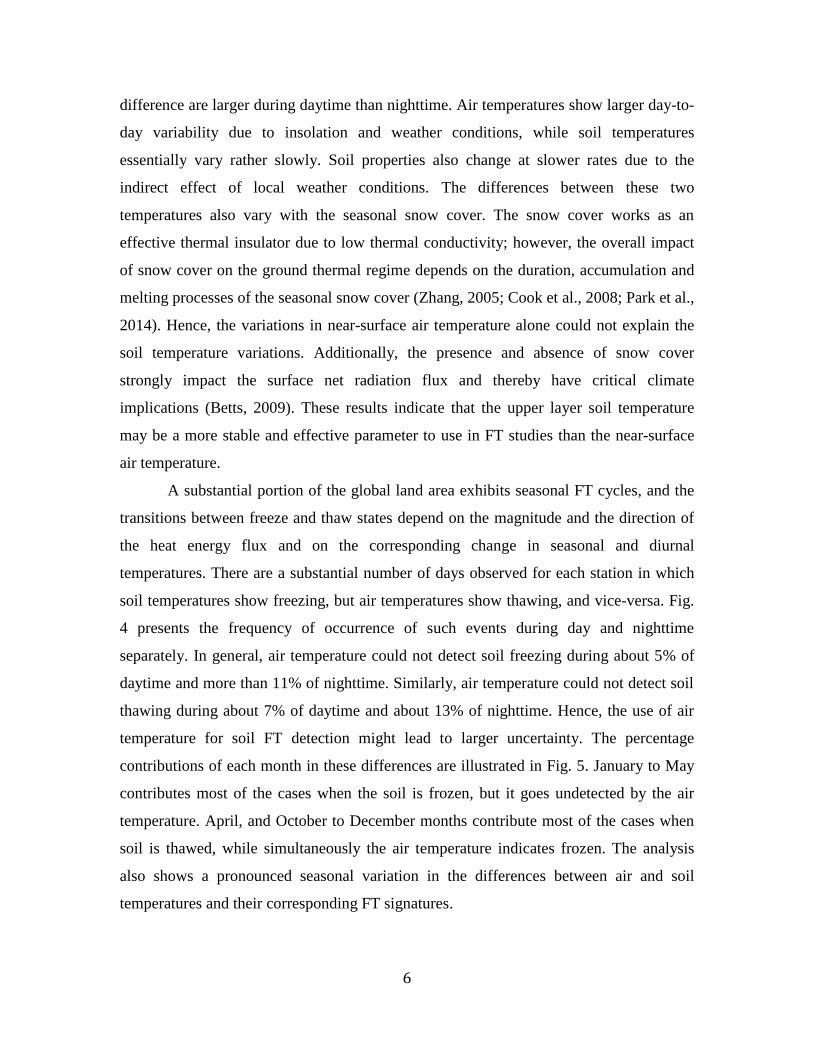
difference are larger during daytime than nighttime. Air temperatures show larger day-to-
day variability due to insolation and weather conditions, while soil temperatures
essentially vary rather slowly. Soil properties also change at slower rates due to the
indirect effect of local weather conditions. The differences between these two
temperatures also vary with the seasonal snow cover. The snow cover works as an
effective thermal insulator due to low thermal conductivity; however, the overall impact
of snow cover on the ground thermal regime depends on the duration, accumulation and
melting processes of the seasonal snow cover (Zhang, 2005; Cook et al., 2008; Park et al.,
2014). Hence, the variations in near-surface air temperature alone could not explain the
soil temperature variations. Additionally, the presence and absence of snow cover
strongly impact the surface net radiation flux and thereby have critical climate
implications (Betts, 2009). These results indicate that the upper layer soil temperature
may be a more stable and effective parameter to use in FT studies than the near-surface
air temperature.
A substantial portion of the global land area exhibits seasonal FT cycles, and the
transitions between freeze and thaw states depend on the magnitude and the direction of
the heat energy flux and on the corresponding change in seasonal and diurnal
temperatures. There are a substantial number of days observed for each station in which
soil temperatures show freezing, but air temperatures show thawing, and vice-versa. Fig.
4 presents the frequency of occurrence of such events during day and nighttime
separately. In general, air temperature could not detect soil freezing during about 5% of
daytime and more than 11% of nighttime. Similarly, air temperature could not detect soil
thawing during about 7% of daytime and about 13% of nighttime. Hence, the use of air
temperature for soil FT detection might lead to larger uncertainty. The percentage
contributions of each month in these differences are illustrated in Fig. 5. January to May
contributes most of the cases when the soil is frozen, but it goes undetected by the air
temperature. April, and October to December months contribute most of the cases when
soil is thawed, while simultaneously the air temperature indicates frozen. The analysis
also shows a pronounced seasonal variation in the differences between air and soil
temperatures and their corresponding FT signatures.

7
Fig. 6 shows the diurnal variations of hourly air and soil temperatures over a
SNOTEL site of Alaska for the year 2015. Three months – January, August and October
were selected for this analysis as they correspond to frozen, thawed, and transition
months. Although both air and soil temperatures exhibit similar kinds of variability, the
range in magnitude is larger for air temperatures than for soil temperatures. It is also
noted that due to the averaging of hourly data for a month, some fine features of the
diurnal cycle are not seen here, even though both air and soil temperatures show
differences in magnitude.
Passive microwave remote sensing has become a reliable tool for studying the FT
states at global and regional scales. Land surface emissivity estimates are developed to
minimize atmospheric effects, and are, therefore, assumed to be better representatives of
land surface and sub-surface characteristics than brightness temperatures. An
instantaneous global land surface emissivity product from the AMSR2 observations was
recently developed utilizing an improved algorithm and near-simultaneous ancillary data
sets (Prakash et al., 2016). The potential of this land emissivity product (difference
between lower and higher frequency channel emissivity estimates) for reliable FT state
detection was also demonstrated over the high-latitude regions (Prakash et al., 2017). Fig.
7 presents the mean monthly AMSR2 land emissivity differences between 6 and 89 GHz
at horizontal polarization over the Northern high-latitude regions (north of 35°N) for
January, August and October of 2015. The monthly composites for ascending and
descending overpasses of AMSR2 are presented separately. Larger positive differences in
emissivity indicate the frozen state, which is prominent during the month of January.
Similarly, lower magnitude of differences (e.g., negative) in emissivity refers to thawed
state as observed during the month of August. The transition from thaw to freeze state is
prominent during the month of October, which is qualitatively captured by the emissivity
difference. Hence, the use of passive microwave land emissivity estimates along with
ground-based upper layer soil temperature has great potential for global soil FT detection
to improve the understanding of the ecosystem.
The global scale in-situ observations of soil temperatures are relatively sparse and
inconsistent compared to the corresponding air temperature and this constrains the
applications of soil temperature usage. Additionally, remote sensing of soil temperatures

8
is challenging and no satellite-based product is currently available to do so. Satellite-
based estimates are available for skin temperatures, but not for soil layers (e.g., at 5cm)
except in some reanalysis products. The scatter plots between both air and soil
temperatures for the three-year period (2013-2015) at the six SNOTEL stations for day
and nighttime are shown in Fig. 8. The plots clearly show that a non-linear relationship,
dependent on day and night, exists between near-surface air and upper layer soil
temperatures. The relationship between both temperatures was also studied in the past
(e.g., Zheng et al., 1993; Brown et al., 2000; Chudinova et al., 2006). The seasonal snow
cover, having higher albedo, lower thermal conductivity, higher latent heat and higher
emissivity, introduces complexity in their relationship over the high-latitude regions
(Zhang, 2005; Cook et al., 2008). The timing, duration, accumulation and melting
processes of the snow are also crucial for the relationship between near-surface air
temperature and soil temperature. Hence, estimation of upper layer soil temperature from
near-surface air temperature by properly taking seasonal snow cover into account
(especially over the high-latitude regions) would certainly enhance the global scale
applicability of upper layer soil temperature. During the freeze-thaw transition periods,
snow on the ground makes a layer that does not eventually allow the soil to be
frozen/thawed despite cold/warm air temperatures. It is imperative, therefore, and there is
a need, that the research community develops an algorithm that estimates upper layer soil
temperature from the Earth-observation satellites so as to more accurately and
realistically study global soil characteristics, particularly for several critical applications.
4. Conclusion
The differences between near-surface air temperatures and upper layer soil
temperatures were assessed over North America. The analysis was done using six
arbitrarily chosen SNOTEL observations for 2013–2015. Near-surface air temperatures
showed larger variability than upper layer soil temperatures. In general, the differences
between air and soil temperatures were larger during daytime than nighttime. There were
notable differences between air and soil temperatures, which varied diurnally as well as
seasonally. The seasonal snow cover also plays a crucial role in the relationship. The
passive microwave land emissivity estimates support the suggestion that soil

9
temperatures may represent soil characteristics more realistically than air temperatures do
and, therefore, should be considered as the reference data for FT state detection.
Moreover, both air and soil temperatures showed a time-dependent, non-linear
relationship with each other. The study also showed that upper layer soil temperatures are
more sensitive than near-surface air temperatures to soil characteristics, and that the use
of upper layer soil temperature along with satellite-based land emissivity estimates may
essentially provide more accurate soil FT detection analyses.
Acknowledgements: This study was supported by the National Science Foundation
(NSF) Research Experiences for Undergraduates (REU) under Grant 1560050 and by the
Department of Defense (DoD) Army Research Office (ARO) under Grant W911NF-15-
1-0070. The statements contained within the manuscript are not the opinions of the
funding agencies or the U.S. government, but reflect the authors’ opinions. The authors
would also like to acknowledge Dr. W. B. Rossow for helpful discussions, and the editor
and anonymous reviewers for constructive comments.
References
Betts, A., 2009: Land-surface-atmosphere coupling in observations and models, J. Adv.
Model. Earth Syst., 1, 4, doi:10.3894/JAMES.2009.1.4.
Brown, S. E., K. S. Pregitzer, D. D. Reed, and A. J. Burton, 2000: Predicting daily mean
soil temperature from daily mean air temperature in four northern hardwood forest
stands, Forest Sci., 46, 297-301.
Chudinova, S. M., O. W. Frauenfeld, R. G. Barry, T. Zhang, and V. A. Sorokovikov,
2006: Relationship between air and soil temperature trends and periodicities in the
permafrost regions of Russia, J. Geophys. Res., 111, F02008, doi:10.1029/2005JF000342.
Cook, B. I., G. B. Bonan, S. Levis, and H. E. Epstein, 2008: The thermoinsulation effect
of snow cover within a climate model, Clim. Dyn., 31, 107-124, doi:10.1007/s00382-007-
0341-y.

10
Du, J., J. S. Kimball, M. Azarderakhsh, R. S. Dunbar, M. Moghaddam, and K. C.
McDonald, 2015: Classification of Alaska spring thaw characteristics using satellite L-
band radar remote sensing, IEEE Trans. Geosci. Remote Sens., 53, 542-556,
doi:10.1109/TGRS.2014.2325409.
Friedl, M. A., D. Sulla-Menashe, B. Tan, A. Schneider, N. Ramankutty, A. Sibley, and X.
Huang, 2010: MODIS Collection 5 global land cover: Algorithm refinements and
characterization of new datasets, Remote Sens. Environ., 114, 168-182,
doi:10.1016/j.rse.2009.08.016.
Jin, R., X. Li, and T. Che, 2009: A decision tree algorithm for surface soil freeze/thaw
classification over China using SSM/I brightness temperature, Remote Sens. Environ.,
113, 2651-2660, doi:10.1016/j.res.2009.08.003.
Kim, Y., J. S. Kimball, K. C. McDonald, and J. Glassy, 2011: Developing a global data
record of daily landscape freeze/thaw status using satellite passive microwave remote
sensing, IEEE Trans. Geosci. Remote Sens., 49, 949-960,
doi:10.1109/TGRS.2010.2070515.
Kim, Y., J. S. Kimball, J. Glassy, and J. Du, 2017: An extended global Earth system data
record on daily landscape freeze-thaw status determined from satellite passive microwave
remote sensing, Earth Syst. Sci. Data, 9, 133-147, doi:10.5194/essd-9-133-2017.
Norouzi, H., W. Rossow, M. Temimi, C. Prigent, M. Azarderakhsh, S. Boukabara, and R.
Khanbilvardi, 2012: Using microwave brightness temperature diurnal cycle to improve
emissivity retrievals over land, Remote Sens. Environ., 123, 470-482,
doi:10.1016/j.rse.2012.04.015.
Norouzi, H., M. Temimi, A. AghaKouchak, M. Azarderakhsh, R. Khanbilvardi, G.
Shields, and K. Tesfagiorgis, 2015: Inferring land surface parameters from the diurnal

11
variability of microwave and infrared temperatures, Phys. Chem. Earth, 83-84, 28-35,
doi:10.1016/j.pce.2015.01.007.
Park, H., A. B. Sherstiukov, A. N. Fedorov, I. V. Polyakov, and J. E. Walsh, 2014: An
observation-based assessment of the influences of air temperature and snow depth on soil
temperature in Russia, Environ. Res. Lett., 9, 064026, doi:10.1088/1748-
9326/9/6/064026.
Podest, E., K. C. McDonald, and J. S. Kimball, 2014: Multisensor microwave sensitivity
to freeze/thaw dynamics across a complex boreal landscape, IEEE Trans. Geosci. Remote
Sens., 52, 6818-6828, doi:10.1109/TGRS.2014.2303635.
Prakash, S., H. Norouzi, M. Azarderakhsh, R. Blake, and K. Tesfagiorgis, 2016: Global
land surface emissivity estimation from AMSR2 observations, IEEE Geosci. Remote
Sens. Lett., 13, 1270-1274, doi:10.1109/LGRS.2016.2581140
Prakash, S., H. Norouzi, M. Azarderakhsh, R. Blake, and R. Khanbilvardi, 2017:
Potential of satellite-based land emissivity estimates for the detection of high-latitude
freeze and thaw states, Geophys. Res. Lett., 44, 2336-2342, doi:10.1002/2017GL072560.
Serreze, M. C., M. P. Clark, R. L. Armstrong, D. A. McGinnis, and R. S. Pulwarty, 1999:
Characteristics of the western United States snowpack from snowpack telemetry
(SNOTEL) data, Water Resour. Res., 35, 2145-2160, doi:10.1029/1999WR900090.
Shahroudi, N., and W. Rossow, 2014: Using land surface microwave emissivities to
isolate the signature of snow on different surface types, Remote Sens. Environ., 152, 638-
653, doi:10.1016/j.rse.2014.07.008.
Wu, T., Q. Wang, L. Zhao, O. Batkhishig, and M. Watanabe, 2011: Observed trends in
surface freezing/thawing index over the period 1987-2005 in Mongolia, Cold Reg. Sci.
Technol., 69, 105-111, doi:10.1016/j.coldregions.2011.07.003.

12
Zhang, T., and R. L. Armstrong, 2001: Soil freeze/thaw cycles over snow-free land
detected by passive microwave remote sensing, Geophys. Res. Lett., 28, 763-766,
doi:10.1029/2000GL011952.
Zhang, T., 2005: Influence of the seasonal snow cover on the ground thermal regime: An
overview, Rev. Geophys., 43, RG4002, doi:10.1029/2004RG000157.
Zheng, D., E. R. Hunt Jr., and S. W. Running, 1993: A daily soil temperature model
based on air temperature and precipitation for continental applications, Clim. Res., 2,
183-191.
Fig. 1 Location of six selected SNOTEL stations considered in this study. Altitude and
IGBP land cover type are also provided for each station.
13
Fig. 2 Mean and standard deviation of daily air temperature and soil temperature over six
SNOTEL stations for 0130 and 1330 LST for the period of 2013-2015.

14
Fig. 3 Time-series of daily (a) daytime and (b) nighttime near surface air temperature and
soil temperature, and (c) their differences over a SNOTEL station for a three-year period
(2013-2015). The shaded area in Fig. 3(a-b) represents the snow depth.

15
Fig. 4 Difference between air temperature and soil temperature over six SNOTEL
stations under two distinct cases corresponding to soil freeze and thaw states.
Fig. 5 Percentage contribution of each month in difference between air and soil
temperatures under freeze and thaw cases.

16
Fig. 6 Diurnal variations of (a) air temperature and (b) soil temperature for the month of
January, August and October over a SNOTEL site during 2015.

17
Fig. 7 Spatial distributions of AMSR2 land emissivity difference between 6 GHz and 89
GHz at horizontal polarization for January, August, and October 2015.
Fig. 8 Scatter plots between air temperature and soil temperature for the three-year period
(2013-2015).