Assessment of Dietary Diversity and Vitamin A-Rich Foods ...
5
Citation: Zongo U, Zoungrana SL, Savadogo A, Thiombiano-Coulibaly N and Traoré AS. Assessment of Dietary Diversity and Vitamin A-Rich Foods Consumption of Pre-School Children in Rural Community in Burkina Faso, an Impact Study Approach. Austin J Nutri Food Sci. 2017; 5(1): 1087. Austin J Nutri Food Sci - Volume 5 Issue 1 - 2017 ISSN : 2381-8980 | www.austinpublishinggroup.com Zongo et al. © All rights are reserved Austin Journal of Nutrition and Food Sciences Open Access Abstract Micronutrient deficiencies especially in vitamin A and low dietary diversity remain a concern in developing countries. This study, based on an anthropological and nutritional approach, was designed to evaluate the diversity and variety of foods in relation to the nutritional status of children in rural areas. 24-hour recalls were conducted with the parents or caregivers of 121 children aged 12-59 months, randomly selected from about 150 households. An average DDA of 3.11 ± 1.04 (ranked from 0 to 6), compared with an average food variety score of 3.70 ± 1.52 were found. The majority of children (70.8%) consumed less than three food groups in the 24 hours prior to the interview. Extensive descriptive analysis showed that 96.6% of preschoolers consumed cereals and tubers, 92.1% consumed vegetables, followed by legumes and nuts (36%). The least consumed foods were fruits and vegetables rich in vitamin A (13.5%), meat (7.9%) fish (7.9%) and eggs (1.1%). A positive and significant correlation between DDS and FVS (r = 0.789; p <0.0001) was obtained. The study did not establish a statistically significant correlation between DDS and nutritional status (p ≥ 0.5). The dietary profile results showed that three major foods make up the bulk of the daily diet of preschool children in the area, namely to porridge and rice. In sum, the study assessed dietary diversity and food profile regarding nutritional status of pre-school children in rural community, in Burkina Faso highly affected by a high prevalence of malnutrition. Keywords: Dietary diversity; Food profile; (pro) vitamin A food; Nutritional status adequacy of the diet. e individual dietary diversity score aims to evaluate the nutritional adequacy of the diet. ese scores were correlated positively with the adequacy of the micronutrient density of complementary foods in infants and young children [2], and with the adequacy of macronutrient and micronutrient intakes of non-infants [3] adolescents [4] and adults. Food approaches are a promising and sustainable way to reduce micronutrient deficiencies efficiently and sustainably, but also vitamin A deficiency. To better understanding the trend, and satisfactory results, we took into account socio-cultural factors, current food practices and knowledge, but also specific constraints on food availability, all of which inhibit food diversification and consumption of vitamin A-rich foods. Methods Study design and data collection e study focused on an anthropological and nutritional approach. It was carried out at the end of the dry season (May-June). Data were collected in two stages. First, data on the availability of foods (rich in vitamin A) were collected from households, market visits using interview techniques, focus groups (mothers of preschool children) or individually interview (mothers, health workers) and free listing. e second step was based on the collection of information on household food consumption and pre-school children’s food Abreviation DD: Dietary Diversity; FV: Food Variety; FVS: Food Variety Score; DDS: Dietary Diversity Score; WHO: World Health Organization; MDD: Minimum Dietary Diversity; WAZ: Weight for Age Z-Scores; HAZ: Height-for-Age Z-Scores; WHZ: Weight-for-Height Z-Scores; ENA: Emergency Nutrition Assessment Introduction Nutrient deficiency, and more particularly micronutrients such as vitamin A, remains a public health problem in developing countries including Burkina Faso. In Africa in general and Burkina Faso in particular, many children are affected by malnutrition or micronutrient deficiencies, or even several forms simultaneously in the early years of their life. According to the national nutrition survey in Burkina Faso, 64.7% of children under two years of age received complementary food in a timely manner (6-8 months), only 17.4% of children between 6 and 23 Months have a diversified diet and 13.4% have a minimum acceptable diet [1]. Harmonious development essentially requires a diversified and available diet. Food diversity is a qualitative measure of food consumption, reflecting the variety of foods that households have access to; it constitutes at the individual level, an approximate measure of the nutritional Research Article Assessment of Dietary Diversity and Vitamin A-Rich Foods Consumption of Pre-School Children in Rural Community in Burkina Faso, an Impact Study Approach Zongo U 1 *, Zoungrana SL 2 , Savadogo A 1 , Thiombiano-Coulibaly N 1,3 and Traoré AS 1 1 Center for Research in Biological, Food and Nutritional Sciences, University Ouaga 1 Pr Joseph KI-ZERBO, Burkina Faso 2 Departement of Gastroenterology, Regional University Hospital Center, Burkina Faso 3 Department of Nutrition, Healthministry, Burkina Faso *Corresponding author: Zongo U, Center for Research in Biological, Food and Nutritional Sciences, University Ouaga 1 Pr Joseph KI-ZERBO, Burkina Faso Received: June 20, 2017; Accepted: July 13, 2017; Published: July 20, 2017
Transcript of Assessment of Dietary Diversity and Vitamin A-Rich Foods ...
Citation: Zongo U, Zoungrana SL, Savadogo A, Thiombiano-Coulibaly N and Traoré AS. Assessment of Dietary Diversity and Vitamin A-Rich Foods Consumption of Pre-School Children in Rural Community in Burkina Faso, an Impact Study Approach. Austin J Nutri Food Sci. 2017; 5(1): 1087.
Austin J Nutri Food Sci - Volume 5 Issue 1 - 2017ISSN : 2381-8980 | www.austinpublishinggroup.com Zongo et al. © All rights are reserved
Austin Journal of Nutrition and Food Sciences
Open Access
Abstract
Micronutrient deficiencies especially in vitamin A and low dietary diversity remain a concern in developing countries. This study, based on an anthropological and nutritional approach, was designed to evaluate the diversity and variety of foods in relation to the nutritional status of children in rural areas. 24-hour recalls were conducted with the parents or caregivers of 121 children aged 12-59 months, randomly selected from about 150 households. An average DDA of 3.11 ± 1.04 (ranked from 0 to 6), compared with an average food variety score of 3.70 ± 1.52 were found. The majority of children (70.8%) consumed less than three food groups in the 24 hours prior to the interview. Extensive descriptive analysis showed that 96.6% of preschoolers consumed cereals and tubers, 92.1% consumed vegetables, followed by legumes and nuts (36%).The least consumed foods were fruits and vegetables rich in vitamin A (13.5%), meat (7.9%) fish (7.9%) and eggs (1.1%). A positive and significant correlation between DDS and FVS (r = 0.789; p <0.0001) was obtained. The study did not establish a statistically significant correlation between DDS and nutritional status (p ≥ 0.5). The dietary profile results showed that three major foods make up the bulk of the daily diet of preschool children in the area, namely to porridge and rice.
In sum, the study assessed dietary diversity and food profile regarding nutritional status of pre-school children in rural community, in Burkina Faso highly affected by a high prevalence of malnutrition.
Keywords: Dietary diversity; Food profile; (pro) vitamin A food; Nutritional status
adequacy of the diet. The individual dietary diversity score aims to evaluate the nutritional adequacy of the diet. These scores were correlated positively with the adequacy of the micronutrient density of complementary foods in infants and young children [2], and with the adequacy of macronutrient and micronutrient intakes of non-infants [3] adolescents [4] and adults. Food approaches are a promising and sustainable way to reduce micronutrient deficiencies efficiently and sustainably, but also vitamin A deficiency. To better understanding the trend, and satisfactory results, we took into account socio-cultural factors, current food practices and knowledge, but also specific constraints on food availability, all of which inhibit food diversification and consumption of vitamin A-rich foods.
MethodsStudy design and data collection
The study focused on an anthropological and nutritional approach. It was carried out at the end of the dry season (May-June). Data were collected in two stages. First, data on the availability of foods (rich in vitamin A) were collected from households, market visits using interview techniques, focus groups (mothers of preschool children) or individually interview (mothers, health workers) and free listing. The second step was based on the collection of information on household food consumption and pre-school children’s food
AbreviationDD: Dietary Diversity; FV: Food Variety; FVS: Food Variety Score;
DDS: Dietary Diversity Score; WHO: World Health Organization; MDD: Minimum Dietary Diversity; WAZ: Weight for Age Z-Scores; HAZ: Height-for-Age Z-Scores; WHZ: Weight-for-Height Z-Scores; ENA: Emergency Nutrition Assessment
IntroductionNutrient deficiency, and more particularly micronutrients
such as vitamin A, remains a public health problem in developing countries including Burkina Faso. In Africa in general and Burkina Faso in particular, many children are affected by malnutrition or micronutrient deficiencies, or even several forms simultaneously in the early years of their life. According to the national nutrition survey in Burkina Faso, 64.7% of children under two years of age received complementary food in a timely manner (6-8 months), only 17.4% of children between 6 and 23 Months have a diversified diet and 13.4% have a minimum acceptable diet [1]. Harmonious development essentially requires a diversified and available diet. Food diversity is a qualitative measure of food consumption, reflecting the variety of foods that households have access to; it constitutes at the individual level, an approximate measure of the nutritional
Research Article
Assessment of Dietary Diversity and Vitamin A-Rich Foods Consumption of Pre-School Children in Rural Community in Burkina Faso, an Impact Study ApproachZongo U1*, Zoungrana SL2, Savadogo A1, Thiombiano-Coulibaly N1,3 and Traoré AS1
1Center for Research in Biological, Food and Nutritional Sciences, University Ouaga 1 Pr Joseph KI-ZERBO, Burkina Faso2Departement of Gastroenterology, Regional University Hospital Center, Burkina Faso3Department of Nutrition, Healthministry, Burkina Faso
*Corresponding author: Zongo U, Center for Research in Biological, Food and Nutritional Sciences, University Ouaga 1 Pr Joseph KI-ZERBO, Burkina Faso
Received: June 20, 2017; Accepted: July 13, 2017; Published: July 20, 2017

Austin J Nutri Food Sci 5(1): id1087 (2017) - Page - 02
Zongo U Austin Publishing Group
Submit your Manuscript | www.austinpublishinggroup.com
consumption, socio-economic characteristics of households and anthropometric measurements.
Data on children’s feeding patterns were collected over a three-day period via the 24-hour recall. All households were visited and informed consent was obtained prior to enrollment in the study. Three types of participants were included in the study. These include resource persons, mothers of children, as well as selected pre-school children.
Study area and subjectsThe study was carried out in rural areas in the municipality of
Gaongo, a Department located in the South Central Burkina Faso according to the administrative division.
The population study included children aged twelve to fifty nine months and their caregivers. This was targeted because of their vulnerability and this stage of development is considered to be the most critical with respect to mortality and nutrient deficiencies [5]. A total of 150 households were selected and 121 children from these households were randomly selected. The mother-child pairs were considered in the survey. The sample size is considered satisfactory to describe the child’s feeding pattern. This sample size is considered adequate for generating valid data because of higth concordance in food culture [6].
Dietary diversity and food variety score24-hour recalls were conducted with each child mothers or
caregivers by trained interviewers inside the households of each participant. The 24-hour period requires less effort from respondents
and is also the recall period used in many dietary diversity studies [3,5].
Dietary Diversity Score (DDS) and Food Variety Score (FVS) were calculated from the 24-hour recall using World Health Organization (WHO) country-specific adaptation guidance [2,7]. Dietary diversity indicator is the sum of scores in the six food groups and is there fore ranged from 0-6. The Minimum Dietary diversity (MDD) indicator is calculated based on consumption of at least four of the following six food groups as recommended by WHO and included: (1) starchy foods (cereals, roots and tubers), (2) legumes and nuts, (3) dairy products (milk, yogurt and Cheese), (4) Eggs, meat, fish, poultry and offal), (5) vitamin A-rich fruits and vegetables; and (6) other fruits and vegetables [8].
Response options were marked and one point (1) was assigned if the food was consumed and zero points (0) if food not consumed [6]. The dietary diversity indicator was the sum of the scores of the six food groups from 0 to 6. The food variety was calculated as the number of foods items consumed over a 24-hour period [9,10]. Minimum Dietary Diversity (MDD) is calculated on the basis of a consumption of at least four of the six food groups. Consumption ≤ 3 food groups was considered to be low dietary diversity, while 4 groups of foods considered as minimum dietary diversity and ≥ 5 food groups such as high dietary diversity [8].
Anthropometric measurementsThe age of child was determined from the birth certificate or
health record; in the absence of these, a calendar of local events was used to determine the age of the child as accurately as possible. Anthropometric measurements including the size and weight of each child were determined using standardized techniques [11,12]. These anthropometric parameters were compared with age and used to determine the nutritional status of children.
Statistical analysisIBM® SPSS® 24.0 statistical analysis software was used to perform
all analyzes. Epi info and ENA were used to calculate the nutritional indices, which were interpreted according to the reference [13]. Regression analyzes were performed to establish correlations between nutritional indices and Dietary Diversity (DD) and Food Variety (FV).
Results Food profile
Food profile was evaluated from the 24h recall in three passages (three days). (Figure 1) shows the food profile of preschool children in rural Burkina Faso.
Most of pre-school children consumed at breakfast, lunch and dinner. Tô, rice and porridge are the most consumed staples, for the day. Tô is the staple food in Burkina Faso, consisting of a cereal-based thick porridge, and is adapted to several types of sauces. It was the most consumed by children, 59.49% at breakfast, 56.04% at lunch and 55.15% at dinner. Porridge was consumed at 16.46%, 15.77% and 18.60% respectively at breakfast, lunch and dinner. The highest consumption rate of rice (the third most consumed meal) was 15.44% at dinner.
Figure 1: Food profile of pre-school children in rural areas of Burkina Faso.
Figure 2: Food items consumption by preschool children.

Austin J Nutri Food Sci 5(1): id1087 (2017) - Page - 03
Zongo U Austin Publishing Group
Submit your Manuscript | www.austinpublishinggroup.com
Dietary diversityTable 1 summarizes food variety and dietary diversity and their
correlation. The majority of children (70.8%) consumed ≤ 3 food groups defining a low dietary diversity, the 24 hours preceding the interview. Approximately twenty-two (22.5) percent of children were classified as having a medium dietary diversity score. Only 6.7% had high dietary diversity (≥ 5 food groups). Finding showed that among underweight children, more than ¾ (73%) have a low dietary diversity, 20.3% have minimun dietary diversity, only 6.8% have dietary diversity. Among those at risk of under weight more than half (57.1%) have low dietary diversity, 35.7% have a minimum dietray diversity, but only 7.1% which have high dietary diversity.
The mean dietary diversity obtained was 3.11 ± 1.04 (ranked from 0 to 6), indicating that pre-school children in the study area consumed less than 4 groups defining an acceptable minimum intake.
Food variety scoreFinding indicated a mean food variety score of 3.70 defining
the average number of foods items consumed during the 24 hours preceding the interview. The most common and frequently consumed food items (Figure 2) are cereals and tubers, vegetables (mainly leafy vegetables stew), and legumes and nuts. Extensive descriptive analysis showed that 96.6% of preschool children consumed cereals and tubers, 92.1% consumed vegetables, followed by legumes and nuts (36%). The least consumed foods were milk (19.1%), and fruit (34.8%). A small proportion of pre-school children in the study area consumed fruits and vegetables rich in vitamin A (13.5%), meat (7.9%) fish (7.9%), and less the eggs (1.1%).
Relationship between dietary diversity, food variety and nutritional status
A positive and significant correlation between DDS and FVS (r = 0.789; p <0.0001) was obtained. (Table 2) shows the correlation coefficient between DDS and FVS. The study did not establish a statistically significant correlation between DDS and nutritional
status (p ≥ 0.5). Other studies such as Sealey [14] indicated that DDS and FVS were not significantly (p ≥ 0.5) correlated with one of the nutritional indices.
Nutritional statusThe nutritional status of the study population was evaluated
by combining the anthropometric parameters [15]. The Table 2 summarizes the mean z-score distribution of pre-school children in the study area. Most of pre-school children had moderate nutritional status for wasting, stunting and underweight respectively.
Vitamin A rich foods consumptionInterviews and focus groups revealed about twenty eight foods
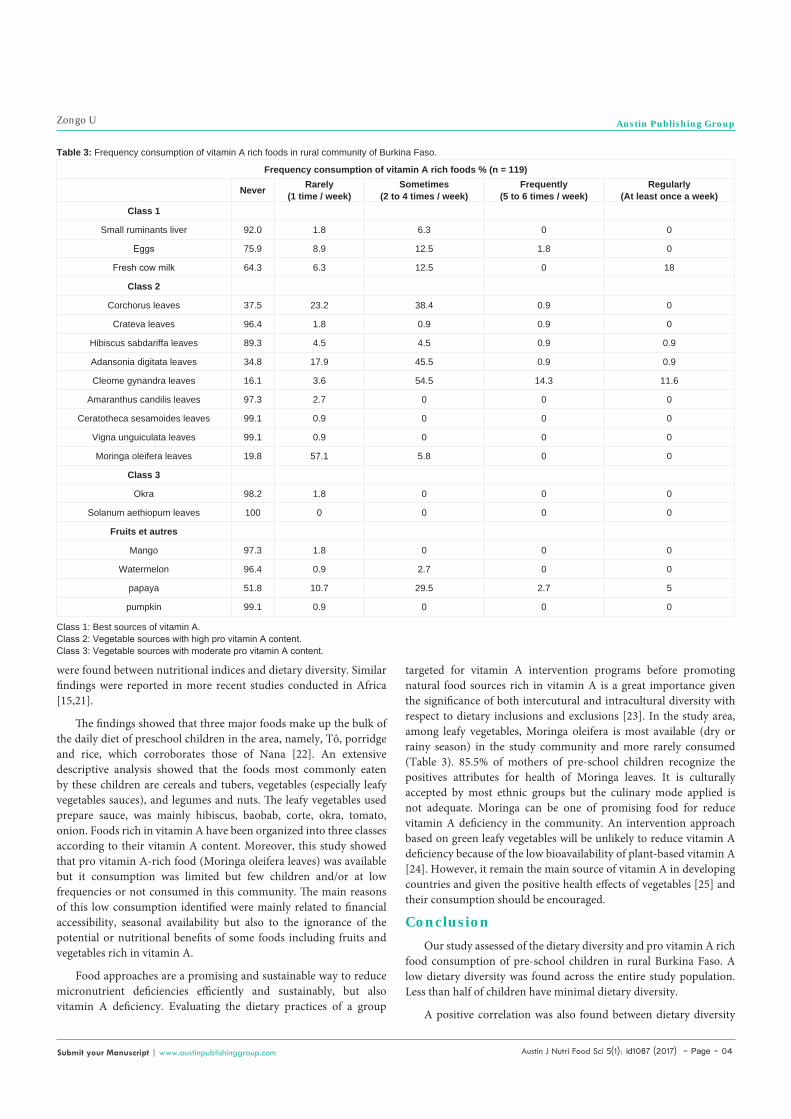
potentially sources of vitamin A. Therefore, for plant sources, those moderately rich in vitamin A [16,17] and available, (eighteen) were used for evaluating food frequency consumption (Table 3). (Pro) vitamin A-rich foods identified in the community included three animal products (Liver, eggs and cow’s milk), four fruits (mango, papaya, watermelon, pumpkin) and twelve green leafy vegetables classified into three classes according to their content of pro-vitamin A [17].
Among animal sources rich in vitamin A, fresh cow’s milk is regularly consumed (at least once a week) by some of the preschool children especially whose of foulany people in the community. For vegetable sources, leaves of Cleome gynandra, baobab and sorrel were the most consumed with regulary consumption frequency of 11.6%, 0.9% and 0.9%, respectively. Moreover, fruits potentially pro rich in vitamin A, papaya is the fruit most regularly consumed by 5% of children. The characteristic of the pro vitamin A-rich food can be divided into health-related perception, availability and accessibility issues and beliefs related to consumption and preparation.
DiscussionNutritional status is strongly influenced by diet but also by health
status. The diet of our study population is very poor overall with a predominance of consumption of tô, porridge and rice in order of importance. This low diversity diet impacts the inadequacy of the ingested and consequently the nutritional status of children observed in the study area at the time of the investigation.
Low dietary diversity is a great problem among poor people in developing countries whose daily diet is usually based on a starches source (cereals, tubers) with one or two additional components [18]. Poor diet quality regarding nutrients intake and low dietary diversity is typical of West African food consumption [14]. The mean dietary diversity score of 3.11 found in this study is lower than the 4 food groups recognized as the minimum dietary diversity score [8]. Our finding are similar to those of Nana [19], who found a dietary diversity score of 3.2 during dry season in pre-school children in rural areas. This low dietary diversity could take related to the period of study (pre-season) which is the lean season with regard to food availability and which access and also level of low income in rural area in Burkina Faso. Studies have shown that increasing dietary diversity is associated with improved household socioeconomic status and house hold food security status [20]. Mean FVS was found to be a 3.70 which is an indication of dietary variety. In this study, DDS was used to compare nutritional status of children. However, no associations
Table 1: Nutritional status of children enrolled in the study.
Specifications n Results
Age (month) 112 24.9
Nutritional Status
HAZ 57 -2.49±1.23
WAZ 74 -2.92±0.93
WHZ 57 -2.26±0.81
Table 2: Dietary diversity and dietary diversity score of pre-school children.
**The correlation is significant at p <0.0001.
Low DDn (%)
Minimum DDn (%)
Hight DDn (%)
Pre-school children (n=112) 79 (70.8) 25 (22.5) 7 (6.7)
Under weight (n=74) 54 (73) 15 (23) 5 (6.8)At risk of underweight
(n=14) 8 (57.1) 5 (35.7) 1 (7.1)
Dietary Diversity Correlation
DDS mean (±SD) 3.11 ±1.04
r= 0.789**Variety Food
FVS mean (±SD) 3.70 ±1.52
Austin J Nutri Food Sci 5(1): id1087 (2017) - Page - 04
Zongo U Austin Publishing Group
Submit your Manuscript | www.austinpublishinggroup.com
were found between nutritional indices and dietary diversity. Similar findings were reported in more recent studies conducted in Africa [15,21].
The findings showed that three major foods make up the bulk of the daily diet of preschool children in the area, namely, Tô, porridge and rice, which corroborates those of Nana [22]. An extensive descriptive analysis showed that the foods most commonly eaten by these children are cereals and tubers, vegetables (especially leafy vegetables sauces), and legumes and nuts. The leafy vegetables used prepare sauce, was mainly hibiscus, baobab, corte, okra, tomato, onion. Foods rich in vitamin A have been organized into three classes according to their vitamin A content. Moreover, this study showed that pro vitamin A-rich food (Moringa oleifera leaves) was available but it consumption was limited but few children and/or at low frequencies or not consumed in this community. The main reasons of this low consumption identified were mainly related to financial accessibility, seasonal availability but also to the ignorance of the potential or nutritional benefits of some foods including fruits and vegetables rich in vitamin A.
Food approaches are a promising and sustainable way to reduce micronutrient deficiencies efficiently and sustainably, but also vitamin A deficiency. Evaluating the dietary practices of a group
targeted for vitamin A intervention programs before promoting natural food sources rich in vitamin A is a great importance given the significance of both intercutural and intracultural diversity with respect to dietary inclusions and exclusions [23]. In the study area, among leafy vegetables, Moringa oleifera is most available (dry or rainy season) in the study community and more rarely consumed (Table 3). 85.5% of mothers of pre-school children recognize the positives attributes for health of Moringa leaves. It is culturally accepted by most ethnic groups but the culinary mode applied is not adequate. Moringa can be one of promising food for reduce vitamin A deficiency in the community. An intervention approach based on green leafy vegetables will be unlikely to reduce vitamin A deficiency because of the low bioavailability of plant-based vitamin A [24]. However, it remain the main source of vitamin A in developing countries and given the positive health effects of vegetables [25] and their consumption should be encouraged.
ConclusionOur study assessed of the dietary diversity and pro vitamin A rich
food consumption of pre-school children in rural Burkina Faso. A low dietary diversity was found across the entire study population. Less than half of children have minimal dietary diversity.
A positive correlation was also found between dietary diversity
Table 3: Frequency consumption of vitamin A rich foods in rural community of Burkina Faso.
Class 1: Best sources of vitamin A.Class 2: Vegetable sources with high pro vitamin A content.Class 3: Vegetable sources with moderate pro vitamin A content.
Frequency consumption of vitamin A rich foods % (n = 119)
Never Rarely(1 time / week)
Sometimes (2 to 4 times / week)
Frequently (5 to 6 times / week)
Regularly (At least once a week)
Class 1
Small ruminants liver 92.0 1.8 6.3 0 0
Eggs 75.9 8.9 12.5 1.8 0
Fresh cow milk 64.3 6.3 12.5 0 18
Class 2
Corchorus leaves 37.5 23.2 38.4 0.9 0
Crateva leaves 96.4 1.8 0.9 0.9 0
Hibiscus sabdariffa leaves 89.3 4.5 4.5 0.9 0.9
Adansonia digitata leaves 34.8 17.9 45.5 0.9 0.9
Cleome gynandra leaves 16.1 3.6 54.5 14.3 11.6
Amaranthus candilis leaves 97.3 2.7 0 0 0
Ceratotheca sesamoides leaves 99.1 0.9 0 0 0
Vigna unguiculata leaves 99.1 0.9 0 0 0
Moringa oleifera leaves 19.8 57.1 5.8 0 0
Class 3
Okra 98.2 1.8 0 0 0
Solanum aethiopum leaves 100 0 0 0 0
Fruits et autres
Mango 97.3 1.8 0 0 0
Watermelon 96.4 0.9 2.7 0 0
papaya 51.8 10.7 29.5 2.7 5
pumpkin 99.1 0.9 0 0 0

Austin J Nutri Food Sci 5(1): id1087 (2017) - Page - 05
Zongo U Austin Publishing Group
Submit your Manuscript | www.austinpublishinggroup.com
and food variety but not with nutritional status. The food profile revealed a monotonous diet characterized by a high consumption of tô, porridge and rice. This study indicated that pro vitamin A-rich food was available but not consumed or consumed by few children and/or at low frequencies in this community, the main reasons were mainly financial accessibility, seasonal availability but also to the ignorance of the potential or nutritional benefits of some foods including fruits and vegetables rich in vitamin A.
Food approaches are a promising and sustainable way to reduce micronutrient deficiencies efficiently and sustainably, but also vitamin A deficiency. Evidence on nutrition education and food access and/or availability programs have been shown to effctively improve dietary diversity and overall nutrition in populations. A continuous monitoring, more research and sensitizations actions for rural people is needed to promote fruits and leafy vegetables consumption particulary whose rich in vtamin A.
AcknowledgementThe first author is very much thankful to Moussa Ouedraogo,
Zoma Lamoussa Robert and interviewers for their technical support.
References1. MS. Enquête nutritionnelle nationale. Ministère de la santé, Burkina Faso.
2015: 67.
2. Technical F, NTAF N, Project. A (FANTA). Working Group on Infant and Young child feeding Indicators. Developing and validating simple indicators of dietary quality and energy intake of infants and young children in developing countries: summary of fidings from analysis of 10 data sets. Washingto. 2006.
3. Kennedy G, Pedro Mr, Seghieri C, Nantel G, Brouwer I. Dietary diversity score is a useful indicator of micronutrient intake in non breast-feeding Filipino children. J Nutr. 2007; 137: 1-6.
4. Mirmiran P, Azadbakht L, Esmaillzadeh A, Azizi F. Dietary diversity score in adolescents - A good indicator of the nutritional adequacy of diets: Tehran lipid and glucose study. Asia Pac J Clin Nutr. 2004; 13: 56-60.
5. WHO. The world health report. Geneva: World health organization. 2002.
6. Kuhnlein HV pelto G. Understanding vtamin A deficiency in community. Kuhnlein HV, Pelto GH, editors. In: Culture, envoronment and food to prevent vitamin A deficiency. Boston Mass, USA: International Nutrition Foundation fot Developing countries. 1997: 177-184.
7. UNICEF W. WHO child growth standards and the identifiation of severe acute malnutrition in infants and children. 2009.
8. Arimond M, Wiesmann D, Becquey E, Carriquiry A, Daniels M, Deitchler M, et al. Simple food group diversity indicators predict micronutrient adequacy of women’s diets in 5 diverse, resource-poor settings. J Nutr. 2010; 140: 2059-2069.
9. WHO. Indicators for assessing infant and young child feeding practices. Part II: measurement. WHO Press. 2009.
10. FANTA. Increased number of different foods or food groups consumed. Measuring household food consumption: A technical guide. 2004.
11. Hatløy A, Torheim LE, Oshaug A. Food variety-a good indicator of nutritional adequacy of the diet? A case study from an urban area in Mali, West Africa. Eur J Clin Nutr. 1998; 52: 891-898.
12. Steyn NP, Nel JH, Nantel G, Kennedy GLD. Food variety and dietary diversity scores in children: are they good indicators of dietary adequacy? Public Heal Nutr. 2006; 9: 644-650.
13. Lohmann TG, Roche AF MR. Anthropometric standardization: Reference Manual Champaign, IL: Human Kinetics. 1988.
14. Sealey-Potts C, Potts AC. An Assessment of Dietary Diversity and Nutritional Status of Preschool Children. Austin J Nutr Food Sci. 2014; 2: 1040.
15. United Nations. How to weigh and measure children: Assessing the nutritional status of young children in household surveys. New York. 1986.
16. MS. Table de composition des aliments couramment consommés au Burkina Faso. Ministère de la santé. 2005; 37.
17. FAO. Table de composition des aliments à l’usage de l’Afrique. FAO, Rome-Italie. 2012.
18. WHO. WHO Child Growth Standards based on length/ height, weight and age. Acta Paediatr. 2006; 95: 76-85.
19. Nana CP, Brouwer ID, Zagre NM, Kok FJTA. Community assessment of availability, consumption, and cultural acceptability of food sources of (pro) vitamine A: toward the development of a dietary intervention among preschool children in rural Burkina Faso. Food nutr bull. 2005; 26: 356-365.
20. Hatloy A, Hallund J, Diarra MM, Oshaug A. Food variety, socioeconomic status and nutritional status in urban and rural areas in Koutiala (Mali). Public Health Nutr. 2000; 3: 57-65.
21. Onyango A, Koski KGTK. Food diversity versus breast feeding choice in determining anthropometric status in rural Kenyan toddlers. Int J Epidemiol. 1998; 27: 484-489.
22. Nana CP. Développement et évaluation de l’impact d’une approche alimentaire dans la lutte contre la carence en vitamine A en milieu rural au Burkina Faso. 2006.
23. Johns T, Booth SL KH. Factors inflencing vitamin A intake and program to improve vitamin A status. Food Nutr Bull. 14: 20-33.
24. de Pee S, West CE, Muhilal, Karyadi DHI. Lack of improvement in vitamin A status with increased consumption of dark-green leafy vegetables. Lancet. 1995; 346: 75-81.
25. JW L. Health effects of vegetables and fruit: assessing mechanisms of actions in human experimental studies. Am J Clin Nutr. 1999; 70: 475-490.
Citation: Zongo U, Zoungrana SL, Savadogo A, Thiombiano-Coulibaly N and Traoré AS. Assessment of Dietary Diversity and Vitamin A-Rich Foods Consumption of Pre-School Children in Rural Community in Burkina Faso, an Impact Study Approach. Austin J Nutri Food Sci. 2017; 5(1): 1087.
Austin J Nutri Food Sci - Volume 5 Issue 1 - 2017ISSN : 2381-8980 | www.austinpublishinggroup.com Zongo et al. © All rights are reserved