Assessment of Council Fit for the Future Proposals · Contents iii IPART Assessment of Council Fit...
208
Independent Pricing and Regulatory Tribunal Assessment of Council Fit for the Future Proposals Local Government — Final Report October 2015
Transcript of Assessment of Council Fit for the Future Proposals · Contents iii IPART Assessment of Council Fit...
Independent Pricing and Regulatory Tribunal
Assessment of Council Fit for the Future Proposals
Local Government — Final ReportOctober 2015


Assessment of Council Fit for the Future Proposals
Local Government — Final Report October 2015

ii IPART Assessment of Council Fit for the Future Proposals
© Independent Pricing and Regulatory Tribunal of New South Wales 2015
This work is copyright. The Copyright Act 1968 permits fair dealing for study, research, news reporting, criticism and review. Selected passages, tables or diagrams may be reproduced for such purposes provided acknowledgement of the source is included.
ISBN 978-1-925340-21-1
The Tribunal members for this report are:
Dr Peter J Boxall AO, Chairman
Ms Catherine Jones
Mr John Comrie
Inquiries regarding this document should be directed to a staff member:
Lucy Garnier (02) 9290 8488
Derek Francis (02) 9290 8421
Independent Pricing and Regulatory Tribunal of New South Wales PO Box K35, Haymarket Post Shop NSW 1240 Level 15, 2-24 Rawson Place, Sydney NSW 2000
T (02) 9290 8400 F (02) 9290 2061
www.ipart.nsw.gov.au
Contents
iii IPART Assessment of Council Fit for the Future Proposals
Contents
Summary 1 Key findings 1 What process have we followed? 16 What does the rest of this report cover? 17 Assessment of councils: Metropolitan Sydney councils 18 Assessment of councils: Non- metropolitan councils 19
1 Assessment approach and proposals received 25 1.1 Context for the review 25 1.2 The assessment approach 26 1.3 Council proposals received 34 1.4 Public consultation on council proposals 37
2 Assessments by region 39 2.1 Metropolitan Sydney 39 2.2 Central Coast, Hunter and Illawarra 61 2.3 Non-Metropolitan Regions 65
3 Monitoring and reporting of FFTF projections 87 3.1 Monitoring and reporting process 87
Appendices 91 A Terms of reference 93 B Fit for the Future financial criteria 96 C Council assessments 104 D Analysis of merger business cases 405 E Ernst & Young consultant report - Fit for the Future: Review of Business
Case Estimates of Merger Net Benefits for Sydney Metropolitan Councils 414


Summary
Assessment of Council Fit for the Future Proposals IPART 1
Summary
The NSW Government has asked IPART to undertake the role of the Expert Advisory Panel in assessing local government Fit for the Future (FFTF) proposals.1 The FFTF reforms aim to improve the strength and effectiveness of local government in providing services and infrastructure that communities need.2
This report sets out our assessment of whether local councils are fit or not fit for the future based on the proposals submitted. In undertaking the assessments we have used the Independent Local Government Review Panel’s (ILGRP’s) options for reform as a starting point for our analysis.
The NSW Government has announced that councils which are assessed as fit will have access to a range of benefits including a streamlined rate variation process, a State Government borrowing facility, priority for other government funding and grants, and eligibility for additional devolved planning powers.3 Funding will also be provided by the NSW Government to assist with the transitional costs of merging, establishing regional Joint Organisations (JO), and assisting regional and rural councils.4
The assessments will now be considered by the NSW Government in determining the next stage of the reform process.
Key findings
We received 139 local council proposals from 144 councils including:
four Merger Proposals (involving nine councils)
115 Council Improvement Proposals, and
20 Rural Council Proposals.5
1 The NSW Government’s terms of reference for the review is at Appendix A. 2 Office of Local Government (OLG), Fit for the Future – A roadmap for Stronger, Smarter Councils,
September 2014, p 15. 3 OLG, Fit for the Future – A roadmap for Stronger, Smarter Councils, September 2014, pp 14-15. 4 Ibid. 5 Council proposals can be found on the IPART website at www.ipart.nsw.gov.au

Summary
2 IPART Assessment of Council Fit for the Future Proposals
We assessed 52 proposals as being fit for the future, which represents 37% of the proposals received.6 To be assessed as fit, councils must have demonstrated they have sufficient scale and capacity and are financially sustainable.
All four Merger Proposals we received were assessed as fit because they:
would deliver substantial benefits to their local communities when compared to the councils standing alone, and
were generally the best available options for the relevant councils as neighbouring councils did not elect to join the Merger Proposals.
We assessed 87 proposals as not being fit for the future, which represents 63% of the proposals received.
Of the 87 proposals assessed as not fit:
60 were assessed as not having sufficient scale and capacity, but did meet the financial criteria
18 were assessed as having sufficient scale and capacity, but did not meet the financial criteria, and
9 were assessed as not having sufficient scale and capacity and not meeting the financial criteria.
The main reasons for councils being assessed as not having sufficient scale and capacity were because:
A merged entity would have greater scale and strategic capacity to better partner with other levels of government in providing key infrastructure and social services.
A merged entity could better integrate planning and development, resulting in improved planning decisions and enhanced economic growth.
The merger option and the business case for the merger commissioned by the council showed substantial gains. Despite this, most councils did not submit a Merger Proposal.
Our analysis and the analysis undertaken by our independent economic consultants, Ernst & Young, indicated the merger option would provide large net benefits to the local communities.
The council’s proposal to remain a stand-alone council was not at least as good as the preferred merger option.
The efficiency improvements in the council’s proposal could be realised under the merger option, and the merger option could provide significant further benefits to residents.
6 Details of the assessment for each council can be found in Chapter 2 and Appendix C.

Summary
Assessment of Council Fit for the Future Proposals IPART 3
In addition to these reasons, in non-metropolitan areas, a number of councils were assessed as not having sufficient scale and capacity because the council’s population is declining or static and is forecast to be below 10,000 by 2031. A population of this size would be likely to affect a council’s efficiency and strategic capacity to meet the future needs of its community.
For both Metropolitan Sydney and non-metropolitan councils, the main reason councils did not meet the financial criteria was generally because they forecast an operating deficit throughout the period, including in the benchmark year of 2019-20, and other factors suggest the council has a weak financial position.7
As discussed further below, most Metropolitan Sydney councils were assessed as not fit because they did not demonstrate they had sufficient scale and capacity. In contrast, in non-metropolitan areas, a number of councils were assessed as not fit as they did not meet the financial criteria.
The assessment for each council can be found in Tables 1 to 7 below.
Metropolitan Sydney
In Metropolitan Sydney, we received 38 proposals, which included two Merger Proposals and 36 Council Improvement Proposals. As set out in Figure 1 below, we assessed 9 proposals as fit and 29 proposals as not fit in Metropolitan Sydney.
7 For rural councils (councils in OLG Groups 8 to 11 and those choosing to submit a Rural
Council Proposal) the benchmark year for the operating performance ratio was 2024-25. However, for all other measures and councils the benchmark year was 2019-20.
Summary
4 IPART Assessment of Council Fit for the Future Proposals
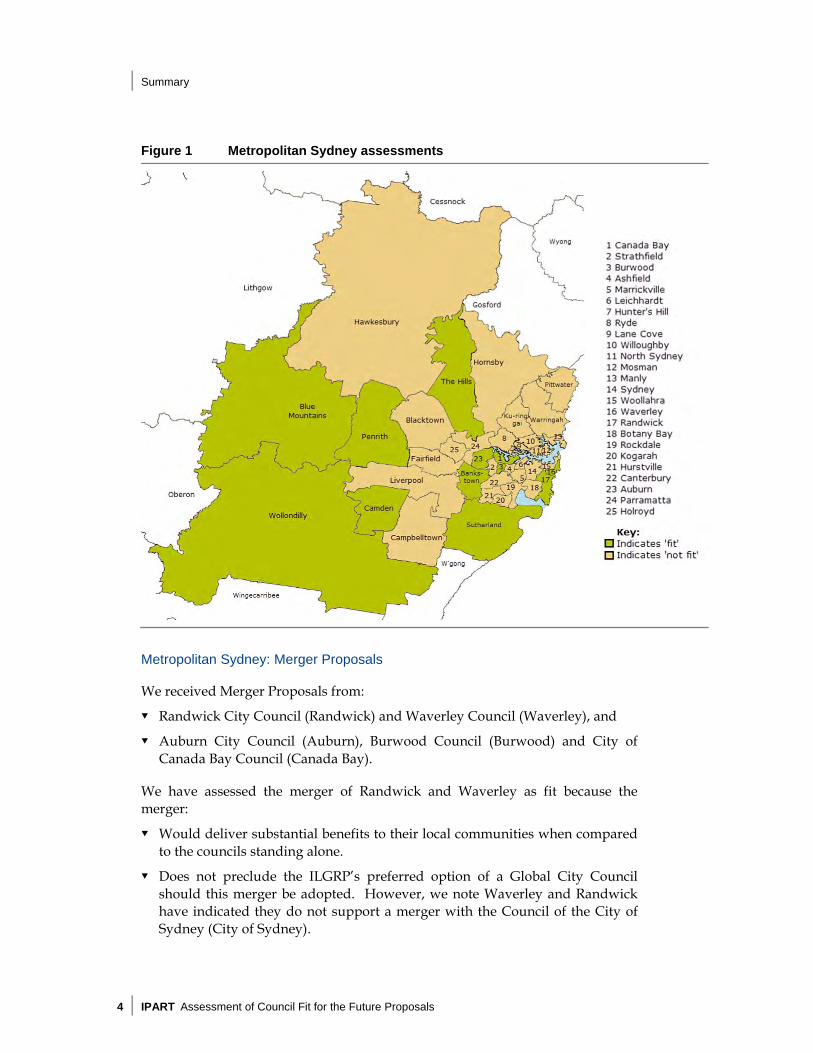
Figure 1 Metropolitan Sydney assessments
Metropolitan Sydney: Merger Proposals
We received Merger Proposals from:
Randwick City Council (Randwick) and Waverley Council (Waverley), and
Auburn City Council (Auburn), Burwood Council (Burwood) and City of Canada Bay Council (Canada Bay).
We have assessed the merger of Randwick and Waverley as fit because the merger:
Would deliver substantial benefits to their local communities when compared to the councils standing alone.
Does not preclude the ILGRP’s preferred option of a Global City Council should this merger be adopted. However, we note Waverley and Randwick have indicated they do not support a merger with the Council of the City of Sydney (City of Sydney).
Summary
Assessment of Council Fit for the Future Proposals IPART 5
Was the best available option for these councils given neighbouring councils did not elect to join the Merger Proposal.
Builds on existing collaborations between Waverley and Randwick, which share communities of interest and similar geography.
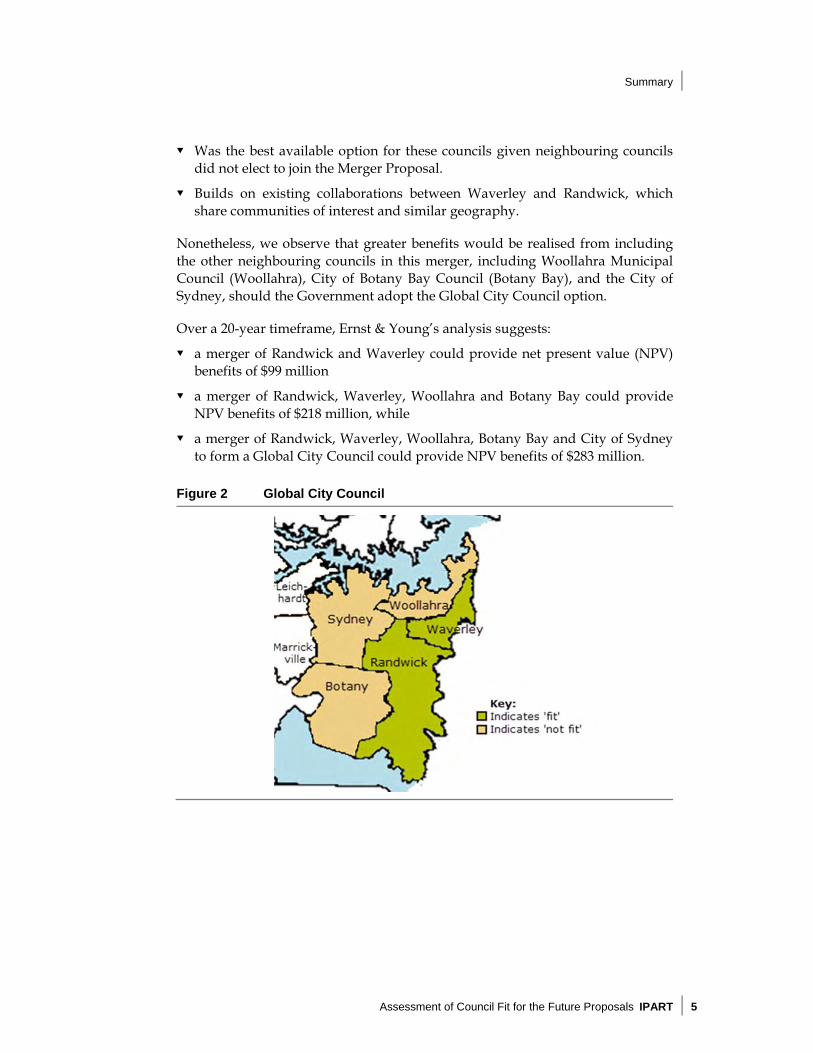
Nonetheless, we observe that greater benefits would be realised from including the other neighbouring councils in this merger, including Woollahra Municipal Council (Woollahra), City of Botany Bay Council (Botany Bay), and the City of Sydney, should the Government adopt the Global City Council option.
Over a 20-year timeframe, Ernst & Young’s analysis suggests:
a merger of Randwick and Waverley could provide net present value (NPV) benefits of $99 million
a merger of Randwick, Waverley, Woollahra and Botany Bay could provide NPV benefits of $218 million, while
a merger of Randwick, Waverley, Woollahra, Botany Bay and City of Sydney to form a Global City Council could provide NPV benefits of $283 million.
Figure 2 Global City Council

Summary
6 IPART Assessment of Council Fit for the Future Proposals
We have also assessed the Merger Proposal from Auburn, Burwood and Canada Bay as fit because the merger:
Would deliver substantial benefits to their local communities when compared to the councils standing alone.
Is forecast to improve the operating performance of the councils compared with each council standing alone, and in the absence of rate increases.
Was the best available option for these councils given neighbouring councils did not elect to join the Merger Proposal.
This merger is consistent with the NSW Government’s Fit for the Future – A roadmap for Stronger, Smarter Councils, which identifies voluntary mergers as an option to become FFTF.8 As noted above, the Government is also providing incentives and support to enable councils to pursue voluntary mergers.9
We understand Auburn, Burwood and Canada Bay consider the Merger Proposal would result in better outcomes for the community with Strathfield Municipal Council (Strathfield) included and they are advocating for its inclusion in the merger.
Over a 20-year timeframe, our analysis, using information provided by the councils, suggests a merger of Auburn, Burwood and Canada Bay could provide NPV benefits of $114 million. A merger which includes Strathfield is likely to yield additional benefits.
Figure 3 Auburn, Burwood and Canada Bay merger proposal
8 OLG, Fit for the Future – A roadmap for Stronger, Smarter Councils, September 2014, p 10. 9 Ibid.

Summary
Assessment of Council Fit for the Future Proposals IPART 7
Metropolitan Sydney: City of Sydney
City of Sydney submitted a Council Improvement Proposal to remain a stand-alone council. City of Sydney meets the financial criteria overall as a stand-alone council and its current and projected financial performance is strong. It also demonstrated it has the ability to proactively partner with the government to undertake significant infrastructure and urban renewal projects, such as the Green Square development.
However, we have assessed City of Sydney as not meeting the scale and capacity criterion against the Global City Council option, and therefore as not fit.
A Global City Council may better integrate planning and development across the eastern suburbs and central Sydney as the central business district (CBD) expands. It would also provide for better partnering with other levels of government for key infrastructure, such as the Sydney Light Rail Project and the second Sydney Harbour rail crossing.
Should the Government adopt the Global City Council option, the following issues might require consideration:
The extent to which the Global City Council should be given control over key infrastructure such as the Sydney Opera House, Barangaroo, Port Botany, Circular Quay and Darling Harbour to enable it to operate effectively as a Global City Council, as this infrastructure is currently administered by bodies separate to local councils.
How to ensure the development and growth of the CBD and surrounding areas continues. This may require changes and enhancements to the City of Sydney Act 1988. In addition, the implications for business voting within the Global City Council may need to be considered, as the City of Sydney Act 1988 will allocate two votes to businesses in local council elections in the City of Sydney from 2016.
Measures to ensure the significant council revenues generated from businesses in the Sydney CBD are spent efficiently to realise the key objectives of the Global City Council.
If the Global City Council option is not adopted, City of Sydney has sufficient scale and capacity to stand alone and would be fit as a stand-alone council.

Summary
8 IPART Assessment of Council Fit for the Future Proposals
Metropolitan Sydney: Council Improvement Proposals
Of the 36 Council Improvement Proposals we received in Metropolitan Sydney (including City of Sydney), we assessed seven as fit and 29 as not fit.
Councils assessed as fit
We assessed seven Council Improvement Proposals as fit in Metropolitan Sydney. All of these councils are in Outer Metropolitan Sydney, other than Bankstown City Council. These councils include:
Bankstown City Council
Blue Mountains City Council
Camden Council
The Hills Shire Council
Penrith City Council
Sutherland Shire Council, and
Wollondilly Shire Council.
These councils were assessed as fit because:
remaining a stand-alone council was consistent with the ILGRP’s preferred option, or
our analysis did not identify a merger alternative that was better than remaining a stand-alone council, and
they met the financial criteria overall.
In the case of Blue Mountains City Council and Wollondilly Shire Council, whilst their current financial performance is poor, their projected financial performance shows significant improvement. This is due primarily to recently approved large special variations which increased the general income Blue Mountains City Council and Wollondilly Shire Council can collect from their communities, by 28.5% and 38.8% respectively above the rate peg, over the next few years.
In the case of Camden Council, the council is managing large increases in its population which has adversely affected its short term financial performance. We have taken this into account in undertaking the assessment against the financial criteria and have assessed it as meeting the financial criteria overall.

Summary
Assessment of Council Fit for the Future Proposals IPART 9
Councils assessed as not fit due to insufficient scale and capacity
We assessed all Inner Metropolitan Sydney councils that had a preferred merger option, but submitted a stand-alone proposal, as not fit, as they did not meet the scale and capacity criterion. As outlined in Table 2 below, we assessed 26 of the 36 Council Improvement Proposals in Metropolitan Sydney as not fit, because the alternative merger option identified and considered in business cases by the councils showed substantial gains that were greater than each council remaining a stand-alone council. For these councils, it is likely that structural changes would be required to enable these councils to be assessed as meeting the scale and capacity criterion.
The ILGRP’s preferred mergers could provide a range of benefits to the community including:
more effective and efficient service delivery
improved delivery of major infrastructure
more integrated strategic planning and policy development
more effective partnering with government, and
stronger advocacy for local communities.
In addition to these benefits, our indicative analysis suggests $1.8 billion to $2.0 billion in NPV benefits could be realised over 20 years if the ILGRP’s preferred Metropolitan Sydney mergers occurred. This analysis was undertaken by using the merger business cases provided by councils and estimating the NPV benefits using a consistent 20-year timeframe and discount rate.10
We have also commissioned Ernst & Young to develop its own estimates of the potential financial benefits of the Metropolitan Sydney mergers. This analysis indicated $1.3 billion in NPV benefits could be realised over 20 years. The differences between IPART’s estimates and Ernst & Young’s estimates represent differences in the assumptions and methodologies used by the councils’ consultants and Ernst & Young. However, both estimates suggest substantial net financial gains are likely to arise from these mergers.
Some councils, such as Hornsby Shire Council and Warringah Council, supported the ILGRP’s proposed reforms, but were unable to submit a Merger Proposal as they could not reach agreement with neighbouring councils to merge.
10 A discount rate of 9.5% nominal (7% real) was used in the IPART estimates, with an assumption
that the merger takes effect from 2016-17. We note the merger business cases commissioned by councils, which formed the basis of the IPART estimates, have been undertaken by a range of different consultants, using different assumptions, methodologies and timeframes. As a result, our estimates have recalculated the NPVs for these business cases using a consistent 20-year timeframe and discount rate.

Summary
10 IPART Assessment of Council Fit for the Future Proposals
A number of councils commissioned business cases of alternative merger options and structural changes to those identified by the ILGRP. Some of these alternative merger options showed there could be substantial benefits from these options. However, despite these potential gains, most Metropolitan Sydney councils did not submit a Merger Proposal.
Hunter’s Hill Council, Lane Cove Municipal Council and City of Ryde Council submitted a proposal for a Joint Regional Authority (JRA) as an alternative to a merger. Under the proposed JRA, the councils would share services and centralise planning and development. Our analysis suggests the preferred merger, which would also include Mosman Municipal Council, North Sydney Council and Willoughby City Council, would improve the capacity of the relevant councils to partner effectively with government and undertake strategic planning and development for the Lower North Shore region. The JRA is also likely to provide a lower level of efficiency savings compared to the large gains available from the preferred merger of $280 million over 20 years on a NPV basis.11 As we assessed standing alone in the proposed JRA would not be as good as, or better than, the preferred merger, we assessed Hunter’s Hill Council, Lane Cove Municipal Council and City of Ryde Council as not meeting the scale and capacity criterion, and not fit.
Councils assessed as not fit due to not meeting the financial criteria
We assessed three Council Improvement Proposals in Metropolitan Sydney as not fit because they did not demonstrate they met the financial criteria overall. These councils are all in Outer Metropolitan Sydney and include:
Blacktown City Council
Campbelltown City Council, and
Hawkesbury City Council.
As these councils were assessed as satisfying the scale and capacity criterion, strategies to improve their financial performance should enable them to become fit. This could include measures to promote financial sustainability, by reducing costs and increasing revenues. However, the strategies that could be adopted will depend on each council’s circumstances and the Government’s priorities.
In general, most Metropolitan Sydney councils demonstrated their current and forecast financial performance was relatively strong.
11 This analysis was based on a business case jointly commissioned by Lane Cove Municipal
Council, Hunter’s Hill Council, City of Ryde Council, Mosman Municipal Council and Willoughby City Council. North Sydney Council was also part of the preferred ILGRP merger, but was not involved in the commissioning of this business case.

Summary
Assessment of Council Fit for the Future Proposals IPART 11
Non-metropolitan councils
Outside of Metropolitan Sydney, we received:
2 Merger Proposals
79 Council Improvement Proposals, and
20 Rural Council Proposals.
As set out in Figure 4 below, of these 101 proposals:
43 proposals were assessed as fit (including nine Rural Council Proposals which were assessed as fit as Rural Councils), and
58 proposals were assessed as not fit for the future.
Figure 4 Non-metropolitan assessments
Summary
12 IPART Assessment of Council Fit for the Future Proposals
Non-metropolitan councils: Merger Proposals
We received Merger Proposals from:
Young Shire Council (Young) and Boorowa Council (Boorowa). This Merger Proposal also included Harden Shire Council without its agreement.
Cootamundra Shire Council (Cootamundra) and Harden Shire Council (Harden).
We assessed both these Merger Proposals as fit because:
the mergers would deliver substantial benefits to their local communities when compared to the councils standing alone
the proposed merger populations are projected to be consistent with the ILGRP’s rule of thumb of close to or above 10,000 for non-metropolitan council populations by 2031, and
in the case of Young and Boorowa, it was the best available option for these councils given neighbouring councils did not wish to join the Merger Proposal.
Our assessment of fit for the Young and Boorowa Merger Proposal is dependent on Young and Boorowa resolving to merge in the absence of Harden. In the event agreement cannot be reached, we find the councils are deemed not fit, as they have not demonstrated scale and capacity as stand-alone councils.
Over a 20-year timeframe, our analysis, based on information provided by the merging councils, suggests:
a merger of Young and Boorowa could provide benefits of $31 million on a NPV basis,12 while
a merger of Cootamundra and Harden could provide benefits of $11 million on a NPV basis.13
Young has indicated it supports a four-way merger between Young, Boorowa, Harden and Cootamundra. However, Cootamundra has rejected this option on the basis that it changes the focus of Cootamundra and the southern half of Harden away from the Riverina region. Based on the information provided by the councils we consider a four-way merger is likely to deliver larger gains to the community than the current two Merger Proposals.
12 This NPV is based on an estimate by IPART using the business case provided by Young and
Boorowa in their Merger Proposal. 13 This NPV is based on an estimate by IPART using the business case provided by Cootamundra
and Harden in their Merger Proposal.

Summary
Assessment of Council Fit for the Future Proposals IPART 13
Figure 5 Merger proposals from Young/ Boorowa and Cootamundra/Harden
Non-metropolitan councils: Council Improvement Proposals
In relation to the 79 Council Improvement Proposals we received in non-metropolitan areas, we assessed 32 as fit and 47 as not fit.
Councils assessed as fit
We assessed 32 Council Improvement Proposals as fit in non-metropolitan areas. The councils that were assessed as fit are spread across all regions in NSW. These councils were generally assessed as fit because:
remaining a stand-alone council was consistent with the ILGRP’s options for reform or
our analysis has not identified evidence for a better alternative to the council’s proposal to stand alone, and
they met the financial criteria overall.
Councils in non-metropolitan areas were generally more likely to meet the scale and capacity criterion than councils in Metropolitan Sydney. This is because the ILGRP identified fewer preferred merger options in non-metropolitan areas. Councils that did not have a preferred merger option were still required to explore the merger option. However, these councils were not required to demonstrate that standing alone was as good as, or better than, the merger option. As a result, less evidence was required from councils in non-metropolitan areas in relation to these merger options.

Summary
14 IPART Assessment of Council Fit for the Future Proposals
We also observe the efficiency gains from enhanced service delivery, integrated planning and development, and partnering with other levels of government in non-metropolitan areas will typically not be as large relative to those in Metropolitan Sydney.
Councils assessed as not fit due to insufficient scale and capacity
We assessed 28 Council Improvement Proposals in non-metropolitan areas as not fit because they did not have sufficient scale and capacity. This was generally because:
the alternative merger option showed substantial gains that were greater than the council remaining a stand-alone council, or
the council’s population was forecast to decline to below 10,000 by 2031, which would be likely to undermine its scale to efficiently deliver services to the local community, and its long term strategic capacity to partner with other levels of government.
It is likely structural changes would be needed to enable these councils to be assessed as meeting the scale and capacity criterion.
Councils assessed as not fit due to not meeting the financial criteria
We assessed 13 Council Improvement Proposals as not fit in non-metropolitan areas as they did not meet the financial criteria overall. For these councils, improvements to their financial performance could enable them to become fit. For example, this could include measures to reduce costs through structural changes or by sharing services with neighbouring councils. However, as noted above, the appropriate strategies for each council will depend on their circumstances and the Government’s policies.
Councils assessed as not fit due to not meeting the financial criteria and insufficient scale and capacity
We assessed six Council Improvement Proposals in non-metropolitan areas as not fit because they did not meet both the scale and capacity criterion and the financial criteria overall. For these councils, both structural changes and improvements to financial performance may be required to enable these councils to become fit.
Non-metropolitan councils: Rural Council Proposals
In relation to the 20 Rural Council Proposals we received, we assessed nine proposals as being fit as Rural Councils and 11 proposals as not fit. Figure 6 sets out a map outlining the councils which submitted Rural Council Proposals and the assessments for these councils.

Summary
Assessment of Council Fit for the Future Proposals IPART 15
Figure 6 Rural Council Proposals assessments
To be assessed as meeting the scale and capacity criterion, and fit as a Rural Council, councils were required to demonstrate:
they met the majority of the Rural Council Characteristics, including they had limited options for mergers, and
how they planned to achieve real change and improve their capacity and sustainability.
Councils were also required to demonstrate they met the financial criteria overall to be assessed as fit. However, rural councils were provided with greater flexibility in meeting some of the measures for these criteria, as were all OLG Group 8 to 11 councils.
The assessment of Rural Councils as meeting the scale and capacity criterion is contingent on the Government adopting a Rural Council Model. This model is based on reducing the regulatory and compliance burden on Rural Councils, by the JO performing most of the higher level functions of the Rural Council. If a Rural Council model is not adopted, it is likely that most Rural Councils would be assessed as not meeting the scale and capacity criterion, and as a result, not fit.

Summary
16 IPART Assessment of Council Fit for the Future Proposals
Under such circumstances, structural changes would be required to enable these councils to become fit.
We assessed 11 Rural Council Proposals as not fit. Of these 11 Rural Council Proposals:
Six proposals did not meet the scale and capacity criterion. This was because in most cases there was an alternative merger option that showed substantial gains that were greater than the council standing alone as a Rural Council.
Two proposals did not meet the financial criteria overall.
Three proposals did not meet either the scale and capacity criterion or the financial criteria overall.
For the councils that did not meet the financial criteria overall, it is likely substantial changes would be required to enable these councils to become fit. This is because these councils did not meet the financial criteria overall, in spite of the greater flexibility provided to rural councils under the assessment approach.
What process have we followed?
Consistent with the NSW Government’s Terms of Reference and our Methodology Paper14, we assessed the council proposals against the following criteria:
1. scale and capacity to engage effectively across community, industry and governments, and
2. sustainability
3. effectively managing infrastructure and delivering services for communities
4. efficiency.
The NSW Government has established the ‘scale and capacity’ criterion as the threshold criterion for councils, which requires councils to meet this criterion to be assessed as fit. Further, councils must also meet the remaining three financial criteria on an overall basis to be assessed as fit.
14 Our final methodology paper for this review was published on 5 June 2015. See: IPART,
Methodology for Assessment of Council Fit for the Future Proposals - Methodology Paper, June 2015.
Summary
Assessment of Council Fit for the Future Proposals IPART 17
What does the rest of this report cover? The report is structured as follows:
Chapter 1 discusses our approach to the assessments and the proposals we received
Chapter 2 outlines the assessments for each council on a regional basis
Chapter 3 sets out monitoring and reporting issues on FFTF projections
Appendix A sets out the NSW Government’s Terms of Reference
Appendix B outlines the FFTF financial criteria and issues we have considered in assessing proposals against the financial criteria
Appendix C provides further detail on the assessment for each council against the FFTF criteria
Appendix D provides further detail on the merger business cases
Appendix E includes Ernst & Young’s consultant report on the benefits of the Metropolitan Sydney mergers.

Summary
18 IPART Assessment of Council Fit for the Future Proposals
Assessment of councils: Metropolitan Sydney councils
Table 1 Metropolitan Sydney Merger Proposals
Councils ILGRP preferred option Assessment
Randwick City and Waverley
Merge to form a Global Sydney council Fit
Auburn City Burwood City of Canada Bay
Auburn to merge with Holroyd, Parramatta, Ryde (part) and The Hills (part); Burwood and Canada Bay to merge with Ashfield, Leichhardt, Marrickville and Strathfield
Fit
Note: Bold indicates an ILGRP preferred option.
Table 2 Inner Metropolitan Sydney Councils
Region ILGRP preferred option Councils Assessment
Global City Amalgamate with Randwick City and Waverley Council
City of Botany Bay Not fit
City of Sydney Not fit as a Global City Council
Woollahra Municipal Not fit
Inner West Amalgamate with City of Canada Bay and Burwood
Ashfield Not fit
Leichhardt Municipal Not fit
Marrickville Not fit
Strathfield Not fit
West Central Amalgamate with Auburn, City of Ryde (part) and The Hills (part)
Holroyd City Not fit
Parramatta City Not fit
Lower North Shore Amalgamate Hunter’s Hill Not fit
Lane Cove Not fit
Mosman Municipal Not fit
North Sydney Not fit
City of Ryde Not fit
Willoughby City Not fit
Northern Suburbs Amalgamate Hornsby Shire Not fit
Ku-ring-gai Not fit
Northern Beaches Amalgamate Manly Not fit
Pittwater Not fit
Warringah Not fit
South West Amalgamate Fairfield City Not fit
Liverpool City Not fit
Southern Amalgamate City of Canterbury Not fit
Hurstville City Not fit
Kogarah City Not fit
Rockdale City Not fit
Bankstown No change Bankstown City Fit
Note: Bold indicates an ILGRP preferred option.

Summary
Assessment of Council Fit for the Future Proposals IPART 19
Table 3 Outer Metropolitan Sydney Councils
Council ILGRP preferred option Assessment
Blacktown City No change Not fit
Blue Mountains City No change Fit
Camden No change Fit
Campbelltown City No change Not fit
Hawkesbury No change Not fit
Penrith City No change Fit
Sutherland Shire No change Fit
The Hills Shire No change Fit
Wollondilly Shire No change Fit
Note: Bold indicates an ILGRP preferred option.
Assessment of councils: Non- metropolitan councils
Table 4 Non- metropolitan Merger Proposals
Councils ILGRP preferred option Assessment
Young Shire and Boorowa Merge with Boorowa, Harden and Young
Fit
Cootamundra Shire and Harden Shire*
Merge with Boorowa and Young Fit
Notes: Bold indicates an ILGRP preferred option. *The ILGRP did not have a preferred option for Cootamundra.

Summary
20 IPART Assessment of Council Fit for the Future Proposals
Table 5 Hunter, Central Coast and Illawarra Councils
Region Council ILGRP options Assessment
Hunter Cessnock City Council in JO Fit
Dungog Shire Merge with Maitland or Council in JOa Not fit
Lake Macquarie City Amalgamate with Newcastle or Council in JOa
Not fit
Maitland City Merge with Dungog or Council in JOa Not fit
Muswellbrook Shire Council in JO Fit
Newcastle City Amalgamate with Lake Macquarie or Council in JO a
Not fit
Port Stephens Council in JO Fit
Singleton Council in JO Fit
Upper Hunter Shire Council in JO Fit
Central Coast Gosford City Amalgamate with Wyong or a multi-purpose JO (no separate water corporation until other options properly evaluated)
Not fit
Wyong City Amalgamate with Gosford or a multi-purpose JO (no separate water corporation until other options properly evaluated)
Not fit
Illawarra Kiama Municipal Council in a JO (if future amalgamation – with Shoalhaven, noting its inclusion in South East-Tablelands region)
Not fit
Shellharbour City Council in a JO (amalgamate if future options need to be revisited)
Not fit
Wollongong City Council in a JO (amalgamate if future options need to be revisited)
Fit
a Possible boundary change included.
Notes: Bold indicates an ILGRP preferred option. JO stands for Joint Organisation.
The ILGRP did not include a table of options for the Hunter, Central Coast and Illawarra regions. Instead, the ILGRP included a discussion of these councils in its report.

Summary
Assessment of Council Fit for the Future Proposals IPART 21
Table 6 Non- metropolitan councils15
Region Council ILGRP options Assessment
Northern Rivers Ballina Shire Council in Northern Rivers JO Fit
Byron Shire Council in Northern Rivers JO Fit
Lismore City Council in Northern Rivers JO or merge with Kyogle
Fit
Richmond Valley Council in Northern Rivers JO or merge with Kyogle
Fit
Tweed Shire Council in Northern Rivers JO Not fit
North Coast Bellingen Shire Council in North Coast JO Not fit
Clarence Valley Council in North Coast JO Not fit
Coffs Harbour City Council in North Coast JO Fit
Nambucca Shire Council in North Coast JO Fit
Mid-North Coast
Gloucester Shire Council in Mid-North Coast JO or merge with Great Lakes and/or Greater Taree
Not fit
Great Lakes Shire Council in Mid-North Coast JO or merge with Gloucester
Fit
Greater Taree City Council in Mid-North Coast JO or merge with Gloucester
Not fit
Kempsey Shire Council in Mid-North Coast JO Not fit
Port Macquarie-Hastings
Council in Mid-North Coast JO Fit
New England Armidale Dumaresq Council in New England JO or merge with Guyra
Not fit
Glen Innes Severn Council in New England JO Fit
Inverell Shire Council in Namoi JO Fit
Tenterfield Shire Council in New England JO Not fit
Uralla Shire Council in New England JO or merge with Walcha
Not fit
Namoi Gunnedah Shire Council in Namoi JO Fit
Gwydir Shire Council in Namoi JO or merge with Moree Plains
Not fit
Liverpool Plains Shire Council in Namoi JO or merge with Gunnedah
Not fit
Moree Plains Shire Council in Namoi JO or merge with Gwydir
Fit
Narrabri Shire Council in Namoi JO Fit
Tamworth Regional Council in Namoi JO Fit
Orana Dubbo City Council in Orana JO or merge with Wellington and/or Narromine
Fit
Narromine Shire Council in Orana CC or merge with Dubbo
Not fit
Warrumbungle Shire Council in Orana JO Not fit
Wellington Council in Orana JO or merge with Dubbo Not fit
15 This excludes Rural Council Proposals and councils in the Hunter, Central Coast and Illawarra.

Summary
22 IPART Assessment of Council Fit for the Future Proposals
Region Council ILGRP options Assessment
Central West Bathurst Regional Council in Central West JO or merge with Oberon
Fit
Blayney Shire Council in Central West JO or merge with Orange
Not fit
Cabonne Council in Central West JO or merge with Orange
Not fit
Cowra Council in Central West JO or merge with Weddin
Fit
Forbes Shire Council in Central West JO; merge with Weddin
Not fit
Lachlan Shire Council in Central West JO or merge with Parkes
Not fit
Lithgow City Council in Central West JO Not fit
Mid-Western Regional Council in Central West JO Not fit
Oberon Council in Central West JO or merge with Bathurst
Not fit
Orange City Council in Central West JO or merge with Cabonne and/or Blayney
Not fit
Parkes Shire Council in Central West JO or merge with Lachlan
Fit
Tablelands Goulburn Mulwaree Council in Tablelands JO Not fit
Upper Lachlan Shire Council in Tablelands JO or merge with Goulburn-Mulwaree
Not fit
Wingecarribee Shire Council in Tablelands JO Fit
Yass Valley Council in Tablelands JO Not fit
Riverina Bland Shire Council in Riverina JO or merge with Coolamon and/or Temora
Not fit
Junee Shire Council in Riverina JO or merge with Cootamundra
Not fit
Temora Shire Council in Riverina JO or merge with Coolamon and/or Bland
Not fit
Tumut Shire Council in Riverina JO or merge with Gundagai and Tumbarumba
Not fit
Wagga Wagga City Council in Riverina JO or merge with Lockhart
Fit
Murrumbidgee Griffith City Council in Murrumbidgee JO or merge with Murrumbidgee
Not fit
Leeton Shire Council in Murrumbidgee JO or merge with Narrandera
Fit
Narrandera Shire Council in Murrumbidgee JO or merge with Leeton
Not fit
Mid-Murray Berrigan Shire Council in Mid-Murray JO or merge with Jerilderie
Not fit
Deniliquin Shire Council in Mid-Murray JO or merge with Conargo/Murray and Wakool
Not fit
Murray Shire Council in Mid-Murray JO or merge with D’quin/Conargo and Wakool
Not fit

Summary
Assessment of Council Fit for the Future Proposals IPART 23
Region Council ILGRP options Assessment
Upper Murray Albury City Council in Upper Murray JO or merge with Greater Hume (part or all)
Fit
Corowa Shire Council in Upper Murray JO or merge with Urana
Not fit
Greater Hume Shire Council in Upper Murray JO or merge part or all with Albury
Fit
South East Bega Valley Shire Council in South East JO Fit
Cooma-Monaro Shire Council in South East JO or merge with Bombala and Snowy River
Not fit
Eurobodalla Shire Council in South East JO Fit
Palerang Council in South East JO or merge with Queanbeyan
Not fit
Queanbeyan City Council in South East JO or merge with Palerang
Not fit
Shoalhaven City Council in South East JO Fit
Snowy River Shire Council in South East JO or merge with Bombala/Cooma-M
Not fit
Note: Bold indicates an ILGRP preferred option. JO stands for Joint Organisation.

Summary
24 IPART Assessment of Council Fit for the Future Proposals
Table 7 Rural Council Proposals
Region Council ILGRP options Assessment
Northern Rivers Kyoglea Council in Northern Rivers JO or merge with Lismore or Richmond Valley
Not fit
New England Guyra Shire Council in New England JO or merge with Armidale
Not fit
Walcha Shire Merge with Uralla or Rural Council in New England JO
Not fit
Orana Bogan Shire Rural Council in Orana JO or merge with Warren
Fit as a Rural Council
Coonamble Shire Rural Council in Orana JO or merge with Gilgandra
Fit as a Rural Council
Gilgandra Shire Rural Council in Orana JO or merge with Coonamble
Fit as a Rural Council
Warren Shire Rural Council in Orana JO or merge with Bogan
Fit as a Rural Council
Central West Weddin Shire Rural Council in Central West JO or merge with Forbes or Cowra
Not fit
Riverina Coolamon Shire Rural Council in Riverina JO or merge with Bland and/or Temora
Fit as a Rural Council
Gundagai Shire Merge with Tumut or Rural Council in Riverina CC
Not fit
Lockhart Shire Rural Council in Riverina JO or merge with Wagga Wagga
Fit as a Rural Council
Tumbarumba Shire
Rural Council in Riverina JO or merge with Tumut/Gundagai
Fit as a Rural Council
Mid-Murray Conargo Shire Merge with Deniliquin and Murray or Rural Council in Mid-Murray JO
Not fit
Jerilderie Shire Merge with Berrigan or Rural Council in Mid-Murray JO
Not fit
Wakool Shire Rural Council in Mid-Murray JO or merge with Murray/Conargo/Deniliquin
Fit as a Rural Council
Murrumbidgee Carrathool Shire Rural Council in Murrumbidgee JO or merge with Griffith
Fit as a Rural Council
Hay Shire Rural Council in Murrumbidgee JO Not fit
Murrumbidgee Shire
Merge with Griffith or Rural Council in Murrumbidgee JO
Not fit
Upper Murray Urana Shire Merge with Corowa or Rural Council in Upper Murray JO
Not fit
South East Bombala Merge with Cooma-M and Snowy R or Rural Council in South East JO
Not fit
a Kyogle submitted a Rural Council Proposal. However, the ILGRP did not identify this as one of the options for the council. We assess Kyogle as not fit as a Rural Council nor fit as a stand-alone council.
Note: Bold indicates an ILGRP preferred option. JO stands for Joint Organisation.

1 Assessment approach and proposals received
Assessment of Council Fit for the Future Proposals IPART 25
1 Assessment approach and proposals received
This chapter sets out:
the context for this review
the approach we have undertaken in assessing councils’ proposals
details of the proposals we received, and
public consultation on the proposals received.
1.1 Context for the review
The NSW Government has asked IPART to undertake the role of the Expert Advisory Panel in assessing local government FFTF proposals.16 The FFTF reforms aim to improve the strength and effectiveness of local government in providing services and infrastructure that communities need.17
The starting point for our analysis is the review of the sector undertaken by the ILGRP in 2012 and 2013. The ILGRP outlined a range of options for governance models, structural arrangements, and boundary changes to increase the strategic capacity of councils and reform the local government sector.
For communities, high capacity local councils can more effectively:
deliver quality services and infrastructure
prepare soundly-based plans for the future
help support local jobs and economic growth
represent the diverse needs of different groups
influence state and federal government decisions to achieve local and regional objectives, for example in transport and housing, and
keep rates and charges at affordable levels and maximise the benefits from spending those revenues.18
16 The Terms of Reference for the review are included in Appendix A. 17 OLG, Fit for the Future – A roadmap for Stronger, Smarter Councils, September 2014, p 5. 18 ILGRP, Revitalising Local Government: Final Report of the NSW Independent Local Government
Review Panel (ILGRP Final Report), October 2013, p 30.

1 Assessment approach and proposals received
26 IPART Assessment of Council Fit for the Future Proposals
The NSW Government has announced that councils which are assessed as fit for the future will have access to a range of benefits including a streamlined rate variation process and a State Government borrowing facility, priority for other government funding and grants, and eligibility for additional devolved planning powers.19 There is also funding being provided by the NSW Government to assist with the transitional costs of merging, establishing regional JOs, and assisting regional and rural councils.20
1.2 The assessment approach
Our role as the Expert Advisory Panel is to ensure a consistent, impartial and balanced assessment of councils’ FFTF proposals. We assessed council proposals in line with:
the NSW Government’s Terms of Reference, which require us to provide a report to the NSW Government by 16 October 2015
our Methodology Paper, which set out how we would assess council proposals, and
previous papers relating to the reform of the NSW local government sector, including the ILGRP’s Final Report.
Each council was required to submit one of the following types of proposals for assessment after considering the ILGRP’s proposed reform options:
Merger Proposal - for councils proposing to merge with one or more other councils to achieve sufficient scale and capacity.
Council Improvement Proposal - for councils that currently have sufficient scale and capacity without any structural change, or are proposing improvements to achieve scale and capacity without merging with another council.
Rural Council Proposal - for councils with ‘Rural Council Characteristics’, which need to demonstrate plans to achieve real change and improve their capacity and sustainability.21
Council proposals were required to be submitted to IPART by 30 June 2015.22
19 OLG, Fit for the Future – A roadmap for Stronger, Smarter Councils, September 2014, pp 14-15. 20 Ibid, p 14. 21 OLG developed templates for councils to use for each proposal type, in addition to other
resources and guidance to assist councils in assessing their options and preparing their proposals.
22 The eight councils in Far Western NSW (Balranald Shire Council, Bourke Shire Council, Brewarrina Shire Council, Broken Hill City Council, Central Darling Shire Council, Cobar Shire Council, Walgett Shire Council, and Wentworth Shire Council) were not required to submit a proposal and no proposals were received from these councils. County councils were also not required to submit a proposal as they are not part of the Fit for the Future process.

1 Assessment approach and proposals received
Assessment of Council Fit for the Future Proposals IPART 27
We assessed each proposal in relation to whether they have the scale and capacity criterion to engage effectively across community, industry and governments. We also assessed proposals against three financial criteria:
sustainability
effectively managing infrastructure and delivering services for communities, and
efficiency.
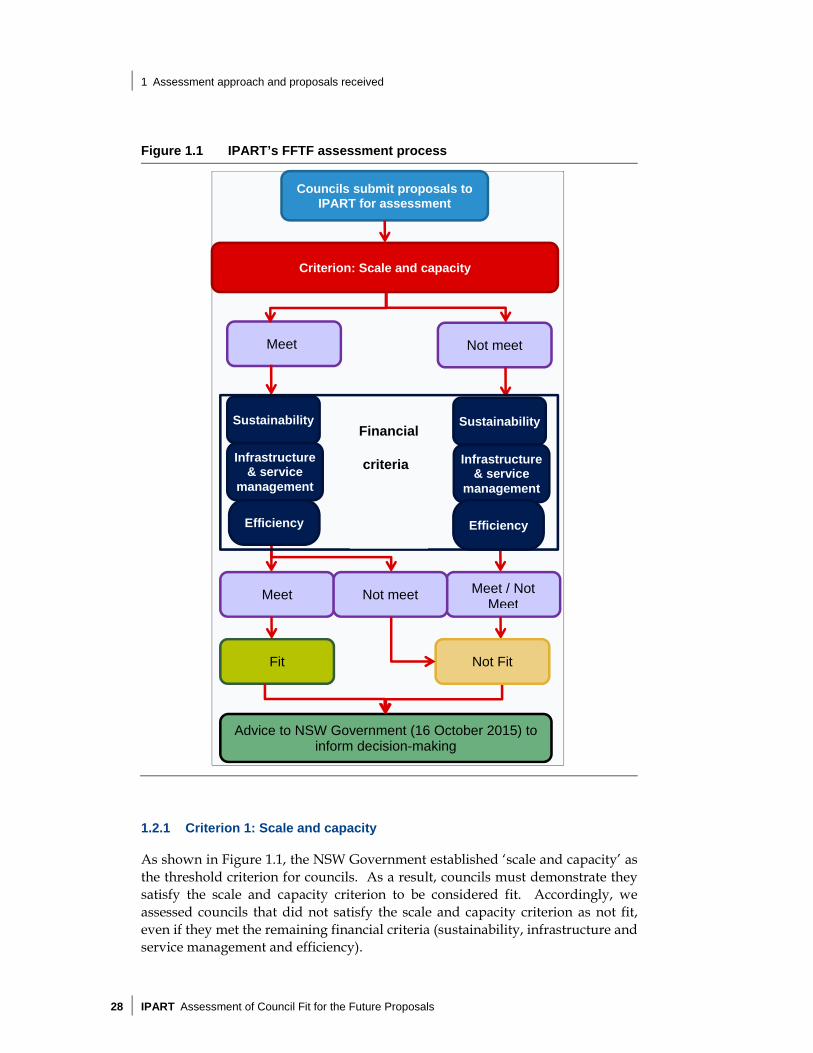
Figure 1.1 outlines how we assessed proposals against these criteria in making our assessment of whether each council is fit or not fit for the future.
The assessment of each council is set out in Chapter 2, with further detail in Appendix C.
1 Assessment approach and proposals received
28 IPART Assessment of Council Fit for the Future Proposals
Figure 1.1 IPART’s FFTF assessment process
1.2.1 Criterion 1: Scale and capacity
As shown in Figure 1.1, the NSW Government established ‘scale and capacity’ as the threshold criterion for councils. As a result, councils must demonstrate they satisfy the scale and capacity criterion to be considered fit. Accordingly, we assessed councils that did not satisfy the scale and capacity criterion as not fit, even if they met the remaining financial criteria (sustainability, infrastructure and service management and efficiency).
Advice to NSW Government (16 October 2015) to inform decision-making
Councils submit proposals to IPART for assessment
Criterion: Scale and capacity
Sustainability
Infrastructure & service
management
Fit
Meet Not meet
Meet
Sustainability
Infrastructure & service
management
Efficiency
Meet / Not Meet
Not Fit
Not meet
Efficiency
Financial
criteria
1 Assessment approach and proposals received
Assessment of Council Fit for the Future Proposals IPART 29
Our analysis of proposals against the scale and capacity criterion considered whether:
the council’s proposed option is at least as good as the ILGRP’s preferred option
the council explored merger options where they were identified
the proposal demonstrates the council can achieve the key elements of strategic capacity in Box 1.1, and
the proposal demonstrates the council has sufficient scale.
In considering the Merger Proposals we received, we also took into account whether the proposed mergers would strengthen the ability for councils to provide the services and infrastructure that communities need, relative to remaining a stand-alone council. This is consistent with the NSW Government’s reform agenda.23
For non-metropolitan councils, we have taken into account the scale objectives identified by the ILGRP. The ILGRP identified a ‘rule of thumb’, which indicated the great majority of councils should have populations close to or greater than 10,000 by 2036.24 The ILGRP also noted that a population of less than around 5,000 is unlikely to support a stand-alone council as governance costs will consume too great a proportion of total revenue.25
For a number of non-metropolitan councils, the ILGRP identified an option for the council to remain a stand-alone council in a JO. The NSW Government is currently working with local councils on the pilot of five JOs.26 These pilots will assist the NSW Government in developing the final JO Model which will be implemented from September 2016, with 15 JOs to be established across NSW.27
23 OLG, Fit for the Future – A roadmap for Stronger, Smarter Councils, September 2014, p 5. 24 ILGRP Final Report, p 111. In general, we used the NSW Department of Planning and
Environment’s current and forecast populations for each council in assessing a council’s scale, but have also considered other forecasts provided by councils.
25 Ibid. 26 JOs are currently being piloted in the Central NSW, Hunter, Illawarra, Namoi and Riverina. For
further details on these JOs see: http://www.fitforthefuture.nsw.gov.au/joint-organisations 27 OLG, Joint Organisations: Emerging Directions Paper, September 2015; OLG, Joint Organisations: A
roadmap for intergovernmental collaboration in NSW, September 2014.

1 Assessment approach and proposals received
30 IPART Assessment of Council Fit for the Future Proposals
Box 1.1 Key elements of Strategic Capacity
More robust revenue base and increased discretionary spending.
Scope to undertake new functions and major projects.
Ability to employ wider range of skilled staff.
Knowledge, creativity and innovation.
Advanced skills in strategic planning and policy development.
Effective regional collaboration.
Credibility for more effective advocacy.
Capable partner for state and federal agencies.
Resources to cope with complex and unexpected change.
High quality political and managerial leadership.
Source: ILGRP Final Report, p 32.
Rural Council Proposals
In assessing Rural Council Proposals against the scale and capacity criterion, we considered if:
the majority of Rural Council Characteristics, set out below in Box 1.2, were met28, and
the plans the council proposed to improve its capacity and sustainability were reasonable and likely to be achievable in the timeframes proposed.
The ‘Rural Council Model’ developed by the ILGRP was considered to be an alternative to mergers in some rural and remote areas. This model is based on reducing the regulatory and compliance burden on Rural Councils, by the JO or a partner council performing most of the higher level functions of Rural Councils.29
The assessment of Rural Councils against the scale and capacity criterion is contingent on the Government adopting a Rural Council model. If a Rural Council model is not adopted, it is likely that most Rural Councils would be assessed as not meeting the scale and capacity criterion, and as a result, not fit.
28 As noted in the Methodology Paper, we have placed particular emphasis on whether the
council has demonstrated it has: a small and static or declining population spread over a large area (Characteristic 1) and, there are limited options for mergers (Characteristic 9).
29 For example, the ILGRP noted Rural Councils could either fully share administration with an adjoining council or have extensive resource-sharing as part of a JO. See: ILGRP Final Report, pp 92-93.

1 Assessment approach and proposals received
Assessment of Council Fit for the Future Proposals IPART 31
Box 1.2 Rural Council Characteristics 1. Small and static or declining population spread over a large area.
2. Local economies that are based on agricultural or resource industries.
3. High operating costs associated with a dispersed population and limitedopportunities for return on investment.
4. High importance of retaining local identity, social capital and capacity forservice delivery.
5. Low rate base and high grant reliance.
6. Difficulty in attracting and retaining skilled and experienced staff.
7. Challenges in financial sustainability and provision of adequate services andinfrastructure.
8. Long distance to a major (or sub-regional centre).
9. Limited options for mergers.
Source: FFTF Guidance material for Completing Template 3: Rural Council Proposal pp 11-12.
1.2.2 Criteria 2 to 4: sustainability, infrastructure and service management and efficiency
The other three criteria we used to assess council proposals are financial criteria. Each of these criteria includes one or more measures. These criteria include:
Sustainability. This criterion reflects whether the council will generate sufficient funds over the long term to provide the agreed level and scope of services and infrastructure for communities. The measures for this criterion include:
– Operating Performance Ratio.
– Own Source Revenue Ratio.
– Building and Infrastructure Asset Renewal Ratio.
Effective infrastructure and service management. This reflects the council’s ability to maximise return on resources and minimise unnecessary burden on the community and business, while working to leverage economies of scale and meet the needs of communities. The measures for this criterion include:
– Infrastructure Backlog Ratio.
– Asset Maintenance Ratio.
– Debt Service Ratio.
Efficiency. This reflects the council’s ability to provide services and deliver infrastructure in a manner that achieves value for money for current and future ratepayers. The measure for this criterion includes:
– Real Operating Expenditure.

1 Assessment approach and proposals received
32 IPART Assessment of Council Fit for the Future Proposals
The assessment for each council against the financial criteria was based on the council’s forecast performance against defined benchmarks for each measure. In general, councils were required to demonstrate that they met the benchmarks or demonstrated improvement towards meeting the benchmarks within five years, ie, by 2019-20.30
We have assessed councils on whether they have met these financial criteria on an overall basis, taking into account:
which financial benchmarks are met
the degree to which any financial benchmarks are not met
the degree of improvement in meeting some of the benchmarks31, and
long term sustainability factors.32
We consider a council’s operating performance ratio provides a key measure of financial sustainability and is a benchmark FFTF councils should meet. As a result, we have emphasised the importance of a council meeting the operating performance ratio in assessing whether councils have met the financial criteria overall.
Appendix B provides further details on these criteria and the considerations we have taken into account in assessing council proposals against these criteria.
Data issues
We were largely dependent on the information provided by the councils in assessing each council against the financial criteria overall. Where possible, we have tried to test and verify the assumptions made by the councils in their proposals through examination of long term financial reports, other available data, and discussions with councils.
30 As set out in our Methodology Paper, rural councils (councils in OLG Groups 8 to 11 and those
choosing to submit a Rural Council Proposal) were given longer timeframes, i.e., a further five years to 2024-25 to demonstrate they met the benchmark for the operating performance ratio. Councils in OLG Groups 8 to 11 were also provided with greater flexibility in meeting the own source revenue and real operating expenditure measures. As noted in our Methodology Paper, we have considered the inclusion of Federal Assistance Grants in assessing own source revenue for these councils. We have also taken into account the impact of falling populations on the real operating expenditure measure. Further, we have taken into account that operational savings may not be practical in the short term for rural councils and councils submitting a Merger Proposal. See: Methodology Paper, pp 42-43, 47.
31 As set out in Appendix B, some of the measures in the financial criteria require councils to meet the benchmark or improve their performance against the benchmark, while for other measures the council must meet the benchmark.
32 We note that OLG and the NSW Treasury Corporation (TCorp) have advised councils in FFTF workshops that they should be aiming for improvement in their overall sustainability rather than meeting all the benchmarks. This was identified in TCorp’s submission (see TCorp submission to IPART Consultation Paper, May 2015, pp 1-2). We consider our approach to assessing how councils satisfy the other criteria overall is consistent with TCorp’s advice.

1 Assessment approach and proposals received
Assessment of Council Fit for the Future Proposals IPART 33
When attributing a level of confidence to a council’s figures, we have assessed the council’s overall approach, the reasonableness of assumptions, and sourced independent material. Where necessary, we have re-calculated ratios based on differing assumptions from those used by councils, where the assumptions used might not be considered reasonable.
1.2.3 Other considerations
During our assessment of proposals, we have also considered other factors in addition to the four criteria discussed above. These included: the social and community context of the council how the council consulted with its community regarding its proposal or
alternative options as relevant, and the outcomes from these consultations the impact of the council’s water utility and sewer business on its General
Fund performance and overall scale and capacity, where the council also has a water utility and sewer function, and
the submissions received on each council’s proposal.33
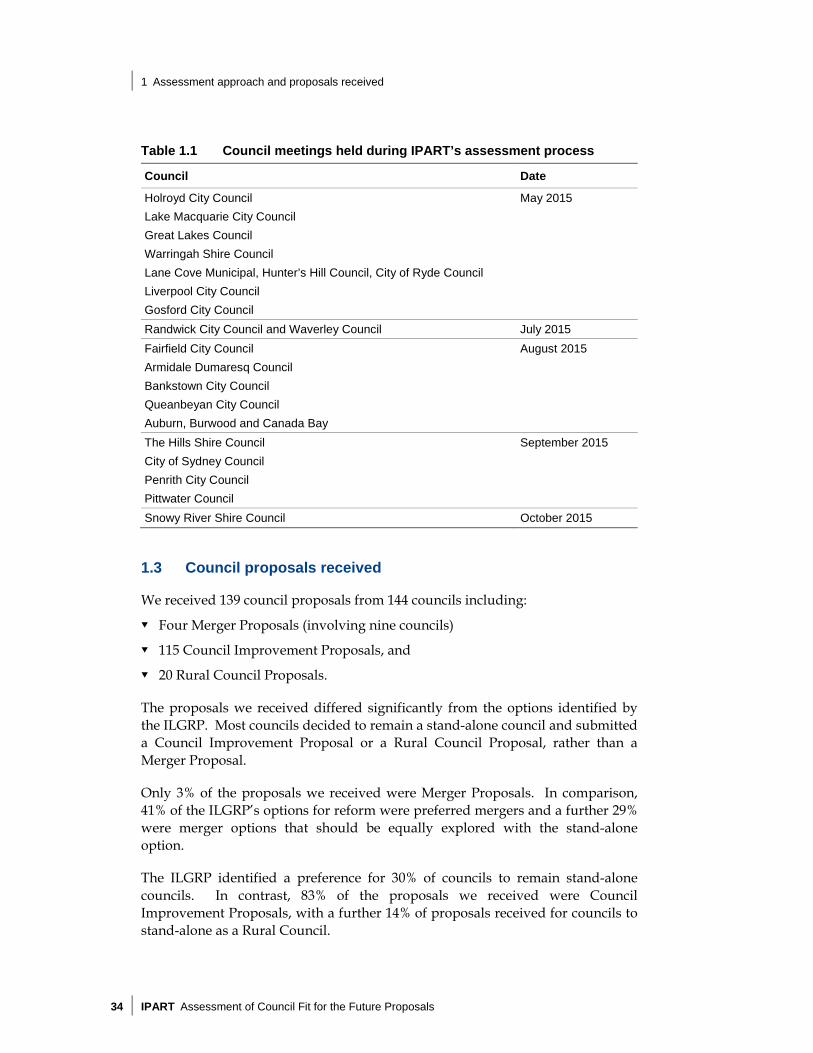
We have also requested additional information from most councils and held in person meetings with a number of councils either at their request, or to clarify and illuminate key issues. We met with all councils that requested meetings. A list of all the councils we met with during the assessment process is set out in Table 1.1.
33 Copies of submissions received on each council’s proposal are available on the IPART website
at www.ipart.nsw.gov.au
1 Assessment approach and proposals received
34 IPART Assessment of Council Fit for the Future Proposals
Table 1.1 Council meetings held during IPART’s assessment process
Council Date
Holroyd City Council May 2015 Lake Macquarie City Council
Great Lakes Council
Warringah Shire Council
Lane Cove Municipal, Hunter’s Hill Council, City of Ryde Council
Liverpool City Council
Gosford City Council
Randwick City Council and Waverley Council July 2015
Fairfield City Council August 2015 Armidale Dumaresq Council
Bankstown City Council
Queanbeyan City Council
Auburn, Burwood and Canada Bay
The Hills Shire Council September 2015 City of Sydney Council
Penrith City Council
Pittwater Council
Snowy River Shire Council October 2015
1.3 Council proposals received
We received 139 council proposals from 144 councils including:
Four Merger Proposals (involving nine councils)
115 Council Improvement Proposals, and
20 Rural Council Proposals.
The proposals we received differed significantly from the options identified by the ILGRP. Most councils decided to remain a stand-alone council and submitted a Council Improvement Proposal or a Rural Council Proposal, rather than a Merger Proposal.
Only 3% of the proposals we received were Merger Proposals. In comparison, 41% of the ILGRP’s options for reform were preferred mergers and a further 29% were merger options that should be equally explored with the stand-alone option.
The ILGRP identified a preference for 30% of councils to remain stand-alone councils. In contrast, 83% of the proposals we received were Council Improvement Proposals, with a further 14% of proposals received for councils to stand-alone as a Rural Council.

1 Assessment approach and proposals received
Assessment of Council Fit for the Future Proposals IPART 35
A number of councils commissioned business cases, which explored the preferred merger as well as alternative merger options. As councils used different consultants, the business cases provided used different assumptions, timeframes and methodologies in estimating the NPV of the costs and benefits of particular mergers. We have undertaken additional analysis to estimate the NPV of these business cases on a more consistent basis, which has also involved adjusting underlying assumptions in some cases.
We have also commissioned economic consultants, Ernst & Young, to independently estimate the NPV of a number of merger options for Metropolitan Sydney councils. This analysis by Ernst & Young was used to sensitivity test the business cases provided by the councils. Ernst & Young also reviewed the merger business cases submitted by Metropolitan Sydney councils and IPART’s analysis of these business cases. There are some differences in the approaches used by councils, and therefore IPART, and Ernst & Young. For instance, Ernst & Young has used a top down approach to independently estimate the NPV of merger options, while IPART’s approach was based on standardising the business cases provided by councils. Further detail in relation to our analysis of these business cases is set out in Chapter 2 and Appendix D. A copy of Ernst & Young’s report is at Appendix E.
1.3.1 Improvements proposed by councils in their proposals
Councils included a range of strategies in their proposals to improve their scale and capacity and financial performance. We note if these strategies were not adopted, a number of councils would be unlikely to meet the financial criteria overall based on their current performance. As outlined in Chapter 3, OLG will undertake monitoring of councils’ performance, which will be a key component in managing the reform process.34
Common strategies proposed by councils to improve their performance included:
Increases to their general income through special variations (SVs)35 and/or increasing user fees and charges.
Changes to the approach used to determine asset maintenance requirements, to reduce the cost and volume of asset maintenance and renewals.
Efficiency improvements, such as reviews of services and functions, to reduce costs.
Sharing services with neighbouring councils or through a JO to improve the council’s capacity and reduce costs.
34 OLG undertakes reporting of council performance each year in the ‘Your Council’ report. 35 See sections 508A and 508(2) of the Local Government Act 1993.

1 Assessment approach and proposals received
36 IPART Assessment of Council Fit for the Future Proposals
Some councils that submitted a Rural Council Proposal have identified projects to improve their performance that they consider may be suitable for grants under the NSW Government’s Innovation Fund. This Fund is open to councils in regional NSW with a population of less than 10,000, with priority given to councils which have been assessed as fit.36 This Fund is subject to a separate application process.37 We have not referred any projects to this Fund as part of our process.
In assessing the improvement strategies proposed by councils, we considered whether they were reasonable and likely to be achievable in the timeframes proposed. Where we have assessed these as not reasonable or unrealistic, we have sometimes assessed councils as not meeting the financial criteria overall, and as a consequence, not fit.
1.3.2 Assumptions relating to proposed SVs in proposals
Where a council has assumed a future SV in its proposal, as well as considering the reasonableness of this assumption, we have also taken into account:
other actions taken by the council to reduce costs or increase revenue
the amount and frequency of any previously approved SVs
their current rates relative to the average rates of their peers
whether there were alternative options to improve general income, and
whether the council has included its assumed SV in its long term financial plan and commenced community consultation on the proposed SV.
However, if a council has assumed a future SV and we have assessed the council as fit, this does not mean we will approve this future SV. SV applications are subject to a separate approval process and criteria, which is outside the FFTF process.
Some councils have not assumed SVs in their proposals. In these cases, we have assessed the council proposals as they are, on the basis of the council’s own financial planning and projections.
Whilst some councils may have been assessed as meeting the financial criteria and fit on the basis of assumed SV increases, it does not mean this course of action is necessarily the best option for local communities under the current reform agenda.
36 OLG, Innovation Fund Guidelines, May 2015. 37 The application process for the Innovation Fund will commence in November 2015. See: OLG,
Innovation Fund Guidelines, May 2015.
1 Assessment approach and proposals received
Assessment of Council Fit for the Future Proposals IPART 37
A large number of councils have proposed substantial future increases to general income to meet the financial criteria. There is a risk councils have proposed future SVs to improve their financial performance, and may not have fully considered whether alternative structures for the local government area, such as a merger, may be a better outcome. Structural changes could achieve similar or larger improvements to a council’s general income and reduce the need for, and size of, potential SV increases, which could limit the impact of higher rates on the community.
This was apparent during the assessment process. For example:
The merger of Auburn, Burwood and Canada Bay is forecast to result in an improvement in the operating performance ratio of the merged council from -0.4% in 2014-15 to 3.1% in 2019-20, and 4% over the long term because of merger efficiencies.
Similarly, the merger of Randwick and Waverley is forecast to result in an improvement in the operating performance ratio of the merged council from 1.7% in 2014-15 to 11.4% in 2019-20, mainly driven by merger efficiencies.
In addition, Young and Boorowa have provided analysis to IPART showing a merger between the councils (and including Harden) would result in an improvement in the operating performance ratio from -3.7% in 2014-15 to 6.5% in 2019-2038, and about 5% over the long term due to merger efficiencies.
1.4 Public consultation on council proposals
Public consultation on council’s FFTF proposals was undertaken over July 2015 and 1570 submissions were received by the 31 July 2015 closing date.39 In addition, 52 submissions were received either before the consultation process or following the closing date.40 All of the submissions received were considered as part of the assessment process.41
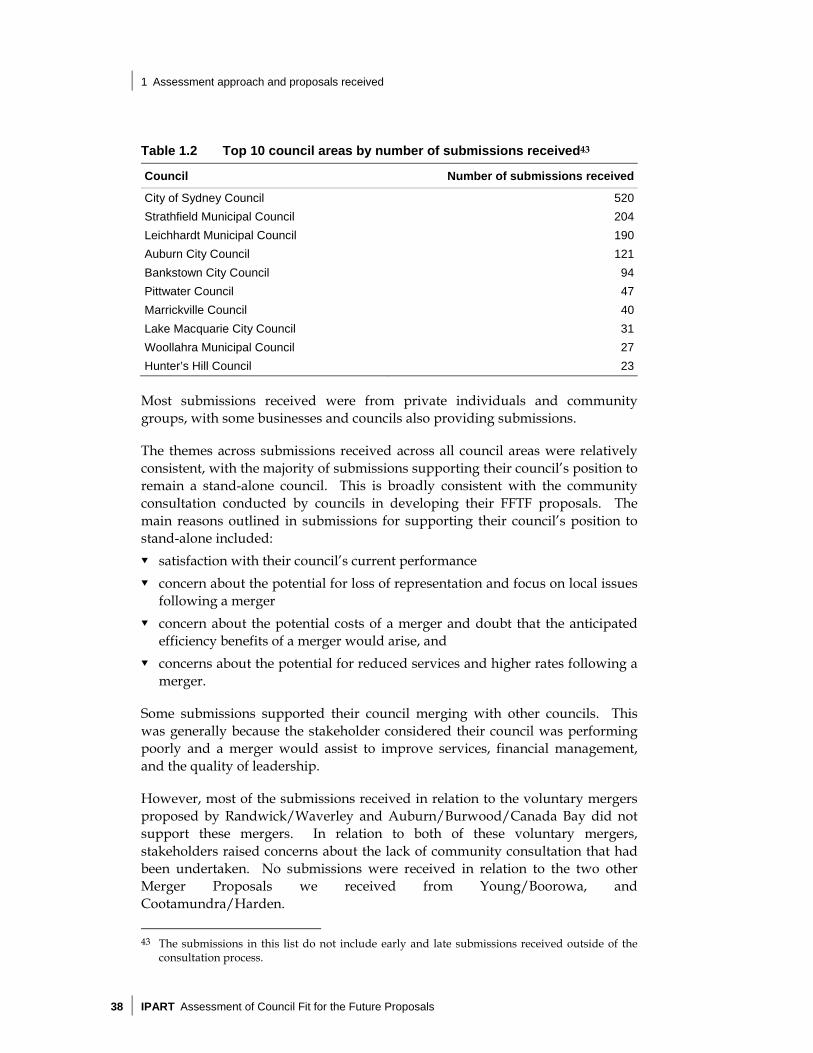
Close to 90% of the submissions received during the consultation process related to councils in the Metropolitan Sydney area, with a third of all submissions received relating to City of Sydney Council’s proposal. Table 1.2 sets out the top 10 council areas which received the most submissions during the consultation process. A number of council proposals received no submissions, with 75 out of the 139 council proposals receiving no submissions on their proposals.42
38 The operating performance ratio figures are annual figures, as the proposal did not include
three year averages. 39 Submissions received during the consultation process are published on the IPART website at
www.ipart.nsw.gov.au. Confidential submissions have not been published. 40 This takes into account late submissions received as at 10 October 2015. 41 However, only those submissions received during the consultation process were published on
the IPART website. 42 This takes into account early and late submissions received outside of the consultation process.
1 Assessment approach and proposals received
38 IPART Assessment of Council Fit for the Future Proposals
Table 1.2 Top 10 council areas by number of submissions received43
Council Number of submissions received
City of Sydney Council 520
Strathfield Municipal Council 204
Leichhardt Municipal Council 190
Auburn City Council 121
Bankstown City Council 94
Pittwater Council 47
Marrickville Council 40
Lake Macquarie City Council 31
Woollahra Municipal Council 27
Hunter’s Hill Council 23
Most submissions received were from private individuals and community groups, with some businesses and councils also providing submissions.
The themes across submissions received across all council areas were relatively consistent, with the majority of submissions supporting their council’s position to remain a stand-alone council. This is broadly consistent with the community consultation conducted by councils in developing their FFTF proposals. The main reasons outlined in submissions for supporting their council’s position to stand-alone included: satisfaction with their council’s current performance concern about the potential for loss of representation and focus on local issues
following a merger concern about the potential costs of a merger and doubt that the anticipated
efficiency benefits of a merger would arise, and concerns about the potential for reduced services and higher rates following a
merger.
Some submissions supported their council merging with other councils. This was generally because the stakeholder considered their council was performing poorly and a merger would assist to improve services, financial management, and the quality of leadership.
However, most of the submissions received in relation to the voluntary mergers proposed by Randwick/Waverley and Auburn/Burwood/Canada Bay did not support these mergers. In relation to both of these voluntary mergers, stakeholders raised concerns about the lack of community consultation that had been undertaken. No submissions were received in relation to the two other Merger Proposals we received from Young/Boorowa, and Cootamundra/Harden.
43 The submissions in this list do not include early and late submissions received outside of the
consultation process.
2 Assessments by region
Assessment of Council Fit for the Future Proposals IPART 39
2 Assessments by region
In this chapter, we provide further detail on our assessment of whether each council is fit or not fit for the future. We discuss our findings by the NSW regions including:
Metropolitan Sydney, which we discuss by the following areas:
– Global City
– Inner Metropolitan Sydney
– Outer Metropolitan Sydney
Central Coast, Hunter and Illawarra, and
Non-metropolitan regions.44
The individual council assessments can be found in Appendix C.
2.1 Metropolitan Sydney
There are 41 councils in Metropolitan Sydney. For the majority of these (31), the ILGRP proposed merger options for investigation, as a preferred starting point. The remaining 10 councils include a number of councils in Outer Metropolitan Sydney. The ILGRP suggested these councils could remain stand-alone and did not propose preferred mergers for these councils, although it noted some merger options could be considered in the longer term.
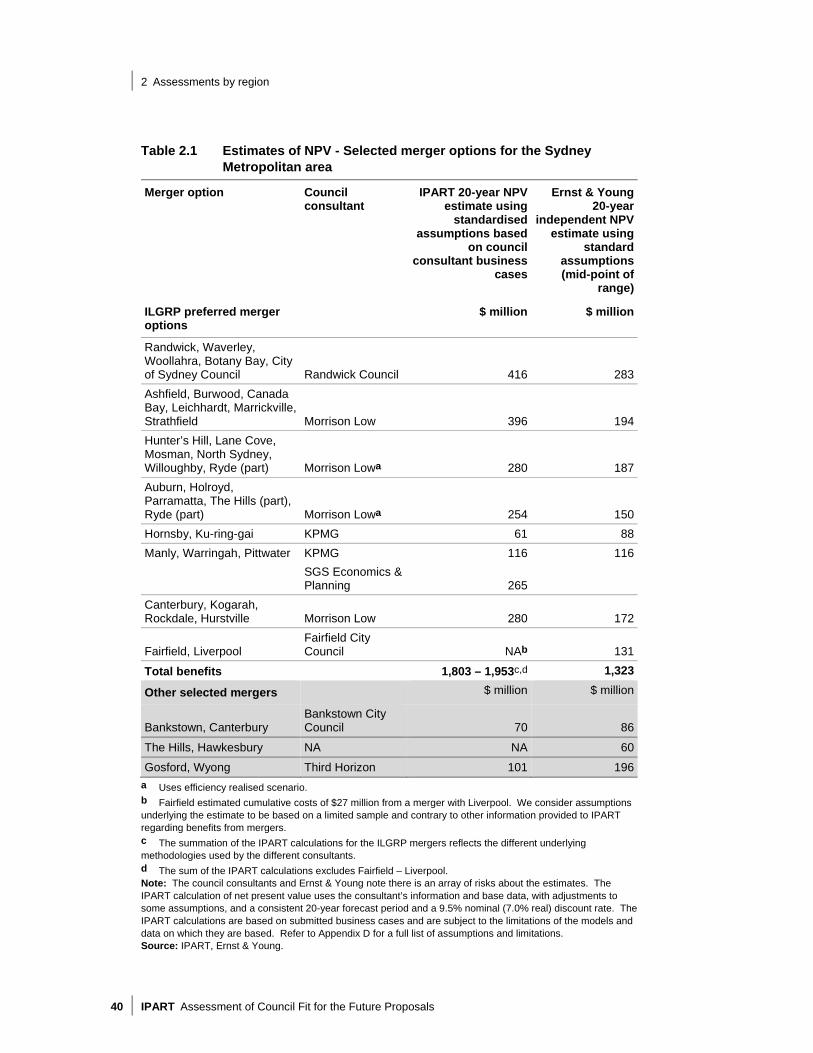
Many Metropolitan Sydney councils submitted business cases with their proposals, which assessed the costs and savings of the merger options identified by the ILGRP. We conducted additional analysis where this information was provided and estimate $1.8 billion to $2.0 billion in NPV benefits could be realised over 20 years if the ILGRP’s preferred Metropolitan Sydney mergers were to occur. Ernst & Young also estimates these mergers could yield substantial financial gains with $1.3 billion in NPV benefits over 20 years.
Table 2.1 provides a summary of the business case analysis for selected merger options for Sydney Metropolitan councils.
44 The assessments are based on council proposals which can be accessed on the IPART website at:
www.ipart.nsw.gov.au.
2 Assessments by region
40 IPART Assessment of Council Fit for the Future Proposals
Table 2.1 Estimates of NPV - Selected merger options for the Sydney Metropolitan area
Merger option Council consultant
IPART 20-year NPV estimate using
standardised assumptions based
on council consultant business
cases
Ernst & Young 20-year
independent NPV estimate using
standard assumptions (mid-point of
range)
ILGRP preferred merger options
$ million $ million
Randwick, Waverley, Woollahra, Botany Bay, City of Sydney Council Randwick Council 416 283
Ashfield, Burwood, Canada Bay, Leichhardt, Marrickville, Strathfield Morrison Low 396 194
Hunter’s Hill, Lane Cove, Mosman, North Sydney, Willoughby, Ryde (part) Morrison Lowa 280 187
Auburn, Holroyd, Parramatta, The Hills (part), Ryde (part) Morrison Lowa 254 150
Hornsby, Ku-ring-gai KPMG 61 88
Manly, Warringah, Pittwater KPMG 116 116
SGS Economics & Planning 265
Canterbury, Kogarah, Rockdale, Hurstville Morrison Low 280 172
Fairfield, Liverpool Fairfield City Council NAb 131
Total benefits 1,803 – 1,953c,d 1,323
Other selected mergers
$ million $ million
Bankstown, Canterbury Bankstown City Council 70 86
The Hills, Hawkesbury NA NA 60
Gosford, Wyong Third Horizon 101 196
a Uses efficiency realised scenario. b Fairfield estimated cumulative costs of $27 million from a merger with Liverpool. We consider assumptions underlying the estimate to be based on a limited sample and contrary to other information provided to IPART regarding benefits from mergers. c The summation of the IPART calculations for the ILGRP mergers reflects the different underlying methodologies used by the different consultants. d The sum of the IPART calculations excludes Fairfield – Liverpool. Note: The council consultants and Ernst & Young note there is an array of risks about the estimates. The IPART calculation of net present value uses the consultant’s information and base data, with adjustments to some assumptions, and a consistent 20-year forecast period and a 9.5% nominal (7.0% real) discount rate. The IPART calculations are based on submitted business cases and are subject to the limitations of the models and data on which they are based. Refer to Appendix D for a full list of assumptions and limitations. Source: IPART, Ernst & Young.

2 Assessments by region
Assessment of Council Fit for the Future Proposals IPART 41
Notwithstanding the estimated NPV of the ILGRP’s preferred mergers is high, we received only two Merger Proposals (involving five councils) in Metropolitan Sydney and 36 Council Improvement Proposals for councils to stand-alone.
Our analysis finds:
both Merger Proposals are fit
seven councils submitting Council Improvement Proposals are fit, and
29 councils submitting Council Improvement Proposals are not fit.
2.1.1 Global City
The ILGRP considered the expansion of the cities of Sydney and Parramatta to be a centerpiece of local government reform.45 It argued against a small ‘CBD council’ and discussed the concept of a ‘Global Capital City’ with attributes listed in Box 2.1.
Figure 2.1 Global City Council
Figure 2.1 shows the five metropolitan councils that were identified to merge into a ‘Global Capital City’, ie, City of Sydney, Randwick City Council, City of Botany Bay Council, Waverley Council and Woollahra Municipal Council.
45 ILGRP Final Report, p 99.

2 Assessments by region
42 IPART Assessment of Council Fit for the Future Proposals
A merger of these councils results in a forecast population of 653,250 by 2031.46 The prospective Global City Council incorporates the whole of the eastern suburbs, south to Sydney Airport, Port Botany, nearly all the iconic locations and features that contribute to Sydney’s global identity47 and much of the supporting infrastructure. The ILGRP suggested that a Global City Council could ‘become a highly capable and well-resourced partner of the State government in projecting Sydney’s image, fostering economic development and providing essential infrastructure.’48
Our assessment of this group of councils considers if each submitted proposal is consistent with, or better than, the option to merge to form a Global City Council. This is in line with our published assessment methodology.
Box 2.2 Key Attributes of a Global Capital City
Physical size – area encompasses a broad area and cross-section of inner metropolitansuburbs, including iconic locations of global significance.
Hierarchy – include major infrastructure and facilities that are at the peak of the hierarchyfor that function (government, transport, health, education, business, recreation, cultureetc).
Leadership – ‘first amongst equals’ of metropolitan councils due to the importance of itsdecisions, geographic scale, budget and responsibilities, reputation and profile, andrelationship to political, business and civic leaders.
Strategic capacity – ability to manage major regional facilities and undertake or facilitatemajor economic and infrastructure development to address the changing needs of theinner metropolitan region.
Global credibility – a leader in the Asia Pacific and maximise opportunities to partner orcompete as required with other global capital cities in the race for capital investment andinternational reputation.
Governability – attracts the best of candidates for political leadership, with a broad,diverse and balanced constituency that will facilitate good governance.
Partnership with the State- not be so large as to challenge the primacy of the State, buthave the stature, maturity and skills to be a respected partner and to develop a productiveworking relationship with state and federal agencies.
Source: ILGRP Final Report, Box 36, p 100.
46 DP&E. 47 As discussed below, the Government would need to consider the extent to which the Global
City Council should be given control over key infrastructure. 48 ILGRP Final Report, p 100.

2 Assessments by region
Assessment of Council Fit for the Future Proposals IPART 43
City of Sydney
The City of Sydney submitted a Council Improvement Proposal to remain a stand-alone council. We find the council is not fit for the future as it does not meet the scale and capacity criterion when compared to a Global City Council, although it meets the financial criteria overall.
The City of Sydney demonstrated it is a high performing council in the Sydney region as:
It maintains low residential rates while achieving high financial performance indicators.
It was the only council to receive a ‘strong’ financial sustainability rating with a ‘positive’ outlook when reviewed by TCorp.
It proactively partners with the Government and has made large contributions to infrastructure and urban renewal, such as the Green Square development.
It is one of the few Local Government Areas (LGAs) in NSW to exceed the housing targets set by the NSW Government. The City of Sydney has achieved an annual growth rate in housing supply of 3.4% per annum since 1993, 250% above the Sydney average.49
We also note City of Sydney received the highest number of public submissions of any council regarding its proposal. The majority of the more than 500 submissions received, supported the council remaining a stand-alone council.
Nevertheless, we assess that City of Sydney does not meet the scale and capacity criterion when compared to a Global City Council because:
It did not show that its stand-alone option is as good as or better than a Global City Council.
A Global City Council would deliver greater benefits for the people of NSW by better integrating planning and development across central Sydney and the eastern suburbs as the CBD expands.
It would also facilitate better partnering with other levels of government to develop and deliver key infrastructure, such as the Sydney Light Rail Project and the second Sydney Harbour rail crossing.
The estimated benefits from a Global City Council merger is $283 million over 20 years based on Ernst & Young’s mid-point range of NPV benefits.
49 NSW Department of Planning & Environment, New South Wales State and Local Government Area
Population, Household and Dwelling Projections: 2014 Final (DP&E).

2 Assessments by region
44 IPART Assessment of Council Fit for the Future Proposals
Should the Government adopt the Global City option, the following issues may require consideration:
The extent to which the Global City Council should be given control over key infrastructure such as the Sydney Opera House, Barangaroo, Port Botany, Circular Quay and Darling Harbour to enable it to operate effectively as a Global City Council, as this infrastructure is currently administered by bodies separate to local councils.
Measures to ensure the development and growth of the CBD and surrounding areas continue. This may require changes and enhancements to the City of Sydney Act 1988. In addition, the implications for business voting within the Global City Council may need to be considered, as the City of Sydney Act 1988 will allocate two votes to businesses in local council elections in the City of Sydney from 2016.
Measures to ensure the significant council revenues generated from businesses ($189 million in 2012-13) in the Sydney CBD are efficiently spent to realise the key objectives of the Global City Council.
If the Global City Council option is not adopted, City of Sydney has sufficient scale and capacity to stand alone and would be fit as a stand-alone council.
Randwick City Council and Waverley Council
We find the Merger Proposal submitted by Randwick and Waverley is fit for the future. It meets the scale and capacity criterion and the financial criteria overall.
A merger of Randwick and Waverley would deliver substantial scale and capacity benefits to their local communities compared to the councils standing alone. The merger builds on existing collaborations between the councils which share communities of interest and similar geography.
We calculate, drawing on information provided by Randwick, that the merger of Randwick and Waverley could produce benefits of around $139 million over 20 years. The mid-point of Ernst & Young’s estimated benefits of the merger is $99 million on an NPV basis over 20 years.
The merged council is forecast to perform better financially than the councils individually, particularly with respect to the operating performance ratio. The operating performance ratio is forecast to reach 11.4% by 2019-20 under the merger, compared to 3.3% for Randwick and 3.0% for Waverley respectively without a merger. The merged council will also meet all the other financial benchmarks by 2019-20.

2 Assessments by region
Assessment of Council Fit for the Future Proposals IPART 45
The merger is the best available option for the councils given neighbouring councils did not want to merge. The merger does not preclude a Global City Council should the NSW Government elect to adopt this option. However, we note Randwick and Waverley have indicated they do not support a merger with City of Sydney.
Woollahra Municipal Council and the City of Botany Bay
Woollahra and Botany Bay submitted Council Improvement Proposals to remain as stand-alone councils. We find both councils are not fit for the future as neither council meets the scale and capacity criterion, although Woollahra and Botany Bay both meet the financial criteria overall.
Our analysis suggests the councils do not have sufficient scale and capacity to effectively partner with governments compared to the merger. Further, the efficiency improvements in the councils’ proposals can be realised under the merger option. We find merging these councils with similar neighbouring councils would produce significant benefits. For example, over a 20-year timeframe, Ernst & Young’s analysis suggests:
a merger of Randwick, Waverley, Woollahra and Botany Bay could provide NPV benefits of $218 million, while
a merger of Randwick, Waverley, Woollahra, Botany Bay and City of Sydney to form a Global City Council could provide NPV benefits of $283 million.
2.1.2 Inner Metropolitan Sydney Councils
As illustrated in Figure 2.2, Inner Metropolitan Sydney includes 27 councils situated roughly between the Global City area and the Outer Metropolitan Sydney area.
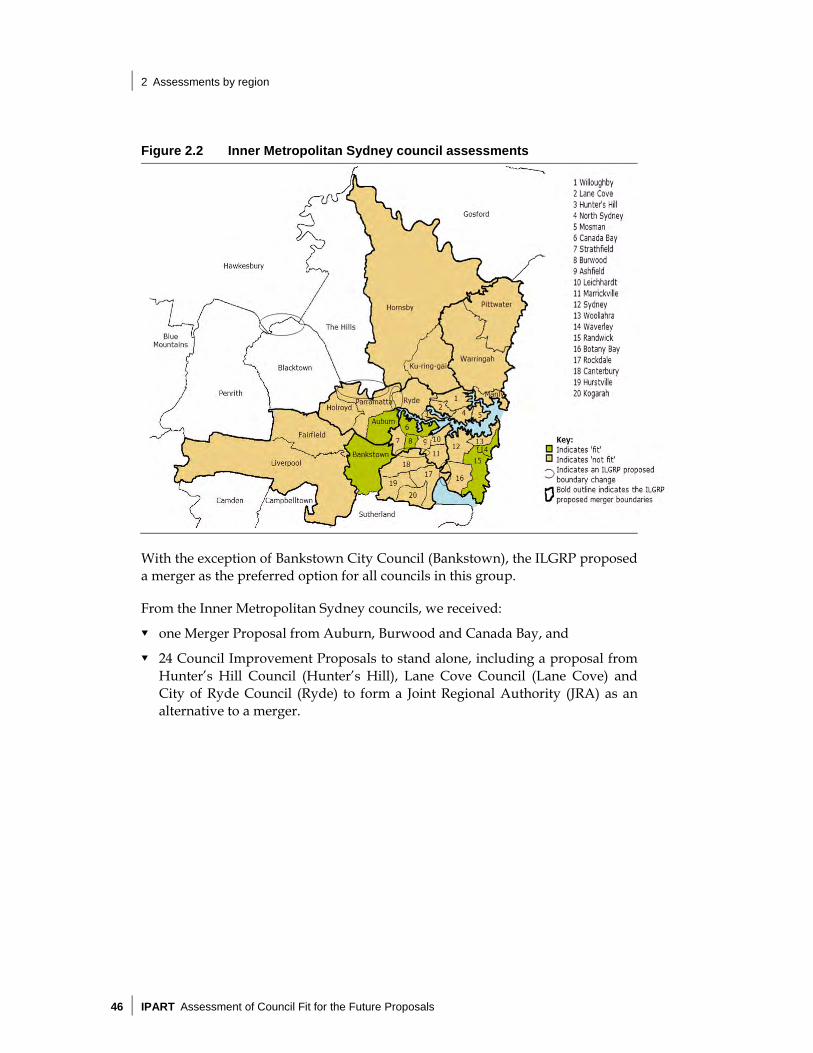
2 Assessments by region
46 IPART Assessment of Council Fit for the Future Proposals
Figure 2.2 Inner Metropolitan Sydney council assessments
With the exception of Bankstown City Council (Bankstown), the ILGRP proposed a merger as the preferred option for all councils in this group.
From the Inner Metropolitan Sydney councils, we received:
one Merger Proposal from Auburn, Burwood and Canada Bay, and
24 Council Improvement Proposals to stand alone, including a proposal from Hunter’s Hill Council (Hunter’s Hill), Lane Cove Council (Lane Cove) and City of Ryde Council (Ryde) to form a Joint Regional Authority (JRA) as an alternative to a merger.

2 Assessments by region
Assessment of Council Fit for the Future Proposals IPART 47
Merger Proposal - Auburn, Burwood and Canada Bay
Figure 2.3 Merger proposal from Auburn, Burwood and Canada Bay
We find the proposed merger of Auburn, Burwood and Canada Bay fit for the future as it meets the scale and capacity criterion and the financial criteria overall (Figure 2.3).
These councils submitted a voluntary, alternative merger to the options identified by the ILGRP. The ILGRP’s preferred options were for:
Auburn to merge with Holroyd City Council (Holroyd), Parramatta City Council (Parramatta), City of Ryde Council (Ryde) (part) and The Hills Shire Council (The Hills) (part).
Burwood and Canada Bay to merge with Ashfield Council (Ashfield), Leichhardt Municipal Council (Leichardt), Marrickville Council (Marrickville) and Strathfield.
Our assessment of the Auburn, Burwood and Canada Bay Merger Proposal finds:
The merged council's population would provide the new council with sufficient scale to capably partner with state and federal agencies on regionally significant projects such as major transport infrastructure.
This arrangement would likely be a desirable outcome in that a voluntary merger would facilitate a faster progression towards achieving efficiencies when transitioning to a new council.
The merger is expandable, and the councils inform us it would be possible and desirable to include Strathfield, and possibly Ashfield.
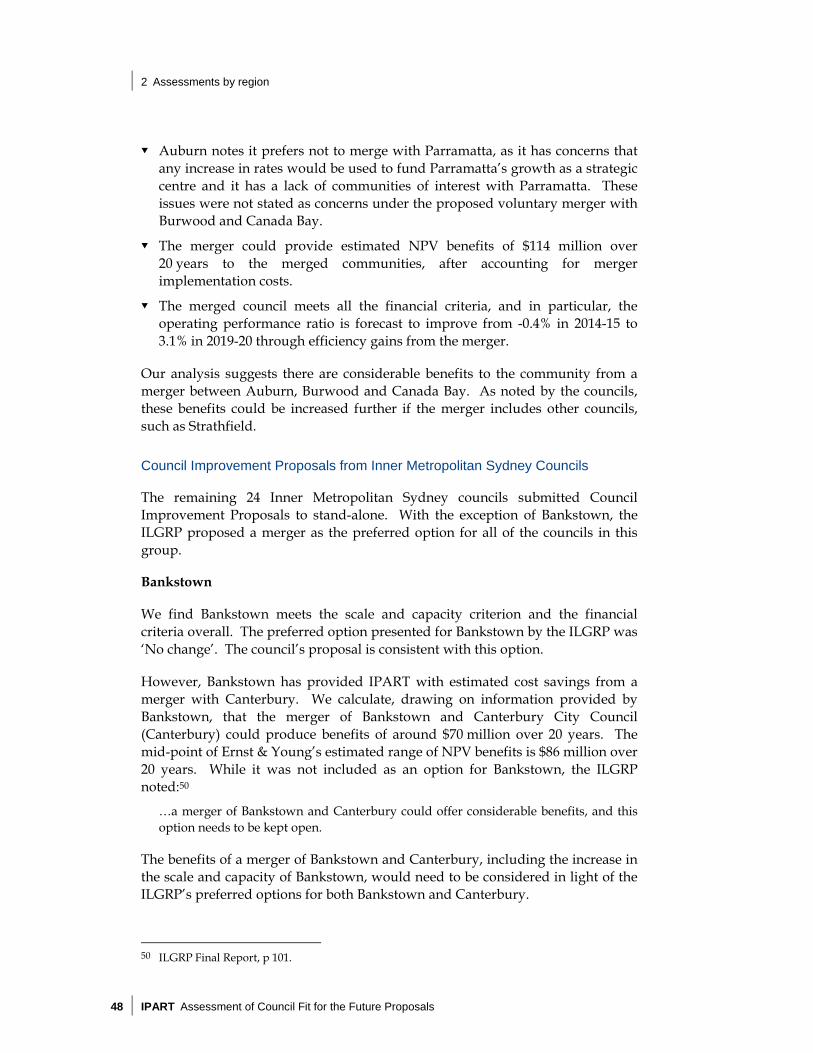
2 Assessments by region
48 IPART Assessment of Council Fit for the Future Proposals
Auburn notes it prefers not to merge with Parramatta, as it has concerns that any increase in rates would be used to fund Parramatta’s growth as a strategic centre and it has a lack of communities of interest with Parramatta. These issues were not stated as concerns under the proposed voluntary merger with Burwood and Canada Bay.
The merger could provide estimated NPV benefits of $114 million over 20 years to the merged communities, after accounting for merger implementation costs.
The merged council meets all the financial criteria, and in particular, the operating performance ratio is forecast to improve from -0.4% in 2014-15 to 3.1% in 2019-20 through efficiency gains from the merger.
Our analysis suggests there are considerable benefits to the community from a merger between Auburn, Burwood and Canada Bay. As noted by the councils, these benefits could be increased further if the merger includes other councils, such as Strathfield.
Council Improvement Proposals from Inner Metropolitan Sydney Councils
The remaining 24 Inner Metropolitan Sydney councils submitted Council Improvement Proposals to stand-alone. With the exception of Bankstown, the ILGRP proposed a merger as the preferred option for all of the councils in this group.
Bankstown
We find Bankstown meets the scale and capacity criterion and the financial criteria overall. The preferred option presented for Bankstown by the ILGRP was ‘No change’. The council’s proposal is consistent with this option.
However, Bankstown has provided IPART with estimated cost savings from a merger with Canterbury. We calculate, drawing on information provided by Bankstown, that the merger of Bankstown and Canterbury City Council (Canterbury) could produce benefits of around $70 million over 20 years. The mid-point of Ernst & Young’s estimated range of NPV benefits is $86 million over 20 years. While it was not included as an option for Bankstown, the ILGRP noted:50
…a merger of Bankstown and Canterbury could offer considerable benefits, and this option needs to be kept open.
The benefits of a merger of Bankstown and Canterbury, including the increase in the scale and capacity of Bankstown, would need to be considered in light of the ILGRP’s preferred options for both Bankstown and Canterbury.
50 ILGRP Final Report, p 101.
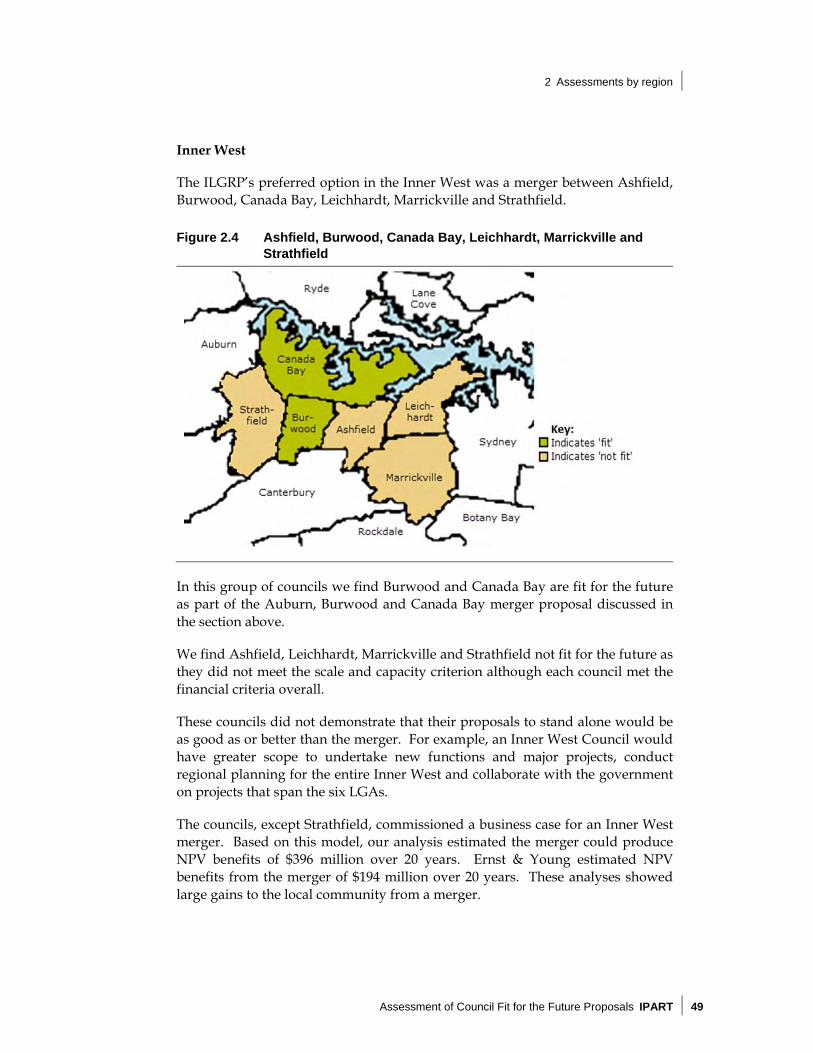
2 Assessments by region
Assessment of Council Fit for the Future Proposals IPART 49
Inner West
The ILGRP’s preferred option in the Inner West was a merger between Ashfield, Burwood, Canada Bay, Leichhardt, Marrickville and Strathfield.
Figure 2.4 Ashfield, Burwood, Canada Bay, Leichhardt, Marrickville and Strathfield
In this group of councils we find Burwood and Canada Bay are fit for the future as part of the Auburn, Burwood and Canada Bay merger proposal discussed in the section above.
We find Ashfield, Leichhardt, Marrickville and Strathfield not fit for the future as they did not meet the scale and capacity criterion although each council met the financial criteria overall.
These councils did not demonstrate that their proposals to stand alone would be as good as or better than the merger. For example, an Inner West Council would have greater scope to undertake new functions and major projects, conduct regional planning for the entire Inner West and collaborate with the government on projects that span the six LGAs.
The councils, except Strathfield, commissioned a business case for an Inner West merger. Based on this model, our analysis estimated the merger could produce NPV benefits of $396 million over 20 years. Ernst & Young estimated NPV benefits from the merger of $194 million over 20 years. These analyses showed large gains to the local community from a merger.
2 Assessments by region
50 IPART Assessment of Council Fit for the Future Proposals
West Central
The ILGRP’s preferred option in the West Central was a merger between Auburn, Holroyd, Parramatta, Ryde (part), and The Hills (part).51
Figure 2.5 Auburn, Holroyd, Parramatta, Ryde (part) and The Hills (part)
We find Holroyd, Parramatta and Ryde are not fit for the future as they do not meet the scale and capacity criterion. They did not demonstrate that their proposals to stand alone are as good as or better than the merger. However, each council met the financial criteria overall. In the case of Holroyd, the additional revenue from the SV approved in 2014 of 44.2% (29.1% above the rate peg) assists the council to meet the benchmark for the operating performance ratio.
Holroyd submitted a business case for a merger of this group of councils. Based on this model, our analysis suggests the merger could produce NPV benefits of $254 million over 20 years. Ernst & Young estimated NPV benefits from the merger of $150 million over 20 years. These analyses showed large gains to the local community from a merger. An enlarged council in the West Central area of Metropolitan Sydney will have a more robust revenue base, better regional collaboration and greater scope to undertake functions and projects that span several LGAs.
Southern Suburbs
The ILGRP’s preferred option in the Southern Suburbs was for a merger of Canterbury, Hurstville City Council (Hurstville), Kogarah City Council (Kogarah) and Rockdale City Council (Rockdale).
51 We discuss Auburn in the previous section as part of the Auburn, Burwood, Canada Bay
Merger Proposal and The Hills in the following section on the Outer Metropolitan Sydney councils.

2 Assessments by region
Assessment of Council Fit for the Future Proposals IPART 51
Figure 2.6 Canterbury, Hurstville, Kogarah, and Rockdale
We find Canterbury, Hurstville, Kogarah and Rockdale not fit for the future, as they did not meet the scale and capacity criterion. Each council submitted a proposal to remain a stand-alone council. However, we find the councils did not demonstrate that standing alone was as good as, or better than the preferred merger option.
The merger could assist the councils to:
partner more effectively with government
provide significant benefits to communities in delivering infrastructure consistent with the South Subregion plan, and
better manage the Georges River catchment.
The councils each commissioned a business case of the merger. Based on this model, our analysis suggests the preferred merger could produce benefits of $280 million over 20 years in NPV terms. Our independent consultants, Ernst and Young estimated benefits from the merger of $172 million over 20 years in NPV terms.
The ILGRP included an alternative for Canterbury to merge with Bankstown. As noted above, our analysis, based on information provided by Bankstown, suggests a merger between Canterbury and Bankstown could provide benefits of $70 million over 20 years in NPV terms, with $86 million of benefits in NPV terms for this alternative merger also estimated by Ernst & Young.
Canterbury, Hurstville, Kogarah and Rockdale met the financial criteria overall. The forecast improvement in Canterbury, Kogarah and Rockdale’s financial performance over the outlook period is driven by approved SVs for asset renewal and to improve financial sustainability.

2 Assessments by region
52 IPART Assessment of Council Fit for the Future Proposals
Lower North Shore
The ILGRP’s preferred option in the Lower North Shore was a merger between Hunter’s Hill Council (Hunter’s Hill), Lane Cove Municipal Council (Lane Cove), Mosman Municipal Council (Mosman), North Sydney Council (North Sydney), Ryde (part), and Willoughby City Council (Willoughby).
Figure 2.7 Hunter’s Hill, Lane Cove, Mosman, North Sydney, Ryde (part) and Willoughby
We find these councils’ proposals to stand alone, including the JRA proposal from Hunter’s Hill, Lane Cove and Ryde, are not fit for the future as they did not meet the scale and capacity criterion although each council met the financial criteria overall. These councils did not demonstrate that their proposal was as good as, or better than the merger.
Hunter’s Hill, Lane Cove and Ryde submitted a JRA proposal as an alternative to a merger. This proposal indicates the JRA would provide benefits from shared services and centralised planning and development without the disruption of a merger. The proposal indicates the JRA would generate net benefits over 15 years of $0.5 million, or $3.4 million if it also included Mosman, North Sydney and Willoughby. The proposal does not fully quantify any efficiency savings that may also eventuate under the JRA.
Our analysis suggests a merger of all councils in this group would improve their capacity to partner effectively with government and undertake strategic planning and development for the Lower North Shore region. The councils (except North Sydney) also commissioned a business case for a merger of all six councils. Based on this model, we estimated the merger could produce NPV benefits of $280 million over 20 years. Ernst & Young estimated NPV benefits from the merger of around $187 million over 20 years. The preferred merger is likely to provide a higher level of efficiency savings than the JRA.
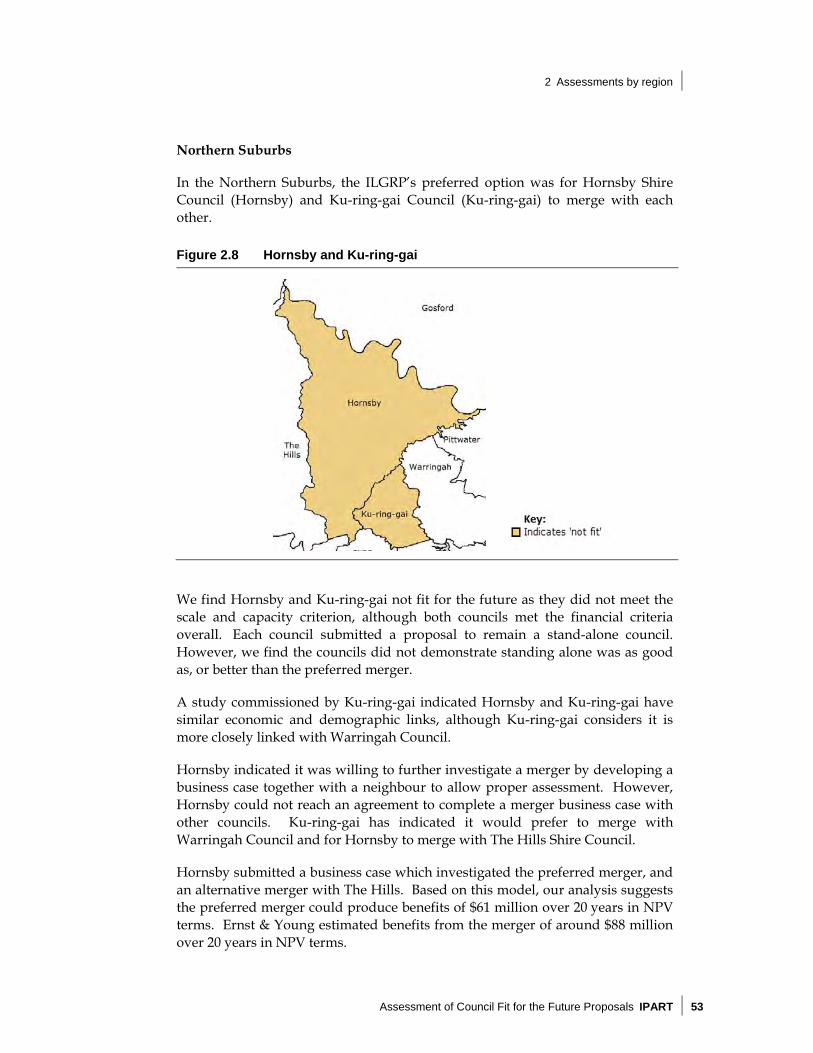
2 Assessments by region
Assessment of Council Fit for the Future Proposals IPART 53
Northern Suburbs
In the Northern Suburbs, the ILGRP’s preferred option was for Hornsby Shire Council (Hornsby) and Ku-ring-gai Council (Ku-ring-gai) to merge with each other.
Figure 2.8 Hornsby and Ku-ring-gai
We find Hornsby and Ku-ring-gai not fit for the future as they did not meet the scale and capacity criterion, although both councils met the financial criteria overall. Each council submitted a proposal to remain a stand-alone council. However, we find the councils did not demonstrate standing alone was as good as, or better than the preferred merger.
A study commissioned by Ku-ring-gai indicated Hornsby and Ku-ring-gai have similar economic and demographic links, although Ku-ring-gai considers it is more closely linked with Warringah Council.
Hornsby indicated it was willing to further investigate a merger by developing a business case together with a neighbour to allow proper assessment. However, Hornsby could not reach an agreement to complete a merger business case with other councils. Ku-ring-gai has indicated it would prefer to merge with Warringah Council and for Hornsby to merge with The Hills Shire Council.
Hornsby submitted a business case which investigated the preferred merger, and an alternative merger with The Hills. Based on this model, our analysis suggests the preferred merger could produce benefits of $61 million over 20 years in NPV terms. Ernst & Young estimated benefits from the merger of around $88 million over 20 years in NPV terms.

2 Assessments by region
54 IPART Assessment of Council Fit for the Future Proposals
Our analysis suggests the alternative merger between Hornsby and The Hills Shire Council could produce net benefits of $85 million over 20 years in NPV terms. This was not an option identified by the ILGRP and we have not undertaken any further analysis of the regional impacts of this alternative merger. The Hills did not seek to pursue this option.
All merger options showed significant gains to the local communities that were better than the stand alone options for each council.
Northern Beaches
In the Northern Beaches, the ILGRP’s preferred option was for a merger of Manly Council (Manly), Pittwater Council (Pittwater) and Warringah Council (Warringah).
Figure 2.9 Manly, Pittwater and Warringah
We find Manly, Pittwater and Warringah not fit for the future, as they did not meet the scale and capacity criterion. Each council submitted a proposal to remain a stand-alone council. However, we find the councils did not demonstrate that standing alone was as good as, or better than the preferred merger. We consider a merger would improve the capacity of the councils to partner more effectively with governments and undertake better strategic planning and development for the Northern Beaches region.
Analysis of the preferred merger was undertaken separately by Manly and Pittwater, Warringah, and Ernst & Young. This analysis shows over a 20-year timeframe in NPV terms, the preferred merger could produce: net benefits of $116 million, using business cases provided by Manly and
Pittwater net benefits of $265 million, using business cases provided by Warringah net benefits of $116 million, based on estimates by Ernst & Young.

2 Assessments by region
Assessment of Council Fit for the Future Proposals IPART 55
Each of these merger assessments was based on different inputs and underlying methodologies, however all of them suggest a merger could provide substantial net benefits to the local community.
Manly and Pittwater commissioned additional analysis relating to the creation of two new councils, Greater Manly and Greater Pittwater, from the existing three councils. Manly has indicated this would be its preference if a merger was required. However, our analysis suggests this alternative merger is unlikely to provide net benefits which are as large as the preferred merger. Warringah noted it does not support this alternative merger option and supports the preferred three-way merger, but could not reach agreement for the preferred merger with Manly and Pittwater.
All three of these councils meet the financial criteria overall. Manly’s proposal assumes a moderate SV in 2017-18 of 2.2% above the rate peg for one year (4.7% including the rate peg).
South West
The ILGRP preferred a merger between Fairfield City Council (Fairfield) and Liverpool City Council (Liverpool) in the South West.
Figure 2.10 Fairfield and Liverpool
We find Fairfield and Liverpool are not fit for the future as they do not meet the scale and capacity criterion. The councils did not demonstrate their proposals to stand alone are as good as or better than the merger. A merged council would have enhanced scale to partner more effectively with governments compared to the stand alone option.
Liverpool conducted analysis of merger options which showed over 10 years52: a merger with Campbelltown and Camden produces NPV benefits of
$243 million, and a merger with Fairfield produces NPV benefits of $64 million. 52 SGS Economics & Planning, Fit for the Future: Options for Liverpool, Lead Council model.

2 Assessments by region
56 IPART Assessment of Council Fit for the Future Proposals
In addition, Ernst & Young estimated NPV benefits from the merger of Liverpool and Fairfield of $131 million on a top down basis, over 20 years.
Each council met the financial criteria overall. Fairfield’s operating performance ratio is forecast to reach 1.6% by 2019-20 which is just above the benchmark. The improvement in its operating performance is primarily due to the approved SV in 2014-15 of 10% (7.7% above the rate peg), proposed efficiency savings and adjustments for depreciation. Liverpool’s operating performance ratio is also forecast to improve, to 0.3% by 2019-20, which meets the benchmark. Both councils included interest income on section 94 reserves. We adjusted the operating performance ratio by removing interest income on section 94 reserves as we do not consider this inclusion appropriate. Nevertheless, both councils still meet the sustainability criterion.
Both councils suggested that socio-economic differences and divergent strategic directions would create issues if they were merged. Both councils suggested that if necessary, alternative merger options would be preferred. Fairfield expressed concerns that a merged council’s focus would shift to the Liverpool CBD which would undermine Fairfield’s current growth strategies and social objectives. Liverpool City Council indicated that due to its growth profile, a merger with a council in the south west growth centre might provide better outcomes.
Fairfield estimated cumulative costs of $27 million from a merger with Liverpool.53 However, neither Fairfield nor Liverpool undertook sufficient financial analysis for a possible merger. Ernst & Young estimated NPV benefits from a merger of the two councils of around $131 million over 20 years.
53 As noted in Table 2.1, we consider assumptions underlying the estimate to be based on a
limited sample and contrary to other information provided to IPART regarding benefits from mergers.
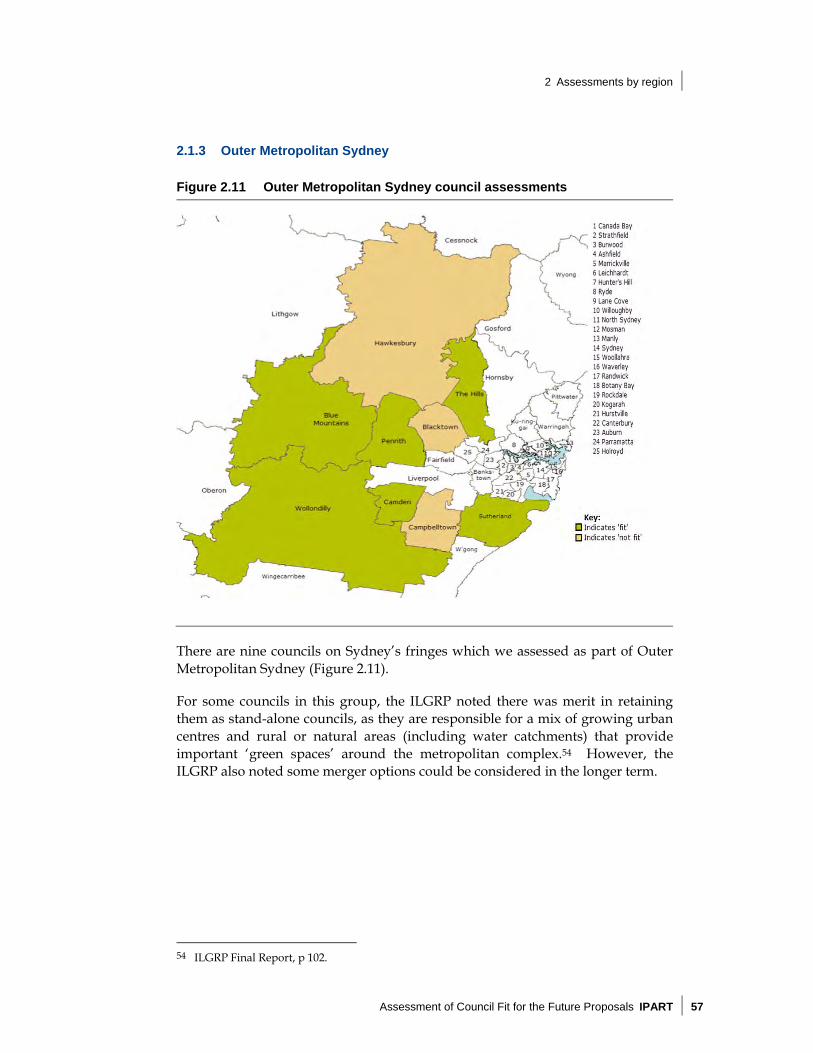
2 Assessments by region
Assessment of Council Fit for the Future Proposals IPART 57
2.1.3 Outer Metropolitan Sydney
Figure 2.11 Outer Metropolitan Sydney council assessments
There are nine councils on Sydney’s fringes which we assessed as part of Outer Metropolitan Sydney (Figure 2.11).
For some councils in this group, the ILGRP noted there was merit in retaining them as stand-alone councils, as they are responsible for a mix of growing urban centres and rural or natural areas (including water catchments) that provide important ‘green spaces’ around the metropolitan complex.54 However, the ILGRP also noted some merger options could be considered in the longer term.
54 ILGRP Final Report, p 102.

2 Assessments by region
58 IPART Assessment of Council Fit for the Future Proposals
Blue Mountains, Camden, Penrith, Sutherland, The Hills and Wollondilly
We find Blue Mountains City Council (Blue Mountains), Camden Council (Camden), Penrith City Council (Penrith), Sutherland Shire Council (Sutherland), The Hills and Wollondilly Shire Council (Wollondilly) are fit for the future. All of these councils meet the scale and capacity criterion as well as the financial criteria overall.
In 2015-16, relatively large SVs were approved for Blue Mountains and Wollondilly respectively, of 28.5% and 38.8% above the rate peg, over four years (40.3% and 50.7% respectively including the rate peg). This additional revenue assists these councils to meet the operating performance benchmark by 2019-20.
Although Camden is not expected to meet the benchmarks for a number of measures by 2019-20, including the operating performance benchmark, its reported financial performance has been adversely affected by its forecast population growth. Camden is forecast to be the fastest growing council in NSW and expected to grow by 5.1% on average a year, which will increase its population from 58,450 in 2011 to 162,350 in 2031.55 This results in growth of almost 180% between 2011 and 2031. We assess Camden as meeting the financial criteria overall as its inability to meet a number of benchmarks has been affected by its expected high population growth as opposed to underlying structural issues. In the long term, as Camden’s growth rates moderate to more normal levels, it would likely meet the operating performance benchmark based on current data.
The Hills’ proposal to stand alone is consistent with the ILGRP’s preferred option of ‘no change’. We therefore assess that it meets the scale and capacity criterion.56
The ILGRP’s report included a possibility for The Hills to merge with Hawkesbury in the longer term. Ernst & Young calculated that a merger between these two councils could produce benefits of $60 million over 20 years in NPV terms. The Hills also submitted its preferred option for boundary changes, but we did not assess the NPV of these changes due to insufficient information.
Blacktown, Campbelltown and Hawkesbury
We find Blacktown City Council (Blacktown), Campbelltown Council Campbelltown) and Hawkesbury City Council (Hawkesbury) are not fit for the future based on these councils not meeting the financial criteria overall. However, all three councils met the scale and capacity criterion.
55 NSW Department of Planning and Environment, New South Wales State and Local Government
Area Population Projections 2014. 56 However, we note there may be alternative merger options which could yield significant net
benefits.

2 Assessments by region
Assessment of Council Fit for the Future Proposals IPART 59
While Blacktown satisfies the infrastructure and service management criterion and the efficiency criterion, it does not satisfy the sustainability criterion based on its forecast of continuing operating deficits and a building and infrastructure renewal ratio significantly below the benchmark by 2019-20. For this reason it does not satisfy the financial criteria overall.
Blacktown’s operating performance ratio is forecast to decrease from -5.6% in 2014-15 to -8.4% in 2019-20. If the interest income on section 94 reserves is removed, this ratio decreases further to -10% in 2019-20. The trend in growing operating deficits will have a significant impact on the council’s financial sustainability and ability to address asset renewals over the long term. The council has forecast its building and infrastructure renewal ratio will be 38.6% by 2019-20, which is significantly below the benchmark of 100%. Blacktown’s long term financial plan forecasts a significant asset renewal funding gap of around $140 million by 2025-26, which is expected to increase further to $626 million by 2035.
A factor adding to the council’s poor operating performance is its depreciation expense, which is forecast to grow because of the accumulation of new assets to support population growth. Blacktown’s depreciation rates are based on weighted average useful asset lives of approximately 60 years, which is reasonable.57 The accumulation of new assets is normal for a growth council.58 Given its scale and capacity and revenue raising ability we consider that there are many options for Blacktown to become fit in future years. This includes exploring revenue and cost-reduction opportunities, refinements to asset management planning, and efficient use of debt for capital and infrastructure projects.
Campbelltown did not meet the financial criteria overall based on a negative and declining operating performance ratio which does not meet the benchmark by 2019-20. Its operating performance ratio is forecast to improve from -0.9% in 2014-15 to 2.0% in 2016-17, but then declines significantly to -2.4% by 2019-20. It is then forecast to deteriorate further to -3.5% by 2024-25. It also forecasts not meeting the building and infrastructure asset renewal benchmark, although it reports it is funding 100% of its renewal requirements in accordance with its Asset Management Plan.
57 Accounting standards require councils to regularly review assumed useful asset lives and the
depreciation methodology and rates used. This enables the reliability of annual depreciation estimates to be enhanced based on past actual asset performance.
58 The forecast population growth in the Blacktown LGA is 51.5% based on DPE projections over the period from 2011 to 2031. This is not as large as other councils such as Camden which is projected to grow by 178% over the same period.

2 Assessments by region
60 IPART Assessment of Council Fit for the Future Proposals
Campbelltown notes its modelling assumes no significant new capital expenditure over the outlook period which may not be reasonable. It notes its focus is on eliminating the infrastructure backlog and annual maintenance gap. Campbelltown’s need to undertake additional new capital expenditure to meet population growth may be mitigated to some extent, as a number of infrastructure projects will likely be delivered by other government agencies and developers. However, additional capital expenditure will likely be required to meet Campbelltown’s population growth, which would have an adverse impact on its operating performance ratio through increased depreciation.
Growth in Campbelltown may be bolstered over the long run by the Glenfield to Macarthur Priority Urban Renewal Corridor initiative and the Greater Macarthur Land Release Preliminary strategy. These developments, if progressed, will provide scope for significant additional dwellings. The timing of most of the potential housing development is uncertain, with additional preparatory work required before much of the development could proceed.
For these reasons, and the recent announcement of the strategy, Campbelltown’s forecasts in its long term financial plan and proposal do not include the substantive part of these potential developments. These developments will require additional infrastructure spending. The funding mechanism for the additional infrastructure is uncertain, but it is expected Campbelltown will draw on state government funding and voluntary planning agreements to fund this infrastructure.
We assessed Hawkesbury as meeting the scale and capacity criterion as its proposal is consistent with the ILGRP’s preferred option for no change. However, Hawkesbury did not meet the financial criteria overall based on its negative operating performance ratio of -1.1% in 2019-20. In addition, the improvement in its operating performance relies on a proposed SV of 16.0% above the rate peg over five years from 2017-18 (29.7% including the rate peg) to approach break-even, as well as unspecified service level reductions to fund asset maintenance and renewals.
As shown in Table 2.1 above, analysis by Ernst & Young suggests a merger between Hawkesbury and The Hills may be a better alternative to Hawkesbury’s proposal to stand alone.

2 Assessments by region
Assessment of Council Fit for the Future Proposals IPART 61
2.2 Central Coast, Hunter and Illawarra
Figure 2.12 Central Coast, Hunter and Illawarra Regions
Unlike the metropolitan and non-metropolitan councils, the options for the Central Coast, Hunter and Illawarra regions were not specifically set out by the ILGRP. However, it stated:
The Hunter and Illawarra regions are vital ‘engine rooms’ of the NSW economy, and local government has an essential role to play in ensuring sound regional development. This requires improved frameworks for local and regional governance. The Central Coast has important links with both the Hunter and the Sydney metropolitan region, is experiencing significant growth pressures, and would also benefit from stronger governance.59
In addition, the ILGRP’s Final Report discussed potential mergers for specific councils in these regions. Table 2.2 provides the options set out in our Methodology Paper for the Central Coast, Hunter and Illawarra based on the ILGRP’s discussion of these regions.60
59 ILGRP Final Report, pp 108. 60 Methodology Paper, p 64; and ILGRP Final Report, pp 108 -110.
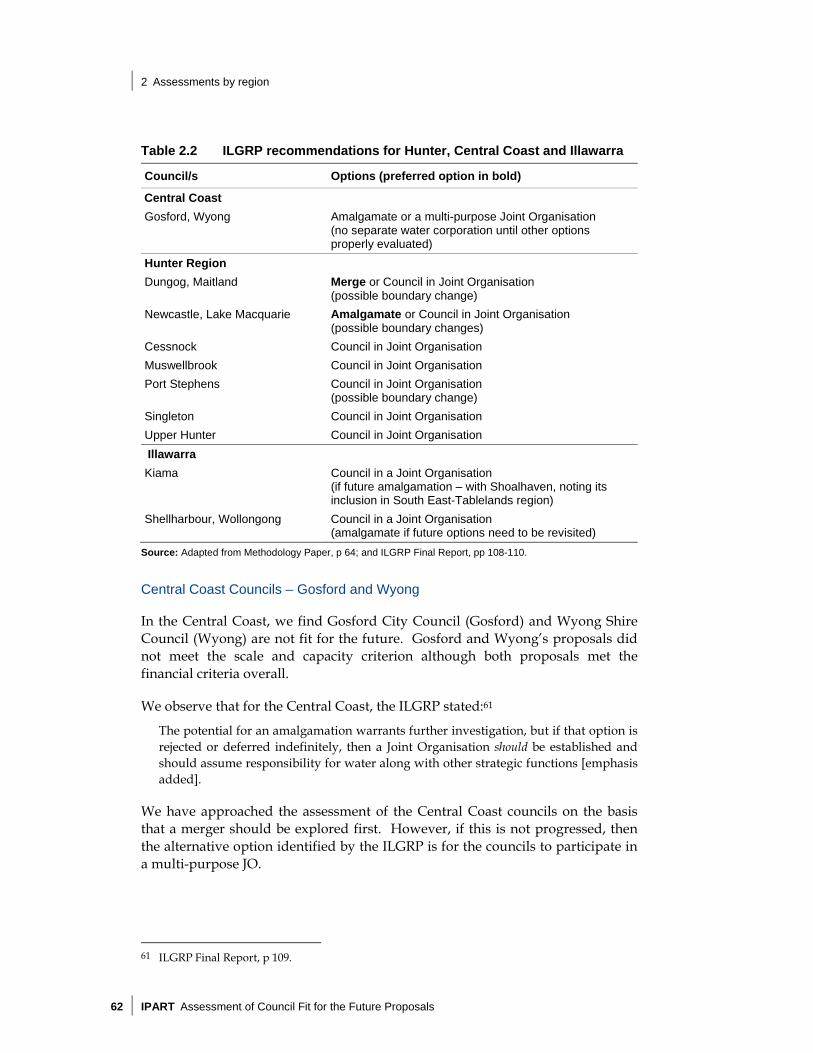
2 Assessments by region
62 IPART Assessment of Council Fit for the Future Proposals
Table 2.2 ILGRP recommendations for Hunter, Central Coast and Illawarra
Council/s Options (preferred option in bold)
Central Coast
Gosford, Wyong Amalgamate or a multi-purpose Joint Organisation (no separate water corporation until other options properly evaluated)
Hunter Region
Dungog, Maitland Merge or Council in Joint Organisation (possible boundary change)
Newcastle, Lake Macquarie Amalgamate or Council in Joint Organisation (possible boundary changes)
Cessnock Council in Joint Organisation
Muswellbrook Council in Joint Organisation
Port Stephens Council in Joint Organisation (possible boundary change)
Singleton Council in Joint Organisation
Upper Hunter Council in Joint Organisation
Illawarra
Kiama Council in a Joint Organisation (if future amalgamation – with Shoalhaven, noting its inclusion in South East-Tablelands region)
Shellharbour, Wollongong Council in a Joint Organisation (amalgamate if future options need to be revisited)
Source: Adapted from Methodology Paper, p 64; and ILGRP Final Report, pp 108-110.
Central Coast Councils – Gosford and Wyong
In the Central Coast, we find Gosford City Council (Gosford) and Wyong Shire Council (Wyong) are not fit for the future. Gosford and Wyong’s proposals did not meet the scale and capacity criterion although both proposals met the financial criteria overall.
We observe that for the Central Coast, the ILGRP stated:61
The potential for an amalgamation warrants further investigation, but if that option is rejected or deferred indefinitely, then a Joint Organisation should be established and should assume responsibility for water along with other strategic functions [emphasis added].
We have approached the assessment of the Central Coast councils on the basis that a merger should be explored first. However, if this is not progressed, then the alternative option identified by the ILGRP is for the councils to participate in a multi-purpose JO.
61 ILGRP Final Report, p 109.

2 Assessments by region
Assessment of Council Fit for the Future Proposals IPART 63
Gosford noted there were net present value benefits from a merger but ruled it out on the basis of the risks, upfront costs and time lags for benefit realisation. It proposes to stand alone and join a Hunter JO rather than to join a Central Coast JO with Wyong.
Wyong ruled out a merger based on its consultant’s report and proposes to stand alone with ‘business improvements’. It notes that it is open to exploring shared services with Gosford similar to a JO, but does not propose to form a Central Coast JO with Gosford.
We consider a merger of Gosford and Wyong would give the councils greater scope to undertake new functions and projects, more capacity to effectively partner with governments and effectively advocate on behalf of their communities. Further, the efficiency improvements in the councils’ proposals could be better realised under the merger option.
We find:
The proposals submitted by Gosford and Wyong are not consistent with the FFTF objectives for stronger and more strategic governance for the Central Coast as the councils propose to stand-alone and not participate in a Central Coast JO.
Based on our indicative analysis, up to $101 million over 20 years in NPV benefits could be realised from a Gosford and Wyong merger. In addition, Ernst & Young estimated NPV benefits from a merger of Gosford and Wyong is $196 million over 20 years.
For these reasons we consider that Gosford and Wyong did not demonstrate their stand-alone proposal was as good as or better than the merger option.
Hunter region
In the Hunter region, we find Cessnock City Council (Cessnock), Muswellbrook Shire Council (Muswellbrook), Port Stephens Council (Port Stephens), Singleton Council (Singleton) and Upper Hunter Shire Council (Upper Hunter) are fit for the future. All of these councils met the scale and capacity criterion as well as the financial criteria. We note for all these councils, the only option presented was to remain stand-alone councils in a Hunter JO, and these council proposals were consistent with this option.
We find Lake Macquarie City Council (Lake Macquarie), Newcastle City Council (Newcastle), Dungog Shire Council (Dungog) and Maitland City Council (Maitland) not fit for the future. These councils did not meet the scale and capacity criterion. However, with the exception of Dungog, these councils met the financial criteria overall. In particular, Dungog did not meet the sustainability criterion. The council has proposed a significant SV of 108.2%

2 Assessments by region
64 IPART Assessment of Council Fit for the Future Proposals
(92.2% above the rate peg) over six years to achieve the operating performance benchmark which may not be reasonable.
Lake Macquarie and Newcastle did not show that their proposals to stand alone were as good as, or better than, the merger option. We consider a merger of Lake Macquarie and Newcastle is likely to provide system-wide benefits to their communities, better strategic capacity and broader benefits to NSW. We calculated significant NPV benefits over 20 years from a merger of the two councils.
Maitland and Dungog did not show that their proposals to stand alone were as good as, or better than, the merger option. In particular, given Dungog’s small and stagnant population, limited capacity to increase revenue and challenges in overcoming infrastructure backlogs, we consider a merger would strengthen the region’s ability to be fit for the future. Our analysis suggests the area in aggregate is likely to be better off with a merger. We calculated NPV benefits of an estimated $5 million over 20 years from a merger of the two councils.
Illawarra
In the Illawarra region, we find Wollongong City Council (Wollongong) is fit since it meets both the scale and capacity criterion and the financial criteria overall. The only option presented for Wollongong by the ILGRP is to remain a stand-alone council in the Illawarra JO, and its proposal is consistent with this option. In addition, Wollongong, Shellharbour, Shoalhaven and Kiama have successfully applied to form a pilot JO.
We find that Shellharbour City Council (Shellharbour) and Kiama Municipal Council (Kiama) are not fit. Both councils meet the scale and capacity criterion since their proposals are consistent with the option presented to stand-alone in an Illawarra JO. However, neither of these councils meet the financial criteria.
Shellharbour does not satisfy the financial criteria, primarily due to its operating performance ratio falling short of the benchmark in 2019-20. It forecasts operating deficits despite a relatively large rate increase over four years from 2013-14. A merger between Wollongong and Shellharbour could be explored, consistent with the ILGRP’s suggestion.
Kiama does not meet the financial criteria due to consistent operating deficits, despite a proposed SV to increase revenue by 17.4% over three years from 2018-19. It does not meet the efficiency criterion as it forecasts an increase in real operating expenditure per capita over time. This is partly due to plans for a new aged care facility which may be over extending the council financially.
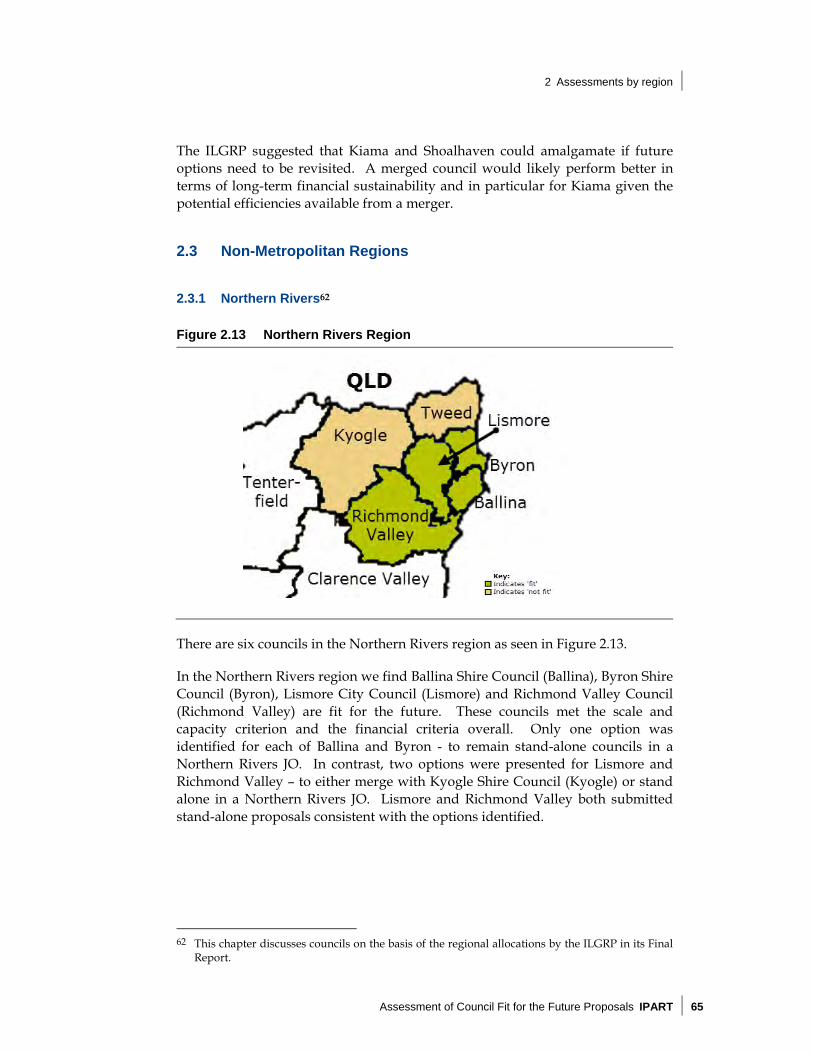
2 Assessments by region
Assessment of Council Fit for the Future Proposals IPART 65
The ILGRP suggested that Kiama and Shoalhaven could amalgamate if future options need to be revisited. A merged council would likely perform better in terms of long-term financial sustainability and in particular for Kiama given the potential efficiencies available from a merger.
2.3 Non-Metropolitan Regions
2.3.1 Northern Rivers62
Figure 2.13 Northern Rivers Region
There are six councils in the Northern Rivers region as seen in Figure 2.13.
In the Northern Rivers region we find Ballina Shire Council (Ballina), Byron Shire Council (Byron), Lismore City Council (Lismore) and Richmond Valley Council (Richmond Valley) are fit for the future. These councils met the scale and capacity criterion and the financial criteria overall. Only one option was identified for each of Ballina and Byron - to remain stand-alone councils in a Northern Rivers JO. In contrast, two options were presented for Lismore and Richmond Valley – to either merge with Kyogle Shire Council (Kyogle) or stand alone in a Northern Rivers JO. Lismore and Richmond Valley both submitted stand-alone proposals consistent with the options identified.
62 This chapter discusses councils on the basis of the regional allocations by the ILGRP in its Final
Report.
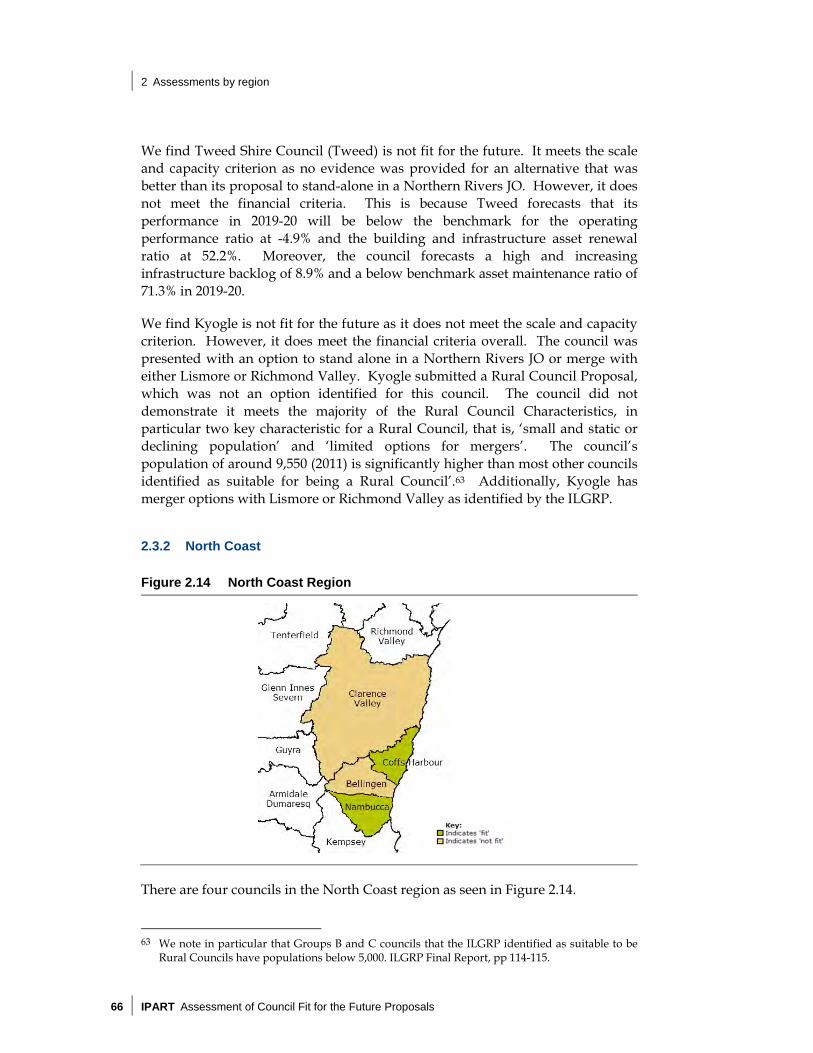
2 Assessments by region
66 IPART Assessment of Council Fit for the Future Proposals
We find Tweed Shire Council (Tweed) is not fit for the future. It meets the scale and capacity criterion as no evidence was provided for an alternative that was better than its proposal to stand-alone in a Northern Rivers JO. However, it does not meet the financial criteria. This is because Tweed forecasts that its performance in 2019-20 will be below the benchmark for the operating performance ratio at -4.9% and the building and infrastructure asset renewal ratio at 52.2%. Moreover, the council forecasts a high and increasing infrastructure backlog of 8.9% and a below benchmark asset maintenance ratio of 71.3% in 2019-20.
We find Kyogle is not fit for the future as it does not meet the scale and capacity criterion. However, it does meet the financial criteria overall. The council was presented with an option to stand alone in a Northern Rivers JO or merge with either Lismore or Richmond Valley. Kyogle submitted a Rural Council Proposal, which was not an option identified for this council. The council did not demonstrate it meets the majority of the Rural Council Characteristics, in particular two key characteristic for a Rural Council, that is, ‘small and static or declining population’ and ‘limited options for mergers’. The council’s population of around 9,550 (2011) is significantly higher than most other councils identified as suitable for being a Rural Council’.63 Additionally, Kyogle has merger options with Lismore or Richmond Valley as identified by the ILGRP.
2.3.2 North Coast
Figure 2.14 North Coast Region
There are four councils in the North Coast region as seen in Figure 2.14.
63 We note in particular that Groups B and C councils that the ILGRP identified as suitable to be
Rural Councils have populations below 5,000. ILGRP Final Report, pp 114-115.

2 Assessments by region
Assessment of Council Fit for the Future Proposals IPART 67
In the North Coast region, we find Coffs Harbour City Council (Coffs Harbour) and Nambucca Shire Council (Nambucca) are fit for the future. These councils meet the scale and capacity criterion and the financial criteria overall. The only option identified for each of the North Coast councils was to stand alone within a North Coast JO. These councils’ proposals are consistent with this option.
We find Clarence Valley Council (Clarence Valley) and Bellingen Shire Council (Bellingen) are not fit for the future. These councils meet the scale and capacity criterion as their proposals to stand-alone were consistent with the ILGRP’s identified option, however, they do not meet the financial criteria overall.
Clarence Valley proposes to increase rates by 34.0% above the rate peg over five years commencing in 2016-17. Despite this proposed rate increase, Clarence Valley forecasts it will have an operating performance ratio in 2019-20 of -5.7%, which is below the benchmark. Clarence Valley also does not meet the infrastructure backlog benchmark of 2% or lower.
Bellingen forecasts its operating performance ratio will be -7.2% in 2024-25, which is below the benchmark, despite proposing a SV from 2016-17 of 44% above the rate peg over nine years (69% including the rate peg). In addition, its building and asset renewal ratio is forecast to be below the 100% benchmark.
2.3.3 Mid North Coast
Figure 2.15 Mid North Coast Region
There are five councils in the Mid-North Coast region as seen in Figure 2.15.

2 Assessments by region
68 IPART Assessment of Council Fit for the Future Proposals
In the Mid-North Coast region, we find Great Lakes Council (Great Lakes) and Port Macquarie-Hastings Council (Port Macquarie) are fit for the future. These councils met the scale and capacity criterion as well as the financial criteria overall. Port Macquarie-Hastings was presented with only one option by the ILGRP – to stand-alone in a Mid-North Coast JO. Great Lakes was presented with an option to merge with Gloucester Shire Council (Gloucester) or to stand-alone in a Mid-North Coast JO. Great Lakes undertook a business case for a merger with Gloucester but considered it provided no financial benefit to the council.
We find Greater Taree Council (Greater Taree) and Kempsey Shire Council (Kempsey) are not fit for the future. These councils meet the scale and capacity criterion but not the financial criteria overall. Greater Taree was also presented with an option to merge with Gloucester or remain a stand-alone council in the Mid-North Coast JO. It considered the merger but found it would not be beneficial to its financial sustainability. Kempsey was presented with only an option to remain a stand-alone council in the Mid-North Coast JO. Both councils submitted a stand-alone proposal. Our analysis did not find sufficient evidence for a better alternative than the stand-alone option. However, both councils do not meet a number of the financial benchmarks. In particular, neither council meets the benchmark for the operating performance ratio which is a key financial sustainability benchmark. Both councils forecast a negative operating performance ratio in 2019-20, which is below the benchmark.
We find Gloucester is not fit for the future. The council does not meet the scale and capacity criterion nor the financial criteria overall. Our analysis suggests the council has insufficient scale to deliver services efficiently to its community and to partner effectively with government. The council’s population in 2011 was 5,000 and is forecast to decline to 4,850 by 2031. In addition, our analysis of the merger business case submitted by the council suggests a merger with Great Lakes may generate benefits to the local communities of $11 million over 20 years.64
Gloucester also does not satisfy the financial sustainability criterion. It forecasts an improvement in its operating performance ratio from -47.5% in 2014-15 to 6.1% in 2024-25. The improvement relies on the approval of a SV of 36.6% above the rate peg, from 2018-19. This would immediately follow a similarly large SV approved in 2015-16, which would amount to a cumulative rate increase over six years of 92% above the rate peg. The proposed increases are not considered a reasonable assumption and are unlikely to be in the public interest given the other options available to the council.
64 Gloucester and Great Lakes councils commissioned Morrison Low to undertake a business case
for a potential merger which returned an NPV of the costs and benefits of -$1 million. However, our analysis of this modelling suggests the merger may generate a positive NPV.

2 Assessments by region
Assessment of Council Fit for the Future Proposals IPART 69
2.3.4 New England
Figure 2.16 New England Region
There are seven councils in the New England region as seen in Figure 2.16.
In the New England region we find Glen Innes Severn Council (Glen Innes) and Inverell Shire Council (Inverell) are fit for the future. These councils meet the scale and capacity criterion and the financial criteria overall. The only option identified for each of these councils was to remain stand-alone councils within the New England JO. Both councils’ proposals are consistent with this option.
We find Armidale Dumaresq Council (Armidale), Tenterfield Shire Council (Tenterfield), Uralla Shire Council (Uralla) and Walcha Council (Walcha) are not fit for the future. Armidale does not meet the scale and capacity criterion nor the financial criteria overall. Uralla and Walcha do not meet the scale and capacity criterion but meet the financial criteria overall. Tenterfield meets the scale and capacity criterion but does not meet the financial criteria overall.
Armidale was presented with two options - a merger with Guyra Shire Council (Guyra) as the preferred option or to stand alone in a New England JO. Armidale’s proposal suggests it favours a merger with Guyra and Uralla, and possibly Walcha. As this option was not available and Guyra rejected a merger with Armidale, the council submitted a proposal to stand alone. We find Armidale’s stand-alone proposal is not as good as or better than the merger option with Guyra because there is limited evidence it could meet the elements of strategic capacity needed to stand-alone compared to the merger option.

2 Assessments by region
70 IPART Assessment of Council Fit for the Future Proposals
Uralla and Walcha were also presented with a preferred option to merge with each other. Uralla did not demonstrate its proposal to stand alone in a New England JO is as good as or better than the proposed merger. Walcha submitted a Rural Council Proposal but did not demonstrate its proposal is as good as or better than the merger. In particular, given Uralla and Walcha are exploring sharing services and staff, the merger potential between the councils is likely to be possible and beneficial. However, both councils meet the financial criteria overall.
Tenterfield was presented with only one option - to remain a stand-alone council in a New England JO. The council would prefer to stand alone within the Northern Rivers JO. We assessed it as meeting the scale and capacity criterion as its proposal is consistent with the identified option. However, it did not meet the financial criteria overall because:
Its operating performance ratio is -7.2% in 2014-15. To achieve the benchmark by 2024-25 it proposes a cumulative SV from 2018 over seven years of 31.5% above the rate peg (50.4% including the rate peg). In addition to an SV approved in 2014 of 43% above the rate peg, this assumption represents combined increases over 11 years of 99% above the rate peg, which we consider is unreasonable.
Even with this additional revenue it would not meet the infrastructure backlog ratio which is forecast to be 3.8% in 2019-20 which is above the benchmark of less than 2%.
With a small, stagnant population and a Socio-Economic Indexes for Areas rating in the bottom decile of the state, it has limited scope to increase its revenue to improve its financial performance.
We also find Guyra Shire Council (Guyra) is not fit as a Rural Council. The ILGRP identified two options for Guyra - a merger with Armidale or to stand alone in a New England JO. The merger option was preferred by the ILGRP. Guyra prefers to stand alone and submitted a Rural Council Proposal. The council does not meet some key Rural Council Characteristics, in particular in relation to the characteristics of having ‘limited options for mergers’ and a ‘long distance to a major (or sub) regional centre. As the council already outsources some functions to Armidale, a merger between Armidale and Guyra is feasible and likely to be beneficial. In addition, the council’s major centre (Guyra), with more than 50% of the LGA’s population, is close to Armidale (30 mins). Guyra did not demonstrate its proposal to stand-alone is as good as or better than the preferred merger option.
Guyra also does not meet the criterion for sustainability based on its forecasts for the operating performance ratio which depends on approval for a significant SV to take effect in 2016-17, as well as unrealistic depreciation assumptions. Using more realistic assumptions, Guyra’s operating performance ratio would be negative throughout the period to 2024-25.

2 Assessments by region
Assessment of Council Fit for the Future Proposals IPART 71
2.3.5 Namoi
Figure 2.17 Namoi Region
There are six councils in the Namoi region as seen in Figure 2.17.
In the Namoi region, we find Gunnedah Council (Gunnedah), Moree Plains Council (Moree Plains), Narrabri Council (Narrabri), and Tamworth Regional Council (Tamworth), are fit for the future. All of these councils meet the scale and capacity criterion as well as the financial criteria overall. The ILGRP presented only a stand-alone option for Gunnedah, Narrabri and Tamworth and these councils’ proposals were consistent with this option. It presented two options for Moree Plains to either merge with Gwydir Council (Gwydir) or to stand alone, but neither option was preferred. Moree Plains discussed a merger with Gwydir but did not pursue it. The council meets the scale and capacity criterion as there was insufficient evidence for a better alternative than the stand-alone option.
We find Gwydir and Liverpool Plains Council (Liverpool Plains) are not fit. We consider Gwydir is not fit, as it does not meet the scale and capacity criterion nor the financial criteria overall. In particular, Gwydir’s small, declining and aging population, which is forecast to fall by 1% a year to 4,200 by 203165, is unlikely to be sufficient to support a stand-alone council. Gwydir also has a weak financial position with large operating deficits. Gwydir has proposed a relatively large rate increase of 29.8% above the rate peg over one year and reducing service levels to improve its financial position. However, our analysis finds the council is unlikely to be sustainable in the long term as a stand-alone council.
65 DP&E.

2 Assessments by region
72 IPART Assessment of Council Fit for the Future Proposals
We find Liverpool Plains is not fit, as it does not meet the scale and capacity criterion. Its small population (forecast to reach 7,950 in 2031)66 is likely to affect the council’s future strategic capacity. Further, the council does not appear to have a robust revenue base and its resources to cope with complex and unexpected change appear limited. The council also did not fully explore a merger with Gunnedah, which could have improved its scale and capacity. However, Liverpool Plains meets the financial criteria overall, provided it successfully applies for and implements its proposed SV of 11.4% above the rate peg from 2017-18.
2.3.6 Orana
Figure 2.18 Orana Region
There are eight councils in the Orana region as seen in Figure 2.18.
In the Orana region, we find Dubbo City Council (Dubbo) is fit for the future. The council meets the scale and capacity criterion as well as the financial criteria overall. Dubbo was presented with an option to merge with Wellington and/or Narromine or to stand alone, but neither option was preferred by the ILGRP. Dubbo explored a merger but did not pursue it. However, as Dubbo’s proposal is consistent with the options identified, we find it meets the scale and capacity criterion.
66 DP&E.

2 Assessments by region
Assessment of Council Fit for the Future Proposals IPART 73
In this region, we also find Bogan Shire Council (Bogan), Coonamble Council (Coonamble), Gilgandra Shire Council (Gilgandra) and Warren Shire Council (Warren) are fit as Rural Councils. These councils were presented with options to merge or become a Rural Council in the Orana JO, but no preference was identified by the ILGRP. These councils’ proposals to become Rural Councils are consistent with the options presented and they met the financial criteria overall. However, should a Rural Council Model not be adopted by Government, these councils would likely be found not fit against the scale and capacity criterion.
We find Warrumbungle Shire Council (Warrumbungle) is not fit for the future. It meets the scale and capacity criterion as its proposal was consistent with the only option presented by the ILGRP - to remain a stand-alone council in the Orana JO. However, the council does not meet the financial criteria overall, in particular it does not meet the benchmark for the operating performance ratio. The council forecasts its operating performance ratio would reach 0.1% by 2024-25 to meet the benchmark, based on an assumption that FAGs would increase by $1 million in 2017-18 which our analysis indicates is not reasonable. Our revised estimate suggests the operating performance ratio will be -2.2% in 2024-25 which does not meet the benchmark. The council also does not meet the criterion for efficiency based on our estimate of an increasing real opex per capita over time.
We find Narromine Shire Council (Narromine) and Wellington Council (Wellington) are not fit for the future. These councils do not meet the scale and capacity criterion although they meet the financial criteria overall. We find they are not fit as stand-alone councils primarily due to their low populations which are forecast to decline to 6,300 and 8,100 by 2031 respectively. Our analysis suggests the councils’ relative size could restrict their regional capacity and place them at risk of becoming unsustainable.
As noted above, a potential merger between Dubbo, Wellington and Narromine was identified as an option to explore by the ILGRP because of the close functional inter-relationships between a regional centre (ie, Dubbo) and adjoining council areas (Narromine and Wellington).67 The councils undertook some evaluation of a merger, however, did not pursue this option.
67 ILGRP Final Report, p 85.
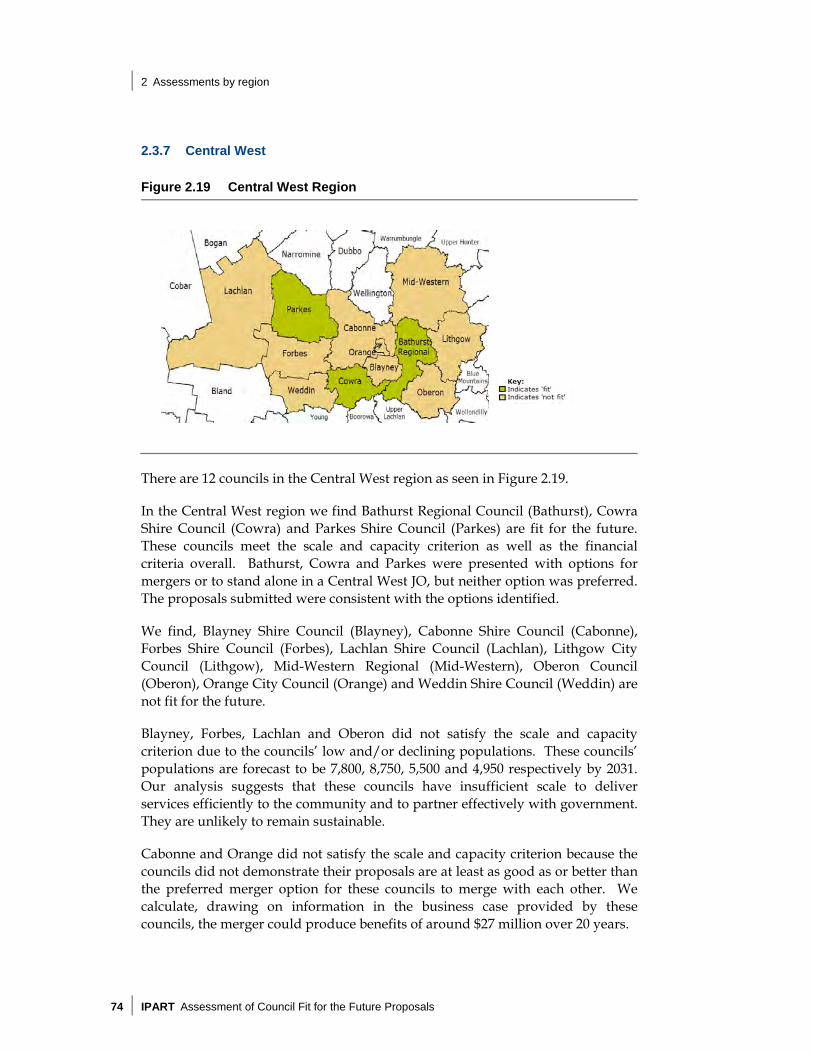
2 Assessments by region
74 IPART Assessment of Council Fit for the Future Proposals
2.3.7 Central West
Figure 2.19 Central West Region
There are 12 councils in the Central West region as seen in Figure 2.19.
In the Central West region we find Bathurst Regional Council (Bathurst), Cowra Shire Council (Cowra) and Parkes Shire Council (Parkes) are fit for the future. These councils meet the scale and capacity criterion as well as the financial criteria overall. Bathurst, Cowra and Parkes were presented with options for mergers or to stand alone in a Central West JO, but neither option was preferred. The proposals submitted were consistent with the options identified.
We find, Blayney Shire Council (Blayney), Cabonne Shire Council (Cabonne), Forbes Shire Council (Forbes), Lachlan Shire Council (Lachlan), Lithgow City Council (Lithgow), Mid-Western Regional (Mid-Western), Oberon Council (Oberon), Orange City Council (Orange) and Weddin Shire Council (Weddin) are not fit for the future.
Blayney, Forbes, Lachlan and Oberon did not satisfy the scale and capacity criterion due to the councils’ low and/or declining populations. These councils’ populations are forecast to be 7,800, 8,750, 5,500 and 4,950 respectively by 2031. Our analysis suggests that these councils have insufficient scale to deliver services efficiently to the community and to partner effectively with government. They are unlikely to remain sustainable.
Cabonne and Orange did not satisfy the scale and capacity criterion because the councils did not demonstrate their proposals are at least as good as or better than the preferred merger option for these councils to merge with each other. We calculate, drawing on information in the business case provided by these councils, the merger could produce benefits of around $27 million over 20 years.
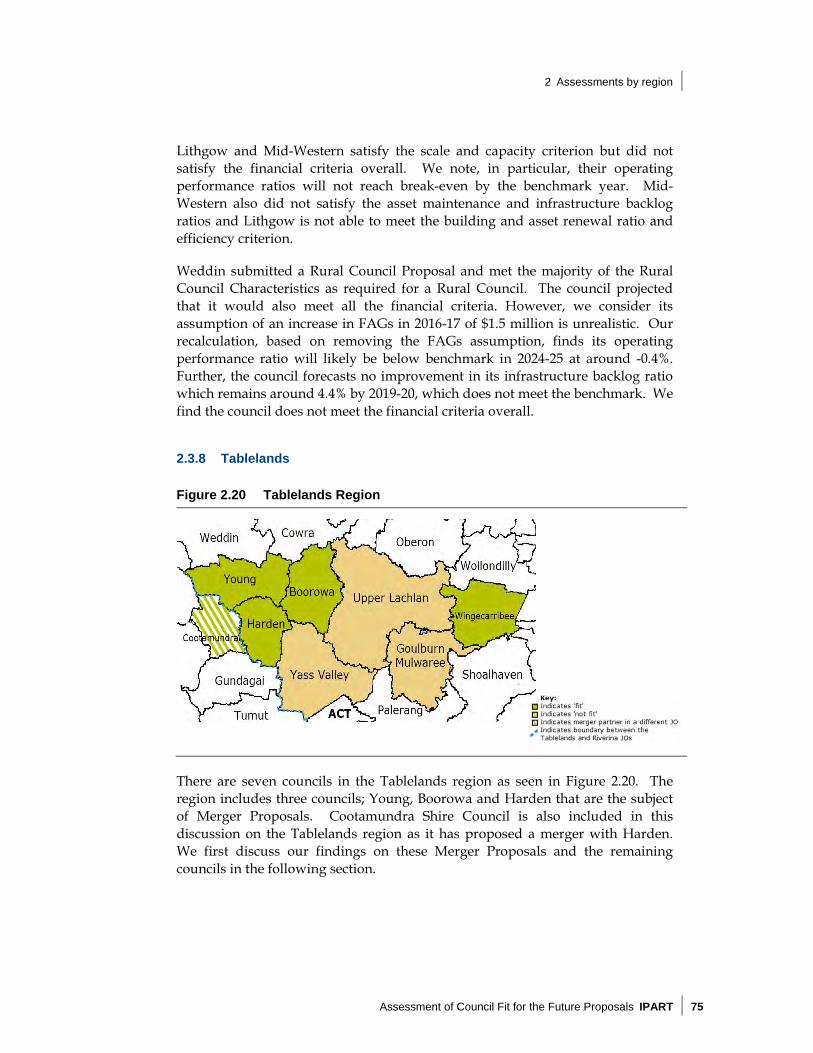
2 Assessments by region
Assessment of Council Fit for the Future Proposals IPART 75
Lithgow and Mid-Western satisfy the scale and capacity criterion but did not satisfy the financial criteria overall. We note, in particular, their operating performance ratios will not reach break-even by the benchmark year. Mid-Western also did not satisfy the asset maintenance and infrastructure backlog ratios and Lithgow is not able to meet the building and asset renewal ratio and efficiency criterion.
Weddin submitted a Rural Council Proposal and met the majority of the Rural Council Characteristics as required for a Rural Council. The council projected that it would also meet all the financial criteria. However, we consider its assumption of an increase in FAGs in 2016-17 of $1.5 million is unrealistic. Our recalculation, based on removing the FAGs assumption, finds its operating performance ratio will likely be below benchmark in 2024-25 at around -0.4%. Further, the council forecasts no improvement in its infrastructure backlog ratio which remains around 4.4% by 2019-20, which does not meet the benchmark. We find the council does not meet the financial criteria overall.
2.3.8 Tablelands
Figure 2.20 Tablelands Region
There are seven councils in the Tablelands region as seen in Figure 2.20. The region includes three councils; Young, Boorowa and Harden that are the subject of Merger Proposals. Cootamundra Shire Council is also included in this discussion on the Tablelands region as it has proposed a merger with Harden. We first discuss our findings on these Merger Proposals and the remaining councils in the following section.

2 Assessments by region
76 IPART Assessment of Council Fit for the Future Proposals
Merger Proposals included in Tablelands - Boorowa and Young; Harden and Cootamundra
Figure 2.21 Boorowa/Young and Harden/Cootamundra Merger Proposals
The ILGRP indicated a preferred ‘Hilltops’ merger option between Young, Boorowa and Harden. Young and Boorowa submitted a three-way Merger Proposal without the endorsement of Harden. We have assessed the two-way Merger Proposal between Young and Boorowa based on the available information in the proposal.
Harden endorsed and submitted a Merger Proposal with Cootamundra from the Riverina region rather than with Young and Boorowa. Cootamundra was given options to stand alone within a Riverina JO or to merge with Junee Shire Council (Junee). Neither option was preferred by the ILGRP.
We find the Young-Boorowa Merger Proposal is fit for the future. We find that this merger satisfies the scale and capacity criterion and the financial criteria overall. Our reasons for this assessment are that:
The proposed merger population is projected to be consistent with the ILGRP’s rule of thumb of close to or above 10,000 for non-metropolitan council populations by 2031.
The merger will provide better ability to employ a wider range of skilled staff, more effective regional collaboration and credibility for more effective advocacy than each council as stand-alone councils.
The merger is superior to each council as stand-alone councils based on the efficiencies and cost savings highlighted in the business case. We calculate the merger would generate net present value benefits of $31 million over 20 years, based on the LKS Quaero’s business case for the councils.
It is the best option available to the councils, given the preferred option is unable to be proposed without Harden’s consent.

2 Assessments by region
Assessment of Council Fit for the Future Proposals IPART 77
Young and Boorowa’s merger proposal is contingent on the inclusion of Harden. Further, Boorowa resolved to not support a two-way merger with Young. Therefore, our assessment of fit is dependent on Young and Boorowa resolving to merge in the absence of Harden. In the event agreement cannot be reached, we find the councils are deemed not fit, as they have not demonstrated scale and capacity as stand-alone councils.
We find the Cootamundra-Harden Merger Proposal is fit for the future as it satisfies the scale and capacity criterion and the financial criteria overall. Our reasons for this assessment are that:
The community consultation supported the proposed merger and there are likely to be communities of interest.
The proposed population is projected to be consistent with the ILGRP’s rule of thumb of close to or above 10,000 for non-metropolitan council populations by 2031.
The merger is superior to each council as stand-alone councils based on the efficiencies and cost savings highlighted in the business case. We calculate the merger would generate net present benefits of about $11 million over 20 years.
The councils’ proposal appears to be based on improving service delivery or the suite of services provided rather than reducing costs. This has not been captured in the business case, but would further benefit the community.
Young’s next preferred option for a merger includes expanding the proposed ‘Hilltops’ merger to include Cootamundra. However, Cootamundra has rejected this option on the basis that it changes the focus of Cootamundra and the southern half of Harden away from the Riverina region. Based on the information provided by the councils we consider a four-way merger between Young, Boorowa, Harden and Cootamundra is likely to deliver larger gains to the community than the current two Merger Proposals.
Other Tableland Councils
Among the other councils in the Tablelands region, we find Wingecarribee Shire Council (Wingecarribee) is fit for the future, as it meets the scale and capacity criterion as well as the financial criteria overall. The ILGRP identified only one option for Wingecarribee - to remain a stand-alone council in the Tablelands JO, and the council’s proposal was consistent with this option. The council has a proposed SV from 2016-17 of 41% over four years (around 30.8% above the rate peg) which enables it to just meet the benchmark for the operating performance ratio.

2 Assessments by region
78 IPART Assessment of Council Fit for the Future Proposals
We find Goulburn Mulwaree Council (Goulburn), Upper Lachlan Shire Council (Upper Lachlan) and Yass Valley Council (Yass Valley) are not fit. The ILGRP identified only one option for Goulburn and Yass Valley - to remain stand-alone councils in the Tablelands JO. However, Upper Lachlan had the option to stand-alone or to merge with Goulburn with no ILGRP preference indicated for either option.
We find that while Goulburn’s proposal to stand alone is consistent with the option identified for the council, it does not meet the financial criteria overall. In particular, its operating performance ratio of -4.3% in 2019-20 could affect its continued ability to provide services to its community. We find that Goulburn is not financially sustainable despite its current and proposed strategies for improvement.
Goulburn considered a merger with Upper Lachlan Shire. We find that Goulburn’s forecast 2031 population of 33,550 represents 86% of a possible merger, which would provide strategic capacity to Upper Lachlan. The council notes it held discussions in relation to a possible amalgamation with all neighbouring councils but that each council decided to stand alone.
We find Upper Lachlan is not fit, as it does not meet the scale and capacity criterion although it meets the financial criteria overall. Its projected population in 2031 of 7,500 suggests the council may be at risk of becoming unsustainable which may affect its future strategic capacity. Further, the council’s relative size means it is unlikely to be able to undertake major projects of regional or state significance.
Yass Valley’s stand-alone proposal was consistent with the identified option and therefore meets the scale and capacity criterion, but it does not meet the financial criteria as it has a weak financial position. We note that even with a proposed SV of 37.2% above the rate peg over five years, its operating performance ratio falls below the benchmark in the assessment period. Its infrastructure backlog ratio also does not meet the benchmark by 2019-20. However, the council has adequate own source revenue relative to the 60% benchmark, and is funding asset maintenance to stabilise the infrastructure backlog, which provides a basis for future improvement.

2 Assessments by region
Assessment of Council Fit for the Future Proposals IPART 79
2.3.9 Riverina
Figure 2.22 Riverina Region
There are 10 councils in the Riverina region as seen in Figure 2.22.
In the Riverina region we find Wagga Wagga City Council (Wagga) is fit for the future as a stand-alone council. The council was presented with two options - to merge with Lockhart Shire Council (Lockhart) or to stand alone in a Riverina JO, but neither option was preferred. Wagga and Lockhart did not undertake a robust or detailed analysis of a merger, but, as the proposals were consistent with the options identified we assessed them as meeting the scale and capacity criterion. However, Wagga has forecast operating deficits in the short term and only just meets the benchmark for the operating performance ratio by 2019-20 at 1.2%, which is assisted by a proposed SV in 2016-17 of 4.1% (6.6% including the rate peg). Additionally, it does not satisfy the infrastructure and service management criterion. While it meets the financial criteria overall, Wagga could make some improvements in its financial performance, particularly in relation to the management of its assets.
We find Coolamon Shire Council (Coolamon), Lockhart and Tumbarumba Shire Council (Tumbarumba) are fit as Rural Councils. These councils’ proposals were consistent with the options presented, met the majority of the Rural Council Characteristics and met the financial criteria overall. However, should a Rural Council Model not be adopted by Government, these councils would likely be found not fit against the scale and capacity criterion.
We find Bland Shire Council (Bland), Gundagai Shire Council (Gundagai), Junee Shire Council (Junee), Temora Shire Council (Temora), and Tumut Shire Council (Tumut) not fit for the future.
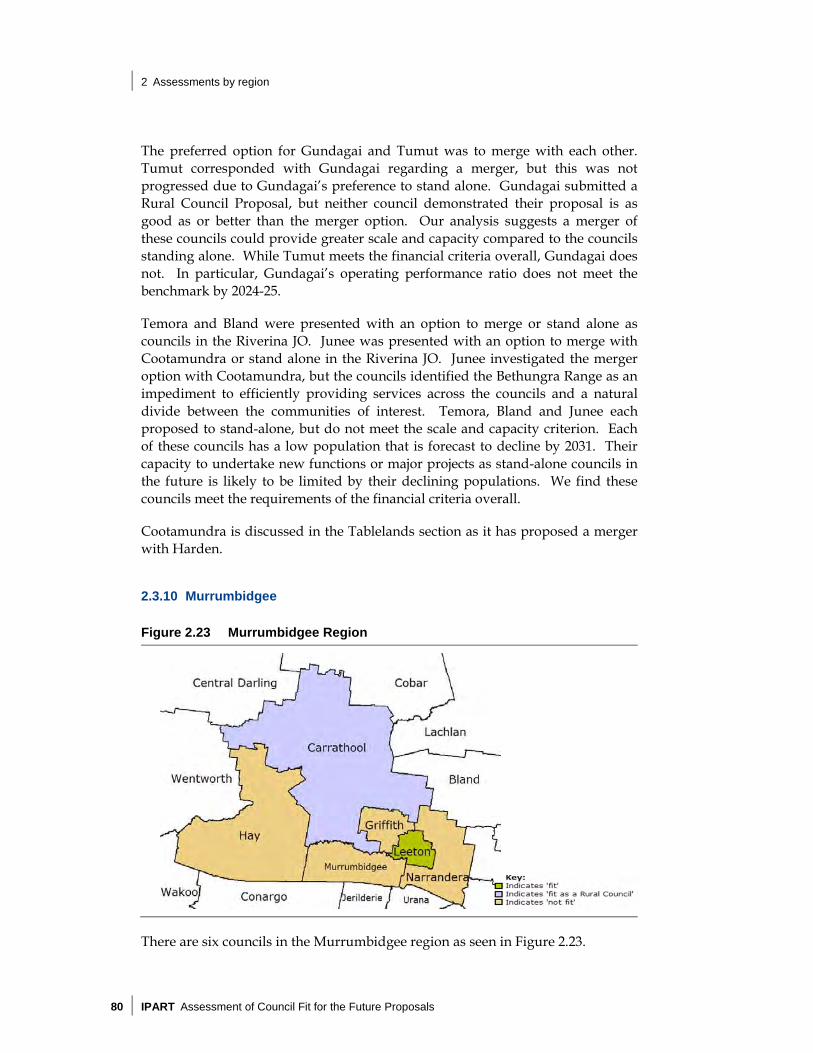
2 Assessments by region
80 IPART Assessment of Council Fit for the Future Proposals
The preferred option for Gundagai and Tumut was to merge with each other. Tumut corresponded with Gundagai regarding a merger, but this was not progressed due to Gundagai’s preference to stand alone. Gundagai submitted a Rural Council Proposal, but neither council demonstrated their proposal is as good as or better than the merger option. Our analysis suggests a merger of these councils could provide greater scale and capacity compared to the councils standing alone. While Tumut meets the financial criteria overall, Gundagai does not. In particular, Gundagai’s operating performance ratio does not meet the benchmark by 2024-25.
Temora and Bland were presented with an option to merge or stand alone as councils in the Riverina JO. Junee was presented with an option to merge with Cootamundra or stand alone in the Riverina JO. Junee investigated the merger option with Cootamundra, but the councils identified the Bethungra Range as an impediment to efficiently providing services across the councils and a natural divide between the communities of interest. Temora, Bland and Junee each proposed to stand-alone, but do not meet the scale and capacity criterion. Each of these councils has a low population that is forecast to decline by 2031. Their capacity to undertake new functions or major projects as stand-alone councils in the future is likely to be limited by their declining populations. We find these councils meet the requirements of the financial criteria overall.
Cootamundra is discussed in the Tablelands section as it has proposed a merger with Harden.
2.3.10 Murrumbidgee
Figure 2.23 Murrumbidgee Region
There are six councils in the Murrumbidgee region as seen in Figure 2.23.

2 Assessments by region
Assessment of Council Fit for the Future Proposals IPART 81
In the Murrumbidgee region, we find Leeton Shire Council (Leeton) is fit for the future as it meets the scale and capacity criterion and financial criteria overall. The council was presented with two options – a merger with Narrandera Shire Council (Narrandera) or to remain a stand-alone council in a Murrumbidgee JO. Neither option was preferred by the ILGRP. Leeton investigated a merger with Narrandera but did not pursue it as it considered there was little benefit based on the results of the business case it commissioned. It submitted a stand-alone proposal which was consistent with the identified options.
We find Carrathool Shire Council (Carrathool) is fit as a Rural Council. It meets most of the Rural Council Characteristics, has proposed some improvement strategies and met the financial criteria overall. Carrathool was presented with two options – to merge with Griffith or become a Rural Council in a Murrumbidgee JO. It ruled out the merger as a large majority of the community preferred the council to stand alone. However, should a Rural Council Model not be adopted by Government, Carrathool would likely be found not fit against the scale and capacity criterion.
We find Griffith City Council (Griffith), Murrumbidgee Shire Council (Murrumbidgee), Hay Shire Council (Hay) and Narrandera Shire Council (Narrandera) not fit for the future.
Griffith and Murrumbidgee do not meet the scale and capacity criterion as they did not sufficiently explore the preferred option for these councils to merge. The councils indicated a discussion on the merger was held, but no agreement was reached to explore the merger. Further Murrumbidgee’s proposal to be a Rural Council did not satisfy the majority of the Rural Council Characteristics.
The ILGRP identified only one option for Hay, which was to be a Rural Council in a Murrumbidgee JO. Its Rural Council Proposal met most of the Rural Council Characteristics, but it does not meet the financial criteria overall. In particular, we consider the improvement to its operating performance ratio is based on optimistic assumptions. The council has a high dependence on FAGs and the Federal Roads to Recovery Grant to deliver a break even result by the benchmark year of 2024-25 for Rural Councils. The council assumes that these federal grants would not only continue, but increase in real terms in the future even though its population is forecast to decline. It forecasts a small operating surplus by 2024-25, but our adjusted estimates forecast a deficit of -0.4% which does not meet the benchmark.
We find Narrandera does not meet the scale and capacity criterion as our analysis indicates its proposed improvements are not sufficient for achieving long term sustainability. In particular, its low population which is forecast to decline to 4,950 in 2031, is unlikely to be sufficient to support a stand-alone council and may affect its future strategic capacity.68 68 NSW Department of Planning and Environment, New South Wales State and Local Government
Area Population Projections 2014.

2 Assessments by region
82 IPART Assessment of Council Fit for the Future Proposals
However, Griffith, Murrumbidgee and Narrandera meet the financial criteria overall, based on forecast modest surpluses to meet the benchmark for the operating performance ratio. This is assisted by an SV in 2017-18 and 2018-19 proposed by Murrumbidgee and by sustainability strategies and improvements proposed by Griffith and Narrandera. We note that each council has reviewed its asset management strategy to achieve the infrastructure and service management ratios, but faces challenges in meeting the efficiency benchmark largely due to declining populations in the area.
2.3.11 Mid-Murray
Figure 2.24 Mid-Murray Region
There are six councils in the Mid-Murray region as seen in Figure 2.24.
In the Mid-Murray region we find Wakool Shire Council (Wakool) fit as a Rural Council. The council meets most of the Rural Council Characteristics, has proposed strategies for improvement, which it forecasts will provide annual savings/revenue of $432,000 a year by 2019-20 and met the financial criteria overall. However, should a Rural Council Model not be adopted by Government, Wakool would likely be found not fit against the scale and capacity criterion.
We find Berrigan Shire Council (Berrigan), Conargo Shire Council (Conargo), Deniliquin Council (Deniliquin), Jerilderie Shire Council (Jerilderie) and Murray Shire Council (Murray) are not fit for the future. These councils do not meet the scale and capacity criterion although Berrigan and Conargo meet the financial criteria overall. Jerilderie does not meet the financial criteria overall.
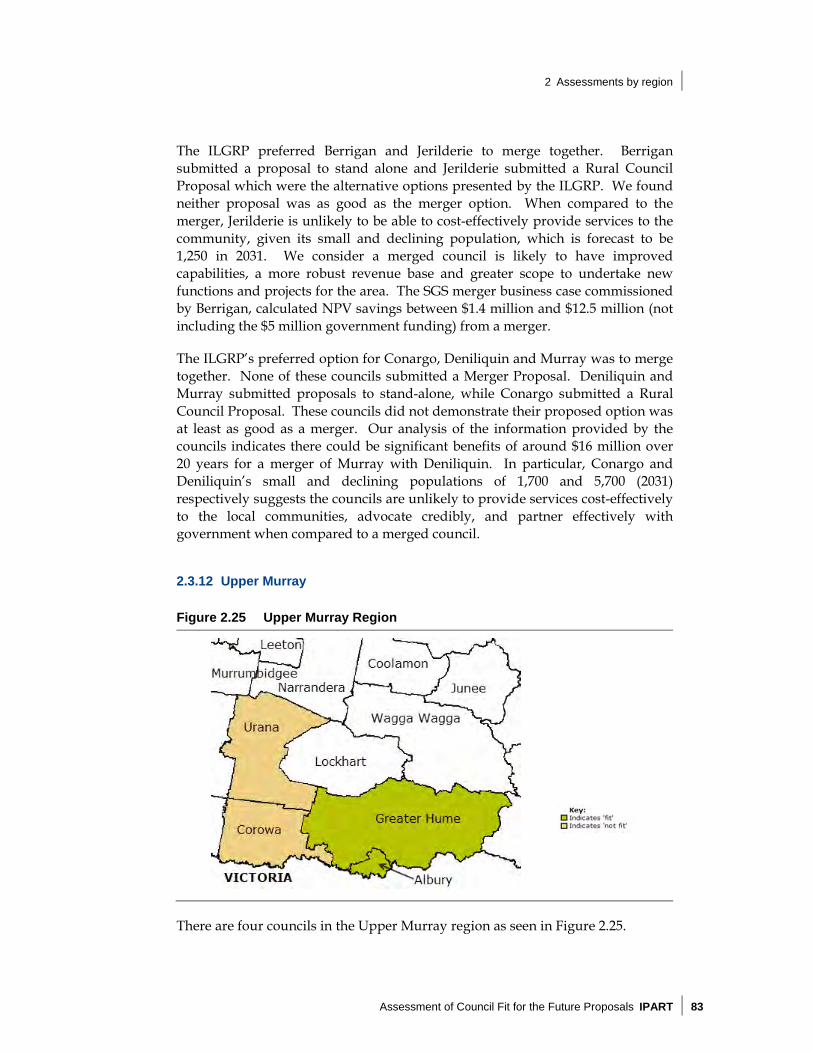
2 Assessments by region
Assessment of Council Fit for the Future Proposals IPART 83
The ILGRP preferred Berrigan and Jerilderie to merge together. Berrigan submitted a proposal to stand alone and Jerilderie submitted a Rural Council Proposal which were the alternative options presented by the ILGRP. We found neither proposal was as good as the merger option. When compared to the merger, Jerilderie is unlikely to be able to cost-effectively provide services to the community, given its small and declining population, which is forecast to be 1,250 in 2031. We consider a merged council is likely to have improved capabilities, a more robust revenue base and greater scope to undertake new functions and projects for the area. The SGS merger business case commissioned by Berrigan, calculated NPV savings between $1.4 million and $12.5 million (not including the $5 million government funding) from a merger.
The ILGRP’s preferred option for Conargo, Deniliquin and Murray was to merge together. None of these councils submitted a Merger Proposal. Deniliquin and Murray submitted proposals to stand-alone, while Conargo submitted a Rural Council Proposal. These councils did not demonstrate their proposed option was at least as good as a merger. Our analysis of the information provided by the councils indicates there could be significant benefits of around $16 million over 20 years for a merger of Murray with Deniliquin. In particular, Conargo and Deniliquin’s small and declining populations of 1,700 and 5,700 (2031) respectively suggests the councils are unlikely to provide services cost-effectively to the local communities, advocate credibly, and partner effectively with government when compared to a merged council.
2.3.12 Upper Murray
Figure 2.25 Upper Murray Region
There are four councils in the Upper Murray region as seen in Figure 2.25.

2 Assessments by region
84 IPART Assessment of Council Fit for the Future Proposals
In the Upper Murray region, we find Albury City Council (Albury) and Greater Hume Shire Council (Greater Hume) are fit for the future. These councils meet the scale and capacity criterion as well as the financial criteria. Two options were identified for these councils – to stand-alone in an Upper Murray JO, or for Albury and Greater Hume to merge in-part or in full. Albury strongly opposes further amalgamations and this view appears to have influenced Greater Hume’s proposal. Both Albury and Greater Hume submitted proposals to stand-alone and did not explore the merger option. Both councils’ proposals are consistent with the identified options.
We find Corowa Shire Council (Corowa) and Urana Shire Council (Urana) are not fit for the future. These councils did not meet the scale and capacity criterion, although they met the financial criteria overall. The two options identified for Corowa and Urana were to merge or to stand-alone in an Upper Murray JO, but the merger of the two councils was preferred. The councils’ proposals to stand-alone did not demonstrate they were at least as good as a merger.
We consider Corowa made an effort to explore merger options with neighbouring councils. In the absence of willing partners, Corowa did not undertake a business case for the merger option and resolved to stand-alone. Corowa’s population is forecast to decline by 0.2% a year from 2011 to 2031. Our analysis shows a merged council would yield a modest improvement in scale and capacity relative to Corowa’s current performance.
Urana’s business case focused on the council becoming a Rural Council in a Riverina JO and it is currently a member of the pilot Riverina JO. Urana’s population of 1,200 in 2011 is forecast to fall by a third to 800 by 2031. This is unlikely to be sufficient to support a stand-alone council. Urana proposes a cumulative SV of 63.1% above the rate peg over four years from 2016-17 to improve its financial sustainability. Its declining population means it will increasingly rely on rate increases to maintain its operations because of its small scale. We consider a merger with Corowa as preferred by the ILGRP would provide scale and capacity for Urana and would improve the system of local government in the area.

2 Assessments by region
Assessment of Council Fit for the Future Proposals IPART 85
2.3.13 South East
Figure 2.26 South East Region
There are eight councils in the South East region as seen in Figure 2.26.
In the South East region we find Bega Valley Shire Council (Bega), Eurobodalla Shire Council (Eurobodalla) and Shoalhaven City Council (Shoalhaven) fit for the future. These councils were presented with only one option - to remain stand-alone councils in the South East JO - and the councils’ proposals were consistent with this option.69 Bega, Eurobodalla and Shoalhaven also meet the financial criteria overall. However, Shoalhaven meeting the sustainability criterion is contingent on the approval of an assumed rate increase of 21% (15.9% above the rate peg) over two years.
We find Bombala Council (Bombala), Cooma-Monaro Shire Council (Cooma), Palerang Council (Palerang), Queanbeyan City Council (Queanbeyan) and Snowy River Shire Council (Snowy River) not fit, as they do not meet the scale and capacity criterion. Further, Cooma and Snowy River do not meet the financial criteria overall.
Bombala and Cooma were presented with a preferred option to merge with each other, with a secondary option to stand alone in the South East JO (as a Rural Council for Bombala).70 Snowy River was presented with the options to merge with Cooma/ Bombala or stand alone in the South East JO. These councils jointly commissioned a business case for a three-council merger, but decided not
69 We note Shoalhaven may not be part of a future South East JO as it is currently part of the pilot
Illawarra JO with Kiama, Wollongong and Shellharbour. 70 We note Cooma has indicated it intends to seek State Government approval to join the Canberra
Region JO (CBRJO) rather than the South East JO. The CBRJO currently has 12 member councils plus the ACT Government and excludes Shoalhaven and Bega.

2 Assessments by region
86 IPART Assessment of Council Fit for the Future Proposals
to pursue it, preferring to stand alone and adopt a shared services option. Cooma and Snowy River submitted Council Improvement Proposals, while Bombala submitted a Rural Council Proposal.
We consider a merger between Bombala, Cooma and Snowy River could assist to improve regional collaboration, advocacy, and planning and enable more effective partnerships with state and federal government. Our analysis of the business case, using information provided by the councils, shows there could be benefits of $22 million over 20 years on a NPV basis. Additionally, each council’s small population (below 10,000), may affect its longer term strategic capacity and financial sustainability as stand-alone councils. Cooma and Snowy River did not demonstrate that standing alone would be as good as, or better than, a merger. Bombala meets most of the Rural Council Characteristics, however we assess standing alone as a Rural Council is not as good as, or better than, the preferred merger with Cooma. As a result, for these reasons, we assess Cooma, Snowy River and Bombala as not meeting the scale and capacity criterion.
We find Bombala meets the financial criteria but Cooma and Snowy River do not. Both Cooma and Snowy River have assumed the approval of large SVs to assist in meeting the financial benchmarks, in particular the operating performance ratio benchmark. In both cases, we consider this may not be a reasonable assumption, based on the magnitude of the proposed SVs.
In relation to Palerang and Queanbeyan, we consider a merger would provide greater benefits for Palerang and Queanbeyan, than each council standing alone. Our analysis suggests that, using the information in the business case jointly commissioned by Palerang and Queanbeyan, a merger would provide benefits of $51 million in NPV terms over 20 years. We also assess a merger would improve regional collaboration, operational efficiencies and longer term financial sustainability for Palerang. Queanbeyan has proposed a ‘Regional Services Model’, which would involve the provision of back office functions for Palerang and a coordinating leadership role for neighbouring councils. However, this model was not supported by Palerang or acknowledged by other neighbouring councils. We also consider this model is unlikely to generate the same level of benefits as the preferred merger.
Both Palerang and Queanbeyan were assessed as meeting the financial criteria overall. However, we note Palerang meeting the sustainability criterion is based on the approval of an SV of 24% above the rate peg over five years (40% including the rate peg). In addition, Queanbeyan meeting the financial criteria is based on the assumption of transitioning to its Regional Services Model, which it has assumed would include significant efficiency gains and a revised organisational structure.

3 Monitoring and reporting of FFTF projections
Assessment of Council Fit for the Future Proposals IPART 87
3 Monitoring and reporting of FFTF projections
This chapter sets out issues relating to the monitoring and reporting of councils’ FFTF projections following our assessment process.
3.1 Monitoring and reporting process
Becoming a FFTF council is a process that will take time, particularly if structural change is proposed. There are also benefits from assessing a council’s performance over time to ensure continued financial sustainability and effective and efficient service delivery.
As discussed in Chapter 1, most councils have proposed a range of strategies to improve their performance in their proposals. The assessment of whether a council is fit has been predicated on the assumption these strategies would be implemented. In some instances, these strategies will require significant change to implement new structures, approaches, and functions which may be challenging and require an extended transition period.
The NSW Government has indicated that strengthening the audit requirements for the local government sector will assist to identify trends and opportunities for improvement.71 The Government has also noted it recognises the potential value in giving the Auditor-General responsibility for the audit of councils’ financial statements to:
improve quality, consistency, timeliness and financial management more generally, and
ensure the provision of reliable data that can be used for sustainability assessments and benchmarking.
71 OLG, NSW Government Response – Independent Local Government Review Panel recommendation –
Local Government Acts Taskforce recommendations, September 2014, p 8.

3 Monitoring and reporting of FFTF projections
88 IPART Assessment of Council Fit for the Future Proposals
OLG expects to implement this new regime following further consultation with the local government sector and legislative change.72 OLG is currently developing a new performance measurement framework to help communities understand how well their council is performing.73
In response to our Consultation Paper, various stakeholders made a number of suggestions regarding how the auditing process for FFTF performance should be implemented. Stakeholders generally considered this should occur:
after other sector reforms are implemented, including the Integrated Planning and Reporting (IP&R) Guidelines and legislative reforms, and
with established performance guidelines, developed in consultation with the sector.74
Other stakeholders noted:
auditing should not commence until there is a review of the most appropriate asset-related measures to report on
there should be reporting of council skill levels, and
any monitoring should have a positive focus, like the Promoting Better Practice Program.
3.1.1 Proposed monitoring and reporting process
Following the assessment process, the monitoring and reporting of councils’ performance against their FFTF proposals could operate as follows:
Councils would report their performance in their Annual Reports.75
OLG would monitor councils’ performance. Councils’ FFTF projections and performance against these projections will be collected annually by OLG.76 The performance of councils would be publicly reported each year by OLG.77
The Auditor-General would be empowered to undertake performance audits of the NSW local government sector.78
72 OLG, NSW Government Response – Independent Local Government Review Panel recommendation –
Local Government Acts Taskforce recommendations, September 2014, pp 4-8. 73 OLG, Local Government Performance Measurement Framework at:
http://www.olg.nsw.gov.au/strengthening-local-government/supporting-and-advising-councils/local-government-performance-measurement-framework, accessed on 7 October 2015.
74 A number of submissions including metropolitan and regional councils, some ROCs and an Engineering Association.
75 Councils are required to report their financial performance in their Annual Report. See: OLG, 2013, Strengthening councils and communities: Discussion Paper, November 2013, pp 4-5.
76 OLG has requested councils’ provide their FFTF projections and financial performance against these projections in its financial data collection for 2014-15.
77 OLG undertakes reporting of council performance each year in the ‘Your Council’ report. 78 OLG, NSW Government Response – Independent Local Government Review Panel recommendation –
Local Government Acts Taskforce recommendations, September 2014, p 8.

3 Monitoring and reporting of FFTF projections
Assessment of Council Fit for the Future Proposals IPART 89
OLG is currently working with the Audit Office of NSW to facilitate the implementation of the audit function.79 The scope of audits would need to be clearly defined to ensure the costs do not exceed the benefits.
The implications of the assessments and of a council not meeting its FFTF projections will be matters for the NSW Government.
79 Ibid.


3 Monitoring and reporting of FFTF projections
Assessment of Council Fit for the Future Proposals IPART
9
Appendices

3 Monitoring and reporting of FFTF projections
92 IPART Assessment of Council Fit for the Future Proposals

A Terms of reference
Assessment of Council Fit for the Future Proposals IPART 93
A Terms of reference

A Terms of reference
94 IPART Assessment of Council Fit for the Future Proposals
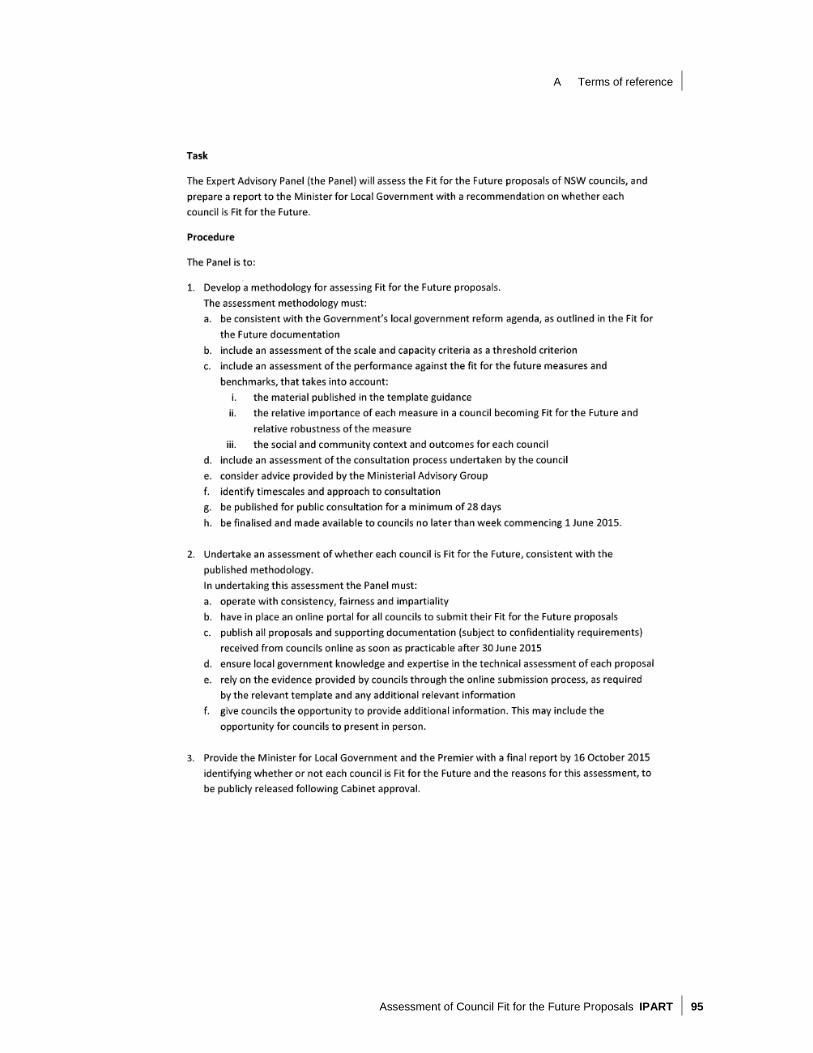
A Terms of reference
Assessment of Council Fit for the Future Proposals IPART 95

B Fit for the Future financial criteria
96 IPART Assessment of Council Fit for the Future Proposals
B Fit for the Future financial criteria
This appendix outlines:
a table with the FFTF financial criteria and benchmarks that were used to assess council proposals, and
a discussion of the considerations we have taken into account in assessing proposals against these criteria.

97 A
ssessm
ent o
f Co
un
cil Fit fo
r the
Fu
ture
Pro
po
sals IPA
RT
B F
it for th
e F
utu
re fin
an
cial crite
ria
Table B.1 Fit for the Future Financial Criteria
Criteria Performance measure
Definition Benchmark Metropolitan/ regional councils
Rural councilsa Merger caseb
Sustainability Operating Performance Ratio
Net continuing operating resulta (excl capital grants and contributions)
Total continuing operating revenuea (excl capital grants and contributions)
Greater than or equal to break-even average over 3 years
Must meet within 5 years
Plan to meet within 10 years
Must meet within 5 years for non-rural councils Plan to meet within 10 years for rural councils
Own Source Revenue
Total continuing operating revenuea (excl all grants and contributions)
Total continuing operating revenuea (incl capital grants and contributions)
Greater than 60% average over 3 years
Must meet within 5 years
Plan to improve within 5 years and consideration of FAGs
Must meet within 5 years for non-rural councils Plan to improve within 5 years and consideration of FAGs for rural councils
Building & Infrastructure Asset Renewal Ratio
Asset renewals (building and infrastructure)
Depreciation, amortisation and impairment (building and infrastructure)
Greater than 100% average over 3 years
Meet or improve within 5 years
Meet or improve within 5 years
Meet or improve within 5 years

B F
it for th
e F
utu
re fin
an
cial crite
ria
98IPA
RT A
ssessm
en
t of C
ou
ncil F
it for th
e F
utu
re P
ropo
sals
Criteria Performance measure
Definition Benchmark Metropolitan/ regional councils
Rural councilsa Merger caseb
Infrastructure and service management
Infrastructure Backlog
Estimated cost to bring assets to satisfactory condition
Total written down value of infrastructure, buildings, other structures, depreciable land, and improvement assets
Less than 2% Meet or improve/ inform within 5 years
Meet or improve/ inform within 5 years
Meet or improve/ inform within 5 years
Asset Maintenance
Actual asset maintenance
Required asset maintenance
Greater than 100% average over 3 years
Meet or improve/ inform within 5 years
Meet or improve/ inform within 5 years
Meet or improve/ inform within 5 years
Debt Service Cost of debt service (interest expense and principal repayments)
Total continuing operating revenuea (excl capital grants and contributions)
Greater than 0% and less than or equal to 20% average over 3 years
Meet within 5 years
Meet within 5 years
Meet within 5 years
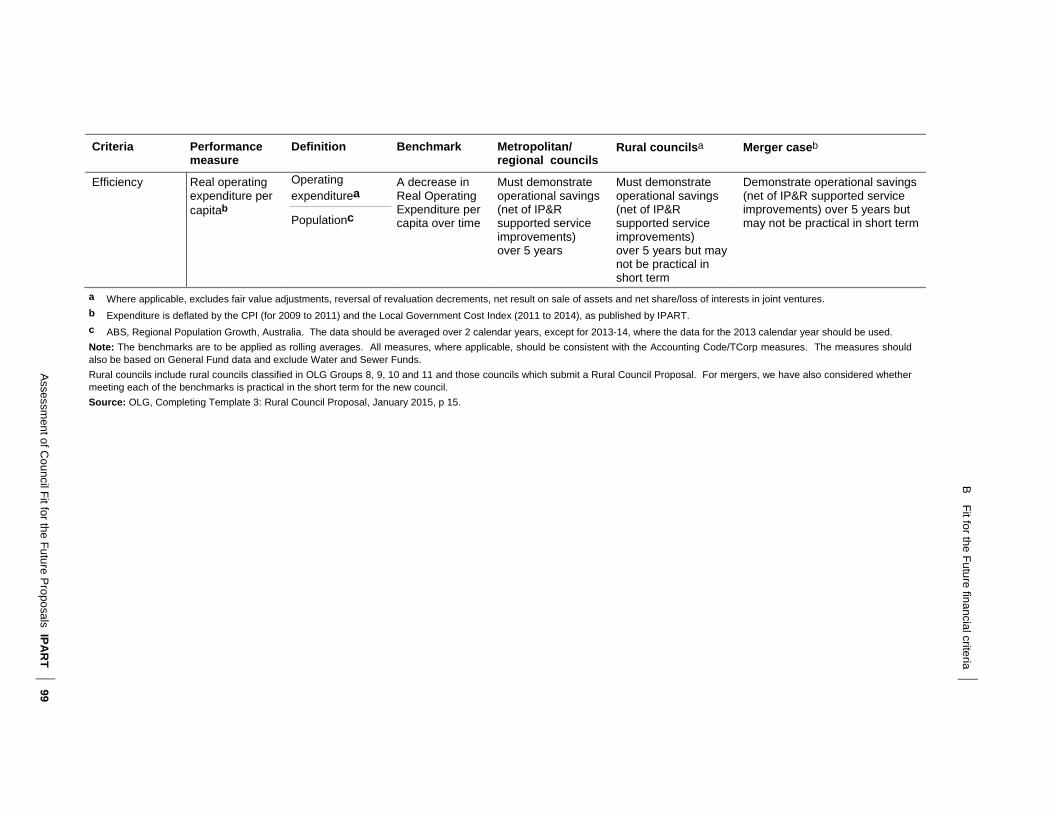
99 A
ssessm
ent o
f Co
un
cil Fit fo
r the
Fu
ture
Pro
po
sals IPA
RT
B F
it for th
e F
utu
re fin
an
cial crite
ria
Criteria Performance measure
Definition Benchmark Metropolitan/ regional councils
Rural councilsa Merger caseb
Efficiency Real operating expenditure per capitab
Operating expenditurea
Populationc
A decrease in Real Operating Expenditure per capita over time
Must demonstrate operational savings (net of IP&R supported service improvements) over 5 years
Must demonstrate operational savings (net of IP&R supported service improvements) over 5 years but may not be practical in short term
Demonstrate operational savings (net of IP&R supported service improvements) over 5 years but may not be practical in short term
a Where applicable, excludes fair value adjustments, reversal of revaluation decrements, net result on sale of assets and net share/loss of interests in joint ventures.
b Expenditure is deflated by the CPI (for 2009 to 2011) and the Local Government Cost Index (2011 to 2014), as published by IPART.
c ABS, Regional Population Growth, Australia. The data should be averaged over 2 calendar years, except for 2013-14, where the data for the 2013 calendar year should be used.
Note: The benchmarks are to be applied as rolling averages. All measures, where applicable, should be consistent with the Accounting Code/TCorp measures. The measures should also be based on General Fund data and exclude Water and Sewer Funds.
Rural councils include rural councils classified in OLG Groups 8, 9, 10 and 11 and those councils which submit a Rural Council Proposal. For mergers, we have also considered whether meeting each of the benchmarks is practical in the short term for the new council.
Source: OLG, Completing Template 3: Rural Council Proposal, January 2015, p 15.

B Fit for the Future financial criteria
100 IPART Assessment of Council Fit for the Future Proposals
B.1 Considerations in assessing the financial criteria
This section sets out a discussion of the considerations we have used in assessing council proposals against each of the financial criteria.
B.1.1 Criterion 2: Sustainability
Table B.2 Sustainability criterion – measures and definitions
Measure Definition
Operating Performance Ratio Core measure of financial sustainability – indicates a council’s capacity to meet ongoing operating expenditure requirements.
Own Source Revenue Ratio Councils with higher own source revenue have a greater ability to control their own operating performance and financial sustainability.
Building & Infrastructure Asset Renewal Ratio
Measures whether a council’s assets are deteriorating faster than they are being renewed – indicator of whether a council’s infrastructure backlog is likely to increase.
Some considerations:
The Operating Performance Ratio is a key measure councils should be aiming to meet over time. However, this measure is influenced by depreciation, which is an accounting measure of the estimated consumption of the service potential of an entity’s asset base during a period. It can often represent about 25% of a council’s annual operating expenses. Thus, changes to a council’s approach in estimating depreciation may have a material effect on the Operating Performance Ratio.
We have also taken into account the impact of interest income from works-in-kind agreements and voluntary planning agreements provided by developers to deliver infrastructure. Interest income from developer contributions may overstate a council’s operating performance as this income cannot be used for council operations, but is included in operating performance figures.
Depreciation is based on ex-ante estimates of an asset’s useful life. As a result, it may not reflect ex-post consumption of an asset’s service potential within periods or over time. However, accounting standards do require councils to regularly review assumed useful asset lives and the depreciation methodology and rates used based on actual asset performance, in order to enhance the reliability of annual depreciation estimates. There is nevertheless currently considerable difference in the approaches used to calculate depreciation between councils.

B Fit for the Future financial criteria
Assessment of Council Fit for the Future Proposals IPART 101
The Own Source Revenue Ratio may be below the benchmark for different reasons in metropolitan and non-metropolitan areas. Metropolitan growth councils may be receiving capital grants from developers which adversely affect their performance in relation to this measure. For non-metropolitan councils, the legislated Federal Assistance Grants (FAGs) provide a large source of relatively stable and reliable income, and their exclusion may artificially reduce a council’s measured relative performance. For this reason, we have considered the impact of FAGs in considering the Own Source Revenue performance of regional and rural councils in OLG Group 8 to 11.
The Building & Infrastructure Asset Renewal Ratio does not take into account that councils may experience peaks and troughs in renewal needs over time, and it may not be prudent to bring forward renewal expenditure to meet the benchmark. In practice, renewal expenditure programs should be based on a sound Asset Management Plan. Further, councils should ensure the community supports and is willing to pay for the scale of renewals proposed by routinely seeking their views on service standards.
B.1.2 Criterion 3: Effective Infrastructure and Service Management
Table B.3 Infrastructure and service management criterion – measures and definitions
Measure Definition
Infrastructure Backlog Ratio Measures how effectively the council is managing its infrastructure. Increasing backlogs may affect the council’s ability to provide services and remain sustainable.
Asset Maintenance Ratio Measures whether the council is spending enough on maintaining its assets to avoid increasing its infrastructure backlog.
Debt Service Ratioa Indicates whether the council is using debt wisely to share the life-long cost of assets and avoid excessive rate increases.
a We consider that debt is used wisely when it is used reasonably in conjunction with established, sound, Asset Management Plans.
Some considerations:
The Infrastructure Backlog Ratio is difficult to measure objectively because condition assessments are subjective and should be based on the community’s preferences regarding asset quality, cost and service levels, their willingness to pay, and a risk based assessment and approach to the provision of community infrastructure. We consider councils with a sound financial position should not be reporting a significant infrastructure backlog over the long term. Infrastructure provision by a council is a balance between the community’s wants compared with its needs and the ability of the council to raise sufficient revenue to pay for assets.

B Fit for the Future financial criteria
102 IPART Assessment of Council Fit for the Future Proposals
We have exercised care when assessing the Infrastructure Backlog Ratio because it is clear that there are widespread differences between councils in their approach to its determination.
The Asset Maintenance Ratio has been used to inform our holistic assessment of the seven measures in the financial criteria. A council may spend on maintenance yet not renew its assets. As a result, the Infrastructure Backlog Ratio may increase even though the Asset Maintenance Ratio is technically being met.
The Debt Service Ratio should be based on sound treasury management, which needs to distinguish between how debt is used and the extent of debt taken on by the council. A council that takes on debt to meet the benchmark is not necessarily in a better financial position than a council that does not take on debt where it may be able to fund its needs through recurring income and reserves. Debt should also be used to share the cost of long lived assets between current and future users to maintain inter-generational equity.
B.1.3 Criterion 4: Efficiency
Table B.4 Efficiency criterion – measures and definitions
Measure Definition
Real Operating Expenditure (Opex) per capita
Indicates how well the council is using economies of scale and managing service levels to achieve efficiencies.
Some considerations:
The Real Opex per capita ratio measures the council’s performance over time. Due to differences in the level, standard and range of services provided, it is difficult to compare this ratio across councils.
Councils should not reduce service levels or quality in order to decrease their expenditure and meet this benchmark.
Increases in this ratio are permissible, where it efficiently reflects the local community’s desire for increased levels of service from their local council. Increases may also occur where the council’s population is declining.
B.2 Methodological changes in asset maintenance and renewals
We note a number of councils are consulting with their community to determine if a lower standard of assets (such as roads) is acceptable. If so, under the OLG’s IP&R Guidelines, councils may then maintain or renew assets to a ‘satisfactory’ condition (condition 3), rather than a ‘good’ condition (condition 2).

B Fit for the Future financial criteria
Assessment of Council Fit for the Future Proposals IPART 103
This altered approach to asset management effectively reduces both the costs and volume of asset maintenance and renewals over the medium term. This has the effect of improving a council’s performance against the financial criteria by:
Extending asset lives and reducing depreciation on a yearly basis. This improves performance against the Operating Performance Ratio and the Building & Infrastructure Asset Renewal Ratio.
Reducing the expenditure required to bring assets to an acceptable standard, which decreases the council’s Infrastructure Backlog Ratio.
Possibly reducing required asset maintenance, which improves performance against the Asset Maintenance Ratio without increasing current expenditure.
As a result, many councils are showing improvements across a number of the ratios. In considering these changes, we have examined whether the assumptions used by the council are reasonable. Some councils have also had their altered approach to asset management externally reviewed by consultants. In undertaking the assessments, we have generally accepted these improvements, notwithstanding the fact they are largely a result of a changed approach to asset maintenance and renewal. This is because the new practices are likely to be acceptable to the community, more efficient, and consistent with the OLG’s IP&R Guidelines.

C Council assessments
104 IPART Assessment of Council Fit for the Future Proposals
C Council assessments
This appendix sets out tables summarising the assessment of each council as follows:
Metropolitan Sydney councils:
– Merger Proposals
– Inner Metropolitan Sydney
– Outer Metropolitan Sydney.
Non-metropolitan councils
– Merger Proposals
– Hunter, Central Coast and Illawarra
– Non-metropolitan proposals
– Rural Council Proposals.
The appendix also includes detail on the assessment for each council against each criteria, which are set out in alphabetical order in the accompanying document.

105 A
ssessm
ent o
f Co
un
cil Fit fo
r the
Fu
ture
Pro
po
sals IPA
RT
C C
ou
ncil a
ssessm
en
ts
C.1 Metropolitan Sydney assessments
Table C.1 Merger Proposals
Councils ILGRP preferred option Assessment Scale and capacity
Financial criteria overall
Sustainability Infrastructure and service
management
Efficiency
Randwick City and Waverley
Merge to form a Global Sydney council
Fit
Auburn City Burwood City of Canada Bay
Auburn to merge with Holroyd, Parramatta, Ryde (part) and The Hills (part); Burwood and Canada Bay to merge with Ashfield, Leichhardt, Marrickville and Strathfield
Fit
Note: Bold indicates an ILGRP preferred option.
Table C.2 Inner Metropolitan Sydney
Region ILGRP preferred option Council Assessment Scale and capacity
Financial criteria overall
Sustainability Infrastructure and service
management
Efficiency
Global City Amalgamate with Randwick City and Waverley Council
City of Botany Bay Not fit
City of Sydney Not fit as a Global City Council
Woollahra Municipal Not fit
Inner West Amalgamate with City of Canada Bay and Burwood
Ashfield Not fit
Leichhardt Municipal Not fit
Marrickville Not fit
Strathfield Not fit

C C
ou
ncil a
ssessm
ents
106IPA
RT A
ssessm
en
t of C
ou
ncil F
it for th
e F
utu
re P
ropo
sals
Region ILGRP preferred option Council Assessment Scale and capacity
Financial criteria overall
Sustainability Infrastructure and service
management
Efficiency
West Central Amalgamate with Auburn, City of Ryde (part) and The Hills (part)
Holroyd City Not fit
Parramatta City Not fit
Lower North Shore
Amalgamate
City of Ryde Not fit
Hunter’s Hill Not fit
Lane Cove Not fit
Mosman Municipal Not fit
North Sydney Not fit
Willoughby Not fit
Northern Suburbs
Amalgamate
Hornsby Not fit
Ku-ring-gai Not fit
Northern Beaches
Amalgamate
Manly Not fit
Pittwater Not fit
Warringah Not fit
South West Amalgamate
Fairfield Not fit
Liverpool Not fit
Southern Amalgamate
Canterbury Not fit
Hurstville Not fit
Kogarah Not fit
Rockdale Not fit
Bankstown No change Bankstown Fit
Note: Bold indicates an ILGRP preferred option.
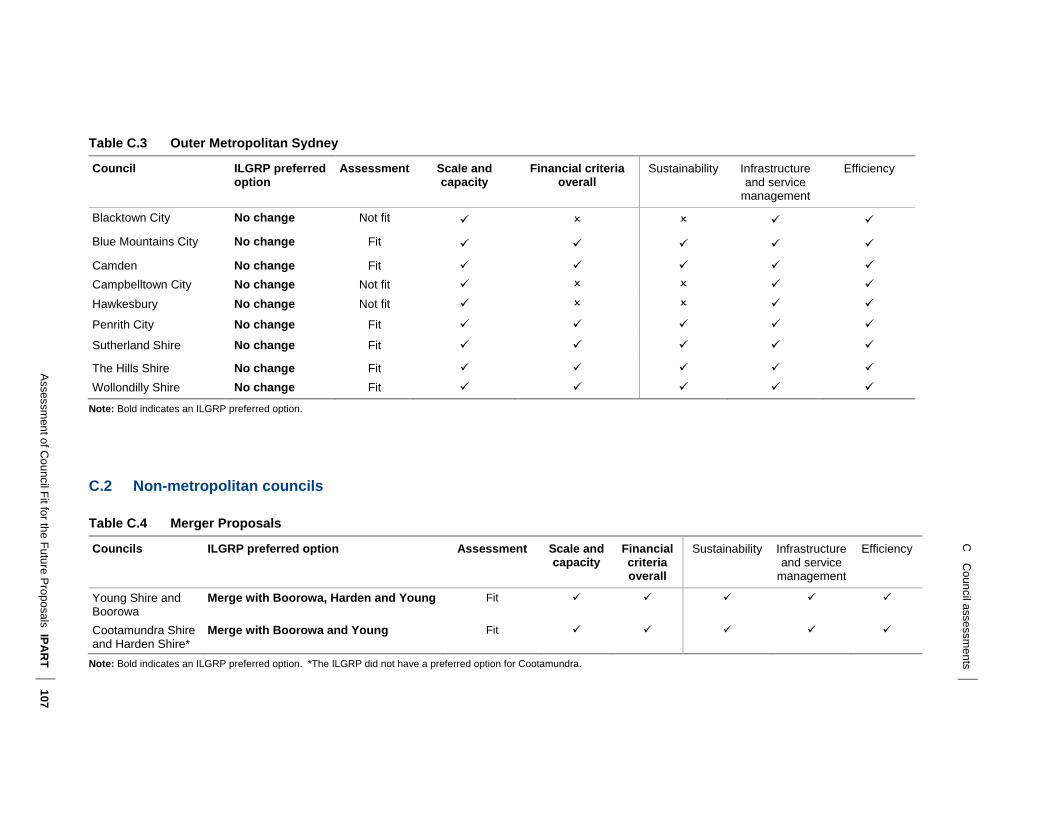
107 A
ssessm
ent o
f Co
un
cil Fit fo
r the
Fu
ture
Pro
po
sals IPA
RT
C C
ou
ncil a
ssessm
en
ts
Table C.3 Outer Metropolitan Sydney
Council ILGRP preferred option
Assessment Scale and capacity
Financial criteria overall
Sustainability Infrastructure and service
management
Efficiency
Blacktown City No change Not fit
Blue Mountains City No change Fit
Camden No change Fit
Campbelltown City No change Not fit
Hawkesbury No change Not fit
Penrith City No change Fit
Sutherland Shire No change Fit
The Hills Shire No change Fit
Wollondilly Shire No change Fit
Note: Bold indicates an ILGRP preferred option.
C.2 Non-metropolitan councils
Table C.4 Merger Proposals
Councils ILGRP preferred option Assessment Scale and capacity
Financial criteria overall
Sustainability Infrastructure and service
management
Efficiency
Young Shire and Boorowa
Merge with Boorowa, Harden and Young Fit
Cootamundra Shire and Harden Shire*
Merge with Boorowa and Young Fit
Note: Bold indicates an ILGRP preferred option. *The ILGRP did not have a preferred option for Cootamundra.

C C
ou
ncil a
ssessm
ents
108IPA
RT A
ssessm
en
t of C
ou
ncil F
it for th
e F
utu
re P
ropo
sals
Table C.5 Hunter, Central Coast and Illawarra
Region Council ILGRP options Assessment Scale and capacity
Financial criteria overall
Sustainability Infrastructure and service
management
Efficiency
Hunter Cessnock City Council in JO Fit
Dungog Shire Merge with Maitland or Council in JOa
Not fit
Lake Macquarie City
Amalgamate with Newcastle or Council in JOa
Not fit
Maitland City Merge with Dungog or Council in JOa Not fit
Muswellbrook Shire
Council in JO Fit
Newcastle City Amalgamate with Lake Macquarie or Council in JO a
Not fit
Port Stephens Council in JO Fit
Singleton Council in JO Fit
Upper Hunter Shire
Council in JO Fit
Central Coast
Gosford City Amalgamate with Wyong or a multi-purpose JO (no separate water corporation until other options properly evaluated)
Not fit
Wyong City Amalgamate with Gosford or a multi-purpose JO (no separate water corporation until other options properly evaluated)
Not fit
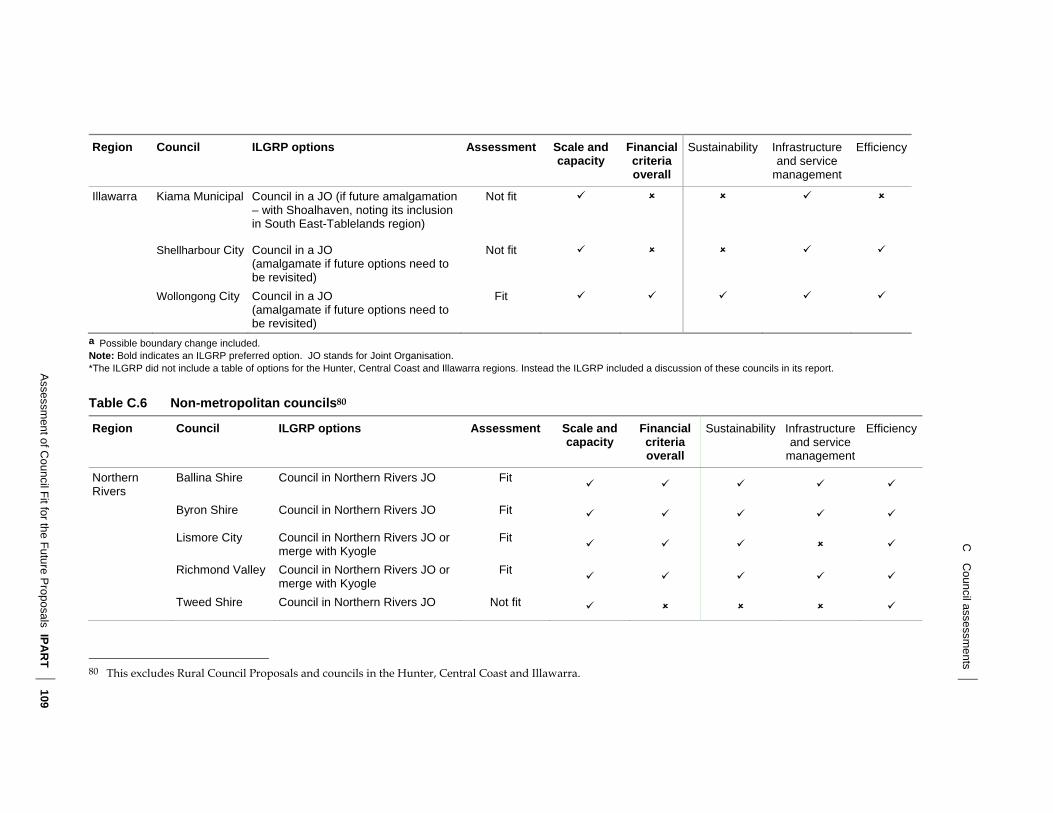
109 A
ssessm
ent o
f Co
un
cil Fit fo
r the
Fu
ture
Pro
po
sals IPA
RT
C C
ou
ncil a
ssessm
en
ts
Region Council ILGRP options Assessment Scale and capacity
Financial criteria overall
Sustainability Infrastructure and service
management
Efficiency
Illawarra Kiama Municipal Council in a JO (if future amalgamation – with Shoalhaven, noting its inclusion in South East-Tablelands region)
Not fit
Shellharbour City Council in a JO (amalgamate if future options need to be revisited)
Not fit
Wollongong City Council in a JO (amalgamate if future options need to be revisited)
Fit
a Possible boundary change included. Note: Bold indicates an ILGRP preferred option. JO stands for Joint Organisation. *The ILGRP did not include a table of options for the Hunter, Central Coast and Illawarra regions. Instead the ILGRP included a discussion of these councils in its report.
Table C.6 Non-metropolitan councils80
Region Council ILGRP options Assessment Scale and capacity
Financial criteria overall
Sustainability Infrastructure and service
management
Efficiency
Northern Rivers
Ballina Shire Council in Northern Rivers JO Fit
Byron Shire Council in Northern Rivers JO Fit
Lismore City Council in Northern Rivers JO or merge with Kyogle
Fit
Richmond Valley Council in Northern Rivers JO or merge with Kyogle
Fit
Tweed Shire Council in Northern Rivers JO Not fit
80 This excludes Rural Council Proposals and councils in the Hunter, Central Coast and Illawarra.

C C
ou
ncil a
ssessm
ents
110IPA
RT A
ssessm
en
t of C
ou
ncil F
it for th
e F
utu
re P
ropo
sals
Region Council ILGRP options Assessment Scale and capacity
Financial criteria overall
Sustainability Infrastructure and service
management
Efficiency
North Coast Bellingen Shire Council in North Coast JO Not fit
Clarence Valley Council in North Coast JO Not fit
Coffs Harbour City
Council in North Coast JO Fit
Nambucca Shire Council in North Coast JO Fit
Mid-North Coast
Gloucester Shire Council in Mid-North Coast JO or merge with Great Lakes and/or Greater Taree
Not fit
Great Lakes Shire
Council in Mid-North Coast JO or merge with Gloucester
Fit
Greater Taree City
Council in Mid-North Coast JO or merge with Gloucester
Not fit
Kempsey Shire Council in Mid-North Coast JO Not fit
Port Macquarie-Hastings
Council in Mid-North Coast JO Fit
New England Armidale Dumaresq
Council in New England JO or merge with Guyra
Not fit
Glen Innes Severn
Council in New England JO Fit
Inverell Shire Council in Namoi JO Fit
Tenterfield Shire Council in New England JO Not fit
Uralla Shire Council in New England JO or merge with Walcha
Not fit

111 A
ssessm
ent o
f Co
un
cil Fit fo
r the
Fu
ture
Pro
po
sals IPA
RT
C C
ou
ncil a
ssessm
en
ts
Region Council ILGRP options Assessment Scale and capacity
Financial criteria overall
Sustainability Infrastructure and service
management
Efficiency
Namoi Gunnedah Shire Council in Namoi JO Fit
Gwydir Shire Council in Namoi JO or merge with Moree Plains
Not fit
Liverpool Plains Shire
Council in Namoi JO or merge with Gunnedah
Not fit
Moree Plains Shire
Council in Namoi JO or merge with Gwydir
Fit
Narrabri Shire Council in Namoi JO Fit
Tamworth Regional
Council in Namoi JO Fit
Orana Dubbo City Council in Orana JO or merge with Wellington and/or Narromine
Fit
Narromine Shire Council in Orana CC or merge with Dubbo
Not fit
Warrumbungle Shire
Council in Orana JO Not fit
Wellington Council in Orana JO or merge with Dubbo
Not fit

C C
ou
ncil a
ssessm
ents
112IPA
RT A
ssessm
en
t of C
ou
ncil F
it for th
e F
utu
re P
ropo
sals
Region Council ILGRP options Assessment Scale and capacity
Financial criteria overall
Sustainability Infrastructure and service
management
Efficiency
Central West Bathurst Regional Council in Central West JO or merge with Oberon
Fit
Blayney Shire Council in Central West JO or merge with Orange
Not fit
Cabonne Council in Central West JO or merge with Orange
Not fit
Cowra Council in Central West JO or merge with Weddin
Fit
Forbes Shire Council in Central West JO; merge with Weddin
Not fit
Lachlan Shire Council in Central West JO or merge with Parkes
Not fit
Lithgow City Council in Central West JO Not fit
Mid-Western Regional
Council in Central West JO Not fit
Oberon Council in Central West JO or merge with Bathurst
Not fit
Orange City Council in Central West JO or merge with Cabonne and/or Blayney
Not fit
Parkes Shire Council in Central West JO or merge with Lachlan
Fit
Tablelands Goulburn Mulwaree
Council in Tablelands JO Not fit
Upper Lachlan Shire
Council in Tablelands JO or merge with Goulburn-Mulwaree
Not fit
Wingecarribee Shire
Council in Tablelands JO Fit
Yass Valley Council in Tablelands JO Not fit

113 A
ssessm
ent o
f Co
un
cil Fit fo
r the
Fu
ture
Pro
po
sals IPA
RT
C C
ou
ncil a
ssessm
en
ts
Region Council ILGRP options Assessment Scale and capacity
Financial criteria overall
Sustainability Infrastructure and service
management
Efficiency
Riverina Bland Shire Council in Riverina JO or merge with Coolamon and/or Temora
Not fit
Junee Shire Council in Riverina JO or merge with Cootamundra
Not fit
Temora Shire Council in Riverina JO or merge with Coolamon and/or Bland
Not fit
Tumut Shire Council in Riverina JO or merge with Gundagai and Tumbarumba
Not fit
Wagga Wagga City
Council in Riverina JO or merge with Lockhart
Fit
Murrumbidgee Griffith City Council in Murrumbidgee JO or merge with Murrumbidgee
Not fit
Leeton Shire Council in Murrumbidgee JO or merge with Narrandera
Fit
Narrandera Shire Council in Murrumbidgee JO or merge with Leeton
Not fit
Mid-Murray Berrigan Shire Council in Mid-Murray JO or merge with Jerilderie
Not fit
Deniliquin Shire Council in Mid-Murray JO or merge with Conargo/Murray and Wakool
Not fit
Murray Shire Council in Mid-Murray JO or merge with D’quin/Conargo and Wakool
Not fit
Upper Murray Albury City Council in Upper Murray JO or merge with Greater Hume (part or all)
Fit
Corowa Shire Council in Upper Murray JO or merge with Urana
Not fit
Greater Hume Shire
Council in Upper Murray JO or Fit

C C
ou
ncil a
ssessm
ents
114IPA
RT A
ssessm
en
t of C
ou
ncil F
it for th
e F
utu
re P
ropo
sals
Region Council ILGRP options Assessment Scale and capacity
Financial criteria overall
Sustainability Infrastructure and service
management
Efficiency
merge part or all with Albury
South East Bega Valley Shire Council in South East JO Fit
Cooma-Monaro Shire
Council in South East JO or merge with Bombala and Snowy River
Not fit
Eurobodalla Shire Council in South East JO Fit
Palerang Council in South East JO or merge with Queanbeyan
Not fit
Queanbeyan City Council in South East JO or merge with Palerang
Not fit
Shoalhaven City Council in South East JO Fit
Snowy River Shire
Council in South East JO or merge with Bombala/Cooma-M
Not fit
Note: Bold indicates an ILGRP preferred option. JO stands for Joint Organisation.

115 A
ssessm
ent o
f Co
un
cil Fit fo
r the
Fu
ture
Pro
po
sals IPA
RT
C C
ou
ncil a
ssessm
en
ts
Table C.7 Rural Council Proposals
Region Council ILGRP options Assessment Scale and capacity
Financial criteria overall
Sustainability Infrastructure and service
management
Efficiency
Northern Rivers
Kyoglea Council in Northern Rivers JO or merge with Lismore or Richmond Valley
Not fit
New England Guyra Shire Council in New England JO or merge with Armidale Not fit
Walcha Shire Merge with Uralla or Rural Council in New England JO Not fit
Orana Bogan Shire Rural Council in Orana JO or merge with Warren
Fit as a Rural Council
Coonamble Shire
Rural Council in Orana JO or merge with Gilgandra
Fit as a Rural Council
Gilgandra Shire
Rural Council in Orana JO or merge with Coonamble
Fit as a Rural Council
Warren Shire Rural Council in Orana JO or merge with Bogan
Fit as a Rural Council
Central West Weddin Shire Rural Council in Central West JO or merge with Forbes or Cowra
Not fit
Riverina Coolamon Shire
Rural Council in Riverina JO or merge with Bland and/or Temora
Fit as a Rural Council
Gundagai Shire
Merge with Tumut or Rural Council in Riverina CC Not fit
Lockhart Shire Rural Council in Riverina JO or merge with Wagga Wagga
Fit as a Rural Council
Tumbarumba Shire
Rural Council in Riverina JO or merge with Tumut/Gundagai
Fit as a Rural Council

C C
ou
ncil a
ssessm
ents
116IPA
RT A
ssessm
en
t of C
ou
ncil F
it for th
e F
utu
re P
ropo
sals
Region Council ILGRP options Assessment Scale and capacity
Financial criteria overall
Sustainability Infrastructure and service
management
Efficiency
Mid-Murray Conargo Shire Merge with Deniliquin and Murray or Rural Council in Mid-Murray JO
Not fit
Jerilderie Shire Merge with Berrigan or Rural Council in Mid-Murray JO Not fit
Wakool Shire Rural Council in Mid-Murray JO or merge with Murray/Conargo/Deniliquin
Fit as a Rural Council
Murrumbidgee Carrathool Shire
Rural Council in Murrumbidgee JO or merge with Griffith
Fit as a Rural Council
Hay Shire Rural Council in Murrumbidgee JO
Not fit
Murrumbidgee Shire
Merge with Griffith or Rural Council in Murrumbidgee JO Not fit
Upper Murray Urana Shire Merge with Corowa or Rural Council in Upper Murray JO Not fit
South East Bombala Merge with Cooma-M and Snowy R or Rural Council in South East JO
Not fit
a Kyogle submitted a Rural Council Proposal. However the ILGRP did not identify this as one of the options for the council. We assess Kyogle as not fit as a Rural Council not fit as a stand-alone council.
Note: Bold indicates an ILGRP preferred option. JO stands for Joint Organisation.

D Analysis of merger business cases
Assessment of Council Fit for the Future Proposals IPART 405
D Analysis of merger business cases
This appendix provides a summary of the estimated benefits of selected merger options for Metropolitan Sydney councils. It includes the estimated benefits set out in the merger business cases provided in council proposals, as well as additional analysis of these mergers undertaken by IPART and Ernst & Young.
D.1 Business Case overview
A number of councils provided business cases and related submissions with respect to options for council mergers and various forms of joint organisation or shared service arrangements. In addition, some councils provided submissions on broader issues of the potential economies and diseconomies arising from council mergers. The submissions provided useful information.
As well, we commissioned Ernst & Young to undertake an independent study of the potential costs and benefits of selected council mergers in Metropolitan Sydney and review information included in council business cases. Specifically, IPART commissioned Ernst & Young to:
To provide an estimate of the NPV of the benefits associated with the merger options identified by the ILGRP or councils for the Sydney metropolitan area.
To review the business cases submitted by Sydney metropolitan councils with respect to estimated benefits.
To review and critique IPART’s assessment of the estimated NPV of the benefits of merger options included in submissions by councils with respect to the Sydney metropolitan area.
D Analysis of merger business cases
406 IPART Assessment of Council Fit for the Future Proposals
D.2 Estimating the value of merger benefits
Ernst & Young undertook a review of relevant literature on the potential benefits from mergers. Ernst & Young’s broad conclusions were:
The empirical evidence of economies from local council mergers is not clear cut. The measurement of benefits following a merger is often difficult because councils may redirect cost savings into service expansion. An implication of this action is that directly observed falls in costs may underestimate the total benefits from a merger.
The extent of scale economies following a merger is likely to vary according to activity and the size of the councils.
The studies identify a number of potential risks associated with local council amalgamations including costs of disruption and workplace cultural barriers.
Some submissions to IPART presented different views on whether council mergers would generate benefits. In a submission by Woollahra Municipal Council, Percy Allan & Associates argued that Sydney metropolitan councils showed no significant scale economies.81 The City of Ryde Council also submitted a report by Professor Brian Dollery which argued that there is little evidence that forced council amalgamations will achieve cost savings.82 However, a number of councils provided business cases which demonstrated that there were benefits associated with merger options.
D.2.1 Comparing the business cases
A number of the business cases submitted by councils to IPART provided estimates for the NPV and/or the undiscounted value of net benefits (or costs) of structural options including mergers and joint organisations. The estimates of net benefits are, by their nature, driven by input assumptions and the precise values are subject to some uncertainty.
The estimates of merger benefits and costs produced by different consultants and councils are not directly comparable because of the differences in methodology and assumptions used. For example, the time period over which benefits are assessed varied. Also, the discount rate used to calculate NPV varied between business cases. Typically, in the case of a council merger, a lower discount rate would give rise to a larger estimated NPV of benefits. In addition, fundamentally different approaches were used to estimate merger costs and potential merger related efficiencies.
81 Percy Allan & Associates Pty Ltd, Fit For The Future Research Report, March 2015. 82 Professor Brian Dollery, Compulsion Versus a Collaborative Regional Approach: An Emperical
Analysis of Forced Amalgamation versus a Regional and Shared Services Approach, May 2015.

D Analysis of merger business cases
Assessment of Council Fit for the Future Proposals IPART 407
Normalising the business cases
We have recalculated the estimates of NPV by using the information in the business cases provided and adjusting the assumptions to use a consistent 20-year time period, a discount rate of 9.5% nominal (7.0% real), and the assumption that the merger takes effect in 2016-17. The merger assistance grant from the NSW is also included in the IPART recalculations of the estimated NPV of benefits. We consider that extending the period of estimation to 20 years allows a better reflection of the long term benefits and costs of a merger.
We have also varied other selected assumptions underlying the consultant estimates, which have been identified in Table D.2.
We do not necessarily endorse other assumptions made by the consultants, but for this exercise we have retained the other assumptions in order to recalculate the estimate of net benefits. The recalculated estimates are subject to most of the assumptions and limitations that the original estimates were subject to.
The purpose of the recalculation was to standardise some elements of the business cases submitted. However, differences in underlying methodologies still make it difficult to directly compare the business case estimates submitted by different councils and different consultants.
Ernst & Young reviewed the assumptions used by IPART in the analysis of the metropolitan Sydney councils and found the assumptions were within the bounds of reasonableness, noting that IPART had applied a ceiling to the level of savings in one case to err on the side of conservatism, and that IPART has included merger grant funding and, where used by the original consultants and relevant, borrowing costs.
Ernst & Young’s own independent assessment of the merger business cases prepared by local councils calculated net outcomes not materially different to IPART’s calculations, after adjusting for the above three considerations.
Analysing the business cases
We also commissioned Ernst & Young to undertake a review of the business cases that provided estimates of merger costs and benefits that were submitted with respect to metropolitan Sydney mergers and to estimate the NPV associated with selected mergers.
The original estimates of the NPV of council merger benefits by consultants/councils, the recalculated estimates produced by IPART and the independent estimates produced by Ernst & Young for selected merger options for the Sydney metropolitan region are summarised in Table D.1.

D Analysis of merger business cases
408 IPART Assessment of Council Fit for the Future Proposals
The NPV of benefits as recalculated by IPART and those estimated by Ernst & Young are generally higher than those estimated by consultants and councils in their submissions. This result partly reflects the fact that the recalculations by IPART and estimated by Ernst & Young are for a longer time period (20 years) than used by the consultants and councils. Also, the IPART calculations include recognising benefits from mergers that were evident in either cost savings or, where they can be estimated, enhanced services.
The information provided in Table D.1 shows that the majority of business cases undertaken by consultants and councils with respect to specific merger options suggest that the NPV of benefits from the mergers are positive. Summing the projected NPV of merger benefits estimated by Ernst & Young for the eight preferred merger options for metropolitan Sydney gives a total of $1.3 billion.
In analysing the estimated NPVs:
The estimated benefits are dependent on assumptions made. The estimated benefits will therefore vary according to assumptions made and are subject to some uncertainty.
There are uncertainties about whether the potential benefits will be realised. For example, it will depend on the willingness of councils to pursue potential efficiency gains.
The measured NPVs mostly relate to council finances. The calculations do not capture matters such as:
– prospective gains from better partnering with government
– potential gains from more integrated planning
– likely gains from improved regional collaboration
– possible diseconomies of scale from loss of local identity, and
– potential diseconomies of scale from reduced local representation.
In summary, we consider that analysis of the business cases for metropolitan Sydney councils suggests that there are significant net benefits to be obtained from the mergers identified by the ILGRP.
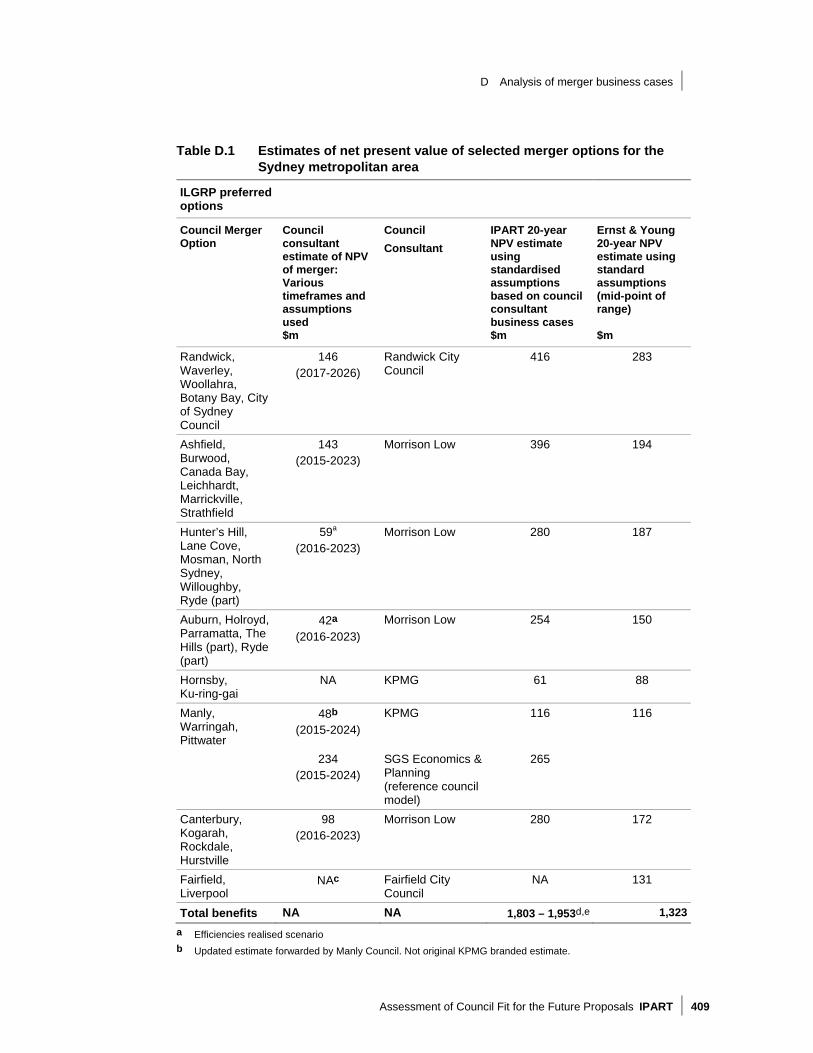
D Analysis of merger business cases
Assessment of Council Fit for the Future Proposals IPART 409
Table D.1 Estimates of net present value of selected merger options for the Sydney metropolitan area
ILGRP preferred options
Council Merger Option
Council consultant estimate of NPV of merger: Various timeframes and assumptions used $m
Council Consultant
IPART 20-year NPV estimate using standardised assumptions based on council consultant business cases $m
Ernst & Young 20-year NPV estimate using standard assumptions (mid-point of range) $m
Randwick, Waverley, Woollahra, Botany Bay, City of Sydney Council
146 (2017-2026)
Randwick City Council
416 283
Ashfield, Burwood, Canada Bay, Leichhardt, Marrickville, Strathfield
143 (2015-2023)
Morrison Low 396 194
Hunter’s Hill, Lane Cove, Mosman, North Sydney, Willoughby, Ryde (part)
59a
(2016-2023) Morrison Low 280 187
Auburn, Holroyd, Parramatta, The Hills (part), Ryde (part)
42a
(2016-2023)
Morrison Low 254 150
Hornsby, Ku-ring-gai
NA KPMG 61 88
Manly, Warringah, Pittwater
48b
(2015-2024)
KPMG 116 116
234 (2015-2024)
SGS Economics & Planning (reference council model)
265
Canterbury, Kogarah, Rockdale, Hurstville
98 (2016-2023)
Morrison Low 280 172
Fairfield, Liverpool
NAc Fairfield City Council
NA 131
Total benefits NA NA 1,803 – 1,953d,e 1,323a Efficiencies realised scenario
b Updated estimate forwarded by Manly Council. Not original KPMG branded estimate.
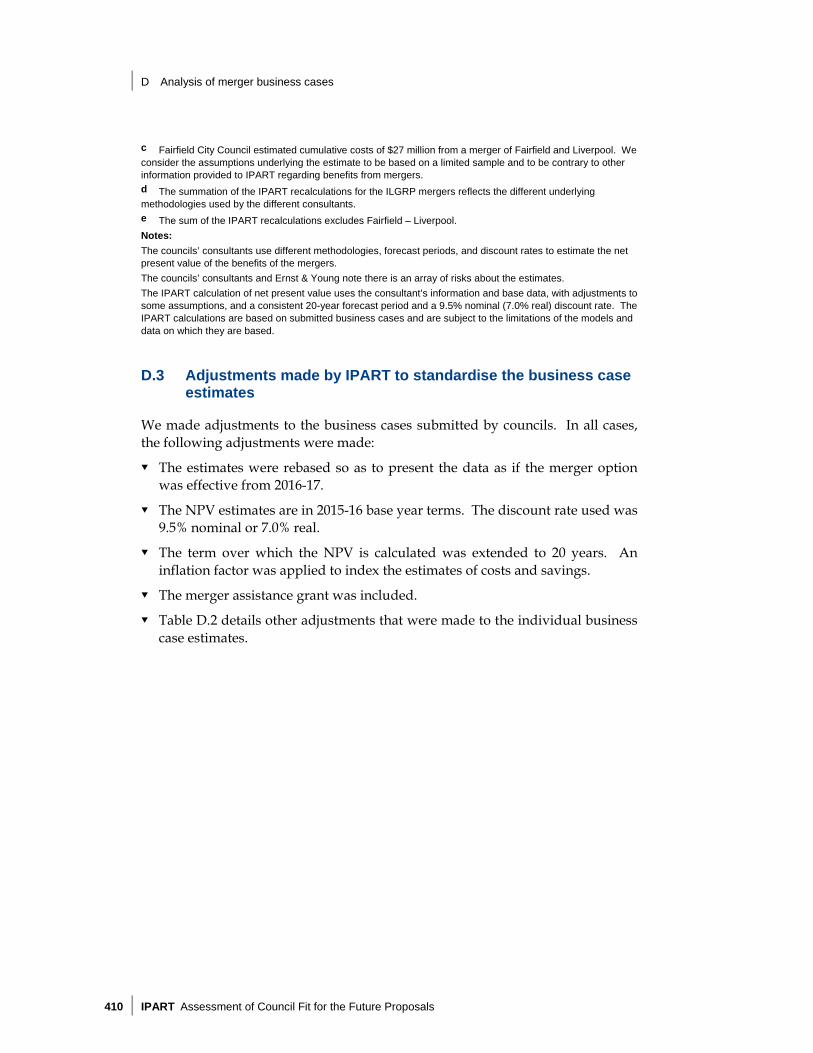
D Analysis of merger business cases
410 IPART Assessment of Council Fit for the Future Proposals
c Fairfield City Council estimated cumulative costs of $27 million from a merger of Fairfield and Liverpool. We consider the assumptions underlying the estimate to be based on a limited sample and to be contrary to other information provided to IPART regarding benefits from mergers.
d The summation of the IPART recalculations for the ILGRP mergers reflects the different underlying methodologies used by the different consultants.
e The sum of the IPART recalculations excludes Fairfield – Liverpool.
Notes: The councils’ consultants use different methodologies, forecast periods, and discount rates to estimate the net present value of the benefits of the mergers.
The councils’ consultants and Ernst & Young note there is an array of risks about the estimates.
The IPART calculation of net present value uses the consultant’s information and base data, with adjustments to some assumptions, and a consistent 20-year forecast period and a 9.5% nominal (7.0% real) discount rate. The IPART calculations are based on submitted business cases and are subject to the limitations of the models and data on which they are based.
D.3 Adjustments made by IPART to standardise the business case estimates
We made adjustments to the business cases submitted by councils. In all cases, the following adjustments were made:
The estimates were rebased so as to present the data as if the merger option was effective from 2016-17.
The NPV estimates are in 2015-16 base year terms. The discount rate used was 9.5% nominal or 7.0% real.
The term over which the NPV is calculated was extended to 20 years. An inflation factor was applied to index the estimates of costs and savings.
The merger assistance grant was included.
Table D.2 details other adjustments that were made to the individual business case estimates.
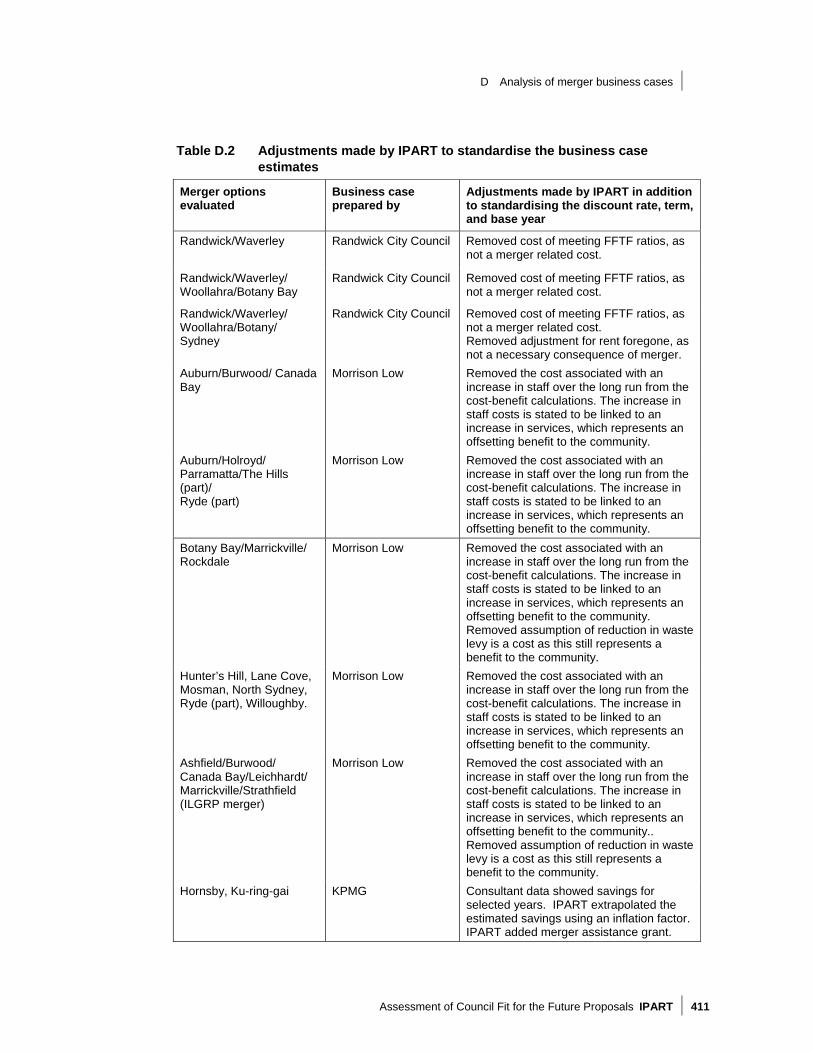
D Analysis of merger business cases
Assessment of Council Fit for the Future Proposals IPART 411
Table D.2 Adjustments made by IPART to standardise the business case estimates
Merger options evaluated
Business case prepared by
Adjustments made by IPART in addition to standardising the discount rate, term, and base year
Randwick/Waverley Randwick City Council Removed cost of meeting FFTF ratios, as not a merger related cost.
Randwick/Waverley/ Woollahra/Botany Bay
Randwick City Council Removed cost of meeting FFTF ratios, as not a merger related cost.
Randwick/Waverley/ Woollahra/Botany/ Sydney
Randwick City Council Removed cost of meeting FFTF ratios, as not a merger related cost. Removed adjustment for rent foregone, as not a necessary consequence of merger.
Auburn/Burwood/ Canada Bay
Morrison Low Removed the cost associated with an increase in staff over the long run from the cost-benefit calculations. The increase in staff costs is stated to be linked to an increase in services, which represents an offsetting benefit to the community.
Auburn/Holroyd/ Parramatta/The Hills (part)/ Ryde (part)
Morrison Low Removed the cost associated with an increase in staff over the long run from the cost-benefit calculations. The increase in staff costs is stated to be linked to an increase in services, which represents an offsetting benefit to the community.
Botany Bay/Marrickville/ Rockdale
Morrison Low Removed the cost associated with an increase in staff over the long run from the cost-benefit calculations. The increase in staff costs is stated to be linked to an increase in services, which represents an offsetting benefit to the community. Removed assumption of reduction in waste levy is a cost as this still represents a benefit to the community.
Hunter’s Hill, Lane Cove, Mosman, North Sydney, Ryde (part), Willoughby.
Morrison Low Removed the cost associated with an increase in staff over the long run from the cost-benefit calculations. The increase in staff costs is stated to be linked to an increase in services, which represents an offsetting benefit to the community.
Ashfield/Burwood/ Canada Bay/Leichhardt/ Marrickville/Strathfield (ILGRP merger)
Morrison Low Removed the cost associated with an increase in staff over the long run from the cost-benefit calculations. The increase in staff costs is stated to be linked to an increase in services, which represents an offsetting benefit to the community.. Removed assumption of reduction in waste levy is a cost as this still represents a benefit to the community.
Hornsby, Ku-ring-gai KPMG Consultant data showed savings for selected years. IPART extrapolated the estimated savings using an inflation factor.IPART added merger assistance grant.

D Analysis of merger business cases
412 IPART Assessment of Council Fit for the Future Proposals
Merger options evaluated
Business case prepared by
Adjustments made by IPART in addition to standardising the discount rate, term, and base year
Manly/Warringah/ Pittwater
KPMG Adjusted borrowing costs resulting from merger to reflect impact of merger assistance grant where relevant.
Manly/Warringah/ Pittwater
SGS Economics and Planning
Based on reference council model. Added merger assistance grant. Applied a ceiling to estimated savings.
Fairfield/Liverpool Fairfield City Council Fairfield City Council estimated cumulative costs of $27 million from a merger of Fairfield and Liverpool. We consider the assumptions underlying the estimate to be based on a limited sample and to be contrary to other models provided to IPART regarding benefits from mergers.
Canterbury/Kogarah/ Rockdale/Hurstville
Morrison Low Removed the cost associated with an increase in staff over the long run from the cost-benefit calculations. The increase in staff costs is stated to be linked to an increase in services, which represents an offsetting benefit to the community.
Bankstown/Canterbury Bankstown City Council
The information provided by Bankstown City Council only extended to annual estimates of savings. In order to estimate an indicative NPV of benefits, IPART included assumptions for the timing of costs/benefits, assumptions for inflation effects and assumptions for merger implementation costs. Given the assumptions used, the calculated NPV should be regarded as indicative.
Maitland/Dungog Morrison Low Removed the cost associated with an increase in staff over the long run from the cost-benefit calculations. The increase in staff costs is stated to be linked to an increase in services, which represents an offsetting benefit to the community.
Gosford/Wyong Third Horizon Scaled NPV results from Wyong.
Bombala/Cooma-M /Snowy River
KPMG Consultant data showed savings for selected years. IPART extrapolated the estimated savings using an inflation factor.IPART added merger assistance grant.
Gloucester/Great Lakes Morrison Low Removed the cost associated with an increase in staff over the long run from the cost-benefit calculations. The increase in staff costs is stated to be linked to an increase in services, which represents an offsetting benefit to the community.
Orange/Cabonne Morrison Low Removed the cost associated with an increase in staff over the long run from the cost-benefit calculations. The increase in staff costs is stated to be linked to an increase in services, which represents an offsetting benefit to the community.

D Analysis of merger business cases
Assessment of Council Fit for the Future Proposals IPART 413
Merger options evaluated
Business case prepared by
Adjustments made by IPART in addition to standardising the discount rate, term, and base year
Parkes/Lachlan Morrison Low Insufficient information in business case to make adjustment.
Leeton/Narrandera Morrison Low Removed the cost associated with an increase in staff over the long run from the cost-benefit calculations. The increase in staff costs is stated to be linked to an increase in services, which represents an offsetting benefit to the community.
Murrumbidgee/ Jerilderie
SGS Economics and Planning
Insufficient information in business case to make any adjustment.
Queanbeyan, Palerang LKS Quaero Assumptions were made for the timing of merger related benefits and costs.
Berrigan/Jerilderie SGS Economics and Planning
Insufficient information in business case to make any adjustment.
Deniliquin/Murray/ Wakool
LKS Quaero Assumptions were made for the timing of merger related benefits and costs.
Deniliquin/Murray LKS Quaero Assumptions were made for the timing of merger related benefits and costs.
Boorowa/ Young merger
NA Derived from LKS Quaero report on Boorowa/Harden/Young. Adjustment made to account for removal of Harden from merger.
Cootamundra/Harden Council Adjustment made to remove selected non-merger related costs.

E Ernst & Young consultant report - Fit for the Future: Review of Business Case Estimates of Merger Net Benefits for Sydney Metropolitan Councils
414 IPART Assessment of Council Fit for the Future Proposals
E Ernst & Young consultant report - Fit for the Future: Review of Business Case Estimates of Merger Net Benefits for Sydney Metropolitan Councils

Fit for the futureReview of Business Case Estimates of Merger Net Benefits forSydney Metropolitan Councils
IPART
Confidential Final Report
October 2015
Review of Business Case Merger OptionsOctober 2015
| 1Liability limited by a scheme approved under Professional Standards Legislation
Table of contents
1. Executive summary ....................................................................................................................................................................................................2Background ........................................................................................................................................................................................................21.1Scope and approach ............................................................................................................................................................................................21.2Limitations .........................................................................................................................................................................................................41.3Key findings ........................................................................................................................................................................................................41.4
Literature review .............................................................................................................................................................................................41.4.1Benchmarks from corporate transactions ...........................................................................................................................................................61.4.2Assessment of merger options ..........................................................................................................................................................................61.4.3
2. Introduction ............................................................................................................................................................................................................13Background ......................................................................................................................................................................................................132.1Scope of work ...................................................................................................................................................................................................132.2Approach .........................................................................................................................................................................................................142.3Limitations .......................................................................................................................................................................................................152.4
Restrictions on Report Use .............................................................................................................................................................................152.4.1Basis of Our Work ..........................................................................................................................................................................................152.4.2Information received......................................................................................................................................................................................162.4.3
3. Potential impacts of local government structural reform ...............................................................................................................................................17ILGRP Report ....................................................................................................................................................................................................173.1Evidence from previous Australian local government inquiries .................................................................................................................................183.2Academic research ............................................................................................................................................................................................203.3
Other evidence .............................................................................................................................................................................................223.3.1Evidence from New Zealand local council amalgamations........................................................................................................................................243.4
Auckland Council...........................................................................................................................................................................................243.4.1Wellington region local government reorganisation ............................................................................................................................................263.4.2
Summary of findings from literature review and NZ experience ...............................................................................................................................303.5Implications for EY analysis ................................................................................................................................................................................313.6
4. The merger options..................................................................................................................................................................................................33The Independent Local Government Review Panel Report .......................................................................................................................................334.1The merger options explored by the councils .........................................................................................................................................................354.2
Summary of the council merger options ...........................................................................................................................................................354.2.1Methodology for assessing merger impacts ......................................................................................................................................................364.2.2
5. Assessment of the merger options .............................................................................................................................................................................39The ILGRP preferred merger options ....................................................................................................................................................................395.1
Expected costs and financial benefits from merger ............................................................................................................................................395.1.1Assumptions underpinning potential merger cost-benefit estimates .....................................................................................................................405.1.2Results of top-down analysis ...........................................................................................................................................................................425.1.3
Review of Business Case Merger OptionsOctober 2015
| 2Liability limited by a scheme approved under Professional Standards Legislation
Sensitivity analysis ........................................................................................................................................................................................435.1.4The merger options explored by the councils .........................................................................................................................................................475.2
Summary of local council merger options explored in submissions .......................................................................................................................475.2.1Assumptions underpinning submitted merger business cases ..............................................................................................................................515.2.2
EY analysis .......................................................................................................................................................................................................525.3Standardisation adjustments ..........................................................................................................................................................................535.3.1Other adjustments.........................................................................................................................................................................................545.3.2
6. Key findings ............................................................................................................................................................................................................58Appendix A Merger business cases reviewed ....................................................................................................................................................................63Appendix B Local council submitted merger business cases – key assumptions .....................................................................................................................65

Review of Business Case Merger OptionsOctober 2015
| 2Liability limited by a scheme approved under Professional Standards Legislation
1. Executive summary
Background1.1The NSW Government has been working with NSW councils since 2011 to achieve a shared vision of stronger local communities. As part of this process, in March 2012, theState appointed the Independent Local Government Review Panel (ILGRP) to review Local Government in NSW and make recommendations for reform.
The ILGRP’s report was completed in October 2013.1 Amongst a range of Fit for the Future (“FFTF”) reforms, the ILGRP’s preferred option was the merger of 32 Sydneymetropolitan councils into 8 larger councils. This would replicate reforms undertaken in most other states.
The NSW Government had requested all councils in NSW to submit a proposal demonstrating how they meet the criteria by 30 June 2015, which would then be assessed byIPART, as the appointed Expert Advisory Panel.
Scope and approach1.2EY has been instructed by IPART to:
• Model and estimate the long term costs and benefits in Net Present Value (NPV) terms, of the 8 council merger combinations in the Sydney Metropolitan Area identifiedas preferred merger options as outlined in the ILGRP report. In addition, IPART has requested EY undertake similar analysis for other sets of mergers:
• Botany Bay, Randwick, Waverley and Woollahra Councils (without the City of Sydney Council)
• Gosford and Wyong Councils, Bankstown and Canterbury Councils, Hawkesbury and the Hills Councils – these three merger scenarios did not form part of theILGRP’s preferred options but the Panel recommended that they be further explored.
• Randwick and Waverley Councils, and Auburn, Burwood and Canada Bay Councils – these are not part of the ILGRP’s preferred options but these councils have putforward voluntary merger proposals and business cases that IPART would like to further explore
1 Final Report of the NSW Independent Local Government Review Panel, Revitalising Local Government, October 2013
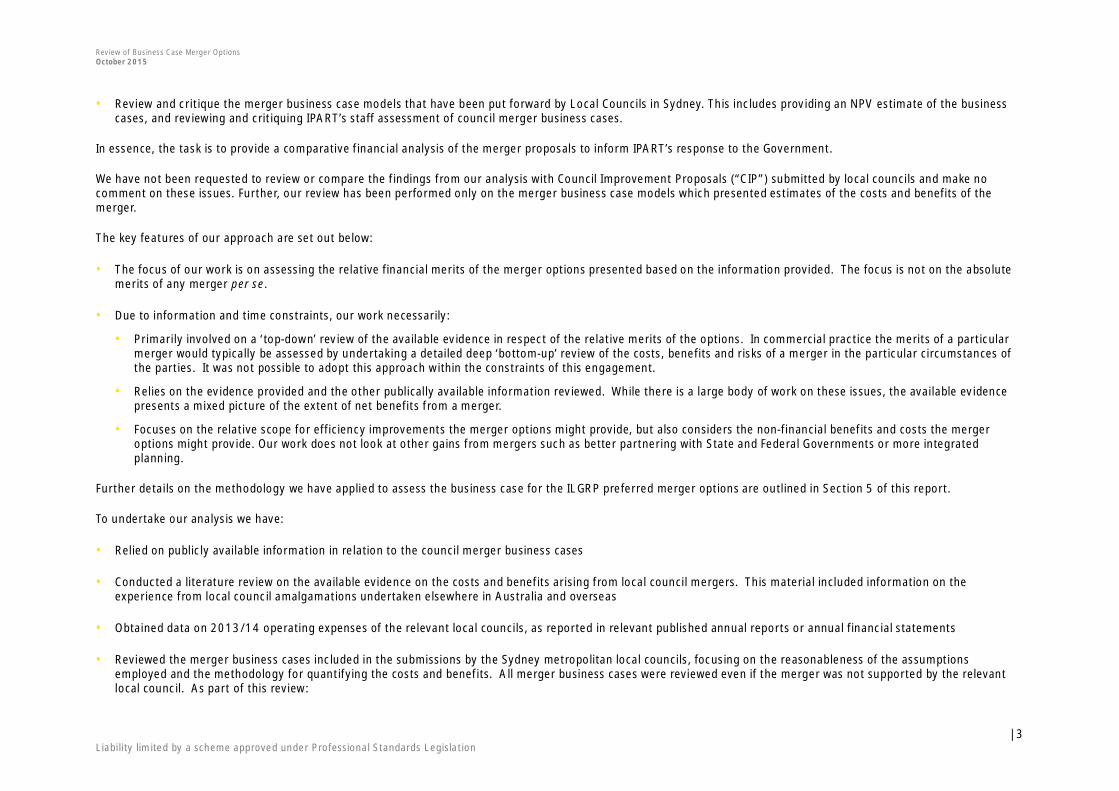
Review of Business Case Merger OptionsOctober 2015
| 3Liability limited by a scheme approved under Professional Standards Legislation
• Review and critique the merger business case models that have been put forward by Local Councils in Sydney. This includes providing an NPV estimate of the businesscases, and reviewing and critiquing IPART’s staff assessment of council merger business cases.
In essence, the task is to provide a comparative financial analysis of the merger proposals to inform IPART’s response to the Government.
We have not been requested to review or compare the findings from our analysis with Council Improvement Proposals (“CIP”) submitted by local councils and make nocomment on these issues. Further, our review has been performed only on the merger business case models which presented estimates of the costs and benefits of themerger.
The key features of our approach are set out below:
• The focus of our work is on assessing the relative financial merits of the merger options presented based on the information provided. The focus is not on the absolutemerits of any merger per se.
• Due to information and time constraints, our work necessarily:
• Primarily involved on a ‘top-down’ review of the available evidence in respect of the relative merits of the options. In commercial practice the merits of a particularmerger would typically be assessed by undertaking a detailed deep ‘bottom-up’ review of the costs, benefits and risks of a merger in the particular circumstances ofthe parties. It was not possible to adopt this approach within the constraints of this engagement.
• Relies on the evidence provided and the other publically available information reviewed. While there is a large body of work on these issues, the available evidencepresents a mixed picture of the extent of net benefits from a merger.
• Focuses on the relative scope for efficiency improvements the merger options might provide, but also considers the non-financial benefits and costs the mergeroptions might provide. Our work does not look at other gains from mergers such as better partnering with State and Federal Governments or more integratedplanning.
Further details on the methodology we have applied to assess the business case for the ILGRP preferred merger options are outlined in Section 5 of this report.
To undertake our analysis we have:
• Relied on publicly available information in relation to the council merger business cases
• Conducted a literature review on the available evidence on the costs and benefits arising from local council mergers. This material included information on theexperience from local council amalgamations undertaken elsewhere in Australia and overseas
• Obtained data on 2013/14 operating expenses of the relevant local councils, as reported in relevant published annual reports or annual financial statements
• Reviewed the merger business cases included in the submissions by the Sydney metropolitan local councils, focusing on the reasonableness of the assumptionsemployed and the methodology for quantifying the costs and benefits. All merger business cases were reviewed even if the merger was not supported by the relevantlocal council. As part of this review:
Review of Business Case Merger OptionsOctober 2015
| 4Liability limited by a scheme approved under Professional Standards Legislation
• We have made inquiries with staff at IPART to confirm, clarify or request additional information. Where additional information was requested, this was only providedto the extent that IPART was able to obtain that information
• We were not asked to and have not had any direct consultations with the Sydney metropolitan local councils or the authors of the relevant merger business cases.For this reason, our analysis does not take into account the specific operating circumstances and business characteristics of each of the local council mergerscenarios examined, which is typically important in identifying the extent to which merger cost savings may be achievable in any particular instance
• We have relied on the information presented within the business cases and have not undertaken an audit of the available information.
• Reviewed the preferred merger options made in the ILGRP report:
• In this regard, we note while the ILGRP expressed a preference for a number of mergers, quantitative analysis was not undertaken to test the economic merits of theproposals
• In estimating the long term costs and benefits of the ILGRP’s preferred merger options, we have therefore considered the evidence from the available literature, theevidence based on our commercial experience with corporate acquisitions and/or mergers, as well as our consideration of the extent to which those savings are likelyto be achievable for public sector organisations. We have also considered the analysis in the councils’ merger business cases.
• Estimated the NPV of the merger costs and savings identified over a 20 year timeframe, applying a real discount rate of 7% which is consistent with the requirements ofthe NSW Government Guidelines for Economic Appraisals. We have also undertaken sensitivity analysis of the NPV outcomes using real discount rates of 4% and 10%.
Limitations1.3We have not independently verified, or accept any responsibility or liability for independently verifying, any information provided to us by IPART or information obtained inthe public domain for the purpose of this review, nor do we make any representation as to the accuracy or completeness of the information.
Our work in connection with this assignment is of a different nature to that of an audit or a review of information, as those terms are understood in Australian AuditingStandards applicable to audit and review engagements. Our report to you is based on inquiries of and discussions with IPART, a review of the business and other documentsmade available to us, and analytical procedures applied to data provided.
Our work commenced on 18 August 2015 and was completed on 9 October 2015. In that time, we assessed the ILGRP preferred merger options (and 5 variations aroundthose options) and reviewed 29 merger business cases presented by the councils. It was undertaken as a desktop exercise and we relied on the information submitted in therelevant merger business cases. As a result, there may be findings or information not included in this report, or our investigations may not have revealed, all relevantmatters. The reliance that can be placed on our report may therefore be limited in that regard.
Key findings1.4
Literature review1.4.1
As part of this engagement, EY has reviewed a large amount of literature and empirical research on the impact of local government structural reform to inform ourestimation of potential merger costs and benefits. Some of this literature has been generated from previous local government financial sustainability reviews in variousAustralian states. Others have been generated from council reorganisations outside of Australia.

Review of Business Case Merger OptionsOctober 2015
| 5Liability limited by a scheme approved under Professional Standards Legislation
Full details of our review are documented in Section 3 of this report.
To briefly summarise, the key findings from our literature review are as follows:
• The extent to which cost savings have been achieved in previous local council reforms may be difficult to measure particularly over the longer term as any cost savingsgenerated are most likely to have been re-directed towards service expansion over that timeframe. As such, the capacity of long term outcomes from actual experienceto inform estimates of potential cost savings from local council amalgamations may be limited, without also including the cost savings that would have been put intoenhanced service delivery.
• The available empirical evidence on the extent to which local council amalgamations will yield net savings in costs is mixed and tends to vary by activity. Econometricanalysis does not provide strong support. Evidence from the Auckland local governance reforms suggests that potentially large opex savings could be achievable(although translation of New Zealand evidence into an Australian context must be done with caution).
• In principle, it is reasonable to expect that opportunities for cost savings to flow from the scale effects associated with local council amalgamations, however, theirmagnitude is likely to vary by type of activity and may diminish for councils that are already large. The available evidence suggests the key sources of savings are fromremoval of duplicated activities / functions, IT and in procurement. Governance and administration is potentially a key area where cost savings would materialise.
• There is limited evidence available on the financial costs associated with local council amalgamations.
• The evidence from the QTC’s assessment of merger costs in Queensland is the most relevant Australian evidence available. This indicated assessed merger costs of$195m over 4 years. The benefits shown in the report, however, did not provide sufficient data as to the time profile of the $129m of estimated merger benefits. Ifit is assumed that $15m is realised in year 1, $25m in year 2, $40m in year 3 and $49m in year 4, this would imply that merger costs were approximately 4xestimated annualised merger benefits. Alternatively, a more conservative ramp up profile – for example $10m in year 1, $20m in year 2, $40m in year 3 and $59min year 4 – would yield a ratio of merger costs to estimated annualised merger benefits of 3.3x.
• The Auckland Transition Authority in Auckland had incurred transition costs of $36.2m when it was dis-established in October 2010 however, this figure is likely tounderstate transition costs that would have been incurred post Day 1 of the new merged Auckland Council. Original estimates of merger costs indicated a range of1.0x to 3.1x annualised efficiency gains.
• The estimates from the proposed Wellington (NZ) local council amalgamations indicates very high ratios of merger costs to benefits (around 5x-7x for the preferredoption) and it has been acknowledged that the approach has been to over-estimate costs and to under-estimate savings.
• There are a range of potential risks associated with local council amalgamations that are identified in literature, most commonly, costs of disruption, workplace culturalbarriers, decreased local democracy and representation and other challenges associated with implementation. Whilst these exist, they can potentially be minimisedthrough proper planning and implementation.
• There is a view the costs associated with amalgamation are large and often under-estimated, particularly costs associated with new systems, cultures and operatingstructures.

Review of Business Case Merger OptionsOctober 2015
| 6Liability limited by a scheme approved under Professional Standards Legislation
Benchmarks from corporate transactions1.4.2
EY has considered the key takeaways from our literature review against our own experience on cost savings that are potentially achievable from corporate transactions.These benchmarks are summarised in the table below.
Table 1: Benchmark synergies from corporate transactions
Rate of expenditure cost savings 15-25% of the target cost base insynergies
In a corporate transaction with similar businesses, synergies up to 30% of the target’s cost base areoften targeted. On average, 15% of the target cost base is targeted.Synergies are often highest in the support functions and overheads – the savings frequently reach50% to 60% of the target’s costs in some areas (e.g. the executive teams, back office support costs)
Time taken to achieve synergies 2-3 years average time for the full runrate of synergies to be realised
The time to fully realise synergies differs depending on the transaction complexity. The range forfull synergy realization is between 2 to 5 years. Where the synergies are related to majorinfrastructure, capital expenditure or IT, these will typically be towards the upper end of the range.In most transactions the alignment of the core operating system or ERP has the longest lead time
Merger integration costs 0.9 – 1.1 average typical ratio of one-offintegration costs to annualized synergyvalue
In some cases the implementation costs can be prohibitive to realising the potential synergies,particularly in cash flow constrained sectors.
Communication rate ~ 60% of companies announce successfulachievement of synergies
Where transaction business case involves a synergy component, companies are often obliged tocommunicate the synergy targets. The communicated targets do not typically ‘pay away’ the fullsynergy estimate. Ongoing communication of synergy targets is highly variable and can be impactedby failure to achieve the targets, change in integration priorities or simply a lack of robust andreliable tracking.
Notwithstanding these broad benchmarks, in our experience, we would expect mergers in the public sector:
• To achieve more conservative levels of synergies in costs (e.g. the lower end of our scale may be the higher end of an achievable range). With local councils, concernsabout risks to service levels may imply less aggressive cost reduction targets, or may result in cost savings being ploughed back into better services. In the case of thelatter, the benefits are less visible but are nevertheless real benefits.
• To achieve realization of full benefits over a longer time frame (i.e. closer to 5 years)
• To incur larger one-off integration costs due to more complex stakeholder management and other factors.
Assessment of merger options1.4.3
ILGRP preferred merger options
EY has estimated the potential costs and benefits associated with the merger options preferred by the ILGRP primarily using a “top-down” approach, over a 20 yeartimeframe. Our data on operating expenditure is based on those publicly reported for each council for 2013-14 financial year.

Review of Business Case Merger OptionsOctober 2015
| 7Liability limited by a scheme approved under Professional Standards Legislation
This approach requires us to estimate a range of inputs to estimate the potential costs and benefits of the ILGRP merger options. In estimating the long term costs andbenefits of the ILGRP preferred merger options, we have used the ‘top down’ method outlined in Section 1.2.
• We have conservatively estimated that potential opex savings of 10% to 15% p.a. of a cost base which comprises the total opex of the entities merging, less the opex ofthe entity with the largest cost base. This rate of efficiency gain is below the 15-25% rate usually targeted in corporate transactions. We have assumed a lower rate ofsavings in view of the mixed evidence around the achievement of efficiency gains in local council amalgamations. Whilst we expect that a large proportion of thepotential opex savings will relate to rationalisation of back-office functions, we have applied the rate of savings to the total opex line. An alternative approach is to applyvarying rates of cost savings to different categories of costs. For example, our experience with corporate transactions indicates that in the executive and corporategovernance function, reduction in council members and consolidation of the executive team could potentially generate savings of 60-80%, supplier rationalisation couldpotentially generate savings of 15-25% in procurement costs and consolidation of IT functions and applications could potentially generate savings of 20-30%. It has notbeen possible to take a more disaggregated approach to identifying cost savings in this instance as we do not have access to cost data that have been appropriatelydeconstructed.
• Potential opex savings are assumed to be realised in full over a period of 5 years. The ramp-up rate we have assumed over the 5 year period is 30% by year 1, 60% byyear 2, 80% by year 3, 90% by year 4 and 100% by year 5.
• Having considered the evidence in merger integration costs as summarised in Section 1.4.1 above, we have estimated once-off merger integration costs at the rate of3.0 times the annualised expenditure saving. The exception to this are the mergers involving Marrickville, Ashfield, Burwood, Canada Bay, Leichardt and StrathfieldCouncils, Auburn, Holroyd and Parramatta Councils together with parts of the Hills and Ryde Councils, Botany Bay, Sydney, Waverley, Randwick and Woollahra Councilsand Hunters Hill, Lane Cove, Mosman, North Sydney, Willoughby and part Ryde. We understand these four merger options were regarded by the NSW ParliamentaryBudget Office, based on advice from the Office of Local Government, as being of “very high” complexity in their costing of council mergers. For these four mergeroptions, we have therefore assumed merger integration costs at the rate of 4.0 times the annualized expenditure saving.2
• Merger integration costs are assumed to be incurred over 5 years, and front end loaded over this period. Specifically, we have assumed that 60% of these costs will beincurred in year 1, 20% in year 2, 10% in year 3, 7% in year 4 and 3% in year 5. This expenditure profile reflects our experience that the majority of the costs will beincurred in the first two years and will relate to initial setting up of the merger implementation program, staffing changes, integration of back office functions, initialbusiness process redesign and consolidation of IT functions and applications. Costs incurred in years 3 to 5 will likely reflect residual costs associated with ongoing ITintegration.
These estimates form our base case NPV analysis. The base case NPV of net merger benefit / (cost) outcomes for each ILGRP preferred merger scenario is summarised inTable 2 below. As mentioned earlier, our NPVs are calculated using real discount rates.
2 NSW Parliamentary Budget Office (PBO) costing of council mergers, Briefing Note.

Review of Business Case Merger OptionsOctober 2015
| 8Liability limited by a scheme approved under Professional Standards Legislation
Table 2: Top down analysis of ILGRP metropolitan local council preferred merger options over 20 years (Base Case)
Merger scenario NPV range 4% @ 2016$’000
NPV range 7% @ 2016$’000
NPV range 10% @ 2016$’000
ILGRP preferred merger options
1 Manly + Warringah +Pittwater 131,470 - 197,204 92,589 - 138,883 66,177 - 99,266
2 Hornsby + Ku-ring-gai 100,408 - 150,611 70,713 - 106,070 50,542 - 75,812
3 Fairfield + Liverpool 148,921 - 223,381 104,879 - 157,318 74,961 - 112,442
4 Canterbury + Kogarah + Rockdale + Hurstville 195,898 - 293,847 137,963 - 206,945 98,608 - 147,912
5 Hunters Hill + Lane Cove + Mosman + North Sydney + Ryde (2/3) + Willoughby 221,023 - 331,535 149,624 - 224,437 101,384 - 152,076
6 Randwick + Waverley + Woollahra + Botany Bay + Sydney 335,015 - 502,522 226,793 - 340,189 153,672 - 230,508
7 Ashfield + Burwood + Canada Bay + Leichhardt + Marrickville + Strathfield 229,663 - 344,495 155,473 - 233,210 105,347 - 158,020
8 Auburn + Holroyd + Parramatta + The Hills (15%) + Ryde (1/3) 177,434 - 266,151 120,116 - 180,174 81,389 - 122,084
Additional merger options identified by ILGRP or councils and requested by IPART
9 Randwick + Waverley + Woollahra + Botany Bay 247,159 - 370,739 174,065 - 261,097 124,411 - 186,617
10 Bankstown + Canterbury 97,170 - 145,755 68,433 - 102,650 48,912 - 73,368
11 Gosford + Wyong 222,831 - 334,247 156,931 - 235,397 112,165 - 168,248
12 Randwick + Waverley 112,555 - 168,832 79,268 - 118,902 56,656 - 84,984
13 Auburn + Burwood + Canada Bay 100,262 - 150,393 70,611 - 105,916 50,468 - 75,703
14 Hawkesbury + The Hills 68,069 - 102,104 47,938 - 71,908 34,263 - 51,395
Our base case analysis indicates all of the ILGRP preferred merger options have large NPV positive estimate and will produce net merger benefits, lending strong support tothe public interest for the mergers. Our NPV range for each merger scenario is reasonably wide and reflects the combination of assumptions we have adopted on potentialmerger benefits and costs. We expect the degree to which net merger benefits will be achievable in each scenario will depend on the specific circumstances of the relevantcouncils in each merger scenario. In some cases, it could be that potential net merger benefits would be closer to the low end of the range, whilst in other cases, net mergerbenefits may be higher.

Review of Business Case Merger OptionsOctober 2015
| 9Liability limited by a scheme approved under Professional Standards Legislation
To understand the NPV impact of variations around our key assumptions, we have examined three hypothetical scenarios:
1. A delay in the achievement of merger cost savings – We have modelled a scenario where savings ramp up to full realisation at a constant rate over 5 years.
2. Understatement of merger costs – We have modelled the impact of a 50% increase in merger costs
3. A combination of the above two scenarios.
As modelled, the delay in achieving potential merger benefits reduces the NPV (@ 7%) of net merger benefits by 8.1%, on average across all merger options, whilst a 50%rise in estimated merger costs reduces NPV outcomes by 24.3%, on average across all merger options.
Nevertheless, in all of the above 3 scenarios, net merger outcomes remain positive for all merger options. The sensitivity analysis suggests the case for the mergersgenerating significant positive benefits is likely under a range of scenarios.
Merger options explored by local councils
We have reviewed the merger options submitted by the local councils. Some of the submissions explored alternative merger options to the ILGRP preferred options, eventhough most of the local councils did not support amalgamation. Where cost-benefit analysis was undertaken, the majority of the options we were instructed to review wereprepared by Morrison Low, SGS Consulting and KPMG, with a handful either self-assessed or prepared by other consultants.
The extent of detail provided in the submitted merger business cases varied significantly. In some cases, forecast cash flows reflecting estimated merger costs and benefitswere provided but no NPV result was calculated. In these cases, where possible, EY has inferred an NPV estimate based on the data provided. In a few cases, merger costsand merger benefits were not separated but net merger cash flows were provided. Additionally, in some cases, the merger costs and benefits were revised by the relevantcouncil or its consultant subsequent to the original submission in response to inquiries made by IPART.
There were also variations in the level of discount rate applied and some of the merger business case analyses were undertaken in real terms whilst others were undertakenin nominal terms. The length of the cash flow period also varied between business cases.
All of the merger business cases we reviewed incorporated assumptions on merger integration costs, with the exception of the merger business case prepared by BankstownCouncil for the merger of Bankstown and Canterbury. Key sources of costs include staff redundancies, ICT transition costs, branding and remuneration harmonisation.
All of the merger business cases we reviewed also identified net merger benefits except for the merger business case prepared by Fairfield Council for the merger of Fairfieldand Liverpool Councils. Key sources of cost savings included staffing where there were duplicated functions and roles, reduction of governance costs due to having agovernance structure which was scaled to the size of the merged council, savings in procurement functions through rationalisation of works units and materials, reduced ITcosts through ICT consolidation and certain property-related savings due to a reduction in number of office sites.
NPVs reported (or inferred by EY) for all business cases were positive except for two mergers – the merger business case prepared by SGS assessing the impact of splittingWarringah Council into two, merging one half with Manly and one half with Pittwater to create two new councils, and the business case prepared by Fairfield and LiverpoolCouncils.
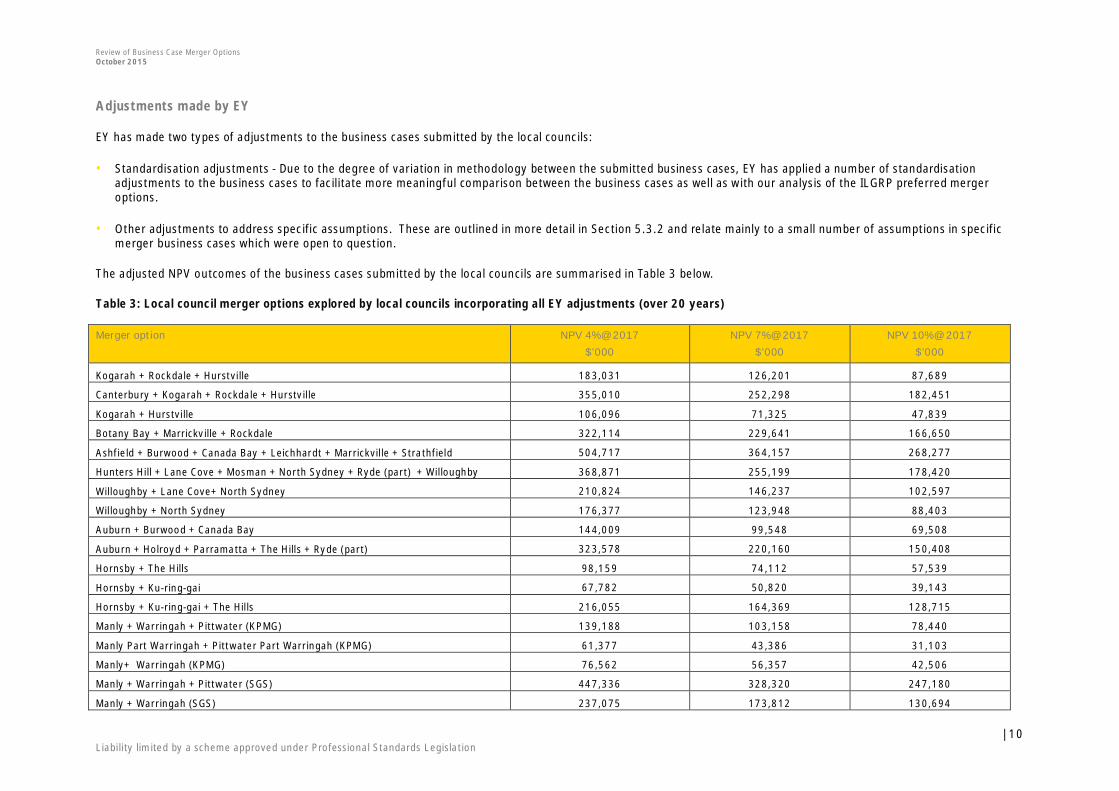
Review of Business Case Merger OptionsOctober 2015
| 10Liability limited by a scheme approved under Professional Standards Legislation
Adjustments made by EY
EY has made two types of adjustments to the business cases submitted by the local councils:
• Standardisation adjustments - Due to the degree of variation in methodology between the submitted business cases, EY has applied a number of standardisationadjustments to the business cases to facilitate more meaningful comparison between the business cases as well as with our analysis of the ILGRP preferred mergeroptions.
• Other adjustments to address specific assumptions. These are outlined in more detail in Section 5.3.2 and relate mainly to a small number of assumptions in specificmerger business cases which were open to question.
The adjusted NPV outcomes of the business cases submitted by the local councils are summarised in Table 3 below.
Table 3: Local council merger options explored by local councils incorporating all EY adjustments (over 20 years)
Merger option NPV 4% @ 2017$’000
NPV 7% @ 2017$’000
NPV 10% @ 2017$’000
Kogarah + Rockdale + Hurstville 183,031 126,201 87,689
Canterbury + Kogarah + Rockdale + Hurstville 355,010 252,298 182,451
Kogarah + Hurstville 106,096 71,325 47,839
Botany Bay + Marrickville + Rockdale 322,114 229,641 166,650
Ashfield + Burwood + Canada Bay + Leichhardt + Marrickville + Strathfield 504,717 364,157 268,277
Hunters Hill + Lane Cove + Mosman + North Sydney + Ryde (part) + Willoughby 368,871 255,199 178,420
Willoughby + Lane Cove+ North Sydney 210,824 146,237 102,597
Willoughby + North Sydney 176,377 123,948 88,403
Auburn + Burwood + Canada Bay 144,009 99,548 69,508
Auburn + Holroyd + Parramatta + The Hills + Ryde (part) 323,578 220,160 150,408
Hornsby + The Hills 98,159 74,112 57,539
Hornsby + Ku-ring-gai 67,782 50,820 39,143
Hornsby + Ku-ring-gai + The Hills 216,055 164,369 128,715
Manly + Warringah + Pittwater (KPMG) 139,188 103,158 78,440
Manly Part Warringah + Pittwater Part Warringah (KPMG) 61,377 43,386 31,103
Manly+ Warringah (KPMG) 76,562 56,357 42,506
Manly + Warringah + Pittwater (SGS) 447,336 328,320 247,180
Manly + Warringah (SGS) 237,075 173,812 130,694

Review of Business Case Merger OptionsOctober 2015
| 11Liability limited by a scheme approved under Professional Standards Legislation
Merger option NPV 4% @ 2017$’000
NPV 7% @ 2017$’000
NPV 10% @ 2017$’000
Pittwater + Warringah [Additional Option] (SGS) 227,595 166,777 125,332
Manly Part Warringah + Pittwater Part Warringah (SGS) (335,096) (247,788) (188,177)
Fairfield + Liverpool 167,779 124,462 95,049
Bankstown + Canterbury 116,512 82,055 58,648
Gosford + Wyong 179,967 126,363 90,527
Randwick + Waverley + Woollahra + Botany Bay + Sydney 523,554 389,275 297,062
Randwick + Waverley 176,250 127,308 93,800
Randwick + Waverley + Woollahra + Botany Bay 497,300 365,084 274,499
Following the adjustments we have made, NPV outcomes have improved for all merger scenarios except for the scenario (prepared by SGS) where Warringah Council is splitinto two, merging one half with Manly and one half with Pittwater to create two new councils, which remains negative. We note there remain substantial variations betweenthe merger business cases prepared by KPMG and SGS in relation to the various combinations of merger involving Manly, Pittwater and Warringah Councils. For example,based on the adjusted figures reported in the table above, the merger scenario which involves splitting Warringah Council has a negative NPV (at 7%) of $247m as assessedby SGS and a positive NPV of $43m as assessed by KPMG.
Overall findings on ILGRP preferred options
The chart below compares:
• The NPV outcomes for the ILGRP preferred merger options and the additional Bankstown + Canterbury, Gosford + Wyong, Randwick + Waverley, Auburn + Burwood +Canada Bay, and Hawkesbury + The Hills options that we have been asked to assess, based on EY’s top-down methodology (“EY top-down approach”); with
• The NPV outcomes for the same options where they have been explored in local council submissions, incorporating the adjustments made by EY (“adjusted reportedNPV”).

Review of Business Case Merger OptionsOctober 2015
| 12Liability limited by a scheme approved under Professional Standards Legislation
Figure 1: Comparison of EY NPV range against adjusted reported NPVs ($’000)
The adjusted reported NPV of net merger outcomes are all positive. In addition, they are higher than or within the NPV range based on EY’s top down approach except forthe mergers involving Hornsby+Ku-ring-gai Councils and Gosford+Wyong Councils.
Further analysis on the level of merger costs versus merger benefits in these scenarios indicates there is more variation around views on merger costs and merger benefits.In most cases, local councils’ estimates of merger costs are lower than EY’s, but there appears to be reasonable level of alignment in views on merger benefits with a fewexceptions.
We are of the view our analysis is conservative but prudently so in light of the work that has been undertaken.
Irrespective of differing views on the size of potential merger benefits and merger costs, there is strong consensus that net merger outcomes are positive in all of the listedscenarios above. They are also robust based on our sensitivity analysis.
0
50,000
100,000
150,000
200,000
250,000
300,000
350,000
400,000
450,000
Manly WarringahPittwater(KPMG)
Manly WarringahPittwater (SGS)
Hornsby Ku-ring-gai
FairfieldLiverpool
CanterburyKograh Rockdale
Hurstville
Hunters Hill LaneCove MosmanNorth Sydney
Ryde Willoughby
RandwickWaverley
Woolahra BotanyBay Sydney
RandwickWaverleyWoollahraBotany Bay
Ashfield BurwoodCanada BayLeichhardtMarrickvilleStrathfield
Auburn HolroydParramatta The
Hills Ryde
BankstownCanterbury
Gosford Wyong RandwickWaverley
Auburn BurwoodCanada Bay
Hawkesbury TheHills
EY NPV Range Adjusted reported NPV

Review of Business Case Merger OptionsOctober 2015
| 13Liability limited by a scheme approved under Professional Standards Legislation
2. Introduction
Background2.1The NSW Government has been working with NSW councils since 2011 to achieve a shared vision of stronger local communities. As part of this process, in March 2012, theState appointed the Independent Local Government Review Panel (ILGRP) to review Local Government in NSW and make recommendations for reform.
The ILGRP’s report was completed in October 2013.3 It established four key criteria which define a Fit for the Future (FFTF) council and proposed a range reforms to meetthis objective.4 Of most relevance to this report, the ILGRP preferred option was the merger of 32 Sydney metropolitan councils into 8 larger councils. This would replicatereforms undertaken in most other states.
In response to the ILGRP Report, the State announced a $1 billion reform package to provide support and incentives to help councils become more sustainable.
The State Government expected that each council would use the ILGRP’s proposals for their council as a point of commencement and consideration, and assess its currentsituation and demonstrate how it intends to become FFTF.
The NSW Government requested all councils in NSW to submit a proposal demonstrating how they meet the criteria by 30 June 2015, which will then be assessed by IPART,as the appointed Expert Advisory Panel.
Scope of work2.2EY has been instructed by IPART to:
• Model and estimate the long term costs and benefits in Net Present Value (NPV) terms, of the 8 council merger combinations in the Sydney Metropolitan Area identifiedas preferred merger options in the ILGRP report. In addition, IPART has requested EY to undertake similar analysis for three other sets of mergers – Gosford and Wyong
3 Final Report of the NSW Independent Local Government Review Panel, Revitalising Local Government, October 20134 These are scale and capacity, financial sustainability, effective infrastructure and service management, and efficiency.
Review of Business Case Merger OptionsOctober 2015
| 14Liability limited by a scheme approved under Professional Standards Legislation
Councils, Bankstown and Canterbury Councils, and Hawkesbury and The Hills Councils. These three merger scenarios did not form part of the ILGRP’s preferred optionsbut the Panel recommended that they be further explored.
• Review and critique the merger business case models that have been put forward by Local Councils in Sydney. This includes providing an NPV estimate of the businesscases, and reviewing and critiquing IPART’s staff own assessment and analysis of the council merger business cases.
In essence, the task is to provide a comparative financial analysis of the merger proposals to inform IPART’s response to the Government.
We have not been requested to review or compare the findings from our analysis with CIPs submitted by local councils and make no comment on such issues.
This report documents our analysis and findings.
Approach2.3The key features of our approach are set out below:
• The focus of our work is on assessing the relative financial merits of the merger options presented based on the information provided. The focus is not on the absolutemerits of any merger per se.
• Due to information and time constraints, our work necessarily:
• Primarily involved on a ‘top-down’ review of the available evidence in respect of the relative merits of the options. In commercial practice the merits of a particularmerger would typically be assessed by undertaking a detailed deep ‘bottom-up’ review of the costs, benefits and risks of a merger in the particular circumstances ofthe parties.
• Relies entirely on the evidence provided and the other publically available information reviewed. While there is a large body of work on these issues, there is arelatively limited amount of commercial evidence on the practical impacts of council mergers.
• Focuses on the relative scope for efficiency improvements that the merger options might provide, but also considers the non-financial benefits and costs the mergeroptions might provide.
Further details on the methodology we have applied to assess the business case for the ILGRP preferred merger options are outlined in Section 5 of this report.
To undertake our analysis we have:
• Relied on publicly available information in relation to the council merger business cases
• Conducted a literature review on the available evidence on the costs and benefits arising from local council mergers. Some of this material included information on theexperience from local council amalgamations undertaken elsewhere in Australia and overseas
• Obtained data on 2013/14 operating expenses of the relevant local councils, as reported in relevant published annual reports or annual financial statements

Review of Business Case Merger OptionsOctober 2015
| 15Liability limited by a scheme approved under Professional Standards Legislation
• Reviewed the merger business cases included in the submissions by the Sydney metropolitan local councils, focusing on the reasonableness of the assumptionsemployed and the methodology for quantifying the costs and benefits. All merger business cases were reviewed even if the merger was not supported by the relevantlocal council. As part of this review:
• We have made inquiries with staff at IPART to confirm, clarify or request additional information. Where additional information was requested, this was only providedto the extent that IPART was able to obtain that information
• We have not had any direct consultations with the Sydney metropolitan local councils. For this reason, our analysis does not take into account the specific operatingcircumstances and business characteristics of each of the local council merger scenarios examined, which is typically important in identifying the extent to whichmerger cost savings may be achievable in any particular instance
• We have relied on the information presented within the business cases and have not undertaken an audit of the available information.
• Reviewed the preferred merger options in the ILGRP report:
• In this regard, we note that while the ILGRP expressed preference for a number of mergers, quantitative analysis was not undertaken to test the economic merits ofthe proposals
• In estimating the long term costs and benefits of the ILGRP preferred merger option, we have therefore considered the evidence from the available literature, theevidence based on our commercial experience with corporate acquisitions and/or mergers, as well as our consideration of the extent to which those savings are likelyto be achievable for public sector organisations.
• Estimated the NPV of the merger costs and savings identified over a 20 year timeframe, applying discount rates which are consistent with the requirements of the NSWGovernment Guidelines for Economic Appraisals. We have also undertaken sensitivity analysis of the NPV outcomes using real discount rates of 4% and 10%.
Limitations2.4
Restrictions on Report Use2.4.1
The Report may only be relied upon by IPART pursuant to the terms and conditions referred to in the Agreement. Any commercial decisions taken by IPART are not withinthe scope of our duty of care and in making such decisions IPART should take into account the limitations of the scope of our work and other factors, commercial orotherwise, of which you should be aware of from sources other than our work.
EY disclaims all liability to any party other than IPART for all costs, loss, damage and liability the third party may suffer or incur arising from or relating to or in any wayconnected with the provision of the Report to the third party without our prior written consent. If others choose to rely in any way on the Report they do so entirely at theirown risk.
Liability is limited by a scheme approved under professional standards legislation.
Basis of Our Work2.4.2
We have not independently verified, or accept any responsibility or liability for independently verifying, any information provided to us by IPART or information obtained inthe public domain for the purpose of this review, nor do we make any representation as to the accuracy or completeness of the information.

Review of Business Case Merger OptionsOctober 2015
| 16Liability limited by a scheme approved under Professional Standards Legislation
Our work in connection with this assignment is of a different nature to that of an audit or a review of information, as those terms are understood in Australian AuditingStandards applicable to audit and review engagements. Our report to you is based on inquiries of and discussions with IPART, a review of the business and other documentsmade available to us, and analytical procedures applied to data provided.
Our work commenced on 18 August 2015 and was completed on 2 October 2015. In that time, we assessed the ILGRP preferred merger options (and 5 variations aroundthose options) and reviewed 29 merger business cases presented by the councils. It was undertaken as a desktop exercise and we relied on the information submitted in therelevant merger business cases. As a result, there may be findings or information not included in this report, or our investigations may not have revealed, all relevantmatters. The reliance that can be placed on our report may therefore be limited in that regard.
In undertaking the work we have acted under the direction of IPART to complete the agreed scope of work and have not considered the interests of any other parties.
Information received2.4.3
All the information we have received is the responsibility of IPART and the relevant councils. We have not sought to establish the reliability of information given to us exceptas specifically stated in the report. Consequently, we give no assurance on such financial information.
References to EY in the report relate to our advice, recommendations and analysis and do not indicate that we take any responsibility for the information concerned or areassembling or associating ourselves with any financial information including prospective financial information. Appendix A provides a full list of the documents we havereviewed.
The underlying assumptions and projections contained with this Report are subject to significant uncertainties and contingencies often outside the control of EY or IPART. Ifevents do not occur as assumed, actual financial information may vary significantly from that in this Report. Accordingly, EY does not confirm or guarantee the achievementof the forecast financial information in this Report, as future events by their very nature, are not capable of independent substantiation.

Review of Business Case Merger OptionsOctober 2015
| 17Liability limited by a scheme approved under Professional Standards Legislation
3. Potential impacts of local government structural reform
There is a significant amount of available academic and empirical research on the impact of local government structural reform. Some of this literature has been generatedfrom previous local government financial sustainability reviews in various Australian States. This section of our report provides a brief summary of the literature that wehave reviewed.
ILGRP Report3.1As noted earlier, the ILGRP ‘s preferred option was the merger of 32 Sydney metropolitan councils into 8 large councils. Whilst the recommendation was not supported byquantitative analysis, it noted there was evidence that amalgamations were an effective way of achieving efficiency and economies of scale, service improvements andstrategic capacity. The evidence cited by the Panel is reproduced in the table below.
Table 4: Summary of Attributes of Different Forms of Consolidation.
Amalgamation Boundary Change Shared Services Regional Collaboration
Efficiency and Economies of Scale Strong link Potentially strong link subject tosize/disposition of re-shapedcouncils
Strong link Weak link
Strategic Capacity Strong link As above – benefits will flow tolarger ‘new’ councils
Potential medium-strong linksubject to organisation structureand governance
Weak link
Service improvement andinnovation
Strong link As above Strong link (but limited to servicesthat are effectively shared)
Potential link subject to nature andscope of collaboration
Potential Diminution of LocalDemocracy
Distinct risk, but can be managed Some risk depending on nature of‘new’ councils – can be managed
Risk where extensive decision-making is ceded to joint authority –may be difficult to manage
Little or no risk
Source: Table 4, Revitalising Local Government, Final Report of the NSW Independent Local Government Review Panel, October 2013, page 72.
The Panel also noted that:
“The principal arguments used against amalgamations are that there is no direct, general relationship between council size and the efficiency of service delivery; thatmergers will fail to produce worthwhile cost savings; that local identity and representation will suffer; and that regional cooperation and shared services can deliver thedesired outcome.”5
5 Revitalising Local Government, Final Report of the NSW Independent Local Government Review Panel, October 2013, page 73

Review of Business Case Merger OptionsOctober 2015
| 18Liability limited by a scheme approved under Professional Standards Legislation
However, it considered (amongst other things):
• The evidence shows for some local government functions, notably infrastructure and back-office functions, increased scale can and does bring efficiencies and costsavings
• A number of before and after case studies of individual amalgamations have shown significant efficiency gains, although not necessarily in the form of rate cuts becausesavings have been ploughed back into other service and infrastructure improvements
• Mechanisms such as Community Boards and new approaches to place management, community engagement and customer service make it possible to maintain localrepresentation and identity within larger council areas.
Evidence from previous Australian local government inquiries3.2As has been observed in a number of articles, since 2000, Australian local government has been exhaustively evaluated by a range of national and state-based publicinquiries. These include:
• The House of Representatives Standing Committee on Economics, Finance and Public Administration (2004) Rates and Taxes: A Fair Share for Responsible LocalGovernment (“Hawker Report”)
• The South Australian Financial Sustainability Review Board inquiry into the long term financial performance of South Australian local government (2005)
• The Financial Sustainability of NSW Local Government (‘Allan Report’) (2006) Are Councils Sustainable?
• The Local Government Association of Tasmania (“LGAT”) (2007), Review of the Financial Sustainability of Local Government in Tasmania
• The Queensland Local Government Reform Commission (“QLGRC”) (2007) Report of the Local Government Reform Commission, which began with the Size, Shape andSustainability (“SSS”) program launched by the Local Government Association of Queensland (”LGAQ”) in early 2005 and concluded with the final report of theQueensland Treasury Corporation (“QTC”) on Financial Sustainability in Queensland Local Government (October 2008).
Whilst the principal focus of most of these inquiries was on the financial sustainability of local government, they also sought to examine structural reform options throughamalgamation. Some of the observations and findings of these inquiries that are relevant to this report are summarised in Table 5 below.

Review of Business Case Merger OptionsOctober 2015
| 19Liability limited by a scheme approved under Professional Standards Legislation
Table 5: Selected Australian local government inquiries
Inquiry Relevant observations and findings
Hawker Report (2004) • In general, large councils had a ‘more secure and adequate financial base, are better able to plan and contribute to economic development,are more effective community advocates, and interact more effectively with government and business.
• Structural reform can deliver economies of scale and can enable councils to employ a wider range of professionals so they can offer a widerrange and usually higher quality of services
• Amalgamations yielded savings as evidence in the South Australian and Victorian amalgamation episodes, Western Australian projectionsthat structural reform of small councils could produce notional annual savings equating to 5.2 per cent of total municipal expenditure, andsizeable savings projections from five NSW mergers
• The report also cautioned that amalgamation may not be viable in the case of small remote councils or large (geographically) councils insparsely settled areas. Furthermore, cost-shifting by state governments could diminish the efficiency enhancing effects of amalgamation.
• The overall conclusion from the report was that in some circumstances, amalgamations of local government bodies is the most direct wayof achieving a more efficient and cost effective local government sector.
South Australian Financial SustainabilityReview Board (FSRB)
• The inquiry focused on the long term financial performance of South Australian local government and was commissioned by the state’sLocal Government Association.
• In relation to structural reform, the report noted that there was no strong relationship between a council’s organisational size and either astrong financial position or a good annual financial performance’
• The report expressed the view that amalgamation involves significant costs and often displayed “exaggerated benefits”. In this context, itquestioned the validity of forecasts of recurrent cost savings of $19.4m per annum and one-off savings of $3.9m from the mid-1990samalgamations in SA.
Allan Report (2006) • This report was the outcome of a NSW Local Government and Shires Association inquiry into the financial sustainability of NSW LocalGovernment.
• Many of the report’s recommendations reflected in those made by the Hawker Report and the FSRB Report.• The inquiry also considered the administration and management of local councils and benchmarked the administrative performance of nine
volunteer councils against other councils, public institutions and private enterprises worldwide. It concluded that the results showed thatlocal government was capable of performing as well as or better than other public and private organisations.
• In relation to size and efficiency, the report questioned the empirical basis for the concept and concluded that the available evidence wasinconclusive, except perhaps for the smallest councils. It offered that an alternative approach would be cooperative service provision forthose services with scale economies through service sharing, joint processing and external outsourcing, notably financial transactionprocessing, IT and procurement.
LGAT (2007) • The LGAT commissioned Access Economics to examine the financial sustainability of Tasmanian local government.• The report advocated a preference for increased cooperation and resource sharing amongst councils over amalgamations. It was observed
that forced amalgamations offered limited prospects of achieving lasting community benefit and that the main benefits of amalgamationcan usually be achieved by other means.
LGAQ (2005), QLGRC (2007) • The LGAQ’s 2004 study considered the long run viability of councils. It identified a number of challenges faced by local government andmade a number of recommendations for local council consolidation including resource sharing, merger/amalgamation and major boundarychanges.
• With respect to amalgamation, the LGAQ argued that the benefits which can flow from council amalgamation could include a ‘sufficientresource base’, a reduction in the ‘total costs of government’, scale economies, lower staff levels, an ‘opportunity to review’ operations,rationalization of assets, ‘cross-border’ facility and service utilization, better promotion of economic development, improved growthmanagement, the ‘formalization’ of communities of interest, increased political lobbying power, and potential for ‘full-time’ electedrepresentatives. However, it also recognised that the potential costs embraced ‘exposure’ to liabilities of other local authorities, addressing‘major difference in rates’, fewer grants, high costs of ‘integrating’ constituent councils, dealing with ‘widely differing organisationalcultures’, creating ‘differing levels of service in some areas’, diluting existing representation, and the loss of direct representation by small
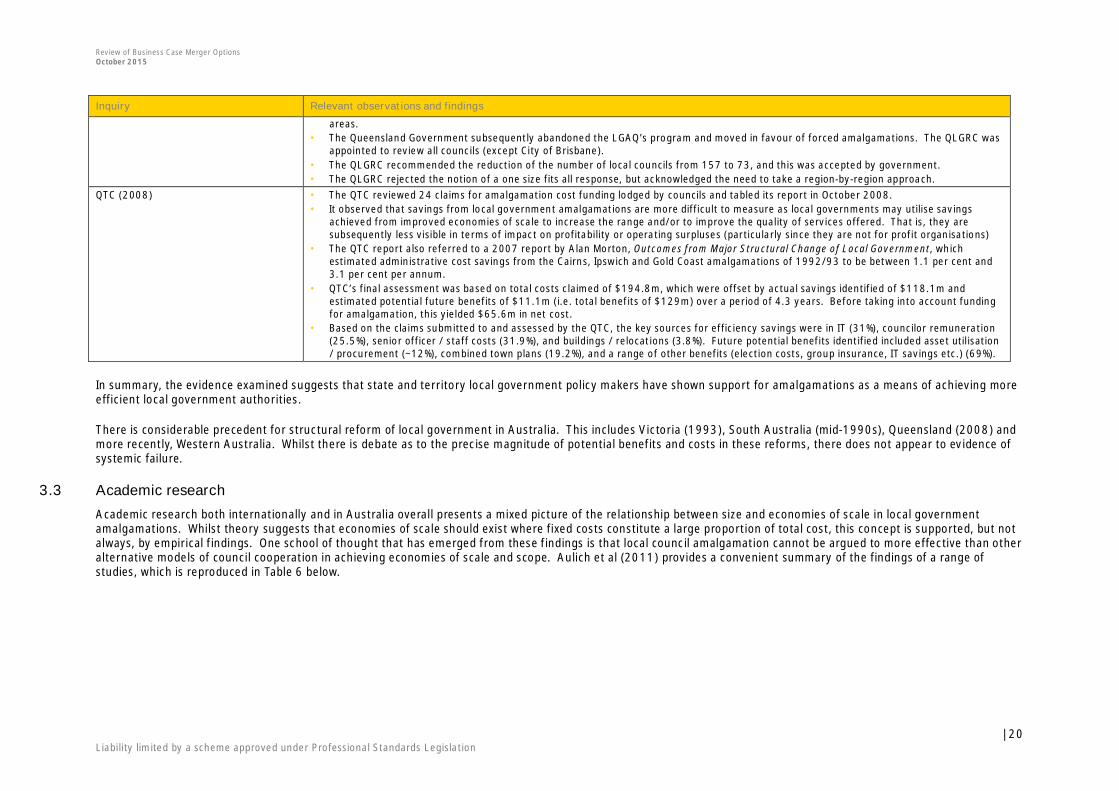
Review of Business Case Merger OptionsOctober 2015
| 20Liability limited by a scheme approved under Professional Standards Legislation
Inquiry Relevant observations and findings
areas.• The Queensland Government subsequently abandoned the LGAQ’s program and moved in favour of forced amalgamations. The QLGRC was
appointed to review all councils (except City of Brisbane).• The QLGRC recommended the reduction of the number of local councils from 157 to 73, and this was accepted by government.• The QLGRC rejected the notion of a one size fits all response, but acknowledged the need to take a region-by-region approach.
QTC (2008) • The QTC reviewed 24 claims for amalgamation cost funding lodged by councils and tabled its report in October 2008.• It observed that savings from local government amalgamations are more difficult to measure as local governments may utilise savings
achieved from improved economies of scale to increase the range and/or to improve the quality of services offered. That is, they aresubsequently less visible in terms of impact on profitability or operating surpluses (particularly since they are not for profit organisations)
• The QTC report also referred to a 2007 report by Alan Morton, Outcomes from Major Structural Change of Local Government, whichestimated administrative cost savings from the Cairns, Ipswich and Gold Coast amalgamations of 1992/93 to be between 1.1 per cent and3.1 per cent per annum.
• QTC’s final assessment was based on total costs claimed of $194.8m, which were offset by actual savings identified of $118.1m andestimated potential future benefits of $11.1m (i.e. total benefits of $129m) over a period of 4.3 years. Before taking into account fundingfor amalgamation, this yielded $65.6m in net cost.
• Based on the claims submitted to and assessed by the QTC, the key sources for efficiency savings were in IT (31%), councilor remuneration(25.5%), senior officer / staff costs (31.9%), and buildings / relocations (3.8%). Future potential benefits identified included asset utilisation/ procurement (~12%), combined town plans (19.2%), and a range of other benefits (election costs, group insurance, IT savings etc.) (69%).
In summary, the evidence examined suggests that state and territory local government policy makers have shown support for amalgamations as a means of achieving moreefficient local government authorities.
There is considerable precedent for structural reform of local government in Australia. This includes Victoria (1993), South Australia (mid-1990s), Queensland (2008) andmore recently, Western Australia. Whilst there is debate as to the precise magnitude of potential benefits and costs in these reforms, there does not appear to evidence ofsystemic failure.
Academic research3.3Academic research both internationally and in Australia overall presents a mixed picture of the relationship between size and economies of scale in local governmentamalgamations. Whilst theory suggests that economies of scale should exist where fixed costs constitute a large proportion of total cost, this concept is supported, but notalways, by empirical findings. One school of thought that has emerged from these findings is that local council amalgamation cannot be argued to more effective than otheralternative models of council cooperation in achieving economies of scale and scope. Aulich et al (2011) provides a convenient summary of the findings of a range ofstudies, which is reproduced in Table 6 below.

Review of Business Case Merger OptionsOctober 2015
| 21Liability limited by a scheme approved under Professional Standards Legislation
Table 6: Econometric research into economies of scale in local government, 2000-2010
Author / Date Data Estimation technique Dependent variable Explanatory variable Findings
Soul (2000) 177 NSW LGAs 1995-1996 Simple regression analysis Gross per capitalexpenditure; per capitaexpenditure on economicservices
Population Evidence of both economiesof scale and diseconomies ofscale
Byrnes et al (2003) 177 NSW LGAs, 2001-2001 Standard regression analysis Average cost of collectingdomestic waste bins
No. of bins; population;income; bin density; No. ofbins per square kilometre
Limited evidence ofeconomies of scale
McDavid (2001) 327 Canadian localgovernments, 1996-1997
Standard regression analysis Residential solid wastecollection cost
Households served per truck Evidence of economies ofscale
Callan and Thomas (2001) 110 Massachusettsmunicipalities for 1997
Seeming unrelatedregression
Total annual cost of disposaland recycling
Housing density; Provider;Frequency; Grants
No evidence of economies ofscale
Bradbury and Stephenson(2003)
154 countries in the UnitedStates, 1992-1997
Standard regression analysis Government expendituresper capita and netgovernment expenditures percapita
Demographics; Income;wealth; commission size;government transfers,ideology
Evidence of economies ofscale in highway expenditure
Bel and Costa (2006) 189 Spanish municipalities Standard regression analysis Total cost of wastemanagement services
Quantity of waste; per centrecycling; wage level;frequency of collection;population density; tourism;landfill; and mode ofproduction
Evidence of economies ofscale for lower population
Dijkgraaf and Gradus (2007) 453 Dutch municipalities forthe year 2002
Standard regression analysis Total cost of wastemanagement services
Pick up points; Inhabitantsper point; density; unsortedwaste; glass; paper;vegetable waste; public andprivate competition;neighbouring municipality
Evidence of economies ofscale for lower populations
Holcombe and Williams(2009)
487 municipalities withpopulations > 50,000 inUSA, 1990 to 2000
Standard regression analysis Total per capita municipalgovernment expenditure;disaggregated functiongovernment expenditure
Demographics; populationdensities; and municipalfunctions
Constant returns to scale;diseconomies in policing andwater services while highwayservices inversely related topopulation density
Bel and Fageda (2009) 65 municipalities of Galicia2005
Standard regression analysis Total cost of wastemanagement services
Volume of waste; recycling;frequency of wastecollection; tourist activity;incineration; mean wage; andcontracted
Evidence of economies ofscale in smaller municipalities
Source: Aulich, Gibbs, Gooding, McKinley, Pillora & Samson, May 2011, Consolidation in local government, A fresh look, Table A2
Review of Business Case Merger OptionsOctober 2015
| 22Liability limited by a scheme approved under Professional Standards Legislation
One of the criticisms against some of the existing studies is the use of population as a proxy for output. It is suggested that this approach is only valid if there is a positivecorrelation between population and service output. However, service outputs for different local government areas with similar size populations may vary because residentshave different needs depending on their demographic and economic profiles.
Most of the academic research in Australia around the relationship between size and efficiency has been undertaken by Professor Brian Dollery of the University of NewEngland. Key findings from some of Professor Dollery’s more recent research are summarised below.
• Drew, Kortt and Dollery (2014), Economies of scale and local government expenditure: Evidence from Australia:
• The study acknowledges the findings from existing empirical evidence are mixed. Whilst the evidence suggests that amalgamation may improve the administrativeand technical capacity of local government, it is not only costly but also has other adverse, disruptive, and often unintended consequences such as the loss of “localvoice” and “local democracy”.
• The study also found that after controlling for population density, there is little evidence to support a relationship between council size (as proxied by population size)and economies of scale.
• Dollery, Kortt and Sinnewe (2015), Is Biggest Best? A Comparative Analysis of the Financial Viability of the Brisbane City Council
• This research paper was recently published in the Australian Journal of Public Administration and submitted to the NSW Parliamentary Inquiry into the Fit for FutureReforms. It seeks to compare the performance of the Brisbane City Council (being the largest local council in Australia with an aggregate population of 1,079,392persons (or around 380,000 households) as at 30 June 2011) with that of the City of Sydney Council.
• Based on a comparison of four financial performance indicators, the study found that the Brisbane City Council was outperformed in 3 of the 4 indicators. The studyconcluded this evidence casts considerable doubts over the “bigger is better” assumption.
Other evidence3.3.1
In August 2011, Deloitte Access Economics (“Deloitte”) prepared an analysis which explored the impacts of local government structural reform in Tasmania for the PropertyCouncil.6 The report noted that Tasmania is the only state or territory where no council has a population greater than 75,000. In terms of average geographic size,Tasmania’s councils are the nation’s smallest (and this is without taking account of the vast mass of land which is state or national park).
A key conclusion emerging from the report was that:
“The characteristics of Tasmania’s councils coupled with the experiences of past reforms suggest that, if well conceived and effectively managed, efficiency gains in theorder of 10% to 20% of operating expenses are achievable from local government structural reform in Tasmania.”7
6 Deloitte Access Economics, Local Government Structural Reform in Tasmania, Property Council of Australia – Tasmania, August, 2011.7 Ibid, page iii
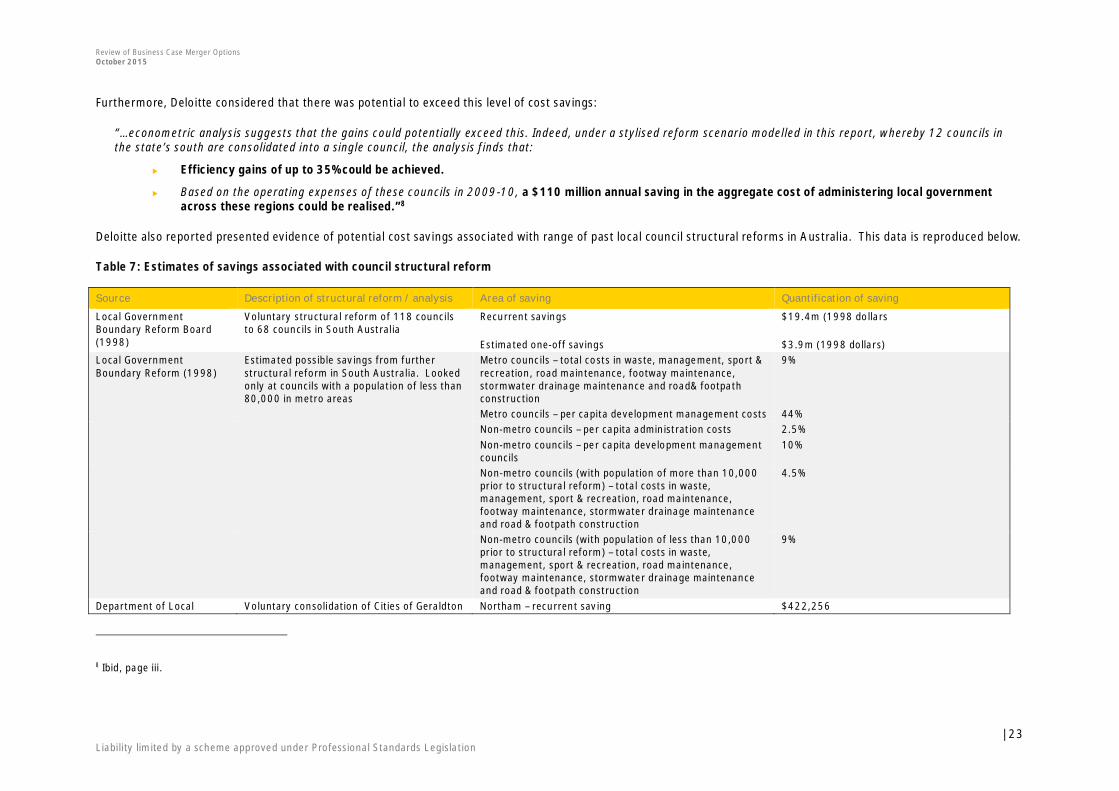
Review of Business Case Merger OptionsOctober 2015
| 23Liability limited by a scheme approved under Professional Standards Legislation
Furthermore, Deloitte considered that there was potential to exceed this level of cost savings:
“…econometric analysis suggests that the gains could potentially exceed this. Indeed, under a stylised reform scenario modelled in this report, whereby 12 councils inthe state’s south are consolidated into a single council, the analysis finds that:
u Efficiency gains of up to 35% could be achieved.
u Based on the operating expenses of these councils in 2009-10, a $110 million annual saving in the aggregate cost of administering local governmentacross these regions could be realised.”8
Deloitte also reported presented evidence of potential cost savings associated with range of past local council structural reforms in Australia. This data is reproduced below.
Table 7: Estimates of savings associated with council structural reform
Source Description of structural reform / analysis Area of saving Quantification of saving
Local GovernmentBoundary Reform Board(1998)
Voluntary structural reform of 118 councilsto 68 councils in South Australia
Recurrent savings
Estimated one-off savings
$19.4m (1998 dollars
$3.9m (1998 dollars)Local GovernmentBoundary Reform (1998)
Estimated possible savings from furtherstructural reform in South Australia. Lookedonly at councils with a population of less than80,000 in metro areas
Metro councils – total costs in waste, management, sport &recreation, road maintenance, footway maintenance,stormwater drainage maintenance and road& footpathconstruction
9%
Metro councils – per capita development management costs 44%Non-metro councils – per capita administration costs 2.5%Non-metro councils – per capita development managementcouncils
10%
Non-metro councils (with population of more than 10,000prior to structural reform) – total costs in waste,management, sport & recreation, road maintenance,footway maintenance, stormwater drainage maintenanceand road & footpath construction
4.5%
Non-metro councils (with population of less than 10,000prior to structural reform) – total costs in waste,management, sport & recreation, road maintenance,footway maintenance, stormwater drainage maintenanceand road & footpath construction
9%
Department of Local Voluntary consolidation of Cities of Geraldton Northam – recurrent saving $422,256
8 Ibid, page iii.

Review of Business Case Merger OptionsOctober 2015
| 24Liability limited by a scheme approved under Professional Standards Legislation
Source Description of structural reform / analysis Area of saving Quantification of saving
Government (2010) and Greenough (new council created 1 July2007) and voluntary consolidation of theTown and Shire of Northam (new councilcreated 1 July 2007) in Western Australia
KPMG (2002) Estimation of savings that would result fromconsolidation of Waratah Wynyard Counciland Burnie City Council, both in Tasmania,based on consultation with councils
Saving on operating expenditure 5%
KPMG analysis, reported inLocal Government BoardReport (1997)
Estimation of savings achieved from differentstructural reform options in Tasmania(Southern Tasmania and Greater Hobartreported here)
Southern Tasmania:• Works & maintenance• Community & development• Administration• GovernanceGreater Hobart:• Works & maintenance• Community & development• Administration• Governance
• 9%• 4%• 45%• 35%
• 8%• 5%• 30%• 40%
We note that the merger business case submission by Woollahra Council includes a report by Percy Allan & Associates which pointed to evidence that increasing populationyields a lower level of gross expenditure per capita up to a point, after which increasing population results in higher levels of gross expenditure per capita. It concluded thatno significant efficiency gain would be generated by merging Woollahra Municipal Council with other councils as proposed by the ILGRP as it was already above the optimalsize where savings would be expected.9
Evidence from New Zealand local council amalgamations3.4The experience from local council amalgamations in other countries can provide some insights into the potential level of costs and savings that can emerge fromamalgamation. EY fully acknowledges that caution should be exercised in translating such overseas experience to Australian local council amalgamations. Nevertheless, weconsider that such case studies can provide useful insights to the potential sources of costs and benefits arising from amalgamations.
Auckland Council3.4.1
In 2007, the government established the Royal Commission on Auckland Governance (“the Commission”) to examine governance arrangements in the Auckland region.Following the release of the its findings in March 2009, the government decided to extinguish the existing city, district and regional councils and replace them with a singlelocal authority – the new Auckland Council. The new council was established in November 2010 and replaced the previous 8 local authorities of the Auckland region. The
9 Woollahra Municipal Council, Fit for the Future Research Report, Percy Allan & Associates, March 2015.

Review of Business Case Merger OptionsOctober 2015
| 25Liability limited by a scheme approved under Professional Standards Legislation
Auckland Transition Agency (“ATA”) was also established to plan and manage all matters in relation to the reorganisation to ensure that the Auckland Council was ready tofunction as of 1 November 2010.
Estimates of potential efficiencies to be generated by the amalgamation of the 8 local authorities in February 2009 are outlined in the table below.10 The reorganisationefficiencies, estimated by Taylor Duignan Barry (“TDB”), were assumed to be progressively realised from 1 January 2012 through to 1 January 2015.
Table 8: TDB’s analysis of the Commission’s preferred option for reorganization of Auckland Local Governance
Commission’s preferred optionindicative range of efficiency gains
Low$m p.a.
% of total plannedexpenditure by
predecessor councilsfor 2008/09
High$m p.a.
% of total plannedexpenditure by
predecessor councils for2008/09
Medium$m p.a.
Capex efficiency gains 22 2% 37 3% 30Opex efficiency gains 54 3% 77 4% 65Total efficiency gains 76 2.5% 113 3.5% 95Source: Taylor Duignan Barry, 28 October 2010, Securing Efficiencies from the Reorganisation of Local Governance in Auckland, page 13
Total integration costs were estimated to range from around 1x annual efficiency gains under an optimistic scenario, to just over 3x annual efficiency gains under apessimistic scenario.11
Table 9: TDB’s estimated merger integration costs for the re-organisation of the Auckland Councils
Pessimistic Optimistic Base Case
Annual efficiency gains $76m $113m $95mTotal integration costs $237m $118m $178mMerger costs / Annualised efficiency gain 3.1x 1.0x 1.9xSource: Taylor Duignan Barry, 9 February 2009, Financial Analysis of the Re-organisation of the councils in the Auckland region, page 6.
In 2010, TDB reviewed the extent to which efficiencies had already been achieved by the ATA up to October 2010. It was noted that the ATA had by that stage put in placeplans for FTE reductions to occur by 1 July 2012 by eliminating duplication of roles. Specifically:
• In the first 12 months, the ATA had achieved FTE reductions of around 13% of FTEs employed by the predecessor councils pre-merger
10 Taylor, Duignan Barry, Securing Efficiencies from the Reorganisation of Local Governance in Auckland, October 2010, Auckland Transition Agency.11 The low (high) scenario combined high (low) integration costs with low (high) savings. As such the ratio of integration costs to savings was 3.1x in the low scenario and 1.0x in the highscenario.

Review of Business Case Merger OptionsOctober 2015
| 26Liability limited by a scheme approved under Professional Standards Legislation
• By 1 July 2012, the ATA was expecting to fully realise FTE reductions totalling 16% of FTEs employed by the predecessor councils pre-merger.
Almost all of these reductions were anticipated to occur in managerial/supervisory positions. The number of employees in front line or public facing positions was to remainvirtually unchanged. Cost savings were also expected to occur in a number of specific administrative processes, including:
• One rather than eight Long Term council Community Plans was required under the new structure
• One audit process, albeit for a larger entity
• Rationalisation of insurance providers.
The ATA’s financial statements up to the date it was disestablished in October 2010 (i.e. after 17 months of operation) indicated that it had incurred approximately $36.2min transition costs.
TDB reported that the ATA’s plans that would yield opex-related efficiencies of some $95m p.a. (i.e. exceeding the 2009 “high” estimate of $77m by $19m) when fullyrealised in 2012/13, comprising personnel savings of $91m p.a. and non-personnel savings of around $4m p.a. $75m of this would be realised in 2011/12. Theseefficiencies were described as being well in excess of the efficiencies originally estimated in TDB’s 2009 report.12 Additional savings ($47m) were also expected in the areasof procurement and business processes, tighter budgeting and capex, although at October 2010, these had not been specifically identified and initiated. Temporarytransition-related costs in 2011/12 were forecast to be around 1.5% of total rates revenue.
Auckland Council’s 2013/14 Annual Plan noted that it had managed to achieve operational savings of $145m per year and that “Much of this cost reduction has beenachieved with little impact on council services, with our focus on reducing corporate costs and delivering services by staff rather than consultants.”13
Wellington region local government reorganisation3.4.2
In December 2014, the Local Government Commission announced a proposal to form a Greater Wellington Council which would combine existing nine councils (MastertonDistrict Council; Carterton District Council; South Wairarapa District Council; Upper Hutt City Council; Hutt City Council; Wellington City Council; Porirua City Council; KapitiCoast District Council, and the Greater Wellington Regional Council). The Greater Wellington Council will have all of the responsibilities of the regional council and the cityand district councils. Decision-making will be shared between the governing body (mayor and councillors) and eight local boards. The mayor and councillors would beresponsible for high-level decisions affecting all of Wellington. The local boards would control council budgets and decisions for local matters in established communities.Local boards would be created for Wairarapa; Upper Hutt; Lower Hutt; Kapiti Coast; Porirua-Tawa; Ohariu; Lambton; and Rongotai.
12 Taylor, Duignan Barry, Securing Efficiencies from the Reorganisation of Local Governance in Auckland, October 2010, Auckland Transition Agency, page 18. Exceeding the “high” caseestimate by $19m implies that the opex savings achieved was just under 5% of 2009 council opex.13 Auckland Council, 2013-14 Annual Plan, Vol. 1 page 6.

Review of Business Case Merger OptionsOctober 2015
| 27Liability limited by a scheme approved under Professional Standards Legislation
The Local Government Commission identified and evaluated a number of other alternative options for reform but identified a single Greater Wellington Council as itspreferred option. It noted that:
“This approach provides the greatest scope to improve the performance of local government in Wellington Region. Across each of the evaluation criteria, this option iseither the best option, or near the best option, of those considered. It is the most expensive option to implement, but offers substantial potential for financial savings ofjust over $30 million per annum.”14
In undertaking its evaluation, the Local Government Commission was required to consider potential savings from the change. It considered work that was previouslyundertaken by NZIER for the Hutt City Council in 2012, which explored scale and cost effectiveness. The Commission expressed agreement with NZIER’s observation thatsavings from local council mergers are often thought to arise from 3 sources – savings from economies of scale, strategic capacity improvement through economies of scopeand service delivery improvements. However, of these, only the first is capable of being objectively measured and quantified. The Commission also expressed the view thatwhilst such potential savings are possible, the opportunities to secure benefits by scale will:
• Vary with activity
• Depend on how the amalgamated council will run
• Depend on the levels of service it chooses to provide.
It also considered that there were a range of non-financial benefits that could accrue from amalgamation including:
• Potential benefits from better aligning decision-making with perceptual, political and functional communities of interest
• Potential benefits from arrangements that enable more timely and better decision-making which is not subject to on-going re-litigation.
Whilst these benefits were difficult to measure, the Commission considered that they were real benefits.
With respect to the potential for future reductions in rates, the Commission offered a view on why reductions in rates are unlikely to emerge:
“One of the observations and criticisms that frequently emerges in relation to estimates of potential savings from amalgamation is that few if any have demonstratedreductions in rates as a consequence of the change. All of the councils in the “affected area” are forecasting ongoing rates increases. All face significant future capitalworks programmes to deal with the renewal of infrastructure. All face rising environmental standards and increasing service level expectations from residents. Thesefactors mean that it is most unlikely that any potential savings from local government reform would be passed on to ratepayers through rates reductions. It is far morelikely that savings provide the scope to address the many issues that current councils are unable to deal with, or to reduce the level of risk that the Wellington
14 Local Government Commission, Draft proposal for reorganisation of local government in Wellington, Vol 2, Technical Report: Evaluation of the options and the draft proposal, December 2014with Feb 2015 adjustment, Page 13. Estimates from the same report suggest that total opex of the nine councils pre-merger amount to around $933m.

Review of Business Case Merger OptionsOctober 2015
| 28Liability limited by a scheme approved under Professional Standards Legislation
communities are exposed to, or to reduce debt, or to improve service standards.”15
In quantifying the potential impacts of the amalgamation, the Commission drew on advice of its consultants (McGredy Winder & Co, Brian Smith Advisory Services, Stimpson& Co, and Deloitte). Brian Smith Advisory Services produced the estimates of the savings that could be achieved under each option. Stimpson & Co developed the estimatesof the transition costs and co-ordinated the financial assumptions between the different pieces of work. Deloitte produced estimates of the IT related costs that would beassociated with the transition to each of the options. Deloitte’s work was then integrated into the estimates of total transition cost reported by Stimpson & Co.
The framework for estimating merger cost savings assumed:
• A rapid approach to transition will be adopted, seeking to do as much integration and set-up as possible during the transition period before the first election for a newcouncil
• Where possible the new council will adopt the ‘best of breed’ approach from within the merging councils rather than develop a new platform approach critical systemsthat support paying staff, paying suppliers, managing accounts receivable and accounts payable, financial planning and performance, and managing rates collectionmust be in place on day one of any new council
• To support critical systems, IT infrastructure will need to be consolidated by day one of operation
• The second priority is for those that provide customer facing systems, including complaints, customer contact and online channels, etc.
• A transition board will be in place and manage the process of appointing an interim chief executive so that transition decisions can be made in the most timely way.
The assessment of savings was based on the experience with the establishment of the Auckland Council, management experience, expert assessments (that is, the Deloittework on IT costs), and insights or investigations by others, including the applicants, consultants who did work to support the applications or alternative applications, andwork that New Zealand Transport Agency has done on opportunities for savings in relation to roading, etc. In estimating savings, the approach was to work on the basis of arange of possible savings and to err on the side of underestimating savings. In estimating transition costs the approach was to err on the side of overestimating them.16
Some of the key assumptions driving potential savings are outlined below.
u “Regulatory savings will be gradually realised, but will not be fully realised until year 4 with the introduction of a new district (or unitary) plan.
u No savings will be made with respect to solid waste, property, harbour and coastal management, public transport services, flood protection, or economicdevelopment.
15 Local Government Commission, Draft proposal for reorganisation of local government in Wellington, Vol 2, Technical Report: Evaluation of the options and the draft proposal, December 2014with Feb 2015 adjustment, Page 21316 Ibid., Page 214.

Review of Business Case Merger OptionsOctober 2015
| 29Liability limited by a scheme approved under Professional Standards Legislation
u Savings in operating and capital costs for water, wastewater and stormwater will be gradual and no more than 2% of current operating costs and 1% of forecastcapital expenditure by year 4. These savings will arise from streamlined management, the removal of duplication, economies of scale in asset management,rationalised operating, management and construction contracts and better capital project planning and delivery.
u Savings in operating and capital costs for roading will be gradual and no more than 1% of current operating costs and 1% of forecast capital expenditure by year 4.These savings will arise from streamlined management, the removal of duplication, economies of scale in asset management, rationalised operating, managementand construction contracts, and better capital project planning and delivery.
u Savings in community facilities expenditure will be gradual but no more than 1% of operating expenditure and capital works, and will arise from streamlinedmanagement, economies of scale, and rationalised operating, maintenance and construction contracts.
u Part of the reduction in staffing for corporate and support functions will take place on the establishment of the new council, but the balance will not be able to beachieved for a year or more as the transition is made to new business systems and operating practices.
u Governance and senior management costs for each new entity will reflect the current market for similar roles and the number of councillors will reflect the natureof the option.
u The potential costs of the operation of local boards in the One Wellington Council with local boards option, reflect the scale of support structure likely to berequired to support the operation of local boards, drawing on the experience of Auckland Council in evolving these structures.” (page 215-6)
Table 10: Comparison of the “reasonably practicable options” regarding the costs of transition and potential savings
Enhanced Local Efficiency One Wellington Council
One WairarapaTerritorialAuthority
One Hutt ValleyTerritorialAuthority
One WesternTerritorialAuthority
ThreeTerritorialAuthorities
One Wairarapa & One HuttValley Territorial Authority,
plus WCC, PDC & KCI
StrongerRegionalDelivery
WithoutLocal
boards
With localboards
Annual savings, year 4/5 ($m) 1.3 5.5 24.8 31.6 6.9 36.3 40.4 30.4Transition CostsTransition Board 1.0 2.0 5.0 8.0 3.0 7.6 10.1 10.3New council start-up 1.0 2.0 5.0 8.0 3.0 7.6 10.1 10.3IT system delivery costs 25.0 40.0 67.5 133.0 65.5 79.0 127.5 127.5Business process change 4.0 6.0 9.8 20.0 10.2 23.7 48.2 48.2Other 0.2 0.4 1.0 1.6 0.6 1.5 2.0 2.0HR costs 0.1 1.6 6.6 8.3 1.7 10.2 11.3 11.3Total estimated cost of transition 32 52 95 179 84 129 209 210Net present value ($m) @ 7% -13.7 8 143 199 154 58Payback period (years) 25 10 5 6 12 5 7 9Source: Local Government Commission, Draft proposal for reorganisation of local government in Wellington, Vol 2, Technical Report: Evaluation of the options and the draft proposal, December2014 with Feb 2015 adjustment, page 216

Review of Business Case Merger OptionsOctober 2015
| 30Liability limited by a scheme approved under Professional Standards Legislation
The Commission observed that:
• The largest potential saving of around $40 million per annum equates to 4% of total current local government operating expenditure in the region. This also equates toslightly more than the 16% p.a. rates increases planned in the first three years of the 2012-2022 long term plans.
• The most significant transition cost under each option is the cost of delivering IT systems and infrastructure. IT costs assume that merging councils would migrate to thebest of breed solution in one of the current councils. These costs account for more than 80% of the estimated transition costs for each option other than the StrongerRegional Delivery option of transferring functions to the Greater Wellington Regional Council. Total cost estimates were derived by developing the programme of workthat was expected to be required prior to the go-live date for a new council and the ongoing work that would follow over the subsequent 3-5 years to complete themigration from separate systems to a common set of council-wide systems.
• HR costs reflect potential redundancy costs and a provision for harmonising employment and remunerations conditions across merging councils. This accounts forbetween less than 1% (for the merger of the Wairarapa councils under the Enhanced Local Efficiency option) and 5% of transition costs for the larger amalgamationoptions under the One Wellington Council options. Estimates are based on the experience of the Auckland Transition Agency which equated to one third of theestimated savings from staffing.
Overall, it was observed that “the case for change in Wellington is not as compelling as it was in Auckland”, however, overall this option was considered to most enableWellington to develop the level of leadership to lift its global competitiveness and attractiveness.
Summary of findings from literature review and NZ experience3.5We summarise the key takeaways from the material reviewed in this section as follows:
• The extent to which cost savings have been achieved in previous local council reforms may be difficult to measure given that councils are most likely to re-direct costsavings to service expansion. As such, the capacity of outcomes from actual experience to inform estimates of potential cost savings from local council amalgamationsmay be limited.
• The available empirical evidence on the extent to which local council amalgamations will yield net savings in costs is mixed and tends to vary by activity. Econometricanalysis does not provide strong support. Evidence from the Auckland local governance reforms suggests that opex savings close to 5% could potentially be achievable(although translation of New Zealand evidence into an Australian context must be done with caution).
• In principle, it is reasonable to expect that opportunities for cost savings to flow from the scale effects associated with local council amalgamations, however, theirmagnitude is likely to vary by type of activity and may diminish for councils that are already regarded as being large. The available evidence suggests that the keysources of savings are from removal of duplicated activities / functions and in procurement. As such, governance and administration is potentially a key area where costsavings would materialise.
• There is limited evidence available on the financial costs associated with local council amalgamations.
• The evidence from the QTC’s assessment of merger costs in Queensland is the most relevant Australian evidence available. This indicated assessed merger costs of$195m over 4 years. The benefits shown in the report, however, did not provide sufficient data as to the time profile of the $129m of estimated merger benefits. If

Review of Business Case Merger OptionsOctober 2015
| 31Liability limited by a scheme approved under Professional Standards Legislation
it is assumed that $15m is realised in year 1, $25m in year 2, $40m in year 3 and $49m in year 4, this would imply that merger costs were approximately 4xestimated annualised merger benefits. Alternatively, a more conservative ramp up profile – for example $10m in year 1, $20m in year 2, $40m in year 3 and $59min year 4 – would yield a ratio of merger costs to estimated annualised merger benefits of 3.3x. Assuming benefits would ramp up to full levels over time rather thanemerge after one year suggests that merger costs in the Queensland local council amalgamations could have been in the range 3x – 4x annualised expendituresavings.
• The Auckland Transition Authority in Auckland had incurred transition costs of $36.2m when it was dis-established in October 2010 however, this figure is likely tounderstate transition costs that would have been incurred post Day 1 of the new merged Auckland Council. Original estimates of merger costs indicated a range of1.0x to 3.1x annualised efficiency gains.
• The estimates from the proposed Wellington local council amalgamations indicates very high ratios of merger costs to benefits (around 5x-7x for the preferredoption) and it has been acknowledged that the approach has been to over-estimate costs and to under-estimate savings.
• There are a range of potential risks associated with local council amalgamations that are identified in literature, most commonly, costs of disruption, workplace culturalbarriers, decreased local democracy and representation and other challenges associated with implementation. Whilst these exist, they can potentially be minimisedthrough proper planning and implementation.
• There is a view that the costs associated with amalgamation are large and often under-estimated, particularly costs related to new systems, cultures and operatingstructures.
Implications for EY analysis3.6EY has considered the key takeaways from our literature review against our own experience on cost savings that are potentially achievable from corporate transactions.These benchmarks are summarised in the table below.
Table 11: Benchmark synergies from corporate transactions
Benchmarks
15-25% of the target cost base insynergies
In a corporate transaction with similar businesses, synergies up to 30% of the target’s cost base are often targeted. On average, 15% ofthe target cost base is targeted.Synergies are often highest in the support functions and overheads – the savings frequently reach 50% to 60% of the target’s costs insome areas (e.g. the executive teams, back office support costs)
2-3 years average time for the full runrate of synergies to be realised
The time to fully realise synergies differs depending on the transaction complexity. The range for full synergy realization is between 2 to5 years. Where the synergies are related to major infrastructure, capital expenditure or IT, these will typically be towards the upper endof the range. In most transactions the alignment of the core operating system or ERP has the longest lead time
0.9 – 1.1 average typical ratio of one-offintegration costs to annualized synergyvalue
In some cases the implementation costs can be prohibitive to realising the potential synergies, particularly in cash flow constrainedsectors.
~ 60% of companies announce successfulachievement of synergies
Where transaction business cases involve a synergy component, companies are often obliged to communicate the synergy targets. Thecommunicated targets do not typically ‘pay away’ the full synergy estimate. Ongoing communication of synergy targets is highly variableand can be impacted by failure to achieve the targets, change in integration priorities or simply a lack of robust and reliable tracking.

Review of Business Case Merger OptionsOctober 2015
| 32Liability limited by a scheme approved under Professional Standards Legislation
Notwithstanding these broad benchmarks, in our experience, we would expect mergers in the public sector:
• To achieve more conservative levels of synergies in costs (e.g. lower end of our scale may be higher end of an achievable range). With local councils, concerns aboutrisks to service levels may imply less aggressive cost reduction targets, or may result in cost savings being ploughed back into better services. In the case of the latter,the benefits are less visible but are nevertheless real benefits that should be included in any NPV analysis.
• To achieve a realization of the full benefits over a longer time frame (i.e. closer to 5 years)
• To incur larger one-off integration costs due to more complex stakeholder management and other factors.
We consider that the findings from our literature review lend broad support for these assumptions.
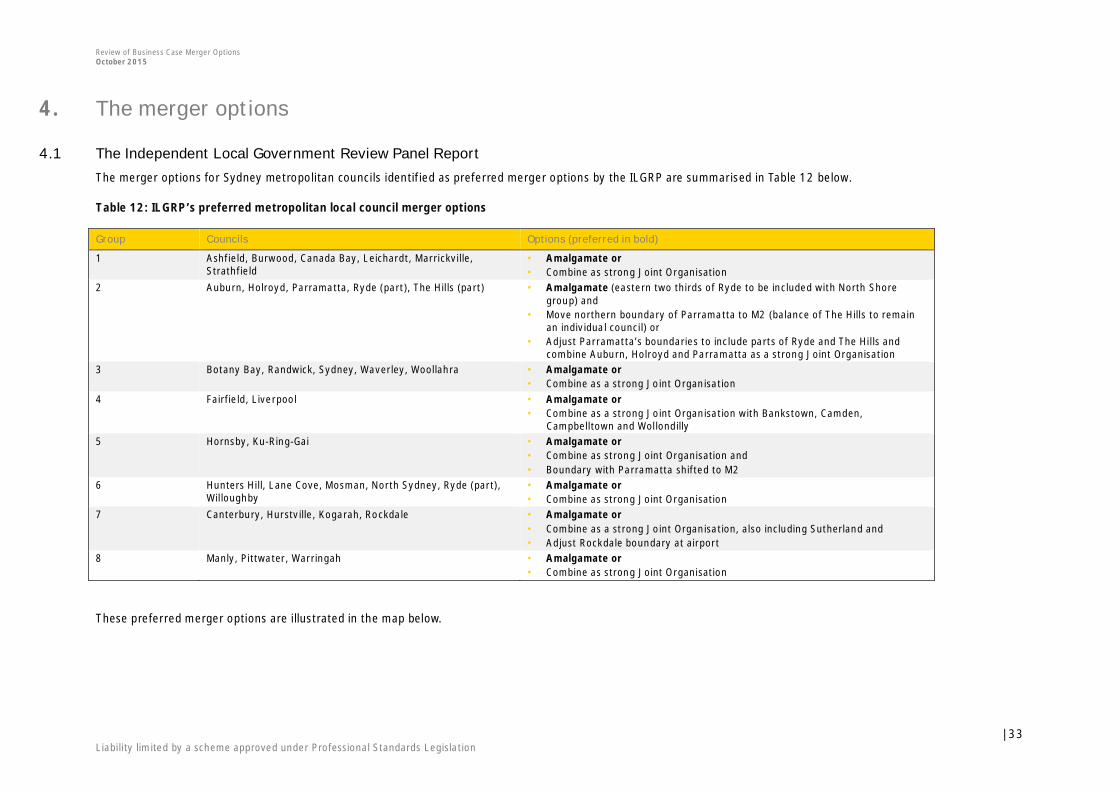
Review of Business Case Merger OptionsOctober 2015
| 33Liability limited by a scheme approved under Professional Standards Legislation
4. The merger options
The Independent Local Government Review Panel Report4.1The merger options for Sydney metropolitan councils identified as preferred merger options by the ILGRP are summarised in Table 12 below.
Table 12: ILGRP’s preferred metropolitan local council merger options
Group Councils Options (preferred in bold)
1 Ashfield, Burwood, Canada Bay, Leichardt, Marrickville,Strathfield
• Amalgamate or• Combine as strong Joint Organisation
2 Auburn, Holroyd, Parramatta, Ryde (part), The Hills (part) • Amalgamate (eastern two thirds of Ryde to be included with North Shoregroup) and
• Move northern boundary of Parramatta to M2 (balance of The Hills to remainan individual council) or
• Adjust Parramatta’s boundaries to include parts of Ryde and The Hills andcombine Auburn, Holroyd and Parramatta as a strong Joint Organisation
3 Botany Bay, Randwick, Sydney, Waverley, Woollahra • Amalgamate or• Combine as a strong Joint Organisation
4 Fairfield, Liverpool • Amalgamate or• Combine as a strong Joint Organisation with Bankstown, Camden,
Campbelltown and Wollondilly5 Hornsby, Ku-Ring-Gai • Amalgamate or
• Combine as strong Joint Organisation and• Boundary with Parramatta shifted to M2
6 Hunters Hill, Lane Cove, Mosman, North Sydney, Ryde (part),Willoughby
• Amalgamate or• Combine as strong Joint Organisation
7 Canterbury, Hurstville, Kogarah, Rockdale • Amalgamate or• Combine as a strong Joint Organisation, also including Sutherland and• Adjust Rockdale boundary at airport
8 Manly, Pittwater, Warringah • Amalgamate or• Combine as strong Joint Organisation
These preferred merger options are illustrated in the map below.

Review of Business Case Merger OptionsOctober 2015
| 34Liability limited by a scheme approved under Professional Standards Legislation
Figure 2: Preferred Merger Options for Sydney Metropolitan Councils
We note that the ILGRP Report did not provide an assessment of the costs and benefits associated with the preferred merger options.

Review of Business Case Merger OptionsOctober 2015
| 35Liability limited by a scheme approved under Professional Standards Legislation
The merger options explored by the councils4.2
Summary of the council merger options4.2.1
The merger options that have been explored by the local councils in their submissions are presented in Table 13 below. Several of the submissions explored merger optionsthat were different to the ILGRP preferred options, even though most of the local councils did not support amalgamation. The options shown in blue text are those which donot reflect ILGRP preferences.
The majority of the submissions included cost-benefit analysis reports that were prepared by Morrison Low, SGS Consulting and KPMG, with a handful either self-assessedor prepared by other consultants.
Table 13: Summary of council merger options explored in submissions
Morrison Low SGS Consulting17 KPMG Other18
Kogarah + Rockdale + Hurstville Manly + Pittwater + Warringah Hornsby + The Hills Fairfield + Liverpool [assessed by Fairfield]
Canterbury + Kogarah + Rockdale + Hurstville Manly + Warringah Hornsby + Ku-Ring Gai Bankstown + Canterbury [assessed byBankstown]
Kogarah + Hurstville Manly + Pittwater Hornsby + The Hills + Ku-Ring Gai Gosford + Wyong [assessed by Third Horizon]
Botany + Marrickville + Rockdale Manly + Part Warringah + Pittwater + PartWarringah
Manly + Warringah + Pittwater Randwick + Waverley [Randwick Council]
Ashfield + Burwood + Canada Bay + Leichardt+ Marrickville + Strathfield
Manly + Part Warringah + Pittwater + PartWarringah
Randwick + Waverley + Woollahra + BotanyBay [Randwick Council]
Ashfield + Leichardt + Marrickville Manly + Warringah Randwick + Waverley + Woollahra + BotanyBay + Sydney [Randwick Council]
Hunters Hill + Lane Cove + Mosman + NorthSydney + Ryde + WilloughbyWilloughby + Lane + Cove + North Sydney
Willoughby + North Sydney
Auburn + Burwood + Canada Bay
Auburn + Holroyd + Parramatta + The Hills +Ryde
17 We note that SGS also prepared business cases for Randwick Council involving various options (e.g. Randwick + Woollahra + Waverley, Randwick + Woollahra + Waverley + Botany Bay (withand without the airport) however insufficient information has been included in these reports for EY to assess the merger analysis.18 Reports prepared by Grant Thornton do not contain sufficient information to enable an assessment of the merger scenarios.

Review of Business Case Merger OptionsOctober 2015
| 36Liability limited by a scheme approved under Professional Standards Legislation
Methodology for assessing merger impacts4.2.2
Morrison Low
In the reports prepared by Morrison Low (“ML”), the methodology for assessing merger impacts has been to:
• Construct the base case for the merged council using the current long term financial plans of the individual councils
• Model merger impacts across short (1-3 years), medium (4-5 years) and long (6-10 years) terms. This analysis typically examines costs and benefits associated withstaffing changes, IT consolidation, material and contracts procurement, and asset rationalisation. All transitional costs are typically modelled as taking place within thefirst three years.
Table 14 below contains an example of how ML models the time profile associated with costs and benefits from various sources.
Table 14: Example of ML cost-benefit analysis methodology.
Review of Business Case Merger OptionsOctober 2015
| 37Liability limited by a scheme approved under Professional Standards Legislation
Key assumptions employed to estimate costs and benefits are generally based on one of the following:
• Estimated impacts based on discussion with management of the relevant councils
• Estimated impacts based on ML’s previous experience (e.g. savings from rationalisation of works units and waste collection)
• Estimated impacts based on the experience in the Auckland and Wellington local council amalgamations, or previous local council amalgamations in NSW.
Some of the assumptions that typically appear in the ML reports are:
• For non-management positions, that the merged council adopts a natural attribution policy to not fill positions in the short term (except for staff in core and front linepositions which would have to be replaced), leading to short term savings on staff remuneration
• Over longer term, FTE numbers will rise as the merged council increases service levels post-merger. To support this, ML cites research conducted for the ILGRP whichnoted that each of the councils involved in the 2004 NSW mergers had more staff after the merger than the combined councils together.
• Transition costs comprise transition management unit costs (based on Auckland experience but sized for the number of local councils in the case being examined), ICTcosts (based on Wellington local council amalgamation estimates, but scaled for the number of local councils in the case being examined), branding, initial redundancycosts and remuneration harmonisation.
SGS
SGS has adopted a reference council approach to estimate merger costs and benefits. This is described as the council which achieves the best economies of scale currently(i.e. pre-merger). This effectively assumes that the lowest cost council (the reference council) reflects “best practice” and that the merged council’s costs will convergearound this target.19
Key aspects of SGS’ approach are:
• Merger costs are estimated based on past amalgamation experience, both domestically and offshore
• Merger savings are applied to cost categories that are likely to be subject to economies of scale. For the merger scenarios involving Warringah, for example, SGSconducted simple linear regression to test the relationship between per capital service costs and population for 11 cost categories. This analysis indicated that sixcategories were affected by economies of scale – governance, administration, public order & safety, environment, recreation & culture, and transport & communications
19 Although a Warringah is identified as the reference council in the merger involving Warringah, Manly and Pittwater Councils, this is no longer the case in the merger scenario involving a splitof Warringah Council.

Review of Business Case Merger OptionsOctober 2015
| 38Liability limited by a scheme approved under Professional Standards Legislation
• Expenditure savings are assumed to grow in line with average projected long term financial plan growth rates for the councils involved in the relevant merger scenario
• Merger costs (excluding redundancies) are estimated as a percentage of current operating expenses and assumed to be spread over the first 2 years.
SGS also used an “average efficiencies” model in the Northern Beaches report which was an econometric model used to estimate efficiency gains.
KPMG
KPMG’s methodology is similar to Morrison Low’s approach in the sense that it considers individual groups of expenditures. Analysis is therefore undertaken on thepotential for FTE reductions, savings in materials and contracts and expenses classified as “other” in the financial accounts of the councils, which often includes expenditurewhich may be amenable to scale economies.
Merger implementation costs were considered to relate principally to IT and facility consolidation, redundancies, staff retraining and costs of funding the mergerimplementation. Redundancies for staff (except for senior staff) are assumed to occur from year 4 onwards, reflecting a 3 year no forced redundancy period. With respectto costs of funding the merger implementation, KPMG’s analysis for Warringah for example, assumed costs would be funded by cash / cash equivalents where upfront costswere less than 10% of cash and cash equivalents. Otherwise, they would be debt funded. Interest rate assumptions were adopted to enable estimation of interest forgoneon cash assets and debt funding.
Benchmarks on merger costs and benefits were based on analysis of local council mergers in Toronto and Auckland. Benchmarks are scaled to the size of the relevantmerger.

Review of Business Case Merger OptionsOctober 2015
| 39Liability limited by a scheme approved under Professional Standards Legislation
5. Assessment of the merger options
The ILGRP preferred merger options5.1EY has been requested by IPART to undertake an analysis of the costs and benefits associated with the 8 sets of amalgamations involving the Sydney metropolitan localcouncils. In addition, IPART has requested EY to undertake similar analysis for other sets of mergers:
• Botany Bay, Randwick, Waverley and Woollahra Councils (without the City of Sydney Council)
• Gosford and Wyong Councils, Bankstown and Canterbury Councils, Hawkesbury and the Hills Councils – these three merger scenarios did not form part of the ILGRP’spreferred options but the Panel recommended they be further explored.
• Randwick and Waverley Councils, and Auburn, Burwood and Canada Bay Councils – these are not part of the ILGRP’s preferred options but these councils have putforward a voluntary merger business case that IPART would further explore
We note whilst the ILGRP Report considered that amalgamations were an effective way of achieving efficiency and economies of scale as well as service improvements andstrategic capacity, the panel did not provide an assessment of the costs and benefits associated with the preferred merger options.
Expected costs and financial benefits from merger5.1.1
The types of financial benefits we would expect from a merger include synergies in the following areas:
• Governance functions – for example Mayoral/Councilor salaries/on-costs, executive management
• Back office support functions – for example, payroll, IT, HR, finance, legal and administration
• Procurement savings – for example utilities, outsourced IT contracts
• Direct service delivery e.g. waste management, road maintenance
The degree to which financial synergies can be typically realised for different types of costs will vary, as will the time taken to realise these savings.

Review of Business Case Merger OptionsOctober 2015
| 40Liability limited by a scheme approved under Professional Standards Legislation
Assumptions underpinning potential merger cost-benefit estimates5.1.2
EY has estimated the potential costs and benefits associated with the ILGRP’s preferred merger options using a “top-down” approach, over a 20 year timeframe. Given theapproach that has been taken for this exercise, as outlined in Section 2.3, and the limitations that this implies for our analysis, we consider that a top-down approach is theonly feasible approach to take. Furthermore, our approach focuses only on operating expenditure and not capital expenditure, as estimating impacts on the latter isgenerally best undertaken in consultation with management of each local council and this has not been possible in this exercise.
Operating expenditure figures are those publicly reported for each council for 2013-14.
Our model requires us to adopt a number of high level assumptions in estimating the potential costs and benefits of the ILGRP preferred merger options. As discussed inSection 3.6, our model inputs have been informed by a literature review, our experience with synergies that are achievable in corporate transactions, and our considerationof the extent to which those savings are achievable for public sector organisations.
• We have conservatively estimated that potential opex savings of 10% to 15% p.a. of a cost base which comprises the total opex of the entities merging, less the opex ofthe entity with the largest cost base. This rate of efficiency gain is below the 15-25% rate usually targeted in corporate transactions. We have assumed a lower rate ofsavings in view of the mixed evidence around the achievement of efficiency gains in local council amalgamations. Whilst we expect that a large proportion of thepotential opex savings will relate to rationalisation of back-office functions, we have applied the rate of savings to the total opex line. An alternative approach is to applyvarying rates of cost savings to different categories of costs. For example, our experience with corporate transactions indicates that in the executive and corporategovernance function, reduction in council members and consolidation of the executive team could potentially generate savings of 60-80%, supplier rationalisation couldpotentially generate savings of 15-25% in procurement costs and consolidation of IT functions and applications could potentially generate savings of 20-30%. It has notbeen possible to take a more disaggregated approach to identifying cost savings in this instance as we do not have access to cost data that have been appropriatelydeconstructed.
• Potential opex savings are assumed to be realised in full over a period of 5 years. The ramp-up rate we have assumed over the 5 year period is 30% by year 1, 60% byyear 2, 80% by year 3, 90% by year 4 and 100% by year 5.
• Once-off merger integration costs have been estimated to be incurred at the rate of 3.0 times the annualised expenditure saving. The exception to this are the mergersinvolving Marrickville, Ashfield, Burwood, Canada Bay, Leichardt and Strathfield Councils, Auburn, Holroyd and Parramatta Councils together with parts of the Hills andRyde Councils, Botany Bay, Sydney, Waverley, Randwick and Woollahra Councils and Hunters Hill, Lane Cove, Mosman, North Sydney, Willoughby and part Ryde. Weunderstand that these four merger options were regarded by the NSW Parliamentary Budget Office, based on advice from the Office of Local Government, as being of“very high” complexity in their costing of council mergers. For these four merger options, we have therefore assumed merger integration costs at the rate of 4.0 timesthe annualized expenditure saving.20
• Our assumption with respect to merger integration costs reflects a more conservative view of merger integration costs than typically incurred in corporate transactions.In other words, we have assumed higher costs will be incurred. As previously shown in Table 11, integration costs in corporate transactions are on average 0.9 to 1.1x
20 NSW Parliamentary Budget Office (PBO) costing of council mergers, Briefing Note - 2015.

Review of Business Case Merger OptionsOctober 2015
| 41Liability limited by a scheme approved under Professional Standards Legislation
(34,500)
0
11,50015,870
20,930 23,000 23,000 23,000 23,000 23,000
(40,000)
(30,000)
(20,000)
(10,000)
0
10,000
20,000
30,000
40,000
50,000
1 2 3 4 5 6 7 8 9 10
Synergy benefit Integration cost Net merger benefit
estimated annualized synergy value. We have adopted a more conservative assumption to reflect our expectation that there are likely to be more complex stakeholdermanagement costs and more variances in systems and processes between local councils as compared with corporations. As noted above, the evidence from theQueensland local council amalgamations indicate a 3-4x annualized merger savings assumption to be reasonable.
• Merger integration costs are assumed to be incurred over 5 years, and front end loaded over this period. Specifically, we have assumed 60% of these costs will beincurred in year 1, 20% in year 2, 10% in year 3, 7% in year 4 and 3% in year 5. This expenditure profile reflects our experience that the majority of the costs will beincurred in the first two years and will relate to initial setting up of the merger implementation program, staffing changes, integration of back office functions, initialbusiness process redesign and consolidation of IT functions and applications. Costs incurred in years 3 to 5 will likely reflect residual costs associated with ongoing ITintegration.
An example of our methodology is illustrated diagram below.
Figure 3: Stylised 4 into 1 merger example of EY’s methodology
Assumed cost base of entities:
• Entity #1 $130m
• Entity #2 $50m
• Entity #3 $100m
• Entity #4 $80m
Cost base subject to merger synergies: $230m
Assumed efficiency saving rate of 10% andintegration costs of 3x annualised efficiencysavings.
Steady State - until the end of the merger timeline

Review of Business Case Merger OptionsOctober 2015
| 42Liability limited by a scheme approved under Professional Standards Legislation
Results of top-down analysis5.1.3
The potential net merger benefit / (cost) outcomes for each ILGRP preferred merger scenario based on the methodology described above is summarised in the table below.
Table 15: Top down analysis of ILGRP metropolitan local council preferred merger options (Base Case) (over 20 years)
Merger option NPV range 4% @ 2016$’000
NPV range 7% @ 2016$’000
NPV range 10% @ 2016$’000
ILGRP preferred merger options
1 Manly + Warringah +Pittwater 131,470 - 197,204 92,589 - 138,883 66,177 - 99,266
2 Hornsby + Ku-ring-gai 100,408 - 150,611 70,713 - 106,070 50,542 - 75,812
3 Fairfield + Liverpool 148,921 - 223,381 104,879 - 157,318 74,961 - 112,442
4 Canterbury + Kogarah + Rockdale + Hurstville 195,898 - 293,847 137,963 - 206,945 98,608 - 147,912
5 Hunters Hill + Lane Cove + Mosman + North Sydney + Ryde (2/3) + Willoughby 221,023 - 331,535 149,624 - 224,437 101,384 - 152,076
6 Randwick + Waverley + Woollahra + Botany Bay + Sydney 335,015 - 502,522 226,793 - 340,189 153,672 - 230,508
7 Ashfield + Burwood + Canada Bay + Leichhardt + Marrickville + Strathfield 229,663 - 344,495 155,473 - 233,210 105,347 - 158,020
8 Auburn + Holroyd + Parramatta + The Hills (15%) + Ryde (1/3) 177,434 - 266,151 120,116 - 180,174 81,389 - 122,084
Additional merger options identified by ILGRP and Councils and requested by IPART
9 Randwick + Waverley + Woollahra + Botany Bay 247,159 - 370,739 174,065 - 261,097 124,411 - 186,617
10 Bankstown + Canterbury 97,170 - 145,755 68,433 - 102,650 48,912 - 73,368
11 Gosford + Wyong 222,831 - 334,247 156,931 - 235,397 112,165 - 168,248
12 Randwick + Waverley 112,555 - 168,832 79,268 - 118,902 56,656 - 84,984
13 Auburn + Burwood + Canada Bay 100,262 - 150,393 70,611 - 105,916 50,468 - 75,703
14 Hawkesbury + The Hills 68,069 - 102,104 47,938 - 71,908 34,263 - 51,395
The base case analysis indicates all of the ILGRP preferred merger options are NPV positive and will produce net merger benefits, lending support to the business case forthe preferred merger options. Our NPV range for each merger scenario is reasonably wide and reflects the combination of assumptions we have adopted on potentialmerger benefits and costs. The degree to which net merger benefits will be achievable in each scenario will likely depend on the specific circumstances of the relevantcouncils in each merger scenario. In some cases, it could be that potential net merger benefits would be closer to the low end of the range, whilst in other cases, net mergerbenefits may be higher.
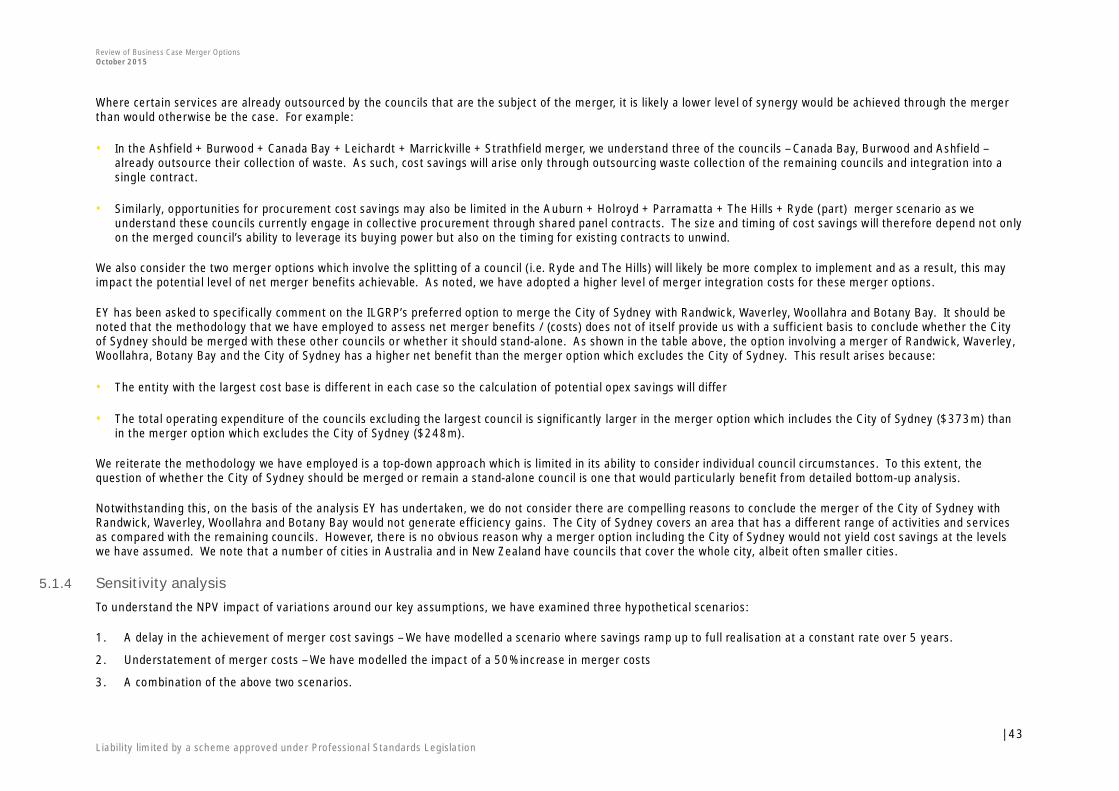
Review of Business Case Merger OptionsOctober 2015
| 43Liability limited by a scheme approved under Professional Standards Legislation
Where certain services are already outsourced by the councils that are the subject of the merger, it is likely a lower level of synergy would be achieved through the mergerthan would otherwise be the case. For example:
• In the Ashfield + Burwood + Canada Bay + Leichardt + Marrickville + Strathfield merger, we understand three of the councils – Canada Bay, Burwood and Ashfield –already outsource their collection of waste. As such, cost savings will arise only through outsourcing waste collection of the remaining councils and integration into asingle contract.
• Similarly, opportunities for procurement cost savings may also be limited in the Auburn + Holroyd + Parramatta + The Hills + Ryde (part) merger scenario as weunderstand these councils currently engage in collective procurement through shared panel contracts. The size and timing of cost savings will therefore depend not onlyon the merged council’s ability to leverage its buying power but also on the timing for existing contracts to unwind.
We also consider the two merger options which involve the splitting of a council (i.e. Ryde and The Hills) will likely be more complex to implement and as a result, this mayimpact the potential level of net merger benefits achievable. As noted, we have adopted a higher level of merger integration costs for these merger options.
EY has been asked to specifically comment on the ILGRP’s preferred option to merge the City of Sydney with Randwick, Waverley, Woollahra and Botany Bay. It should benoted that the methodology that we have employed to assess net merger benefits / (costs) does not of itself provide us with a sufficient basis to conclude whether the Cityof Sydney should be merged with these other councils or whether it should stand-alone. As shown in the table above, the option involving a merger of Randwick, Waverley,Woollahra, Botany Bay and the City of Sydney has a higher net benefit than the merger option which excludes the City of Sydney. This result arises because:
• The entity with the largest cost base is different in each case so the calculation of potential opex savings will differ
• The total operating expenditure of the councils excluding the largest council is significantly larger in the merger option which includes the City of Sydney ($373m) thanin the merger option which excludes the City of Sydney ($248m).
We reiterate the methodology we have employed is a top-down approach which is limited in its ability to consider individual council circumstances. To this extent, thequestion of whether the City of Sydney should be merged or remain a stand-alone council is one that would particularly benefit from detailed bottom-up analysis.
Notwithstanding this, on the basis of the analysis EY has undertaken, we do not consider there are compelling reasons to conclude the merger of the City of Sydney withRandwick, Waverley, Woollahra and Botany Bay would not generate efficiency gains. The City of Sydney covers an area that has a different range of activities and servicesas compared with the remaining councils. However, there is no obvious reason why a merger option including the City of Sydney would not yield cost savings at the levelswe have assumed. We note that a number of cities in Australia and in New Zealand have councils that cover the whole city, albeit often smaller cities.
Sensitivity analysis5.1.4
To understand the NPV impact of variations around our key assumptions, we have examined three hypothetical scenarios:
1. A delay in the achievement of merger cost savings – We have modelled a scenario where savings ramp up to full realisation at a constant rate over 5 years.
2. Understatement of merger costs – We have modelled the impact of a 50% increase in merger costs
3. A combination of the above two scenarios.

Review of Business Case Merger OptionsOctober 2015
| 44Liability limited by a scheme approved under Professional Standards Legislation
The results are summarised in the tables below.
Table 16: ILGRP metropolitan local council preferred merger options – Scenario 1: More conservative ramp-up of merger benefits (over 20 years)
Merger option EY top-down indicative NPV Range ($’000)
4% Discount Rate 7% Discount Rate 10% Discount Rate
ILGRP preferred merger options
1 Manly Warringah Pittwater 123,919 - 185,879 85,547 - 128,321 59,592 - 89,388
2 Hornsby Ku-ring-gai 94,641 - 141,962 65,335 - 98,003 45,512 - 68,268
3 Fairfield Liverpool 140,368 - 210,552 96,902 - 145,353 67,502 - 101,253
4 Canterbury Kogarah Rockdale Hurstville 184,648 - 276,971 127,470 - 191,206 88,796 - 133,194
5 Hunters Hill Lane Cove Mosman North Sydney Ryde (part) Willoughby 206,940 - 310,410 136,490 - 204,735 89,101 - 133,652
6 Randwick Waverley Woollahra Botany Bay Sydney 313,669 - 470,503 206,884 - 310,326 135,055 - 202,582
7 Ashfield Burwood Canada Bay Leichhardt Marrickville Strathfield 215,030 - 322,545 141,825 - 212,738 92,584 - 138,876
8 Auburn Holroyd Parramatta The Hills Ryde (part) 166,129 - 249,193 109,572 - 164,358 71,529 - 107,294
Additional merger options identified by ILGRP and Councils and requested by IPART
9 Randwick Waverley Woollahra Botany Bay 232,965 - 349,448 160,826 - 241,239 112,031 - 168,047
10 Bankstown Canterbury 91,590 - 137,385 63,228 - 94,843 44,045 - 66,067
11 Gosford Wyong 210,034 - 315,051 144,996 - 217,494 101,004 - 151,506
12 Randwick Waverley 106,091 - 159,136 73,239 - 109,859 51,018 - 76,527
13 Auburn Burwood Canada Bay 94,504 - 141,756 65,240 - 97,861 45,446 - 68,170
14 Hawkesbury The Hills 64,160 - 96,240 44,292 - 66,439 30,854 - 46,281

Review of Business Case Merger OptionsOctober 2015
| 45Liability limited by a scheme approved under Professional Standards Legislation
Table 17: ILGRP metropolitan local council preferred merger options – Scenario 2: 50% increase in merger costs (over 20 years)
Merger options EY top-down indicative NPV Range ($’000)
4% Discount Rate 7% Discount Rate 10% Discount Rate
ILGRP preferred merger options
1 Manly Warringah Pittwater 112,012 - 168,018 74,033 - 111,050 59,592 - 89,388
2 Hornsby Ku-ring-gai 85,547 - 128,321 56,542 - 84,813 45,512 - 68,268
3 Fairfield Liverpool 126,880 - 190,320 83,860 - 125,791 67,502 - 101,253
4 Canterbury Kogarah Rockdale Hurstville 166,904 - 250,357 110,314 - 165,471 88,796 - 133,194
5 Hunters Hill Lane Cove Mosman North Sydney Ryde (part) Willoughby 172,632 - 258,948 103,478 - 155,217 89,101 - 133,652
6 Randwick Waverley Woollahra Botany Bay Sydney 261,667 - 392,500 156,846 - 235,269 135,055 - 202,582
7 Ashfield Burwood Canada Bay Leichhardt Marrickville Strathfield 179,381 - 269,071 107,523 - 161,284 92,584 - 138,876
8 Auburn Holroyd Parramatta The Hills Ryde (part) 138,587 - 207,880 83,070 - 124,606 71,529 - 107,294
Additional merger options identified by ILGRP and Councils and requested by IPART
9 Randwick Waverley Woollahra Botany Bay 210,579 - 315,868 139,181 - 208,771 112,031 - 168,047
10 Bankstown Canterbury 82,789 - 124,183 54,719 - 82,078 44,045 - 66,067
11 Gosford Wyong 189,851 - 284,777 125,481 - 188,221 101,004 - 151,506
12 Randwick Waverley 95,896 - 143,845 63,382 - 95,073 51,018 - 76,527
13 Auburn Burwood Canada Bay 85,423 - 128,135 56,460 - 84,690 45,446 - 68,170
14 Hawkesbury The Hills 57,995 - 86,992 38,331 - 57,497 30,854 - 46,281
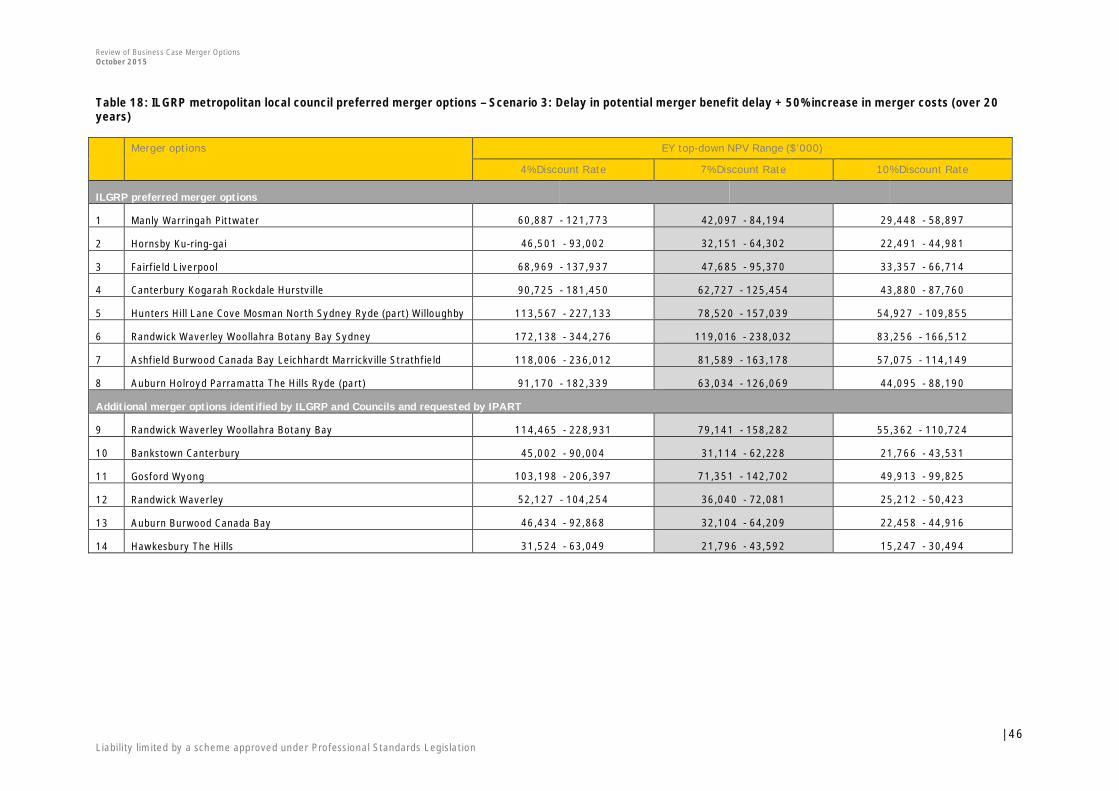
Review of Business Case Merger OptionsOctober 2015
| 46Liability limited by a scheme approved under Professional Standards Legislation
Table 18: ILGRP metropolitan local council preferred merger options – Scenario 3: Delay in potential merger benefit delay + 50% increase in merger costs (over 20years)
Merger options EY top-down NPV Range ($’000)
4% Discount Rate 7% Discount Rate 10% Discount Rate
ILGRP preferred merger options
1 Manly Warringah Pittwater 60,887 - 121,773 42,097 - 84,194 29,448 - 58,897
2 Hornsby Ku-ring-gai 46,501 - 93,002 32,151 - 64,302 22,491 - 44,981
3 Fairfield Liverpool 68,969 - 137,937 47,685 - 95,370 33,357 - 66,714
4 Canterbury Kogarah Rockdale Hurstville 90,725 - 181,450 62,727 - 125,454 43,880 - 87,760
5 Hunters Hill Lane Cove Mosman North Sydney Ryde (part) Willoughby 113,567 - 227,133 78,520 - 157,039 54,927 - 109,855
6 Randwick Waverley Woollahra Botany Bay Sydney 172,138 - 344,276 119,016 - 238,032 83,256 - 166,512
7 Ashfield Burwood Canada Bay Leichhardt Marrickville Strathfield 118,006 - 236,012 81,589 - 163,178 57,075 - 114,149
8 Auburn Holroyd Parramatta The Hills Ryde (part) 91,170 - 182,339 63,034 - 126,069 44,095 - 88,190
Additional merger options identified by ILGRP and Councils and requested by IPART
9 Randwick Waverley Woollahra Botany Bay 114,465 - 228,931 79,141 - 158,282 55,362 - 110,724
10 Bankstown Canterbury 45,002 - 90,004 31,114 - 62,228 21,766 - 43,531
11 Gosford Wyong 103,198 - 206,397 71,351 - 142,702 49,913 - 99,825
12 Randwick Waverley 52,127 - 104,254 36,040 - 72,081 25,212 - 50,423
13 Auburn Burwood Canada Bay 46,434 - 92,868 32,104 - 64,209 22,458 - 44,916
14 Hawkesbury The Hills 31,524 - 63,049 21,796 - 43,592 15,247 - 30,494

Review of Business Case Merger OptionsOctober 2015
| 47Liability limited by a scheme approved under Professional Standards Legislation
As can be seen from Table 16 to Table 18 above, the NPV range of net merger outcomes reduces in each case compared with our base case estimates.
As modelled, the delay in achieving potential merger benefits reduces the NPV (@ 7%) of net merger benefits by 8.1%, on average across all merger options, whilst a 50%rise in estimated merger costs reduces NPV outcomes by 24.3%, on average across all merger options.
Nevertheless, in all of the above 3 scenarios, net merger outcomes remain positive for all merger options.
In addition to the above three sensitivity scenarios, we have analysed the extent of the
• Reduction in potential merger benefits that would need to occur such that the NPV outcomes (at 7%) would shift from positive to negative; and
• Increase required in estimated merger costs that would need to be incurred in order to reduce the NPV outcome (at 7%) to shift from positive to negative.
Our calculations indicate that NPV outcomes (at 7%) would shift from positive to negative if:
• Potential opex savings are delayed by 11 years and fully realised over 5 years for low-medium complex merger options and 9 years for very complex merger options.That is, for low-medium complex merger options, there would not be any opex savings from year 1 to year 10 of the merger. Instead, they will begin in year 11 and endin year 20 in the following ramp up profile: 20% of opex savings in year 11, 40% in year 12, 60% in year 13, 80% in year 14, 100% in year 15 to year 20; or
• Estimated merger integration costs increased by 250% from the base case assumptions for low-medium complex merger options and 170% for highly complex mergeroptions.
The merger options explored by the councils5.2
Summary of local council merger options explored in submissions5.2.1
Table 19 below sets out the local council merger options we have been asked to analyse. The NPV figures shown below reflect those calculated in the cost-benefit analysis(“CBA”) in the relevant submission (or implied by the figures supplied in the submission). That is, the NPV figures do not incorporate any re-calculation based on adjustedassumptions or inputs by EY.
In some cases, merger costs and benefits forecast cash flows were provided but no NPV result was calculated. In these cases, where possible, EY has inferred an NPVestimate based on the data provided. Additionally, In some cases, the merger costs and benefits, and hence NPV outcomes, have been revised by the relevant council or itsconsultant subsequent to the original submission in response to queries from IPART. Where this has occurred, a revised NPV outcome has been noted in Table 19.
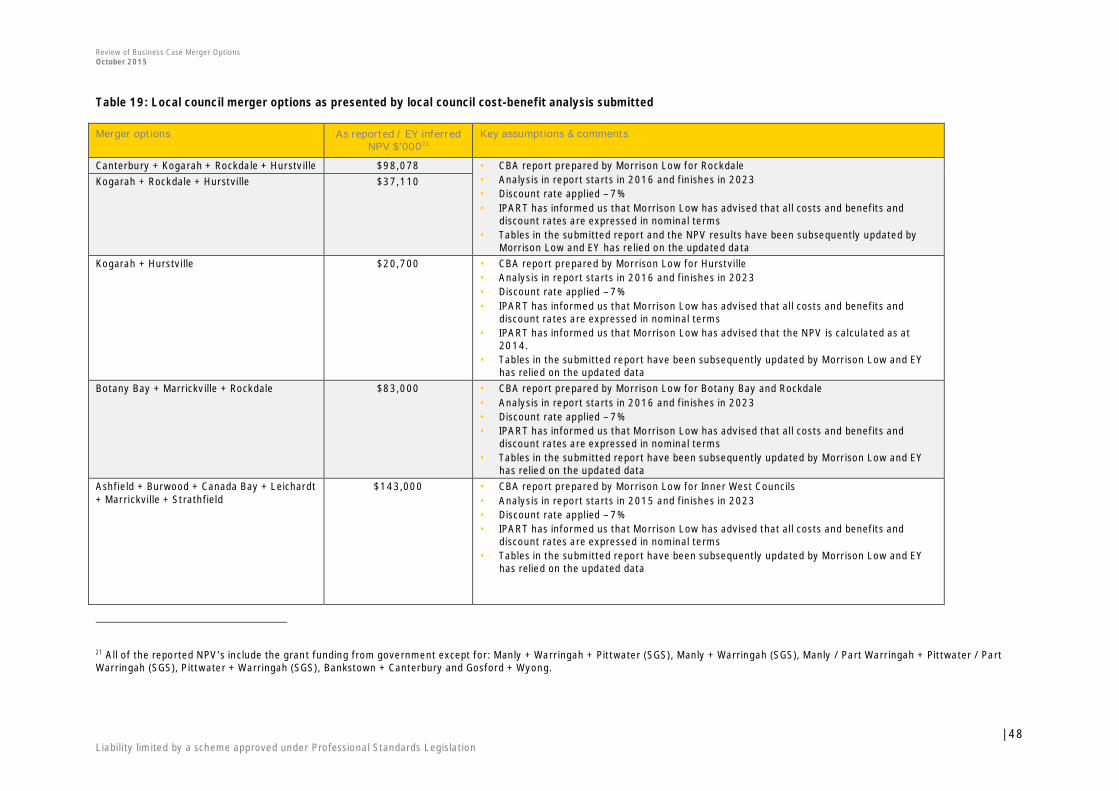
Review of Business Case Merger OptionsOctober 2015
| 48Liability limited by a scheme approved under Professional Standards Legislation
Table 19: Local council merger options as presented by local council cost-benefit analysis submitted
Merger options As reported / EY inferredNPV $’00021
Key assumptions & comments
Canterbury + Kogarah + Rockdale + Hurstville $98,078 • CBA report prepared by Morrison Low for Rockdale• Analysis in report starts in 2016 and finishes in 2023• Discount rate applied – 7%• IPART has informed us that Morrison Low has advised that all costs and benefits and
discount rates are expressed in nominal terms• Tables in the submitted report and the NPV results have been subsequently updated by
Morrison Low and EY has relied on the updated data
Kogarah + Rockdale + Hurstville $37,110
Kogarah + Hurstville $20,700 • CBA report prepared by Morrison Low for Hurstville• Analysis in report starts in 2016 and finishes in 2023• Discount rate applied – 7%• IPART has informed us that Morrison Low has advised that all costs and benefits and
discount rates are expressed in nominal terms• IPART has informed us that Morrison Low has advised that the NPV is calculated as at
2014.• Tables in the submitted report have been subsequently updated by Morrison Low and EY
has relied on the updated dataBotany Bay + Marrickville + Rockdale $83,000 • CBA report prepared by Morrison Low for Botany Bay and Rockdale
• Analysis in report starts in 2016 and finishes in 2023• Discount rate applied – 7%• IPART has informed us that Morrison Low has advised that all costs and benefits and
discount rates are expressed in nominal terms• Tables in the submitted report have been subsequently updated by Morrison Low and EY
has relied on the updated dataAshfield + Burwood + Canada Bay + Leichardt+ Marrickville + Strathfield
$143,000 • CBA report prepared by Morrison Low for Inner West Councils• Analysis in report starts in 2015 and finishes in 2023• Discount rate applied – 7%• IPART has informed us that Morrison Low has advised that all costs and benefits and
discount rates are expressed in nominal terms• Tables in the submitted report have been subsequently updated by Morrison Low and EY
has relied on the updated data
21 All of the reported NPV’s include the grant funding from government except for: Manly + Warringah + Pittwater (SGS), Manly + Warringah (SGS), Manly / Part Warringah + Pittwater / PartWarringah (SGS), Pittwater + Warringah (SGS), Bankstown + Canterbury and Gosford + Wyong.

Review of Business Case Merger OptionsOctober 2015
| 49Liability limited by a scheme approved under Professional Standards Legislation
Merger options As reported / EY inferredNPV $’00021
Key assumptions & comments
Hunters Hill + Lane Cove + Mosman + NorthSydney + Ryde (part) + Willoughby
$59,000 • CBA report prepared by Morrison Low for Hunters Hill, Lane Cove and Ryde• Analysis in report starts in 2016 and finishes in 2023• Discount rate applied – 7%• IPART has informed us that Morrison Low has advised that all costs and benefits and
discount rates are expressed in nominal terms• IPART has informed us that Morrison Low has advised that the NPV is calculated as at
2014.• Data shown is for the ‘efficiencies realised’ scenario
Willoughby + Lane Cove + North Sydney $33,800 • CBA report prepared by Morrison Low for Willoughby• Analysis in report starts in 2016 and finishes in 2023• Discount rate applied – 7%• IPART has informed us that Morrison Low has advised that all costs and benefits and
discount rates are expressed in nominal terms• IPART has informed us that Morrison Low has advised that the NPV is calculated as at
2014.
Willoughby + North Sydney $31,600
Auburn + Burwood + Canada Bay $32,100 • CBA report prepared by Morrison Low for Auburn• Analysis in report starts in 2016 and finishes in 2023• Discount rate applied – 7%• IPART has informed us that Morrison Low has advised that all costs and benefits and
discount rates are expressed in nominal terms• IPART has informed us that Morrison Low has advised that the NPV is calculated as at
2014.• Tables in the submitted report have been subsequently updated by Morrison Low and EY
has relied on the updated dataAuburn + Holroyd + Parramatta + The Hills +Ryde (part)
$41,800 • CBA report prepared by Morrison Low for Holroyd• Analysis in reports starts in 2016 and finishes in 2023• Discount rate applied – 7%• IPART has informed us that Morrison Low has advised that all costs and benefits and
discount rates are expressed in nominal terms• IPART has informed us that Morrison Low has advised that the NPV is calculated as at
2014.• Data shown is for the ‘efficiencies realised’ scenario
Hornsby + The Hills $51,509 • CBA reports prepared by KPMG• Analysis in report starts in 2014 and finishes in 2023• Discount rate applied – 9.5% nominal (inferred from other KPMG reports)• Net merger benefits identified annually but NPV of net merger benefits not stated.
The NPV figures stated are inferred based on assumptions employed in the report.
Hornsby + Ku-Ring Gai $37,751Hornsby + Ku-Ring Gai + The Hills $115,500
Manly + Warringah + Pittwater (KPMG) $44,998 • CBA report prepared by KPMG, as originally submitted• Analysis in report starts in 2015 and finishes in 2024, however, merger cash flows beginManly / Part Warringah + Pittwater / Part $13,746
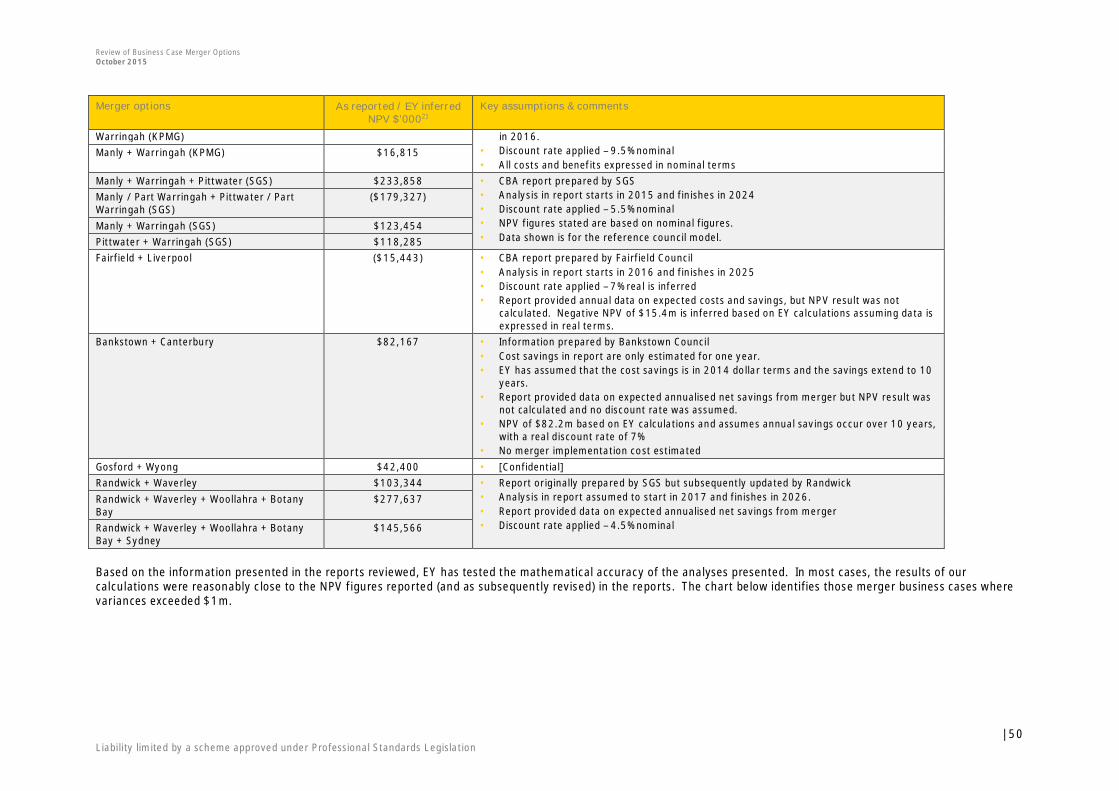
Review of Business Case Merger OptionsOctober 2015
| 50Liability limited by a scheme approved under Professional Standards Legislation
Merger options As reported / EY inferredNPV $’00021
Key assumptions & comments
Warringah (KPMG) in 2016.• Discount rate applied – 9.5% nominal• All costs and benefits expressed in nominal terms
Manly + Warringah (KPMG) $16,815
Manly + Warringah + Pittwater (SGS) $233,858 • CBA report prepared by SGS• Analysis in report starts in 2015 and finishes in 2024• Discount rate applied – 5.5% nominal• NPV figures stated are based on nominal figures.• Data shown is for the reference council model.
Manly / Part Warringah + Pittwater / PartWarringah (SGS)
($179,327)
Manly + Warringah (SGS) $123,454Pittwater + Warringah (SGS) $118,285Fairfield + Liverpool ($15,443) • CBA report prepared by Fairfield Council
• Analysis in report starts in 2016 and finishes in 2025• Discount rate applied – 7% real is inferred• Report provided annual data on expected costs and savings, but NPV result was not
calculated. Negative NPV of $15.4m is inferred based on EY calculations assuming data isexpressed in real terms.
Bankstown + Canterbury $82,167 • Information prepared by Bankstown Council• Cost savings in report are only estimated for one year.• EY has assumed that the cost savings is in 2014 dollar terms and the savings extend to 10
years.• Report provided data on expected annualised net savings from merger but NPV result was
not calculated and no discount rate was assumed.• NPV of $82.2m based on EY calculations and assumes annual savings occur over 10 years,
with a real discount rate of 7%• No merger implementation cost estimated
Gosford + Wyong $42,400 • [Confidential]Randwick + Waverley $103,344 • Report originally prepared by SGS but subsequently updated by Randwick
• Analysis in report assumed to start in 2017 and finishes in 2026.• Report provided data on expected annualised net savings from merger• Discount rate applied – 4.5% nominal
Randwick + Waverley + Woollahra + BotanyBay
$277,637
Randwick + Waverley + Woollahra + BotanyBay + Sydney
$145,566
Based on the information presented in the reports reviewed, EY has tested the mathematical accuracy of the analyses presented. In most cases, the results of ourcalculations were reasonably close to the NPV figures reported (and as subsequently revised) in the reports. The chart below identifies those merger business cases wherevariances exceeded $1m.

Review of Business Case Merger OptionsOctober 2015
| 51Liability limited by a scheme approved under Professional Standards Legislation
Figure 4: Reported NPVs versus EY calculations ($’000) – Variances > $1m
The largest mathematical variance based on our checks appears to be in the Willoughby + North Sydney merger business case. We have not had further access to the localcouncils or their respective consultants to reconcile these differences.
Assumptions underpinning submitted merger business cases5.2.2
This section of our report provides a high level overview of the key assumptions that have been employed by councils and their consultants in undertaking their mergerbusiness case analyses. Appendix B contains a detailed outline of the key assumptions employed.
Merger integration costs
All of the merger business cases we reviewed incorporated assumptions on merger integration costs, with the exception of the information prepared by Bankstown Councilfor the merger of Bankstown and Canterbury.
Reports prepared by Morrison Low typically apply transition costs principally in the first three years and rely on estimates based on the proposed amalgamation of nine localcouncils to create a single council for Wellington. As we have discussed earlier, the integration cost estimates for the proposed Wellington reorganization appear to be high,albeit there is limited evidence generally available on the size of these costs. Morrison Low also included estimates for staff redundancy in the transition period althoughthis is limited to Tier 1 and Tier 2 staff. With respect to other staff, Morrison Low assumes that redundancies will occur after a no forced redundancy period (3 years) but inthe transition period, it is assumed a natural attrition policy will apply. Other merger transition costs include ICT costs, branding and in some cases, remunerationharmonisation.
0
50,000
100,000
150,000
200,000
250,000
300,000
Randwick Waverley Woollahra Botany Bay Manly Part Warringah + Pittwater PartWarringah (KPMG)
Randwick Waverley Woolahra Botany BaySydney
Willoughby North Sydney
Reported NPV
Recalculated NPV

Review of Business Case Merger OptionsOctober 2015
| 52Liability limited by a scheme approved under Professional Standards Legislation
In the reports prepared by KPMG, merger integration costs have been estimated based on case study examples. Upfront costs generally were estimated as a proportion oftotal annual expenditure of the merged entity and apportioned across costs for different types of activities based on a comparative study of the amalgamation experience inToronto. Effort was made to estimate redundancy costs based on the specific circumstances of individual councils.
SGS estimated merger transition costs as a percentage of operating expenses based on a UK case study. Merger costs were assumed to occur in the first 2 years.
For the remaining merger business cases we reviewed, merger integration costs were generally estimated based on case study examples or on discussions with the relevantcouncils.
Potential cost savings
Where merger cost savings were identified, key sources of cost savings included staffing where there were duplicated functions and roles, reduction of governance costs dueto having a governance structure which was scaled to the size of the merged council, savings in procurement functions through rationalisation of works units and materials,reduced IT costs through ICT consolidation and certain property-related savings due to a reduction in the number of office sites.
Estimates of cost savings were based mainly on case studies of amalgamation experience elsewhere (mainly New Zealand) as well as on discussions with management of therelevant councils. In most cases, cost savings were assumed to commence upon transition, although some staff redundancies were assumed to be delayed due toprotections offered under the Local Government Act.
Key risks identified
All of the merger business cases we reviewed identified key risks arising from the merger, particularly around the obvious financial risks such as transitional andimplementation costs being more significant than set out in the business cases or that the efficiencies projected are not delivered.
Reports prepared by KPMG also identified other financial and non-financial risks such as the risk of the merged entity not being able to achieve financial sustainability overthe longer term, strategic risks, risk to service quality and effectiveness, risk to the effectiveness of local representation and risk to effective implementation andmanagement over time.
Reports prepared by Morrison Low discussed other key risks identified such as the risk that cultural integration of the different councils could negatively impact morale andthe staff turnover rate. This could reduce business performance and prolong the time taken to achieve the projected efficiencies. Service levels are also at risk to rise acrossthe merged council, standardizing on the highest level of those services that are being integrated. Meanwhile, should the financial performance of the merged council beless than projected, this could result in the need to reduce services, find further efficiency gains or increase rates to address the operating deficit. In addition, developing agovernance model that represents the communities of interest across the proposed merger area could also prove to be challenging.
EY analysis5.3We have made two types of adjustments to the business cases submitted by the local councils:
• Standardisation adjustments
• Other adjustments

Review of Business Case Merger OptionsOctober 2015
| 53Liability limited by a scheme approved under Professional Standards Legislation
Standardisation adjustments5.3.1
Many of the merger business cases were presented in different ways, based on different timelines, using both nominal and real cash flows, and different discount rates.Some included the impact of the grant funding from the State. We have standardised the business cases to facilitate more effective comparison between them and with theNPV results of EY’s top-down approach as applied to the ILGRP preferred merger scenarios. The key adjustments were to:
• Extend the analysis to 20 year timeframe, with all costs and benefits commencing FY 2017
• Discount real net merger benefits / (costs) using a 7% real discount rate, or discount nominal net merger benefits / (costs) using 9.675% nominal discount rate (i.e.inflated by 2.5 % inflation assumption)
• Exclude grant funding from merger benefits.
The impact of the standardisation adjustments that we have made are reflected in the figures shown in Table 20.
Table 20: Local council merger options explored by local councils incorporating standardisation adjusted by EY (over 20 years)
Merger scenario NPV 4% @ 2016$’000
NPV 7% @ 2016$’000
NPV 10% @ 2016$’000
Kogarah Rockdale Hurstville 132,171 90,273 61,711
Canterbury Kogarah Rockdale Hurstville 276,676 196,961 142,441
Kogarah Hurstville 73,944 48,613 31,418
Botany Bay Marrickville Rockdale 193,949 138,221 99,817
Ashfield Burwood Canada Bay Leichhardt Marrickville Strathfield 315,420 229,108 169,546
Hunters Hill Lane Cove Mosman North Sydney Ryde (part) Willoughby 244,461 166,466 113,582
Willoughby Lane Cove North Sydney 127,218 86,403 58,721
Willoughby North Sydney 119,503 83,807 59,407
Auburn Burwood Canada Bay 111,181 76,359 52,741
Auburn Holroyd Parramatta The Hills Ryde (part) 169,629 110,387 70,217
Hornsby The Hills 98,159 74,112 57,539
Hornsby Ku-ring-gai 67,782 50,820 39,143
Hornsby Ku-ring-gai The Hills 216,055 164,369 128,715
Manly Warringah Pittwater (KPMG) 116,046 84,934 63,650
Manly Part Warringah + Pittwater Part Warringah (KPMG) 33,328 21,298 13,177
Manly Warringah (KPMG) 60,855 43,989 32,469

Review of Business Case Merger OptionsOctober 2015
| 54Liability limited by a scheme approved under Professional Standards Legislation
Merger scenario NPV 4% @ 2016$’000
NPV 7% @ 2016$’000
NPV 10% @ 2016$’000
Manly Warringah Pittwater (SGS) 447,336 328,320 247,180
Manly Warringah (SGS) 237,075 173,812 130,694
Pittwater Warringah [Additional Option] (SGS) 227,595 166,777 125,332
Manly Part Warringah + Pittwater Part Warringah (SGS) (335,096) (247,788) (188,177)
Fairfield Liverpool (49,456) (40,823) (34,407)
Bankstown Canterbury 167,057 130,225 104,651
Gosford Wyong 179,967 126,363 90,527
Randwick Waverley Woollahra Botany Bay Sydney 276,610 191,503 134,444
Randwick Waverley 166,860 119,423 87,066
Randwick Waverley Woollahra Botany Bay 465,025 338,555 252,314
Other adjustments5.3.2
As discussed in Section 5.2, the merger business cases explored by the local councils are based on a range of assumptions. Most of the assumptions were adequatelyjustified and are considered reasonable given the available evidence, however, a small number were more open to question. These are:
• Assumed increase in service levels and FTE requirements – In most of the merger business cases prepared by Morrison Low, an assumption is made for FTE increasesfrom around year 4 onwards to support an increase in service levels. Morrison Low reports indicate this is based on research conducted for the ILGRP which noted thateach of the councils involved in the 2004 NSW mergers had more staff after the merger than the combined councils together. Whilst it may be true that councils maydirect initial cost savings towards higher levels of service provision and this may lead to a future increase in FTEs, we consider that for the purpose of modelling the NPVimpacts of each merger, the objective should be to capture the first-round direct impacts of the merger. Hence, we consider the merger business cases should includethe full benefits of rationalisation, including both cost savings and enhanced service levels. .
• Branding costs assumption in Fairfield + Liverpool business case – Fairfield Council’s merger business case for the amalgamation of Fairfield and Liverpool Councils hasassumed a branding cost assumption of $0.5m per annum from 2016 to 2025. Whilst we do not dispute that costs will be incurred for re-branding, we question whethersuch costs would amount to $10m over 10 years. This assumption also stands out in comparison with the branding cost assumptions in the other merger business casesexplored, particularly given the relative size of the merger. On this basis, we consider a more conservative branding cost assumption of $2m over 2 years should beapplied.
• Absence of merger cost savings in Fairfield + Liverpool merger business case – Fairfield Council’s merger business case applied a methodology for estimating savingsin operating costs from a merger, which results in no merger cost savings. Instead, the analysis predicts a rise in costs post-merger. We do not consider this is areasonable outcome as some degree of cost savings, however minimal, would be expected from a reduction in the number of mayors and councillors and from FTEnumbers in back-office functions. It has also been assumed that any savings that arise would do so in 2022/23. We consider a more reasonable assumption is toassume cost savings from year 1. We have adjusted the merger business case by applying an assumption for cost savings similar to our top-down approach.

Review of Business Case Merger OptionsOctober 2015
| 55Liability limited by a scheme approved under Professional Standards Legislation
• Temporary office relocation costs in Fairfield + Liverpool merger business case - We also note Fairfield Council has assumed there will be relocation costs over fiveyears at the rate of $1.75m per annum as it will be necessary to temporarily lease a building whilst a permanent new building is constructed. Whilst it is notunreasonable to expect the merged council will have its staff relocated to one premise, we question whether Fairfield Council has overlooked cost savings which mightarise from moving from the current premises occupied by each council to the new merged office. To the extent these existing office locations are owned or leased, therewould be cost savings either in the form of sites which could be sold, or leasing costs forgone.
• Merger assumptions in Bankstown merger business case - Bankstown Council’s merger business case identified some cost savings in governance and administrationand in certain other areas. These costs however, are assumed to be fully realised in year 1. We consider that it would be more reasonable to assume that cost savingswill flow through over time. As such as we have applied a 5 year ramp up similar to that in our top down approach. We also note that the business did not include anyconsideration of merger costs. We have adjusted the merger business case by applying an assumption for merger integration costs similar to our top-down approach.
• Relocation costs during transition in Randwick & Waverley Council’s merger business case – Randwick and Waverley Councils conducted an analysis of a number ofmerger options. In the merger option involving the City of Sydney, it was assumed that it would be necessary to relocate a number of staff to a single location beingTown Hall House. This assumption generates a significant loss of rental revenue as Town Hall House is currently leased out to the commercial tenants. Whilst it is notunreasonable to expect that the merged council would seek to have most of its staff housed in a single premise, no analysis has been presented on whether alternativelower cost options have been explored. In the absence of a better estimate, we have removed the relocation costs in this option and replaced it with relocation costssimilar to the Randwick + Waverley + Woollahra option.
• Expenditure made to meet the FFTF ratios in Randwick & Waverley’s merger business case – We understand Randwick Council has calculated the net merger benefitsof the various merger options by estimating the efficiencies for each option based on a service oriented financial model designed by SGS in 2013. The costs of theamalgamation process were also estimated as part of the analysis. Additional expenditure was also allowed in order to meet the FFTF ratios, eliminate the infrastructurebacklog and repay debt for each option. Whilst it may be true that councils could direct initial cost savings towards meeting the FFTF ratios, address infrastructurebacklog and debt repayment, these cost savings should nevertheless be recognised as they resulted from the merger. We have therefore made an adjustment to removethis expenditure from all the amalgamation options presented by the Randwick Council.
• Forgone waste reduction levy in various Morrison Low merger business cases – Various merger business cases prepared by Morrison Low have identified cost savingswhich would arise from a rationalisation of existing arrangements and contracts in waste management. In addition, it has also been assumed the cost savings wouldthen be applied to reduce existing waste collection levies. As such, the business case identifies forgone waste collection levy revenue as a merger cost. We haveadjusted the relevant business case to remove the impact of the forgone levy revenue. As noted earlier, we consider that such cost savings should be included in thebusiness case.
• Funding of merger costs in KPMG Pittwater, Manly and Warringah merger business case – The merger business case has identified funding costs of the merger as amerger integration cost. We have adjusted the business case estimates to remove such costs.
The table below presents the NPV results of the merger options incorporating all of the above adjustments.

Review of Business Case Merger OptionsOctober 2015
| 56Liability limited by a scheme approved under Professional Standards Legislation
Table 21: Local council merger options explored by local councils incorporating all EY adjustments (over 20 years)
Merger scenario NPV 4% @ 2017$’000
NPV 7% @ 2017$’000
NPV 10% @ 2017$’000
Kogarah + Rockdale + Hurstville 183,031 126,201 87,689Canterbury + Kogarah + Rockdale + Hurstville 355,010 252,298 182,451Kogarah + Hurstville 106,096 71,325 47,839Botany Bay + Marrickville + Rockdale 322,114 229,641 166,650Ashfield + Burwood + Canada Bay + Leichhardt + Marrickville + Strathfield 504,717 364,157 268,277Hunters Hill + Lane Cove + Mosman + North Sydney + Ryde (part) + Willoughby 368,871 255,199 178,420Willoughby + Lane Cove+ North Sydney 210,824 146,237 102,597Willoughby + North Sydney 176,377 123,948 88,403Auburn + Burwood + Canada Bay 144,009 99,548 69,508Auburn + Holroyd + Parramatta + The Hills + Ryde (part) 323,578 220,160 150,408Hornsby + The Hills 98,159 74,112 57,539Hornsby + Ku-ring-gai 67,782 50,820 39,143Hornsby + Ku-ring-gai + The Hills 216,055 164,369 128,715
Manly + Warringah + Pittwater (KPMG) 139,188 103,158 78,440
Manly Part Warringah + Pittwater Part Warringah (KPMG) 61,377 43,386 31,103
Manly+ Warringah (KPMG) 76,562 56,357 42,506
Manly + Warringah + Pittwater (SGS) 447,336 328,320 247,180
Manly + Warringah (SGS) 237,075 173,812 130,694
Pittwater + Warringah [Additional Option] (SGS) 227,595 166,777 125,332
Manly Part Warringah + Pittwater Part Warringah (SGS) (335,096) (247,788) (188,177)Fairfield + Liverpool 167,779 124,462 95,049Bankstown + Canterbury 116,512 82,055 58,648Gosford + Wyong 179,967 126,363 90,527Randwick + Waverley + Woollahra + Botany Bay + Sydney 523,554 389,275 297,062Randwick + Waverley 176,250 127,308 93,800Randwick + Waverley + Woollahra + Botany Bay 497,300 365,084 274,499

Review of Business Case Merger OptionsOctober 2015
| 57Liability limited by a scheme approved under Professional Standards Legislation
Following the adjustments we have made, NPV outcomes have improved except for the scenario (prepared by SGS) where Warringah Council is split into two, merging onehalf with Manly and one half with Pittwater to create two new councils, which remains negative. We note there remain substantial variations between the merger businesscases prepared by KPMG and SGS in relation to the various combinations of merger involving Manly, Pittwater and Warringah Councils. For example, based on the adjustedfigures reported in the table above, the merger scenario which involves splitting Warringah Council has a negative NPV (at 7%) of $247m as assessed by SGS and a positiveNPV of $43m as assessed by KPMG (with EY adjustments).

Review of Business Case Merger OptionsOctober 2015
| 58Liability limited by a scheme approved under Professional Standards Legislation
6. Key findings
The table below compares:
• The NPV outcomes for the ILGRP preferred merger options and the additional Bankstown/Canterbury and Gosford/Wyong options that we have been asked to assess,based on EY’s top-down methodology (“EY top-down approach”); with
• The NPV outcomes for the same options where they have been explored in local council submissions, incorporating the adjustments made by EY as outlined in Section5.3 (“adjusted reported NPV”).
Table 22: ILGRP metropolitan local council preferred merger options (over 20 years)
Merger scenario 4% Discount Rate 7% Discount Rate 10% Discount Rate
EY top-down NPVRange ($’000)
AdjustedReported
NPV ($’000)EY top-down NPV
Range ($’000)
AdjustedReported
NPV ($’000)EY top-down NPV
Range ($’000)
AdjustedReported
NPV ($’000)
ILGRP preferred merger options
1A Manly Warringah Pittwater (KPMG) 131,470 - 197,204 139,188 92,589 - 138,883 103,158 66,177 - 99,266 78,440
1B Manly Warringah Pittwater (SGS) 131,470 - 197,204 447,336 92,589 - 138,883 328,320 66,177 - 99,266 247,180
2 Hornsby Ku-ring-gai 100,408 - 150,611 67,782 70,713 - 106,070 50,820 50,542 - 75,812 39,143
3 Fairfield Liverpool 148,921 - 223,381 167,779 104,879 - 157,318 124,462 74,961 - 112,442 95,049
4 Canterbury Kogarah Rockdale Hurstville 195,898 - 293,847 355,010 137,963 - 206,945 252,298 98,608 - 147,912 182,451
5 Hunters Hill Lane Cove Mosman North Sydney Ryde (part) Willoughby 221,023 - 331,535 368,871 149,624 - 224,437 255,199 101,384 - 152,076 178,420
6 Randwick Waverley Woollahra Botany Bay Sydney 335,015 - 502,522 523,554 226,793 - 340,189 389,275 153,672 - 230,508 297,062
7 Ashfield Burwood Canada Bay Leichhardt Marrickville Strathfield 229,663 - 344,495 504,717 155,473 - 233,210 364,157 105,347 - 158,020 268,277
8 Auburn Holroyd Parramatta The Hills Ryde (part) 177,434 - 266,151 323,578 120,116 - 180,174 220,160 81,389 - 122,084 150,408
Additional merger scenarios identified by ILGRP and Councils and requested by IPART
9 Randwick Waverley Woollahra Botany Bay 247,159 - 370,739 497,300 174,065 - 261,097 365,084 124,411 - 186,617 274,499
10 Bankstown Canterbury 97,170 - 145,755 116,512 68,433 - 102,650 82,055 48,912 - 73,368 58,648
11 Gosford Wyong 222,831 - 334,247 179,967 156,931 - 235,397 126,363 112,165 - 168,248 90,527
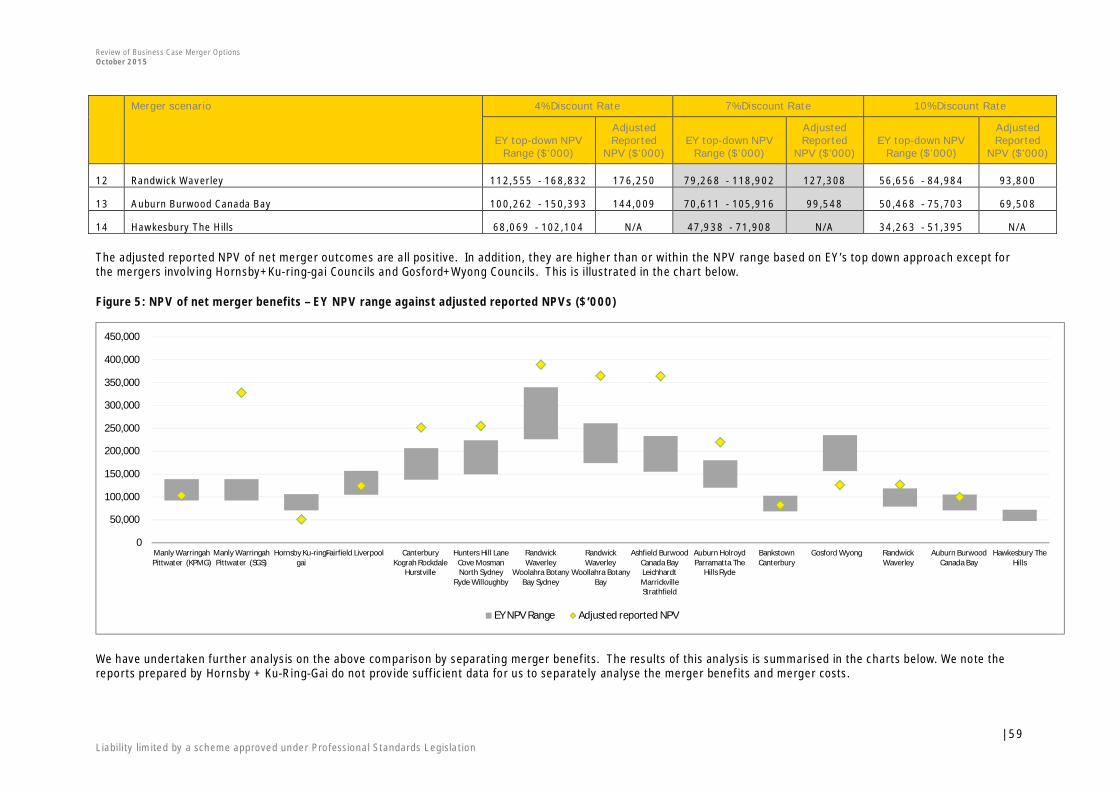
Review of Business Case Merger OptionsOctober 2015
| 59Liability limited by a scheme approved under Professional Standards Legislation
Merger scenario 4% Discount Rate 7% Discount Rate 10% Discount Rate
EY top-down NPVRange ($’000)
AdjustedReported
NPV ($’000)EY top-down NPV
Range ($’000)
AdjustedReported
NPV ($’000)EY top-down NPV
Range ($’000)
AdjustedReported
NPV ($’000)
12 Randwick Waverley 112,555 - 168,832 176,250 79,268 - 118,902 127,308 56,656 - 84,984 93,800
13 Auburn Burwood Canada Bay 100,262 - 150,393 144,009 70,611 - 105,916 99,548 50,468 - 75,703 69,508
14 Hawkesbury The Hills 68,069 - 102,104 N/A 47,938 - 71,908 N/A 34,263 - 51,395 N/A
The adjusted reported NPV of net merger outcomes are all positive. In addition, they are higher than or within the NPV range based on EY’s top down approach except forthe mergers involving Hornsby+Ku-ring-gai Councils and Gosford+Wyong Councils. This is illustrated in the chart below.
Figure 5: NPV of net merger benefits – EY NPV range against adjusted reported NPVs ($’000)
We have undertaken further analysis on the above comparison by separating merger benefits. The results of this analysis is summarised in the charts below. We note thereports prepared by Hornsby + Ku-Ring-Gai do not provide sufficient data for us to separately analyse the merger benefits and merger costs.
0
50,000
100,000
150,000
200,000
250,000
300,000
350,000
400,000
450,000
Manly WarringahPittwater (KPMG)
Manly WarringahPittwater (SGS)
Hornsby Ku-ring-gai
Fairfield Liverpool CanterburyKograh Rockdale
Hurstville
Hunters Hill LaneCove MosmanNorth Sydney
Ryde Willoughby
RandwickWaverley
Woolahra BotanyBay Sydney
RandwickWaverley
Woollahra BotanyBay
Ashfield BurwoodCanada BayLeichhardtMarrickvilleStrathfield
Auburn HolroydParramatta The
Hills Ryde
BankstownCanterbury
Gosford Wyong RandwickWaverley
Auburn BurwoodCanada Bay
Hawkesbury TheHills
EY NPV Range Adjusted reported NPV

Review of Business Case Merger OptionsOctober 2015
| 60Liability limited by a scheme approved under Professional Standards Legislation
Figure 6: NPV of merger benefits - EY NPV range versus adjusted reported NPVs (7%) ($’000)
0
100,000
200,000
300,000
400,000
500,000
600,000
Manly WarringahPittwater(KPMG)
Manly WarringahPittwater (SGS)
Hornsby Ku-ring-gai
FairfieldLiverpool
CanterburyKograh Rockdale
Hurstville
Hunters Hill LaneCove MosmanNorth Sydney
Ryde Willoughby
RandwickWaverleyWoolahra
Botany BaySydney
RandwickWaverleyWoollahraBotany Bay
AshfieldBurwood Canada
Bay LeichhardtMarrickvilleStrathfield
Auburn HolroydParramatta The
Hills Ryde
BankstownCanterbury
Gosford Wyong RandwickWaverley
Auburn BurwoodCanada Bay
Hawkesbury TheHills
EY NPV Range Adjusted reported NPV

Review of Business Case Merger OptionsOctober 2015
| 61Liability limited by a scheme approved under Professional Standards Legislation
Table 23: NPV of merger integration costs - EY NPV range versus adjusted reported NPVs (7%) ($’000)
0
50,000
100,000
150,000
200,000
250,000
ManlyWarringahPittwater(KPMG)
ManlyWarringah
Pittwater (SGS)
Hornsby Ku-ring-gai
FairfieldLiverpool
CanterburyKograh Rockdale
Hurstville
Hunters Hill LaneCove MosmanNorth Sydney
Ryde Willoughby
RandwickWaverleyWoolahra
Botany BaySydney
RandwickWaverleyWoollahraBotany Bay
AshfieldBurwood Canada
Bay LeichhardtMarrickvilleStrathfield
Auburn HolroydParramatta The
Hills Ryde
BankstownCanterbury
Gosford Wyong RandwickWaverley
Auburn BurwoodCanada Bay
Hawkesbury TheHills
EY NPV Range Adjusted reported NPV
Review of Business Case Merger OptionsOctober 2015
| 62Liability limited by a scheme approved under Professional Standards Legislation
It is evident there is substantially more variations around views on merger costs and merger benefits. In most cases, local councils’ estimates of merger costs are lower thanEY’s, but there appears to be a reasonable level of alignment in views on merger benefits with a few exceptions. Overall, EY’s top-down analysis yields net merger outcomesthat are more conservative than many of the analysis undertaken.
We are of the view that our analysis is conservative but prudently so in light of the work that has been undertaken.
Irrespective of differing views on the size of potential merger benefits and merger costs, there would be appear to be consensus that net merger outcomes are positive in allof the listed scenarios above. They also appear to be reasonably robust based on the sensitivity analysis.
EY acknowledges that there are a range of non-financial costs and benefits that will impact any merger. Some of the benefits include:
• Additional capacity for improved and consistent planning decisions
• Improved scale to better partner with government
• Greater resource bases for amalgamated councils
• Additional capacity for local government to improve the range and quality of its services
• Improved ability to attract skilled staff and capacity to offer better staff career development options
Offsetting these non-financial benefits are the challenges noted earlier in this report associated with managing the disruption that inevitably accompanies most mergers,managing cultural differences and addressing staff morale.
These non-financial costs and benefits have not been quantified in our analysis due to the inherent difficulties of valuing such impacts. Nevertheless, the impact of thesecosts and benefits is a relevant consideration in any merger.

Review of Business Case Merger OptionsOctober 2015
| 63Liability limited by a scheme approved under Professional Standards Legislation
Appendix A Merger business cases reviewed
Merger business cases reviewed
Consultant’s name Title of report Date Options analysed
Morrison LowRockdale Council Fit for the Future –Merger Business Case Modelling
March 2015Kogarah Rockdale HurstvilleCanterbury Kogarah Rockdale Hurstville
Morrison LowKogarah Council Fit for the FutureMerger Business Case Modelling
March 2015 Kogarah Hurstville
Morrison LowAirport Councils Fit for the Future –Shared Modelling
March 2015 Botany Bay Marrickville Rockdale
Morrison LowInner West Councils Fit for the Future –Shared Modelling
February 2015 Ashfield Burwood Canada Bay Leichhardt Marrickville Strathfield
Morrison Low
Review of ILGRP recommendationsrelating to a proposed merger of thewhole of Hunters Hill, Lane Cove,Mosman, North Sydney, Willoughby andtwo thirds of Ryde Council.
19 June 2015 Hunters Hill Lane Cove Mosman North Sydney Ryde Willoughby
Morrison LowWilloughby City Council Fit for theFuture Assessment of Options
June 2015Willoughby Lane Cove North SydneyWilloughby North Sydney
Morrison LowSydney Olympic Park City CouncilMerger Business Case
June 2015 Auburn Burwood Canada Bay
Morrison LowHolroyd City Council Merger vs Stand-Alone Business Case
June 2015 Auburn Holroyd Parramatta The Hills Ryde
KPMGAnalysis of local government reformoptions in the Northern Sydney area 22 May 2014
Hornsby The HillsHornsby Ku-ring-gaiHornsby Ku-ring-gai The Hills
KPMGIndependent review of structuraloptions for Manly Council & PittwaterCouncil
1 April 2015Manly Warringah PittwaterManly Part Warringah + Pittwater Part WarringahManly Warringah
SGS ConsultingLocal Government Structural Change –Supplementary Study
February 2015
Manly Warringah PittwaterManly Part Warringah + Pittwater Part WarringahPittwater WarringahManly Warringah
Fairfield CouncilChapter 2 Fit for the Future Financialcriteria and measures
June 2015 Fairfield Liverpool
Bankstown CouncilBankstown City Council: fit for thefuture (information prepared byBankstown Council)
30 July 2015 Bankstown Canterbury

Review of Business Case Merger OptionsOctober 2015
| 64Liability limited by a scheme approved under Professional Standards Legislation
Merger business cases reviewed
Third HorizonWyong Shire Council Fit for the FutureCost-Benefit Analysis of LocalGovernment reform options
12 June 2015 Gosford Wyong
Randwick Council (using an updated reportfrom SGS Consulting)
Randwick City Council Fit for the FutureOptions Analysis
May 2015Randwick Waverley Woollahra Botany Bay SydneyRandwick WaverleyRandwick Waverley Woollahra Botany Bay
It should be noted that in some cases, the data in the merger business cases submitted to IPART were amended following inquiries made by IPART. We have applied theamended data where this has been provided to us.

Review of Business Case Merger OptionsOctober 2015
| 65Liability limited by a scheme approved under Professional Standards Legislation
Appendix B Local council submitted merger business cases – key assumptions
Source Document & Merger Options Valuation assumptions
Key merger assumptions
Merger costs Merger cost savings
SGS (Warringah)
Options:1. Status quo – three separatecouncils2. Manly + Warringah + Pittwater3. Manly + Warringah4. Pittwater + Warringah5. Form 2 new councils by splittingWarringah – i.e. Manly + PartWarringah; Pittwater + PartWarringah
• Discount rate of 5.5%nominal
• Base year 2015• Nominal cash flows to 2024• Concludes that Option 2 has
the preferred outcome• Uses the reference council
model
• Captures transitions costs associated withsystems and processes as these can beobjectively measured.
• Redundancy costs are excluded as assumed tobe offset by savings from staff natural attritionpolicy in the first 3 years
• Estimates based on a UK case study whichassumed 1.4% of current operating expenses
• Merger costs of $3m to $5.5m (measured aspresent value over 10 years) but assumed to beincurred in first 2 years
• Merger costs are higher in option 5 due to theformation of 2 councils
• SGS has identified the following services as those whichare subject to economies of scale - governance,administration, public order and safety, environment,recreation & culture, and transport & communications.Per capita service costs used as a measure of cost.
• Other than governance costs, cost savings in theremaining categories modelled on the basis ofachieving the per capita cost achieved by the mostefficient council in the merger scenario
• Governance costs are dependent on the number ofcouncilors so modelled separately. Option 2 assumes13 councillors whilst options 3 through 5 assume 10councillors per council (same as current number inWarringah). Therefore Option 5 has double thegovernance costs of options 3 and 4.
• Cost savings are assumed to commence 3 years fromcurrent time (i.e. in FY18) to reflect a transition periodfor moving to the new structure.
• Cost savings are assumed to grow in line with growth inoperating expenditure (excluding depreciation) which isbased on projected long term financial plan growthrates.
KPMG (Pittwater & Manly)
Options:1. Status quo – three separatecouncils2. Form 2 new councils by splittingWarringah – i.e. Manly + PartWarringah; Pittwater + PartWarringah3. Manly + Warringah + Pittwater4. Manly + Warringah (Alternativeoption)
• Discount rate: 9.5%nominal, 7% real
• Nominal cash flows• Inflation of 2.5% p.a.• Merger cash flows from
2016 to 2024
• Captures estimated redundancy costs as well asimplementation costs comprising IT and facilityconsolidation, staff retraining and cost offinancing transition costs
• Total upfront costs estimated at 4.7% of totalannual expenditure and apportioned acrosscost types based on Toronto case study
• Total upfront costs assumed to be funded bycash or cash equivalents where upfront costswere less than 10% of cash and cashequivalent. Interest forgone estimated basedon RBA’s interbank overnight cash rate of 2.3%p.a. Otherwise funded by debt at a cost equalto weighted average small business lendingrate (6.6% p.a.)
• Redundancy costs varied from the 4.7%average due to assumptions underpinning the
• Staffing reductions estimated based on experience inToronto and Auckland. Option 2 assumes 3.3%reduction, Option 3 assumes 8% and Option 4 assumes5.6%.
• Salary and wages costs assumed to grow at 3.1% p.a.consistent with the average level used by the NorthernBeaches Council in long term financial plans
• Assumes that there are no forced redundancies in firstyear of implementation. Combined with naturalattrition of approximately 11 per cent, 25% ofredundancies were assumed to occur each year overthe four year period from 2015 – 2019.
• 2% savings assumed in materials and contracts basedon scaling of the 3% saving achieved in the Aucklandcase study. Reduction only applied to those cost itemswithin materials & contracts which were regarded asvariable.

Review of Business Case Merger OptionsOctober 2015
| 66Liability limited by a scheme approved under Professional Standards Legislation
Source Document & Merger Options Valuation assumptions
Key merger assumptions
Merger costs Merger cost savings
efficiency package e.g. 4-12 weeks’ payassumption depending on staff tenure. Stafftenure was estimated with respect to theaverage employee turnover rate of 10.9 percent across each of the councils. Considerationwas given to staffing efficiencies achievable bybranch and average salaries and on-costsaccruals from Manly and Pittwater.
• 2% savings in other expenses after considering make-upof other expenditure and excluding costs that are notscalable.
• No quantification of avoided annual facilitiesexpenditure although KPMG considered that there maybe additional financial benefits from merging councilsshould opportunities for asset rationalisation bepursued.
KPMG (Hornsby)
Options:Hornsby + The HillsHornsby + Ku-Ring GaiHornsby + Ku-Ring Gai + The Hills
• Data was not discounted• 10 year nominal cash flows
from 2014 to 2023
• Costs associated with the merger includedestimated redundancy costs as well asimplementation costs comprising IT and facilityconsolidation, staff retraining and costs of debtfinancing (or foregone interest on cash or cashequivalents). Estimates were based on casestudy examples.
• Total upfront costs were estimated at 4.7 percent of total annual expenditure andapportioned across cost types based onToronto’s comparative study
• For Hornsby, redundancy costs were estimatedbased on:• The estimated staffing efficiencies by
division• Average salaries and accruals (annual leave
and long service leave) by division• An assumption about the average tenure of
employees (based on turnover rates) todetermine the redundancy liability as afunction of annual salaries.
• For neighbouring councils, the estimatedredundancy costs were based on the ratio forHornsby of redundancy costs as a proportion oftotal upfront costs.
• Total upfront costs assumed to be funded bycash or cash equivalents where upfront costswere less than 10% of cash and cashequivalent. Interest forgone estimated basedon assumptions consistent with Hornsby ShireCouncil's long term financial projections.Otherwise funded by debt at a cost equal toweighted average small business lending rate(6.8% p.a.)
• Data was based on detailed assumptions for Hornsbycouncil but publicly available data for otherneighbouring councils.
• For Hornsby, staffing efficiencies were estimated atbetween 4 per cent and 7 per cent of theestablishment.
• It was estimated that there would be an efficiencysaving of 3% of applicable expenses in materials andcontracts, informed by the comparative study ofAuckland. A similar approach was adopted for theneighbouring councils.
• 3% savings in other expenses after considering make-upof other expenditure and excluding bad and doubtfuldebts; bank charges and cash collection expenses;contributions/levies to other levels of government;councillor expenses (mayoral and councillors’ fees andother expenses); and • donations, contributions andassistance.

Review of Business Case Merger OptionsOctober 2015
| 67Liability limited by a scheme approved under Professional Standards Legislation
Source Document & Merger Options Valuation assumptions
Key merger assumptions
Merger costs Merger cost savings
Morrison Low (Kogarah)
Options:Kogarah + HurstvilleKogarah + Hurstville + Rockdale (“StGeorge”)Kogarah + Hurstville + Rockdale +Canterbury (St George andCanterbury)
• Discount rate 7%• 8 year cash flows from
2016 to 2023• ML has advised that all cash
flows and discount rate areexpressed in nominal terms
• ML has advised that thebase year for Kogarah +Hurstville is 2014.
• Costs associated with the merger options thatwere quantified include the cost of a transitionbody, ICT costs, rebranding, remuneration andharmonisation. The costs for the transitionbody were estimated based on the experienceof Auckland and Wellington.
• Costs incurred by the transition body areassumed to relate to pre-day 1 costs, whichrelate principally to a range of strategy,planning and change management activities.
• The costs for ICT were based on analysisundertaken by Deloitte for Wellington and havebeen scaled. The estimated cost for branding is"based on other amalgamation experience."
• The estimate for redundancy costs was basedon assumed redundancy in Tier 1 and Tier 2positions with the cost calculated usinginformation from the Council's annual reports.Costs are assumed to be incurred in 2016 and2019. Whilst not stated, the latter costs arepresumed to reflect protections in the LocalGovernment Act.
• The estimate for remuneration harmonisation isfounded on average employee costs for similarsized councils as well as between the councils
• Bulk of transition costs assumed to take placewithin the first 3 years of the merger.
• Some savings related to governance costs due to fewernumber of Mayors and councilors. Governance savingscommence in 2016.
• The estimates for staffing reductions were calculatedbased on the strata of staff.
• Assumed FTE reduction in:• Executive management• Corporate support personnel of around 5-15%. The
starting point assumption was a reduction of 35%,but this was moderated following a review oforganizational structures.
• Number of staff in works units of 20%, based on MLexperience.
• Assumed rationalisation of plant and fleet ofaround 30%, based on ML experience.
• Savings from ICT benefits due to reduced IT costs andcosts of staff required to support it will arise in the longterm at the rate of $4.8 - $7.9m p.a.
• Staff costs are assumed to increase in the long term (6-10 years) following earlier falls. ML believes thatlonger run there will be an increase in service levelsfollowing the merger based on evidence considered bythe ILGRP.
Morrison Low (Rockdale)
Options:Botany + Rockdale + Marrickville
• Discount rate 7% (Nominal)• 9 year cash flows from
2015 to 2023 advised to bein nominal terms
• Costs associated with the merger options thatwere quantified include the cost of a transitionbody, ICT costs, rebranding, remuneration andharmonisation. The costs for the transitionbody were estimated based on the experienceof Auckland and proposed reorganization inWellington.
• The costs for ICT were based on analysisundertaken by Deloitte for Wellington and havebeen scaled. The estimated cost for branding is"based on other amalgamation experience."
• The estimate for redundancy costs was basedon assumed redundancy in Tier 1 and Tier 2positions with the cost calculated usinginformation from the Council's annual reports.
• Some savings related to governance costs due to fewernumber of Mayors and councilors. Governance savingscommence in 2016.
• Assumed FTE reduction in:• Executive management• Corporate support personnel of around 15-20%.
The starting point assumption was a reduction of35%, but this was moderated following a review oforganizational structures.
• Number of staff in works units of 20%, based on MLexperience
• Assumed rationalisation of plant and fleet ofaround 20%, based on ML experience.
• Materials and contracts savings are estimated at 3%rising to 5%. This estimate is based on ML experience

Review of Business Case Merger OptionsOctober 2015
| 68Liability limited by a scheme approved under Professional Standards Legislation
Source Document & Merger Options Valuation assumptions
Key merger assumptions
Merger costs Merger cost savings
Costs are assumed to be incurred in year 1(2015) and year 4 (2018). Whilst not stated,the latter costs are presumed to reflectprotections in the Local Government Act.
• The estimate for remuneration harmonisation isfounded on average employee costs forSutherland Shire Council have been comparedwith that of the Airport councils combined andindividually.
• Bulk of transition costs assumed to take placewithin the first 3 years of the merger.
and analysis.• Savings from ICT benefits due to reduced IT costs and
costs of staff required to support it will arise in the longterm at the rate of $7.8m p.a.
• Assumed reduction of property assets of 5%• Staff costs are assumed to increase in the long term (6-
10 years) following earlier falls. ML believes thatlonger run there will be an increase in service levelsfollowing the merger based on evidence considered bythe ILGRP.
Morrison Low (Holroyd)
Options:Holroyd + Parramatta + Auburn +The Hills (part) + Ryde (part)
Note: Based on efficiencies realisedscenario (Scenario 1 or base case).Alternative scenarios were alsopresented including efficiencies notrealized and a scenario based onHolroyd Council assumptions.
• Discount rate 7% (Nominal)• Base year 2014, as advised
by ML• 8 year cash flows starting
from 2016 advised to be innominal terms
• Costs associated with the merger options thatwere quantified include the cost of a transitionbody, ICT costs, rebranding, remunerationharmonisation. The costs for the transitionbody were estimated based on the experienceof Auckland and proposed reorganization inWellington. Additional costs ($2m) over andabove these costs were allowed to address thesplitting of The Hills and Ryde.
• The costs for ICT were informed by analysisundertaken by Deloitte for Wellington. Thehigh end of the range has been assumed due tocomplexity associated with splitting The Hillsand Ryde.
• The estimated cost for branding ($6m) is"based on other amalgamation experience."
• The estimate for redundancy costs was basedon assumed redundancy in Tier 1 and Tier 2positions with the cost calculated usinginformation from the Council's annual reports.Redundancy costs modelled on 38 weeks forTier 1 and 2 management and 26 weeks forcorporate services personnel. Costs areassumed to be incurred in 2016 and 2019.Whilst not stated, the latter costs are presumedto reflect protections in the Local GovernmentAct.
• The remuneration harmonisation costs areestimated by comparing the average employeecosts for similar councils to that of thecombined councils as well as between the five
• Some savings related to governance costs due to fewerMayors and councilors. 15 Councillors and a Mayor areassumed. Governance savings commence in 2016.
• Assumed FTE reduction in:• Executive management of positions across Tiers 1
through 4 levels. Assumes reduction to oneGeneral Manager and from 13 directors to 4 in theshort term. Also assumes a 30% reduction acrossthe existing Tier 3 and Tier 4 managerial positionsover the medium term.
• Corporate support personnel of around 35%informed by the Auckland experience. The startingpoint assumption was a reduction of 35%.
• Number of staff in works units of 20%, based on MLexperience
• Assumed rationalisation of plant and fleet ofaround 20%, based on ML experience
• Further savings in staff costs based on a naturalattrition policy
• Materials and contracts savings are estimated at 2%rising to 4%. This estimate is based on ML experienceand analysis.
• Savings from ICT benefits due to reduced IT costs andcosts of staff required to support it will arise in the longterm at the rate of $7m p.a.
• Assumed reduction of property assets of 5%• Staff costs are assumed to increase by 2% from year 4
onwards following earlier natural attrition period. MLbelieves that longer run there will be an increase inservice levels following the merger based on evidenceconsidered by the ILGRP.
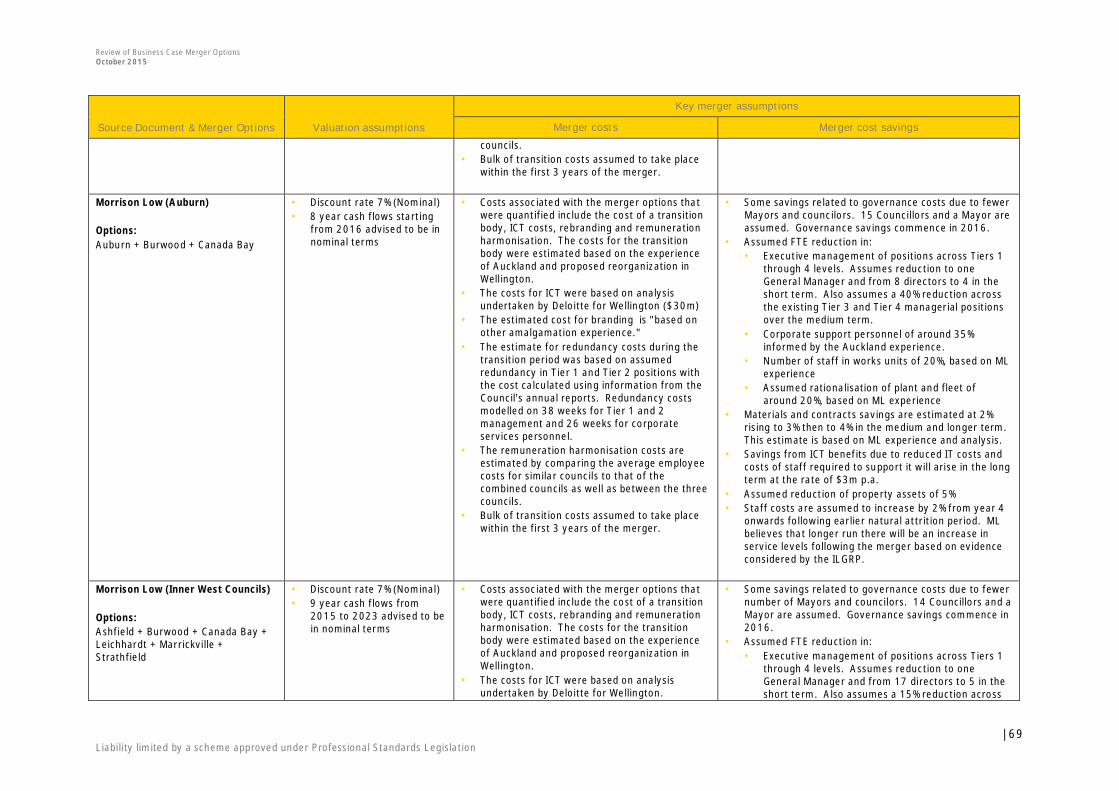
Review of Business Case Merger OptionsOctober 2015
| 69Liability limited by a scheme approved under Professional Standards Legislation
Source Document & Merger Options Valuation assumptions
Key merger assumptions
Merger costs Merger cost savings
councils.• Bulk of transition costs assumed to take place
within the first 3 years of the merger.
Morrison Low (Auburn)
Options:Auburn + Burwood + Canada Bay
• Discount rate 7% (Nominal)• 8 year cash flows starting
from 2016 advised to be innominal terms
• Costs associated with the merger options thatwere quantified include the cost of a transitionbody, ICT costs, rebranding and remunerationharmonisation. The costs for the transitionbody were estimated based on the experienceof Auckland and proposed reorganization inWellington.
• The costs for ICT were based on analysisundertaken by Deloitte for Wellington ($30m)
• The estimated cost for branding is "based onother amalgamation experience."
• The estimate for redundancy costs during thetransition period was based on assumedredundancy in Tier 1 and Tier 2 positions withthe cost calculated using information from theCouncil's annual reports. Redundancy costsmodelled on 38 weeks for Tier 1 and 2management and 26 weeks for corporateservices personnel.
• The remuneration harmonisation costs areestimated by comparing the average employeecosts for similar councils to that of thecombined councils as well as between the threecouncils.
• Bulk of transition costs assumed to take placewithin the first 3 years of the merger.
• Some savings related to governance costs due to fewerMayors and councilors. 15 Councillors and a Mayor areassumed. Governance savings commence in 2016.
• Assumed FTE reduction in:• Executive management of positions across Tiers 1
through 4 levels. Assumes reduction to oneGeneral Manager and from 8 directors to 4 in theshort term. Also assumes a 40% reduction acrossthe existing Tier 3 and Tier 4 managerial positionsover the medium term.
• Corporate support personnel of around 35%informed by the Auckland experience.
• Number of staff in works units of 20%, based on MLexperience
• Assumed rationalisation of plant and fleet ofaround 20%, based on ML experience
• Materials and contracts savings are estimated at 2%rising to 3% then to 4% in the medium and longer term.This estimate is based on ML experience and analysis.
• Savings from ICT benefits due to reduced IT costs andcosts of staff required to support it will arise in the longterm at the rate of $3m p.a.
• Assumed reduction of property assets of 5%• Staff costs are assumed to increase by 2% from year 4
onwards following earlier natural attrition period. MLbelieves that longer run there will be an increase inservice levels following the merger based on evidenceconsidered by the ILGRP.
Morrison Low (Inner West Councils)
Options:Ashfield + Burwood + Canada Bay +Leichhardt + Marrickville +Strathfield
• Discount rate 7% (Nominal)• 9 year cash flows from
2015 to 2023 advised to bein nominal terms
• Costs associated with the merger options thatwere quantified include the cost of a transitionbody, ICT costs, rebranding and remunerationharmonisation. The costs for the transitionbody were estimated based on the experienceof Auckland and proposed reorganization inWellington.
• The costs for ICT were based on analysisundertaken by Deloitte for Wellington.
• Some savings related to governance costs due to fewernumber of Mayors and councilors. 14 Councillors and aMayor are assumed. Governance savings commence in2016.
• Assumed FTE reduction in:• Executive management of positions across Tiers 1
through 4 levels. Assumes reduction to oneGeneral Manager and from 17 directors to 5 in theshort term. Also assumes a 15% reduction across

Review of Business Case Merger OptionsOctober 2015
| 70Liability limited by a scheme approved under Professional Standards Legislation
Source Document & Merger Options Valuation assumptions
Key merger assumptions
Merger costs Merger cost savings
Estimated cost is $55m - $80m, of which $10m- $20m is in the transition period and $45m -$60m is incurred post Day 1.
• The estimated cost for branding ($2m) is"based on other amalgamation experience."
• The estimate for redundancy costs for seniormanagement during the transition period wasbased on assumed redundancy in Tier 1 andTier 2 positions with the cost calculated usinginformation from the Council's annual reports.Redundancy costs modelled on 38 weeks forTier 1 and 2 management and 26 weeks forother personnel.
• The remuneration harmonisation costs areestimated by comparing the average employeecosts for similar councils to that of thecombined councils as well as between the sixcouncils.
• Bulk of transition costs assumed to take placewithin the first 3 years of the merger.
the existing Tier 3 and Tier 4 managerial positionsover the medium term
• Corporate support personnel of around 35%informed by the Auckland experience
• number of staff in works units of 20%, based on MLexperience
• Assumed rationalisation of plant and fleet ofaround 20%, based on ML experience
• Further savings in staff costs based on a naturalattrition policy
• Materials and contracts savings are estimated at 3% inthe short term rising to 5% in the medium and longerterm. This estimate is based on ML experience andanalysis.
• Assumed reduction of property assets of 5%• Move to outsourced waste collection contract will
generate cost savings in the short term, with furthercost savings expected from moving to a single contractover the longer term.
• Staff costs are assumed to increase by 2% from year 4onwards following earlier natural attrition period. MLbelieves that longer run there will be an increase inservice levels following the merger based on evidenceconsidered by the ILGRP.
Morrison Low
Options:Willoughby + North SydneyWilloughby + Lane Cove + NorthSydneyHunters Hill + Lane Cove + NorthSydney + Mosman + Willoughby +Ryde (part)
• Discount rate 7% (Nominal)• Base year 2014, as advised
by ML• 8 year cash flows starting
from 2016 advised to be innominal terms
• Costs associated with the merger options thatwere quantified include the cost of a transitionbody, ICT costs, rebranding and remunerationharmonisation. The costs for the transitionbody ($11m) were estimated based on theexperience of Auckland and proposedreorganization in Wellington. Additional costs($2m) over and above these costs were allowedto address the splitting of Ryde council.
• The costs for ICT were based on analysisundertaken by Deloitte for Wellington whichsuggests costs in the range of $55m - $80m, ofwhich $10m - $20m is in the transition periodand $45m - $60m is incurred post Day 1.Estimate for this merger is approx. $75m dueto splitting of Ryde.
• The estimated cost for branding ($2m) is"based on other amalgamation experience."
• Some savings related to governance costs due to fewerMayors and councilors. 14 Councillors and a Mayor areassumed. Governance savings commence in 2016.
• Assumed FTE reduction in:• Executive management of positions across Tiers 1
through 4 levels. Assumes reduction to oneGeneral Manager and from 17 directors to 5 in theshort term. Also assumes at least a 30% reductionacross the existing Tier 3 and Tier 4 managerialpositions over the medium term.
• Corporate support personnel of around 35%informed by the Auckland experience.
• Number of staff in works units of 20%, based on MLexperience
• Assumed rationalisation of plant and fleet ofaround 20%, based on ML experience
• Further savings in staff costs based on a natural

Review of Business Case Merger OptionsOctober 2015
| 71Liability limited by a scheme approved under Professional Standards Legislation
Source Document & Merger Options Valuation assumptions
Key merger assumptions
Merger costs Merger cost savings
• The estimate for redundancy costs during thetransition period was based on assumedredundancy in Tier 1 and Tier 2 positions withthe cost calculated using information from theCouncil's annual reports. Redundancy costsmodelled on 38 weeks for Tier 1 and 2management and 26 weeks for otherpersonnel.
• The remuneration harmonisation costs ($4m)are estimated by comparing the averageemployee costs for similar councils to that ofthe combined councils as well as between thesix councils.
• Bulk of transition costs assumed to take placewithin the first 3 years of the merger.
attrition policy• Materials and contracts savings are estimated at 1%
rising to 2% in the short term, then to rising to 3% in themedium and longer term. This estimate is based on MLexperience and analysis.
• Savings from ICT benefits due to reduced IT costs andcosts of staff required to support it will arise in the longterm.
• Assumed reduction of property assets of 5% (forNorthern Sydney option)
• Move to outsourced waste collection contract willgenerate cost savings in the short term, with furthercost savings expected from moving to a single contractover the longer term.
• Staff costs are assumed to increase by 2% from year 4onwards following earlier natural attrition period. MLbelieves that longer run there will be an increase inservice levels following the merger based on evidenceconsidered by the ILGRP.
• Data shown is for the ‘efficiencies realised’ scenario.
Randwick Council
Options:Randwick + WaverleyRandwick + Waverley + Woollahra +Botany BayRandwick + Waverley + Woollahra +Botany Bay + Sydney
• Discount rate of 4.5 % (10Years)
• 10 year nominal cash flows• Base year 2017• All income projections
based on current LTFPs.• Note that original merger
business case wasundertaken by SGS in 2013and has been updated byRandwick Council
• Amalgamation is assumed to take 3 years, with2015-16 being the transition year and the firsttwo years of the new merged entity being2016-17 and 2017-18.
• Amalgamation costs are assumed to relate toICT costs, recruitment of senior staff,redundancy costs, staff training, transitioncommittee and general reform costs,community and staff consultation, newbuildings / renovations, legal and audit servicesduring transition, statutory planningintegration, branding / visual identity. Of theseit is assumed that the costs incurred duringtransition would relate to ICT, recruitment,senior staff redundancy, community and staffconsultation, legal and audit fees and branding.
• It is assumed that there will be relocation costsunder all options due to having toaccommodate additional staff. Some of loss ofrental income would be incurred as staff will berequired to move into council owned propertiesthat are currently leased out to tenants. The
• No change in the service costs for the first year• In the second year 50% of service costs are based on
existing pre-merger cost structures and the remaining50% based on the new service cost model
• Modelling of cost profile of the merged council is basedon Randwick’ s current per dwelling service costs forgovernance, administration, public order and safety,community services and education, housing andcommunity amenities, mining, manufacturing andconstruction, transport and communication. Eachcouncil’s current per dwelling service costs were usedfor expenditure on health, environment, streetcleaning, solid waste management, recreation andculture, parking and economic affairs.
• Governance costs assumed to change 18 months afteramalgamation at Randwick’s per dwelling rates.Parking and economic affairs expenditure inflated bythe LGCI as these costs do not grow with number ofdwellings
• The City of Sydney’s operating costs are as per theLTFP.
• Some cost savings expected to accrue from sale of

Review of Business Case Merger OptionsOctober 2015
| 72Liability limited by a scheme approved under Professional Standards Legislation
Source Document & Merger Options Valuation assumptions
Key merger assumptions
Merger costs Merger cost savings
forgone rental is largest in the option involvinga merger with the City of Sydney as it isassumed that staff would relocate to Town HallHouse.
excess depot sites.
Fairfield Council
Options:Fairfield + Liverpool
• No discount rate applied –only total amounts includedand not based on NPV
• 9 year cash flows providedto 2025
• Cash flows assumed to bestated in real terms
• Relies on experience with amalgamations inQueensland, in particular, Toowoomba, toestimate amalgamation costs. Broadlyestimated by applying a ratio of 86.9% to the$19m of amalgamation costs over 4 yearswhich was incurred by Toowoomba. It is notedthat this amounts to $16.5m for systems,processes and redundancies.
• Costs related to systems integration estimatedat $7.2m in total, based on 43.8% of $16.5m.Initial costs of $1m incurred in 2018/19followed by a 3 year implementation period.
• Redundancy costs estimated at $4.6m incurredin 2019/20 due to award guarantee of noredundancies in the first 3 years ofamalgamation. Estimated based on 28% of$16.5m.
• Branding costs of $0.5m p.a. from 2015-16 to2024-25 (period of long term financial plan)
• Salary equalization costs assumed to amount to$15.8m (i.e. $3.96m p.a. over four years to2019/20). Based on experience in Toowoombawhere salaries increased by 6.65% due to salaryequalization. Estimate for Fairfield/Liverpoolmerger based on half of this.
• Relocation costs assumed based on lease costsof $1.75m p.a. from 2016/17 to 2022/23. Itis assumed that it will be necessary totemporarily lease a building whilst a permanentnew building is constructed.
• It is assumed that cost savings will only commenceseven years from the base year identified, that is, inthe 2022/23 year. This is the period of time it will takefor council cost structures to gradually move to mergedstructures where economies of scale will apply.
• To estimate future cost savings, it is assumed that thepost-merger operating services per capita will be at theaverage of the pre-merger operating services percapital for the individual councils. This is then appliedto the combined population estimate for the mergedcouncil to estimate the post-merger annual operatingcosts. The difference between the post-mergeroperating cost estimate and the sum of the operatingcosts of the individual councils based on the relevantyear of the LTFP is the cost savings. Using thismethodology, there are effectively no cost savingswhich arise as of 2022/23. However, costs will riseinstead.
Third Horizon
Options:Gosford + Wyong
• [Confidential] • [Confidential] • [Confidential]
Bankstown Council • No discount rate applied –only total amounts included
• No information provided on merger costs. • Savings in governance and administration estimated byaligning the ratio of Governance and Administrationexpense to operating expense of Canterbury Council

Review of Business Case Merger OptionsOctober 2015
| 73Liability limited by a scheme approved under Professional Standards Legislation
Source Document & Merger Options Valuation assumptions
Key merger assumptions
Merger costs Merger cost savings
Options:Bankstown + Canterbury
and not based on NPV with that of Bankstown Council.• Assumed savings in workers compensation insurance
from moving to self-insurance.• Savings in senior staff remuneration based on
removing duplication.• Assumed savings in systems from reducing duplication
of systems and contracts.

EY | Assurance | Tax | Transactions | Advisory
About EYEY is a global leader in assurance, tax, transaction and advisory services. The insights and qualityservices we deliver help build trust and confidence in the capital markets and in economies the worldover. We develop outstanding leaders who team to deliver on our promises to all of our stakeholders.In so doing, we play a critical role in building a better working world for our people, for our clients andfor our communities.
EY refers to the global organisation and may refer to one or more of the member firms ofErnst & Young Global Limited, each of which is a separate legal entity. Ernst & Young Global Limited,a UK company limited by guarantee, does not provide services to clients. For more information aboutour organisation, please visit ey.com.
© 2015 Ernst & Young, AustraliaAll Rights Reserved.
The Report may only be relied upon by IPART pursuant to the terms and conditions referred to in theContract. Any commercial decisions taken by IPART are not within the scope of our duty of care andin making such decisions you should take into account the limitations of the scope of our work andother factors, commercial or otherwise, of which you should be aware of from sources other than ourwork.
Ernst & Young disclaims all liability to any party other than IPART for all costs, loss, damage andliability that the third party may suffer or incur arising from or relating to or in any way connectedwith the provision of the deliverables to the third party without our prior written consent. If otherschoose to rely in any way on the Report they do so entirely at their own risk. If IPART wishes toprovide a third party with copies of the Report, then our prior written consent must be obtained.
ey.com