ASSESSMENT OF CORROSION RATE OF DISSIMILAR WELDED METALS BY AFIGO OGHENEKARO SAMSON
72
ASSESSMENT OF CORROSION RATE OF DISSIMILAR WELDED METALS: GRAVIMETRIC ANALYSIS BY AFIGO OGHENEKARO SAMSON CHE/10/1948 A PROJECT SUBMITTED TO INDUSTRIAL CHEMISTRY DEPARTMENT SCHOOL OF SCIENCE FEDERAL UNIVERSITY OF TECHNOLOGY, AKURE, ONDO STATE IN PARTIAL FULFILLMENT OF THE REQUIREMENTS FOR THE AWARD OF BACHELOR OF TECHNOLOGY (B.TECH) DEGREE IN INDUSTRIAL CHEMISTRY SEPTEMBER, 2015.
Transcript of ASSESSMENT OF CORROSION RATE OF DISSIMILAR WELDED METALS BY AFIGO OGHENEKARO SAMSON
ASSESSMENT OF CORROSION RATE OF DISSIMILAR WELDED
METALS: GRAVIMETRIC ANALYSIS
BY
AFIGO OGHENEKARO SAMSON
CHE/10/1948
A PROJECT SUBMITTED TO
INDUSTRIAL CHEMISTRY DEPARTMENT
SCHOOL OF SCIENCE
FEDERAL UNIVERSITY OF TECHNOLOGY, AKURE, ONDO STATE
IN PARTIAL FULFILLMENT OF THE REQUIREMENTS FOR THE AWARD OF BACHELOR
OF TECHNOLOGY (B.TECH) DEGREE IN INDUSTRIAL CHEMISTRY
SEPTEMBER, 2015.
CERTIFICATION
This is to certify that this work was carried out by Mr. AFIGO, Oghenekaro Samson with
matriculation number CHE/10/1948, in the Department of Industrial Chemistry in partial
fulfillment of the requirements for the award of Bachelor’s Degree of Technology (B. Tech.) in
Industrial Chemistry, Federal University of Technology, Akure.
…………………..…………… …………………………….
PROF. AYIESANMI A.F. Date
Supervisor

DEDICATION
This work is dedicated to God Almighty for His grace and mercy upon me throughout my study
in the Federal University of Technology, Akure. Also to my parents, brothers and sisters, and all
my friends who have in one way or the other contributed to my academic progress.

ACKNOWLEDGMENT
All praises and adoration are due to the God Almighty, the most merciful and the most beneficent
for His guidance and protection during my studies in the Federal University of Technology, Akure
(FUTA).
A very much appreciate to the invaluable role of my Supervisors, Prof. Ayiesanmi A. F. in
conjunction with Mr. Shoetan I. O., Chemistry Department FUTA for their guidance and
understanding throughout the duration of this project. I cannot forget Mr. Abe and Mr Ajayi,
Chemistry Department FUTA for their assistance during the practical aspect of my project, so also
the work of Mr. Ajayi cannot be left unappreciated.
It is my radiant sentiment to place on record my best regards, deepest sense of gratitude to Mr.
Amoruwa, Mrs. Kadiri V., Mr. Usman, Mr. Anas of Nigerian Gas Company Limited, Warri Delta
State, for their careful and precious guidance which were extremely valuable for my study both
theoretically and practically.
I am also grateful to my parents Mr. & Mrs. Afigo for the gift of education and their financial
support, spiritual and parental support, also to my uncle in person of Mr James Ikpro and my lovely
sister Mrs. Afigo Joy for her unquantifiable financial and moral support.
ABSTRACT
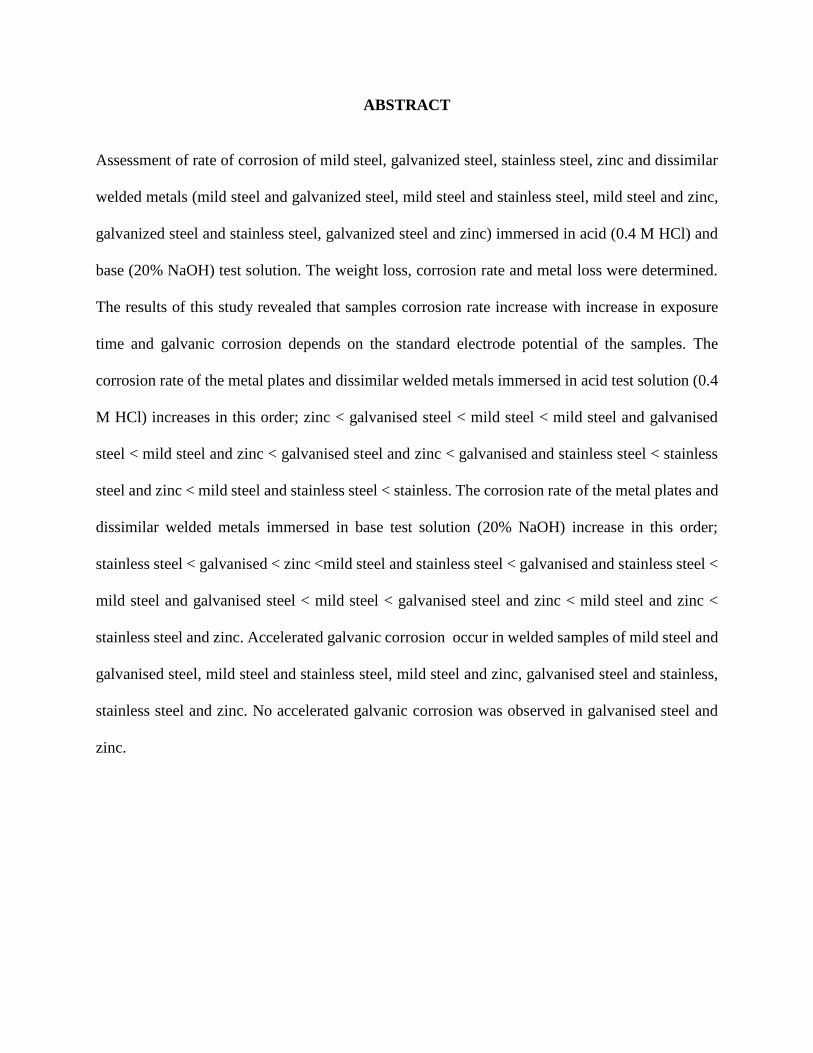
Assessment of rate of corrosion of mild steel, galvanized steel, stainless steel, zinc and dissimilar
welded metals (mild steel and galvanized steel, mild steel and stainless steel, mild steel and zinc,
galvanized steel and stainless steel, galvanized steel and zinc) immersed in acid (0.4 M HCl) and
base (20% NaOH) test solution. The weight loss, corrosion rate and metal loss were determined.
The results of this study revealed that samples corrosion rate increase with increase in exposure
time and galvanic corrosion depends on the standard electrode potential of the samples. The
corrosion rate of the metal plates and dissimilar welded metals immersed in acid test solution (0.4
M HCl) increases in this order; zinc < galvanised steel < mild steel < mild steel and galvanised
steel < mild steel and zinc < galvanised steel and zinc < galvanised and stainless steel < stainless
steel and zinc < mild steel and stainless steel < stainless. The corrosion rate of the metal plates and
dissimilar welded metals immersed in base test solution (20% NaOH) increase in this order;
stainless steel < galvanised < zinc <mild steel and stainless steel < galvanised and stainless steel <
mild steel and galvanised steel < mild steel < galvanised steel and zinc < mild steel and zinc <
stainless steel and zinc. Accelerated galvanic corrosion occur in welded samples of mild steel and
galvanised steel, mild steel and stainless steel, mild steel and zinc, galvanised steel and stainless,
stainless steel and zinc. No accelerated galvanic corrosion was observed in galvanised steel and
zinc.
TABLE OF CONTENT
Certification i
Dedication ii
Acknowledgment iii
Abstract iv
List of Figures ix
List of Tables xi
List of Schemes xiii
List of Plates xiv
CHAPTER ONE
INTRODUCTION 1
1 Background 1
1.1 Aim and Objectives of the Project 4
CHAPTER TWO
LITERATURE REVIEW 5
2.1 Definition of Corrosion 5
2.2 Economic Impact 6
2.3 Types of Corrosion 8
2.3.1 Galvanic Corrosion 8
2.3.2 Uniform Attack 9
2.3.3 Selective Leaching 9
2.3.4 Erosion Corrosion 10
2.3.5 Stress Corrosion 10
2.3.6 Crevice Corrosion 11
2.3.7 Pitting 11
2.3.8 Intergranular Corrosion 12
2.4 Definition of Welding 12
2.5 Types of Welding 13
2.5.1 Gas Welding 13
2.5.2 Arc Welding 14
2.5.3 Resistance and thermite welding 17
2.5.4 New processes welding 18
2.6 Electrolysis 19
2.7 Electrochemical Series 22
2.8 Conditions Necessary for Galvanic Corrosion 23
2.9 Mechanisms of Galvanic Corrosion 24
2.10 Factors that Effect the Rate of Corrosion 25
2.10.1 Electrode Potential 25
2.10.2 Electrode Efficiency 27
2.10.3 Variable Potential 27
2.10.4 Electrolyte 28

2.10.5 Area Ratio 30
CHAPTER THREE
MATERIALS AND METHODOLOGY 32
3.1 Materials 32
3.2 Apparatus 32
3.3 Reagents 32
3.4 Preparation of Materials 33
3.5 Welding 33
3.6 Preparation of Standard Solutions 34
3.7 Gravimetric analysis 34
3.7.1 Exposure Area 35
3.7.2 Sample Weight 35
3.7.3 Sample Volume 35
3.7.4 Sample Density 36
3.7.5 Weight Loss 36
3.7.6 Corrosion Rate 37
3.7.7 Metal Loss 37
CHAPTER FOUR
RESULT AND DISCUSION 38
4.1 Welded Dissimilar metals 38

4.2 Samples Exposure Area 38
4.3 Measured Sample Weight 39
4.4 Measured Sample Volume 39
4.5 Determined Sample Density 42
4.6 Measured weight loss 43
4.7 Calculated Corrosion Rate 45
4.8 Calculated Metal Loss 48
4.7 Assessment of Accelerated Galvanic Corrosion 50
CHAPTER FIVE
CONCLUSION AND RECOMMENDATION 54
5.1 Conclusion 54
5.2 Recommendation 54
REFERENCES 56

LIST OF FIGURES
Figure 1: Corrosion of zinc metal 5
Figure 2: Galvanic Corrosion 8
Figure 3: Gas welding 14
Figure 4: Shielded metal arc welding equipment 15
Figure 5: Gas-Tungsten Arc equipment 15
Figure 6: Gas metal arc welding equipment 16
Figure 7: Submerged arc welding equipment 17
Figure 8: Resistance welding machine 18
Figure 10: Laser welding 18
Figure 11: Corrosion of mild steel in acid test solution 19
Figure 12: Corrosion of mild steel in base test solution 20
Figure 13: Corrosion of mild steel and galvanised steel in acid test solution 21
Figure 14: Corrosion of mild steel and galvanised steel in base test solution 22
Figure 15: Weight loss of metal plates in acid test solution (0.4 M HCl) 43
Figure 16: Weight loss of metal in base test solution (20% NaOH) 44
Figure 17: Corrosion rate (mpy) in acid media (0.4 M HCl) 46
Figure 18: Corrosion rate (mpy) in base media (20% NaOH) 46
Figure 19: Metal loss (mils) in acid media (0.4 M HCl) 48
Figure 20: Metal loss (mils) in base media (20% NaOH) 49

Figure 21: Corrosion rate of individual dissimilar welded metals in 51
acid test solution (0.4 M HCl)
Figure 22: Corrosion rate of individual dissimilar welded metals in 52
base test solution (20% NaOH)
LIST OF TABLES
Table 1: Galvanic series 23
Table 2: Galvanic corrosion table 26
Table 3: Electrical conductivity of electrolytes 29
Table 4: Constant K values for CR calculation 36
Table 5: Constant K values for ML calculation 37
Table 6: Exposure area of sample in acid media (0.4 M HCl) 38
Table 7: Exposure area of sample in base media (20% NaOH) 39
Table 8: Sample weight before immersion in acid test solution (0.4 M HCl) 40
Table 9: Sample weight before immersion in base test solution (20% NaOH) 40
Table 10: Sample volume before immersion in acid test solution (0.4 M HCl) 41
Table 11: Sample volume before immersion in base test solution (20% NaOH) 41
Table 12: Sample density of samples before immersion in acid test solution 41
(0.4 M HCl)
Table 13: Sample density samples before immersion in base test solution 41
(20% NaOH)
Table 14: Weight loss of metal plates in acid test solution(0.4 M HCl) 42
Table 15: Weight loss of metal plates in base media (20% NaOH) 43
Table 16: Corrosion rate of metal in acid test solution (0.4 M HCl) 45
Table 17: Corrosion rate of metal in base test solution (20%NaOH) 45
Table 18: Metal loss of metal in acid test solution (0.4 M HCl) 47

Table 19: Metal loss of metal in base test solution (20% NaOH) 48
Table 20: Corrosion rate of individual dissimilar welded metals in acid 50
test solution (0.4 M HCl)
Table 21: Corrosion rate of individual dissimilar welded metals in base 50
test solution (20% NaOH)

LIST OF SCHEMES
Scheme 1: Galvanic corrosion of two dissimilar 3
Scheme 2: Galvanic corrosion of iron and tin connected directly 25

LIST OF PLATES
Plate 1: The collapse silver bridge has seen from ohio side 6
Plate 2: Impact of corrosion on metallic structure 6
Plate 3: Uniform attack of metal 9
Plate 4: Selective leaching of zinc 9
Plate 5: Erosion corrosion of metal 10
Plate 6: Stress corrosion of metal 10
Plate 7: Crevice Corrosion of metal 11
Plate 8: Pitting Corrosion of metal 12
Plate 9: Thermite welding machine 18
Plate 10: Accelerated corrosion of a copper tube attached to a stainless steel tank 31
Plate 11: Metal plates immersed in 0.4 M HCl and 20% NaOH 34
Plate 12: Cleaning of immersed sample 36
Plate 13: Prepared sample for weighing 36
Plate 14: Weighing of cleaned coupons after immersion 36
Plate 15: Welded dissimilar metal sample 38

CHAPTER ONE
INTRODUCTION
1.1 Background
The word corrode is derived from the Latin corrodere, which means “to gnaw to pieces”.
Corrosion is defined as the destruction or deterioration of materials because of the chemical
interaction with their environment. Regardless of all the recent advances in polymer technology
and the development of high strength plastics, industry and civilization would grind to a halt
without the metals. Metals are usually exposed to the action of bases or acids in the industries.
Acid and base being corrosive causes severe damage to properties of metal resulting in sudden
failure of material in service (Mars, 2005; Barbara et al., 2006; Pierre, 2007). The corrosion costs
in most of the countries are in the range of 2 - 4 % of the gross national product (Vedula, 1998).
Consequently, it is needed to investigate the trend of the metal-dissolution on their exposure to
various medium, as this is an important factor in material selection that determines the service life
of the material (Osarolube et al., 2008; Noor and Al - Moubaraki, 2008). The present work has
been focused to study the corrosive tendency of dissimilar welded metals metals viz mild steel,
galvanized steel, stainless steel and zinc in hydrochloric acid and sodium hydroxide medium by
employing weight loss method.
The process of corrosion may be fast, slow or moderate. The corrosion of metals can be considered
as extractive metallurgy. Rusting is a term reserved for steel and iron corrosion. During the process
of corrosion most of metals form their metal oxide. Practically all environments are corrosive. Air,
moisture, fresh distilled water, salt and mine water, rural and urban and industrial atmosphere,
steam and other gases such as ammonia, chlorine, hydrogen sulphide and sulphur dioxide, fuel

gases, inorganic and organic acids, solvents, petroleum oils cause corrosion environment.
Inorganic materials are more corrosive than the organic materials. High temperature and pressure
produce more severe corrosion condition (Mars, 1987; Sedriks and Dudts, 2001).
Corrosion is a destructive phenomenon that, besides its economic effects, is detrimental to
appearance of metals and in some case equipment failure. Nature has endowed each metallic
substance with a certain natural energy level or potential.
When two metals having different energy levels or potentials are coupled together, current will
flow. The direction of positive current flow will be from the metal with the more negative potential
through electrolytes such as soil or water to that which is more positive. Corrosion will occur at
the point where positive current leaves the metal surface.
Current will be generated when two dissimilar metals are electrically connected and immersed in
an electrolyte, one of the metals will corrode. The path of the current will be from the corroding
metal, through the electrolyte to the non-corroding metal and then back through the connection
(conductor) between the two metals. The corroding metal is the one where the current leaves to
enter the electrolyte and is called an anode. The metal that receives the current is called the cathode
(Fontana and Greene, 1967; Uhlig, 1971). The presence of the second metal can actually increase
the rate of corrosion. The values of the standard electrode potentials for tin (E° = −0.14 V) and
iron (E° = −0.45 V) in table 1 show that iron is more easily oxidized than tin. As a result, the more
corrosion-resistant metal (in this case, tin) accelerates the corrosion of iron by acting as the cathode
and providing a large surface area for the reduction of oxygen (scheme 1). This process is seen in
some homes where copper and iron pipes have been directly connected to each other. The less
easily oxidized copper acts as the cathode, causing iron to dissolve rapidly near the connection and

occasionally resulting in a catastrophic plumbing failure (http://chemwiki.usdavis.edu/Analytical-
_Chemistry/ Electrochemistry/Case_Studies/ Corrosion_ Basics_II).
Corrosion rate is the speed at which any metal in a specific environment deteriorates. It can also
be defined as the amount of corrosion loss per year in thickness (Baboian, 1995). Using metal
coupons to assess rate of corrosion is the oldest and simplest method in monitoring of corrosion
(Memon et al., 2011). Coupons are described as small pieces of metal, usually of rectangular shape
or cylindrical, which are inserted in the process stream and removed after a period of time usually
one hour interval (Rajendran et al., 2002; Baboian, 1990).The most common and basic use of
coupons is to determine average corrosion rate over the period of exposure (Abdel-Gaber et al.,
2003). This is accomplished by weighing the degreased coupon before and after immersions
followed by its exposure to various acidic solutions to remove corrosion deposits on the substrate
surface. The difference between the initial and final weights of the coupon, which is the weight
loss. At least two, and preferably more specimens should be exposed for each condition (Memon
et al., 2011).
Scheme 1: Galvanic corrosion of two dissimilar
metals

1.2 Aim and Objectives of the Project
The present investigation was aimed to assess the rate of corrosion of dissimilar welded metals.
This project work is centred on obtaining relevant information on the effect of dissimilar welded
metals on the rate of corrosion using weight loss method which may increase or decrease the rate
of corrosion.
To achieve the aim of the research work, the following objectives are set to:
i. cut different metal plates to precise dimensions;
ii. weld the different dissimilar metals using suitable welding techniques;
iii. determine their physical parameters;
iv. prepare test solutions of 0.4 M HCl , 20% NaOH and cleaning solution of SnCl2, SbCl3
and HCl;
v. determine the corrosion rate.
CHAPTER TWO
LITERATURE REVIEW
2.1 Definition of Corrosion
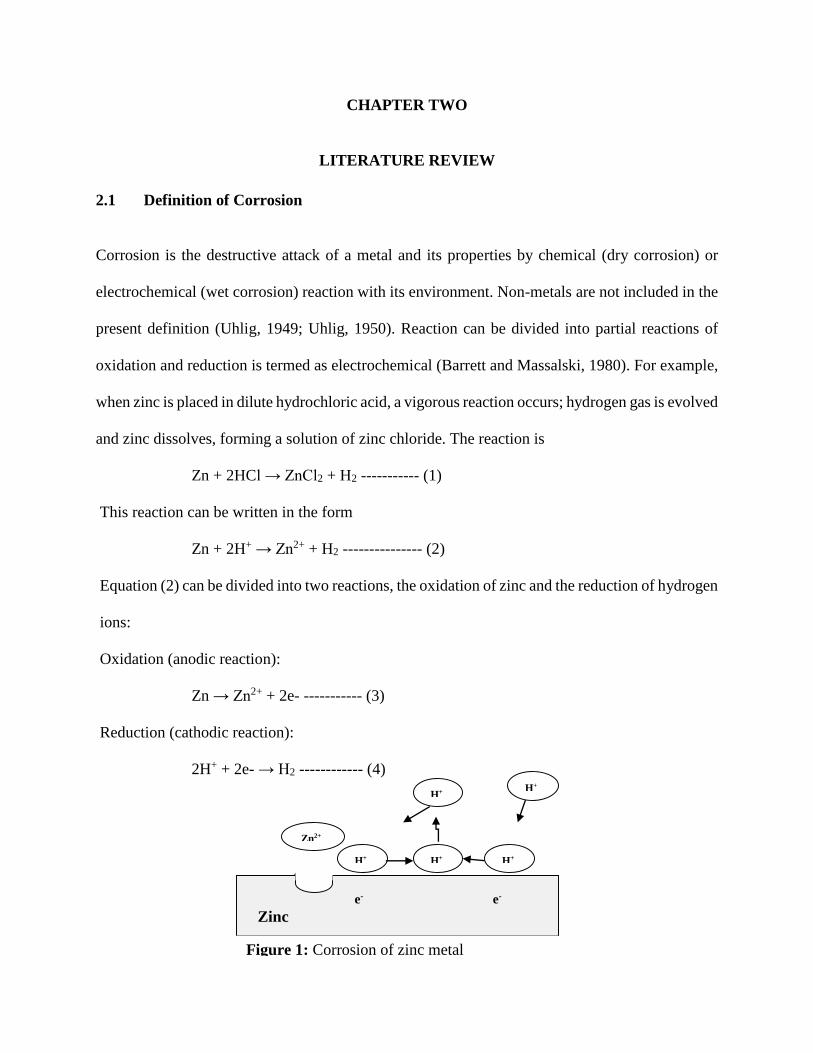
Corrosion is the destructive attack of a metal and its properties by chemical (dry corrosion) or
electrochemical (wet corrosion) reaction with its environment. Non-metals are not included in the
present definition (Uhlig, 1949; Uhlig, 1950). Reaction can be divided into partial reactions of
oxidation and reduction is termed as electrochemical (Barrett and Massalski, 1980). For example,
when zinc is placed in dilute hydrochloric acid, a vigorous reaction occurs; hydrogen gas is evolved
and zinc dissolves, forming a solution of zinc chloride. The reaction is
Zn + 2HCl → ZnCl2 + H2 ----------- (1)
This reaction can be written in the form
Zn + 2H+ → Zn2+ + H2 --------------- (2)
Equation (2) can be divided into two reactions, the oxidation of zinc and the reduction of hydrogen
ions:
Oxidation (anodic reaction):
Zn → Zn2+ + 2e- ----------- (3)
Reduction (cathodic reaction):
2H+ + 2e- → H2 ------------ (4)
Zn2+
H+ H+ H+
H+ H+
e- e-
Zinc
Figure 1: Corrosion of zinc metal

An oxidation is indicated by a production of electrons and reduction is indicated by consumption
of electrons. The rate of electrochemical reaction is limited by physical or chemical factors.
(Wagner and Trand, 1938; Piontelli, 1954). Metals that normally fall victim to corrosion will
sometimes exhibit passivity to corrosion. Passivity is the characteristic of a metal exhibited when
that metal does not become active in the corrosion reaction. Passivity is caused by the buildup of
a stable, tenacious layer of metal oxide on the surface of the metal (Revie and Greene, 1969;
Skaperdas and Uhlig, 1942).
2.2 Economic Impact
Rust is one of the most common causes of bridge accidents. As rust has a much higher volume
than the originating mass of iron, its build-up can also cause failure by forcing apart adjacent parts.
Rust was also an important factor in the Silver Bridge disaster of 1967 in West Virginia, when a
steel suspension bridge collapsed within a minute, killing 46 drivers and passengers on the bridge
at the time (https://en.m.wikipedia.org/wiki/Silver_Bridge).
Plate 2: Impact of corrosion on metallic structure
Source: https://en.m.wikipedia.org/wiki/Corrosion
Plate 1: The collapse silver bridge has seen from ohio
side
Source: https://en.m.wikipedia.org/wiki/Silver_Bridge

Perhaps most dangerous of all is corrosion that occurs in major industrial plants, such as electrical
power plants or chemical processing plants. Plant shutdowns can and do occur as a result of
corrosion. This is just one of its many direct and indirect consequences. Some consequences are
economic, and cause the following:
i. Replacement of corroded equipment
ii. Overdesign to allow for corrosion
iii. Preventive maintenance, for example, painting
iv. Shutdown of equipment due to corrosion failure
v. Contamination of a product
vi. Loss of efficiency, such as when overdesign and corrosion products decrease the heat-
transfer rate in heat exchangers
vii. Loss of valuable product, for example, from a container that has corroded through
viii. Inability to use otherwise desirable materials
ix. Damage of equipment adjacent to that in which corrosion failure occurs
Still other consequences are social. These can involve the following issues:
i. Safety, for example, sudden failure can cause fire, explosion, release of toxic product,
and construction collapse
ii. Health, for example, pollution due to escaping product from corroded equipment or due
to a corrosion product itself
iii. Depletion of natural resources, including metals and the fuels used to manufacture them
iv. Appearance as when corroded material is unpleasing to the eyes (Craig and Aderson,
1987).

2.3 Types of Corrosion
Corrosion damage can occur in many ways, for example, in failure by cracking and loss of strength.
Forms of corrosion are galvanic corrosion, uniform attack, selective leaching, erosion corrosion,
stress corrosion, crevice corrosion, pitting and intergranular corrosion (Uhlig, 1948).
2.3.1 Galvanic Corrosion
Galvanic corrosion also known as bimetallic corrosion tends to occur when dissimilar conducting
materials are connected electrically and exposed to an electrolyte (Figure 2). The following
fundamental requirements therefore have to be met for galvanic corrosion:
i. Dissimilar metals
ii. Electrical contact between the dissimilar conducting materials (can be direct contact or a
secondary connection such as a common grounding path).
iii. Electrolyte (the corrosive medium) in contact with the dissimilar conducting materials
(Uhlig, 1948).
Figure 2: Galvanic Corrosion

2.3.2 Uniform Attack
Uniform corrosion is the attack of a metal at essentially the same at all exposed areas of its surface
(Plate 3). At no point is the penetration of the metal by corrosion twice as great as the average rate.
Rusting steel in the atmosphere and the corrosion of copper alloys in seawater are common
examples where uniform corrosion is usually encountered (Uhlig, 1948).
2.3.3 Selective Leaching
It is also known as parting or dealloying is the selective removal of one element from an alloy
leaving an altered residual structure. The most common example is the selective removal of zinc
in brass alloy (dezincification) (Plate 4) (Baboian, 1977).
Plate 3: Uniform attack of metal
Source: Uhlig, 1948
Plate 4: Selective leaching of zinc
Source: Baboian, 1977

2.3.4 Erosion Corrosion
Erosion corrosion is the acceleration or increase in the rate of deterioration or attack on a metal
because of relative movement between a corrosive fluid and the metal surface (Plate 5) (Baboian,
1977).
2.3.5 Stress Corrosion
Stress corrosion cracking (SCC) refers to the cracking caused by the simultaneous presence of
tensile stress and a corrosive environment. The impact of SCC on a material usually falls between
dry cracking and the fatigue threshold of that material (Plate 6) (Baboian, 1977)
Plate 5: Erosion corrosion of metal
Source: Baboian, 1977
Plate 6: Stress corrosion of metal
Source: Baboian, 1977
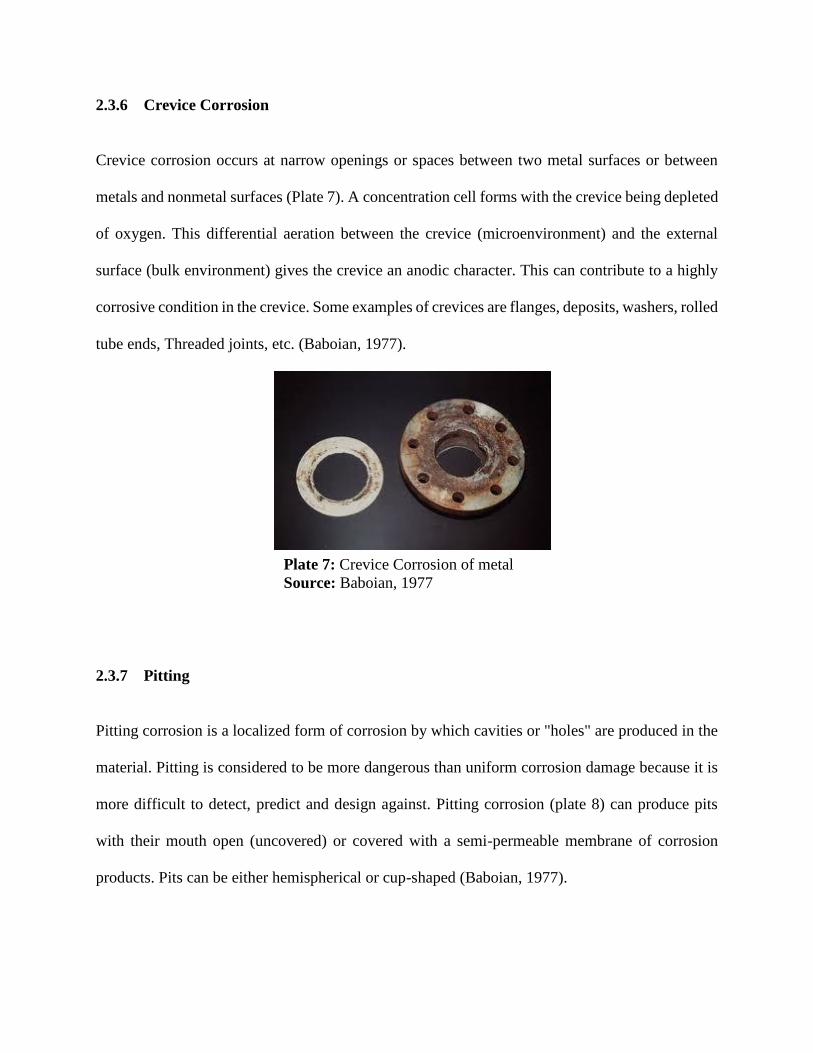
2.3.6 Crevice Corrosion
Crevice corrosion occurs at narrow openings or spaces between two metal surfaces or between
metals and nonmetal surfaces (Plate 7). A concentration cell forms with the crevice being depleted
of oxygen. This differential aeration between the crevice (microenvironment) and the external
surface (bulk environment) gives the crevice an anodic character. This can contribute to a highly
corrosive condition in the crevice. Some examples of crevices are flanges, deposits, washers, rolled
tube ends, Threaded joints, etc. (Baboian, 1977).
2.3.7 Pitting
Pitting corrosion is a localized form of corrosion by which cavities or "holes" are produced in the
material. Pitting is considered to be more dangerous than uniform corrosion damage because it is
more difficult to detect, predict and design against. Pitting corrosion (plate 8) can produce pits
with their mouth open (uncovered) or covered with a semi-permeable membrane of corrosion
products. Pits can be either hemispherical or cup-shaped (Baboian, 1977).
Plate 7: Crevice Corrosion of metal
Source: Baboian, 1977
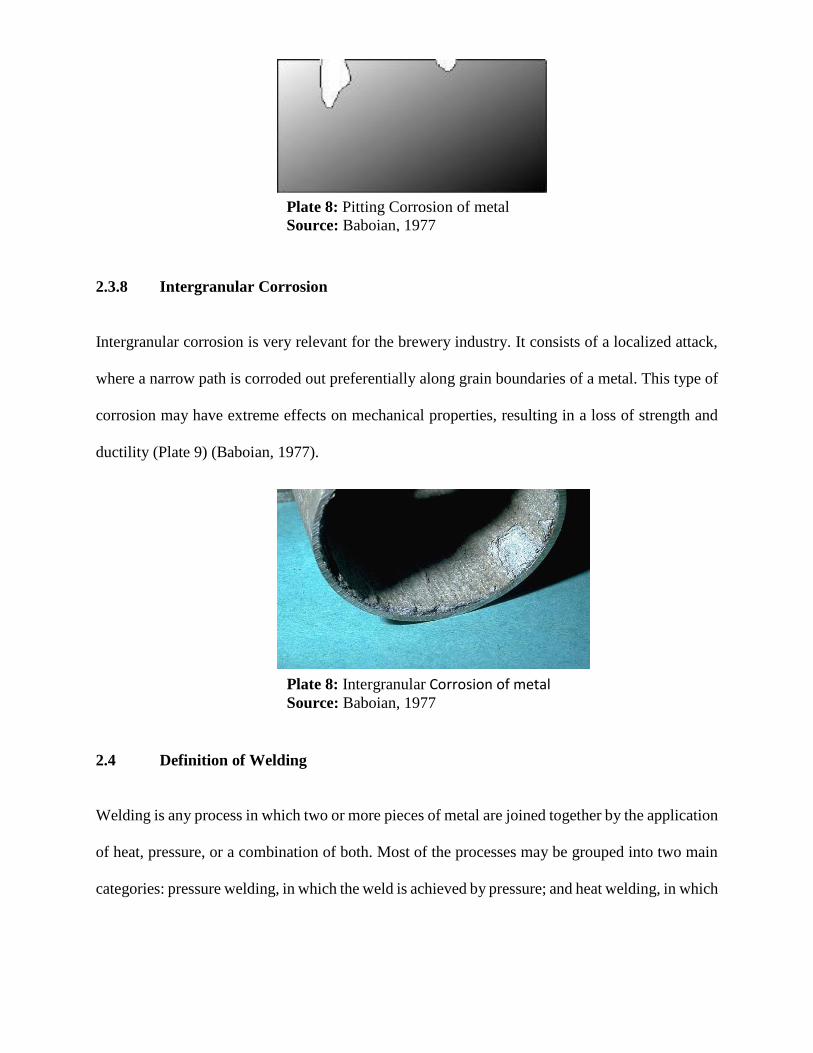
2.3.8 Intergranular Corrosion
Intergranular corrosion is very relevant for the brewery industry. It consists of a localized attack,
where a narrow path is corroded out preferentially along grain boundaries of a metal. This type of
corrosion may have extreme effects on mechanical properties, resulting in a loss of strength and
ductility (Plate 9) (Baboian, 1977).
2.4 Definition of Welding
Welding is any process in which two or more pieces of metal are joined together by the application
of heat, pressure, or a combination of both. Most of the processes may be grouped into two main
categories: pressure welding, in which the weld is achieved by pressure; and heat welding, in which
Plate 8: Pitting Corrosion of metal
Source: Baboian, 1977
Plate 8: Intergranular Corrosion of metal Source: Baboian, 1977

the weld is achieved by heat. Heat welding is the most common welding process used today.
Brazing and soldering are other means of joining metals.
With the development of new techniques during the first half of the 20th century, welding replaced
bolting and riveting in the construction of many types of structures, including bridges, buildings,
and ships. It is also a basic process in the automotive and aircraft industries and in the manufacture
of machinery. Along with soldering and brazing, it is essential in the production of virtually every
manufactured product involving metals (Samuel, 2009).
2.5 Types of Welding
The welding processes most commonly employed today include:
1. Gas welding
2. Arc welding
3. Resistance and thermite welding
4. New processes welding
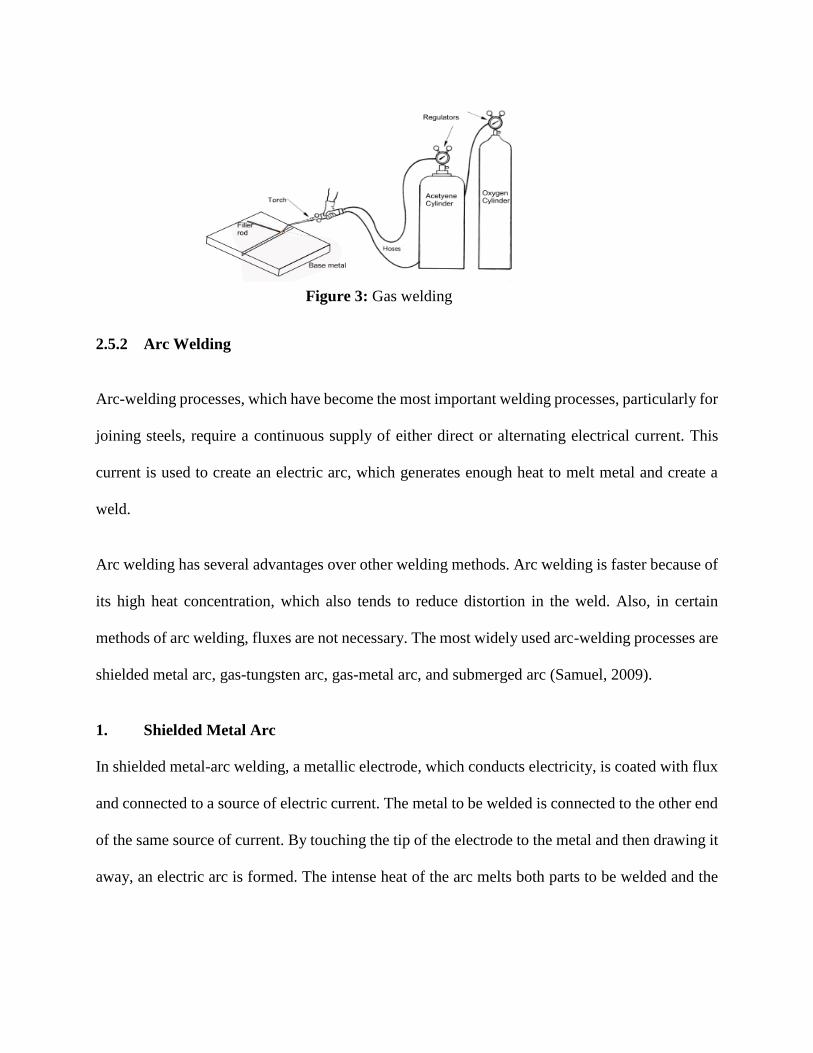
2.5.1 Gas Welding
Gas welding is a non-pressure process using heat from a gas flame. The flame is applied directly
to the metal edges to be joined and simultaneously to a filler metal in wire or rod form, called the
welding rod, which is melted to the joint. Gas welding has the advantage of involving equipment
that is portable and does not require an electric power source. The surfaces to be welded and the
welding rod are coated with flux, a fusible material that shields the material from air, which would
result in a defective weld (Samuel, 2009).
2.5.2 Arc Welding
Arc-welding processes, which have become the most important welding processes, particularly for
joining steels, require a continuous supply of either direct or alternating electrical current. This
current is used to create an electric arc, which generates enough heat to melt metal and create a
weld.
Arc welding has several advantages over other welding methods. Arc welding is faster because of
its high heat concentration, which also tends to reduce distortion in the weld. Also, in certain
methods of arc welding, fluxes are not necessary. The most widely used arc-welding processes are
shielded metal arc, gas-tungsten arc, gas-metal arc, and submerged arc (Samuel, 2009).
1. Shielded Metal Arc
In shielded metal-arc welding, a metallic electrode, which conducts electricity, is coated with flux
and connected to a source of electric current. The metal to be welded is connected to the other end
of the same source of current. By touching the tip of the electrode to the metal and then drawing it
away, an electric arc is formed. The intense heat of the arc melts both parts to be welded and the
Figure 3: Gas welding
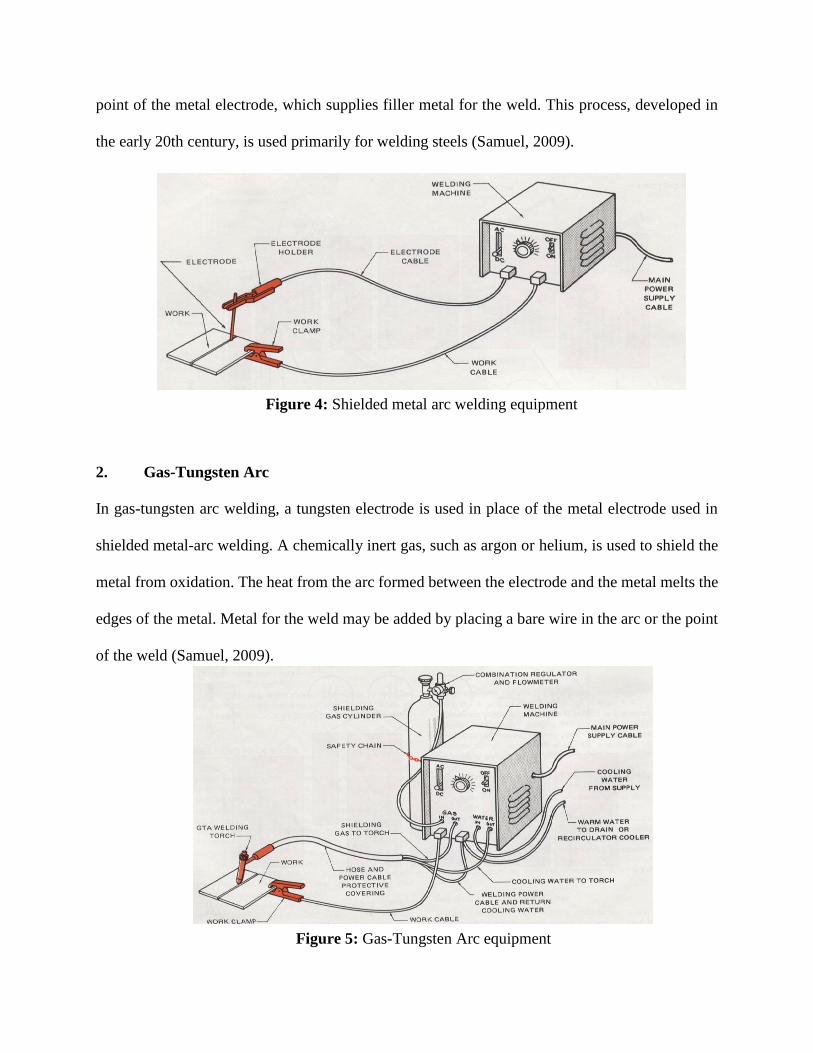
point of the metal electrode, which supplies filler metal for the weld. This process, developed in
the early 20th century, is used primarily for welding steels (Samuel, 2009).
2. Gas-Tungsten Arc
In gas-tungsten arc welding, a tungsten electrode is used in place of the metal electrode used in
shielded metal-arc welding. A chemically inert gas, such as argon or helium, is used to shield the
metal from oxidation. The heat from the arc formed between the electrode and the metal melts the
edges of the metal. Metal for the weld may be added by placing a bare wire in the arc or the point
of the weld (Samuel, 2009).
Figure 4: Shielded metal arc welding equipment
Figure 5: Gas-Tungsten Arc equipment
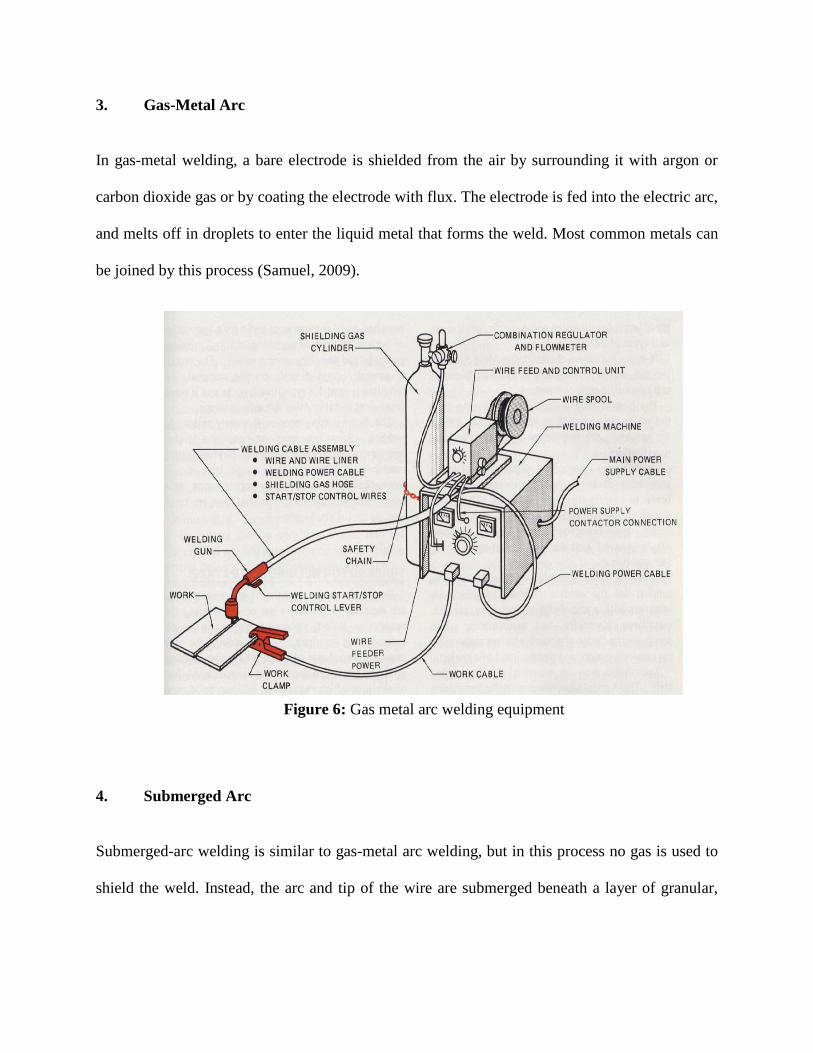
3. Gas-Metal Arc
In gas-metal welding, a bare electrode is shielded from the air by surrounding it with argon or
carbon dioxide gas or by coating the electrode with flux. The electrode is fed into the electric arc,
and melts off in droplets to enter the liquid metal that forms the weld. Most common metals can
be joined by this process (Samuel, 2009).
4. Submerged Arc
Submerged-arc welding is similar to gas-metal arc welding, but in this process no gas is used to
shield the weld. Instead, the arc and tip of the wire are submerged beneath a layer of granular,
Figure 6: Gas metal arc welding equipment
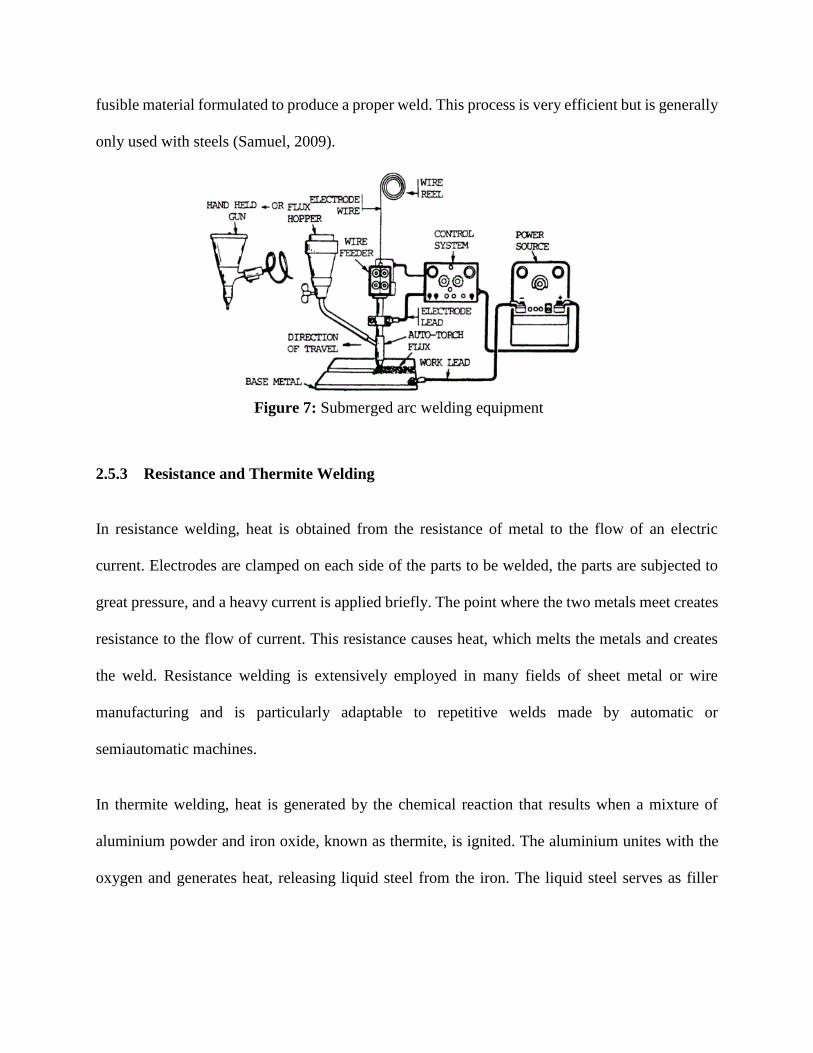
fusible material formulated to produce a proper weld. This process is very efficient but is generally
only used with steels (Samuel, 2009).
2.5.3 Resistance and Thermite Welding
In resistance welding, heat is obtained from the resistance of metal to the flow of an electric
current. Electrodes are clamped on each side of the parts to be welded, the parts are subjected to
great pressure, and a heavy current is applied briefly. The point where the two metals meet creates
resistance to the flow of current. This resistance causes heat, which melts the metals and creates
the weld. Resistance welding is extensively employed in many fields of sheet metal or wire
manufacturing and is particularly adaptable to repetitive welds made by automatic or
semiautomatic machines.
In thermite welding, heat is generated by the chemical reaction that results when a mixture of
aluminium powder and iron oxide, known as thermite, is ignited. The aluminium unites with the
oxygen and generates heat, releasing liquid steel from the iron. The liquid steel serves as filler
Figure 7: Submerged arc welding equipment

metal for the weld. Thermite welding is employed chiefly in welding breaks or seams in heavy
iron and steel sections. It is also used in the welding of rail for railroad tracks (Samuel, 2009).
2.5.4 New Processes Welding
The use of electron beams and lasers for welding has grown during the second half of the 20th
century. These methods produce high-quality welded products at a rapid rate. Laser welding and
electron-beam welding have valuable applications in the automotive and aerospace industries
(Samuel, 2009).
Plate 9: Thermite welding machine
Source: Samuel, 2009 Figure 8: Resistance welding machine
Figure 10: Laser welding

2.6 Electrolysis
Electrolysis, process by which electric current is passed through a substance to effect a chemical
change. The chemical change is one in which the substance loses or gains an electron (oxidation
or reduction). The process is carried out in an electrolytic cell, an apparatus consisting of positive
and negative electrodes held apart and dipped into a solution containing positively and negatively
charged ions. The substance to be transformed may form the electrode, may constitute the solution,
or may be dissolved in the solution. Electric current (i.e. electrons) enters through the negatively
charged electrode (cathode); positively charged components of the solution travel to this electrode,
combine with the electrons, and are transformed to neutral elements or molecules. The negatively
charged components of the solution travel to the other electrode (anode), give up their electrons,
and are transformed into neutral elements or molecules. If the substance to be transformed is the
electrode, the reaction is generally one in which the electrode dissolves by giving up electrons
(http://www.britannica.com/science/electrolysis)
For instance mild steel immersed in acid test solution (0.4 M HCl), the reaction is as follows:
Fe + 2HCl → FeCl2 + H2
Fe2
H+ H+ H+
H+ H+
e- e-
Figure 11: Corrosion of mild steel in acid test solution
Mild steel
This reaction can be written in the form
Fe + 2H+ → Fe2+ + H2
The equation can be divided into two reactions, the oxidation of mild steel and the reduction of
hydrogen ions:
Oxidation (anodic reaction):
Fe → Fe2+ + 2e-
Reduction (cathodic reaction):
2H+ + 2e- → H2
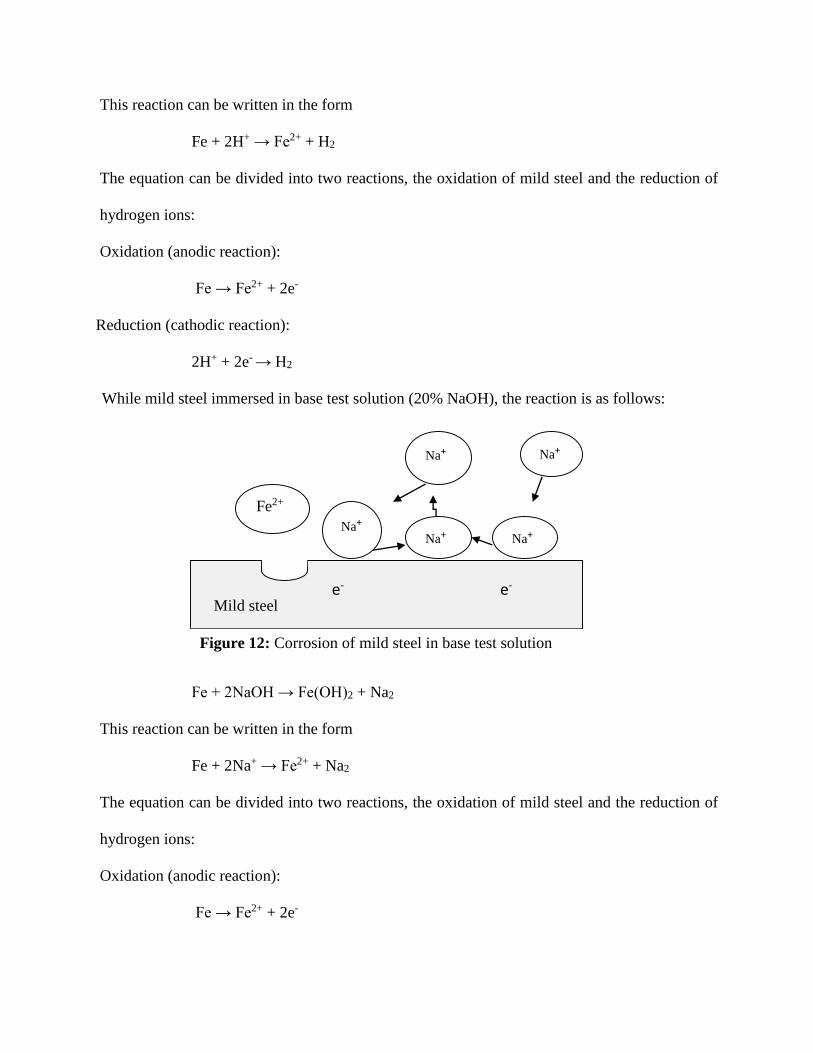
While mild steel immersed in base test solution (20% NaOH), the reaction is as follows:
Fe + 2NaOH → Fe(OH)2 + Na2
This reaction can be written in the form
Fe + 2Na+ → Fe2+ + Na2
The equation can be divided into two reactions, the oxidation of mild steel and the reduction of
hydrogen ions:
Oxidation (anodic reaction):
Fe → Fe2+ + 2e-
Fe2+
Na+ Na+ Na+
Na+ Na+
e- e-
Figure 12: Corrosion of mild steel in base test solution
Mild steel

Reduction (cathodic reaction):
2Na+ + 2e- → Na2
When dissimilar welded metal in electrical contact with each other immersed in test solution. The
metal with the most negative standard potential (E0) value (table 1) undergo oxidation.
For instance, mild steel and galvanized steel immersed in acid test solution (0.4 M HCl), the
reaction is as follows:
Zn + 2HCl → CrCl2 + H2
This reaction can be written in the form
Zn + 2H+ → Cr2+ + H2
The equation can be divided into two reactions, the oxidation of mild steel and the reduction of
hydrogen ions:
Oxidation (anodic reaction):
Zn → Zn2+ + 2e-
Reduction (cathodic reaction):
2H+ + 2e- → H2
Zn2+
H+ H+ H+
H+ H+
Galvanised
steel Mild steel e- e-
Figure 13: Corrosion of mild steel and galvanised steel in
acid test solution

While mild steel and galvanized steel immersed in base test solution (20% NaOH), the reaction is
as follows:
Zn + 2NaOH → Zn(OH)2 + Na2
This reaction can be written in the form
Zn + 2Na+ → Cr2+ + Na2
The equation can be divided into two reactions, the oxidation of mild steel and the reduction of
hydrogen ions:
Oxidation (anodic reaction):
Zn → Zn2+ + 2e-
Reduction (cathodic reaction):
2Na+ + 2e- → Na2
The reaction for samples used in this study are all documented in the appendix.
2.7 Electrochemical Series
The electrochemical series is built up by arranging various redox equilibria in order of their
standard electrode potentials (redox potentials). The most negative standard potential (E0) values
Zn2+
Na+ Na+
Na+
Na+ Na+
Galvanised
steel Mild steel e- e-
Figure 14: Corrosion of mild steel and galvanised steel in
base test solution
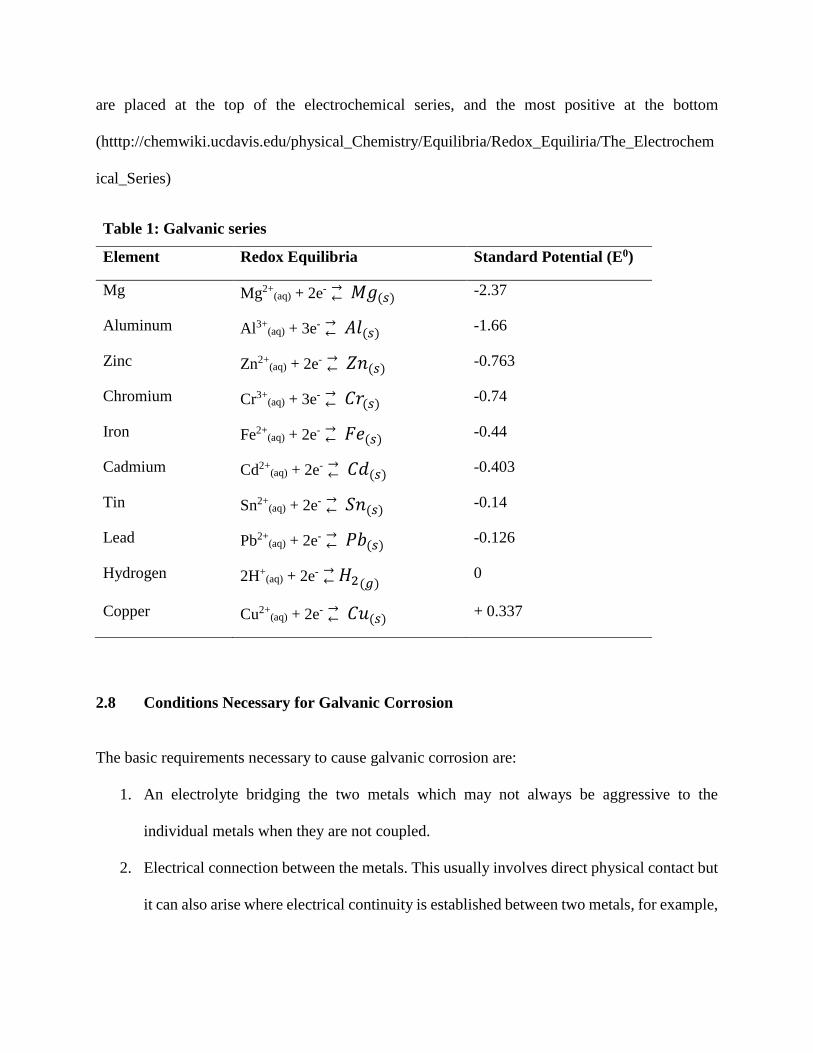
are placed at the top of the electrochemical series, and the most positive at the bottom
(htttp://chemwiki.ucdavis.edu/physical_Chemistry/Equilibria/Redox_Equiliria/The_Electrochem
ical_Series)
Table 1: Galvanic series
Element Redox Equilibria Standard Potential (E0)
Mg Mg2+(aq) + 2e- 𝑀𝑔(𝑠)←
→ -2.37
Aluminum Al3+(aq) + 3e- 𝐴𝑙(𝑠)←
→ -1.66
Zinc Zn2+(aq) + 2e- 𝑍𝑛(𝑠)←
→ -0.763
Chromium Cr3+(aq) + 3e- 𝐶𝑟(𝑠)←
→ -0.74
Iron Fe2+(aq) + 2e- 𝐹𝑒(𝑠)←
→ -0.44
Cadmium Cd2+(aq) + 2e- 𝐶𝑑(𝑠)←
→ -0.403
Tin Sn2+(aq) + 2e- 𝑆𝑛(𝑠)←
→ -0.14
Lead Pb2+(aq) + 2e- 𝑃𝑏(𝑠)←
→ -0.126
Hydrogen 2H+(aq) + 2e- 𝐻2(𝑔)←
→ 0
Copper Cu2+(aq) + 2e- 𝐶𝑢(𝑠)←
→ + 0.337
2.8 Conditions Necessary for Galvanic Corrosion
The basic requirements necessary to cause galvanic corrosion are:
1. An electrolyte bridging the two metals which may not always be aggressive to the
individual metals when they are not coupled.
2. Electrical connection between the metals. This usually involves direct physical contact but
it can also arise where electrical continuity is established between two metals, for example,
by an insulation-coated conductor, by welding, by structural metal work or electrical
earthing. It is not necessary for the metal junction to be immersed in the electrolyte.
3. A sufficient difference in potential between the two metals to provide a significant galvanic
current.
4. A sustained cathodic reaction on the more noble of the two metals by one of the
mechanisms described below; in most practical situations this is the consumption of
dissolved oxygen (Bardal, 1984).
2.9 Mechanisms of Galvanic Corrosion
Different metals and alloys have different electrochemical potentials (or corrosion potentials) in
the same electrolyte. The potential difference (i.e., the voltage) between two dissimilar metals is
the driving force for the destructive attack on the active metal (anode). Current flows through the
electrolyte to the more noble metal (cathode) and the less noble (anode) metal will corrode. The
conductivity of electrolyte will also affect the degree of attack. The cathode to anode area ratio is
directly proportional to the acceleration factor.
For instance, if iron is in contact with a more corrosion-resistant metal such as tin, copper, or lead,
the other metal can act as a large cathode that greatly increases the rate of reduction of oxygen.
Because the reduction of oxygen is coupled to the oxidation of iron, this can result in a dramatic
increase in the rate at which iron is oxidized at the anode. Galvanic corrosion is likely to occur
whenever two dissimilar metals are connected directly, allowing electrons to be transferred from
one to the other (http://chemwiki.usdavis.edu /Analytical_Chemistry/ Electrochemistry /
Case_Studies/ Corrosion_Basics_II).

At cathode: O2(g) + 4H+(aq) + 4e−→ 2H2O(l)
At anode: Fe(s) → Fe2+(aq) + 2e−
The iron (II) ions react with hydrogen ions and oxygen to produce iron (iii) ions:
4Fe2+(aq) + 4H+(aq) + O2(aq) → 4Fe3+(aq) + 2H2O(l)
The iron(III) ions react with hydroxide ions and oxygen to produce hydrated iron (iii) oxides (also
known as iron(III) hydroxides:
Fe3+(aq) + 3OH-→ Fe(OH)3(s)
Iron (iii) hydroxide Fe(OH)3 then dehydrates to produce rust (Fe2O3.nH2O):
Fe(OH)3(s) Fe2O3.nH2O
2.10 Factors that Effect the Rate of Corrosion
2.10.1 Electrode Potential
The value of the potential for any alloy, even in sea water, can be changed by a variety of factors
such as temperature, velocity, biocide treatment etc. However, the relative ranking of alloys
remains largely unchanged by these factors. A simplified version of the galvanic series is shown
in table 1. Alloys which are coupled to metals which have more electropositive potentials are the
ones which may suffer bimetallic corrosion. Stainless steels, such as 316, have a thin, protective
Scheme 2: Galvanic corrosion of iron
and tin connected directly
dehydrates
film and while this is intact corrosion rates are very low and the alloy is said to be in its passive
state. When breakdown of the film occurs, usually localised, such as crevice corrosion, then the
stainless steel is said to be active.
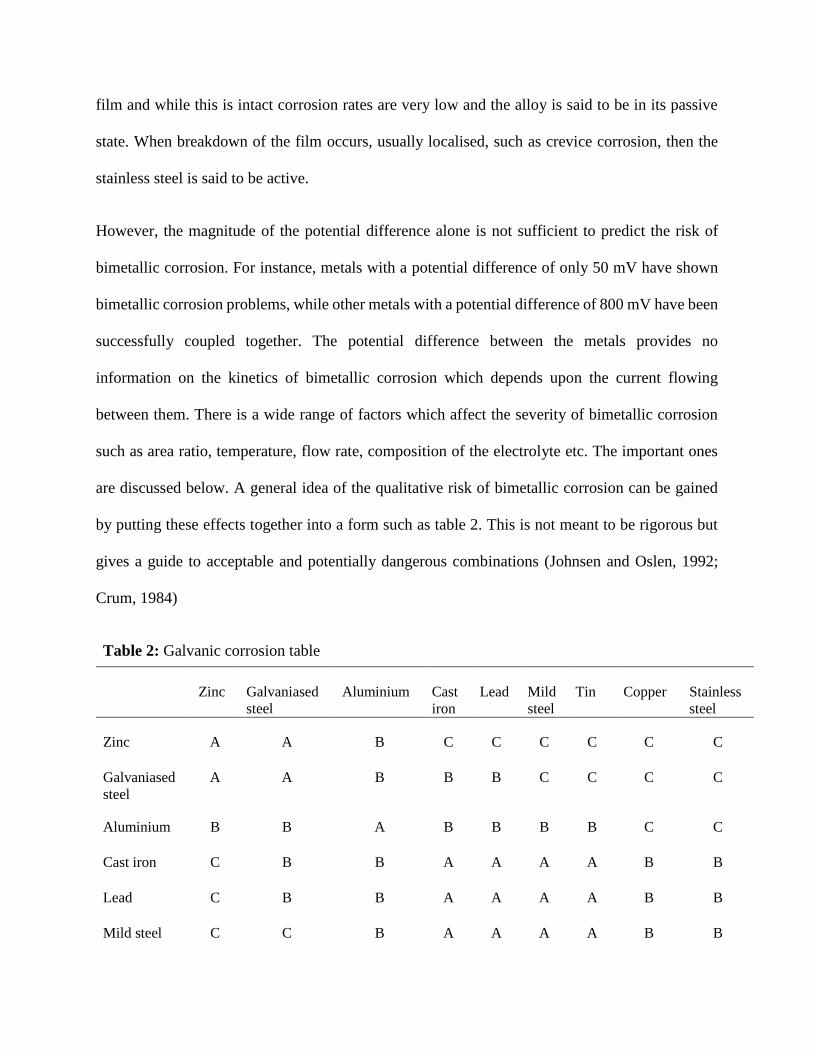
However, the magnitude of the potential difference alone is not sufficient to predict the risk of
bimetallic corrosion. For instance, metals with a potential difference of only 50 mV have shown
bimetallic corrosion problems, while other metals with a potential difference of 800 mV have been
successfully coupled together. The potential difference between the metals provides no
information on the kinetics of bimetallic corrosion which depends upon the current flowing
between them. There is a wide range of factors which affect the severity of bimetallic corrosion
such as area ratio, temperature, flow rate, composition of the electrolyte etc. The important ones
are discussed below. A general idea of the qualitative risk of bimetallic corrosion can be gained
by putting these effects together into a form such as table 2. This is not meant to be rigorous but
gives a guide to acceptable and potentially dangerous combinations (Johnsen and Oslen, 1992;
Crum, 1984)
Table 2: Galvanic corrosion table
Zinc Galvaniased
steel
Aluminium Cast
iron
Lead Mild
steel
Tin Copper Stainless
steel
Zinc A A B C C C C C C
Galvaniased
steel
A A B B B C C C C
Aluminium B B A B B B B C C
Cast iron C B B A A A A B B
Lead C B B A A A A B B
Mild steel C C B A A A A B B

Tin C C B A A A A B B
Copper C C C B B B B A A
Stainless
steel
C C C B B B B A A
Where A is galvanic action insignificant, B is galvanic action may occur and C is galvanic action
will occur.
2.10.2 Electrode Efficiency
Current flow between the two metals in contact is accompanied by a shift in the potential of the
anode to a more electropositive value and in the potential of the cathode to a more electronegative
value. These changes, called polarisation, result in the two metals approaching the same potential,
any potential difference between them being equal to the product of the current and the resistance
through the electrolyte. The extent of polarisation depends upon both the metal and the
environment. In neutral electrolytes the cathode is almost always polarised much more than the
anode, which accounts for the fact that a small area of sacrificial anode will effectively provide
protection to a relatively large cathodic area. The extent of polarisation will determine how
effective any particular metal may be as a cathode (Davis et al., 1986).
2.10.3 Variable Potential
Changes in the corrosion potential of individual metals and ,therefore, in the polarity of a couple,
from commonly encountered values can result from the presence of complexing ions, from
changes in pH and temperature, and from intense aeration which enhances film formation on the
anodic metal. Large differences in area ratio, especially with metals of nearly the same corrosion
potential, can also influence the relative polarity of metals by causing intense polarisation. Tin is
usually cathodic to iron in neutral salt solution, but in the presence of the complexing organic acids
found, for instance, in fruit preservation, it is anodic and therefore an effective sacrificial coating
for tin cans. Lead, tin, and their solder alloys form soluble corrosion products in alkaline solutions
and are anodic to iron, whereas in acid solutions they are usually cathodic to iron.
Reversals of significant practical importance are encountered with zinc and aluminium, which are
usually anodic to iron in natural waters. At temperatures above 600C iron becomes anodic to zinc,
which explains why problems are sometimes encountered in galvanised steel hot-water systems.
In fresh waters, polarity reversal is enhanced by the presence of bicarbonate and decreased by
sulphate and chloride. The aluminium/iron couple undergoes polarity reversal at elevated
temperatures in fresh water and in sea water (about 95oC) and the aluminium/zinc couple exhibits
polarity reversal in seawater at about 90oC (Davis et al., 1986).
2.10.4 Electrolyte
Electrolyte factors that have a major influence on bimetallic corrosion are composition, pH and,
in particular, electrical conductivity, which affects both the intensity and distribution of corrosion.
The severity of corrosion often increases with increasing electrical conductivity of the electrolyte
because, in practice, high conductivity is often caused by the presence of aggressive ions such as
chloride, or by acid or alkali.
The electrical conductivity of electrolytes can vary widely typical values are as follows:

Table 3: Electrical conductivity of electrolytes
Electrolytes Electrical
conductivity
Distilled water 0.5 – 2 µS/cm
Supply water 50 – 1,500 µS/cm
Saturated sodium
Chloride solution
2500,000 µS/cm
Sulphuric acid Up to 8,000,000 µS/cm
Molten salts 20,000 - 107 µS/cm
In common with local-cell corrosion, bimetallic corrosion is sensitive to the presence of
constituents in the electrolyte that effect stability of the corroded-metal ions. Thus, the presence of
bicarbonate, silicate and sulphate in water enhances formation of insoluble and adherent corrosion
products. In some cases insoluble corrosion products from the anodic metal can deposit upon, and
induce crevice corrosion of, the cathodic metal of a couple; stainless steels are susceptible to this
type of corrosion, especially when in contact with aluminum or mild steel. In some cases the
composition of the environment can be modified by adding inhibitors to control both local-cell
and bimetallic corrosion.
This practice has proved effective in the treatment of waters in engine cooling systems and
industrial cooling plants. Bicarbonate, cyanide and tartrate ions form soluble complexes with
copper and zinc, and thus their presence increases the rate of corrosion.
The effect of pH is even more far-reaching and depends upon the composition of both metals
forming the couple. In the case of magnesium and its alloys there is a possibility of a significant
amount of hydrogen evolution at the cathode in neutral solutions. Enhancement of the corrosion
rate starts as pH is decreased to about 4-5 for aluminum and ferrous alloys, and at about pH 6 for
zinc. At pH 1, hydrogen evolution is the predominant reaction on the cathode of most coupled
metals and bimetallic corrosion rates may be increased by two to three orders of magnitude
compared with those in neutral solutions. In sulphuric acid, however, much smaller increases in
corrosion rate are encountered with lead because of the formation of films of insoluble lead
sulphate.
Hence, care is required if hydrogen evolution is occurring and the cathode material is susceptible
to hydrogen embrittlement. Low pHs can also occur between two tightly coupled metals when one
undergoes crevice corrosion (e.g. 316 and superaustenitic stainless steel in sea water). The pH can
become so low (<1) that corrosion initiates on the cathode within the crevice (Davis et al., 1986).
2.10.5 Area Ratio
The area ratio is very important in the consideration of the likelihood of bimetallic corrosion. The
larger the cathode compared to the anode, the more oxygen reduction can occur and, hence, the
greater the galvanic current and, therefore, corrosion.
Under static conditions, where the bimetallic corrosion current is often dependent upon the rate of
diffusion of dissolved oxygen to the cathode, the amount of bimetallic corrosion is independent of
the size of the anode and is proportional to the area of the cathodic metal surface. This is sometimes
known as the catchment area principle, and has important implications in designing to minimise
the risk of bimetallic corrosion. Thus, for a constant area of cathode metal the amount of corrosion
of the anode metal is constant, but the intensity of corrosion is increased as the area of the anodic
metal is decreased.

Under immersed conditions in many supply waters, which have a relatively low electrical
conductivity, adverse effects are uncommon if the contacting metals adjacent to the junction are
of similar area. Thus, galvanized steel pipes can be used with brass or gunmetal connectors, but
serious corrosion to the pipe end is likely to result if the contact is directly to a large area of copper,
such as a tank or cylinder. Similarly, stainless steel and copper tubes can usually be joined without
problems resulting, but accelerated corrosion of the copper tube is likely to occur if it is attached
to a stainless steel tank (see Plate) (Davis et al., 1986).
Plate 10: Accelerated corrosion of a copper tube
attached to a stainless steel tank
CHAPTER THREE
MATERIALS AND METHODOLOGY
3.1 Materials
The mild steel plate, galvanised steel plate, and stainless steel plate of thickness 0.2 cm, 0.15 cm
and 0.1 cm respectively used for this study were purchased at Agricultural Engineering Workshop
(AGE), Federal University of Technology Akure (FUTA) and were cut into 2 × 2 cm. Zinc plate
of thickness 0.1 cm used for this study was purchased from Pascal Scientific Limited Akure, Ondo
State and was cut into 2 × 2 cm.
3.2 Apparatus
Apparatus used in this research include:
i. 100-mL graduated measuring cylinder
ii. 250ml graduated glass beakers
iii. 250ml Volumetric flask
iv. Electronic weighing balance
v. Spatula
vi. Stop watch
vii. Metric ruler
3.3 Reagents
The list of reagents used in this corrosion study include:
i. Ethanol

ii. Acetone
iii. Sodium hydroxide (NaOH)
iv. Concentrated Hydrochloric acid (HCl)
v. Distilled water
vi. Tin chloride (SnCl2)
vii. Antimony chloride (SbCl3)
3.4 Preparation of Materials
The metal surface was treated by degreasing in absolute ethanol and drying in acetone. The
samples were then stored in a moisture-free desiccator to avoid contamination before their use in
the corrosion studies
3.5 Welding
Mild steel and galvanized steel, mild steel and stainless steel, galvanized steel and stainless steel
were welded using arc welding technique. While zinc and mild steel, zinc and galvanized steel,
zinc and stainless steel plates were welded using gas welding technique.
3.8 Preparation of Standard Solutions
The acid test solution (0.4 M HCl) was prepared by measuring 9 ml of concentrated hydrochloric
acid (HCl) and making it up with distilled water up to the 250 mark volumetric flask. The base test
solution (20% NaOH) was prepared by measuring 50 g of concentrated sodium hydroxide and
dilute with 200 ml of distilled water. The cleaning solution was prepared by dissolving 5 g of
SnCl2, 2g SbCl3 in 100ml of distill water and 5ml of concentrated hydrochloric acid (HCl).

3.9 Gravimetric analysis
A known weight of various metals plate (mild steel, galvanised steel, stainless steel and zinc) and
dissimilar welded metals (mild steel and galvanised steel, mild steel and stainless steel, mild steel
and zinc, galvanised steel and stainless steel, galvanised steel and zinc and stainless steel and
zinc) were immersed in the test solution for a total exposure time of 24 hours, the weight loss was
measured at an interval of 1 hour, and the corrosion rate and metal loss were calculated.
3.7.1 Exposure Area
The samples length and breadth were measured using metric ruler and the thickness were
measured using venier calliper. Exposure area of the sample was calculated as follows:
Surface Area (A) = 2 x [(LxB) + (BxT) + (LxT)]
Were L is the length of sample, B is the breath of sample and T is the thickness of sample
3.7.2 Sample Weight
The metal plates were measured using an electronic balance, in grams (g) of 0.001g readability.
Plate 11: Metal plates immersed in 0.4M HCl and 20% NaOH
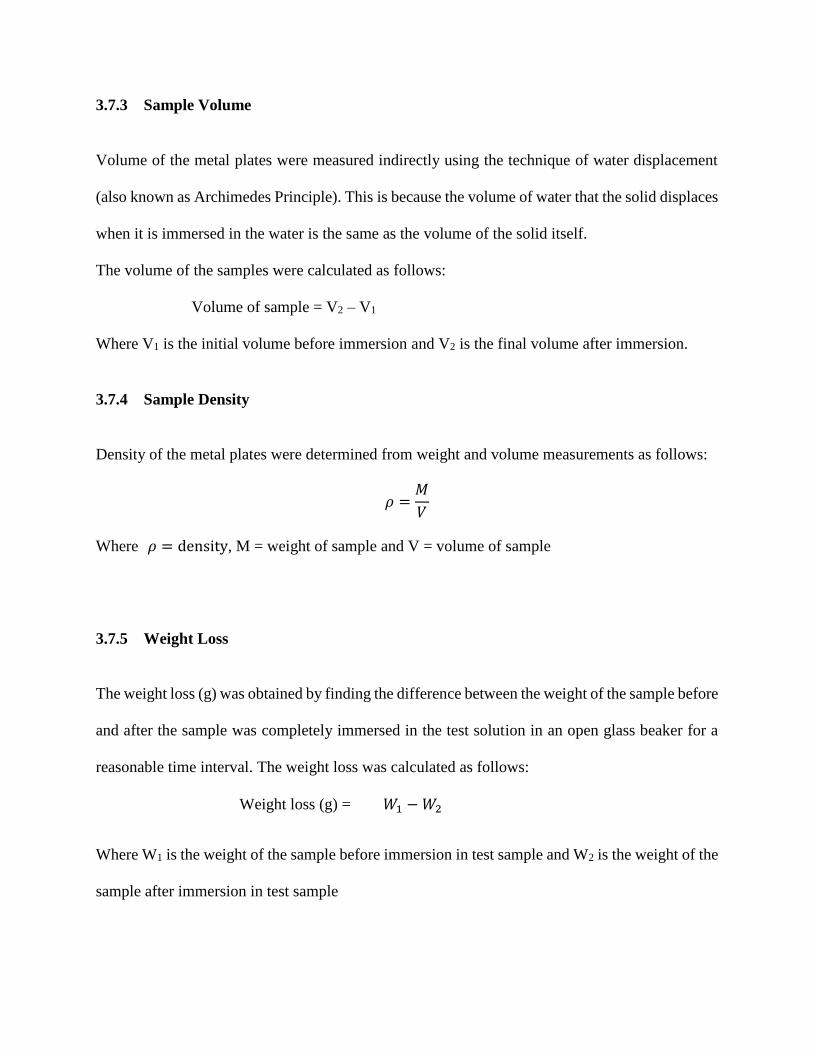
3.7.3 Sample Volume
Volume of the metal plates were measured indirectly using the technique of water displacement
(also known as Archimedes Principle). This is because the volume of water that the solid displaces
when it is immersed in the water is the same as the volume of the solid itself.
The volume of the samples were calculated as follows:
Volume of sample = V2 – V1
Where V1 is the initial volume before immersion and V2 is the final volume after immersion.
3.7.4 Sample Density
Density of the metal plates were determined from weight and volume measurements as follows:
𝜌 =𝑀
𝑉
Where 𝜌 = density, M = weight of sample and V = volume of sample
3.7.5 Weight Loss
The weight loss (g) was obtained by finding the difference between the weight of the sample before
and after the sample was completely immersed in the test solution in an open glass beaker for a
reasonable time interval. The weight loss was calculated as follows:
Weight loss (g) = 𝑊1 − 𝑊2
Where W1 is the weight of the sample before immersion in test sample and W2 is the weight of the
sample after immersion in test sample

In order to determine accurately the amount of material lost to corrosion, the metal plates were
cleaned after immersion, dried and weighed. Chemical cleaning was used in this corrosion study,
the metal plate after immersion in test solution for a precise time was soaked in cleaning solution
until all corrosion product has be removed.
3.7.6 Corrosion Rate
The weight loss was converted to a corrosion rate (CR), as follows:
Corrosion Rate (CR) = Wieght loss(g) × K
𝑆𝑎𝑚𝑝𝑙𝑒 𝐷𝑒𝑛𝑠𝑖𝑡𝑦 ( 𝑔
𝑐𝑚2) × 𝐸𝑥𝑝𝑜𝑠𝑒𝑑 𝐴𝑟𝑒𝑎 (𝐴) × 𝐸𝑥𝑝𝑜𝑠𝑢𝑟𝑒 𝑇𝑖𝑚𝑒 (ℎ𝑟)
Table 4: Constant K values for CR calculation
Corrosion Rate Unit (CR) Area Unit (A) K-Factor
mils/year (mpy) in2 5.34x10⁵
mils/year (mpy) cm2 3.45x10⁶
Millimeters/year (mmy) cm2 8.75x10⁴
Plate 14: Weighing of
cleaned coupons after
immersion
Plate 13: Prepared
sample for weighing Plate 12: Cleaning of
immersed sample

3.7.7 Metal Loss
The metal loss (ML) was determined, as follows;
Metal Loss (ML) = Wieght loss(g) × K
𝑆𝑎𝑚𝑝𝑙𝑒 𝐷𝑒𝑛𝑠𝑖𝑡𝑦 (𝑔
𝑐𝑚2) ×𝐸𝑥𝑝𝑜𝑠𝑒𝑑 𝐴𝑟𝑒𝑎 (𝐴)
Table 5: Constant K values for ML calculation
Metal Loss (CR) Area Unit (A) K-Factor
Mils in2 61.02
Mils cm2 393.7
Millimeters cm2 10.0

CHAPTER FOUR
RESULTS AND DISCUSION
4.1 Welded Dissimilar metals
The dissimilar welded were observed to be in contact with each other before gravimetric
analysis were carried out (plate 11).
4.2 Samples Exposure Area
The calculated exposure area of the metal plates used in this corrosion study are tabulated in
table 6 and table 7.
Table 6: Exposure area of sample in acid media (0.4 M HCl)
SAMPLE LENGTH
(cm)
BREADTH
(cm)
THICKNESS
(cm)
AREA
(cm2)
Mild steel 2.1 2.1 0.2 10.5
Galvanised steel 2 2 0.15 9.2
Stainless steel 2.2 2.1 0.1 10.1
Plate 15: Welded dissimilar metal sample

Table 7: Exposure area of sample in base media (20% NaOH)
SAMPLE LENGTH
(cm)
BREADTH
(cm)
THICKNESS
(cm)
AREA (cm2)
Mild steel 2.2 2.0 0.2 10.48
Galvanised steel 2 2 0.15 9.2
Stainless steel 2.1 2.0 0.1 9.22
Zinc 2.4 1.3 0.1 6.98
Mild steel and galvanised
steel
M = 2.2
G = 2.0
M = 2.0
G = 2.0
M = 0.2
G = 0.15
19.68
Mild steel and stainless steel M = 2.2
S = 2.1
M = 2.0
S = 2.0
M = 0.2
S = 0.1
19.70
Galvanised steel and
stainless steel
G = 2.0
S = 2.1
G = 2.0
S = 2.0
G = 0.15
S = 0.1
18.84
Mild steel and zinc M = 2.0
Z = 2.4
M = 2.0
Z = 2.0
M = 0.2
Z = 0.1
20.08
Galvanised steeland zinc G = 2.1
Z = 2.4
G = 2.0
Z = 2.0
G = 0.15
Z = 0.1
20.11
Stainless steel and zinc S = 2.0
Z = 2.5
S = 1.8
Z = 1.2
S = 0.1
Z = 0.1
14.7
Zinc 2.4 1.2 0.1 6.48
Mild steel and galvanised steel M = 2.2
G = 2.0
M = 2.1
G = 2.0
M = 0.2
G = 0.15 20.16
Mild steel and stainless steel M = 2.1
S = 2.3
M = 2.0
S = 2.1
M = 0.2
S = 0.1 21.34
Galvanised steel and stainless steel G = 2.0
S = 2.2
G = 2.0
S = 2.0
G = 0.15
S = 0.1 18.84
Mild steel and zinc M = 2.1
Z = 2.4
M = 2.0
Z = 2.0
M = 0.2
Z = 0.1 20.52
Galvanised steel and zinc G = 2.1
Z = 2.4
G = 2.0
Z = 2.0
G = 0.15
Z = 0.1 20.11
Stainless steel and zinc S = 2.2
Z = 2.4
S = 2.0
Z = 2.0
S = 0.1
Z = 0.1 20.12
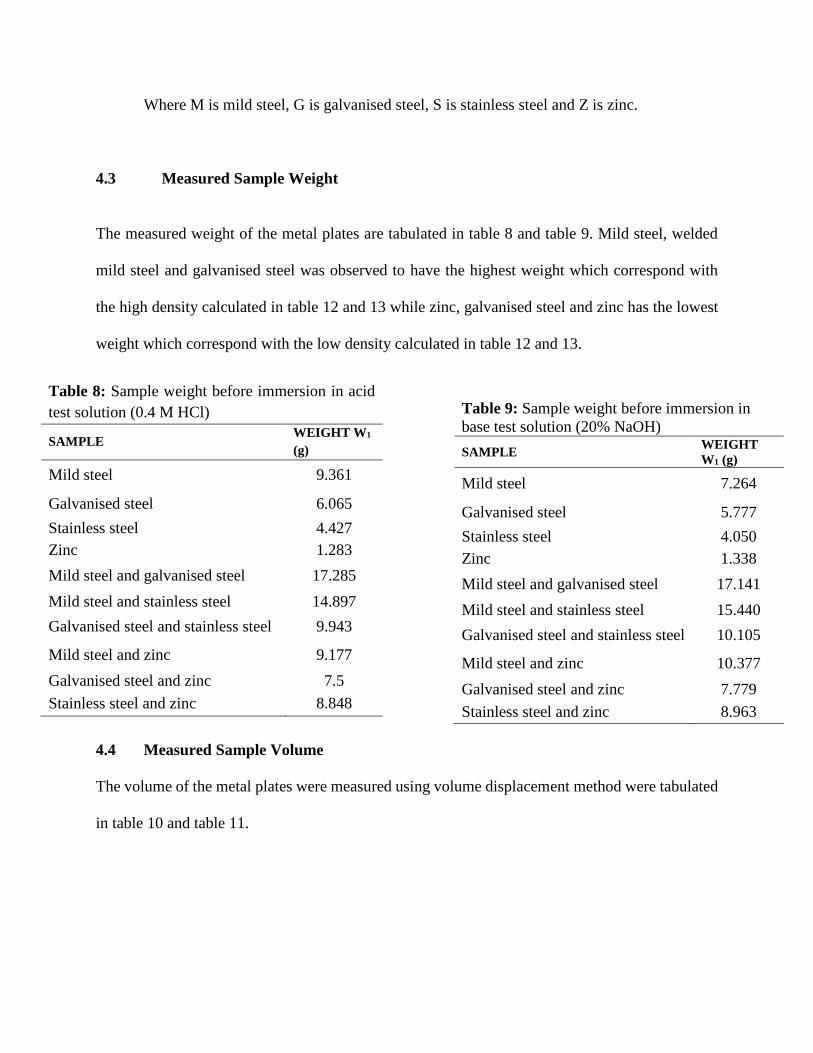
Where M is mild steel, G is galvanised steel, S is stainless steel and Z is zinc.
4.3 Measured Sample Weight
The measured weight of the metal plates are tabulated in table 8 and table 9. Mild steel, welded
mild steel and galvanised steel was observed to have the highest weight which correspond with
the high density calculated in table 12 and 13 while zinc, galvanised steel and zinc has the lowest
weight which correspond with the low density calculated in table 12 and 13.
4.4 Measured Sample Volume
The volume of the metal plates were measured using volume displacement method were tabulated
in table 10 and table 11.
Table 8: Sample weight before immersion in acid
test solution (0.4 M HCl)
SAMPLE WEIGHT W1
(g)
Mild steel 9.361
Galvanised steel 6.065
Stainless steel 4.427
Zinc 1.283
Mild steel and galvanised steel 17.285
Mild steel and stainless steel 14.897
Galvanised steel and stainless steel 9.943
Mild steel and zinc 9.177
Galvanised steel and zinc 7.5
Stainless steel and zinc 8.848
Table 9: Sample weight before immersion in
base test solution (20% NaOH)
SAMPLE WEIGHT
W1 (g)
Mild steel 7.264
Galvanised steel 5.777
Stainless steel 4.050
Zinc 1.338
Mild steel and galvanised steel 17.141
Mild steel and stainless steel 15.440
Galvanised steel and stainless steel 10.105
Mild steel and zinc 10.377
Galvanised steel and zinc 7.779
Stainless steel and zinc 8.963

4.4 Determined Sample Density
The samples density calculated from the measured weight and volume of the samples are tabulated
in table 12 and table 13. The calculated density of mild steel in table 12 and table 13 correspond
with standard density (7.85g/cm3) of mild steel (http://en.m.wkipedia.org/wiki/ Carbon-steel).
Table 10: Sample volume before immersion in
acid test solution (0.4 M HCl)
SAMPLE VOLUME
(cm3)
Mild steel 1
Galvanised steel 0.5
Stainless steel 1
Zinc 0.1
Mild steel and galvanised steel 2.5
Mild steel and stainless steel 2
Galvanised steel and stainless steel 1.5
Mild steel and zinc 1.5
Galvanised steel and zinc 1
Stainless steel and zinc 1.5
Table 11: Sample volume before immersion in
base test solution (20% NaOH)
SAMPLE VOLUME
(cm3)
Mild steel 1
Galvanised steel 0.5
Stainless steel 1
Zinc 0.1
Mild steel and galvanised steel 2.5
Mild steel and stainless steel 2
Galvanised steel and stainless steel 1.5
Mild steel and zinc 1.5
Galvanised steel and zinc 1
Stainless steel and zinc 1.5
Table 12: Sample density of samples before
immersion in acid test solution (0.4 M HCl)
SAMPLE Density
(g/cm3)
Mild steel 9.361
Galvanised steel 12.13
Stainless steel 4.427
Zinc 12.83
Mild steel and galvanised steel 6.914
Mild steel and stainless steel 7.449
Galvanised steel and stainless steel 6.629
Table 13: Sample density samples before
immersion in base test solution (20% NaOH)
SAMPLE Density
(g/cm3)
Mild steel 7.264
Galvanised steel 11.554
Stainless steel 4.05
Zinc 13.38
Mild steel and galvanised steel 8.571
Mild steel and stainless steel 7.72
Galvanised steel and stainless steel 6.737
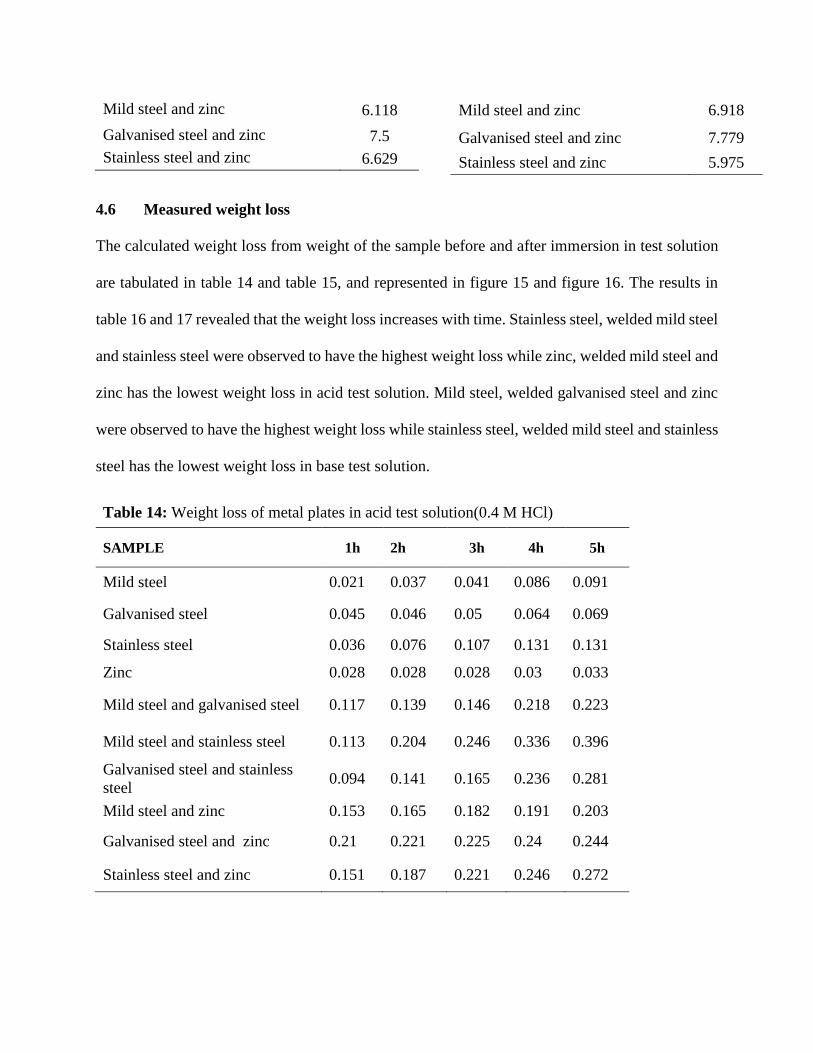
4.6 Measured weight loss
The calculated weight loss from weight of the sample before and after immersion in test solution
are tabulated in table 14 and table 15, and represented in figure 15 and figure 16. The results in
table 16 and 17 revealed that the weight loss increases with time. Stainless steel, welded mild steel
and stainless steel were observed to have the highest weight loss while zinc, welded mild steel and
zinc has the lowest weight loss in acid test solution. Mild steel, welded galvanised steel and zinc
were observed to have the highest weight loss while stainless steel, welded mild steel and stainless
steel has the lowest weight loss in base test solution.
Mild steel and zinc 6.118
Galvanised steel and zinc 7.5
Stainless steel and zinc 6.629
Mild steel and zinc 6.918
Galvanised steel and zinc 7.779
Stainless steel and zinc 5.975
Table 14: Weight loss of metal plates in acid test solution(0.4 M HCl)
SAMPLE 1h 2h 3h 4h 5h
Mild steel 0.021 0.037 0.041 0.086 0.091
Galvanised steel 0.045 0.046 0.05 0.064 0.069
Stainless steel 0.036 0.076 0.107 0.131 0.131
Zinc 0.028 0.028 0.028 0.03 0.033
Mild steel and galvanised steel 0.117 0.139 0.146 0.218 0.223
Mild steel and stainless steel 0.113 0.204 0.246 0.336 0.396
Galvanised steel and stainless
steel 0.094 0.141 0.165 0.236 0.281
Mild steel and zinc 0.153 0.165 0.182 0.191 0.203
Galvanised steel and zinc 0.21 0.221 0.225 0.24 0.244
Stainless steel and zinc 0.151 0.187 0.221 0.246 0.272

Table 15: Weight loss of metal plates in base media (20% NaOH)
SAMPLE 1h 2h 3h 4h 5h
Mild steel 0.033 0.051 0.055 0.06 0.066
Galvanised steel 0.01 0.018 0.02 0.021 0.025
Stainless steel 0.001 0.002 0.002 0.002 0.002
Zinc 0.004 0.007 0.016 0.021 0.024
Mild steel and galvanised steel 0.063 0.068 0.071 0.073 0.086
Mild steel and stainless steel 0.018 0.026 0.037 0.038 0.057
Galvanised steel and stainless
steel 0.045 0.048 0.05 0.051 0.058
Mild steel and zinc 0.108 0.142 0.174 0.193 0.201
Galvanised steel and zinc 0.169 0.187 0.198 0.206 0.21
Stainless steel and zinc 0.105 0.12 0.126 0.176 0.193
0
0.05
0.1
0.15
0.2
0.25
0.3
0.35
0.4
0.45
Mild steel Galvanisedsteel
Stainless Zinc Mild steel +galvanised
steel
Mild steel +stainless
Galvanisedsteel +
stainless
Mild steel +zinc
Galvanisedsteel + zinc
Stainless +zinc
Figure 15: Weight loss of metal plates in acid test solution (0.4 M HCl)
1h 2h 3h 4h 5h
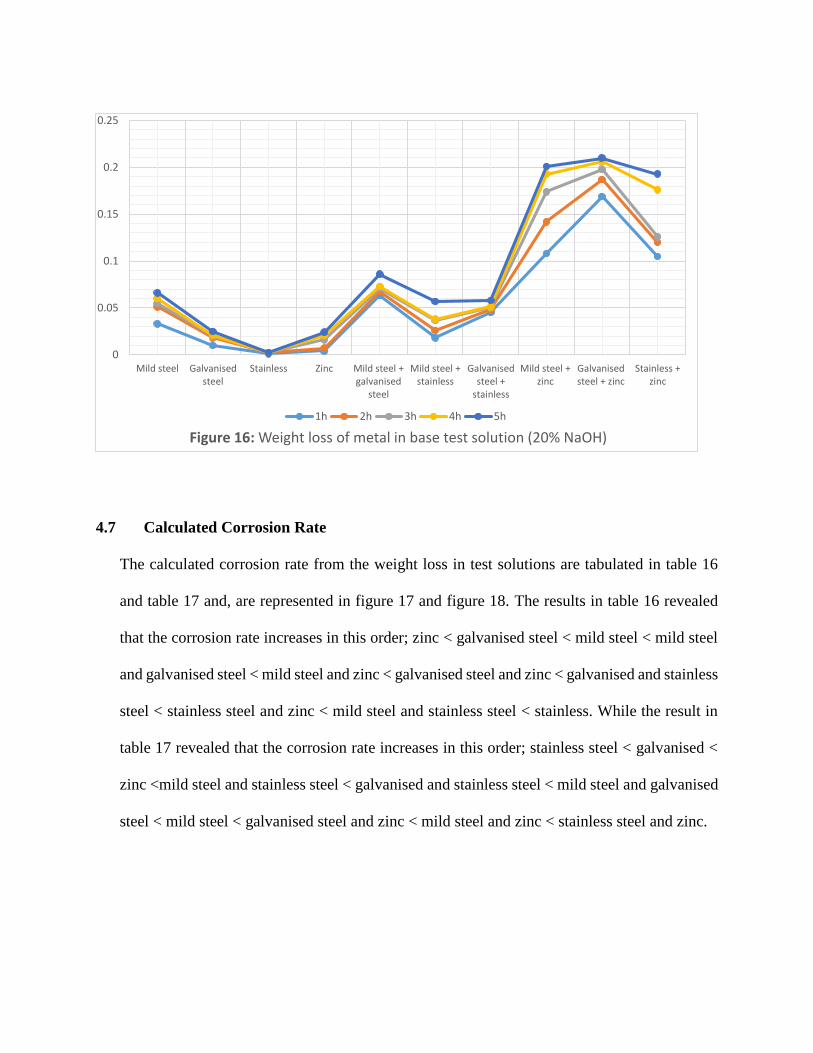
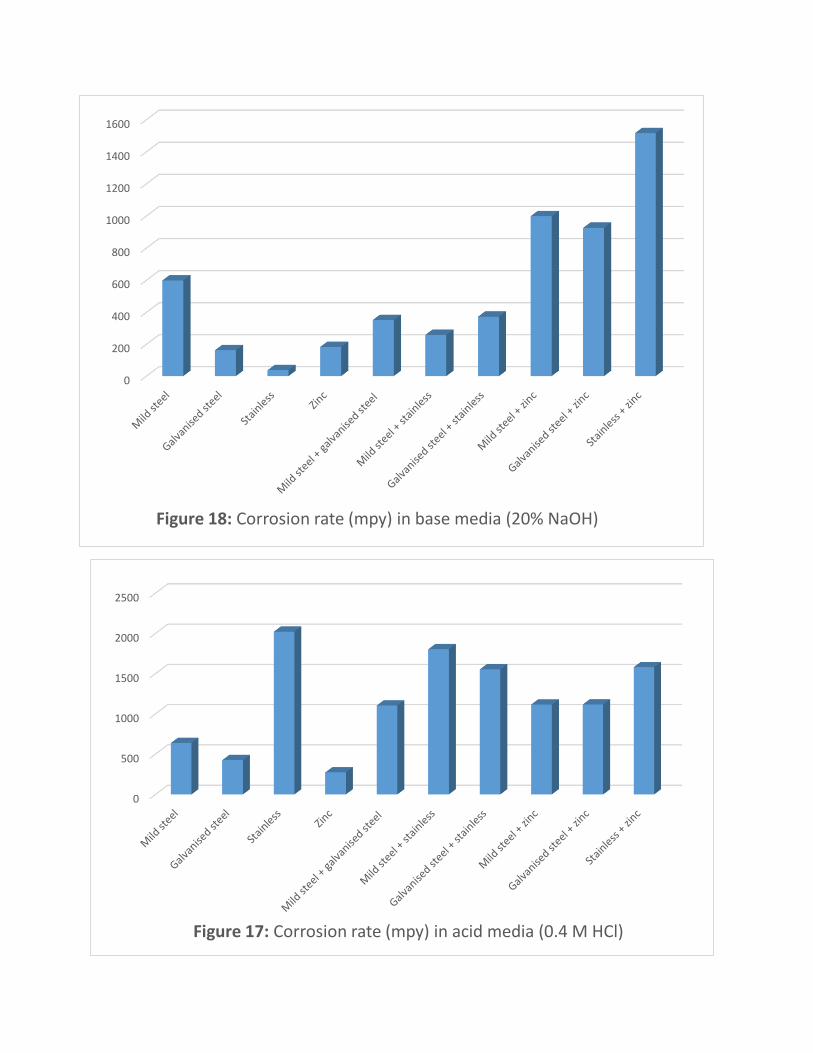
4.7 Calculated Corrosion Rate
The calculated corrosion rate from the weight loss in test solutions are tabulated in table 16
and table 17 and, are represented in figure 17 and figure 18. The results in table 16 revealed
that the corrosion rate increases in this order; zinc < galvanised steel < mild steel < mild steel
and galvanised steel < mild steel and zinc < galvanised steel and zinc < galvanised and stainless
steel < stainless steel and zinc < mild steel and stainless steel < stainless. While the result in
table 17 revealed that the corrosion rate increases in this order; stainless steel < galvanised <
zinc <mild steel and stainless steel < galvanised and stainless steel < mild steel and galvanised
steel < mild steel < galvanised steel and zinc < mild steel and zinc < stainless steel and zinc.
0
0.05
0.1
0.15
0.2
0.25
Mild steel Galvanisedsteel
Stainless Zinc Mild steel +galvanised
steel
Mild steel +stainless
Galvanisedsteel +
stainless
Mild steel +zinc
Galvanisedsteel + zinc
Stainless +zinc
Figure 16: Weight loss of metal in base test solution (20% NaOH)
1h 2h 3h 4h 5h
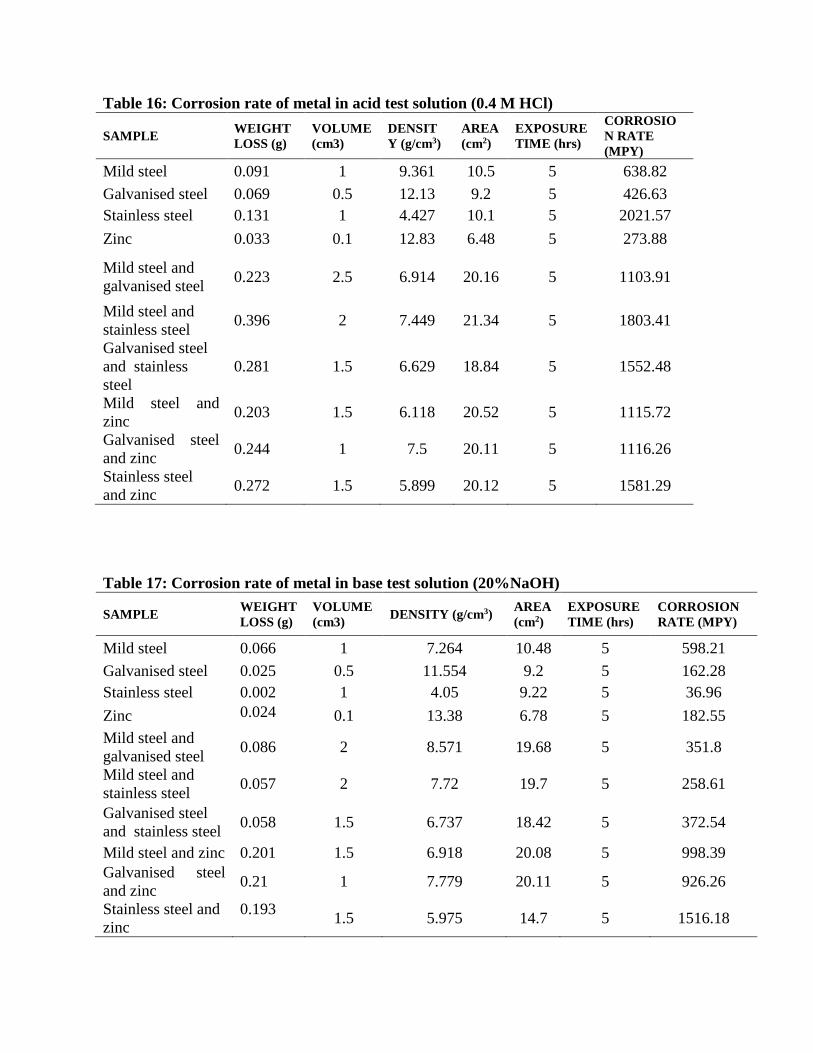
Table 16: Corrosion rate of metal in acid test solution (0.4 M HCl)
SAMPLE WEIGHT
LOSS (g)
VOLUME
(cm3)
DENSIT
Y (g/cm3)
AREA
(cm2)
EXPOSURE
TIME (hrs)
CORROSIO
N RATE
(MPY)
Mild steel 0.091 1 9.361 10.5 5 638.82
Galvanised steel 0.069 0.5 12.13 9.2 5 426.63
Stainless steel 0.131 1 4.427 10.1 5 2021.57
Zinc 0.033 0.1 12.83 6.48 5 273.88
Mild steel and
galvanised steel 0.223 2.5 6.914 20.16 5 1103.91
Mild steel and
stainless steel 0.396 2 7.449 21.34 5 1803.41
Galvanised steel
and stainless
steel
0.281 1.5 6.629 18.84 5 1552.48
Mild steel and
zinc 0.203 1.5 6.118 20.52 5 1115.72
Galvanised steel
and zinc 0.244 1 7.5 20.11 5 1116.26
Stainless steel
and zinc 0.272 1.5 5.899 20.12 5 1581.29
Table 17: Corrosion rate of metal in base test solution (20%NaOH)
SAMPLE WEIGHT
LOSS (g)
VOLUME
(cm3) DENSITY (g/cm3)
AREA
(cm2)
EXPOSURE
TIME (hrs)
CORROSION
RATE (MPY)
Mild steel 0.066 1 7.264 10.48 5 598.21
Galvanised steel 0.025 0.5 11.554 9.2 5 162.28
Stainless steel 0.002 1 4.05 9.22 5 36.96
Zinc 0.024 0.1 13.38 6.78 5 182.55
Mild steel and
galvanised steel 0.086 2 8.571 19.68 5 351.8
Mild steel and
stainless steel 0.057 2 7.72 19.7 5 258.61
Galvanised steel
and stainless steel 0.058 1.5 6.737 18.42 5 372.54
Mild steel and zinc 0.201 1.5 6.918 20.08 5 998.39
Galvanised steel
and zinc 0.21 1 7.779 20.11 5 926.26
Stainless steel and
zinc
0.193 1.5 5.975 14.7 5 1516.18
0
200
400
600
800
1000
1200
1400
1600
Figure 18: Corrosion rate (mpy) in base media (20% NaOH)
0
500
1000
1500
2000
2500
Figure 17: Corrosion rate (mpy) in acid media (0.4 M HCl)

4.8 Calculated Metal Loss
The calculated metal loss from the weight loss in test solutions are tabulated in table 18 and
table 19, and are represented in figure 19 and figure 20. The results in table 18 revealed that
the metal loss increases in this order; zinc < galvanised steel < mild steel < mild steel and
galvanised steel < mild steel and zinc < galvanised steel and zinc < galvanised and stainless
steel < stainless steel and zinc < mild steel and stainless steel < stainless. While the result in
table 19 revealed that the metal loss increases in this order; stainless steel < galvanised < zinc
<mild steel and stainless steel < galvanised and stainless steel < mild steel and galvanised steel
< mild steel < galvanised steel and zinc < mild steel and zinc < stainless steel and zinc.
Table 18: Metal loss of metal in acid test solution (0.4 M HCl)
SAMPLE WEIGHT
LOSS (g)
VOLUME
(cm3)
DENSITY
(g/cm3)
AREA
(cm2)
METAL
LOSS (mils)
Mild steel 0.091 1 9.361 10.5 0.36
Galvanised steel 0.069 0.5 12.13 9.2 0.24
Stainless 0.131 1 4.427 10.1 1.15
Zinc 0.033 0.1 12.83 6.48 0.16
Mild steel and galvanised steel 0.223 2.5 6.914 20.16 0.63
Mild steel and stainless 0.396 2 7.449 21.34 0.98
Galvanised steel and stainless 0.281 1.5 6.629 18.84 0.89
Mild steel and zinc 0.203 1.5 6.118 20.52 0.6366
Galvanised steel and zinc 0.244 1 7.5 20.11 0.6369
Stainless and zinc 0.272 1.5 5.899 20.12 0.9
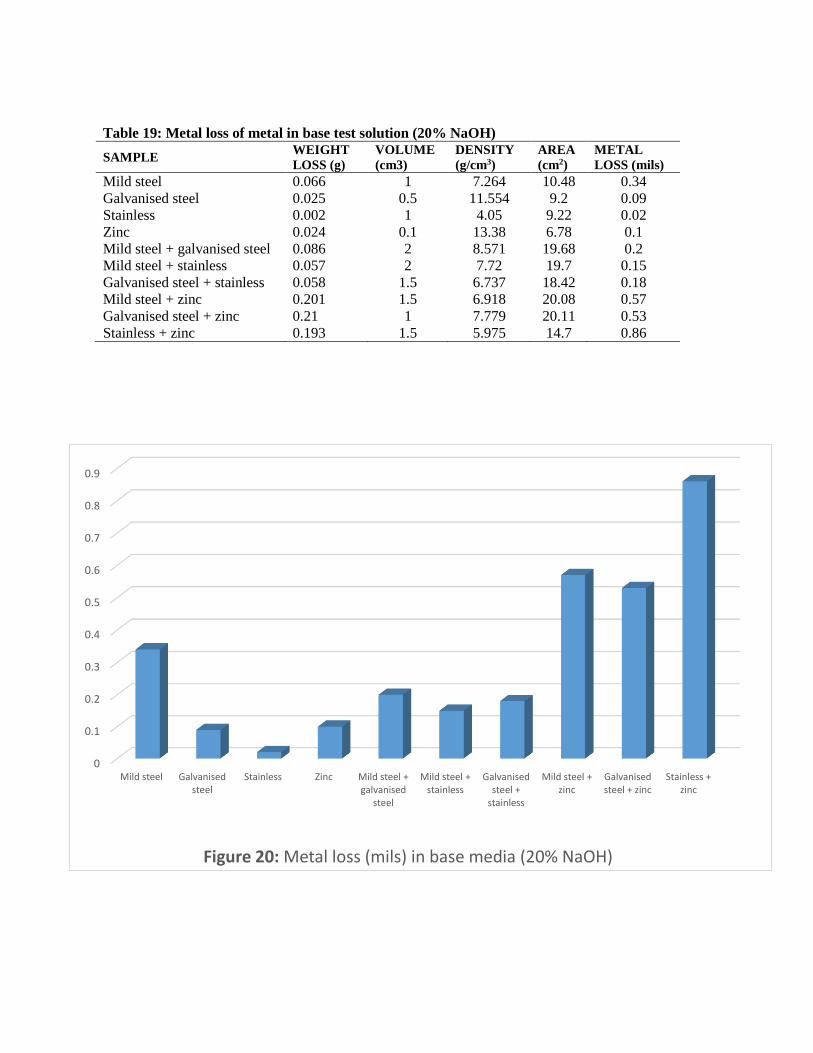
Table 19: Metal loss of metal in base test solution (20% NaOH)
SAMPLE WEIGHT
LOSS (g)
VOLUME
(cm3)
DENSITY
(g/cm3)
AREA
(cm2)
METAL
LOSS (mils)
Mild steel 0.066 1 7.264 10.48 0.34
Galvanised steel 0.025 0.5 11.554 9.2 0.09
Stainless 0.002 1 4.05 9.22 0.02
Zinc 0.024 0.1 13.38 6.78 0.1
Mild steel + galvanised steel 0.086 2 8.571 19.68 0.2
Mild steel + stainless 0.057 2 7.72 19.7 0.15
Galvanised steel + stainless 0.058 1.5 6.737 18.42 0.18
Mild steel + zinc 0.201 1.5 6.918 20.08 0.57
Galvanised steel + zinc 0.21 1 7.779 20.11 0.53
Stainless + zinc 0.193 1.5 5.975 14.7 0.86
0
0.1
0.2
0.3
0.4
0.5
0.6
0.7
0.8
0.9
Mild steel Galvanisedsteel
Stainless Zinc Mild steel +galvanised
steel
Mild steel +stainless
Galvanisedsteel +
stainless
Mild steel +zinc
Galvanisedsteel + zinc
Stainless +zinc
Figure 20: Metal loss (mils) in base media (20% NaOH)

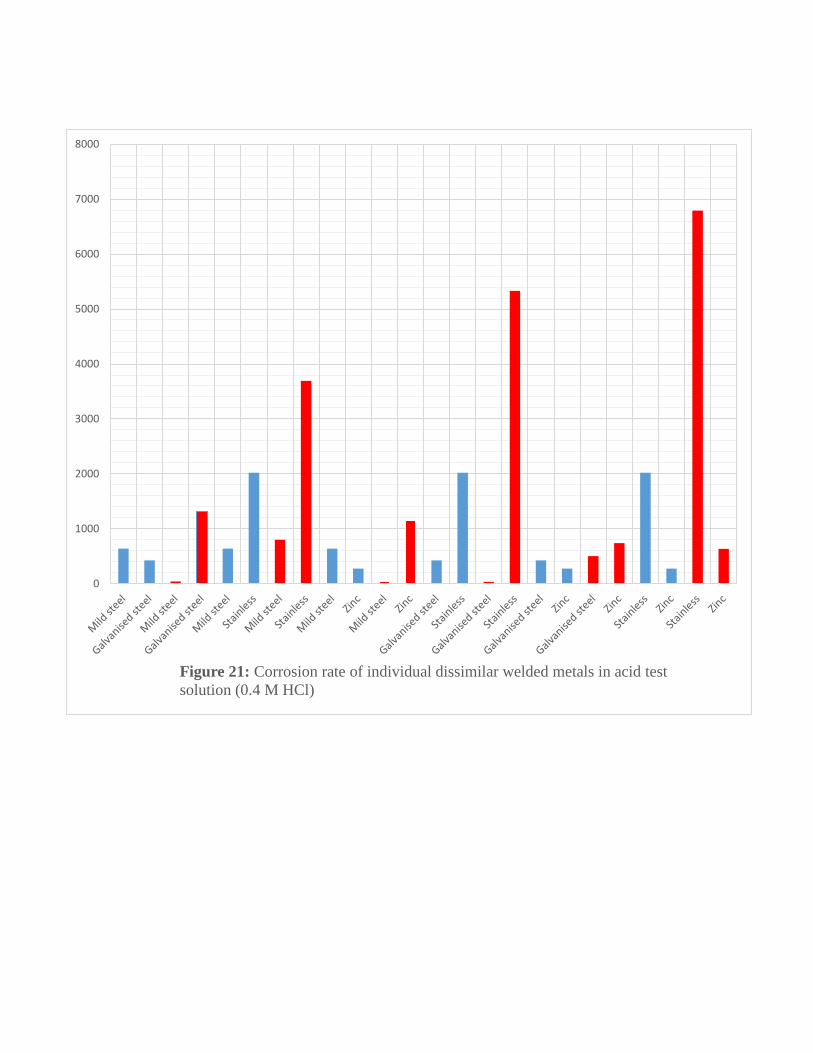
4.8 Assessment of Accelerated Galvanic Corrosion
The calculated corrosion rate of the individual dissimilar welded metals are tabulated in table
20 and table 21, and are represented in figure 21 and figure 22.
The result in table 21 and 22 revealed that accelerated galvanic corrosion occur in welded
samples of mild steel and galvanised steel, mild steel and stainless steel, mild steel and zinc,
galvanised steel and stainless, stainless steel and zinc. No accelerated galvanic corrosion was
observed in galvanised steel and zinc.
0
0.2
0.4
0.6
0.8
1
1.2
Mild steel Galvanisedsteel
Stainless Zinc Mild steel+
galvanisedsteel
Mild steel+ stainless
Galvanisedsteel +
stainless
Mild steel+ zinc
Galvanisedsteel + zinc
Stainless +zinc
Figure 19: Metal loss (mils) in acid media (0.4 M HCl)

Where M is mild steel, G is galvanised steel, S is stainless steel and Z is zinc.
Table 20: Corrosion rate of individual dissimilar welded metals in acid test solution (0.4 M HCl)
SAMPLE WEIGHT
LOSS (g)
VOLUME
(cm3)
DENSITY
(g/cm3) AREA (cm2)
EXPOSURE
TIME (hrs)
CORROSION
RATE (MPY)
Mild steel and
galvanised steel
M=0.034
G =1.094
M = 1
G = 0.5
M=10.818
G =12.93
M=10.96
G=9.2 24
M=41
G=1317
Mild steel and
stainless steel
M=0.559
S=1.425
M = 1
S = 1
M=9.978
S=4.912
M=10.04
S=11.3 24
M=802
S=3691
Mild steel and
zinc
M=0.02
Z=0.506
M = 1
Z = 0.5
M=6.164
Z=6.026
M=10.04
Z=10.48 24
M=46
Z=1152
Galvanised steel
and stainless
steel
G=0.02
S=1.712
G = 0.5
S = 1
G=9.432
S=4.791
G=9.2
S=9.64 24
G=33
S=5329
Galvanised steel
and zinc
G=0.335
Z=0.3
G = 0.5
Z = 0.5
G=9.432
Z=5.508
G=9.63
Z=10.48 24
G=530
Z=739
Stainless steel
and zinc
S=2.075
Z=0.396
S = 1
Z =0.5
S=4.566
Z=8.864
S=9.64
Z=10.48 24
S=6791
Z=634
Table 21: Corrosion rate of individual dissimilar welded metals in base test solution (20% NaOH)
SAMPLE WEIGHT
LOSS (g)
VOLUME
(cm3)
DENSITY
(g/cm3) AREA (cm2)
EXPOSURE
TIME (hrs)
CORROSION
RATE (MPY)
Mild steel and
galvanised steel
M=0.028
G =0.659
M = 1
G = 0.5
M=10.966
G =12.35
M=10.48
G=9.2 24
M=35
G=834
Mild steel and
stainless steel
M=0.583
S=0.007
M = 1
S = 1
M=11.566
S=3.847
M=10.48
S=9.22 24
M=691
S=28
Mild steel and
zinc
M=0.111
Z=0.402
M = 1
Z = 0.5
M=7.381
Z=5.992
M=9.6
Z=10.48 24
M=225
Z=920
Galvanised steel
and stainless
steel
G=0.493
S=0.004
G = 0.5
S = 1
G=12.304
S=3.953
G=9.2
S=9.22 24
G=626.07
S=15.78
Galvanised steel
and zinc
G=0.356
Z=0.296
G = 0.5
Z = 0.5
G=9.984
Z=5.574
G=9.63
Z=10.48 24
G=532
Z=728
Stainless steel
and zinc
S=0.006
Z=0.897
S = 1
Z =0.5
S=4.791
Z=8.344
S=7.96
Z=6.74 24
S=22
Z=2293
0
1000
2000
3000
4000
5000
6000
7000
8000
Figure 21: Corrosion rate of individual dissimilar welded metals in acid test
solution (0.4 M HCl)

0
500
1000
1500
2000
2500
Figure 22: Corrosion rate of individual dissimilar welded metals in base test
solution (20% NaOH)
Un-welded metal plate Dissimilar welded metal plate

CHAPTER FIVE
CONCLUSION AND RECOMMENDATION
5.1 Conclusion
Summarily it can be concluded that, the rate of corrosion of metal plates and dissimilar welded
metals is dependent on both the media and chemical properties of the steel. Within the limits of
experimental error, conclusion drawn based on observations and result of the research are:
In corroding media like used in this research, corrosion of metal depends the exposure time and
the standard electrode potential. The closer the standard electrode potential of dissimilar metals
the lesser the corrosion rate.
The corrosion rate of the metal plates and dissimilar welded metals immersed in acid test solution
(0.4 M HCl) increases in this order; zinc < galvanised steel < mild steel < mild steel and galvanised
steel < mild steel and zinc < galvanised steel and zinc < galvanised and stainless steel < stainless
steel and zinc < mild steel and stainless steel < stainless. The corrosion rate of the metal plates and
dissimilar welded metals immersed in base test solution (20% NaOH) increase in this order;
stainless steel < galvanised < zinc <mild steel and stainless steel < galvanised and stainless steel <
mild steel and galvanised steel < mild steel < galvanised steel and zinc < mild steel and zinc <
stainless steel and zinc.
Accelerated galvanic corrosion occur in welded samples of mild steel and galvanised steel, mild
steel and stainless steel, mild steel and zinc, galvanised steel and stainless, stainless steel and zinc.
No accelerated galvanic corrosion was observed in galvanised steel and zinc.

5.2 Recommendation
A satisfactory performance against galvanic corrosion can only be achieved if the following
recommendations and methods to control corrosion are followed:
i. Select metals/alloys as close together as possible in the galvanic series.
ii. Avoid unfavourable area effect of a small anode and large cathode.
iii. Insulate dissimilar metals wherever practical.
iv. Apply coatings with caution. Paint the cathode (or both) and keep the coatings in good
repair on the anode.
v. Avoid threaded joints for materials far apart in the galvanic series
Suggestions for Future Work
i. A better and modern method of checking corrosion rate asides weight loss method should
be employed in future investigations.
ii. It is suggested that future researchers should try developing a model to better interpret the
effect of bimetallic welding on rate of corrosion.
iii. Future researchers are also encouraged to use the existing data in developing a model
capable of predicting time of failure of metals found in environments as investigated.

REFERENCES
Abdel-Gaber, A. M.; Khalil, N.; El-Fetouh, A. A.; The Dissolution Mechanism of Steel in
Inorganic Acids, Anti-Corrosion Methods and Materials, 2003, 50, 6, 442-447.
Baboian R. “Electro chemical techniques for corrosion” edited by R. Baboian, National
Association of corrosion engineeres, Houston, Texas, 1977.
Baboian, R. (Ed.); Corrosion Tests and Standards: Application and Interpretation, American
for Testing and Materials, Philadelphia, 1995.
Baboian, R.; Dean, S. W. (Eds.); Corrosion Testing and Evaluation, STP 1000, American Society
for Testing and Materials, Philadelphia, 1990.
Barbara A. Shaw, Robert G. Kelly, Electrochem. Soc. Interface, pp. 24-26, 2006.
Bardal E., R. Johnsen and Gartland P.O. Corrosion 40 (1984) 12.
Barrett C.S. and Massalski T. B., “Structure of metals: Crystallographic methods, principles and
data,” 3rd rev. ed., p.210, pergamon press, Oxford, 1980.
Craig B. and Anderson D. Corrosion, Vol 13, ASM Handbook, ASM International, 1987
Davis G.O., Kolts J. and Sridhar S., Corrosion 42,6 (1986) 329.
Fontana, M.G., and Greene, N.D., Corrosion Engineering, McGraw-Hill Book Co., New York,
1967
http://chemwiki.ucdavis.edu/Analytical_Chemistry/Electrochemistry/Case_Studies/Corrosion/Co
rrosion_Basics_II

http://en.m.wkipedia.org/wiki/ Carbon_ steel
http://www.britannica.com/science/electrolysis
https://en.m.wikipedia.org/wiki/Silver_Bridge
htttp://chemwiki.ucdavis.edu/physical_Chemistry/Equilibria/Redox_Equiliria/The_Electrochemi
cal_Series
Johnsen R. and Olsen S. Paper 397, Corrosion ‘92; Nashville, USA, April 1992, NACE.
Johnsen R. and Olsen S. Paper 397, Corrosion ‘92; Nashville, USA, April 1992, NACE.
Mars G. Fontana, Corrosion Engineering ,3rd edition, McGraw –Hill (1987)
Mars G. Fontana, Corrosion Engineering, 2nd ed., Tata McGraw Hill: New Delhi, 2005.
Memon S., Abdul Karim and A. Venkatachalam “Corrosion Study of Iron and Copper Metals and
Brass Alloy in Different Medium”. pp. S346, 2011
Noor E. A., Al-Moubaraki A. H., “Corrosion Behavior of Mild Steel in Hydrochloric Acid
Solutions” Int. J. Electrochem. Sci., vol. 3, pp. 806 – 818, 2008.
Osarolube E., Owate I. O., Oforka N. C., “Corrosion behaviour of mild and high carbon steels in
various acidic media”, Scientific Research and Essay, vol. 3 (6) pp. 224-228, 2008.
Pierre R. R., Corrosion Inspection and Monitoring, John Wiley & Sons: New York, 2007.
Piontelli, R. Z. Elektrochem.,Vol 58. pp 54. 1954.

Rajendran, S.; Joany, R. M.; Palaniswamy, N.; An Encounter with Microheterogeneous Systems
as Corrosion Inhibitors, Corrosion Reviews, 2002, 20, 3, 231-252.
Revie R. W. and N. D. Greene, Corros.Sci.,Vol No. 9. pp 755. 1969.
Samuel M. Allen “Corrosion” Microsoft ® Encarta ® 2009. © 1993-2008 Microsoft
Corporation. All rights reserved.
Sedriks A. J. and Dudts P., Corrosion, 57(1), 84(2001)
Skaperdas G. and Uhlig H., Ind. Eng. Chem., Vol 34. pp 748. 1942.
Uhlig H.H., “Corrosion Hand book.”pp 1107, pp 598-599. pp 1109. 1948.
Uhlig H.H., “The corrosion,” Chem.Eng. News, Vol 29. No 6. pp 2764. 1950.
Uhlig H.H., “The cost of the corrosion to the united states,” Chem.Eng. News, Vol 27. pp 2764.
1949.
Uhlig, H. H., Corrosion Control, 2nd ed., John Wiley and Sons, New York 1971
Vedula S. Sastri, Corrosion Inhibitors: Principles and Applications, John Wiley & Sons: England,
1998.
Wagner C. and W. Traud, Z. Elektrochem., Vol 44. pp 391.1938.


![Samson. HWV 57 - accueil (data.bnf.fr) · Samson. - Awake the trumpet's lofty sound. - [6] (1995) Samson. - Awake the trumpet's lofty sound. - [6] (1995) Samson. - Awake the trumpet's](https://static.fdocuments.us/doc/165x107/600665197a8f42597414c65e/samson-hwv-57-accueil-databnffr-samson-awake-the-trumpets-lofty-sound.jpg)