ASSESSMENT OF COASTAL AND MARINE
73
Transcript of ASSESSMENT OF COASTAL AND MARINE


ASSESSMENT OF COASTAL AND MARINE ECOSYSTEM GOODS AND SERVICES -
LINKING COASTAL ZONE MANAGEMENT TO ECOSYSTEM SERVICES IN INDIA
MANGROVES
INTEGRATED SOCIAL SCIENCES AND ECONOMICS (ISE) DIVISION
NATIONAL CENTRE FOR SUSTAINABLE COASTAL MANAGEMENT
MINISTRY OF ENVIRONMENT, FOREST AND CLIMATE CHANGE
GOVERNMENT OF INDIA

Research Team – Integrated Social Sciences and Economics Division Dr. D. Asir Ramesh Dr. L. Muthukrishnan Mr. N. Karthi Ms. S. Dhivya Data and Knowledge Support - NCSCM Dr. R. Muruganandam, Geospatial Sciences Division Guidance Dr. Purvaja Ramachandran, Division Chair, NCSCM Dr. Ramesh Ramachandran, Director, NCSCM

CONTENTS
SUMMARY ..................................................................................................................... 1
1 INTRODUCTION ...................................................................................................... 2
2 MANGROVES OF INDIA ......................................................................................... 3
3 META ANALYSIS OF MANGROVE VALUATION .................................................. 7
3.1 PROVISIONING SERVICES OF MANGROVE ................................................................ 8
3.1.1 Fishery ........................................................................................................ 9
3.1.2 Aquaculture ............................................................................................... 11
3.1.3 Fuelwood and timber function ................................................................... 12
3.1.4 Fodder function ......................................................................................... 13
3.1.5 Honey collection ........................................................................................ 14
3.1.6 Medicinal uses .......................................................................................... 15
3.2 REGULATION SERVICES ....................................................................................... 16
3.2.1 Protection function .................................................................................... 16
3.2.2 Erosion prevention and soil accretion ....................................................... 18
3.2.3 Water quality maintenance ........................................................................ 20
3.2.4 Carbon sequestration ................................................................................ 20
3.3 CULTURAL SERVICES .......................................................................................... 21
3.3.1 Bird nesting ground patches ...................................................................... 23
3.3.2 Education .................................................................................................. 23
3.4 SUPPORTING SERVICE ........................................................................................ 24
3.4.1 Biodiversity and nursery ground support ................................................... 24
3.4.2 Nutrient and soil formation support ........................................................... 25
4 BENEFIT TRANSFER AND META-ANALYSIS OF MANGROVE ECOSYSTEM .... 26
5 CONCLUSION ....................................................................................................... 39
6 REFERENCES ....................................................................................................... 40
ANNEXURE-1 .............................................................................................................. 56
ANNEXURE-2 .............................................................................................................. 62
ANNEXURE-3 .............................................................................................................. 63
1
SUMMARY
Mangroves are a group of trees and shrubs that live in the coastal intertidal zone.
Mangroves have been distributed in low-energy, tidal shorelines between latitudes in
tropical and subtropical areas. Mangroves are important productive ecosystems in the
coastal areas. Mangrove ecosystems are rich in biodiversity and provide a wide range
of goods and services to human communities living in coastal areas including wood and
non-wood forest products, fisheries, medicines, tannins, apiculture, wildlife resources,
fishery, recreation, ecotourism, bio-filtration, nursery grounds, coastal protection, and
carbon sequestration. Mangroves are bio shields of the coast and protect people from
disasters like tsunamis, cyclones. Mangroves support shoreline protection, sediment
accretion and other functions. Mangroves are a rich source of fisheries, providing nursery
ground for many marine fishes and capture fisheries. It is the livelihood of many important
coastal communities.
Status of mangroves has been influenced by natural process including climate change
and manmade activities. Manmade activities such as reclamation, agriculture,
aquaculture, fuel wood, timber, damming, oil pollution and mining operation etc., degrade
the ecosystem function. Mangrove products and services are often undervalued or even
ignored in the economy, by industry and local inhabitants. Economic valuation of various
benefits out of mangroves is a useful tool to support conservation and the decisions of
mangrove ecosystem management and governance.
Mangrove cover in coastal areas of India is 559098.62 ha. They have been
discontinuously distributed in 42859 patches of the coastal areas. All coastal States and
UTs of India are distributed with mangrove ecosystems except, the UT of Lakshadweep.
There are many economic studies to value the goods and services of mangrove
ecosystem of the world. Using Benefit cost Transfer (BT) method, the values (existing
values) have been applied to estimate the economic benefits of India’s’ mangrove
patches (policy site). In this present study, ISE Division of NCSCM has estimated
aggregated economic value of India’s’ mangroves. Accordingly, economic values of
mangroves range between Rs. 92662/-/ha/yr. (minimum) and Rs. 3361144/-/ha/yr.
(maximum) with an average total economic benefit of goods and services of mangroves
to be Rs. 958766/ha-/yr. Regulatory services of mangroves contribute maximum (Avg.
Rs. 602074/-/yr./ha.) followed by support service (Rs. 287401/-/yr./ha.), provisional
service (Avg.Rs.36908/-/yr./ha.) and cultural service (Avg. Rs. 32383/-/yr./ha.).
Application of the maximum value estimated by the present study (NCSCM) TEV of
economic value of India mangroves amounts to 187921crore Rs. / yr. and average value
estimated from this study arrives to Rs. 53604 crore Rs./yr. Among the coastal States
and UTs, West Bengal has huge area (218209ha.) of mangroves which shares
20921crore Rs. / yr., economic value equivalent to about 39% of total mangrove benefit
out of economic share in the National Green Account has been described in this report.

2
1 INTRODUCTION
Mangroves are a group of trees and shrubs that live in the coastal intertidal zone. The
word ‘mangrove’ is usually referred to both vegetation and the habitat. Mangroves have
been called as tidal forest, swamp, wetland, and mangal (Spalding et al., 2010; FAO,
2007). Mangroves have been distributed in low-energy, tidal shorelines between
latitudes in tropical and subtropical areas (approximately between 30°N and 30°S).
Topography, fresh water flow, and substrate are the other important parameters for the
development of mangroves.
Mangroves are important productive ecosystems in the coastal areas (Lee et al., 2014).
Mangrove ecosystems are rich in biodiversity and provide a wide range of goods and
services to human communities living in coastal areas including wood and non-wood
forest products, fisheries, medicines, tannins, apiculture, wildlife resources, fishery,
recreation, ecotourism, bio-filtration, nursery grounds, coastal protection, and carbon
sequestration. Mangroves are bio shields of the coast and protecting people from
disasters like tsunamis, cyclones. Mangroves support shoreline protection, sediment
accretion and other functions (James Spurgeon., 2002). Mangroves are a rich source of
fisheries, providing nursery ground for many marine fishes and capture fisheries. It is
the livelihood of many important coastal communities.
Status of mangroves has been influenced by natural process including climate change
and manmade activities. Man-made activities such as reclamation, agriculture,
aquaculture, fuel wood, timber, damming, oil pollution and mining operation etc., degrade
the ecosystem function. To protect the mangrove ecosystems, CRZ 2011 Notification
classified the mangroves as Ecologically Sensitive Areas (ESAs) and restricts
development activities in the areas. The National Environment Policy (NEP., 2006) of
India has emphasised public investments for forest conservation including mangroves
and it recommends adopting community based practices.
Mangrove products and services are often undervalued or even ignored in the economy
by industry and local inhabitants (Ong and Gong. 2013). Mangrove ecosystem
destructions are mainly because; the conservation benefits of mangroves do not receive
adequate importance and there is very little understanding of the role mangroves in
economic systems. This has led to mangroves being considered as wastelands with little
use, and no value (IUCN. 2006). Economic valuation of various benefits out of
mangroves is a useful tool to support conservation and the decisions of mangrove
ecosystem management and governance (Lauran’s et.al. 2013).
This report estimated the value of various goods and services of mangrove ecosystem.
Recommendations to incorporate the value in various policy decisions have been given
in the final parts of this report.

3
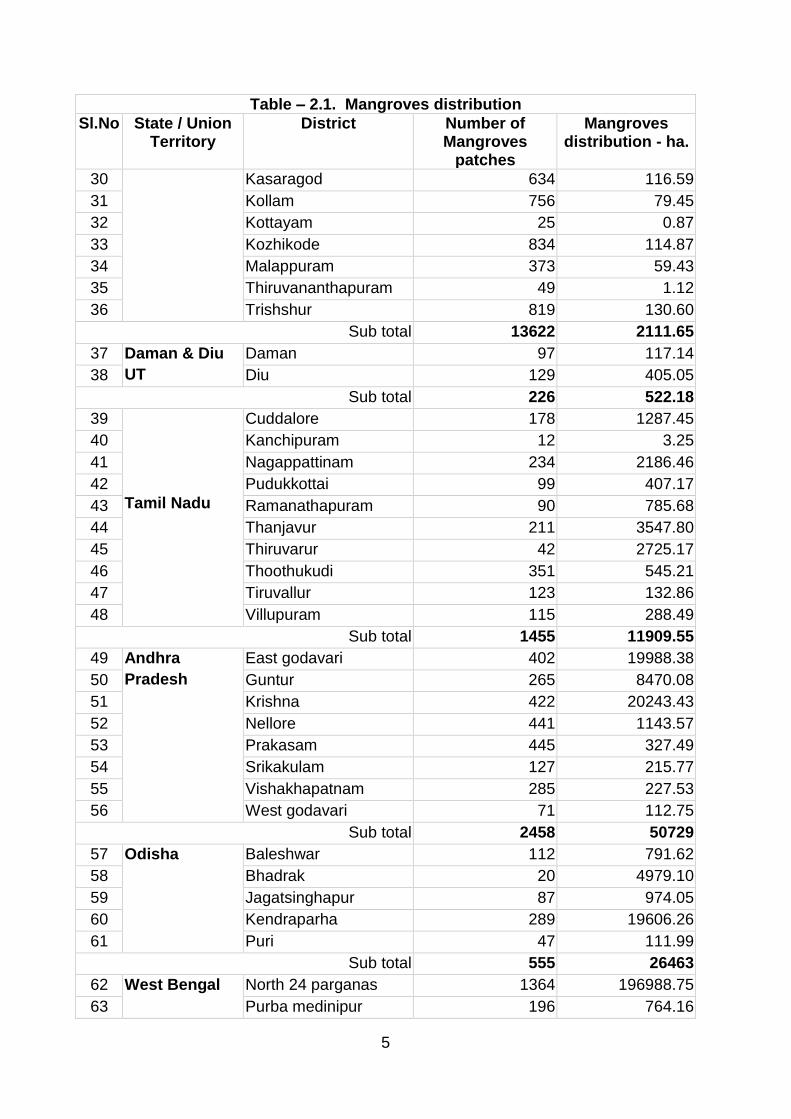
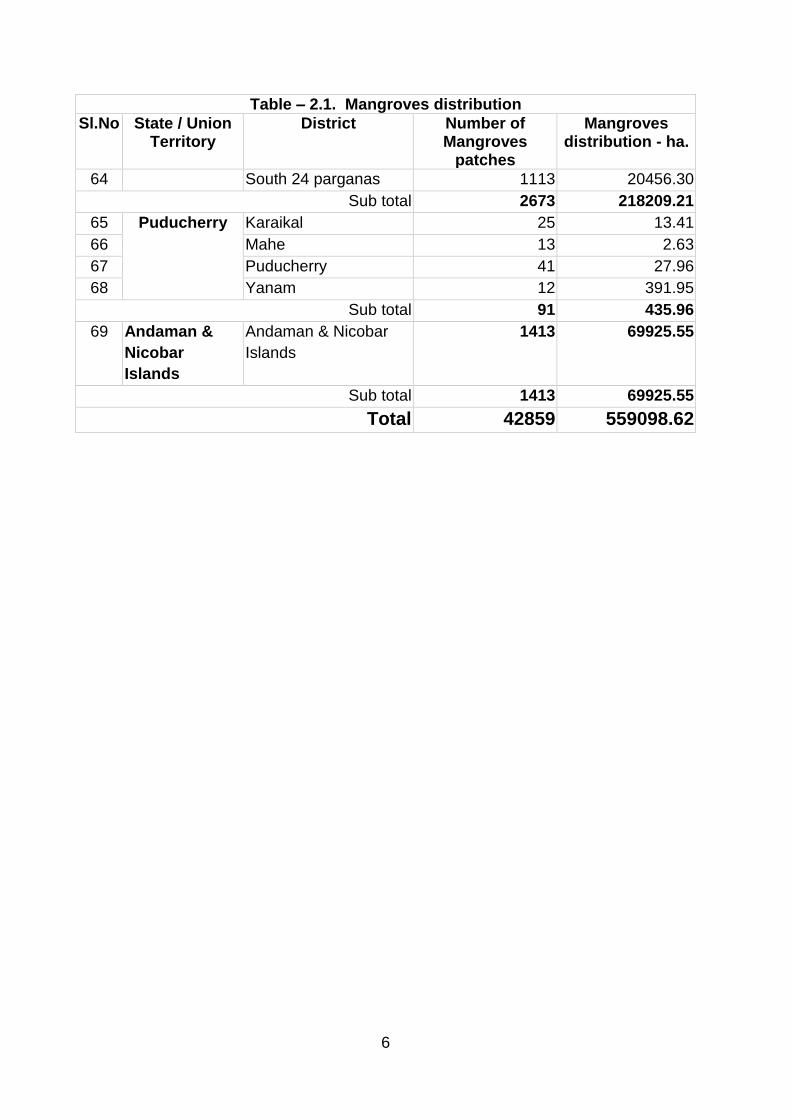
2 MANGROVES OF INDIA
All coastal States and UTs of India have mangrove ecosystems in the coastal areas
except the UT of Lakshadweep. Mangrove cover in coastal areas of India is 559098.62
ha and they have been discontinuously distributed in 42859 patches of the coastal areas
(NCSCM. 2015). Indian part of Sundarbans falling in West Bengal State has 218209ha
which is about 40% of total mangrove areas of India. North 24 Parganas district of West
Bengal has the most (196995 ha.) mangrove distributed (36%) district in India. Details
of mangrove patches in various coastal States and districts have been given in table –
2.1. Various mangrove patch locations in various coastal districts have been given below
The Indian mangroves comprise approximately 59 species in 41 genera and 29 families.
The species composition vary between east coast, west coast and island mangroves.
However, the uses and benefits out of mangroves are equal.
Mangrove Patches in Coastal States of India

4
The India’s’ mangroves provide a range of non-market as well as marketed goods and
services, both on and off-site. Various economic valuation methods were applied to the
various mangrove patches towards comprehensive assessment of many goods and
services of mangrove ecosystems of India and the same has been explained in the
following chapters.
Table – 2.1. Mangroves distribution
Sl.No State / Union Territory
District Number of Mangroves
patches
Mangroves distribution - ha.
1 Gujarat Ahmedabad 48 5885.96
2 Amreli 150 632.35
3 Anand 13 2822.22
4 Bharuch 77 5698.17
5 Bhavnagar 126 3507.90
6 Devbhumi Dwarka 231 9161.58
7 Gir Somnath 94 434.79
8 Jamnagar 530 20570.54
9 Kachchh 1410 34650.71
10 Morvi 287 9963.29
11 Navsari 186 2005.68
12 Porbandar 41 111.21
13 Rann of Kachchh 755 42808.99
14 Surat 179 3375.22
15 Valsad 436 504.62
Sub total 4563 142133.2
16 Maharashtra Mumbai city 46 255.84
17 Mumbai suburban 617 6430.48
18 Ratnagiri 1637 3176.43
19 Raygad 4476 13322.17
20 Sindhudurg 1154 1292.59
21 Thane 3882 7246.79
Sub total 11812 31724.29
22 Goa North goa 1614 2809.86
23 South goa 609 478.22
Sub total 2223 3288
24 Karnataka Dakshina Kannada 214 172.39
25 Udupi 574 368.02
26 Uttara Kannada 980 1106.47
Sub total 1768 1646.87
27 Kerala Alappuzha 1079 138.68
28 Ernakulam 5490 555.81
29 Kannur 3563 914.23
5
Table – 2.1. Mangroves distribution
Sl.No State / Union Territory
District Number of Mangroves
patches
Mangroves distribution - ha.
30 Kasaragod 634 116.59
31 Kollam 756 79.45
32 Kottayam 25 0.87
33 Kozhikode 834 114.87
34 Malappuram 373 59.43
35 Thiruvananthapuram 49 1.12
36 Trishshur 819 130.60
Sub total 13622 2111.65
37 Daman & Diu
UT
Daman 97 117.14
38 Diu 129 405.05
Sub total 226 522.18
39
Tamil Nadu
Cuddalore 178 1287.45
40 Kanchipuram 12 3.25
41 Nagappattinam 234 2186.46
42 Pudukkottai 99 407.17
43 Ramanathapuram 90 785.68
44 Thanjavur 211 3547.80
45 Thiruvarur 42 2725.17
46 Thoothukudi 351 545.21
47 Tiruvallur 123 132.86
48 Villupuram 115 288.49
Sub total 1455 11909.55
49 Andhra
Pradesh
East godavari 402 19988.38
50 Guntur 265 8470.08
51 Krishna 422 20243.43
52 Nellore 441 1143.57
53 Prakasam 445 327.49
54 Srikakulam 127 215.77
55 Vishakhapatnam 285 227.53
56 West godavari 71 112.75
Sub total 2458 50729
57 Odisha Baleshwar 112 791.62
58 Bhadrak 20 4979.10
59 Jagatsinghapur 87 974.05
60 Kendraparha 289 19606.26
61 Puri 47 111.99
Sub total 555 26463
62 West Bengal North 24 parganas 1364 196988.75
63 Purba medinipur 196 764.16
6
Table – 2.1. Mangroves distribution
Sl.No State / Union Territory
District Number of Mangroves
patches
Mangroves distribution - ha.
64 South 24 parganas 1113 20456.30
Sub total 2673 218209.21
65 Puducherry Karaikal 25 13.41
66 Mahe 13 2.63
67 Puducherry 41 27.96
68 Yanam 12 391.95
Sub total 91 435.96
69 Andaman &
Nicobar
Islands
Andaman & Nicobar
Islands
1413 69925.55
Sub total 1413 69925.55
Total 42859 559098.62

7
3 META ANALYSIS OF MANGROVE VALUATION
Meta-analysis is a method of synthesising the results of multiple studies to examine the
phenomenon, which is then ‘explained’ using regression techniques (Stanley, 2001).
Meta-analysis shall also be applied to identify the common goods and services of
mangrove ecosystem and value that by using benefit transfer method (Navrud and
Ready, 2007).
There are many economic analyses to value the goods and services of mangrove
ecosystem of the world (VO, Q.T., et.al. 2012). Using benefit cost transfer method, the
values (existing values) can be applied to estimate the economic benefits of India’s’
mangrove patches (policy site). These values can be applied to estimate the economic
loss of the damages caused on the mangrove ecosystems (Brouwer, 2000). These
values shall provide primary values for various goods and services of mangrove at low
cost and limited time (Rosenberger and Stanley, 2006).
Average physical quantities of goods and services or values from mangrove areas have
been analysed using 73 studies encompassing 352 observations by Marwa etal (2012).
Average quantities of mangrove goods and services (ha/yr.) and important goods and
services have been identified through the above study. Important goods and services
identified from the above study include fishery (fish, shellfish, molluscs), shrimp, timber,
fuel wood, charcoal, and carbon. The above quantitative and qualitative results can be
referred and applied for mangrove ecosystems.
TEV of mangrove habitat has been estimated by many studies, the global value was
estimated at US$181 billion (Alongi 2002), or US$10,000 ha-1 (Ronnback 1999). The
above value is the result of regression analysis of many studies. The above global
average for the mangrove ecosystems was evaluated by Brander et.al (2002) at US $
4185 ha/ yr. Similar to the global averages, country wise, and patch wise mangrove goods
and service values have been estimated. Total Economic Value of Mangroves of Mekong
basin region amounted to US$2,670/ha/year (Lucy Emerton., 2013); Rekawa mangrove–
lagoon, Sri Lanka was estimated at US$ 1088/ha/yr. (Gunawardena, M and J. S. Rowan.,
2005); Gazi mangroves, Kenya was estimated at US$ 1,092.3 ha-1y-1 (Janis Hoberg.,
2011); Ca Mau Province of Vietnam was estimated at US$3,000/ha/year (Vo Quoc Tuan.,
2013). In India, TEV of Pitchavaram mangrove (1100 ha.), Tamil Nadu was estimated at
Rs. 353, 52, 31,312 (Piyashi DebRoy and R. Jayaraman., 2012). Following the mangrove
valuation studies conducted all over the world, TEV of India’s’ mangrove patches have
been estimated. To get the TEV of mangroves, the goods and services have been
classified as provisional, regulation, cultural and supporting service followed by
Millennium Ecosystem Assessment (2005).

8
Figure 3.1. Various goods and services of mangrove ecosystem
3.1 Provisioning services of mangrove
Provisioning services are the goods that can be extracted from mangroves for human
requirements. Mangroves are highly productive ecosystems and they generate a number
of direct and indirect goods and services that are very useful to human being (Ruitenbeek,
1994). Coastal communities, especially fishermen depend on mangrove forests to fulfil
their needs for food and raw materials (Saenger 2002; Van Oudenhoven et.al. 2014).
Fishery, aquaculture support, timber, fuel wood, honey, pharmaceuticals, fodder etc.
(Nibedita Mukherjee et.al. 2014) are the important provisional services provided by the
mangroves. Economic values of various provisioning services of mangroves are
discussed below in the following chapters.
9
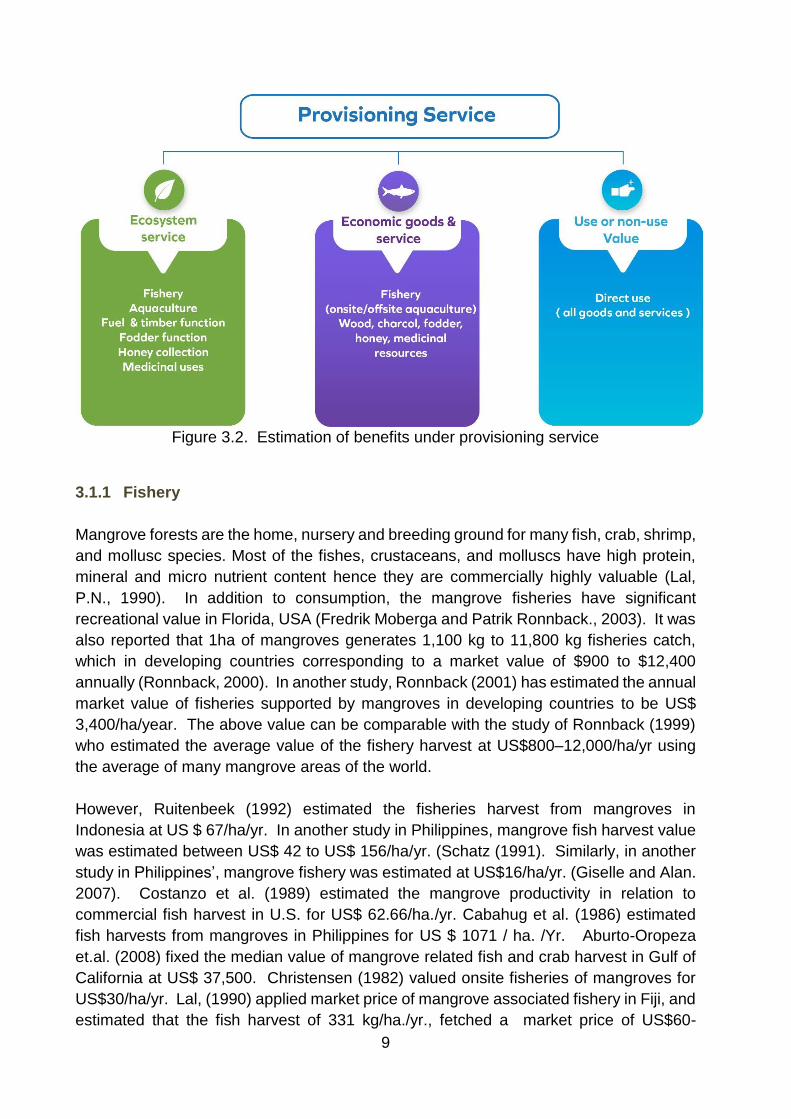
Figure 3.2. Estimation of benefits under provisioning service
3.1.1 Fishery
Mangrove forests are the home, nursery and breeding ground for many fish, crab, shrimp,
and mollusc species. Most of the fishes, crustaceans, and molluscs have high protein,
mineral and micro nutrient content hence they are commercially highly valuable (Lal,
P.N., 1990). In addition to consumption, the mangrove fisheries have significant
recreational value in Florida, USA (Fredrik Moberga and Patrik Ronnback., 2003). It was
also reported that 1ha of mangroves generates 1,100 kg to 11,800 kg fisheries catch,
which in developing countries corresponding to a market value of $900 to $12,400
annually (Ronnback, 2000). In another study, Ronnback (2001) has estimated the annual
market value of fisheries supported by mangroves in developing countries to be US$
3,400/ha/year. The above value can be comparable with the study of Ronnback (1999)
who estimated the average value of the fishery harvest at US$800–12,000/ha/yr using
the average of many mangrove areas of the world.
However, Ruitenbeek (1992) estimated the fisheries harvest from mangroves in
Indonesia at US $ 67/ha/yr. In another study in Philippines, mangrove fish harvest value
was estimated between US$ 42 to US$ 156/ha/yr. (Schatz (1991). Similarly, in another
study in Philippines’, mangrove fishery was estimated at US$16/ha/yr. (Giselle and Alan.
2007). Costanzo et al. (1989) estimated the mangrove productivity in relation to
commercial fish harvest in U.S. for US$ 62.66/ha./yr. Cabahug et al. (1986) estimated
fish harvests from mangroves in Philippines for US $ 1071 / ha. /Yr. Aburto-Oropeza
et.al. (2008) fixed the median value of mangrove related fish and crab harvest in Gulf of
California at US$ 37,500. Christensen (1982) valued onsite fisheries of mangroves for
US$30/ha/yr. Lal, (1990) applied market price of mangrove associated fishery in Fiji, and
estimated that the fish harvest of 331 kg/ha./yr., fetched a market price of US$60-

10
US$240/ha/yr., with an average of US$100/ha/year. In Egypt, the mangrove fishery value
was estimated at US$ 13,000/ha/yr. (Spurgeon, 2002). In Gazi mangroves of Kenya, the
value of mangrove fishery was estimated at Ksh 3,664/ha/yr., or an equivalent of US$ 44
ha/yr. (Janis Hoberg., 2011). Christense (1982) estimated the value of fish harvest in the
mangrove area of Thailand at US$0.30/ha/year. Lal (1990) estimated that annual
production of commercial fishery in Fiji mangroves is 147/kg and the value was estimated
between US$60 - US$240/ha/year. In Sri Lanka, Rekawa mangrove, lagoon fisheries
were estimated for US$ 493/ha/year (Gunawardena and Rowan. 2005). In the Millennium
Ecosystem Assessment, the market value of seafood from mangroves has been valued
at $7,500 to $167,500/km²/year (875/ha) (Millennium Ecosystem Assessment, 2005 cited
in UNEP-WCMC, 2006). In 1997, annual commercial fish harvests from mangroves were
valued $6,200 per km² in the United States to $60,000 per km² (331/ha) in Indonesia
(Bann, 1997).
There are many estimates on mangrove associated fishery economic value (offsite) that
were valued in the open water, near shore water and inshore waters around the
mangrove areas. Off-site fisheries of mangroves of Thailand were estimated at US $
189/ha/yr. (Christensen. 1982). In another study in Thailand, off-site fisheries were
estimated at US$ 92-147/ha/yr. (Sathirathai. 1998). A Gulf of California, USA mangrove
area fringes (offsite) economic value was estimated at US $37,500/ha (Aburto-Oropeza
et.al. 2008). Near shore fisheries of mangroves of Sri Lanka was studied by Ranasinghe
and Kallesoe (2006) and its value was estimated between US $ 4,861 to US $
12,964/ha/yr. It has been estimated that, income from the inshore fishing in the
mangroves of Ngoc Hien, Vietnam amounted to 50 USD/ ha/year (UNEP. 2015). In
Matang, west Malaysia, a 2006 study estimated that with fish catches averaging 1.3–8.8
kg an hour, a 400-km² managed mangrove forest supported a fishery worth $100.0 million
a year ($250,000/km²/year) (UNEP-WCMC, 2006). Christensen (1982) valued the offsite
fisheries of mangroves (Asia and Pacific) at US$100/ha/year. Mangrove area reduction
shall reduce the fishery harvest in the regions. Barbier (2007) valued the fishery reduction
using the mangrove reduction estimates of FAO and Thai Forests Department and
applied the value to the fishery harvest and estimated the loss to be USD 123/ha/yr. and
USD 3.1 ha/yr. respectively. Sathirathai and Barbier (2001) estimated US$21-69/ha/yr.
for the contribution of mangroves to offshore fisheries productivity.
In addition to general fisheries related valuation estimates, there are estimations for
individual groups such as molluscs, shrimps, crabs and echinoderms that are associated
with mangroves. Though this study focuses on general fisheries of mangroves the
special group values have also been listed for information for further special studies and
policy decisions. Giselle and Alan (2007) estimated the mangrove associated molluscs
and echinoderms (sea cucumber, sea urchin, etc.) for US$33/ha/yr. On-site crustacean
and mollusc harvests from mangroves of Vietnam were estimated for US $ 126/ha/yr.
(Nielson et al., 1998). Cabahug et al. (1986) estimated the molluscs harvested from
mangroves in Philippines for US $675 per ha per year.

11
It has been estimated that, in developing countries, the annual market of fisheries
supported by mangroves ranges from US$ 900 to US$ 12,400/ha/yr., with US$
3,400/ha/yr. as a mean (Ronnback, 2001). Shrimp fishery dependent on mangroves in
Pakistan was studied by Khalil (1999) and estimated its market value for US$ 100 million
per year. Shrimp harvest from mangroves of Bintuni Bay, Indonesia was estimated for a
price of US$94/ha/yr. Kapestky (1985) estimated the average yield of fish and shellfish
in mangrove areas to be about 90 kg/ha/yr., with the maximum of about 225 kg/ha/yr.
Cabahug et al. (1986) reported high valuation estimates for shrimp harvests from
mangroves in Philippines at US $ 254 per ha per year. Cabahug et al. (1986) also
estimated the economic value of crab harvested from mangroves in Philippines at US
$720 per year.
3.1.2 Aquaculture
Shrimps belonging to the
genus Penaeus have a life
cycle where they spawn at
sea and, after a few weeks,
the post larval shrimps settle
in inshore and estuarine
waters, which they use as
nurseries during their critical
early life stages (Dall et al.,
1990). The wild shrimp post
larvae (seed) that are stocked
in grow-out ponds are either
allowed to enter traditional
ponds with incoming tidal
waters or caught by seed
fishers and subsequently stocked in ponds. Shrimp post larvae can also be produced in
hatcheries, which depend upon continual inputs of wild-caught brood stock. The shrimp
hatchery industry is heavily dependent on the continuous input of wild-caught Penaeus
monodon spawners generated by mangrove ecosystems (Ronnback et.al. 2013). Apart
from shrimp post larvae and brood stock, mangrove ecosystems also provide feed inputs,
water quality maintenance (Ronnback 1999). Robertson and Phillips (1995) estimated
that 3 ha of mangrove forest would be required to filter the nitrogen and phosphorus loads
from effluents produced from 1 ha of semi intensive shrimp pond, and 22 ha of mangrove
forest would be required for 1 ha of intensive shrimp pond. It has been estimated that,
each hectare of mangrove in the Godavari River delta generated an annual Penaues
monodon spawer catch of 0.8 – 1.5 (gravid females), valued at US$ 92–184 ha.
Accordingly, the entire Godavari mangrove delta was estimated for partial gross
economic value of US$ 3.0–6.0 million per year for the provision of shrimp spawners
alone (Ronnback et.al. 2003).
Wild seed collection activity in Sagar Island, West Bengal
12
3.1.3 Fuelwood and timber function
Mangrove trees have been the source of firewood in India since ancient time
(Bandarnayake, WM., 1998). Because of the high specific gravity of rhizophoraceous
wood, the species of Rhizophora, Kandelia, Ceriops and Bruguiera are preferred for
firewood. The value of mangroves for fuel can be determined based on the cost of
alternative supplies of fuel (i.e. substitute price). Khalil (1999) estimated that the daily
household use of mangrove wood in Indu Delta, Karachi, Pakistan was 4.5
kg/household/day. At an average price of RS 1.45 per kg, it was estimated that the overall
value of mangrove fuel wood in the Indu Delta was estimated to be Rs 22.5 million per
year (approximately US$ 385,000/yr). Similarly, in Sri Lanka, household’s dependent
firewood was estimated as 20.5 kg/week which was equivalent to 982 kg/year. In the
local markets, the equivalent firewood sold for 1.2 Rs/kg was interpreted for annual value
of the harvest and it was estimated at US$24 /ha/year (Gunawardena, M and J. S.
Rowan., 2005).
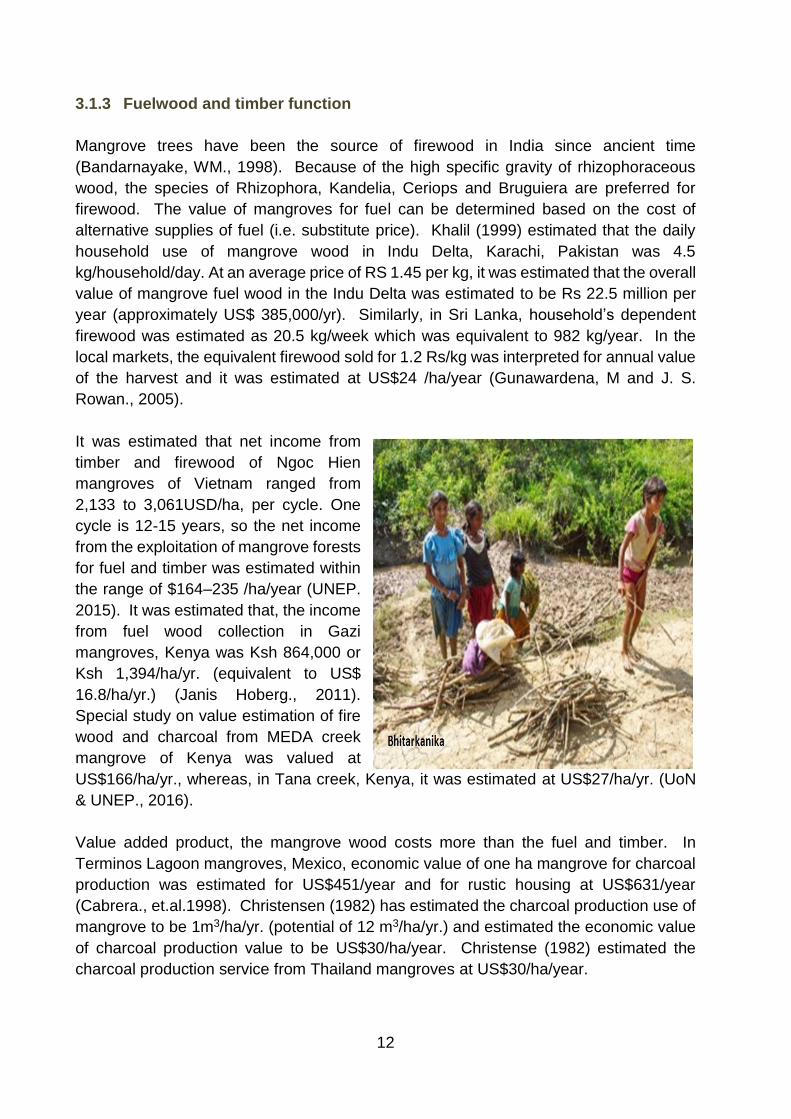
It was estimated that net income from
timber and firewood of Ngoc Hien
mangroves of Vietnam ranged from
2,133 to 3,061USD/ha, per cycle. One
cycle is 12-15 years, so the net income
from the exploitation of mangrove forests
for fuel and timber was estimated within
the range of $164–235 /ha/year (UNEP.
2015). It was estimated that, the income
from fuel wood collection in Gazi
mangroves, Kenya was Ksh 864,000 or
Ksh 1,394/ha/yr. (equivalent to US$
16.8/ha/yr.) (Janis Hoberg., 2011).
Special study on value estimation of fire
wood and charcoal from MEDA creek
mangrove of Kenya was valued at
US$166/ha/yr., whereas, in Tana creek, Kenya, it was estimated at US$27/ha/yr. (UoN
& UNEP., 2016).
Value added product, the mangrove wood costs more than the fuel and timber. In
Terminos Lagoon mangroves, Mexico, economic value of one ha mangrove for charcoal
production was estimated for US$451/year and for rustic housing at US$631/year
(Cabrera., et.al.1998). Christensen (1982) has estimated the charcoal production use of
mangrove to be 1m3/ha/yr. (potential of 12 m3/ha/yr.) and estimated the economic value
of charcoal production value to be US$30/ha/year. Christense (1982) estimated the
charcoal production service from Thailand mangroves at US$30/ha/year.

13
Mangrove forest produces construction materials and support subsistence economies of
coastal communities (Fredrik moberga and patrik Ronnback., 2003). In addition, they
have been used to construct local canoes (Wilson, J.S., 1858). Strength and durability
including pest and rot resistance make the mangrove wood suited for use in construction
(Kairo et al. 2002). Economic value of building materials extracted from MEDA creek,
Kenya mangrove ecosystem was valued at US$16/ha/yr., whereas, in Tana creek,
Kenya, mangrove timber was estimated at US$15/ha/yr. (UoN & UNEP., 2016). Export
price of mangrove wood of Indonesia cost about US$67/ha/yr. (Ruitenbeek. 1992).
Sathirathai, (1998) estimated the Thailand mangrove forest products at 140-1059
US$/ha/yr using economic assumption method. Lal (1990) estimated that annual
production forestry products from mangroves of Fiji for US$6/ha/yr. Gilbert AJ and
Janssen (1998) were estimated the wood market price of mangroves of many mangrove
areas and set value as 251 US$/ha/year. Tri (2000), estimated the annual value of wood
products from routine thinning to be US$34,438 or US$47.5/ha, while thatch obtained
from nipa palm is worth US$0.2/ha in Can Gio mangrove reserve, Vietnam.
3.1.4 Fodder function
Mangroves grazing ground for many cattle. Mangrove leaves are used for camel fodder
in Gujarat. Similarly, mangroves are used as camel fodder throughout northeast Africa,
Middle East and in Pakistan (Wilke, 1995). Khalil (1999) estimated that mangrove leaves
of the Indus, Pakistan are very nutritious, and it helps food support to 16,000 camels and
11,000 cattle. Faya (1993) studied nutritional value of Avicennia marina for browsing
animals and indicated that it has poor nutritional value when it was given as a lone feed
while, it was also given with alternative fodder, and it is a nutritious source of cattle food.
The most suitable valuation technique would be based on the volume of leaves eaten
and the market price of providing an equivalent amount of fodder (i.e. substitute product
price) (James Spurgeon., 2002). Based on data from a household survey it was
estimated that the Indus delta yielded 2 million kg of fodder per year worth RS 2.56 million
per year, based on a price of RS 1.25 per kg of mangrove fodder. Memon reports that
Mangrove harvest for charcoal and timber in Kuala Sepetang, Malaysia
Mangrove charcoal, Vietnam

14
the area of mangrove forests was 263,000 hectares in 1977 and 158,500 ha (392,000
acres) in 1990. This will value the use of mangrove as fodder at US$16.15 ha/yr.
3.1.5 Honey collection
The links between bees and mangroves are inextricable and have been exploited by
humans for thousands of years. Since the mangroves naturally provide a safe habitat by
providing year round supply of nectar, pollen, unlimited water source, stability of trees,
resilience against forest fires and deters termites and ants (Jonathan Baines and Manon
Whittaker., 2016). Honey collection from the mangrove forest is a traditional activity in
India.
It has been estimated that Sundarbans mangrove alone produce 111 tons of honey
annually (http://www.niobioinformatics.in/mangroves/MANGCD/fact.htm visited on
13/03/2017). Honey and bee wax contribute around Rs. 4500 (3.5%) on an average to
the average annual household income in the Sunderban villages (Anshu Singh et.al.
2010). About 35,000 tonnes of honey was collected from the India part of Sundarbans
mangrove forests last year and sold through the State’s Forest Development Corporation
(Debashis Chattopadh., 2003). Sundarbans tiger reserve of India has estimated that
honey collection during 2014-15 was 47,412 kg and it was sold for Rs. 47, 41,200 /-
(http://sundarbantigerreserve.org/urls/non-timber-forest-produce.html# visited on
14/03/2017).
India’s part of Sundarbans mangrove covers an area of about 426200 ha and the honey
potential in this area can be estimated for Rs. 11/ha. According to Tri et al (1998) around
0.2 kg/ha/yr. of honey can be collected from mangroves in Vietnam. The value was based
on potential volumes of honey produced and the market price (US$ 4 to 5 per kg in Cairo)
of honey. After deducting the production cost, the value was estimated at US$ 0.8 to
1/ha/yr. Economic value of honey collection from MEDA creek of Kenya mangrove was
estimated at US$22/ha/yr., whereas, in Tana creek mangroves of Kenya it was estimated
at US$2/ha/yr. (UoN & UNEP., 2016). The values have been applied to total mangrove
areas of India and have been incorporated in the table 4.1
Mangrove are grazing for camels, Kutch district

15
3.1.6 Medicinal uses
Extracts and chemicals from mangroves are used mainly in folkloric medicine (e.g. bush
medicine), as insecticides and pesticides and these practices continue to this day
(Bandaranayake, 1998). Ethno-botanical studies revealed therapeutic potential of nearly
17 applications from eleven plant species of mangrove and associated species including
medicinal properties to treat different diseases and ailments. The important traditional
therapeutic applications of mangrove in Pitchavaram fishing community are; cure for
snakebite, Small pox, ulcer, detoxification, birth control, urinary disorders, stomach
disorders, tumour inhibitors, jaundice, malaria, toothache, skin diseases, diarrhoea,
nausea, vomiting, cholera etc. (Ravindran et.al. 2005). Extracts from Rhizophora and
Avicennia spp have been used for making tonics, wines and fruit drinks. The leaves, fruits
and seeds of Avicennia marina have been used as vegetables. Extracts from Avicennia
marina are believed to cure rheumatism, smallpox and ulcers. Extracts from Rhizophora
mucronata are believed to cure diarrhoea, elephantiasis, haematoma, hepatitis and
ulcers (Bandaranayke, 1998). Rhizophora bark has been found to be important as a
source of tannins, used in leather work and for curing and dyeing of fishing nets made of
natural fibre (FAO, 1994).
Traditionally mangroves have been used for the treatment of diabetes (Bandaranayake,
2002; Revathi etal. 2013). Kathiresan et al. (2006) found biochemical components
related to the medicines of cancer and other diseases. Extracts from mangroves and
mangrove dependent species have proven effective against human, animal and plant
pathogens, but only limited investigations have been carried out to identify the
metabolites responsible for their bioactivities (Roome et al., 2011).
Ruitenbeek (1992) estimated that an annual benefit for medicinal plants of US$ 15/ha for
mangroves in Indonesia. In another study, pharmaceutical values of mangroves were
suggested for US$ 0.1 to US$ 60/ ha, using values of similar components of other studies
(Bann, 1997).
Mangrove honey is a popular product in USA Honey collection activity in Sundarbans Mangroves

16
3.2 Regulation services
The benefits that mangrove systems provide in terms of regulating services have been
acknowledged extensively. Regulating services that have been analysed in most detail
include water quality maintenance, storm, flood and erosion control and climate
regulation (Saenger 2002). Mangroves protect life and livelihoods of coastal communities
since they border the shoreline. They protect the coastal communities from coastal
extreme events such as floods, storms and tsunamis (Ong and Gong, 2013). It prevents
erosion and supports soil deposition. Mangroves filter the nutrients from river discharge.
Figure 3.3. Estimation of benefits under regulation service
It protects the coastal aquifers from seawater intrusion wastewater treatment and
pollution prevention through its biological activity of micro-organisms in the soil. It
sequesters greenhouse gases and regulate the global climate. It regulates air quality by
removing pollutants from the atmosphere. Details of various functions of mangroves
ecosystems are given the following chapters. To summarise, the regulation functions of
the mangroves have been classified under the following functions; (i) protection function
(ii) erosion prevention function (iii) soil deposition and nutrient enrichment function
(iv) water quality maintenance function and (v) carbon sequestration function. Details of
the various functions under the regulation services are given in the following chapters.
3.2.1 Protection function
Mangrove forests are natural barriers that protect life and livelihoods of coastal
communities from storms and cyclones (Gilbert and Janssen 1998). Generally mangrove
patches are predominant where the tropical cyclones are dominant and prone to
atmospheric disturbance (Storch and Woth 2008). Mangroves naturally form barriers and
thus inevitably provide some shore protection. Mangrove forests reduce risk from coastal
hazards, such as waves, storm surges, and tsunamis. They reduce flood depths and

17
wave heights, lessening damage to property behind mangrove forests. The level of risk
reduction depends on the type of hazard, as well as mangrove characteristics (World
Bank. 2016; Van Oudenhoven et.al. 2014; Bao, 2011). McIvor et al. (2012) analysed
several recordings of Louisiana during the Rita hurricane and found that the mangroves
reduce the water level by 15.8 cm per km. The most important characteristics that
determine mangrove areas’ ability to attenuate waves include the extent or width of the
forest, species composition, water depth, density and type of roots and branches, and
age of trees (Brinkman et al. 1997; Barbier et al., 2008; Gedan et al., 2011; Sandilyan
and Kathiresan, 2015). The protection service of mangroves are particularly important to
poor communities since they are less resilient to flooding and other damages (BCA,
FORES, FORWET. 2013). The mangroves protect the coastal communities from the
extreme coastal events such as tsunamis. Evidence from the 12 Indian Ocean countries
affected by the tsunami disaster, suggests that those coastal areas that had dense and
healthy mangrove forests suffered fewer losses and less damage to property than those
areas in which mangroves had been degraded or converted to other land uses (Wetlands
International, 2005; Chong, 2005).
While calculating the NPV of mangroves forest of India, it was estimated that 1 ha of
mangrove forests shall save 0.0148 lives (Verma M, N., etal., 2013). It was estimated
that the average opportunity cost of saving a life by retaining mangrove forests was 11.7
million rupees per life saved during the Orissa super cyclone (Das and Vincent. 2009).
The value of the mangrove buffer in Srilanka was estimated at 21,000 Rs/ha/year or US$
300/ha/year (Gunawardena, M and J. S. Rowan., 2005). Constanza and others (1997)
estimated the disturbance regulation function of mangroves at US$ 1800/ha/yr. In
southern Thailand, Sathirathai (1998) estimated the coastline protection service of
mangroves and valued it for US$3,000/ha/yr. Following the above estimate of southern
Thailand, Sathirathai and Barbier (2001) revisited the value and refined it to
US$3,679/ha/yr. However, Barbier et al. (2007) estimated an average value for the storm
protection value of mangroves of Thailand at $1879/ha/yr. The value of coastal protection
provided by mangroves in India has been estimated to be 653.98 billion Rs for 4, 62,763
ha or 1413207 Rs/ha/yrin 2013 price using benefit transfer (Kavi Kumar et.al. 2016)
Protection function of Ngoc Hien, Vietnam mangrove forests was valued between the
range of 742 and 756 USD/ha/yr (UNEP. 2015). Protection service of mangroves during
extreme events in south of Viet Nam was estimated at USD 5,000/km2/yr. (Tri et al.
1998). Using the estimates on the cost of house construction Koh Kapik, Vietnam being
suffered by storm destruction, the loss to property was equated with the protection service
of mangroves ad equated to beUS$391,816 (Bann. 1997).
Economic value of flood control protection service of MEDA creek, Kenya mangrove was
estimated at US$154/ha/yr (UoN & UNEP., 2016). Economic value of shoreline
protection service of mangroves in MEDA creek, Kenya was estimated at US$911/ha/yr.,
whereas, in Tana creek, Kenya, it was estimated at US$44/ha/yr. (UoN & UNEP., 2016).
While estimating restoration benefits of mangroves, Barbier (2009) estimated that flood

18
protection at $11000 per/ha. And suggested that restoration was profitable. Salem and
Mercer (2012) used meta-analysis to value the protection service of mangroves to be
10.45-8044 USD/ha/yr. Ranasinghe and Kallesoe (2006) and IUCN (2006) have
estimated the average values of protection service of mangroves in east coast of Srilanka
at US$ 3300 – 9500. The value of the shoreline protection function of panama village
mangroves, south east coast of Sri Lanka was estimated at US$ 392.5/haIUCN. 2006).
The protection value of mangrove forests of Orissa, India was estimated at Rs.51168/-
/ha/yr (Saudamini Das., 2009). Storm protection services of mangroves in Sri Lanka were
estimated at USD 8,000/km2/yr. (Batagoda 2003).
In Bhitarkanika of India, storm abatement function of mangroves was estimated at 116.28
US$/household using damage cost avoided method (Ruchi Badola and S A Hussain.,
2003). Strom surge protection using seawalls in Bamburi, Kenya to protect property
against the high sea storm surges cost around US$952/mtr with 1% maintenance cost
as equal to the mangrove protection service in the natural coast (UNEP, 2011). Further,
the shoreline protection value from severe weather events of Gazi mangroves, Kenya
was estimated at US$ 91.7/ha/yr (Janis Hoberg., 2011). Similar to that, the protection
service of 8000 metre length of Pitchavaram mangrove in India from tsunami was
estimated between Rs. 160,00,00,000 and Rs. 320,00,00,000 (without maintenance)
which is equivalent to Rs. 1454545 /ha to Rs. 2909090 /ha (Piyashi DebRoy and R.
Jayaraman., 2012).
3.2.2 Erosion prevention and soil accretion
Mangroves protect the coastlines from erosion, thus preventing the loss of producing land
service and the properties located (McIvor et al. 2013). Shoreline erosion and
deterioration have been reduced by mangrove by its ability to retain soil and stabilize the
sediment (BCA, FORES, and FORWET. 2013). Erosion protection function of mangrove
of Philippines was estimated at US$672/ha/yr. (Giselle and Alan. 2007; Samonte-Tan et
al., 2007). Ruitenbeek (1992) estimated the value of damage cost avoided for agriculture
farming by the erosion protection function of mangroves of Bintuni Bay, Indonesia at US$
240/ha.
Erosion in Goa – Agriculture and Land loss

19
In Indonesia, prevention of coastline erosion service of mangrove was estimated within
the range 1192 kUSD to 6475 kUSD or 694 USD/ha to 3767 USD/ha (Abdul Malik etal.,
2015). (Both erosion and sea water intrusion value)
Similarly, Christensen (1982) estimated erosion protection function of Asia–Pacific region
mangroves at $165/ha/year. Sathirathai and Barbier (2001) have estimated the cost of
constructing breakwaters to prevent coastal erosion in Southern Thailand and equated
the potential economic service of mangroves for US$3679/ha (coastline protection). A
2005 assessment of the Rekawa mangrove-lagoon ecosystem, Sri Lanka, found that the
Total Economic Value was about $1,088/ha/year, or $217,600/year based on 200-ha of
mangrove. Erosion control and buffer against storm damage accounted for $300/ha/year
or $60,000 per year (Gunawardena and Rowan, 2005).
Unit cost of constructing artificial breakwaters to prevent coastal erosion and damages
from storm surges was US$1011/mtr (1996 price). Based on the estimate, Barbier (2007)
estimated the erosion prevention service of mangroves of Thailand for protecting the
shoreline with a 75-metre width stand of mangrove to be approximately US$13.48 per
m2, or US$134800/ha (1996 prices) (Barbier., 2007). Shoreline loss after mangrove
removal and hard structures establishment and maintainance to protect Kenya coast was
estimated at US$ 20.81 m2/yr, US$ 395/ ha (Mark Huxham etal. 2015).
Soil deposition in Sundarbans mangroves

20
Mangroves are ‘land stabilizers’, where mangrove roots consolidate and accrete mineral
sediment. Although some studies have highlighted the ability of mangroves to prevent
coastal erosion, others consider coastal erosion prevention to be part of a bigger process,
namely soil surface elevation (McIvor et al. 2013). Soil surface elevation, in response to
sea level rise is an important ecosystem service provided by mangroves. Mangroves
slow water flows and reduce wave energy that allows deposition of sediment particles
and increased soil volume (Krauss et al. 2003, McIvor et al. 2013). Stabilization of
sediments provides protection to shorelines and associated shore based activities and
can lead to land gains (Spaninks & van Beukering 1997). Positive elevation change
allows mangrove vegetation to remain in the same relative position in the tidal frame as
sea levels rise over the long-term, and a reduction in sediment input is a key factor in
mangrove vulnerability to sea level (Lovelock etal., 2015). In Bhitakanika mangroves of
India, land accretion function was estimated to be 983795.7 US$ over a period of 111
years (Ruchi Badola and S AHussain., 2003).
3.2.3 Water quality maintenance
Mangroves help to purify and maintain freshwater sources in coastal areas. Further, it
acts as a barrier against siltation and pollution from land based sources, which protects
coral reefs, sea grass beds and the coastal wetlands (BCA, FORES, FORWET, 2013).
Water flow regulation and prevention of salt water intrusion to agriculture, aquaculture
and aquifers are important functions of the mangroves (Ilman et al. 2011; Semesi 1998).
Abdul Malik etal (2015) revealed that abrasion and seawater intrusion occurred in several
places in the region where mangroves are absent. Mangroves maintain coastal water
quality by abiotic and biotic retention, removal, and cycling of nutrients, pollutants, and
particulate matter from land-based sources, filtering these materials from water before
they reach seaward coral reef and seagrass habitats (Ewel etal., 1998).
Lal (1990) estimated the nutrient (waste) filtering service derived from Fiji mangroves
worth of US$5,820/ha / year using alternative cost approach. Harahab (2010), estimated
the mangrove service of prevention of seawater intrusion in to the coastal aquifers of
Probolinggo district, East Java for USD 7 kUSD/ha/year. In Indonesia protection of
aquifer and prevention of seawater service of mangroves were estimated at 476 kUSD
or 277 USD/ha, (Abdul Malik etal., 2015).
3.2.4 Carbon sequestration
Mangroves are the most productive and bio-geochemically active ecosystems and
important sinks of carbon in the biosphere (.2003; Ong 1993; Walters et al. 2008). The
carbon stock per unit area of mangrove forest are high since the photosynthesis rates of
mangrove trees and top layers of mangrove sediments store large amounts of organic
carbon (Alongi 2012; Bouillon et al., 2008). This carbon sequestration and storage
service by mangroves provides global benefits by removing the harmful greenhouse gas
carbon dioxide from the atmosphere (Meenakshi Jerath etal., 2012).

21
Ong (1993), reported that mangroves could store 100 to 200 ton C/ha above ground,
whereas below ground carbon can reach 700 ton C/1 m soil thickness/ha (with an
estimated carbon sink rate of 1.5 ton C/ha/year). A 20-year old plantation of Rhizophora
mangroves stores 11.6 kg m2 of carbon with a C burial rate of 580 g m2 /yr (Fujimoto
2000). It has been reported that the carbon sequestration potential of India mangrove
was estimated at 2.27 tC/ha/yr and the functioning of avoided emission was estimated at
1.61 tC/ ha/yr (Lucy Emerton., 2014). If mangrove ecosystems are influenced by
environmental change, the benefits accrued will be changed (Rebecca Shaw., etal.,
2011). Experimental work using small-scale forest cutting of mangrove forests lead to
the carbon loss of 4.85 tC/ha/yr by sediment following forest removal (Lang'at et al.,
2014).
The market price for carbon ranges from $6.86/tC in the Regional Greenhouse Gas
Initiative (RGGI) market in the United States to $75.24/tC in the European Union’s
Emissions Trading System (Meenakshi Jerath etal., 2012). It has been estimated that
the carbon sequestration potential of all mangroves of the globe were valued at
$30.50ha/yr (Chumra et al. 2003). Economic value of carbon sequestration service of
the mangroves of MEDA creek, Kenya was estimated at US$177/ha/yr (UoN & UNEP.,
2016). The economic value of carbon sequestration from mangroves in Ngoc Hien
District, Vietnam was about 325 USD/ha/year (UNEP., 2015). In southern Thailand,
carbon sequestration potential of mangroves was estimated at US$100/ha/yr
(Sathirathai, 1998). In Indonesia, carbon sequestration services were estimated at 945
kUSD to 1891 kUSD or 550 USD/ha to 1100 USD/ha. (Abdul Malik etal., 2015).
A study assumes a carbon price of US$ 7/ tonne, and estimated the Gazi mangroves,
Kenya ‘carbon sequestration potential to be US$ 126 ha/ yr (Janis Hoberg., 2011). De
Lopez et al (2001) estimated the carbon storage value of mangroves in Cambodia at US$
2/ha/yr (James Spurgeon., 2002). In India, Hirway and Goswami (2007) assumed the
carbon value as $ 150/ton C. The value of carbon sequestration provided by mangroves
in India has been estimated using direct market pricing average value 1.21 billion Rs for
4,62,763 ha or 2614 Rs/ha/yr in 2013 price (Kavi Kumar et.al. 2016) The value was
applied in Pichavaram mangroves (1158 ha), India by Piyashi DebRoy and R. Jayaraman
(2012) and estimated that the total carbon sequestered ranged between $ 3,303,000 and
Rs. 15,27,63,627/yr.
3.3 Cultural services
Cultural services of mangrove include economic benefits through aesthetic, spiritual,
recreational, education and other cultural values. Mangroves are traditionally and
culturally important habitat for many coastal communities and maritime peoples (Polunin
1983). Coast communities traditionally use the mangroves for firewood, constructions,
furniture, boats, fishing gear, folk medicine (e.g. bush medicine) and tannins. In addition,
mangrove ecosystems are attractive for recreation purposes especially, eco-tourists,
22
hunters, and birdwatchers (Hussain and Badola 2010; Janis Hoberg., 2011; Thiagarajah,
2015).
The traditional uses of mangroves have little information since they have not documented
(Bandaranayake. W.M., 1999) except recreation and tourism. Anthropologists have
mentioned that there was a strong spiritual link between mangrove forest and local
communities in many coastal communities of various coastal Nations. Mangroves were
viewed as dangerous as they were seen to be the refuge or hiding place of ‘dangerous’
indigenous communities (Birtles, T.G., 1997). In addition, Mangrove forests lands were
used as graveyard or burial ground among coastal communities especially aboriginals
(MacDonald, J.D., 1857; Wake, C.S., 1866; James, G.K., 2013).
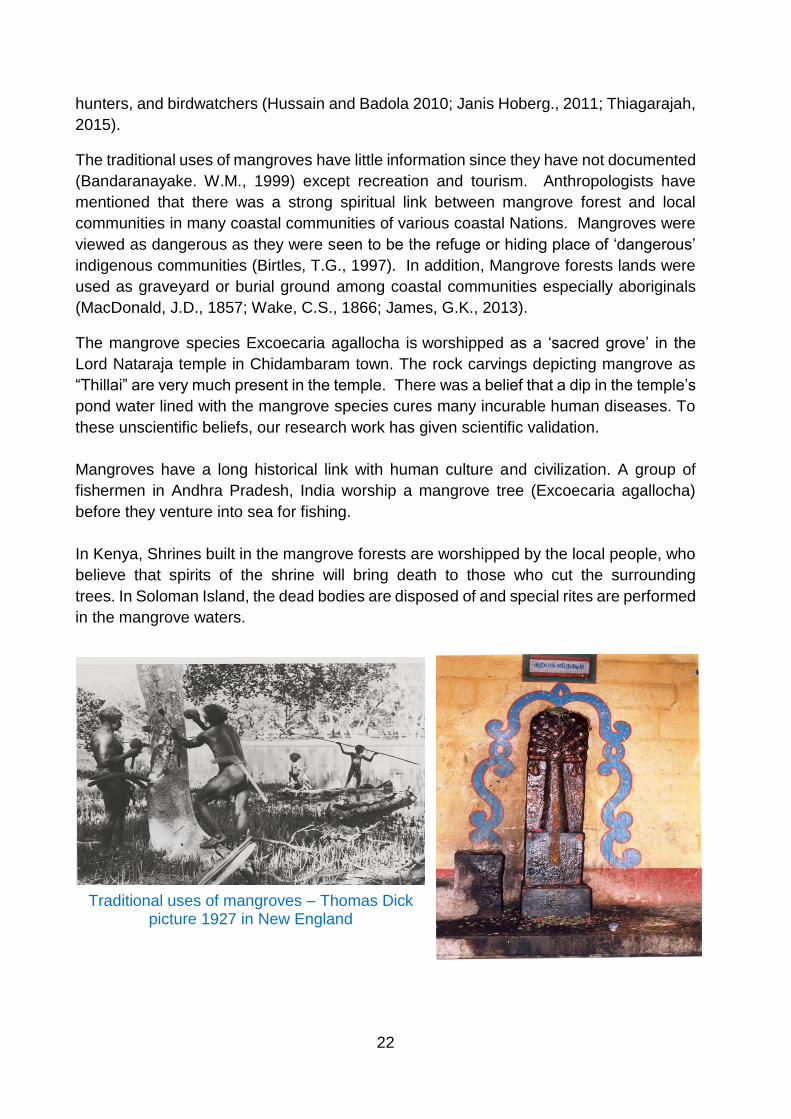
The mangrove species Excoecaria agallocha is worshipped as a ‘sacred grove’ in the
Lord Nataraja temple in Chidambaram town. The rock carvings depicting mangrove as
“Thillai” are very much present in the temple. There was a belief that a dip in the temple’s
pond water lined with the mangrove species cures many incurable human diseases. To
these unscientific beliefs, our research work has given scientific validation.
Mangroves have a long historical link with human culture and civilization. A group of
fishermen in Andhra Pradesh, India worship a mangrove tree (Excoecaria agallocha)
before they venture into sea for fishing.
In Kenya, Shrines built in the mangrove forests are worshipped by the local people, who
believe that spirits of the shrine will bring death to those who cut the surrounding
trees. In Soloman Island, the dead bodies are disposed of and special rites are performed
in the mangrove waters.
Traditional uses of mangroves – Thomas Dick picture 1927 in New England
23
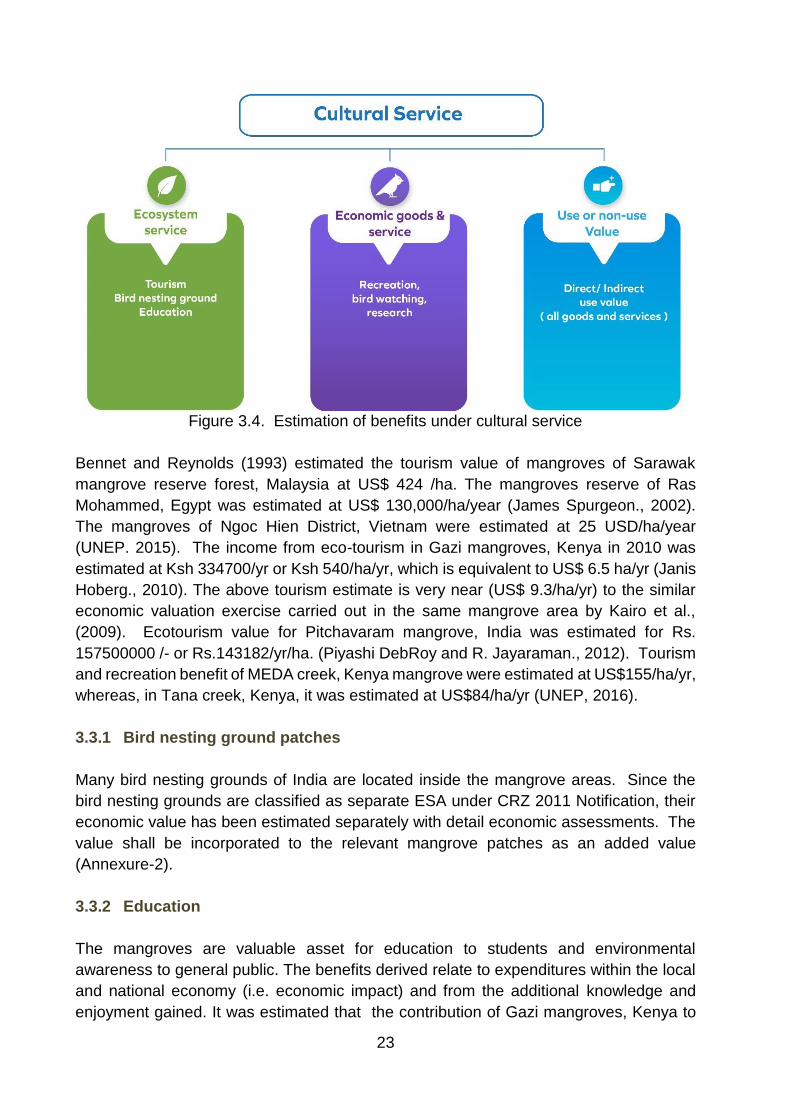
Figure 3.4. Estimation of benefits under cultural service
Bennet and Reynolds (1993) estimated the tourism value of mangroves of Sarawak
mangrove reserve forest, Malaysia at US$ 424 /ha. The mangroves reserve of Ras
Mohammed, Egypt was estimated at US$ 130,000/ha/year (James Spurgeon., 2002).
The mangroves of Ngoc Hien District, Vietnam were estimated at 25 USD/ha/year
(UNEP. 2015). The income from eco-tourism in Gazi mangroves, Kenya in 2010 was
estimated at Ksh 334700/yr or Ksh 540/ha/yr, which is equivalent to US$ 6.5 ha/yr (Janis
Hoberg., 2010). The above tourism estimate is very near (US$ 9.3/ha/yr) to the similar
economic valuation exercise carried out in the same mangrove area by Kairo et al.,
(2009). Ecotourism value for Pitchavaram mangrove, India was estimated for Rs.
157500000 /- or Rs.143182/yr/ha. (Piyashi DebRoy and R. Jayaraman., 2012). Tourism
and recreation benefit of MEDA creek, Kenya mangrove were estimated at US$155/ha/yr,
whereas, in Tana creek, Kenya, it was estimated at US$84/ha/yr (UNEP, 2016).
3.3.1 Bird nesting ground patches
Many bird nesting grounds of India are located inside the mangrove areas. Since the
bird nesting grounds are classified as separate ESA under CRZ 2011 Notification, their
economic value has been estimated separately with detail economic assessments. The
value shall be incorporated to the relevant mangrove patches as an added value
(Annexure-2).
3.3.2 Education
The mangroves are valuable asset for education to students and environmental
awareness to general public. The benefits derived relate to expenditures within the local
and national economy (i.e. economic impact) and from the additional knowledge and
enjoyment gained. It was estimated that the contribution of Gazi mangroves, Kenya to
24
research value per year is US$ 114,000 or US$ 184.4 ha-1y-1 (Janis Hoberg., 2011).
Economic value of education and research service of MEDA creek mangroves, Kenya
was estimated to be US$22/ha/yr (UoN & UNEP., 2016).
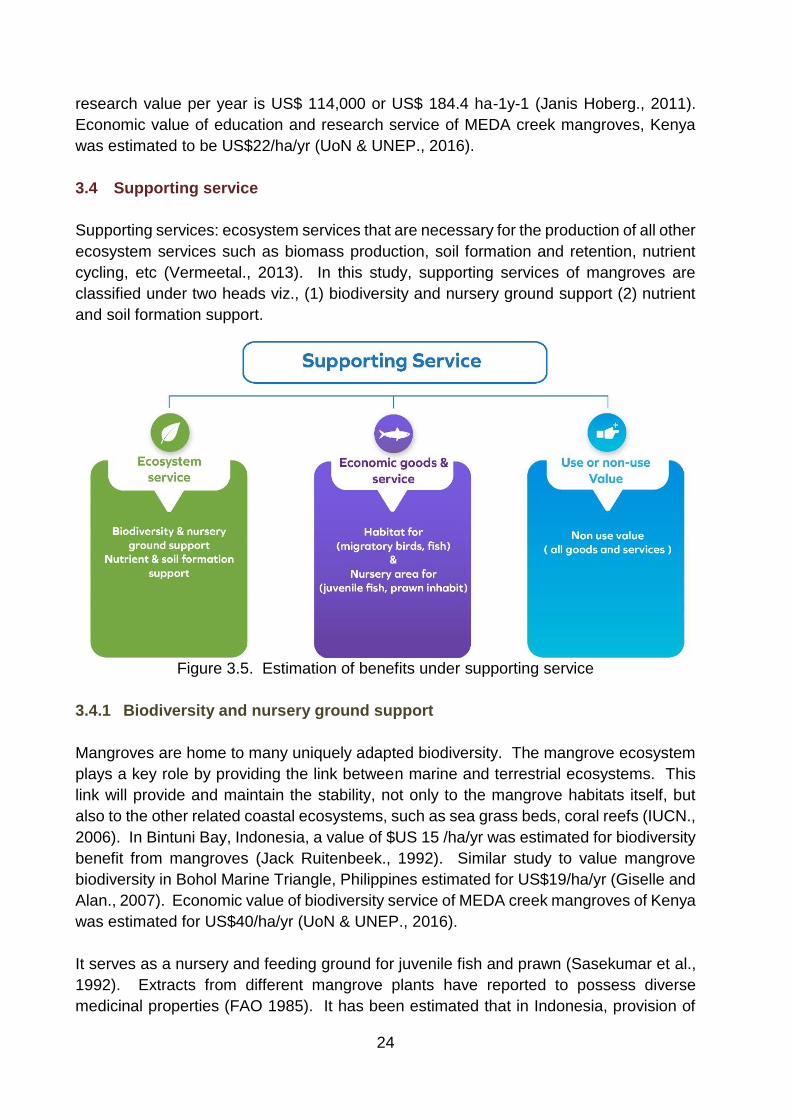
3.4 Supporting service
Supporting services: ecosystem services that are necessary for the production of all other
ecosystem services such as biomass production, soil formation and retention, nutrient
cycling, etc (Vermeetal., 2013). In this study, supporting services of mangroves are
classified under two heads viz., (1) biodiversity and nursery ground support (2) nutrient
and soil formation support.
Figure 3.5. Estimation of benefits under supporting service
3.4.1 Biodiversity and nursery ground support
Mangroves are home to many uniquely adapted biodiversity. The mangrove ecosystem
plays a key role by providing the link between marine and terrestrial ecosystems. This
link will provide and maintain the stability, not only to the mangrove habitats itself, but
also to the other related coastal ecosystems, such as sea grass beds, coral reefs (IUCN.,
2006). In Bintuni Bay, Indonesia, a value of $US 15 /ha/yr was estimated for biodiversity
benefit from mangroves (Jack Ruitenbeek., 1992). Similar study to value mangrove
biodiversity in Bohol Marine Triangle, Philippines estimated for US$19/ha/yr (Giselle and
Alan., 2007). Economic value of biodiversity service of MEDA creek mangroves of Kenya
was estimated for US$40/ha/yr (UoN & UNEP., 2016).
It serves as a nursery and feeding ground for juvenile fish and prawn (Sasekumar et al.,
1992). Extracts from different mangrove plants have reported to possess diverse
medicinal properties (FAO 1985). It has been estimated that in Indonesia, provision of
25
nursery ground service of mangroves were estimated for 1403 kUSD or 2292 USD/ha./
yr (Abdul Malik etal., 2015). In Bohol Marine Triangle, Philippines, supporting nursery
service of mangrove were estimated at US$243/ha/year (Giselle and Alan., 2007).
Economic value of the fish breeding and nursery service in MEDA creek, Kenya
mangrove ecosystem service was estimated at US$585/ha/yr, whereas, in Tana creek,
Kenya, it was estimated at US$626/ha/yr (UNEP., 2016).
3.4.2 Nutrient and soil formation support
Mangrove soils play an important role in uptake of N and P (Robertson and Phillips.,
1995). The waters around mangroves are generally rich in nutrients, as a result of the
organic matter produced by the trees and plants themselves, and also from the sediment
that is trapped around the roots. Mangroves produce about 1 kg litter/m2 annually, which
forms the basis of a complex food chain and some of which is exported with the tide
(Mumby et al., 2004). In Bhitakanika mangroves of India, the nutrient retention function
was valued for US$350 /acre/year (Ruchi Badola and S A Hussain ., 2003). Oyster reefs
are located inside mangroves, and counteract increases of nitrogen loading by promoting
bacterially mediated denitrification induced by concentrated bottom deposits of feces and
pseudofeces. Filtration by oysters also benefits submerged aquatic vegetation (SAV), a
habitat long recognized as critical for many fish species by filtering sediments and
phytoplankton from the water column—thereby increasing light penetration—and by
continuous fertilization of the benthic plants through deposition of bio deposits (Newell et
al. 2002). It has been estimated that the economic value of oyster reef services in nutrient
cycling was estimated at $5500 and $99,000 per hectare per year with an average of
10,325 US $/ha/yr. (Jonathan etal., 2012).

26
4 BENEFIT TRANSFER AND META-ANALYSIS OF MANGROVE ECOSYSTEM
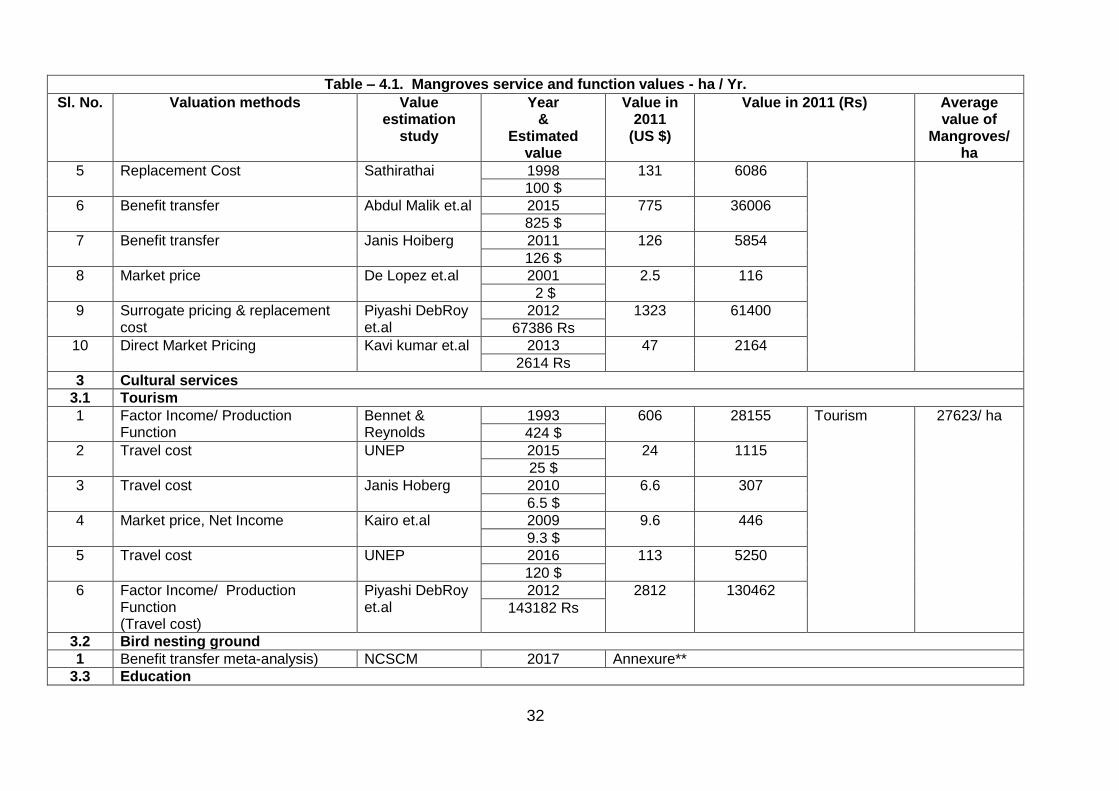
Table – 4.1. Mangroves service and function values - ha / Yr.
Sl. No. Valuation methods Value estimation
study
Year &
Estimated value
Value in 2011
(US $)
Value in 2011 (Rs) Average value of
Mangroves/ ha
1 Provisioning service
1.1 Fishery
1 Meta-analysis (Market Price method)
Ronnback 1999 8258 383666 on & off site fishery
18177/ ha
6400 $
2 Meta-analysis (Market Price method)
Ronnback 2000 8390 389799 6650 $
3 Meta-analysis (Market Price method)
Ronnback 2001 4194 194853 3400 $
4 Market Price Method UNEP-WCMC 2006 953 44276 On-site fishery 875 $
5 Market Price Method Bann 1997 438 20349
331 $
6 Market Price Method Ruitenbeek 1992 98 4553
67 $
7 Market Price Method Schatz 1991 148 6876
99 $
8 Benefit transfer method Giselle & Alan 2007 17 790
16$
9 Production function Costanza et al. 1989 101 4692
62.66 $
10 Market Price Method Cabahug et al. 1986 1895 88042
1071$
11 Market Price Method Christensen 1982 60 2788
30 $
12 Market Price Method Lal 1990 155 7201
100 $
13 Market / Shadow price Lal 1990 232 10779
150 $

27
Table – 4.1. Mangroves service and function values - ha / Yr.
Sl. No. Valuation methods Value estimation
study
Year &
Estimated value
Value in 2011
(US $)
Value in 2011 (Rs) Average value of
Mangroves/ ha
14 Market Price Method Janis Hoberg 2011 44 2044
44 $
15 Gross revenue Method
Gunawardena & Rowan
2005 554 25739
493 $
16 Production function Aburto-Oropeza etal.
2008 39036 1813610 Off-site fishery 37500 $
17 Production function UNEP-WCMC 2006 2742 126557
2500 $
18 Market Price Method (NPV) Spurgeon 2002 15793 733742
13000 $
19 Market Price Method Christensen 1982 379 17608
189 $
20 Market Price Method Christensen 1982 200 9292
100 $
21 Market Price Method Sathirathai 1998 157 7294
120 $
22 Market Price Method Ranasinghe & Kallesoe
2006 9712 451219
8913 $
23 Market Price Method UNEP 2015 47 2184
50 $
24 Market Price Method Barbier 2007 67 3113
63 $
25 Net factor income /production function
Sathirathai & Barbier
2001 56 2602
45 $
26 Market Price/ production function (molluscs & echinoderms)
Giselle &Alan 2007 35 1626 Individual species (crustacean & mollusc, shrimp, crab)
33 $
27 Market Price Method Nielson et al 1998 165 7666
126 $
28 Market Price Method Cabahug et al 1986 1194 55473
675 $

28
Table – 4.1. Mangroves service and function values - ha / Yr.
Sl. No. Valuation methods Value estimation
study
Year &
Estimated value
Value in 2011
(US $)
Value in 2011 (Rs) Average value of
Mangroves/ ha
29 Gross revenue Method Khalil 1999 121 5622
94 $
30 Market Price Method Kapestky 1985 285 13241
158
31 Market Price Method Cabahug et al. 1986 449 20861
254 $
32 Market Price Method
Cabahug et al. 1986 1274 59190
720 $
1.2 Aquaculture
1 Market Price/ production function
Ronnback etal 2003 164 7619 Shrimp spawner
7619 / ha
138 $
1.3 Fuel and timber function
1 Market Price Method Gunawardena, M & J. S. Rowan
2005 27 1254 Firewood 8531/ ha
24 $
2 Market Price Method Janis Hoberg 2011 16.8 781
16.8 $
3 Shadow price Ruitenbeek 1992 98 4553
67 $
4 Market Price Method Gilbert AJ and Janssen
1998 329 15285
251 $
5 Market Price Method Tri 2000 60 2788
47.5 $
6 Market Price/ UNEP 2015 188 8734
net factor income method 200 $
7 Market Price Method UoN & UNEP 2016 90 4181
97 $
8 Net Revenue Method Cabrera et.al 1998 709 32940
541 $
9 Market Price Method Christensen 1982 60 2788
30 $

29
Table – 4.1. Mangroves service and function values - ha / Yr.
Sl. No. Valuation methods Value estimation
study
Year &
Estimated value
Value in 2011
(US $)
Value in 2011 (Rs) Average value of
Mangroves/ ha
10 Market Price Method UoN & UNEP 2016 14 650
15.5 $
11 Cost and benefit analysis Sathirathai 1998 786 36518
600 $
12 Gross revenue (forestry products) Lal 1990 9 418
6 $
13 Net factor income Tri 2000 0.25 12 thatch
0.2 $
1.4 Fodder function
1 Substitute product price method
James Spurgeon
2002 20 929 Fodder 929/ ha
16.15 $
1.5 Honey collection
1 Market Price Method Sundarban tiger 2015 0.17 8 Honey 188/ ha
reserve.org 11Rs
2 Market Price Method Tri et.al 1998 1 46
0.9 $
3 Market Price Method UoN & UNEP 2016 11 511
12 $
1.6 Medicinal uses
1 Market Price Method Ruitenbeek 1992 22 1022 Medicine 1464/ ha
15 $
2 Direct market pricing Bann 1997 41 1905
31 $
2 Regulation services
2.1 Protection function
1 NPV Avoided mortality method
Verma & Das et.al
2009 4405 204656 Storm protection
310437/ ha
173333 Rs
2 Expected damage avoided Barbier et.al. 2007 1994 92641
1879 $
3 Benefit transfer method Batagoda 2003 95 4414

30
Table – 4.1. Mangroves service and function values - ha / Yr.
Sl. No. Valuation methods Value estimation
study
Year &
Estimated value
Value in 2011
(US $)
Value in 2011 (Rs) Average value of
Mangroves/ ha
80 $
4 Replacement cost Gunawardena et.al
2005 742 34473
21000 Rs
5 Damage avoided cost method Saudamini Das 2009 1300 60232
51168 Rs
6 Replacement cost
Piyashi DebRoy 2012 42919 1994013
2181818 Rs
7 Benefit transfer & net present value Barbier et.al. 2009 11364
11000 $
8 Benefit Transfer Kavi kumar et.al 2013 25259 1170011
1413207 Rs
9 Choice experiments approach UoN & UNEP 2016 142 6597 Coastline & shoreline protection
154 $
10 Cost benefit analysis Sathirathai 1998 3930 182588
3000$
11 Replacement cost Sathirathai & Barbier
2001 4538 210835
3679 $
12 Choice experiments approach UoN & UNEP 2016 443 20582
478 $
13 Damage cost avoided method IUCN 2006 428 19885
392.5 $
14 Damage cost avoided method Janis Hoberg 2011 91. 7 4260
91.7 $
15 Damage cost avoided method Ranasinghe et.al & IUCN
2006 6974 324012
6400 $
16 Contingent valuation method Costanza 1997 2384 110761 Overall protection service
1800 $
17 meta-analysis Salem and Mercer
2012 3954 183703
4027 $
18 Expected Damage Function UNEP 2015 703 32661

31
Table – 4.1. Mangroves service and function values - ha / Yr.
Sl. No. Valuation methods Value estimation
study
Year &
Estimated value
Value in 2011
(US $)
Value in 2011 (Rs) Average value of
Mangroves/ ha
749 $
2.2 Erosion prevention and soil accretion
1 Benefit transfer Giselle & Alan 2007 713 33126 Erosion prevention
19578/ ha
672 $
2 Damage cost avoided Ruitenbeek 1992 351 16307
240 $
3 Substitute Market price Christensen 1982 331 15378
165 $
4 Benefit transfer Mark Huxham et.al
2014 375 17422
395 $
5 Damage cost avoided Gunawardena et.al
2005 337 15657
300 $
2.3 Water quality maintenance
1 Alternative cost approach Lal 1990 9005 418372 Waste water filtering
254136 / ha
5820 $
2 Annual benefit value
Harahab 2010 7145 331956
7000 $
3 Replacement cost /benefit transfer Abdul Malik et.al 2015 260 12080 Sea water intrusion prevention
277 $
2.4 Carbon sequestration
1 Global market Chumra et.al. 2003 36 1673 Carbon sequestration
17923/ ha
price 30.50 $
2 Global Market price UoN &UNEP 2016 164 7619
177 $
3 Market price UNEP 2015 305 14170
325 $
4 Meta-analysis Salem & Mercer 2012 950 44137
967 $
32
Table – 4.1. Mangroves service and function values - ha / Yr.
Sl. No. Valuation methods Value estimation
study
Year &
Estimated value
Value in 2011
(US $)
Value in 2011 (Rs) Average value of
Mangroves/ ha
5 Replacement Cost Sathirathai 1998 131 6086
100 $
6 Benefit transfer Abdul Malik et.al 2015 775 36006
825 $
7 Benefit transfer Janis Hoiberg 2011 126 5854
126 $
8 Market price De Lopez et.al 2001 2.5 116
2 $
9 Surrogate pricing & replacement cost
Piyashi DebRoy et.al
2012 1323 61400
67386 Rs
10 Direct Market Pricing Kavi kumar et.al 2013 47 2164
2614 Rs
3 Cultural services
3.1 Tourism
1 Factor Income/ Production Function
Bennet & Reynolds
1993 606 28155 Tourism 27623/ ha
424 $
2 Travel cost UNEP 2015 24 1115
25 $
3 Travel cost Janis Hoberg 2010 6.6 307
6.5 $
4 Market price, Net Income Kairo et.al 2009 9.6 446
9.3 $
5 Travel cost UNEP 2016 113 5250
120 $
6 Factor Income/ Production Function (Travel cost)
Piyashi DebRoy et.al
2012 2812 130462
143182 Rs
3.2 Bird nesting ground
1 Benefit transfer meta-analysis) NCSCM 2017 Annexure**
3.3 Education

33
Table – 4.1. Mangroves service and function values - ha / Yr.
Sl. No. Valuation methods Value estimation
study
Year &
Estimated value
Value in 2011
(US $)
Value in 2011 (Rs) Average value of
Mangroves/ ha
1 Benefit transfer Janis Hoberg 2011 184.4 8567 Education 4760/ha
184.4 $
2 Choice experiment approach UoN & UNEP 2016 20.5 952
22 $
4 Supporting service
4.1 Biodiversity and nursery ground support
1
International transfers for rainforest
Ruitenbeek 1992 22 1022 Biodiversity 23625/ha
15 $
2 Benefit transfer Giselle & Alan 2007 20 929
19 $
3 Choice experiments approach UoN & UNEP 2016 37 1719
40 $
4 Benefit transfer Abdul Malik et.al 2015 2152 99982 Nursery
2292 $
5 Benefit transfer Giselle & Alan 2007 258 11987
243 $
6 A choice experiments approach UNEP 2016 562 26110
606 $
4.2 Nutrient and soil formation support
1 Benefit transfer Jonathan et.al 2011 10325 479698 Nutrient retention
263776/ ha
10325 $
2 Replacement cost approach Badola , Hussain
2003 1030 47854
865 $
Note: ** = values incorporated innesting grounds of birds report;() =converted to 2011 Indian Rs. value.

34
Table – 4.2. Average TEV for the Mangrove Habitat in 2011 Indian Rs/ ha/ Yr:
SI. No
Mangrove Ecosystem service
TEV Value in 2011 Rs/ ha/ Yr.
I. Provisioning service
1. Fishery 18177
2. Aquaculture 7619
3. Fuel and timber 8531
4. Fodder 929
5. Honey collection 188
6. Medicinal uses 1464
II. Regulating service
7. Protection function 310437
8. Erosion prevention & soil accretion 19578
9. Water quality maintenance 254136
10. Carbon sequestration 17923
III. Cultural service
11 Tourism 27623
12. Bird nesting ground Patch wise*
13. Education 4760
IV. Supporting service
14. Biodiversity & nursery ground support 23625
15. Nutrient & soil formation support 263776
TEV in 2011 Rs/ ha/ Yr. 958766
Note: *=value incorporated in nesting grounds of birds ESA
Aggregated economic value of India’s’ mangroves range between Rs.92662 /- / ha/yr.
(minimum) and Rs. 3361144/-/ha /yr (maximum). In meta-analysis, averages of various
services has been used to value total economic value per ha. /year. consequently,
average total economic benefit out of goods and services of mangroves amounts to
Rs.9,58,766/- / yr. ha. This value is very close to the similar TEV study on mangroves
conducted by global meta-analysis estimate by Salem & Mercer (2012) 13,07,568 Rs /
ha/ Yr) amounts to 28,144$/ ha/yr (value converted for 2011). Similarly net present value
of global mangroves estimated by Abdul Malik et al (10,80,286 Rs/ ha/ Yr) amounts to
23,252$/ ha/yr (value converted for 2011). Also compared with Southeast Asian country
(Thailand) net present value ranges from 27,400$ to 37500$/ ha/ yr as estimated by
Sathirathai & Barbier (2001). Similarly the maximum value of 33,61,144/-/ha /yr is close
to TEV study on mangroves conducted by Costanza (2014). His estimated TEV value of
mangroves is 194,000 $/ha/yr.
35
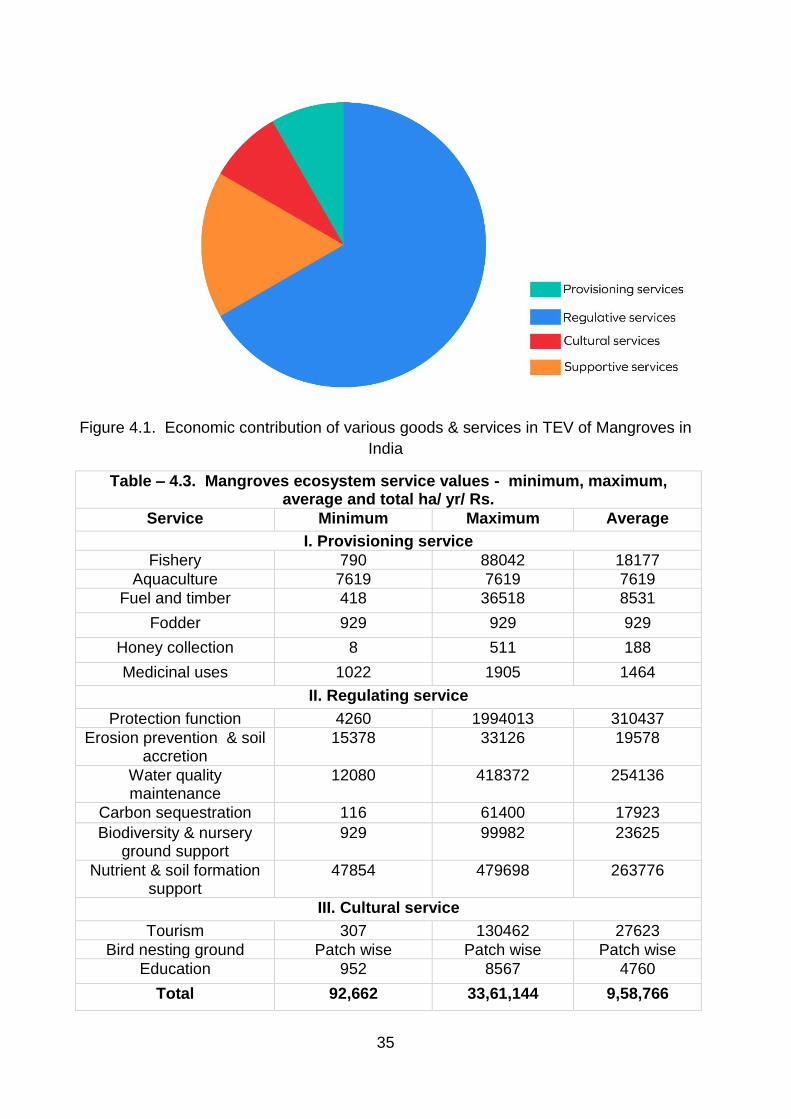
Figure 4.1. Economic contribution of various goods & services in TEV of Mangroves in
India
Table – 4.3. Mangroves ecosystem service values - minimum, maximum, average and total ha/ yr/ Rs.
Service Minimum Maximum Average
I. Provisioning service
Fishery 790 88042 18177
Aquaculture 7619 7619 7619
Fuel and timber 418 36518 8531
Fodder 929 929 929
Honey collection 8 511 188
Medicinal uses 1022 1905 1464
II. Regulating service
Protection function 4260 1994013 310437
Erosion prevention & soil accretion
15378 33126 19578
Water quality maintenance
12080 418372 254136
Carbon sequestration 116 61400 17923
Biodiversity & nursery ground support
929
99982
23625
Nutrient & soil formation support
47854 479698 263776
III. Cultural service
Tourism 307 130462 27623
Bird nesting ground Patch wise Patch wise Patch wise
Education 952 8567 4760
Total 92,662 33,61,144 9,58,766

36
Mangroves economic benefits through various services and functions of India are given
in table 4.3. Accordingly, the regulatory service contribute maximum (Avg. Rs. 602074/-
/ yr/ha.) followed by support service (Rs. 287401/- / yr/ha.), provisional service (Avg.Rs.
36908/- / yr/ha.) and cultural service (Avg. Rs32383/- / yr/ha.), Chart – fig 6 describe
various service contribution in economic values of mangroves services.
Figure 4.2. Comparative values - Present study and other significant international
studies
Economic values of mangroves using global average estimate (Costanza. 2014), India’s
mangroves total value is 5062067723508 (506206 crore) Rs. /yr. Application of the
maximum value estimated by this present study (NCSCM) for India mangroves is
1879210972021(187921 crore) Rs. / yr. Average value estimated from this study value
the India’s’ mangroves at 536044746143(53604 crore) Rs. /yr. Chart fig 7 shows the
comparative economic value given in various global studies and NCSCM study estimate.
Among the coastal States and UTs, West Bengal has huge area (218209 ha.) of
mangroves which shares 209211573934 (20921 crore)Rs. / yr. which is 39 % of total
mangroves benefit out of National Green Account. State / UTs mangroves economic
share in National Green Account is given in Table 4.4.

37
Table – 4.4. Total economic value of mangroves services Rs. / Yr.
S. No
State / Union Territories
Mangroves distribution - ha
Total Economic Value of Mangroves
1. Gujarat 142133.23 136272508720
2. Maharashtra 31724.29 30416180101
3. Goa 3288.07 3152498728
4. Karnataka 1646.87 1578969328
5. Kerala 2111.65 2024585519
6. Diu & Daman 522.18 500650163
7. Tamil Nadu 11909.55 11418474666
8. Andhra Pradesh 50729 48637249507
9. Odisha 26463 25371835947
10. West Bengal 218209.21 209211573934
11. Pondicherry 435.96 417981288
12. Andaman & Nicobar Island
69925.55 67042238243
Total 559098.62 536044746143 (53604 crore)
Table – 4.5. Mangroves – Indian Coastal Districts Patch wise valuation
Sl. No.
State / Union Territory
District Mangroves
distribution - ha.
TEV Value/year
2011 price
1
Gujarat
Ahmedabad 5885.96 5643261424
2 Amreli 632.35 606278201
3 Anand 2822.22 2705846102
4 Bharuch 5698.17 5463213436
5 Bhavnagar 3507.9 3363251763
6 Devbhumi Dwarka 9161.58 8783808093
7 Gir Somnath 434.79 416860463
8 Jamnagar 20570.54 19722330311
9 Kachchh 34650.71 33221923298
10 Morvi 9963.29 9552466462
11 Navsari 2005.68 1922977727
12 Porbandar 111.21 106628745
13 Rann of Kachchh 42808.99 41043808467
14 Surat 3375.22 3236044817
15 Valsad 504.62 483809413
Sub Total 142133 136272508720
16
Maharashtra
Mumbai city 255.84 245291887
17 Mumbai suburban 6430.48 6165326528
18 Ratnagiri 3176.43 3045448820
19 Raygad 13322.17 12772843138
20 Sindhudurg 1292.59 1239291928
21 Thane 7246.79 6947977799
Sub Total 31724.3 30416180101
22 Goa North goa 2809.86 2693998966

38
Table – 4.5. Mangroves – Indian Coastal Districts Patch wise valuation
Sl. No.
State / Union Territory
District Mangroves
distribution - ha.
TEV Value/year
2011 price
23 South goa 478.22 458499762
Sub Total 3288 3152498728
24
Karnataka
Dakshina Kannada 172.39 165282936
25 Udupi 368.02 352845224
26 Uttara Kannada 1106.47 1060841168
Sub Total 1646.88 1578969328
27
Kerala
Alappuzha 138.68 132961302
28 Ernakulam 555.81 532893350
29 Kannur 914.23 876536143
30
Kasaragod 116.59 111784976
31 Kollam 79.45 76172216
32 Kottayam 0.87 832576
33 Kozhikode 114.87 110137565
34 Malappuram 59.43 56978556
35 Thiruvananthapuram 1.12 1075140
36 Trishshur 130.6 125213693
Sub Total 2111.65 2024585519
37
Tamil Nadu
Cuddalore 1287.45 1234364804
38 Kanchipuram 3.25 3118541.574
39 Nagappattinam 2186.46 2096308262
40 Pudukkottai 407.17 390376030.5
41 Ramanathapuram 785.68 753287112.1
42 Thanjavur 3547.8 3401510329
43 Thiruvarur 2725.17 2612799946
44 Thoothukudi 545.21 522729094
45 Tiruvallur 132.86 127386420
46 Villupuram 288.49 276594126
Sub Total 11909.54 11418474666
47
Andhra Pradesh
East godavari 19988.38 19164180894
48 Guntur 8470.08 8120827599
49 Krishna 20243.43 19408711957
50 Nellore 1143.57 1096413574
51 Prakasam 327.49 313989798
52 Srikakulam 215.77 206872794
53 Vishakhapatnam 227.53 218148488
54 West godavari 112.75 108104403
Sub Total 50729 48637249507
55
Odisha
Baleshwar 791.62 758978801
56 Bhadrak 4979.1 4773788575
57 Jagatsinghapur 974.05 933885611
58 Kendraparha 19606.26 18797813467
59 Puri 111.99 107369493

39
Table – 4.5. Mangroves – Indian Coastal Districts Patch wise valuation
Sl. No.
State / Union Territory
District Mangroves
distribution - ha.
TEV Value/year
2011 price
Sub Total 26463.02 25371835947
60
West Bengal
North 24 parganas 196988.75 188866118181
61 Purba medinipur 764.16 732647231
62 South 24 parganas 20456.3 19612808522
Sub Total 218209.21 209211573934
63 UT Daman 117.14 112306130
64 Diu & Daman Diu 405.05 388344033
Sub Total 522 500650163
65
UT Puducherry
Karaikal 13.41 12856237
66 Mahe 2.63 2522244
67 Puducherry 27.96 26809857
68 Yanam 391.95 375792949
Sub Total 435.95 417981288
69 Andaman &
Nicobar Islands Andaman & Nicobar Islands
69925.55 67042238243
Sub Total 69925.55 67042238243
Total 559098 536044746143
(53604 crore)
5 CONCLUSION
Mangroves are important productive ecosystems in the coastal areas. The India’s’
mangroves provide a range of non-market as well as marketed goods and services, both
on and off-site. Mangrove products and services are often undervalued or even ignored
in the economy, by industry and local inhabitants. Economic valuation of various benefits
out of mangroves is a useful tool to support conservation and the decisions of mangrove
ecosystem management and governance. Economic values of mangroves range
between Rs. 92662/-/ha/yr. (minimum) and Rs. 3361144/-/ha/yr. (maximum) with an
average total economic benefit of goods and services of mangroves to be Rs. 958766/ha-
/yr. Application of the maximum value estimated by the present study (NCSCM) TEV of
economic value of India mangroves amounts to 187921crore Rs. / yr. and average value
estimated from this study arrives to Rs. 53604 crore Rs./yr. Among the coastal States
and UTs, West Bengal has huge area (218209ha.) of mangroves which shares
20921crore Rs. / yr., economic value equivalent to about 39% of total mangrove benefit
out of economic share in the National Green Account.
40
6 REFERENCES
Asia Pacific School of Economics and Government.Environmental Management and
Development, WORKING PAPERS, AUSTRALIAN NATIONAL UNIVERSITY, pages 1-43.
Abdul Malik., Rasmus Fensholt., and Ole Mertz., 2015. Economic Valuation of Mangroves for
Comparison with Commercial Aquaculture in South Sulawesi, Indonesia. Forests 6, 3028-3044
Aburto-Oropeza, O. Ezcurra, E.Danemann, G.Valdez, V.Murray, J.Sala, E., 2008. “Mangroves
in the Gulf of California increase fishery yields” Proceedings of the National Academy of Sciences
of the United States (PNAS), 105(30): 10456–10459
Adger, W.N., Kelly, P.M. & Tri, N.H., 1997.Valuing the products and services of mangrove
restoration. Commonwealth Forestry Review 76(3): 198–202.
Ahmad, S., 2009.Recreational values of mangrove forest in Larut Matang, Perak. Journal of
Tropical Forest Science 21(2): 81–87.
Alongi DM., 2002. Present state and future of the world’s mangrove forests. Environmental
Conservation 29:331–349
Alongi, D. (2008). Mangrove forests: Resilience, protection from tsunamis, and responses to
global climate change. Estuarine Coastal and Shelf Science, 76, 1-13.
Alongi, D. M. 2012. Carbon sequestration in mangrove forests. Carbon Management 3: 313-322
Alongi, D.M., 2014. Carbon cycling and storage in mangrove forests. Ann. Rev. Mar. Sci. 6, 195
- 219
Altaf A. Memon (May 14–19, 2005). "Devastation of the Indus River Delta".World Water &
Environmental Resources Congress 2005. Anchorage, Alaska: American Society of Civil
Engineers. World Wildlife Fund.
Anshu Singh, Prodyut Bhattacharya, Pradeep Vyas, and Sarvashish Roy., 2010.Contribution of
NTFPs in the Livelihood of Mangrove Forest Dwellers of Sundarban. J Hum Ecol, 29(3): 191-
200.
Assessment from Cameroon. Central Africa Biology 1: 617-638.
Aylward, B, 1993, The economic value of ecosystems: 3 – biological diversity, Report LEEC GK
91-03, International Institute for Environment and Development, London, UK.
Badola, R., Hussain, S.A., 2005.Valuing ecosystems functions: an empirical study on the storm
protection function of Bhitarkanika mangrove ecosystem, India. Environ. Conserv. 32, 85–92.
Balasooriya, S.J., Sotheeswaran, S. and Balasubramanium, S., 1982. Economically useful plants
of Sri Lanka. Part IV. Screening of Sri Lanka plants for tannins. Journal of the National Science
Council, Sri Lanka 10(2):213-219.
Bandaranayake WM, 2002. Bioactivities, bioactive compounds and chemical constituents of
mangrove plants. Wetlands Ecol. Manage, 10, 421–52.
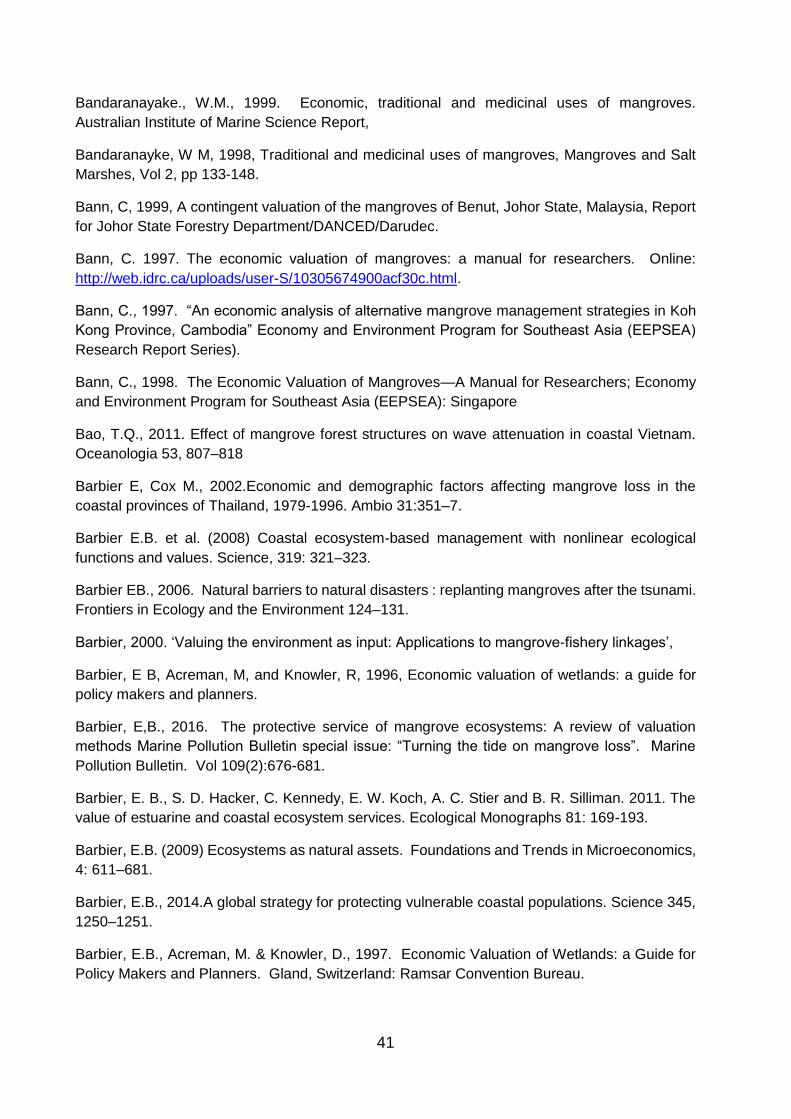
41
Bandaranayake., W.M., 1999. Economic, traditional and medicinal uses of mangroves.
Australian Institute of Marine Science Report,
Bandaranayke, W M, 1998, Traditional and medicinal uses of mangroves, Mangroves and Salt
Marshes, Vol 2, pp 133-148.
Bann, C, 1999, A contingent valuation of the mangroves of Benut, Johor State, Malaysia, Report
for Johor State Forestry Department/DANCED/Darudec.
Bann, C. 1997. The economic valuation of mangroves: a manual for researchers. Online:
http://web.idrc.ca/uploads/user-S/10305674900acf30c.html.
Bann, C., 1997. “An economic analysis of alternative mangrove management strategies in Koh
Kong Province, Cambodia” Economy and Environment Program for Southeast Asia (EEPSEA)
Research Report Series).
Bann, C., 1998. The Economic Valuation of Mangroves—A Manual for Researchers; Economy
and Environment Program for Southeast Asia (EEPSEA): Singapore
Bao, T.Q., 2011. Effect of mangrove forest structures on wave attenuation in coastal Vietnam.
Oceanologia 53, 807–818
Barbier E, Cox M., 2002.Economic and demographic factors affecting mangrove loss in the
coastal provinces of Thailand, 1979-1996. Ambio 31:351–7.
Barbier E.B. et al. (2008) Coastal ecosystem-based management with nonlinear ecological
functions and values. Science, 319: 321–323.
Barbier EB., 2006. Natural barriers to natural disasters : replanting mangroves after the tsunami.
Frontiers in Ecology and the Environment 124–131.
Barbier, 2000. ‘Valuing the environment as input: Applications to mangrove-fishery linkages’,
Barbier, E B, Acreman, M, and Knowler, R, 1996, Economic valuation of wetlands: a guide for
policy makers and planners.
Barbier, E,B., 2016. The protective service of mangrove ecosystems: A review of valuation
methods Marine Pollution Bulletin special issue: “Turning the tide on mangrove loss”. Marine
Pollution Bulletin. Vol 109(2):676-681.
Barbier, E. B., S. D. Hacker, C. Kennedy, E. W. Koch, A. C. Stier and B. R. Silliman. 2011. The
value of estuarine and coastal ecosystem services. Ecological Monographs 81: 169-193.
Barbier, E.B. (2009) Ecosystems as natural assets. Foundations and Trends in Microeconomics,
4: 611–681.
Barbier, E.B., 2014.A global strategy for protecting vulnerable coastal populations. Science 345,
1250–1251.
Barbier, E.B., Acreman, M. & Knowler, D., 1997. Economic Valuation of Wetlands: a Guide for
Policy Makers and Planners. Gland, Switzerland: Ramsar Convention Bureau.
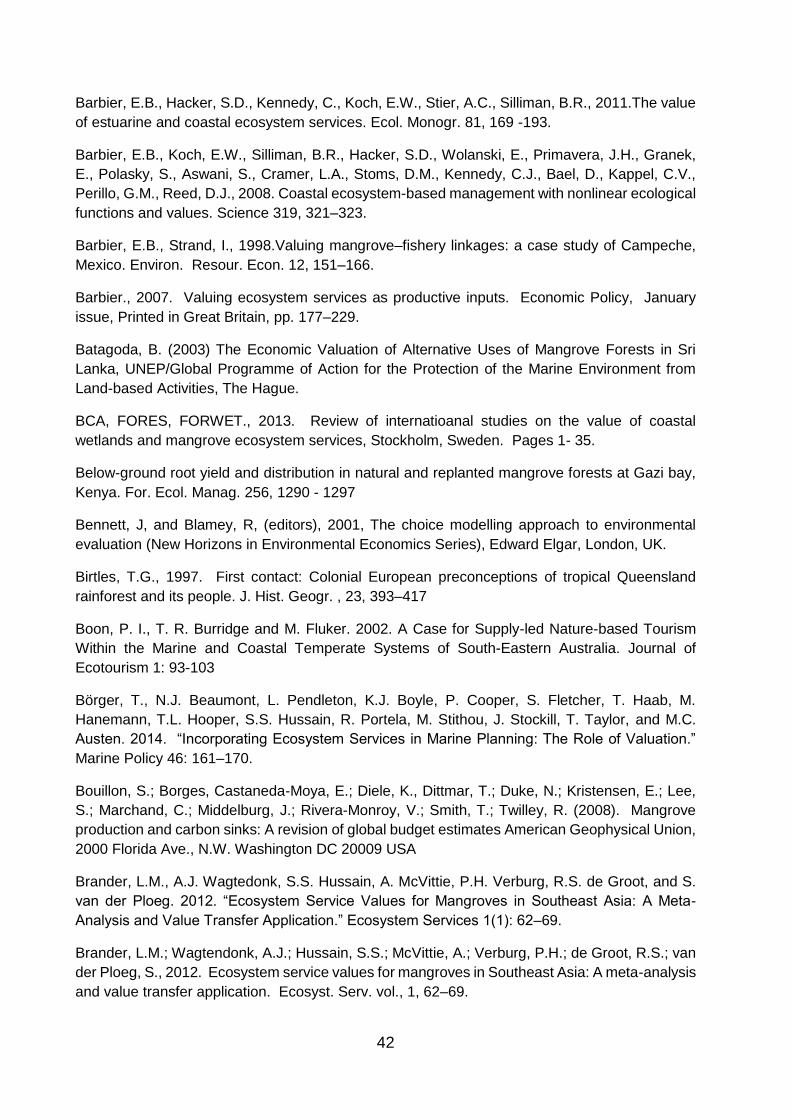
42
Barbier, E.B., Hacker, S.D., Kennedy, C., Koch, E.W., Stier, A.C., Silliman, B.R., 2011.The value
of estuarine and coastal ecosystem services. Ecol. Monogr. 81, 169 -193.
Barbier, E.B., Koch, E.W., Silliman, B.R., Hacker, S.D., Wolanski, E., Primavera, J.H., Granek,
E., Polasky, S., Aswani, S., Cramer, L.A., Stoms, D.M., Kennedy, C.J., Bael, D., Kappel, C.V.,
Perillo, G.M., Reed, D.J., 2008. Coastal ecosystem-based management with nonlinear ecological
functions and values. Science 319, 321–323.
Barbier, E.B., Strand, I., 1998.Valuing mangrove–fishery linkages: a case study of Campeche,
Mexico. Environ. Resour. Econ. 12, 151–166.
Barbier., 2007. Valuing ecosystem services as productive inputs. Economic Policy, January
issue, Printed in Great Britain, pp. 177–229.
Batagoda, B. (2003) The Economic Valuation of Alternative Uses of Mangrove Forests in Sri
Lanka, UNEP/Global Programme of Action for the Protection of the Marine Environment from
Land-based Activities, The Hague.
BCA, FORES, FORWET., 2013. Review of internatioanal studies on the value of coastal
wetlands and mangrove ecosystem services, Stockholm, Sweden. Pages 1- 35.
Below-ground root yield and distribution in natural and replanted mangrove forests at Gazi bay,
Kenya. For. Ecol. Manag. 256, 1290 - 1297
Bennett, J, and Blamey, R, (editors), 2001, The choice modelling approach to environmental
evaluation (New Horizons in Environmental Economics Series), Edward Elgar, London, UK.
Birtles, T.G., 1997. First contact: Colonial European preconceptions of tropical Queensland
rainforest and its people. J. Hist. Geogr. , 23, 393–417
Boon, P. I., T. R. Burridge and M. Fluker. 2002. A Case for Supply-led Nature-based Tourism
Within the Marine and Coastal Temperate Systems of South-Eastern Australia. Journal of
Ecotourism 1: 93-103
Börger, T., N.J. Beaumont, L. Pendleton, K.J. Boyle, P. Cooper, S. Fletcher, T. Haab, M.
Hanemann, T.L. Hooper, S.S. Hussain, R. Portela, M. Stithou, J. Stockill, T. Taylor, and M.C.
Austen. 2014. “Incorporating Ecosystem Services in Marine Planning: The Role of Valuation.”
Marine Policy 46: 161–170.
Bouillon, S.; Borges, Castaneda-Moya, E.; Diele, K., Dittmar, T.; Duke, N.; Kristensen, E.; Lee,
S.; Marchand, C.; Middelburg, J.; Rivera-Monroy, V.; Smith, T.; Twilley, R. (2008). Mangrove
production and carbon sinks: A revision of global budget estimates American Geophysical Union,
2000 Florida Ave., N.W. Washington DC 20009 USA
Brander, L.M., A.J. Wagtedonk, S.S. Hussain, A. McVittie, P.H. Verburg, R.S. de Groot, and S.
van der Ploeg. 2012. “Ecosystem Service Values for Mangroves in Southeast Asia: A Meta-
Analysis and Value Transfer Application.” Ecosystem Services 1(1): 62–69.
Brander, L.M.; Wagtendonk, A.J.; Hussain, S.S.; McVittie, A.; Verburg, P.H.; de Groot, R.S.; van
der Ploeg, S., 2012. Ecosystem service values for mangroves in Southeast Asia: A meta-analysis
and value transfer application. Ecosyst. Serv. vol., 1, 62–69.

43
Brinkman, R. M., S. R. Massel, P. V. Ridd and K. Furukawa. 1997. Surface wave attenuation in
mangrove forests. Proceedings of the Combined Australasian Coastal Engineering and Ports
Conference (Christchurch): 941-946.
Brouwer, R., 2000. Environmental value transfer: state of the art and future prospects. Ecological
Economics 32, 137–152.
Burton, R.F.; Speke, J.H., 1858. A coasting voyage from Mombasa to the Pangani river; visit to
Sultan Kimwere; and progress of the expedition into the interior. J. R. Geogr. Soc. Lond. Vol., 28,
188–226
Cabahug, D. M. Jr.; F. M. Ambi; S. O. Nisperos; N. C. Truzan Jr., 1986, Impact of community-
based mangrove reforestation to mangrove dependent families and to nearby coastal areas in
Central Visayas: A case example, In Mangroves of Asia and the Pacific: Status and Management,
Natural Resources Management Center and National Mangrove Committee, Ministry of Natural
Resources, Manila, pp. 441 – 466.
Cabrera, M.A., J.C. Seijo, J. Euano and E. Perez (1998): Economic values of ecological services
from mangrove ecosystem. International Newsletter of Coastal management 33, pp: 1‐2.
Cesar, H. (1996) Economic Analysis of Indonesian Coral Reefs. Environment Department Work
in Progress, World Bank, Washington DC.
Chan HT, Ong JE, Gong WK, Sasekumar A., 1993. The socio-economic, ecological and
environmental values of mangrove ecosystems in Malaysia and their present state of
conservation.In : Clough BF, editor. The economic and environmental values of mangrove forests
and their present state of conservation in the South-East Asia/Pacific region, vol. 1.
Okinawa:Internation al Society for Mangrove Ecosystems, International Tropical Timber
Organization and Japan International Association for Mangroves, p. 41–81.
Chee, Y.E., 2004. An Ecological Perspective on the Valuation of Ecosystem Services. Biol.
Conserv., 120, 549–565
Chiranjibi Pattanaik, C.S. Reddy, N.K. Dhal and Rashmita Das., 2008. Indian jurnal of traditional
knowledge, vol. 7 (4), pp 598-603.
Chmura, G. L., S. C. Anisfeld, D. R. Cahoon, and J. C. Lynch., 2003.Global carbon sequestration
in tidal, saline wetland soils. Global Biogeochemical Cycles 17:1111.
Chong, J., 2005. Protective Values of Mangrove and Coral Ecosystems: A Review of Methods
and Evidence, IUCN, Gland, Switzerland.
Chong, V. C. 2007. Mangrove-fishery linkages: the Malaysian perspective. Bulletin of Marine
Science 80:755–772.
Christensen, B, 1982, Management and utilisation of mangroves in Asia and the Pacific, FAO
Environment Paper No 3, FAO, Rome.
Collins, D.J., Culvenor, C.C.J., Lamberton, J.A., Loder, J.W. and Price, J.R., 1990. Plants for
Medicine: A Chemical and Pharmacological Survey of Plants in the Australian Region. CSIRO
Publications, Melbourne, Australia, 303pp.
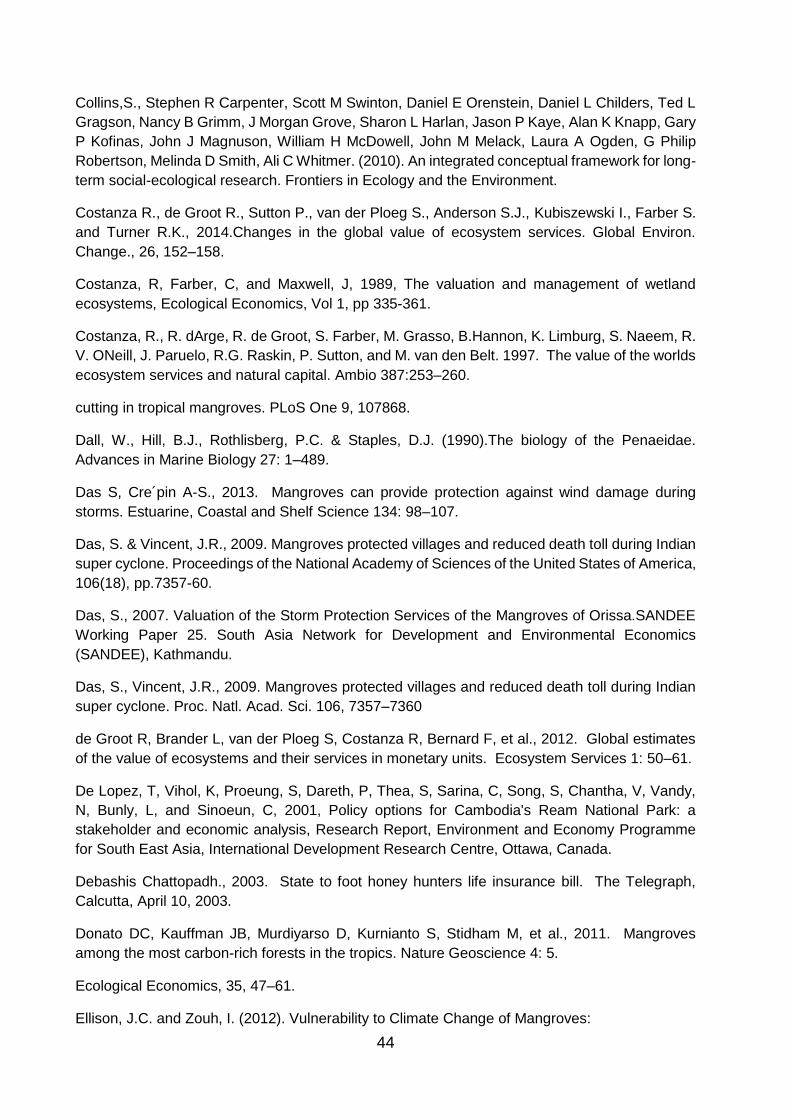
44
Collins,S., Stephen R Carpenter, Scott M Swinton, Daniel E Orenstein, Daniel L Childers, Ted L
Gragson, Nancy B Grimm, J Morgan Grove, Sharon L Harlan, Jason P Kaye, Alan K Knapp, Gary
P Kofinas, John J Magnuson, William H McDowell, John M Melack, Laura A Ogden, G Philip
Robertson, Melinda D Smith, Ali C Whitmer. (2010). An integrated conceptual framework for long-
term social-ecological research. Frontiers in Ecology and the Environment.
Costanza R., de Groot R., Sutton P., van der Ploeg S., Anderson S.J., Kubiszewski I., Farber S.
and Turner R.K., 2014.Changes in the global value of ecosystem services. Global Environ.
Change., 26, 152–158.
Costanza, R, Farber, C, and Maxwell, J, 1989, The valuation and management of wetland
ecosystems, Ecological Economics, Vol 1, pp 335-361.
Costanza, R., R. dArge, R. de Groot, S. Farber, M. Grasso, B.Hannon, K. Limburg, S. Naeem, R.
V. ONeill, J. Paruelo, R.G. Raskin, P. Sutton, and M. van den Belt. 1997. The value of the worlds
ecosystem services and natural capital. Ambio 387:253–260.
cutting in tropical mangroves. PLoS One 9, 107868.
Dall, W., Hill, B.J., Rothlisberg, P.C. & Staples, D.J. (1990).The biology of the Penaeidae.
Advances in Marine Biology 27: 1–489.
Das S, Cre´pin A-S., 2013. Mangroves can provide protection against wind damage during
storms. Estuarine, Coastal and Shelf Science 134: 98–107.
Das, S. & Vincent, J.R., 2009. Mangroves protected villages and reduced death toll during Indian
super cyclone. Proceedings of the National Academy of Sciences of the United States of America,
106(18), pp.7357-60.
Das, S., 2007. Valuation of the Storm Protection Services of the Mangroves of Orissa.SANDEE
Working Paper 25. South Asia Network for Development and Environmental Economics
(SANDEE), Kathmandu.
Das, S., Vincent, J.R., 2009. Mangroves protected villages and reduced death toll during Indian
super cyclone. Proc. Natl. Acad. Sci. 106, 7357–7360
de Groot R, Brander L, van der Ploeg S, Costanza R, Bernard F, et al., 2012. Global estimates
of the value of ecosystems and their services in monetary units. Ecosystem Services 1: 50–61.
De Lopez, T, Vihol, K, Proeung, S, Dareth, P, Thea, S, Sarina, C, Song, S, Chantha, V, Vandy,
N, Bunly, L, and Sinoeun, C, 2001, Policy options for Cambodia's Ream National Park: a
stakeholder and economic analysis, Research Report, Environment and Economy Programme
for South East Asia, International Development Research Centre, Ottawa, Canada.
Debashis Chattopadh., 2003. State to foot honey hunters life insurance bill. The Telegraph,
Calcutta, April 10, 2003.
Donato DC, Kauffman JB, Murdiyarso D, Kurnianto S, Stidham M, et al., 2011. Mangroves
among the most carbon-rich forests in the tropics. Nature Geoscience 4: 5.
Ecological Economics, 35, 47–61.
Ellison, J.C. and Zouh, I. (2012). Vulnerability to Climate Change of Mangroves:

45
Emerton, L. 2002. The Use of Economic Valuation for Protected Area Management in the Lower
Mekong: A Review of Lessons and Experience, Review of Protected Areas and their Role in the
Socio-Economic Development of the Lower Mekong Region. Lessons Paper Series, ICEM and
IUCN, Bangkok.
Environment Australia. 2000. Migratory Birds, Let’s Ensure Their Future. Wetlands, Waterways
and Waterbirds Unit, Environment Australia, Canberra, Australia.
Ewel, K.C., J. Bourgeois, T. Cole, S. Zheng. 1998. Variation in environmental characteristics and
vegetation in high-rainfall mangrove forests, Kosrae, Micronesia. Global Ecology and
Biogeography Letters 7: 49-56.
FAO (2007). The World's Mangroves 1980-2005. FAO Forestry Paper No. 153. Rome, Forest
Resources Division, FAO. pp. 77.
FAO (Food and Agriculture Organization of the United Nations), 2007.The world’s mangroves
1980–2005. FAO Forestry Paper, Report 153, FAO, Rome.
FAO, 1994, Mangrove forest management guidelines, Forestry Paper 117, FAO, Rome.
FAO., 1985. Mangrove Management in Thailand, Malaysia and Indonesia.Food and Agriculture
Organization of the United Nations, FAO Environment Paper No.4, Rome, 59pp.
FAO., 2007. The world’s mangrove 1980-2005. FAO Forestry paper 153
Farber, S. and R. Costanza., 1987.The economic value of wetland systems.Journal of
Environmetal Management, Vol. 24; 41-51 pp. In. Anderson and Rockel, 1991.In. Heimlich, R.E.,
K.D. Wiebe, R.Claassen, D. Gadsby and R.M. House, 1998.
Farber, S., 1996. Welfare loss of wetlands disintegration: A Louisiana Study. Contemporary
economic policy, Vol. 14(2); 92-106 pp. In. Heimlich, R.E., K.D. Wiebe, R. Claassen, D. Gadsby
and R.M. House, 1998.
Faya, B, 1993, Mangrove, Secheresse et Dromadaire, Secheresse 1993, Vol 4, pp 47-55
Final frontier., 2009. Agenda to protect the ecosystem and habitat of India’s coast for
conservation and livelihood security.Report of the Expert Committee on the draft Coastal
Management Zone (CMZ) Notification, constituted by the Ministry of Environment and Forests,
under the Chairmanship of Prof M S Swaminathan. Pages 1-49
Frank Spaninks and Pieter van Beukering., 1997. Economic Valuation of Mangrove Ecosystems:
Potential and Limitations. CREED Working Paper No 14. Institute for Environmental Studies
Vrije Universiteit, de Boelelaan 1115, 1081 HV Amsterdam, The Netherlands, pages 1-67.
Frank Spaninks and Pieter van Beukering., 1997. Economic Valuation of Mangrove Ecosystems:
Potential and Limitations. CREED Working paper No 14. Available at SSRN :
https://ssrn.com/abstract=34764
Fredrik Moberga and Patrik Ronnback., 2003. Ecosystem services of the tropical seascape :
interactions, substitutions and restoration. Ocean & Coastal Management 46, 27–46.
Frost, R., 2010. Dwindling Indian Sundarban Mangrove: The Way Out. Sci. Culture,76, 275–282.
46
Fujimoto K (2000) Belowground carbon sequestration of mangrove forests in the Asia-Pacific
region. In Proceedings of Asia-Pacific Cooperation on Research for conservation of mangroves,
Japan 87–96.
Gedan, K.B., Kirwan, M.L.,Wolanski, E., Barbier, E.B., Silliman, B.R., 2011. The present and
future role of coastal wetland vegetation in protecting shorelines: answering recent challenges to
the paradigm. Clim. Chang. 106, 7–29
Gedney, R.H., Kapetsky, J.M., Kuhnhold, W.W., 1982. Training on Assessment of Coastal
Aquaculture Potential, Malaysia. SCS:GEN:82:35 South China Sea Fisheries Development and
Coordination Programme, Manila.
Gilbert A.J. & Janssen, R., 1998.Use of environmental functions to communicate the values of a
mangrove ecosystem under different management regimes. Ecological Economics 25(3): 323–
346.
Gilbert AJ, Janssen R., 1998. Use of environmental functions to communicate the values of a
mangrove ecosystem under different management regimes. Ecological Economics 25:323–346.
Giri C., Ochieng E., Tieszen L.L., Zhu Z., Singh A., Loveland T., Masek J. and Duke N., 2011.
Status and distribution of mangrove forests of the world using earth observation satellite data.
Global Ecol. Biogeogr., 20, 154–159.
Giselle P. B. Samonte-Tan and Alan T. White., 2007. Economic Valuation of Coastal and Marine
Resources: Bohol Marine Triangle, Philippines. Coastal Management, 35:319–338.
Gunawardena, M and J. S. Rowan., 2005.Economic Valuation of a Mangrove Ecosystem
Threatened by Shrimp Aquaculture in Sri Lanka. Environmental Management Vol. 36, No. 4, pp.
535–550
Harahab, N., 2010. Penilaian Ekonomi Ekosistem Hutan Mangrove dan Aplikasinya dalam
Perencanaan Wilayah Pesisir; Graha Ilmu
Hirway, I. and S. Goswami, 2004, Valuation of Mangroves in Gujarat, Centre for Development
Alternatives, Ahmedabad, Gujarat Ecology Commission, Vadodara, pp. 1 – 97.
Hussain SA, and Badola R., 2010.Valuing mangrove benefits: contribution of mangrove forests
to local livelihoods in Bhitarkanika Conservation Area, East Coast of India. Wetlands Ecology and
Management 18:321–331.
Huxham, M., 2014. Rapid losses of surface elevation following tree girdling and
Ilman, M., I. T. C. Wibisono and I. N. N. Suryadiputra 2011.State of the art information on
mangrove ecosystems in Indonesia. Wetlands International-Indonesia Programme, Bogor
IUCN., 2006. Conservation benefits of mangroves. IUCN Policy brief. Sri Lanka, Colombo 07.
pages 1-6.
IUCN., 2006. Valuation, Rehabilitation and Conservation of Mangroves in Tsunami Affected
Areas: Rapid Mangrove Valuation Study, Panama Village in South Eastern Coast of Sri Lanka.
The World Conservation Union (IUCN), Ecosystems and Livelihoods Group Asia, Colombo.
47
Jack Ruitenbeek., 1992. Mangrove Management: An Economic Analysis of Management
Options with a Focus on Bintuni Bay, Irian Jaya. Environmental Management Development in
Indonesia Project (EMDI).Jakarta and Halifax.Pages 1-52.
James Spurgeon., 2002. Rehabilitation, conservation and sustainable utilization of mangroves
in Egypt.Socio-economic assessment and economic valuation of Egypt’s mangroves. FAO
Consultancy report TCP/EGY/0168 (A), pages 1-55.
James, G.K.; Adegoke, J.O.; Osagie, S.; Ekechukwu, S.; Nwilo, P.; Akinyede, J., 2013.Social
valuation of mangroves in the Niger delta region of Nigeria. Int. J. Biodivers. Sci. Ecosyst. Serv.
Manag. Vol.9, 311–323.
Janis Hoberg., 2011. Economic Analysis of Mangrove Forests: A case study in Gazi Bay, Kenya.
Published by UNEP, pages 1-50; ISBN: 978-92-807-3187-3
Janssen, R. and J. E. Padilla (1999), ‘Preservation of Conversion? Valuation and Evaluation of a
Mangrove Forest in the Philippines’, Environmental and Resource Economics 14, 297–331.
Jonathan Baines and Manon Whittaker., 2016. Apiculture in or near mangroves: a natural winner
for communities & mangroves. Mangrove honey information sheet.Pages 1-8.
Jonathan H. Grabowski, Robert D. Brumbaugh, Robert F. Conrad, Andrew G. Keeler, James J.
Opaluch, Charles H. Peterson, Michael F. Piehler, Sean P. Powers, and Ashley R. Smyth., 2012.
Economic Valuation of Ecosystem Services Provided by Oyster Reefs. BioScience, Vol. 62 No.
10, pages 900-909.
Jusoff, K., and Taha, D., 2008. Managing Sustainable Mangrove Forests in Peninsular Malaysia.
J. Sustain. Devel., 1, 88–96.
Kairo J, Wanjiru C and Ochiewo J, 2009. Net Pay: Economic analysis of a Replanted Mangrove
Plantation in Kenya. Journal of Sustainable Forestry, 28:(3):395 — 414
Kairo, J. G., F. Dahdouh-Guebas, P. O. Gwaba, C. Ochieng and N. Koedam. 2002. Regeneration
status of mangrove forests in Mida Creek, Kenya: a compromised or secured future? Ambio 31:
562-568.
Kapestky, J M, 1985, Mangroves, fisheries and aquaculture, Fish.Rep. 338 (Supplement), pp 17-
36, FAO, Rome.
Kathiresan, K., N. S. Boopathy and S. Kavitha. 2006. Coastal vegetation —An underexplored
source of anticancer drugs. Indian Journal of Natural Products and Resources 5: 115-119
Kenya. United Nations Environment Programme, Nairobi.
Khalil, S, 1999, Economic valuation of the mangrove ecosystem along the Karachi coastal areas,
in: The economic value of the environment: cases from South Asia, IUCN.
Krauss, K. W., J. A. Allen and D. R. Cahoon. 2003. Differential rates of vertical accretion and
elevation change among aerial root types in Micronesian mangrove forests. Estuarine, Coastal
and Shelf Science 56: 251-259

48
Krauss, K.W.; Cahoon, D.R.; Allen, J.A.; Ewel, K.C.; Lynch, J.C.; Cormier, N., 2010. Surface
elevation change and susceptibility of different mangrove zones to sea-level rise on Pacific high
islands of Micronesia. Ecosystems. Vol., 13, 129–143
Krauss, K.W.; McKee, K.L.; Lovelock, C.E.; Cahoon, D.R.; Saintilan, N.; Reef, R.; Chen, L., 2014.
How mangrove forests adjust to rising sea level. New Phytol. Vol., 202, 19–34.
Kuenzer C, Bluemel A, Gebhardt S, et al., 2011. Remote Sensing of Mangrove Ecosystems: A
Review. Remote Sensing 3:878–928
Lal PN., 1990. Conservation or conversion of mangroves in Fiji: An ecological economic analysis.
Occasional paper No11 East-West Environment and Policy Institute 108.
Lang'at, J.K.S., Kairo, J.G., Mencuccini, M., Bouillon, S., Skov, M.W., Waldron, S.,
Laurans Y, Rankovic A, Bille R, Pirard R, Mermet L., 2013. Use of ecosystem services economic
valuation for decision making: questioning a literature blindspot. J Environ Manage 119: 208–219
Lee S.Y., Primavera J.H., Dahdouh-Guebas F., McKee K., Bosire J.O., et al., 2014. Ecological
role and services of tropical mangrove ecosystems: a reassessment. Global Ecol. Biogeogr., 23,
726–743.
Lewis III, R.R., 2005. Ecological engineering for successful management and restoration of
mangrove forests. Ecol. Eng. 24, 403–418
Linwood H. Pendleton., 2-. The Economic and Market Value of Coasts and Estuaries : What’s
At Stake?. Produced by Restore America's Estuaries. Pafes 1-182
London.
Lovelock, C.E.; Cahoon, D.R.; Friess, D.A.; Guntenspergen, G.R.; Krauss, K.W.; Reef, R.;
Rogers, K.; Saunders, M.L.; Sidik, F.; Swales, A., 2015. The vulnerability of Indo-Pacific
mangrove forests to sea-level rise. Nature, 526, 559–563.
Lucy Emerton., 2013. The economic value of ecosystem services in the mekong basin what we
know, and what we need to know. WWF – World Wide Fund For Nature, Gland, Switzerland.
Pages 1-68.
Lucy Emerton., 2014. Assessing, demonstrating and capturing the economic value of marine &
coastal ecosystem services in the Bay of Bengal Large Marine Ecosystem. A draft report for the
BOBLME Project, Contract No.CST-RAPRD 492/6/2014.Pages 1-73.
Lugo AE., 2002. Can we manage tropical landscapes? An answer from the Caribbean
perspective. Landscape Ecol 17:601–615
Luke Brander and Florian Eppink., 2012. The economics of ecosystems and biodiversity for
Southewast Asia (ASEAN TEEB).Scoping study.Pages 1-53.
Luke M. Brander, Raymond J. G. M. Florax and Jan E. Vermaat., 2006. The Empirics of Wetland
Valuation: A Comprehensive Summary and a Meta-Analysis of the Literature. Environmental &
Resource Economics, 33: 223–250
49
MacDonald, J.D., 1857. Proceedings of the expedition for the exploration of the Rewa River and
its tributaries, in Na Viti Levu, Fiji islands. J. R. Geogr. Soc. Lond. Vol., 27, 232–268.
Mangrove Ecosystems (ISME): Okinawa, Japan; International Tropical Timber Organization
(ITTO): Yokohama, Japan.
Marine Resources: Bohol Marine Triangle, Philippines. Coastal Manag., 35, 319–338
Mark Huxham, Lucy Emerton, James Kairo, Fridah Munyi, Hassan Abdirizak, Tabitha Muriuki,
Fiona Nunan, Robert A. Briers., 2015. Applying Climate Compatible Development and Economic
Valuation to Coastal Management: A Case Study of Kenya's Mangrove Forests. Journal of
Environmental Management 157, pages 168 - 181
Marwa E.S., and D. Evan Mercer., 2012. The Economic Value of Mangroves: A Meta-Analysis.
Sustainability, 4(3), 359-383
Mashayekhi,Z., A. Danehkar, G.A. Sharzehi and V. Majed., 2016. Coastal Communities WTA
Compensation for conservation of mangrove forests: a choice experiment approach. Knowledge
and Management of Aquatic Ecosystems, 417, 20.
Mazda, Y., and Magi, M., Kogo, M., Hong, P.N., 1997.Mangroves as a coastal protection from
waves in the Tong King delta, Vietnam. Mangroves Salt Marshes, 1, 127–135.
McIvor, A. L., T. Spencer, I. Möller and M. Spalding 2012.Storm surge reduction by mangroves.
Natural Coastal Protection Series : Report 2. Cambridge Coastal Research Unit Working Paper
41., The Nature Conservancy and Wetlands International, Cambridge, UK.
Meenakshi Jerath, Mahadev G. Bhat, and Victor H. Rivera-Monroy., 2012. Alternative
approaches to valuing carbon sequestration in mangroves.
w.isecoeco.org/conferences/isee2012-versao3/pdf/761.pdf (visisted on 21/02/2017)
Mitsch W.J. and Gosselink J.G., 2015.Wetlands, 5th edition, John Wiley & Sons, Inc., Hoboken,
NJ, 744 p.
Mumby, P. J., et al. 2006., Fishing, trophic cascades, and the process of grazing on coral reefs.
Science 311:98–101.
Mumby, P.J., Edwards, A.J., Arias-Gonzalez, J.E., Lindeman, K.C., Blackwell, P.G., Gall, A.,
Gorczynska, M.I., Harborne, A.R., Pescod, C.L., Renken, H., Wabnitz, C.C.C., Llewellyn, G.,
2004. Mangroves enhance the biomass of coral reef fish communities in the Caribbean. Nature
427, 533 - 536.
Navrud, S., Ready, R., 2007. Environmental Value Transfer: Issues and Methods. Springer,
Dordrecht.
Naylor, R., and Drew, M., 1998.Valuing mangrove resources in Kosrae, Micronesia. Environment
and Development Economics, 3, 471-490.
NEP., 2006. National Environment Policy, Approved by Union Cabinet., Published by Ministry of
Environment and Forests. Pages 1-58.

50
Newell RIE, Cornwell JC, Owens MS. 2002. Influence of simulated bivalve biodeposition and
microphyrobenthos on sediment nitrogen dynamics : A laboratory study. Limnology and
Oceanography 47: 1367–1379.
Nibedita Mukherjee, William J. Sutherland, Lynn Dicks, Jean Huge, Nico Koedam and Farid
Dahdouh-Guebas., 2014.Ecosystem Service Valuations of Mangrove Ecosystems to Inform
Decision Making and Future Valuation. Plos One Vol. 1 (1), pages 1-9.
Nicolas Pascal ., 2014. Economic valuation of mangrove ecosystem services in Vanuatu: Case
study of Crab Bay (Malekula Is.) and Eratap (Efate Is.) - Summary report. IUCN, Suva, Fiji. 18pp
Nicolas Pascal and Molu Bulu., 2013. Economic valuation of mangrove ecosystem services in
Vanuatu : Case study of Crab Bay (Malekula Is.) and Eratap (Efale Is). IRCP, MESCAL Project.
Vanuvatu, Pages 3-147.
Nielsen, S. S., A. Pederson, L. T. Trai and L. D. Thuy, 1998, Local Use of Selected Wetland
Resources – Cua Day Estuary, Red River Delta, Vietnam, ZMUC and Wetlands International –
Asia Pacific, Kuala Lumpur, Malaysia, Publication No. 121.
Ong, J. E. 1993. Mangroves - a carbon source and sink. Chemosphere 27: 1097-1107.
Ong, J.E., and Gong, W.K., 2013. Structure, Function and Management of Mangrove
Ecosystems; International Society for
Pauly, D., Ingles, J., 1986. The relationship between shrimp yields and intertidal (mangrove)
areas: a reassessment. In: IOC:FAO Workshop on Recruitment in Tropical Coastal Demersal
Communities, IOC, UNESCO, pp. 227–284.
Piyashi DebRoy and R. Jayaraman., 2012. Economic valuation of mangroves for assessing the
livelihood of fisherfolk: A case study in India. International Institute of Fisheries Economics and
Trade.Proceeding of International Workshop, 2012 Tanzania Proceedings.Pages 1- 11.
Polunin, N.V.C., 1983. The marine resources of Indonesia. Oceanography and Marine Biology:
an Annual Review 21:455-531.
Prakash, M.; Sivakumar, T., 2013. A study on antibacterial activity of mangrove plant Excoecaria
agallocha L. Int. J. Curr. Microbiol. Appl. Sci., 2, 260–262.
Publisher: Yogyakarta, Indonesia.
Puustinen, J., E. Pouta, N. Marjo and S. Tuija. 2009. Visits to national parks and the provision of
natural and man-made recreation and tourism resources. Journal of Ecotourism 8: 18-31
Rahman MA, Haque E, Hasanuzzaman M, Shahid IZ, 2011. Antinociceptive, anti inflammatory
and antibacterial properties of Tamarix indica roots, Inter J Pharmacol, 7, 527–31.
Ranasinghe, T., Kallesoe, M., 2006. Valuation, Rehabilitation and Conservation of Mangroves in
Tsunami Affected Areas of Hambantota, Sri Lanka: Economic Valuation of Tsunami Affected
Mangroves. The World Conservation Union (IUCN), Ecosystems and Livelihoods Group Asia,
Colombo.
51
Ravindran, K.C., K. Venkatesan, V.Balakrishnan, K.P.Chellapan and T. Balasubramanian., 2005.
Ethonomedicinal studies of Pitchavaram mangroves of East coast, Tamil Nadu. Indian journal of
traditional Knowledge. Vol. 4 (4), pp 409-411.
Rebecca Shaw, M & Linwood Pendleton & D. Richard Cameron & Belinda Morris & Dominique
Bachelet & Kirk Klausmeyer & Jason MacKenzie & David R. Conklin & Gregrory N. Bratman &
James Lenihan & Erik Haunreiter & Christopher Daly & Patrick R. Roehrdanz., 2011. The impact
of climate change on California’s ecosystem services.Climate change, Volume 109, Supplement
1, pp 465–484.
Revathi P, T Jeyaseelan Senthinath, P Thirumalaikolundu subramanian and N Prabhu., 2013.
Medicinal properties of mangrove plants - An overview. International Journal of Bioassays., 02
(12), 1597-1600
Robertson, A. I. and M. J. Phillips. 1995. Mangroves as filters of shrimp pond effluents: predictions
and biogeochemical research needs. Hydrobiologia 295: 311-321.
Rönnbäck .P, M. TROELL, T. ZETTERSTRÖM AND D.E. BABU., 2003.Mangrove dependence
and socio-economic concerns in shrimp hatcheries of Andhra Pradesh, India. Environmental
Conservation 30(04):344 - 352.
Ronnback P., 1999. The ecological basis for economic value of seafood production supported
by mangrove ecosystems. Ecol Econ 29:235–252
Rönnbäck, M. Troell, T. Zetterström and D.E. Babu., 2003.Mangrove dependence and socio-
economic concerns in shrimp hatcheries of Andhra Pradesh, India. Volume 30, Issue 4, pp. 344-
352
Ronnback, P, 2001, Mangroves and seafood production: the ecological economics of
sustainability, Doctoral Thesis in Systems Ecology, Stockholm University.
Rönnbäck, P. (1999) The ecological basis for the economic value of mangrove forests in seafood
production. Ecological Economics 29: 235–252.
Ronnback, P., 2000, Fisheries and shrimp aquaculture supported by mangroves: The ecological
basis for economic valuation, Paper presented at the International Society for Mangroves (ISME)
Conference Sustainable use of estuaries and mangroves: Challenges and prospects, 22nd May
to 28th May, 2000, Brazil, Recife.
Roome T, Dar A, Naqvi A., 2011. Evaluation of antinociceptive effect of Aegiceras corniculatum
stems extracts and its possible mechanism of action in rodents, J Ethnopharmacol, 135, 351–8.
Rosenberger, R.S., Stanley, T.D., 2006. Measurement, generalization, and publication: sources
of error in benefit transfers and their management. Ecological Economics 60, 372–378.
Ruchi Badola and S A Hussain ., 2003. Valuation of the Bhitarkanika Mangrove Ecosystem for
Ecological Security and Sustainable Resource Use. A World Bank Aided India Environmental
Management Capacity Building Technical Assistance Project, IGIDR, Mumbai. Published by Wild
Life Institute of India, Pages 1-124.
52
Ruchi Badola and S.A. Hussain., 2005. Valuing ecosystem functions: an empirical study on the
storm protection function of Bhitarkanika mangrove ecosystem, India. Environmental
Conservation 32 (1): 85–92.
Ruitenbeek, H J, 1992, Mangrove management: an economic analysis of management options
with a focus on Bintuni Bay, Irian Jaya, EMDI Environmental Report 8, Environmental
Management Development in Indonesia Project.
Ruitenbeek, H J, and Cartier, C M, 1999, Prospecting for marine biodiversity: a case study in
Montego Bay, Jamaica, in: Turner, K, Bateman, I, and Adger, N (editors), Economics of coastal
and water resources : valuing environmental functions, Kluwer Academic Press, Dordrecht.
Ruitenbeek, H. J. (1992), ‘Mangrove Management: An Economic Analysis of Management
Options with a Focus on Bintuni Bay, Irian Jaya’. Environmental Management Development in
Indonesia Project, EMDI Environmental Report 8, Jakarta, Indonesia.
Saenger, P. 2002. Mangrove Ecology, Silviculture and Conservation. Kluwer Academic
Publishers, Dordrecht, Netherlands
Salem, M.E., and D.E. Mercer. 2012. “The Economic Value of Mangroves: A Meta-Analysis.”
Sustainability 4: 359–383.
Samonte-Tan, G.P.B.; White, A.T.; Tercero, M.A.; Diviva, J.; Tabara, E.; Caballes, C., 2007.
Economic Valuation of Coastal and
Sandilyan, S., Kathiresan, K., 2015. Mangroves as bio-shields: an undisputed fact. Ocean
Coast.Manag. 103, 94–96.
Sasekumar, A., Chong, V.C., Leh, M.U., and D’Cruz, R., 1992. Mangroves as a Habitat for Fish
and Prawns. Hyrobiologia, 247, 195–207
Sathirathai, S. and E. B. Barbier (2001), ‘Valuing Mangrove Conservation in Southern Thailand’,
Contemporary Economic Policy 19, 109–122.
Sathirathai, S., 1998, Economic valuation of mangroves and the Roles of Local Communities in
the Conservation of Natural Resources: Case Study of Surat Thani, South of Thailand, Singapore,
Economy and Environment Program for Southeast Asia.
Sathirathai, S., 1998. Economic Valuation of Mangroves and the Roles of Local Communities in
the Conservation of Natural Resources: Case Study of Surat Thani, South of Thailand. EEPSEA
Research Report. Environment and Economics Program for South East Asia, International
Development Research Centre, Ottawa.
Sathirathai, S., and Barbier, E.B., 2001. Valuing Mangrove Conservation in Southern Thailand.
Contemp. Econ. Policy, 19, 109–122
Saudamini Das., 2009. Can Mangroves Minimize Property Loss during Big Storms? An Analysis
of House Damage due to the Super Cyclone in Orissa. SANDEE Working Papers 42-09, pages
1-343.
Schatz, R. E., 1991, Economic Rent Study for the Philippine Fisheries Sector Program, Asian
Development Bank T A 1208 – PHI, Manila, 42 pp.
53
Semesi, A.K., 1998. Mangrove management and utilization in Eastern Africa. Ambio 27(8): 620–
626.
services and dependent livelihoods in Bangladesh. Asian Journal of Conservation Biology. Vol.
2 No. 2, pp. 152–156.
services. Ecol. Indic, 23, 431–446.
Shibata, A., 1982. Proceedings of Rattanakosin Bicentennial Joint Seminar on the Chemistry of
Natural Products, 2-6 August 1982, Bangkok, Thailand. National Research Council, Thailand,
131-132.
Sitthinan Wiwatthanapornchai, Chucheep Piputsitee, and Samakkee Boonyawat., 2014. The
Economic Value of Laem Phak Bia Mangrove Ecosystem Services in Phetchaburi Province,
Thailand. Modern Applied Science; Vol. 8, No. 5.pages 36-45.
Spalding, M., Kainuma, M. and Collins, L. (2010).World Atlas of Mangroves.ITTO, ISME, FAO,
UNEP-WCMC, UNESCO-MAB and UNU-INWEH. Earthscan Publishers Ltd.
Spaninks, F. & van Beukering, P., 1997. Economic valuation of mangrove ecosystems: potential
and limitations. CREED Working Paper Series 14, IIED, London, UK.
Spurgeon G, 2002. Socio-economic assessment and economic valuation of Egypt’s mangroves,
FAO Consultancy Report, TCP/EGY/0168 (A).
ftp://ftp.fao.org/docrep/fao/007/ae212e/ae212e00.pdf (accessed 7 March 2011)
Spurgeon, J. (1998), ‘The socio-economic costs and benefits of coastal habitat rehabilitation and
creation’, Marine Pollution Bulletin 37(8-12): 373-382.
Sribianti, I., 2008. Valuasi Ekonomi Hutan Mangrove: Studi Kasus Valuasi Ekonomi Kawasan
Hutan Mangrove Malili Kabupaten Luwu Timur. J. Sains. &Teknol., 8, 186–192
Stanley, T.D., 2001. Wheat from chaff: meta-analysis as quantitative literature review. Journal of
Economic Perspectives 15, 131–150.
Stenhouse, J., 1862. On some varieties of Tannin. Proc. R. Geogr. Soc. Lond. Vol., 11, 401–
405.
Storch, H. and K. Woth. 2008. Storm surges: perspectives and options. Sustainability Science 3:
33-43.
Suthawan Sathirathai., 1998. Economic Valuation of Mangroves and the Roles of Local
Communities in the Conservation of Natural Resources: Case Study of Surat Thani, South of
Thailand. Economy and Environment Program for Southeast Asia.Pages 1-60.
Tamooh, F., Huxham, M., Karachi, M., Mencuccini, M., Kairo, J.G., Kirui, B., 2008.
Technical paper for the ‘Mangrove Capital’ project. Wageningen University (Environmental
Systems Analysis Group, Wageningen) and Wetlands International (Ede & Bogor). Pages 1-
134.

54
Thang Nam Do and Jeff Bennett., A., 2005. An Economic Valuation of Wetlands in Vietnam’s
Mekong Delta: a case study of direct use values in Camau Province.
Thiagarajah, J.;Wong, S.K.M.; Richards, D.R.; Friess, D.A., 2015. Historical and contemporary
cultural ecosystem service values in the rapidly urbanizing city state of Singapore. Ambio, 44,
666–677
Tobias, D, and Mendelsohn, R, 1991, Valuing ecotourism in a tropical rainforest reserve, Ambio,
Vol 20, No 2.
Tong C, Rusty A, Feagin, et al. (2007) Ecosystem service values and restoration in the urban
Sanyang wetland of Wenzhou, China. Ecological Engineering 29:249–258
Tovilla-Hernandez, C., de la Lanza, G. E., Orihuela-Belmonte, D. E. 2001. Impact of logging on
a mangrove swamp in South Mexico: Cost/benefit analysis. Revista De Biologia Tropical 49: 571-
80.
Townsville, Number 28, pages 1 - 84.
Tri N., Adger W. and Kelly M. (1998) Natural resource management in mitigating climate impacts:
the example of mangrove restoration in Viet Nam. Global Environmental Change 8. (1):49-61.
Tri, N.H. 2000. Valuation of the Mangrove Ecosystem in Can Gio Mangrove Biosphere Reserve,
Vietnam. UNESCO/MAB Programme National Committee, Center for Natural Resources and
Environmental Studies (CRES), Hanoi University of Economics (HUE) and Management Board
of Can Gio Mangrove Biosphere Reserve, Hanoi.
Tri, N.H., Adger, W.N. and M. Kelly. 1998. Natural resource management in mitigating climate
impacts: the example of mangrove restoration in Vietnam. Global Environmental Change 8(1):49-
61.
Turner, R.K., Brouwer, R., Crowards, T.C. and Georgiou, S., 2003. ‘The economics of wetland
management’, in R.K. Turner, J.C.J.M. van den Bergh and R. Brouwer (eds), Managing Wetlands:
an ecological economics approach, Edward Elgar, Chltenhan, U.K:73-107.
Uddin Shams, Mohammad Aminur Rahman Shah, Shahida Khanom, and Karimon Nesha., 2013.
Climate change impacts on the Sundarbans mangrove ecosystem
UNEP, 2011. Economic Analysis of Mangrove Forests: a Case Study in Gazi Bay,
UNEP., 2005. After the Tsunami: Rapid Environmental Assessment Report, UNEP, Nairobi, 22
February; www.unep.org/tsunami/reports.
UNEP., 2015. Global Synthesis Report of the Project for Ecosystem Services, UNEP, Ecosystem
Services Economics Unit, Division of Environmental Policy Implementation.pages 1-97.
UNEP-WCMC. 2006. In the Front Line: Shoreline protection and Other Ecosystem Services from
Mangroves and Coral Reefs. United Nations Environment Programme (UNEP), World
Conservation Monitoring Centre (WCMC), Cambridge, UK.
UoN & UNEP., 2016.Valuing coastal ecosystems as economic assets.The importance of
mangroves for food security and livelihoods among communities in Kilifi Country and the Tana
55
Delta, Kenya. Report No., FMM/GLO/112/MUL BABY04. University of Nairobi, FAO, and
UNEP.Pages 1-10.
Valiela I, Bowen JL et al., 2001. Mangrove forests: one of the world’s threatened major tropical
environments. Bioscience 51(10):807–815
Van Oudenhoven, A.P.E., A.J. Siahainenia, I. Sualia, F.H. Tonneijck, S. Van der Ploeg and R.S.
de Groot., 2014.Effects of different management regimes on mangrove ecosystem services in
Java, Indonesia.
Vedeld, P., A. Angelsen, E. Sjaastad and G. K. Berg 2004.Counting on the environment: Forest
incomes and the rural poor. Environmental Economics Series Paper No. 98, World Bank,
Washington, DC.
Verma M, Negandhi D, Wahal A K, Kumar R., 2013. Revision of rates of NPV applicable for
different class/category of forests.Indian Institute of Forest Management. Bhopal, India. pages 1-
143.
Vo Quoc Tuan., 2013. Valuation of Mangrove Ecosystems along the Coast of the Mekong Delta
in Vietnam an approach combining socio-economic and remote sensing methods
Dissertation.Department of Geography, Faculty of Math and Natural Science, Kiel University,
Kiel, Germany.
Vo, Q.T.; Kuenzer, C.; Vo, Q.M.; Moder, F.; Oppelt, N., 2012. Review of valuation methods for
mangrove ecosystem
Wake, C.S., 1866.Tribal affinities among the aborigines of Australia. J. Anthropol. Soc. Lond.
Vol., 8, 13–32
Walters BB, Ro¨nnba¨ck P, Kovacs JM, Crona B, Hussain SA, et al., 2008. Ethnobiology, socio-
economics and management of mangrove forests: A review. Aquatic Botany 89: 220–236
Wells, S.; C. Ravilous; and E. Corcoran, 2006, In The front line: Shoreline protection and other
ecosystem services from mangroves and coral reefs, United Nations Environment Programme,
World Conservation Monitoring Centre, Cambridge, U.K., 33 pp.
Wetlands International., 2005. Natural Mitigation of Natural Disasters. Assessment Report to
Ramsar STRP12, Wetlands International, Jakarta, 2 February,
Wilson, J.S., 1858. Notes on the physical geography of north-west Australia. J. R. Geogr. Soc.
Lond. Vol., 28, 137–153.
World Bank. 2016. Managing Coasts with Natural Solutions: Guidelines for Measuring and
Valuing the Coastal Protection Services of Mangroves and Coral Reefs. M. W. Beck and G-
M.Lange, editors.Wealth Accounting and the Valuation of Ecosystem Services Partnership
(WAVES), World Bank, Washington, DC.
World Bank., 1993. Bangladesh—Coastal Embankment Rehabilitation Project (CERP), Project
information sheet, prepared by the Public Information Centre, The World Bank, Washington.
Zulkarnaini and Mariana., 2016. Economic Valuation of Mangrove Forest Ecosystem in Indragiri
Estuary.International Journal of Oceans and Oceanography. Volume 10, Number 1, pp. 13-17
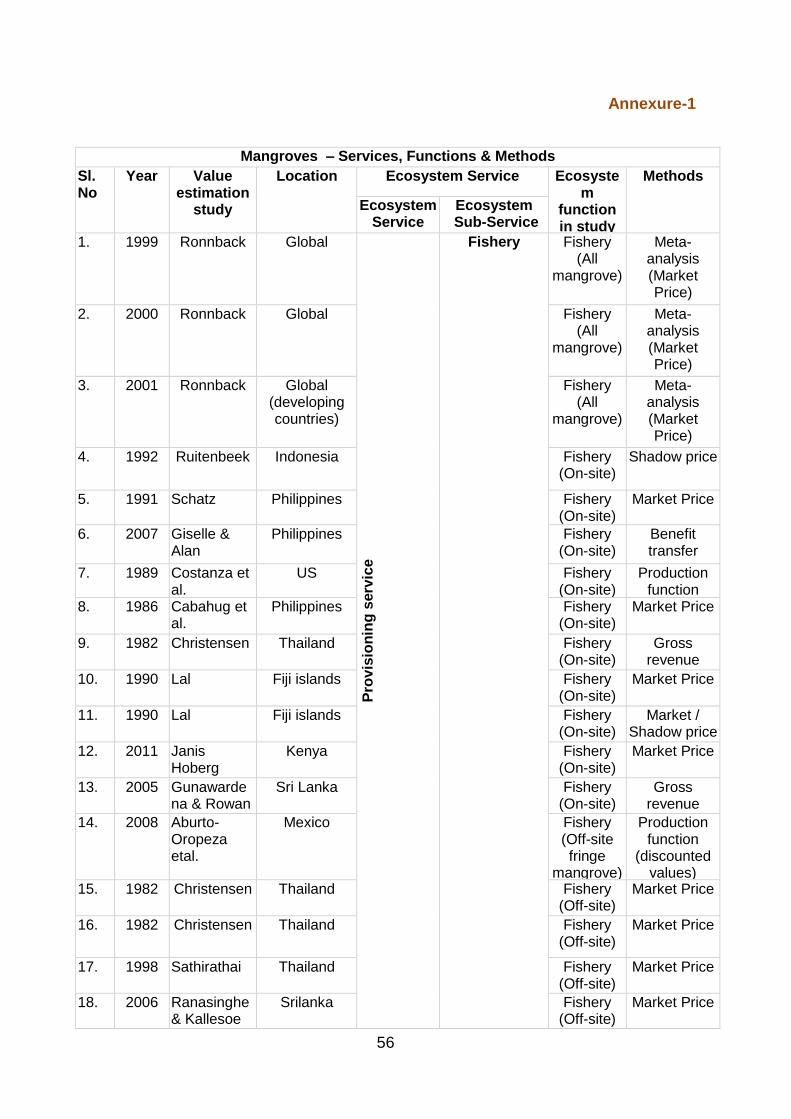
56
Annexure-1
Mangroves – Services, Functions & Methods
Sl. No
Year Value estimation
study
Location Ecosystem Service Ecosystem
function in study
Methods
Ecosystem Service
Ecosystem Sub-Service
1. 1999 Ronnback Global
Pro
vis
ion
ing
serv
ice
Fishery Fishery (All
mangrove)
Meta-analysis (Market Price)
2. 2000 Ronnback Global Fishery (All
mangrove)
Meta-analysis (Market Price)
3. 2001 Ronnback Global (developing countries)
Fishery (All
mangrove)
Meta-analysis (Market Price)
4. 1992 Ruitenbeek Indonesia Fishery (On-site)
Shadow price
5. 1991 Schatz Philippines Fishery (On-site)
Market Price
6. 2007 Giselle & Alan
Philippines Fishery (On-site)
Benefit transfer
7. 1989 Costanza et al.
US Fishery (On-site)
Production function
8. 1986 Cabahug et al.
Philippines Fishery (On-site)
Market Price
9. 1982 Christensen Thailand Fishery (On-site)
Gross revenue
10. 1990 Lal Fiji islands Fishery (On-site)
Market Price
11. 1990 Lal Fiji islands Fishery (On-site)
Market / Shadow price
12. 2011 Janis Hoberg
Kenya Fishery (On-site)
Market Price
13. 2005 Gunawardena & Rowan
Sri Lanka Fishery (On-site)
Gross revenue
14. 2008 Aburto-Oropeza etal.
Mexico Fishery (Off-site fringe
mangrove)
Production function
(discounted values)
15. 1982 Christensen Thailand Fishery (Off-site)
Market Price
16. 1982 Christensen Thailand Fishery (Off-site)
Market Price
17. 1998 Sathirathai Thailand Fishery (Off-site)
Market Price
18. 2006 Ranasinghe & Kallesoe
Srilanka Fishery (Off-site)
Market Price

57
Mangroves – Services, Functions & Methods
Sl. No
Year Value estimation
study
Location Ecosystem Service Ecosystem
function in study
Methods
Ecosystem Service
Ecosystem Sub-Service
19. 2015 UNEP Vietnam Fishery (Off-site)
Market Price
20. 2007 Barbier Thailand Fishery (Off-site)
Market Price
21. 2001 Sathirathai & Barbier
Thailand Fishery (Off-site)
Net factor income
/production function
22. 2002 Spurgeon Egypt Fishery (Off-site)
Market Price
23. 2007 Giselle &Alan
Philippines Fishery (Individual
group)
Market Price/ production
function
24. 1998 Nielson et al Vietnam Fishery (Individual
group)
Market Price
25. 1986 Cabahug et al
Philippines Fishery (Individual
group)
Market Price
26. 1999 Khalil Pakistan Fishery (Individual
group)
Gross revenue
27. 1985 Kapestky Egypt Fishery (Individual
group)
Market Price
28. 1986 Cabahug et al.
Philippines Fishery (Individual
group)
Market Price
29. 1986 Cabahug et al.
Philippines Fishery (Individual
group)
Market Price
1. 2003 Ronnback etal
India Aquaculture Shrimp spawner
Market Price/ production
function
1. 2005 Gunawardena, M&J. S. Rowan
Sri Lanka Fuel & timber Firewood Market Price
2. 2011 Janis Hoberg
Kenya Fuel wood Market Price
3. 1992 Ruitenbeek Indonesia Wood Shadow price
4. 1998 Gilbert AJ & Janssen
Selected countries
Wood Market Price
5. 2000 Tri Vietnam Wood product
Net factor income
6. 2015 UNEP Vietnam Timber & firewood
Market Price/ net factor income

58
Mangroves – Services, Functions & Methods
Sl. No
Year Value estimation
study
Location Ecosystem Service Ecosystem
function in study
Methods
Ecosystem Service
Ecosystem Sub-Service
7. 2016 UoN & UNEP
Kenya Fire wood & charcoal
Market Price
8. 1998 Cabrera et.al
Mexico Charcoal Net Revenue
9. 1982 Christensen Thailand Charcoal Market Price
10. 2016 UoN & UNEP
Kenya Building materials
Market Price
11. 1998 Sathirathai Thailand Forestry products
Cost benefit analysis
12. 1990 Lal Fiji Forestry products
Gross revenue
13. 2000 Tri Vietnam Thatch Net factor income
1. 2002 James Spurgeon
Egypt Fodder Fodder Substitute product pricing
1. 2015 Sundarban tiger reserve.org
India Honey collection
Honey Market Price
2. 1998 Tri et.al Vietnam Honey Market Price
3. 2016 UoN & UNEP
Kenya Honey Market Price
1. 1992 Ruitenbeek Indonesia Medicinaluses Medicine Market Price
2. 1997 Bann Cambodia Medicine Gross revenue
1. 2009 Verma & Das et.al
India
Re
gu
lati
ng
serv
ice
Protection function
Storm Protection
Avoided mortality
2. 2007 Barbier et.al. Thailand Storm protection
Expected damage function
3. 2003 Batagoda Srilanka Storm protection
Benefit transfer
4. 2003 Ruchi Badola et.al
India Storm protection
Damage cost avoided
5. 2005 Gunawardena et.al
Srilanka Erosion control / Storm
protection
Replacement cost
6. 2009 Saudamini Das
India Storm Protection.
..
Damage cost avoided
7. 2012 Piyashi DebRoy
India Storm Protection
Surrogate pricing method
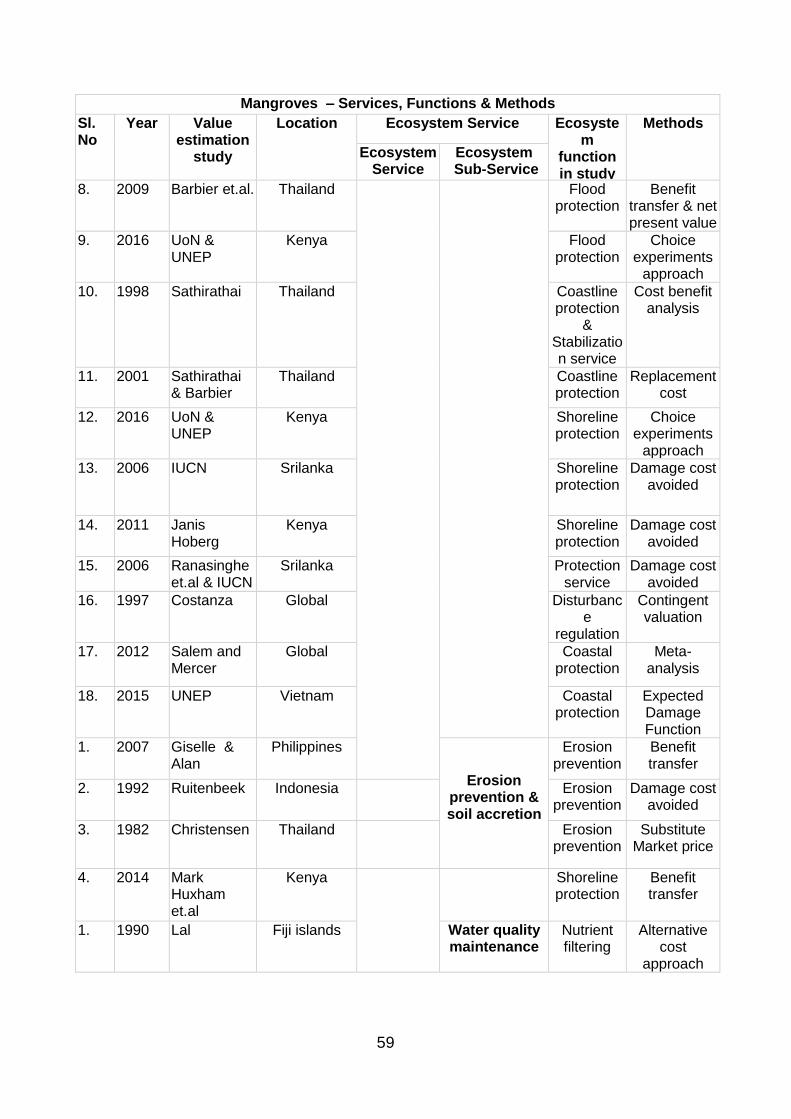
59
Mangroves – Services, Functions & Methods
Sl. No
Year Value estimation
study
Location Ecosystem Service Ecosystem
function in study
Methods
Ecosystem Service
Ecosystem Sub-Service
8. 2009 Barbier et.al. Thailand Flood protection
Benefit transfer & net present value
9. 2016 UoN & UNEP
Kenya Flood protection
Choice experiments
approach
10. 1998 Sathirathai Thailand Coastline protection
& Stabilization service
Cost benefit analysis
11. 2001 Sathirathai & Barbier
Thailand Coastline protection
Replacement cost
12. 2016 UoN & UNEP
Kenya Shoreline protection
Choice experiments
approach
13. 2006 IUCN Srilanka Shoreline protection
Damage cost avoided
14. 2011 Janis Hoberg
Kenya Shoreline protection
Damage cost avoided
15. 2006 Ranasinghe et.al & IUCN
Srilanka Protection service
Damage cost avoided
16. 1997 Costanza Global Disturbance
regulation
Contingent valuation
17. 2012 Salem and Mercer
Global Coastal protection
Meta-analysis
18. 2015 UNEP Vietnam Coastal protection
Expected Damage Function
1. 2007 Giselle & Alan
Philippines
Erosion prevention & soil accretion
Erosion prevention
Benefit transfer
2. 1992 Ruitenbeek Indonesia Erosion prevention
Damage cost avoided
3. 1982 Christensen Thailand Erosion prevention
Substitute Market price
4. 2014 Mark Huxham et.al
Kenya Shoreline protection
Benefit transfer
1. 1990 Lal Fiji islands Water quality maintenance
Nutrient filtering
Alternative cost
approach

60
Mangroves – Services, Functions & Methods
Sl. No
Year Value estimation
study
Location Ecosystem Service Ecosystem
function in study
Methods
Ecosystem Service
Ecosystem Sub-Service
2. 2010 Harahab Indonesia Seawater intrusion
prevention
Annual benefit value
3. 2015 Abdul Malik et.al
Indonesia
Seawater intrusion
prevention
Replacement cost /benefit
transfer
1. 2003 Chumra et.al.
Global Carbon sequestration
Carbon sequestrati
on
Global carbon
sequestration rate
2. 2016 UoN & UNEP
Global Carbon sequestrati
on
Global Market price
3. 2012 Salem & Mercer
Global Carbon sequestrati
on
Meta-analysis
4. 2015 UNEP Kenya Carbon sequestrati
on
Market price
5. 1998 Sathirathai Thailand Carbon sequestrati
on
Replacement Cost
6. 2015 Abdul Malik et.al
Indonesia Carbon sequestrati
on
Benefit transfer
7. 2011 Janis Hoberg
Kenya Carbon sequestrati
on
Benefit transfer
8. 2001 De Lopez et.al
Cambodia Carbon sequestrati
on
Market price
9. 2012 Piyashi DebRoy et.al
India Carbon sequestrati
on
Surrogate pricing &
replacement cost
1. 1993 Bennet & Reynolds
Malaysia
Cu
ltu
ral
serv
ice
Tourism Tourism Factor Income /
Production Function
2. 2015 UNEP Kenya Tourism Travel cost
3. 2010 Janis Hoberg
Kenya Tourism Travel cost
4. 2009 Kairo et.al Costa Rica Tourism Market price, Net Income
5. 2012 Piyashi DebRoy et.al
India Tourism Factor Income/

61
Mangroves – Services, Functions & Methods
Sl. No
Year Value estimation
study
Location Ecosystem Service Ecosystem
function in study
Methods
Ecosystem Service
Ecosystem Sub-Service
Production Function
(Travel cost)
7. 2016 UNEP Kenya Tourism Travel cost
1. 2017 NCSCM India Bird nesting ground
Bird nesting ground
Benefit transfer (meta-
analysis)
1. 2011 Janis Hoberg
Kenya Education Research Benefit transfer
2. 2016 UoN & UNEP
Global Research Choice experiments
approach
1. 1992 Ruitenbeek Indonesia
Su
pp
ort
ing
serv
ice
Biodiversity & Nursery ground support
Biodiversity
International agriculture
benefit transfer
2. 2007 Giselle & Alan
Philippines Biodiversity
Benefit transfer
3. 2016 UoN & UNEP
Global Biodiversity
Choice experiments
approach
4. 2015 Abdul Malik et.al
Indonesia Nursery service
Replacement cost/ benefit
transfer
5. 2007 Giselle & Alan
Philippines Nursery service
Benefit transfer
6. 2016 UNEP Kenya Nursery service
A choice experiments
approach 1. 2012 Jonathan
et.al Global Nutrient & soil
formation support
Oyster Nutrient retention
Benefit transfer
2. 2003 Badola, R., Hussain
India Bhitarkanika
Nutrient retention
Market price

62
Annexure-2
Nestinggrounds of bird table:
No of overlapped
nesting grounds of
birds patches
State Overlapped patch
Total economic
value
Nesting grounds of
birds (mangroves) distribution
- ha
1 Gujarat Khijadia Bet 251122925 982.4
1 Maharastra Madangad 2865855 11.1
14 Tamil Nadu Muthupet Mangrove
1455720428 5696.3
28 Tamil Nadu Pichavaram Mangrove
297580310 981.8
1 Andhra Pradesh Pulicat Lake 25684603257 99387.4
5 Odisha Bhitarkanika Mangrove
18629029969 72397.4
1 West Bengal Sajenkhali 11037918810 43092.5
3 West Bengal Sagar Island 69859034 273.3
1 West Bengal Sunderbans 55750075364 217787.3
1 West Bengal Bulcherry Island
551558468 2158.2
30 Andaman & Nicobar Hanspuri 1549664260 6061.4
1 Andaman & Nicobar Car Nicobar Island
122463199 479.1
1 Andaman & Nicobar Chidiya Tapu 5019762 19.6
1 Andaman & Nicobar Henry Lawrence Island
1393210208 5450.7
1 Andaman & Nicobar Interview Island 2624602822 10253.3
1 Andaman & Nicobar Mahatma Gandhi Marine National Park
7820397864 30601.7
1 Andaman & Nicobar Montgommery Island
6363398 20.4
1 Andaman & Nicobar Passage Island 328604698 1283.8
1 Andaman & Nicobar Petrie Island 3112941 12
1 Andaman & Nicobar Reef Island 17435299 68.2
1 Andaman & Nicobar Reing-Reing 169378139 662.7
1 Andaman & Nicobar Rafters Creek 162119381 600.9
1 Andaman & Nicobar Shearme Island Wildlife sanctuary
3859425 15.1
1 Andaman & Nicobar Trinkut 328598504 1285.3
99
128265164320 (12826 crore)
499583.2 ha

63
Annexure-3
Physical flow of mangroves ecosystem service
S.No Ecosystem services
Production Capacity / ha /yr
Value / ha
Source Country
1 Provisioning service
1.1
Fishery
1,100 kg to 11,800 kg / ha
900- 12400 $
Ronnback (2000)
Indonesia
90 - 225 kg / ha 94 $ Kapestky (1985) Egypt
10 – 50 kg / ha 30 – 150 $
Spurgeon (2002)
Egypt
32 kg / ha (22.1538 tons / 620 ha)
44 $ Janis Hoberg (2011)
Kenya
164 kg / ha (36 tons / 200 ha)
493 $ Gunawardena and Rowan., (2005)
Srilanka
349 kg / ha (24020 tons / 62436 ha)
50 $ UNEP (2015) Vietnam
3577 kg / ha (on & off shore) 1739 kg / HH 144 tot HH
4,861 - 12,964 $
Ranasinghe and Kallesoe (2006)
Srilanka
8655 kg / ha (on & off shore) 3462000 kg / 400 ha
21- 69 $ Sathirathai and Barbier (2001)
Thailand
147 - 331 kg / ha 60-240 $
Lal (1990) Fiji islands
Crustaceans, Penaeid shrimp
16–165 kg / ha 112- 1155 $
Ronnback (1999)
Indonesia
13–756 kg / ha 91- 5292 $
Turner (1977) Worldwide survey
515 kg / ha 3.605 $ Gedney et al. (1982)
Peninsular malaysia
130-350 kg / ha 910-2450 $
Pauly and ingles (1986)
Philippines
161 kg / ha 1.127 $ Naamin (1990) Java, Indonesia
18 kg / ha 126 $ Ruitenbeek (1994)
Irian jaya, Indonesia
670 kg / ha 4.690 $ Singh et al. (1994) chan et al. (1993)
Perak, Malaysia
274 kg / ha 1.918 $ Hambrey (1996) Sumatra, Indonesia
Suggested shrimp
63 kg / ha 19 $ Gedney (1982) Peninsular malaysia
29 kg / ha 9 $ FAO (1998), Spalding et al., (1997)
Malaysia
113 kg / ha 34 $ FAO (1998), Spalding et al., (1997)
Philippaines

64
Physical flow of mangroves ecosystem service
S.No Ecosystem services
Production Capacity / ha /yr
Value / ha
Source Country
89 kg / ha 27 $ FAO (1998), Spalding et al., (1997)
Thailand
Mangrove mud crab
34 kg / ha 102 $ Hill (1975) Kowie, south africa
13 kg / ha 39 $ Christensen (1982)
Chanthaburi, Thailand
15 kg / ha 45 $ Gedney et al (1982)
Peninsular Malaysia
17 kg / ha 51 $ Macintosh (1982)
Andrah Pradesh, India
17-23 kg / ha 51-69 $ Sivasubramaniam and Angell (1992)
India, Madagaskar, Thailand
64 kg / ha 352 $ Naylor and Drew (1999)
Kosrare, micronesia
Fish 549 kg / ha 549 $ Gedney et al. (1982)
Peninsular Malaysia
257 kg / ha 475 $ Lal (1990) Fiji
5.840 kg / ha 5330 $ Morton (1990) Queensland, Australia
900 kg / ha 713 $ Singh et al (1994). Chan et al (1993)
Perak, Malaysia
Molluscs _ Blood Cockles
500-750 kg / ha 140-210 $
Macintosh (1982)
Perak Malaysia
Edible Molluscs
979 kg / ha 274 $ NRMC and NMC (1986)
Negros Oriental, Philippines
1.2 Aquaculture 0.8-1.5 kg / ha 92-184 $
Ronnback (2003)
India
1.3
Fuelwood and timber function
1.2 kg / ha 24 $ gunawardena M .J. S. Rowan (2005)
Sri lanka
1.5 kg / ha 164–235 $
UNEP (2015) Vietnam
13200 bundles / yr ( 21 bundles / ha)
16.8 $ Janis Hoberg (2011)
Kenya
1 - 12 m3 / ha 30 $ Christensen (1982)
Thailand
1.4 Fodder function
4.5 kg/household/day 16.15 $ James spurgeon (2002)
Egypt
1.5 Honey Collection
47,412 kgs / Sunderban tiger reserve (0.11 kg/ ha)
11 $ (Rs)
Sundarban tiger reserve data (2015)
India
0.2 kg/ha 4-5 $ Tri et al (1998) Vietnam

65
Physical flow of mangroves ecosystem service
S.No Ecosystem services
Production Capacity / ha /yr
Value / ha
Source Country
1.6 Medicinal uses
- 0.1 - 60 $
Ruitenbeek (1992), Bann (1997)
Indonesia
2 Regulation service
2.1 Protection Function
Avoided mortality method - 0.0148 lives saves / ha 11.7 million rupees / life saved ( Orissa super cyclone )
173333 Rs
Verma & Das et.al (2009)
India
Replacement cost analysis - costs incurred to have erosion control and/or storm-control structures such as sea walls, revetments, or groins / km = study area km value / mangrove ha
300 $ Gunawardena et.al (2005)
Srilanka
Replacement cost analysis - 1 mtr = 75 m width stand of mangroves., over 20 yrs period of annualized benefit
1800 $ Sathirathai (1998)
Thailand
Replacement cost analysis - 1 mtr = 75 m width stand of mangroves., over 20 yrs period of 10% discount rate for annualized benefit
3000 $ Sathirathai & Barbier (2001)
Thailand
Expected damage cost analysis change in 1 km2 mangrove area / yr = economic damages per coastal event / yr
3679 $ Barbier (2007) Thailand
Based on expected damage avoided value per ha from Barbier (2007) includes Net present value per ha (10–15% discount rate)
11000 $ Barbier (2009) Thailand

66
Physical flow of mangroves ecosystem service
S.No Ecosystem services
Production Capacity / ha /yr
Value / ha
Source Country
InVEST Coastal vulnarability model - Epected damage cost analysis Vulnerability index in the coastal area with presence of mangrove and without mangrove no. of disasters (8) dead/ missing (3) injured (2) destroyed houses (46) destroyed boats (4) / yr = mangrove area ha
742- 756 $
UNEP (2015) Vietnam
Benefit transferred value / ha from (Das, S. 2007) storm protection by mangroves in orissa super cyclone
653.98 $
Kavi kumar et.al (2016)
India
Expected damage cost analysis - 990 dead and injured people for 20 yrs = economic damages for 20 yrs coastal event Replacement cost analysis - costs incurred to sea dike system Restoration cost - plantation cost / ha
391816 $
Bann (1997) Vietnam
Actual damages avoided method per household - October 1999 cyclone - Eleven variables were used to compare damage in the villages (Damage to houses, Tree damage ,Damage to other personal property, Damage to livestock in money terms , Flooding in premises, Flooding in fields, Water logging in fields, Cost of repair and reconstruction, Yield (kg ha−1 ), Loss of fish seedlings, total quantifiable variables ) one protected by mangroves one unprotected by
116.28 $
Ruchi Badola (2003)
India

67
Physical flow of mangroves ecosystem service
S.No Ecosystem services
Production Capacity / ha /yr
Value / ha
Source Country
mangroves possessing an embankment on its seaward side.
Epected damage cost analysis - D = d Vi Wi Pi Si where i represents the location (villages), Di is the damage suffered, Vi is velocity of wind, Wi is velocity of storm surge or the severity of flooding due to surge, Pi is population or property at risk and, Si is the group of socio-economic factors at the location using OLS & WLS estimate
51168 $(Rs)
Saudamini Das (2009)
Orrisha
Surrogate pricing - The cost of constructing tsunami wall along the coast (pichavaram)
2181818 Rs
Piyashi DebRoy (2012)
India
Assuming 700 houses value, Likelihood of any severe weather event at the Kenyan coastline per year 5% Epected damage cost analysis - 5% value taken out of total value / Mangroves (ha)
91.7 $ Janis Hoberg (2011)
Kenya
Epected damage cost analysis - loss of agricultural crops,human injuries, and loss of income during the period of disability
3300 – 9500 $
Ranasinghe et.al & IUCN (2006)
Srilanka
2.2
Erosion prevention and soil accretion
Based on agricultural output from local production
240 $ Ruitenbeek (1992)
Indonesia
Benefit transferred value / ha from Tridoyo, 1998
672 $ Giselle & Alan (2007)
Philippines
Coastline prevention value (CPV) CPV =
694 - 3767 $
Abdul Malik et.al (2015)
Indonesia

68
Physical flow of mangroves ecosystem service
S.No Ecosystem services
Production Capacity / ha /yr
Value / ha
Source Country
coastal length (m) ×cost of breakwater construction (USD)
Ref. protection function - Gunawardena et.al (2005), Barbier (2007),Barbier (2009), Ruchi Badola (2003)
2.3 Water quality maintenance
32 ha mangrove land = cost incured for sewage treatment (oxidation ponds) sewerage volume cm3 / yr = cost of oxidation ponds 0.8 million (Green 1983)
5820 $ Lal (1990) Fiji islands
Replacement cost - Seawater intrusion prevention value (SwIPV) SwIPV = household population x number of water supply (gallon/day) × Price (USD/gallon) ×365 days (gallon/yr = mangrove area ha)
476 $ Abdul Malik et.al (2015)
Indonesia
2.4
Carbon Sequestration
1.5 tC / ha *** Ong (1993) Malaysia
3.3 - 7.2 ton C / ha 30.50 $ Chumra et.al. (2003)
Global
580 g / m2 - Fujimoto (2000) Japan
2.27 ton C / ha - Lucy Emerton (2014)
Switzerland
4.85 tC / ha - Lang'at et al., (2014)
3.67 tC / ha 325 $ UNEP (2015) Vietnam
15.1 tC/ ha 100 $ Sathirathai (1998)
Thailand
15.1 tC/ ha 126 $ Janis Hoberg (2011)
Kenya
2.8 tC/ ha 2 $ De Lopez et.al (2001)
Cambodia
20 tC/ ha 3303000 $
Piyashi DebRoy et.al (2012)
India
6.3 tC / ha 2614 $ Kavi kumar et.al (2016)
India
3 Cultural services

69
Physical flow of mangroves ecosystem service
S.No Ecosystem services
Production Capacity / ha /yr
Value / ha
Source Country
3.1
Tourism 1380 visitors / tot mangrove ha
6.5 $ Janis Hoberg (2010)
Kenya
260000 visitors / tot mangrove ha
25 $ UNEP (2015) Kenya
911 visitors = tot mangrove ha
9.3 $ Kairo et.al (2009)
Costa Rica
1lakh visitors , 25000 boats (3 - 4 trip per boat) 150 Rs / boat
143182 $
Piyashi DebRoy et.al (2012)
India
3.2 Bird nesting ground patches
patch wise *
NCSCM (Bird nesting ground value)
3.3 Education tot amount of funding for mangrove research 5 PhD , 9 Msc, 4 Bsc value / yr / tot mangrove area
114000 $
Janis Heberg (2011)
Kenya
4 Supporting service
4.1
Biodiversity and nursery ground support
The Indian mangroves comprise approximately 59 species in 41 genera and 29 families. The species composition is varying between east coast, west coast and island mangroves.
- Deshmukh (1991), ENVIS Centre (2002)
India
Computed using diver’s willingness-to-pay of $4 on Alona Beach, Panglao, Bohol and no.of divers during peak and lean months in the three municipalities
*** Giselle & Alan (2007), Arin & Kramer (2002)
Philippines
Provision of nursery grounds value (PNGV) PNGV =loss volume of fish catch (kg/year) x fish price (USD/kg)/total loss of mangrove area during the period 2003–2011 (612 ha)
2292 $ Abdul Malik et.al (2015)
Indonesia
4.2
Nutrient & soil Formation
1 kg litter / m2 - Mumby et al (2004)
Belize & Mexico
143.5 Kg N/ ha (Nitrogen removal by oyster reef habitat)
10325 $ Jonathan et al (2012)
Global
2907kg N , 28.1kg P, 1564.55kg K / ha
350 $ Badola , Hussain (2003)
India