Assessment of CO2 emission reduction and identification of CDM potential in a township
11
ORIGINAL ARTICLE Assessment of CO 2 emission reduction and identification of CDM potential in a township Rohit Misra & Tarun Kumar Aseri & Doraj Kamal Jamuwa & Vikas Bansal Received: 10 August 2010 / Accepted: 8 April 2012 / Published online: 22 May 2012 # Springer Science+Business Media B.V. 2012 Abstract This paper presents the theoretical investi- gation of CDM opportunity in a township at Jaipur, India. The purpose of study is to identify and analyze the various opportunities viz., installation of solar water heater, energy efficient lighting, energy efficient air conditioners, and energy efficient submersible wa- ter pumps in desert coolers and thus achieve a consid- erable (65.7 %) reduction in GHG emissions. Out of the various opportunities considered, the retrofitting with solar water heater can be recommended for CDM. Though, the retrofitting with energy efficient lighting, energy efficient air conditioners and energy efficient submersible water pumps in desert coolers claimed CO 2 emission reduction of 104.84, 25.92, and 36.94 tons per annum, respectively, but the only opportunity which got through CDM was retrofitting with solar water heater claiming 115.70 tCO 2 (100 %) emission reductions per annum which could result into net earnings of 115.70 CERs. The simple and dis- counted payback period for all four project activities are also calculated with and without CDM and tax benefits. Keyword Internal rate of return (IRR) . Clean development mechanism (CDM) . Solar water heater (SWH) . Approved small scale methodology (AMS) . Certified emission reduction (CER) . Life cycle cost (LCC) . Simple payback period (SPP) . Discounted payback period (DPP) Introduction The Kyoto Protocol adopted at the 3rd session of the Conference of the Parties (COP3) to the United Nations Framework Convention on Climate Change (UNFCCC) held in Kyoto, Japan, in December 1997 (Mizuno 2009) defines and sets quantified greenhouse gas (GHG) emissions reduction targets for Annex I countries (mainly industrialized countries and countries with economies in transition) and establishes the three cooperative mechanisms viz. International Emission Trading, Joint Implementation, and Clean Development Mechanism. The Clean Development Mechanism (CDM) is an arrangement under the Kyoto Protocol allowing industrialized countries with a greenhouse gas reduction commitment to invest in ventures that reduce emissions in developing countries Energy Efficiency (2012) 5:471–481 DOI 10.1007/s12053-012-9156-8 R. Misra (*) : T. K. Aseri : D. K. Jamuwa Department of Mechanical Engineering, Government Engineering College, Ajmer, Rajasthan, India e-mail: [email protected] T. K. Aseri e-mail: [email protected] D. K. Jamuwa e-mail: [email protected] V. Bansal Department of Mechanical Engineering, Government Mahila Engineering College, Ajmer, Rajasthan, India e-mail: [email protected]
-
Upload
vikas-bansal -
Category
Documents
-
view
215 -
download
2
Transcript of Assessment of CO2 emission reduction and identification of CDM potential in a township
ORIGINAL ARTICLE
Assessment of CO2 emission reduction and identificationof CDM potential in a township
Rohit Misra & Tarun Kumar Aseri & Doraj Kamal Jamuwa & Vikas Bansal
Received: 10 August 2010 /Accepted: 8 April 2012 /Published online: 22 May 2012# Springer Science+Business Media B.V. 2012
Abstract This paper presents the theoretical investi-gation of CDM opportunity in a township at Jaipur,India. The purpose of study is to identify and analyzethe various opportunities viz., installation of solarwater heater, energy efficient lighting, energy efficientair conditioners, and energy efficient submersible wa-ter pumps in desert coolers and thus achieve a consid-erable (65.7 %) reduction in GHG emissions. Out ofthe various opportunities considered, the retrofittingwith solar water heater can be recommended forCDM. Though, the retrofitting with energy efficientlighting, energy efficient air conditioners and energyefficient submersible water pumps in desert coolersclaimed CO2 emission reduction of 104.84, 25.92,and 36.94 tons per annum, respectively, but the onlyopportunity which got through CDM was retrofittingwith solar water heater claiming 115.70 tCO2 (100 %)
emission reductions per annum which could result intonet earnings of 115.70 CERs. The simple and dis-counted payback period for all four project activitiesare also calculated with and without CDM and taxbenefits.
Keyword Internal rate of return (IRR) . Cleandevelopment mechanism (CDM) . Solar water heater(SWH) . Approved small scale methodology (AMS) .
Certified emission reduction (CER) . Life cycle cost(LCC) . Simple payback period (SPP) . Discountedpayback period (DPP)
Introduction
The Kyoto Protocol adopted at the 3rd session of theConference of the Parties (COP3) to the UnitedNations Framework Convention on Climate Change(UNFCCC) held in Kyoto, Japan, in December 1997(Mizuno 2009) defines and sets quantified greenhousegas (GHG) emissions reduction targets for Annex Icountries (mainly industrialized countries andcountries with economies in transition) and establishesthe three cooperative mechanisms viz. InternationalEmission Trading, Joint Implementation, and CleanDevelopment Mechanism. The Clean DevelopmentMechanism (CDM) is an arrangement under the KyotoProtocol allowing industrialized countries with agreenhouse gas reduction commitment to invest inventures that reduce emissions in developing countries
Energy Efficiency (2012) 5:471–481DOI 10.1007/s12053-012-9156-8
R. Misra (*) : T. K. Aseri :D. K. JamuwaDepartment of Mechanical Engineering,Government Engineering College,Ajmer, Rajasthan, Indiae-mail: [email protected]
T. K. Aserie-mail: [email protected]
D. K. Jamuwae-mail: [email protected]
V. BansalDepartment of Mechanical Engineering,Government Mahila Engineering College,Ajmer, Rajasthan, Indiae-mail: [email protected]
as an alternative to more expensive emission reduc-tions in their own countries, thus, contributing to sta-bilization of greenhouse gas concentrations in theatmosphere. A crucial feature of an approved CDMcarbon project is that it has established that theplanned reductions would not occur without the addi-tional incentive provided by emission reductions cred-its, a concept known as “additionality.”
An industrialized country that wishes to get creditsfrom a CDM project must obtain the consent of thedeveloping country hosting the project that the projectwill contribute to sustainable development. Then, usingmethodologies approved by the CDM Executive Board(EB), the applicant (the industrialized country) mustmake the case that the carbon project would not havehappened anyway (establishing additionality), and es-tablish a baseline estimating the future emissions inabsence of the registered project. The case is then vali-dated by a third party agency, called a Designated Op-erational Entity (DOE), to ensure that the project resultsin real, measurable, and long-term emission reductions(Shrestha et al. 2005). The EB then decides whether ornot to register (approve) the project. If a project isregistered and implemented, the credits called certifiedemission reductions (CERs, commonly known as car-bon credits, where each unit is equivalent to the reduc-tion of 1 metric ton of CO2 or its equivalent) are issuedby EB to project participants based on the monitoreddifference between the baseline and the actual emis-sions, duly verified by the DOE. To avoid giving creditsto projects that would have happened anyway (“free-riders”), rules have been specified to ensure additional-ity of the project, that is, to ensure the project reducesemissions more than that would have occurred in theabsence of the project.
The CDM projects can be carried out in a number ofsectors, such as energy industries (renewable/non-re-newable sources), manufacturing industries, chemicalindustries, fugitive emissions from fuels (solid, oil andgas), waste handling and disposal, agriculture, land use,etc. Out of the total registered project activities inUNFCCC, India bags 680 CDM projects (21.15 %), ason July 2011. CERs issued to India by UNFCCC aggre-gates to 95,758,431 which constitutes 15.12 % (as onJuly 2011) of the total CERs accounted globally.
Only one project relating to the solar photo voltaichas been requested for registration in the UNFCCCfrom India which aims to generate the 8,322 MWh ofnet electricity and reduce 7,862 metric tons of CO2
equivalent annually, utilizing clean solar energy andsupplies it to Tamil Nadu Electricity Board. The otherrequested CDM project for solar cooker in Chinainvolves the installation of 20,000 solar cookers withthe total installed capacity of 15.47 MW benefittingthe total population of 96,016 once the project is putinto operation.
Electricity savings obtained by lighting retrofit issufficient not only to pay for the installation of newlighting, but also produce return on the investment.Various studies (Stefano 2000; Lee 2000; Guan et al.1997; Kazakevicius et al. 1999;Mahlia et al. 2005, 2011)have been carried out on retrofitting inefficient light-ing by reducing input wattage. Mahlia et al. carriedout electricity savings, cost-benefit analysis, andemission reduction of lighting retrofits in Malaysiaresidential sector (Mahlia et al. 2005) and cost benefitanalysis in terms of potential energy saving, life cyclecost analysis, and payback period in campus build-ings of the University of Malaya, Malaysia (Mahlia etal. 2011). Singh and Michaelowa (2004) assessed theCDM potential considering the energy efficiency forlarge building in the Indian public and private sector.Pallav Purohit and Michaelowa (2008) assessed themaximum theoretical as well as the realisticallyachievable CDM potential of SPV lanterns and solarhome lighting systems in India.
Popularity of a room air conditioner has increasedenormously despite consuming a large amount ofelectricity. In real practice, electricity cost for runningan AC depends upon its energy efficiency as designedby its manufacturer, number of operating hours, andhow efficiently we operate and maintain it. Potentialelectricity savings (Mahlia et al. 2002) based on threescenarios (i.e., minimum expected, nominal, and max-imum expected) were calculated and the potentialmitigation of emissions (Mahlia et al. 2004) by imple-menting energy labels for room air conditioners inMalaysia.
Hens (2010) discussed the stepwise retrofit of anend of the row house that started in 1979 byinsulating roof, walls, and lowest floor, installinghigh performance windows, implementing a venti-lation system, upgrading the central heating system,and installing solar boiler and PV panels. Techatoet al. (2009) conducted the life cycle analysis tofind out the environmental impacts resulting fromsome energy conservation measures that producehazardous waste.
472 Energy Efficiency (2012) 5:471–481

Tsilingiridis et al. (2004) carried out the study oflife cycle environmental impact of Domestic Solar HotWater System and compared its results with that ofelectrical and gas water heaters. The production andutilization of the DSHWS have a “net” gain overelectrical heaters of at least 696 Pt up to a maximumof 2,117 Pt of environmental impact, depending on thesystem size. The net gain is reduced by a factor of 4when natural gas was used, instead of electricity.Crawford and Treloar (2004) carried out net the ener-gy analysis of solar hot water systems for period of10 years, and compared them with conventional hotwater systems in Melbourne, Australia. The solar hotwater systems provided a net energy saving comparedto the conventional systems after 0.5–2 years, forelectric- and gas-boosted systems, respectively.
Kalogirou (2009) carried out the study of the ther-mal performance, economics, and environmental pro-tection offered by thermosiphon solar water heatingsystems of the domestic size and showed that thesystem investigated, yielded positive and very prom-ising financial characteristics with payback time of2.7 years and life cycle savings of 2,240 € with elec-tricity backup and payback time of 4.5 years and lifecycle savings of 1,056 € with diesel backup.
This study presents the potential energy saving, lifecycle cost analysis, and payback period through theintroduction of energy efficient technologies (compactfluorescent lighting, solar water heater, efficient airconditioners, submersible water pumps in desert cool-ers) in a township.
Identification of CDM opportunities
Malaviya National Institute of Technology (MNIT)located in Jaipur, which is situated in Northern India ata distance of 260 km south of Delhi. The campus of theinstitute is spread over area of 312 acres. The campus
area has been organized into three functional sectors,viz. hostels for student, instructional buildings, and res-idential sector for the faculty and staffs. A substantialamount of grid energy is being consumed by all threesectors. As per the survey, MNIT residential sector con-sists of four types of residences for total 1,200 personsincluding faculty, staff, and their family members(Table 1). The identified CDM opportunities in thetownship involve the replacement of:
& The electric immersion coils or electric geyserswith the solar water heater (SWH) for the purposeof heating the water for household uses.
& The incandescent bulbs (IBs) and fluorescent tubeswith the energy efficient compact fluorescentlamps (CFLs).
& The energy intensive device, i.e., air conditionerwith the energy efficient air conditioner.
& The old energy inefficient water pumps in desertcooler with more energy efficient submersiblepumps fitted with automatic on/off timer.
Methodology and development of baseline
Any proposed CDM project has to use an approvedbaseline and a monitoring methodology to be validat-ed, approved and registered. Baseline Methodologywill set steps to determine the baseline within certainapplicability conditions whilst monitoring methodolo-gy will set specific steps to determine monitoringparameters, quality assurance, and equipment to beused, in order to obtain data to calculate the emissionreductions. The annual energy saving from the CDMproject activity is less than 60 GWh so the projectactivity falls under the small scale project activity(Fenhann et al. 2004) and there are two baseline meth-odologies that are applicable for the development ofthe baseline.
Table 1 Statistics of type ofresidence and accommodation intownship
Type of residence Accommodation Nos.
A 5 rooms, 1 dining hall, 3 wash-rooms, 1 kitchen,1 verandah, 1 servant quarter, 1 garage
01
B 4 rooms, 1 dining hall, 2 wash-rooms, 1 kitchen,1 verandah, 1 servant quarter
17
C 3 rooms, 2 wash-rooms, 1 kitchen, 1 verandah 98
D 2 rooms, 1 wash-room, 1 kitchen, 1 verandah 139
Total 255
Energy Efficiency (2012) 5:471–481 473

& AMS I.C. Thermal energy for the user with or with-out electricity (UNFCCC 2009). (For estimating thebaseline emission from the installation of SWH).
& AMS II.C. Demand side energy efficiency pro-grams for specific technology (UNFCCC 2009).(For estimating the baseline emission from retro-fitting the incandescent bulbs and air conditionersand submersible desert cooler pumps).
Development of baseline for solar water heatingsystem
Currently the heating of water for household purposesis done with electric immersion coils and/or electricgeysers. Under proposed CDM project activity, it hasbeen planned to replace these electric appliances withsolar water heating system. In this system, the baselineemissions are the amount of electricity obtained fromthe grid multiplied by the CO2 emission factor. Theemission factor for the grid is calculated as per theprocedures outlined in the approved small-scale meth-odology AMS I.D “Grid connected renewable elec-tricity generation” (UNFCCC 2009). The data andassumptions for estimation of baseline emissionreductions from solar water heating system are givenin the Table 2. Electrical energy required for heatingwater (from 283 to 338 K) is 1.0755 kWh/person. For4 months, the electricity consumed for heating water is139.39 MWh/year and the total amount of CO2 emit-ted is 115.69 tCO2/year. The CO2 emission factor(EFy) calculated as per AMSI.D and published byCentral Electricity Authority India for the northerngrid is 0.83 tCO2/MWh (2009).
Development of baseline for energy efficient lighting
For this project activity, the fluorescent tube and incan-descent bulb will be replaced by the CFLs to provide the
equal lumens. In each house, all 55 W fluorescent tubesand all 60W incandescent bulbs are being replaced with25 W CFL (cost US$ 6.27) (http://en.wikipedia.org/wiki/Compactfluorescentlamp). As per the small-scaleproject activity methodology AMS II.C (UNFCCC2009), if the energy displaced is electricity, the energybaseline is calculated as:
EB ¼ Σi ni � pi � oið Þwhere, EB annual energy baseline in kWh per year, Σi
the sum over the group of “i” devices replaced (e.g.,60 W incandescent bulb and 55 W fluorescent tubes),for which the replacement is operating during the year,implemented as part of the project, ni the number ofdevices of the group of “i” devices replaced for whichthe replacement is operating during the year, pi thepower of the devices of the group of “i” devicesreplaced. In the case of a retrofit activity, “power” isthe weighted average of the devices replaced. In the caseof new installations, “power” is the weighted average ofdevices replaced. oi the average annual operating hoursof the devices of the group of “i” devices replaced. Asper the specifications (Tiwari 2006), the life of CFL is11,000 h (5 years approximately).
This energy baseline when multiplied by the rele-vant emission factor for the grid, gives the baselineemission for the lighting system. Table 3 gives thenumber of IBs/FTLs to be retrofitted and their operat-ing hours. The baseline emission for lighting system isestimated as 186.18 tCO2/year.
Development of baseline for energy efficient airconditioners
The air conditioners (ACs) that are currently being usedin township are energy inefficient. In the project activity,the old air conditioners will be retrofitted by the energyefficient air conditioners. The baseline estimation for the
Table 2 Data/assumptions forsolar water heating system
aThe consumption of hot water is16 l per person per day. It isassumed that the 90 % of thetotal residents use hot waterdaily
Items Details
Hot water required for a person 16 l/day
Total number of persons in the township (approx.) 1,200
Total number of persons taking bath on a daya 1,080
Winter months (Nov.–Feb.)120 days
Efficiency of conversion of electrical energy to heat energy, ηconv(assuming 5 % heat losses)
95 %
474 Energy Efficiency (2012) 5:471–481

electricity consumption for the air conditioner can bedone as per the formula stated for the baseline estimationof lighting (UNFCCC 2009). The data and assumptionsused for calculating the baseline emission for air condi-tioners are given in the Table 4. For 6 months, theelectr ici ty consumed by air condit ioners is103.68 MWh/year and total amount of CO2 emitted isestimated as 86.05 tCO2/year.
Development of baseline for energy efficient desertcooler submersible water pumps
The conventional type desert cooler are being used intownship. In the project activity, the existing 35W ratedpump is retrofitted with 10 W submersible water pumpfitted with automatic on/off timer electronic circuit,which allows the pump to work intermittently, i.e., fora period of 5 min, so the actual operational hours ofpump are just halved. The data and assumptions used forcalculating the baseline emission from retrofitting theenergy efficient desert cooler submersible water pumps
(with automatic on/off timer) is given in the Table 5. Thebaseline emission reduction for the desert cooler isestimated as 43.09 tCO2/year.
Summary of the baseline emission
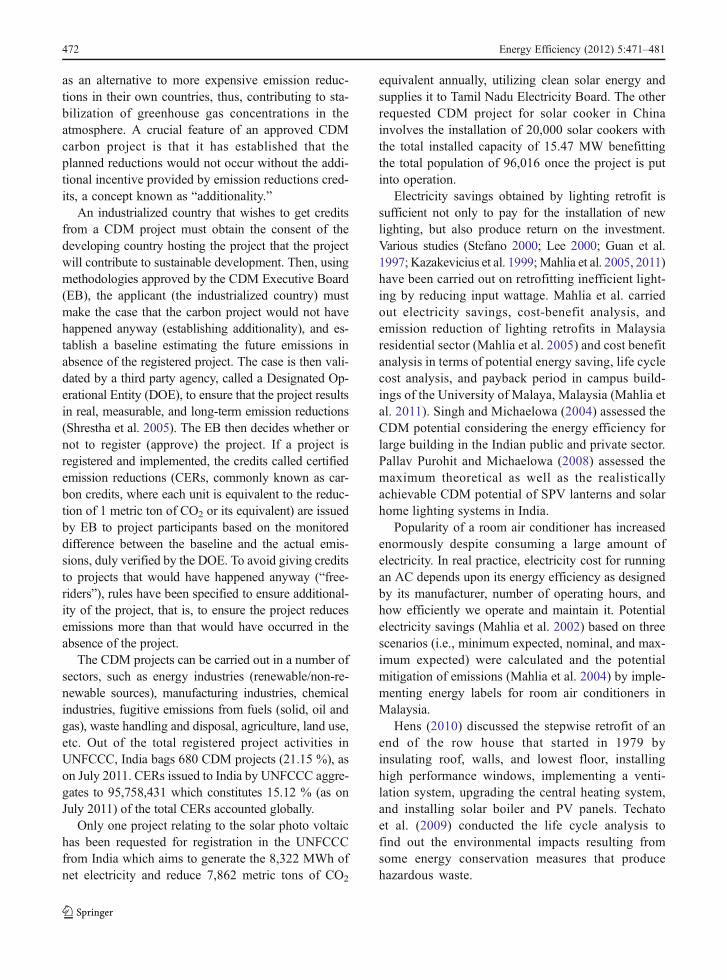
The baseline emission and emission from various retro-fitted item are summarized in the Fig. 1. This baselineemission estimation, also called as CER is used to issuethe carbon credit. The CER will be issued based uponthe emission reduction achieved by the project activity.In this case, the total CER is 431.02 tCO2/year, whichcan be used to generate the additional revenue to supportthe project activity. From Fig. 1 it is clearly depicted thatthe by using various retrofit activities the total reductionin CO2 emission is 283.39 t (65.7 %).
Additionality and investment analysis
CDM as such does not reduce the net global greenhousegas emissions (Michaelowa and Purohit 2006). For everyton of emissions reduced in a host country, an investor isallowed to emit 1 ton in Annex I country. If a CDMproject does not reduce emissions compared to whatwould have happened anyway (business as usual), thenthe net effect would be an increase in the global emis-sions. Therefore business-as-usual projects do not justcontribute to overall greenhouse gas emission reduction;they actually will increase the net emissions. The addi-tionality principle is thus of fundamental importance inthe CDM context. A CDM project is additional only ifgreenhouse gas emissions are reduced below those thatwould have occurred in the absence of the registeredCDM project activity. The tool for demonstration of
Table 4 Data/assumptions for retrofitting the ACs
Items Details
Number of ACs in township 30
Tonnage of existing andretrofitted ACs
1.5 ton
Energy efficiency ratio ofexisting ACs
2.16
Energy efficiency ratio ofretrofitted ACs
3.10
Operating hours 8 h/day for6 months
Table 3 Data for baseline emission estimation of lightingsystem
Place where retrofitting isbeing done
Nos. Operatinghours/day
Incandescent bulbs
Wash-room 510 3
Porch light 255 10
Main gate pillar lights 230 3
Fluorescent tubes
Kitchen 255 6
Dining hall, bed rooms 460 6
Rooms 280 6
Table 5 Data/assumptions for retrofitting the energy efficientdesert cooler submersible water pumps
Items Details
Number of Desert Coolers in township 475
Rated power of existing pumps 35 W
Rated power of retrofitted pumps 10 W
Percent of pumps to be retrofitted 90 %
Operating hours of existing pumps 16 h/day for6 months
Operating hours of retrofitted pumps(with automatic on/off timer)
08 h/day for6 months
Energy Efficiency (2012) 5:471–481 475
additionality (UNFCCC 2008) provides a stepwise ap-proach to demonstrate and assess the additionality for theproject activity. These steps include:
& Identification of alternatives to the project activity& Investment analysis& Common practice analysis
The project falls under the small-scale project ac-tivity as annual energy saving is less than 60GWh sothe additionality can be proved by any of these steps.In our case, the additionality has been proved bycarrying an investment analysis. Under investmentanalysis, a suitable financial indicator is chosen andcompared against the relevant industry regional/na-tional benchmark. The appropriate analysis methodchosen for the investment analysis is by conducting abenchmark analysis for each of the project activitywherein a financial indicator (here internal rate ofreturn (IRR)) will be compared against establishedvalue for respective technology.
Investment analysis for the solar water heating system
The IRR for the generation of hot water through thesolar water heating system is calculated. The data/assumptions for the IRR calculation are given inTable 6.
For this project activity the IRR obtained withoutthe CDM revenue is 8 % and with CDM revenue it is16 %, above the benchmark of 10 %. Therefore, on thebasis of economic rationale, the project developers donot install this solar energy technology without theCDM benefit. The low penetration of solar water
heater in the country reflects this fact. Thus, it is theCDM incentive and the green image that comes with itthat has induced the project developers to go for solarwater heating system.
The sensitivity analysis is done for the solar waterheating system for the rate of the electricity, operationand maintenance cost and the CER price. The sensi-tivity analysis in the Table 7 shows the conclusionregarding the financial attractiveness with variationsin the critical assumptions:
The above analysis shows that the project will havehigher IRR if the price of the electricity is escalated by10 % which is justified by increase in saving. Thecritical thing in the above sensitivity analysis is theoperation and maintenance, as solar water heater has
115.70
186.18
86.05
43.09
0.00
81.34
60.13
6.16
0
20
40
60
80
100
120
140
160
180
200
SWH Lighting AC SWP
Em
issi
on
(tC
O2 /y
ear)
Project activity
Baseline Emission (tCO2/yr)
Emission by retrofitted items (tCO2/yr)
Fig. 1 Summary of baseline emission
Table 6 Data/assumptions for the IRR calculation for solarwater heating system
Items Details
Project life 15 years
Rate of electricity US$ 0.151/kWh
Escalation on rate of electricity 5 %
Cost of solar water heater for100 l per day capacity
US$ 411
No. of SWH 220
Operation and maintenancecost per year
5 %
CER price 15 Euro
Exchange rate: 1 Euro US$ 1.44
Depreciation 65 %
Tax rebate 30 %
Table 7 Sensitivity analysis for solar water heating system
Cases IRR withoutCDM
IRR withCDM
Base case
(5 % escalation onelectricity price,5 % O&M charges,CER price 15 Euro
8 % 16 %
Electricity price
With 10 % escalation 16 % 22 %
Operation and maintenance cost
With 2 % O&M charges 16 % 22 %
CER price
With 12 Euro 8 % 15 %
With 18 Euro 8 % 18 %
476 Energy Efficiency (2012) 5:471–481

to be maintained yearly. IRR of the project withoutCDM support is greatly affected by O&M charges.The additional revenue through the CDM will be amotivating source for the installation of the SWH.
Investment analysis for energy efficient lighting
For this project, the baseline technology replaced is aCFL. In each house, 55 W fluorescent tube and 60 Wincandescent lamp will be replaced by CFL of rating25 W. The data and assumption for the calculation ofthe IRR for the lighting purpose are given in Table 8.
From the above data and assumption, the IRR forinstalling the energy efficient lighting is 131 % with-out CDM revenue and 148 % with CDM revenue. Soit is concluded that adopting energy efficient lightingis highly profitable as is seen by the higher value ofthe IRR and does not require the additional revenuefrom the CDM. The project activity is viable evenwithout the CDM.
Investment analysis for energy efficientair-conditioning
For the investment analysis of the air conditioners, theIRR for retrofitting the ACs is considered. The data/assumptions made for calculating the IRR of the proj-ect activity are tabulated in Table 9.
The IRR for installing the AC of 1.5 ton capacity iscalculated as 36 % without CDM benefits and 43 %with CDM benefits. In this case also, the IRR is highenough to make the project activity attractive withoutthe CDM benefit.
Investment analysis for energy efficient desert coolersubmersible water pump (SWP) fitted with automaticon/off timer
The data used/assumptions made for calculating theIRR of the project activity are tabulated in Table 10.
The IRR for installing the SWP is calculated as178 % without CDM benefits and 199 % with CDMbenefits. So it can be said that retrofitting of SWP ishighly profitable as is seen by the higher value of theIRR and does not require the additional revenue fromthe CDM. The project activity can go ahead evenwithout the CDM. The summary of project IRR forretrofitting activities is shown in Fig. 2
Payback period and life cycle cost analysis
Payback period
The payback period measures the amount of time need-ed to recover the additional investment (incrementalcost) on efficiency improvement through lower operat-ing costs. Payback period is important for financial
Table 8 Data/assumptions for the IRR calculation for retrofit-ting CFL
Items Details
Project life 11,000 h
Rate of electricity US$ 0.151/kWh
Escalation on rate of electricity 5 %
Cost of 25 W CFL US$ 6.27
No. of CFL to be retrofitted 1,990
Investment required US$ 12,477.3
Operation and maintenance cost per year 2 %
CER price 15 Euro
Exchange rate, 1 Euro US$ 1.44
Table 9 Data/assumptions for retrofitting AC
Items Details
Project life 10 years
Rate of electricity US$ 0.151/kWh
Escalation on rate of electricity 5 %
Cost of a unit of AC of 1.5 ton US$ 313.64
No. of ACs to be retrofitted 30
Operation and maintenance cost 5 %
CER price 15 Euro
Exchange rate, 1 Euro US$ 1.44
Table 10 Data/assumptions for retrofitting SWP
Items Details
Project life 5 years
Rate of electricity US$ 0.151/kWh
Escalation on rate of electricity per year 5 %
Cost of a SWP with timer US$ 6.49
No. of SWPs to be retrofitted 428
CER price 15 Euro
Exchange rate, 1 Euro US$ 1.44
Energy Efficiency (2012) 5:471–481 477

management to look whether the investment made ishaving a proper payback time.
The payback period is the ratio of the incrementalcost (from the baseline to the more efficient product)to the decrease in annual operating cost. If paybackperiod is greater than the lifetime of the product, itmeans that the investment made on energy efficiencymeasures is not recovered from reduced operatingcost. The payback period without the effect of timevalue of money is called simple payback period (SPP)as given by Eq. (1), while the payback period withtime vale of money is called discounted payback pe-riod (DPP). The value of payback period with taxbenefits is calculated as per the expressions given byTiwari (2006) and Agustin and Lopez (2006). The taxbenefits are given for promotion of renewable energysystems in India. The tax benefit of 30 % is consideredfor the calculation of payback period for investmenton solar water heater.
Simple payback period ¼ initial investmentðPÞannual net cash flow CFð Þ ð1Þ
where P0 initial investment; CF0annual uniform cashinflow (R)−annual uniform cash outflow (M).
The discounted payback period with time value ofmoney can be determined by using Eq. (2) reported byAgustin and Lopez (2006):
P ¼ R� 1þ ið Þnp � 1
i� 1þ 1ð Þnp� �
�M
� 1þ ið Þnp � 1
i� 1þ ið Þnp� �
ð2Þ
¼ R�Mð Þ � 1þ ið Þnp � 1
i� 1þ ið Þnp� �
Put CF0R−M in Eq. (2), one gets discounted pay-back period as follows (Tiwari 2006):
Discounted payback period ¼ ln CFð Þ= CF� P � ið Þ½ �ln 1þ i½ �
ð3Þ
Discounted payback periodwith tax benefits
¼ ln CFð Þ= CF� P � rð Þ½ �ln 1þ r½ � ð4Þ
The term “r” is interest rate with tax benefits. As-suming the values of R and M are constant throughoutthe life cycle. Based on this assumption, life cycle cost(LCC) analysis has been carried out to estimate thepayback period for the investment on retrofittingbased on Eqs. (1)–(4). The suitable annual interestrates considered for retrofitting are in the range of 4–16 % and the reasons for this are as follows:
1. 4 % is the subsidized interest rate normally offeredby government sectors in India to promote the useof renewable energy applications.
2. 7–8 % is the interest rate normally offered bygovernment banks.
3. 10–12 % is the interest rate offered by privatebanking sectors.
4. 12–16 % is the interest rate for any other privatesource.
Life cycle cost
A LCC analysis calculates the cost of a system orproduct over its entire life span. For this study, LCCis used to calculate the cost of energy efficiency im-provement measures based on design option. The LCCis the sum of investment cost (P) and the annualoperating cost (OC) discounted over the lifetime ofthe product.
Life cycle cost analysis and payback period of retrofitwith energy efficient lighting
For calculating the life cycle cost, the life span of IB,FTL, and CFL has been taken as 1,000, 11,000, and
8%
131%
36%
178%
16%
148%
43%
199%
0%
50%
100%
150%
200%
250%
SWH Lighting AC SWP
Pro
ject
IR
R
in %
Retrofitting activity
IRR Without CDM
IRR With CDM
Fig. 2 Summary of project IRR for retrofitting activities
478 Energy Efficiency (2012) 5:471–481
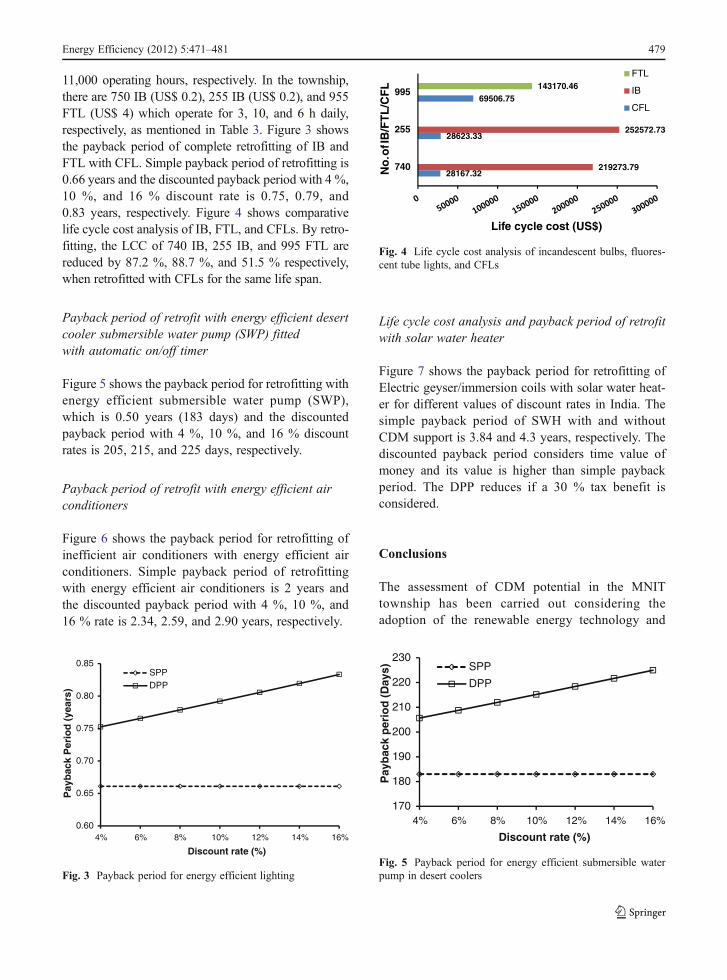
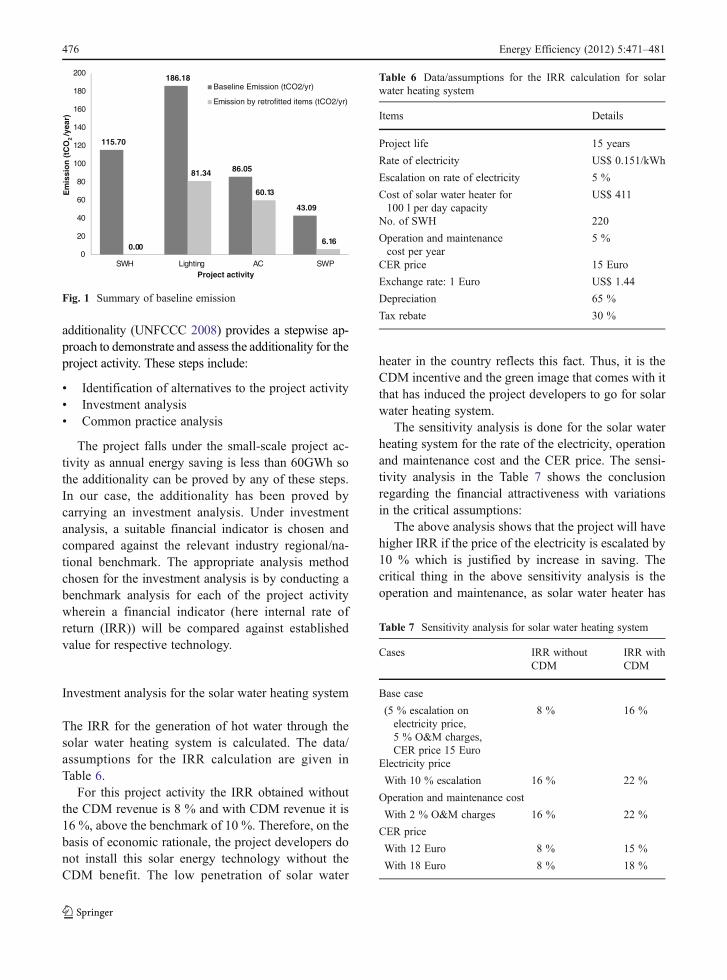
11,000 operating hours, respectively. In the township,there are 750 IB (US$ 0.2), 255 IB (US$ 0.2), and 955FTL (US$ 4) which operate for 3, 10, and 6 h daily,respectively, as mentioned in Table 3. Figure 3 showsthe payback period of complete retrofitting of IB andFTL with CFL. Simple payback period of retrofitting is0.66 years and the discounted payback period with 4 %,10 %, and 16 % discount rate is 0.75, 0.79, and0.83 years, respectively. Figure 4 shows comparativelife cycle cost analysis of IB, FTL, and CFLs. By retro-fitting, the LCC of 740 IB, 255 IB, and 995 FTL arereduced by 87.2 %, 88.7 %, and 51.5 % respectively,when retrofitted with CFLs for the same life span.
Payback period of retrofit with energy efficient desertcooler submersible water pump (SWP) fittedwith automatic on/off timer
Figure 5 shows the payback period for retrofitting withenergy efficient submersible water pump (SWP),which is 0.50 years (183 days) and the discountedpayback period with 4 %, 10 %, and 16 % discountrates is 205, 215, and 225 days, respectively.
Payback period of retrofit with energy efficient airconditioners
Figure 6 shows the payback period for retrofitting ofinefficient air conditioners with energy efficient airconditioners. Simple payback period of retrofittingwith energy efficient air conditioners is 2 years andthe discounted payback period with 4 %, 10 %, and16 % rate is 2.34, 2.59, and 2.90 years, respectively.
Life cycle cost analysis and payback period of retrofitwith solar water heater
Figure 7 shows the payback period for retrofitting ofElectric geyser/immersion coils with solar water heat-er for different values of discount rates in India. Thesimple payback period of SWH with and withoutCDM support is 3.84 and 4.3 years, respectively. Thediscounted payback period considers time value ofmoney and its value is higher than simple paybackperiod. The DPP reduces if a 30 % tax benefit isconsidered.
Conclusions
The assessment of CDM potential in the MNITtownship has been carried out considering theadoption of the renewable energy technology and
170
180
190
200
210
220
230
4% 6% 8% 10% 12% 14% 16%
Pay
bac
k p
erio
d (
Day
s)
Discount rate (%)
SPP
DPP
Fig. 5 Payback period for energy efficient submersible waterpump in desert coolers
28167.32
28623.33
69506.75
219273.79
252572.73
143170.46
740
255
995
Life cycle cost (US$)
No
.ofI
B/F
TL
/CF
L
FTL
IB
CFL
Fig. 4 Life cycle cost analysis of incandescent bulbs, fluores-cent tube lights, and CFLs
0.60
0.65
0.70
0.75
0.80
0.85
4% 6% 8% 10% 12% 14% 16%
Pay
bac
k P
erio
d (
year
s)
Discount rate (%)
SPPDPP
Fig. 3 Payback period for energy efficient lighting
Energy Efficiency (2012) 5:471–481 479

energy efficiency measures. Out of the four casesanalyzed for the CDM opportunities, the solarwater heating system requires the CDM benefitsto go ahead. The adoption of energy efficiencymeasures through energy efficient lighting, energyefficient air-conditioning, and energy efficient sub-mersible water pump with automatic on/off timerfor desert cooler does not require the CDM reve-nue as is seen from their higher rates of return of131 %, 36 %, and 178 %, respectively. Theseproject activities are the profitable options andcan be considered as business as usual options sothey will not get through the additionality criterionof CDM Executive Board. The only project activ-ity that passes the additionality criterion andrequires CDM benefits is the solar water heaters.The CER obtained from this project activity is115.70 tCO2 per year. To register this project asa CDM project with CDM Executive board, theCER generated is much less and will not be able
to cover the validation/verification and otherexpenses relating to registration. The CER gener-ated from the project should be at least1,000 CER/year to cover the expenses relating tothe registration. To generate more CER, bundlingof the similar CDM project activity with the near-by townships can be done. However, on overallbasis the adoption of renewable energy technologyand energy efficiency measures would save431.02 tCO2/year from emitting to the atmosphereand make small effort in curbing the globalwarming.
Simple payback period and discounted paybackperiod of retrofitting with energy efficient lightingand SWP is less than 1 year, whereas for air condi-tioner, the SPP is 2 year and DPP is in between 2 and3 years. Regarding SWH, the SPP is 3.84 years withCDM support.
The work carried out by earlier authors remainedconfined to a single appliance for the evaluation ofpotential energy savings, whereas in this study, thesaving in electricity consumption for retrofitting ofIB or FTL with energy efficient lighting such asCFL, inefficient air conditioners with efficient ones,electric geyser/immersion coils with SWH, and in-efficient conventional water pump with submersiblewater pumps fitted with automatic on/off timerelectronic circuit in desert coolers has been carriedout, taking all the energy intensive units into ac-count for entire township. This paper presents theCDM potential of such retrofitting measures, ifintegrated over various townships may prove to bea solution to the problem of energy crisis worldover.
1.90
2.10
2.30
2.50
2.70
2.90
4% 6% 8% 10% 12% 14% 16%
Pay
bac
k P
erio
d (
Yr)
Discount rate (%)
SPPDPP
Fig. 6 Payback period of retrofitting with energy efficient airconditioner
2
3
4
5
6
7
8
9
10
4% 6% 8% 10% 12% 14% 16%
Pay
bac
k p
erio
d (
Yea
rs)
Discount rate (%)
SPP without CDM support
SPP with CDM support
DPP without CDM support
DPP with CDM support
DPP with 30% tax benefit & No CDMsupportDPP with 30% tax benefit & with CDMsupport
Fig. 7 Payback period forretrofitting with solar waterheater
480 Energy Efficiency (2012) 5:471–481

References
Agustin, J. L. B., & Lopez, R. D. (2006). Economic and envi-ronment analysis of grid connected photovoltaic systems inSpain. Renewable Energy, 31, 1107–1128.
Crawford, R. H., & Treloar, G. J. (2004). Net energy analysis ofsolar and conventional domestic hot water systems in Mel-bourne, Australia. Solar Energy, 76, 159–163.
Fenhann, J., Halsnaes, K., Pacudan, R., & Olhoff, A. (2004).CDM Information and Guidebook, Second edition, UNEPRiso Centre on Energy, Climate and Sustainable Develop-ment, Riso National Laboratory Roskilde, Denmark, ISBN:87-550-3339-3.
Guan, F. M., Mills, E., & Qin, Z. (1997). Energy efficientlighting in China. Energy Policy, 25, 77–83.
Hens, H. (2010). Energy efficient retrofit of an end of the rowhouse: confronting predictions with long-term measure-ments. Energy and Buildings, 42, 1939–1947.
Kalogirou, S. (2009). Thermal performance, economic and en-vironmental life cycle analysis of thermosiphon solar waterheaters. Solar Energy, 83, 39–48.
Kazakevicius, E., Gadgil, E., & Vorsatz, D. (1999). Residentiallighting in Lithuania. Energy Policy, 27, 603–611.
Lee, A. H. W. (2000). Verification of electrical energysavings for lighting retrofits using short- and long-term monitoring. Energy Conversation and Manage-ment, 41, 1999–2008.
Mahlia, T. M. I., Masjuki, H. H., & Choudhury, I. A. (2002).Potential electricity savings by implementing energy labelsfor room air conditioner in Malaysia. Energy Conversionand Management, 43, 2225–2233.
Mahlia, T. M. I., Masjuki, H. H., Saidur, R., & Amalina, M. A.(2004). Mitigation of emissions through energy efficiencystandards for room air conditioners in Malaysia. EnergyPolicy, 32, 1783–1787.
Mahlia, T. M. I., Said, M. F. M., Masjuki, H. H., & Tamjis, M.R. (2005). Cost-benefit analysis and emission reduction oflighting retrofits in residential sector. Energy and Build-ings, 37, 573–578.
Mahlia, T. M. I., Abdul Razak, H., & Nursahida, M. A. (2011).Life cycle cost analysis and payback period of lightingretrofit at the University of Malaya. Renewable and Sus-tainable Energy Reviews, 15, 1125–1132.
Michaelowa, A., & Purohit, P. (2006). Additionality determina-tion of Indian CDM projects: Can Indian CDM projectdevelopers outwit the CDM Executive Board, Draft Re-port, University of Zurich, Institute for Political Science,Műhlegasse 21, 8001 Zűrich, Switzerland.
Mizuno, Y. CDM in Charts, Version 9.0, November 2009,Institute for Global Environmental Strategies, Ministry ofthe Environment, Japan.
Pallav Purohit, P., & Michaelowa, A. (2008). CDM potential ofSPV lighting systems in India. Mitigation and AdaptationStrategies for Global Change, 13, 23–46.
Shrestha R. M., Sharma, S., Timilsina, G. R., & Kumar, S.(2005) Baseline methodologies for Clean DevelopmentMechanism Projects UNEP Riso Centre on Energy, Cli-mate and Sustainable Development, Riso National Labora-tory Roskilde, Denmark, ISBN: 87-550-3483-7.
Singh, I., & Michaelowa, A. (2004). Indian Urban BuildingSector: CDM potential through energy efficiency in electric-ity consumption, HWWA Discussion Paper 289. Hamburg,Germany: Hamburg Institute of International Economics.
Stefano, J. D. (2000). Energy efficiency and the environment: thepotential for energy efficient lighting to save energy andreduce carbon dioxide emissions at Melbourne University,Australia. Energy—The International Journal, 25, 823–839.
Techato, K., Watts, D. J., & Chaiprapat, S. (2009). Life cycleanalysis of retrofitting with high energy efficiency air-conditioner and fluorescent lamp in existing buildings.Energy Policy, 37, 318–325.
The CO2Baseline Database for the Indian Power Sector,Ministry ofPower: Central Electricity Authority India (CEA), Version 5.0,November 2009. http://www.cea.nic.in/planning/c%20and%20e/Government%20of%20India%20website.htm
Tiwari, G. N. (2006). Solar energy fundamentals, design, mod-eling and applications (1st ed., pp. 452–487). New Delhi:Narosa Pub. House.
Tsilingiridis, G., Martinopoulos, G., & Kyriakis, N. (2004). Lifecycle environmental impact of a thermosyphonic domesticsolar hot water system in comparison with electrical andgas water heating. Renewable Energy, 29, 1277–1288.
UNFCCC, Tool for the demonstration and assessment of addition-ality. Version 5.2, 26th August 2008. http://cdm.unfccc.int/methodologies/PAmethodologies/approved.html
UNFCCC, Approved small scale methodology AMS I.C. Thermalenergy for the user with or without electricity. Version 16, 4thDecember 2009. http://cdm.unfccc.int/methodologies/SSCmethodologies/approved.html
UNFCCC, Approved small scale methodology AMS II.C.Demand-side energy efficiency activities for specific tech-nologies. Version 13, 17th July 2009. http://cdm.unfccc.int/methodologies/SSCmethodologies/approved.html
UNFCCC, Approved small scale methodology AMS I.D. Gridconnected renewable electricity generation. Version 15,16th October 2009 http://cdm.unfccc.int/methodologies/SSCmethodologies/approved.html.
Energy Efficiency (2012) 5:471–481 481