Assessment of CO Storage as Hydrates in Saline Aquifers ...
6
DOI: 10.3303/CET2186087 Paper Received: 19 August 2020; Revised: 1 February 2021; Accepted: 27 April 2021 Please cite this article as: De-Gald V., Rahmanian N., Batrshin D., 2021, Assessment of CO 2 Storage as Hydrates in Saline Aquifers Using Machine Learning Algorithms, Chemical Engineering Transactions, 86, 517-522 DOI:10.3303/CET2186087 CHEMICAL ENGINEERING TRANSACTIONS VOL. 86, 2021 A publication of The Italian Association of Chemical Engineering Online at www.cetjournal.it Guest Editors: Sauro Pierucci, Jiří Jaromír Klemeš Copyright © 2021, AIDIC Servizi S.r.l. ISBN 978-88-95608-84-6; ISSN 2283-9216 Assessment of CO 2 Storage as Hydrates in Saline Aquifers using Machine Learning Algorithms Vladislav De-Gald a, b , Nejat Rahmanian b* , Denis Batrshin c a School of Computer Science & Robotics, Division of Information Technology, Tomsk Polytechnic University, Tomsk, Russia b Chemical Engineering Department, Faculty of Engineering and Informatics, University of Bradford, BD7 1DP, UK с JSC All-Russian Scientific-Research Oil&Gas Institute named after acad. A.P. Krylov, 105005, Moscow, Russia [email protected] Global warming is one of the most serious issues the world is currently facing. The major reason is attributed to emission of greenhouse gases and in particular carbon dioxide, CO 2 . The most promising methods that could allow significant reduction in CO 2 emissions are capture and geological storage of CO 2 . One major concern against storage of CO 2 is the possibility of its leakage. One process that could lead to more reliable trapping of CO 2 is hydrate formation – that leads to trapping of CO 2 in the solid form. In this study, Machine Learning algorithms and reservoir simulation software were used to conduct sensitivity studies on some of the main reservoir parameters, to understand which characteristics have most impact on stability of CO 2 storage in the form of hydrates. The hydrate formation curve calculated by HydraFlash software was considered to be a benchmark for experiments conducted in this study. 1. Introduction Carbon dioxide (CO 2 ) is a chief constituent of greenhouse gases and should be captured, transported and stored in saline aquifers or used for enhanced oil recovery (Peletiri et al., 2017). The safety assessment is a key aspect that should be assessed in the planning and operational step of any CO 2 transportation system (Mocellin et al., 2019), however, this issue is not in the scope of this article. One of the possible trapping mechanisms for CO 2 is hydrate formation. Gas hydrates are crystalline compounds of gases and water of a variable composition, having similar physical properties to ice. Gas hydrates are formed upon the contact of gas and water under certain thermobaric conditions (Malakhova, 2020). They usually exist in marine bottom sediments and in areas of permafrost. Hydrate is a highly condensed form of gas bound with water; one cubic meter of hydrate corresponds to approximately 160 cubic meters of gas at atmospheric conditions. The zone where gas hydrates can form is referred to as the gas hydrate stability zone (GHSz). In the marine environment, the GHSz is located between the sea floor and the base of the stability zone defined by the phase diagram. The limits of the stability zone are determined by bottom water temperature, sea level, geothermal gradient, gas composition and pore water salinity. Storage of CO 2 as hydrates below the sea floor is a possible trapping mechanism but has not been widely considered. This is because the long-term behavior of such hydrates in shallow sediments is not well known (NPD, 2019). 2. Current study In this study, CO 2 storage as hydrates in Saline Aquifers is modelled by STARS software (CMG STARS, 2016). The phase behavior of CO 2 hydrate and a kinetic model is incorporated in the thermal reservoir simulator. Norwegian Petroleum Directorate proposes possible locations for CO 2 storage; one of the possible options for CO 2 storage as hydrates is below the Barents seabed (CO 2 Storage Atlas Barents Sea, NPD). Barents Sea depth reaches 500 meters, which in combination with low bottom water temperatures that can be as low as 0 ℃, provides necessary conditions for CO 2 Hydrate formations, which is presented in Figure 1b. 517
Transcript of Assessment of CO Storage as Hydrates in Saline Aquifers ...

DOI: 10.3303/CET2186087
Paper Received: 19 August 2020; Revised: 1 February 2021; Accepted: 27 April 2021 Please cite this article as: De-Gald V., Rahmanian N., Batrshin D., 2021, Assessment of CO2 Storage as Hydrates in Saline Aquifers Using Machine Learning Algorithms, Chemical Engineering Transactions, 86, 517-522 DOI:10.3303/CET2186087
CHEMICAL ENGINEERING TRANSACTIONS
VOL. 86, 2021
A publication of
The Italian Association of Chemical Engineering Online at www.cetjournal.it
Guest Editors: Sauro Pierucci, Jiří Jaromír KlemešCopyright © 2021, AIDIC Servizi S.r.l. ISBN 978-88-95608-84-6; ISSN 2283-9216
Assessment of CO2 Storage as Hydrates in Saline Aquifers using Machine Learning Algorithms
Vladislav De-Galda, b, Nejat Rahmanianb*, Denis Batrshinc aSchool of Computer Science & Robotics, Division of Information Technology, Tomsk Polytechnic University, Tomsk, Russia bChemical Engineering Department, Faculty of Engineering and Informatics, University of Bradford, BD7 1DP, UK сJSC All-Russian Scientific-Research Oil&Gas Institute named after acad. A.P. Krylov, 105005, Moscow, Russia [email protected]
Global warming is one of the most serious issues the world is currently facing. The major reason is attributed to emission of greenhouse gases and in particular carbon dioxide, CO2. The most promising methods that could allow significant reduction in CO2 emissions are capture and geological storage of CO2. One major concern against storage of CO2 is the possibility of its leakage. One process that could lead to more reliable trapping of CO2 is hydrate formation – that leads to trapping of CO2 in the solid form. In this study, Machine Learning algorithms and reservoir simulation software were used to conduct sensitivity studies on some of the main reservoir parameters, to understand which characteristics have most impact on stability of CO2 storage in the form of hydrates. The hydrate formation curve calculated by HydraFlash software was considered to be a benchmark for experiments conducted in this study.
1. Introduction
Carbon dioxide (CO2) is a chief constituent of greenhouse gases and should be captured, transported and stored in saline aquifers or used for enhanced oil recovery (Peletiri et al., 2017). The safety assessment is a key aspect that should be assessed in the planning and operational step of any CO2 transportation system (Mocellin et al., 2019), however, this issue is not in the scope of this article. One of the possible trapping mechanisms for CO2 is hydrate formation. Gas hydrates are crystalline compounds of gases and water of a variable composition, having similar physical properties to ice. Gas hydrates are formed upon the contact of gas and water under certain thermobaric conditions (Malakhova, 2020). They usually exist in marine bottom sediments and in areas of permafrost. Hydrate is a highly condensed form of gas bound with water; one cubic meter of hydrate corresponds to approximately 160 cubic meters of gas at atmospheric conditions. The zone where gas hydrates can form is referred to as the gas hydrate stability zone (GHSz). In the marine environment, the GHSz is located between the sea floor and the base of the stability zone defined by the phase diagram. The limits of the stability zone are determined by bottom water temperature, sea level, geothermal gradient, gas composition and pore water salinity. Storage of CO2 as hydrates below the sea floor is a possible trapping mechanism but has not been widely considered. This is because the long-term behavior of such hydrates in shallow sediments is not well known (NPD, 2019).
2. Current study
In this study, CO2 storage as hydrates in Saline Aquifers is modelled by STARS software (CMG STARS, 2016). The phase behavior of CO2 hydrate and a kinetic model is incorporated in the thermal reservoir simulator. Norwegian Petroleum Directorate proposes possible locations for CO2 storage; one of the possible options for CO2 storage as hydrates is below the Barents seabed (CO2 Storage Atlas Barents Sea, NPD). Barents Sea depth reaches 500 meters, which in combination with low bottom water temperatures that can be as low as 0 ℃, provides necessary conditions for CO2 Hydrate formations, which is presented in Figure 1b.
517
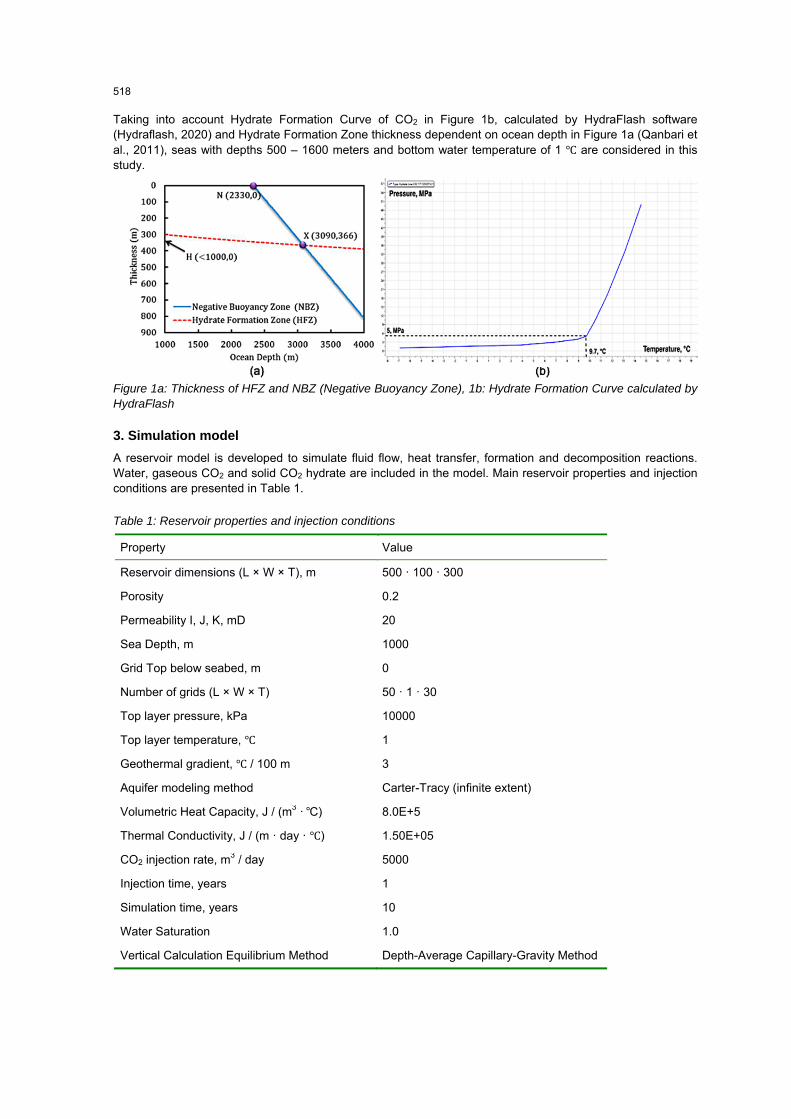
Taking into account Hydrate Formation Curve of CO2 in Figure 1b, calculated by HydraFlash software (Hydraflash, 2020) and Hydrate Formation Zone thickness dependent on ocean depth in Figure 1a (Qanbari et al., 2011), seas with depths 500 – 1600 meters and bottom water temperature of 1 ℃ are considered in this study.
Figure 1a: Thickness of HFZ and NBZ (Negative Buoyancy Zone), 1b: Hydrate Formation Curve calculated by HydraFlash
3. Simulation model
A reservoir model is developed to simulate fluid flow, heat transfer, formation and decomposition reactions. Water, gaseous CO2 and solid CO2 hydrate are included in the model. Main reservoir properties and injection conditions are presented in Table 1.
Table 1: Reservoir properties and injection conditions
Property Value
Reservoir dimensions (L × W × T), m 500 · 100 · 300
Porosity 0.2
Permeability I, J, K, mD 20
Sea Depth, m 1000
Grid Top below seabed, m 0
Number of grids (L × W × T) 50 · 1 · 30
Top layer pressure, kPa 10000
Top layer temperature, ℃ 1
Geothermal gradient, ℃ / 100 m 3
Aquifer modeling method Carter-Tracy (infinite extent)
·Volumetric Heat Capacity, J / (m3 ℃ ) 8.0E+5
Thermal Conductivity, J / (m · day · ℃ ) 1.50E+05
CO2 injection rate, m3 / day 5000
Injection time, years 1
Simulation time, years 10
Water Saturation 1.0
Vertical Calculation Equilibrium Method Depth-Average Capillary-Gravity Method
518
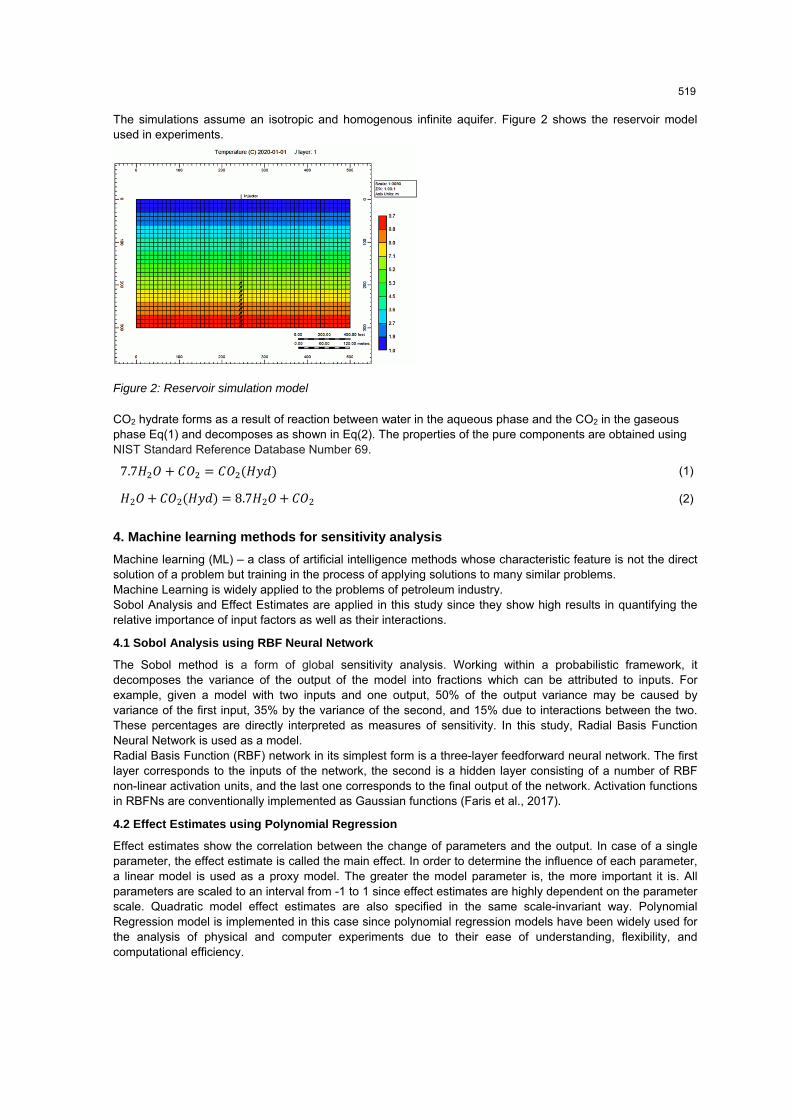
The simulations assume an isotropic and homogenous infinite aquifer. Figure 2 shows the reservoir model used in experiments.
Figure 2: Reservoir simulation model
CO2 hydrate forms as a result of reaction between water in the aqueous phase and the CO2 in the gaseous phase Eq(1) and decomposes as shown in Eq(2). The properties of the pure components are obtained using NIST Standard Reference Database Number 69. 7.7 (1)
2 2 8.7 2 2 (2)
4. Machine learning methods for sensitivity analysis
Machine learning (ML) – a class of artificial intelligence methods whose characteristic feature is not the direct solution of a problem but training in the process of applying solutions to many similar problems.Machine Learning is widely applied to the problems of petroleum industry. Sobol Analysis and Effect Estimates are applied in this study since they show high results in quantifying the relative importance of input factors as well as their interactions.
4.1 Sobol Analysis using RBF Neural Network
The Sobol method is a form of global sensitivity analysis. Working within a probabilistic framework, it decomposes the variance of the output of the model into fractions which can be attributed to inputs. For example, given a model with two inputs and one output, 50% of the output variance may be caused by variance of the first input, 35% by the variance of the second, and 15% due to interactions between the two. These percentages are directly interpreted as measures of sensitivity. In this study, Radial Basis Function Neural Network is used as a model. Radial Basis Function (RBF) network in its simplest form is a three-layer feedforward neural network. The first layer corresponds to the inputs of the network, the second is a hidden layer consisting of a number of RBF non-linear activation units, and the last one corresponds to the final output of the network. Activation functions in RBFNs are conventionally implemented as Gaussian functions (Faris et al., 2017).
4.2 Effect Estimates using Polynomial Regression
Effect estimates show the correlation between the change of parameters and the output. In case of a single parameter, the effect estimate is called the main effect. In order to determine the influence of each parameter, a linear model is used as a proxy model. The greater the model parameter is, the more important it is. All parameters are scaled to an interval from -1 to 1 since effect estimates are highly dependent on the parameter scale. Quadratic model effect estimates are also specified in the same scale-invariant way. Polynomial Regression model is implemented in this case since polynomial regression models have been widely used for the analysis of physical and computer experiments due to their ease of understanding, flexibility, and computational efficiency.
519
5. Results and discussion
A number of simulations using CMG CMOST were conducted to understand factors that affect hydrate formation over 10 years. Table 2 shows the list of experiment cases where the effects of Porosity, Permeability, Sea Depth, Thermal Conductivity and Heat Capacity are investigated.
Table 2: Case List
Parameter Discrete values
Porosity, % 1 – 51 (step 12.5)
Permeability I, J, K, mD 10-2010 (step 500)
Top layer pressure (Reference Pressure), kPa 5000-17000 (step 3000)
Thermal Conductivity, J / (m · day · ℃) 1.5E+5, 3.2E+5, 6.0E+5
· Volumetric Heat Capacity, J / (m3 ℃ ) 8.0E+5, 2.0E+6, 3.5E+6
Injection temperature 1-21 (step 5)
Total number of successful experiments 3426
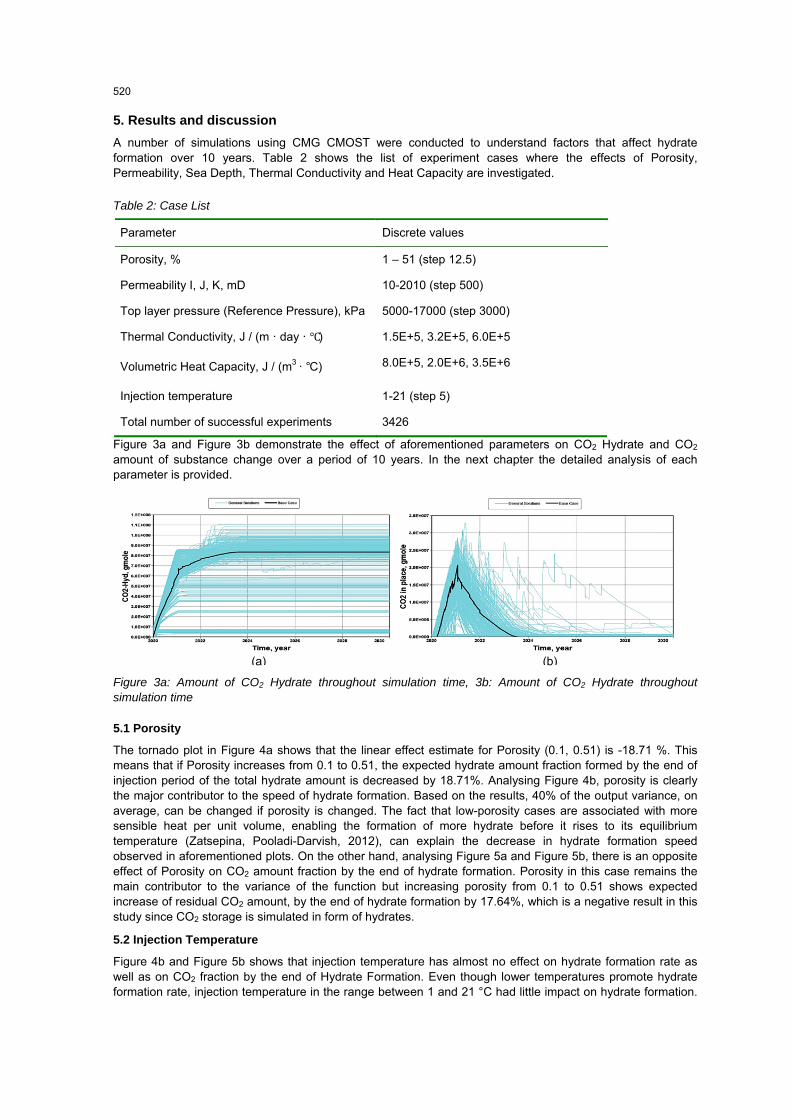
Figure 3a and Figure 3b demonstrate the effect of aforementioned parameters on CO2 Hydrate and CO2 amount of substance change over a period of 10 years. In the next chapter the detailed analysis of each parameter is provided.
Figure 3a: Amount of CO2 Hydrate throughout simulation time, 3b: Amount of CO2 Hydrate throughout simulation time
5.1 Porosity
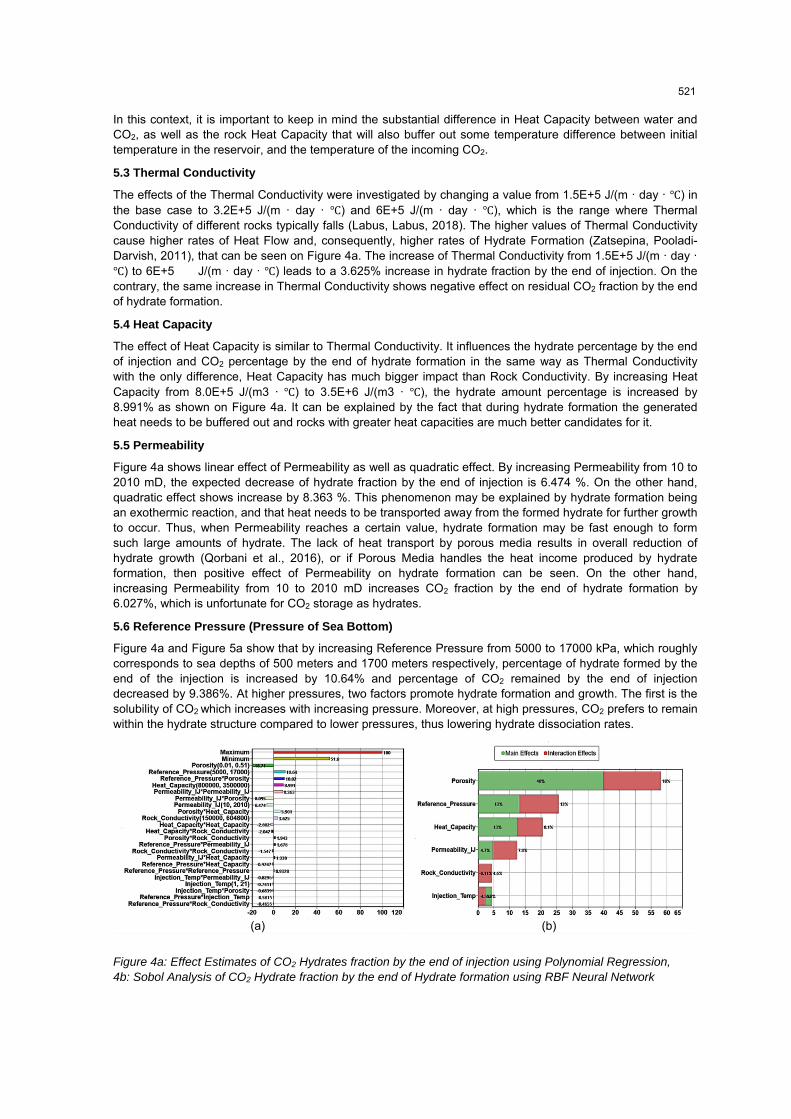
The tornado plot in Figure 4a shows that the linear effect estimate for Porosity (0.1, 0.51) is -18.71 %. This means that if Porosity increases from 0.1 to 0.51, the expected hydrate amount fraction formed by the end of injection period of the total hydrate amount is decreased by 18.71%. Analysing Figure 4b, porosity is clearly the major contributor to the speed of hydrate formation. Based on the results, 40% of the output variance, on average, can be changed if porosity is changed. The fact that low-porosity cases are associated with more sensible heat per unit volume, enabling the formation of more hydrate before it rises to its equilibrium temperature (Zatsepina, Pooladi-Darvish, 2012), can explain the decrease in hydrate formation speed observed in aforementioned plots. On the other hand, analysing Figure 5a and Figure 5b, there is an opposite effect of Porosity on CO2 amount fraction by the end of hydrate formation. Porosity in this case remains the main contributor to the variance of the function but increasing porosity from 0.1 to 0.51 shows expected increase of residual CO2 amount, by the end of hydrate formation by 17.64%, which is a negative result in this study since CO2 storage is simulated in form of hydrates.
5.2 Injection Temperature
Figure 4b and Figure 5b shows that injection temperature has almost no effect on hydrate formation rate as well as on CO2 fraction by the end of Hydrate Formation. Even though lower temperatures promote hydrate formation rate, injection temperature in the range between 1 and 21 °C had little impact on hydrate formation.
(a) (b)
520
In this context, it is important to keep in mind the substantial difference in Heat Capacity between water and CO2, as well as the rock Heat Capacity that will also buffer out some temperature difference between initial temperature in the reservoir, and the temperature of the incoming CO2.
5.3 Thermal Conductivity
The effects of the Thermal Conductivity were investigated by changing a value from 1.5E+5 J/(m · day · ℃) in the base case to 3.2E+5 J/(m · day · ℃) and 6E+5 J/(m · day · ℃), which is the range where Thermal Conductivity of different rocks typically falls (Labus, Labus, 2018). The higher values of Thermal Conductivity cause higher rates of Heat Flow and, consequently, higher rates of Hydrate Formation (Zatsepina, Pooladi-Darvish, 2011), that can be seen on Figure 4a. The increase of Thermal Conductivity from 1.5E+5 J/(m · day · ℃) to 6E+5 J/(m · day · ℃) leads to a 3.625% increase in hydrate fraction by the end of injection. On the contrary, the same increase in Thermal Conductivity shows negative effect on residual CO2 fraction by the end of hydrate formation.
5.4 Heat Capacity
The effect of Heat Capacity is similar to Thermal Conductivity. It influences the hydrate percentage by the end of injection and CO2 percentage by the end of hydrate formation in the same way as Thermal Conductivity with the only difference, Heat Capacity has much bigger impact than Rock Conductivity. By increasing Heat Capacity from 8.0E+5 J/(m3 · ℃) to 3.5E+6 J/(m3 · ℃), the hydrate amount percentage is increased by 8.991% as shown on Figure 4a. It can be explained by the fact that during hydrate formation the generated heat needs to be buffered out and rocks with greater heat capacities are much better candidates for it.
5.5 Permeability
Figure 4a shows linear effect of Permeability as well as quadratic effect. By increasing Permeability from 10 to 2010 mD, the expected decrease of hydrate fraction by the end of injection is 6.474 %. On the other hand, quadratic effect shows increase by 8.363 %. This phenomenon may be explained by hydrate formation being an exothermic reaction, and that heat needs to be transported away from the formed hydrate for further growth to occur. Thus, when Permeability reaches a certain value, hydrate formation may be fast enough to form such large amounts of hydrate. The lack of heat transport by porous media results in overall reduction of hydrate growth (Qorbani et al., 2016), or if Porous Media handles the heat income produced by hydrate formation, then positive effect of Permeability on hydrate formation can be seen. On the other hand, increasing Permeability from 10 to 2010 mD increases CO2 fraction by the end of hydrate formation by 6.027%, which is unfortunate for CO2 storage as hydrates.
5.6 Reference Pressure (Pressure of Sea Bottom)
Figure 4a and Figure 5a show that by increasing Reference Pressure from 5000 to 17000 kPa, which roughly corresponds to sea depths of 500 meters and 1700 meters respectively, percentage of hydrate formed by the end of the injection is increased by 10.64% and percentage of CO2 remained by the end of injection decreased by 9.386%. At higher pressures, two factors promote hydrate formation and growth. The first is the solubility of CO2 which increases with increasing pressure. Moreover, at high pressures, CO2 prefers to remain within the hydrate structure compared to lower pressures, thus lowering hydrate dissociation rates.
Figure 4a: Effect Estimates of CO2 Hydrates fraction by the end of injection using Polynomial Regression, 4b: Sobol Analysis of CO2 Hydrate fraction by the end of Hydrate formation using RBF Neural Network
(a) (b)
521
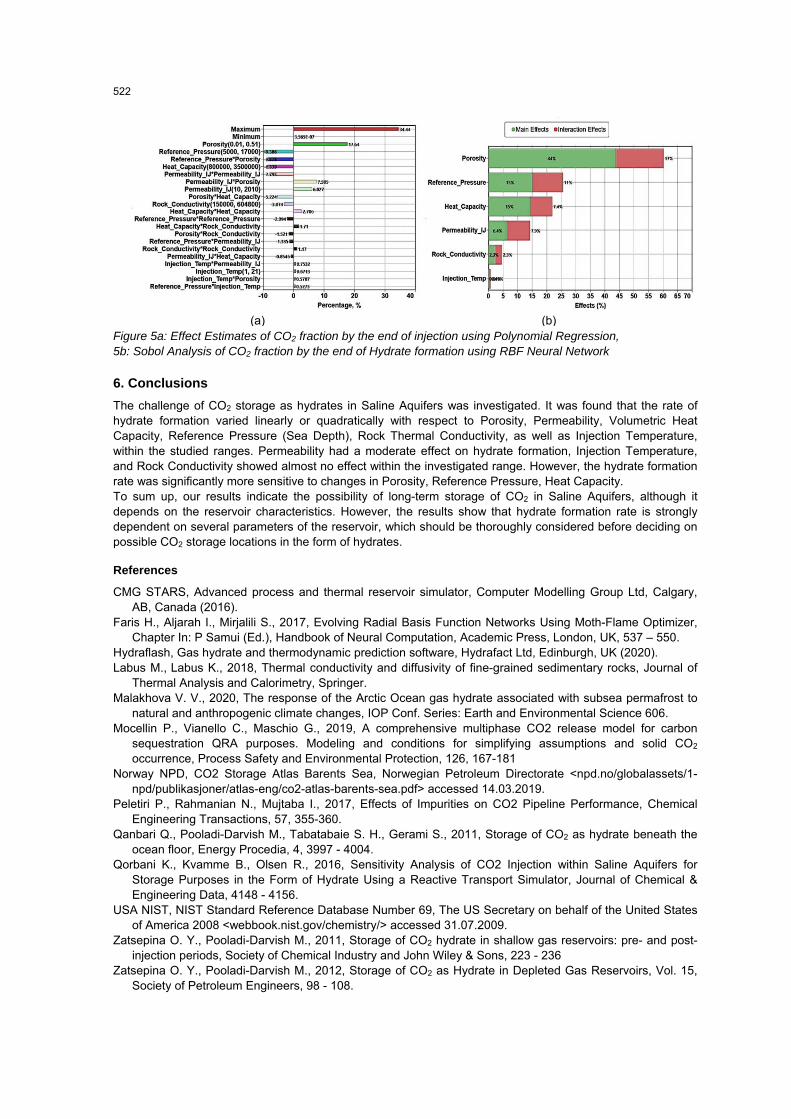
Figure 5a: Effect Estimates of CO2 fraction by the end of injection using Polynomial Regression, 5b: Sobol Analysis of CO2 fraction by the end of Hydrate formation using RBF Neural Network
6. Conclusions
The challenge of CO2 storage as hydrates in Saline Aquifers was investigated. It was found that the rate of hydrate formation varied linearly or quadratically with respect to Porosity, Permeability, Volumetric Heat Capacity, Reference Pressure (Sea Depth), Rock Thermal Conductivity, as well as Injection Temperature, within the studied ranges. Permeability had a moderate effect on hydrate formation, Injection Temperature, and Rock Conductivity showed almost no effect within the investigated range. However, the hydrate formation rate was significantly more sensitive to changes in Porosity, Reference Pressure, Heat Capacity. To sum up, our results indicate the possibility of long-term storage of CO2 in Saline Aquifers, although it depends on the reservoir characteristics. However, the results show that hydrate formation rate is strongly dependent on several parameters of the reservoir, which should be thoroughly considered before deciding on possible CO2 storage locations in the form of hydrates.
References
CMG STARS, Advanced process and thermal reservoir simulator, Computer Modelling Group Ltd, Calgary, AB, Canada (2016).
Faris H., Aljarah I., Mirjalili S., 2017, Evolving Radial Basis Function Networks Using Moth-Flame Optimizer, Chapter In: P Samui (Ed.), Handbook of Neural Computation, Academic Press, London, UK, 537 – 550.
Hydraflash, Gas hydrate and thermodynamic prediction software, Hydrafact Ltd, Edinburgh, UK (2020). Labus M., Labus K., 2018, Thermal conductivity and diffusivity of fine-grained sedimentary rocks, Journal of
Thermal Analysis and Calorimetry, Springer. Malakhova V. V., 2020, The response of the Arctic Ocean gas hydrate associated with subsea permafrost to
natural and anthropogenic climate changes, IOP Conf. Series: Earth and Environmental Science 606. Mocellin P., Vianello C., Maschio G., 2019, A comprehensive multiphase CO2 release model for carbon
sequestration QRA purposes. Modeling and conditions for simplifying assumptions and solid CO2 occurrence, Process Safety and Environmental Protection, 126, 167-181
Norway NPD, CO2 Storage Atlas Barents Sea, Norwegian Petroleum Directorate <npd.no/globalassets/1-npd/publikasjoner/atlas-eng/co2-atlas-barents-sea.pdf> accessed 14.03.2019.
Peletiri P., Rahmanian N., Mujtaba I., 2017, Effects of Impurities on CO2 Pipeline Performance, Chemical Engineering Transactions, 57, 355-360.
Qanbari Q., Pooladi-Darvish M., Tabatabaie S. H., Gerami S., 2011, Storage of CO2 as hydrate beneath the ocean floor, Energy Procedia, 4, 3997 - 4004.
Qorbani K., Kvamme B., Olsen R., 2016, Sensitivity Analysis of CO2 Injection within Saline Aquifers for Storage Purposes in the Form of Hydrate Using a Reactive Transport Simulator, Journal of Chemical & Engineering Data, 4148 - 4156.
USA NIST, NIST Standard Reference Database Number 69, The US Secretary on behalf of the United States of America 2008 <webbook.nist.gov/chemistry/> accessed 31.07.2009.
Zatsepina O. Y., Pooladi-Darvish M., 2011, Storage of CO2 hydrate in shallow gas reservoirs: pre- and post- injection periods, Society of Chemical Industry and John Wiley & Sons, 223 - 236
Zatsepina O. Y., Pooladi-Darvish M., 2012, Storage of CO2 as Hydrate in Depleted Gas Reservoirs, Vol. 15, Society of Petroleum Engineers, 98 - 108.
(a) (b)
522


![arXiv:1601.03097v1 [physics.flu-dyn] 12 Jan 2016 important subsurface processes involve multiple phases that exchange species. Examples are carbon sequestration in saline aquifers](https://static.fdocuments.us/doc/165x107/5ad965887f8b9a6d318b489f/arxiv160103097v1-12-jan-2016-important-subsurface-processes-involve-multiple.jpg)