Assessment of Biomass Pelletization Options for Greensburg ... · PDF fileTechnical Report ....
18
Technical Report NREL/TP-7A2-45843 November 2009 Assessment of Biomass Pelletization Options for Greensburg, Kansas Executive Summary S. Haase
Transcript of Assessment of Biomass Pelletization Options for Greensburg ... · PDF fileTechnical Report ....
Technical Report NREL/TP-7A2-45843 November 2009
Assessment of Biomass Pelletization Options for Greensburg, Kansas Executive Summary S. Haase

National Renewable Energy Laboratory 1617 Cole Boulevard, Golden, Colorado 80401-3393 303-275-3000 • www.nrel.gov
NREL is a national laboratory of the U.S. Department of Energy Office of Energy Efficiency and Renewable Energy Operated by the Alliance for Sustainable Energy, LLC
Contract No. DE-AC36-08-GO28308
Technical Report NREL/TP-7A2-45843 November 2009
Assessment of Biomass Pelletization Options for Greensburg, Kansas Executive Summary S. Haase
Prepared under Task No. IDKS.1070

NOTICE
This report was prepared as an account of work sponsored by an agency of the United States government. Neither the United States government nor any agency thereof, nor any of their employees, makes any warranty, express or implied, or assumes any legal liability or responsibility for the accuracy, completeness, or usefulness of any information, apparatus, product, or process disclosed, or represents that its use would not infringe privately owned rights. Reference herein to any specific commercial product, process, or service by trade name, trademark, manufacturer, or otherwise does not necessarily constitute or imply its endorsement, recommendation, or favoring by the United States government or any agency thereof. The views and opinions of authors expressed herein do not necessarily state or reflect those of the United States government or any agency thereof.
Available electronically at http://www.osti.gov/bridge
Available for a processing fee to U.S. Department of Energy and its contractors, in paper, from:
U.S. Department of Energy Office of Scientific and Technical Information P.O. Box 62 Oak Ridge, TN 37831-0062 phone: 865.576.8401 fax: 865.576.5728 email: mailto:[email protected]
Available for sale to the public, in paper, from: U.S. Department of Commerce National Technical Information Service 5285 Port Royal Road Springfield, VA 22161 phone: 800.553.6847 fax: 703.605.6900 email: [email protected] online ordering: http://www.ntis.gov/ordering.htm
Printed on paper containing at least 50% wastepaper, including 20% postconsumer waste
iii
NREL Contacts
Laboratory Point Scott Haase of Contact: Phone: 303-275-3057
Project Team: Scott Haase Lynn Billman Anelia Milbrandt Dave Peterson Chris Gaul Rachel Gelman Alexander Dane
Project Name: Assessment of Biomass Pelletization Options for Greensburg, Kansas: Executive Summary

iv
Acknowledgments
This work was conducted by the U.S. Department of Energy’s (DOE) National Renewable Energy Laboratory (NREL) to provide input on the potential to establish a biomass pelletization or briquetting plant in or around the community of Greensburg, Kansas. A number of organizations and individuals contributed information that was useful in the analysis. The authors wish to thank the following persons and organizations for their assistance with this project (listed alphabetically):
• Bob Dickson, Mayor of Greensburg, Kansas • Kelly Estes, BTI Industries • Mike Estes, BTI Industries • Josh Harden, Biomass Energy Development Company • Steve Hewitt, Greensburg City Administrator • Brian Hoffman, Pratt Area Chamber of Commerce • Roger Masenthin, USDA, Sunflower Resource Conservation and Development (RC&D)
Program • Mike Mayberry, USDA, Sunflower RC&D Program • Don Queal, Queal Enterprises • Jeanette Siemens, Kiowa County Economic Development • Terry Studer, Local Agricultural Producer.
At NREL, staff who contributed to the effort in addition to the main author include: Lynn Billman, Alexander Dane, Chris Gaul, Rachel Gelman, Anelia Milbrandt, and Dave Peterson.
1
Executive Summary
In May 2007, the town of Greensburg, Kansas, was struck by a large tornado that destroyed more than 90% of the buildings and infrastructure of the town. After this devastating event, the citizens of Greensburg decided to rebuild their town in a green manner, incorporating the most efficient energy technologies possible in the reconstruction effort. The U.S. Department of Energy, through the National Renewable Energy Laboratory (NREL), has been providing technical assistance to Greensburg to help facilitate the various efforts. As part of this support, NREL conducted an assessment of potential opportunities to develop a biomass pelletization or briquetting plant in the region.
Major activities conducted for this assessment include the following:
• Detailed analysis of the biomass resource base in the region, including quantity, physical and chemical properties, availability, cost, and collection potential
• Assessment of demand for thermal energy in the region, and opportunities for biomass to be utilized to meet some of that demand
• Overview of the pellet manufacturing process, including equipment needs, capital costs, and manufacturing costs
• Overview of briquette and bripell manufacturing technologies and costs
• Discussion of end-use conversion technologies
• Conclusions and recommendations for next steps.
Biomass Resource Assessment Biomass Quantity and Geographic Distribution. NREL conducted a detailed, county-level assessment of the biomass residues found in the region. The primary agricultural biomass types located in the region include corn stover, corn cobs, sorghum residue, and wheat straw. There is also significant potential to collect woody biomass in the form of eastern red cedar. Eastern red cedar is considered an invasive species, and it is spreading rapidly from Oklahoma into southwestern Kansas. Cedar trees are being aggressively cut and removed to prevent its continued spread into agricultural lands.
Counties were included in the analysis if all or most of the county boundary is located within a 50-mile radius of either Pratt or Greensburg, Kansas. Using data available from the U.S. Department of Agriculture National Agricultural Statistics Service (NASS), NREL estimated the quantities of residues that are produced in the region. NREL used a 10-year average of values to account for potential year-to-year fluctuations in market conditions, weather patterns, and harvest. Based on total residue produced, NREL then used standard factors to estimate the amount of biomass that could safely be removed from agricultural lands while still maintaining nutrient cycling, soil health, and erosion mitigation. We estimated the quantity of eastern red cedar available through interviews with a local cedar clearing company. The full methodology is documented in Appendix A of this report.

2
Table ES-1 shows the total residues available in the study area, by county. A total of 1.7 million bone dry tons per year (bdt/yr) are available within counties that intersect 50 miles of Pratt and Greensburg. The value under “other forestry removals” for Pratt County is an estimate of the quantity of eastern red cedar available in the area. Even though this material is collected from many counties in the region, this quantity has been assigned to Pratt County because it is the location of the contractor’s business. It should also be noted that the values for corn are based only on residues available from irrigated acres. We found that non-irrigated corn is in a net-deficit situation, meaning that more residue should be left on the land than is actually being produced.
Table ES-1. Summary of Biomass Residues
Figure ES-1 shows the geographic distribution of the residues in the study area. Notice that, in general, greater quantities of residues are produced in the eastern counties of the region.
County Wheat Corn Sorghum Soybean Sunflower Cotton Logging Residues
Other Forestry
RemovalsCorn Cobs Total
Barber 25,283 407 4,004 1,337 46 210 161 2,818 623 34,888 Barton 74,604 17,556 47,399 14,320 222 - 22 14,760 168,882 Clark 469 9,681 345 - - - 218 10,713 Comanche 3,835 285 5,357 627 - - - 450 10,554 Edwards 31,955 39,921 18,599 21,961 60 - - 31,913 144,409 Ford 55,368 22,632 53,883 10,214 136 - - 21,533 163,765 Harper 96,815 146 9,270 1,821 65 436 0 135 108,687 Hodgeman 21,536 2,228 18,130 1,287 - - - 4,200 47,380 Kingman 78,586 5,270 8,869 6,458 185 - - 3,810 103,177 Kiowa 17,281 15,562 12,205 12,255 24 - - 15,113 72,438 Pawnee 59,127 21,710 35,327 16,494 52 - - 18,915 151,626 Pratt 58,679 38,472 19,270 17,711 377 1,122 12,500 33,533 181,663 Reno 89,693 13,495 51,240 22,829 1,253 - 15 13,118 191,642 Rice 111,254 14,194 50,816 15,130 931 - 24 8,190 200,539 Stafford 35,258 18,182 20,366 14,845 85 - - 31,935 120,670 Total 759,742 210,058 364,416 157,632 3,435 1,768 222 15,318 198,443 1,711,034
Residues Available (bdt/yr)

3
Figure ES-1. Biomass residue distribution
Looking in greater detail at the production of agricultural residues, we present in Table ES-2 the yields of biomass per acre of land harvested. The values for corn are only from irrigated acres. The table indicates that irrigated sorghum and irrigated corn will yield the greatest amount of biomass per acre. Thus, if one is interested in collecting agricultural residues, these two feedstocks should be considered as the top priority, as fewer acres will be needed to collect the most material.

4
Table ES-2. Yields of Biomass per Acre of Crop Land (bdt/acre/yr)
Biomass Physical and Chemical Properties. Table ES-3 shows the results of lab tests for some of the feedstocks in the region. The column labeled SMEC pellets shows the results of tests performed on a 50-50 blend of wood and agricultural residues made by Show Me Energy Cooperative (SMEC) of Centerview, Missouri. These pellets have moderate Btu value, high percentage of ash, and high alkalis. Most pellet-burning appliances are designed to handle low-ash (< 1%) fuels and low-alkali fuels. Values higher than 0.4 pounds of alkali per million British thermal units (lb/Mbtu) are likely to cause slagging or clinker formation during the combustion process. Pellets made from wood and agricultural residues in Greensburg would exhibit similar characteristics if similar blend ratios are used. In general, the SMEC pellets are better suited for use in large-scale utility plants (mixed with coal) or in large industrial- or commercial-scale biomass combustors designed to handle high-ash, high-alkali fuels. Appendix B contains the detailed lab results of the analysis of these samples, and of samples of corn stover, corn cobs, and sorghum residue.
Potential end users of biomass pellets in the region would likely want a price concession on the cost of the product in order to offset the higher operations and maintenance costs associated with using a high-ash, high-alkali fuel.
Table ES-3. Biomass Physical and Chemical Properties
Corn (bdt/acre)
Wheat IrrigatedWheat Non-
irrigated Wheat Total Sorghum IrrigatedSorghum Non-
irrigatedSorghum
TotalCorn Stover
and CobsBarber 0.52 0.22 0.22 0.50 1.24 Barton 0.67 0.46 0.46 1.35 0.80 0.86 1.64 Clark 0.27 - 0.01 1.22 0.70 0.65 0.75 Comanche 0.44 0.05 0.06 1.23 0.37 0.55 1.23 Edwards 0.70 0.27 0.33 1.13 0.60 0.71 1.69 Ford 0.57 0.31 0.33 1.28 0.71 0.80 1.54 Harper 0.61 0.44 0.44 0.57 1.56 Hodgeman 0.64 0.17 0.21 1.09 0.64 0.69 1.15 Kingman 0.69 0.40 0.41 1.20 0.54 0.59 1.79 Kiowa 0.47 0.22 0.25 1.27 0.63 0.73 1.52 Pawnee 0.74 0.42 0.45 1.29 0.73 0.83 1.61 Pratt 0.58 0.39 0.40 1.25 0.64 0.70 1.61 Reno 0.68 0.37 0.38 1.17 0.67 0.71 1.52 Rice 0.57 0.75 0.75 1.07 0.63 0.85 2.05 Stafford 0.56 0.23 0.26 1.24 0.69 0.75 1.18 Average 0.51 0.26 0.28 1.05 0.52 0.58 1.47
Wheat (bdt/acre) Sorghum Residues (bdt/acre)County
Value Wheat Straw
Freshly Cut Cedar
Seasoned Cedar
SMEC Pellets
Btu content as received HHV (Btu/lb) 7,125 8,143 8,056 7,059 Btu content bone dry (Btu/lb) 7,709 8,827 8,976 7,680 Moisture content as received (%) 7.57 7.75 10.25 8.09 Percentage Ash (%) 7.83 1.63 0.88 9.04 Lb Alkali/Mbtu 1.3 0.08 0.05 1.44 Lb ash/Mbtu 10.99 2.00 1.09 12.81 Potassium in ash as K2O (%) 11.4 3.25 4.55 10.8
5
The values for cedar shown in Table ES-3 indicate that this material would make an excellent feedstock for a biomass system. A product made of only cedar, or mostly cedar, is going to have much better combustion properties than a 50-50 blend of agricultural residues and cedar. For this reason, entrepreneurs wishing to develop a plant in the region may want to use either 100% cedar or a small blend percentage of agricultural residues. Test batches of various blend percentages would need to be made in order to test for ash content and alkali values before any full-scale production begins. The size of any potential pellet enterprise may be limited by the quantity of cedar that can economically be collected in the region.
Biomass Cost. Biomass collection cost is one of the major factors influencing the final cost of pellets. One of the challenges of using agricultural residues for feedstock is that the resource is dispersed on the land and relatively expensive to collect. Remember, too, that biomass pellets are competing against fossil fuels–primarily natural gas and propane. In recent months, the wholesale price of natural gas has fallen from $14/Mbtu to less than $4/Mbtu.
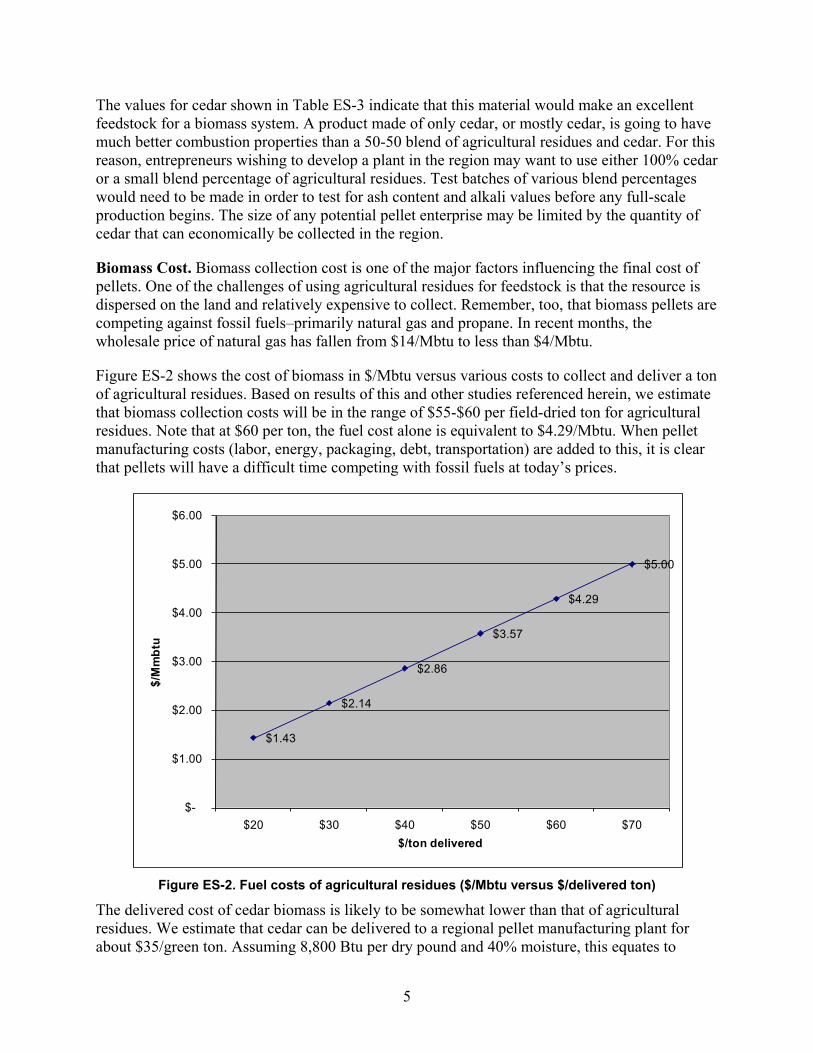
Figure ES-2 shows the cost of biomass in $/Mbtu versus various costs to collect and deliver a ton of agricultural residues. Based on results of this and other studies referenced herein, we estimate that biomass collection costs will be in the range of $55-$60 per field-dried ton for agricultural residues. Note that at $60 per ton, the fuel cost alone is equivalent to $4.29/Mbtu. When pellet manufacturing costs (labor, energy, packaging, debt, transportation) are added to this, it is clear that pellets will have a difficult time competing with fossil fuels at today’s prices.
Figure ES-2. Fuel costs of agricultural residues ($/Mbtu versus $/delivered ton)
The delivered cost of cedar biomass is likely to be somewhat lower than that of agricultural residues. We estimate that cedar can be delivered to a regional pellet manufacturing plant for about $35/green ton. Assuming 8,800 Btu per dry pound and 40% moisture, this equates to
$1.43
$2.14
$2.86
$3.57
$4.29
$5.00
$-
$1.00
$2.00
$3.00
$4.00
$5.00
$6.00
$20 $30 $40 $50 $60 $70
$/M
mbt
u
$/ton delivered

6
$3.31/Mbtu. Cedar is an important feedstock in the region, as it is likely to be the lowest cost resource; at the same time it has the best physical and chemical qualities of all the regional biomass sources.
Regional Demand for Thermal Energy and Competing Fuel Costs Comparison of Fuel Prices. Table ES-4 shows the delivered costs of energy from various fuels used in the region. The delivered cost of energy takes into account appliance efficiency and thus represents the cost to deliver a therm of useful energy to the building space. The natural gas prices used in the table are based on statewide averages for Kansas for the months of April through December 2008. Although the natural gas prices are based on average values for the period, note that the most recent prices for November and December 2008 were considerably lower than the averages. So while the commercial cost per therm is listed as $1.57 in table ES-4, the value for December 2008 was $1.00 per therm, which would make the delivered cost of energy $12.00/Mbtu as compared to the $19.63 shown in Table ES-4.
Table ES-4. Delivered Cost of Thermal Energy for Various Fuels ($/Mbtu)
When assessing the market for pellets, it is important to remember that fossil fuel prices fluctuate considerably, and while prices are low, end users may not be as interested in alternative fuels as they would be when prices are high. One of the selling points of biomass should be that biomass prices typically remain stable and seldom exhibit the wild price swings evident with fossil fuels.
Chipped cedar at $50 per ton has the lowest delivered cost, followed by straw bales. However, the use of these fuels will require additional on-site labor and higher up-front capital costs when compared with systems that burn pellets or other densified fuels. Notice that wood/ag pellets at $130 per ton are about $0.67 less per Mbtu than the cost of energy at the average industrial rate for gas in Kansas. It is difficult to compete with natural gas if your fuel is just slightly less expensive yet takes more labor and maintenance and requires an up-front purchase of a new appliance. Ag pellets at $130 per ton compare nicely, however, with hardwood pellets at $185 per ton, fuel oil at $2.17 per gallon, propane at $2.13 per gallon, and electrical resistance heat at $0.10 per kilowatt-hour (kWh). Ag pellets also compare well with commercial natural gas rates of $19.63/Mbtu. Ag pellets at $160 per ton compare favorably with fuel oil, commercial and residential gas, propane, and electricity. Note that it may be a challenge for a pellet plant to deliver wood/ag pellets to its customers at $130 per ton, even when using bulk shipments instead
Source UnitsCost to User
($)Efficiency
(%) Btu/unit $/MbtuChipped Cedar $/green ton 50.00 75 13,200,000 5.05 Wheat straw bales $/ton 55.00 70 14,000,000 5.61 Natural gas (industrial) $/therm 0.69 80 100,000 8.63 Wood/ag pellets ($130/ton) $/ton 130.00 80 15,000,000 10.83 Wood/ag pellets ($160/ton) $/ton 160.00 80 15,000,000 13.33 Hardwood pellets $/ton 185.00 80 16,600,000 13.93 Natural gas (commercial) $/therm 1.50 80 100,000 18.75 Fuel oil $/gallon 2.17 85 135,000 18.91 Natural gas (residential) $/therm 2.10 80 100,000 26.25 Propane $/gallon 2.13 85 91,600 27.36 Electricity $/kWh 0.10 100 3,413 29.30
7
of plastic bags. A cost of $160 per ton for bulk pellets delivered to a regional customer may be more likely.
Table ES-5 shows the average natural gas rates in Kansas by customer type. Data are shown through October 2008. It is likely that in the near term these rates will show a continued downward trend. The value for “electric power price” is the rate paid for gas used to generate electricity. The Energy Information Administration reports the data in terms of dollars per thousand cubic feet ($/Mcf). We have reported these values in $/Mbtu to be consistent with the other units used in this report.
Table ES-5. Average 2008 Monthly Natural Gas Prices in Kansas, by Customer Type ($/Mbtu)
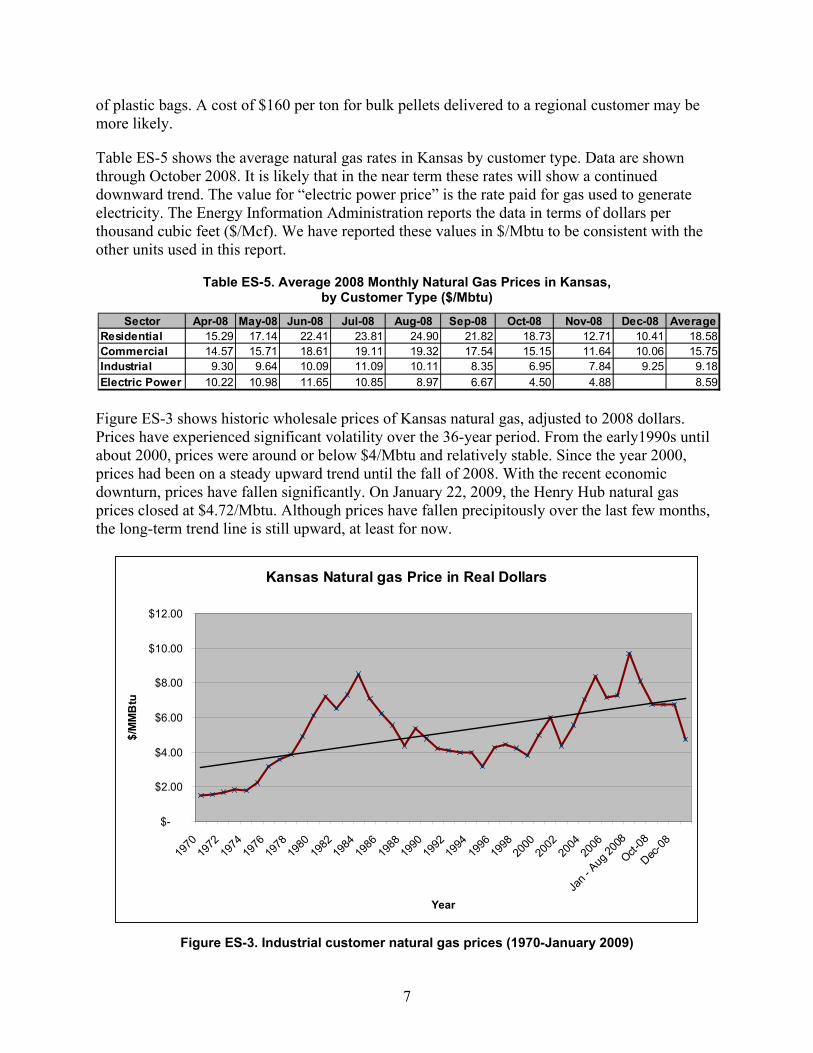
Figure ES-3 shows historic wholesale prices of Kansas natural gas, adjusted to 2008 dollars. Prices have experienced significant volatility over the 36-year period. From the early1990s until about 2000, prices were around or below $4/Mbtu and relatively stable. Since the year 2000, prices had been on a steady upward trend until the fall of 2008. With the recent economic downturn, prices have fallen significantly. On January 22, 2009, the Henry Hub natural gas prices closed at $4.72/Mbtu. Although prices have fallen precipitously over the last few months, the long-term trend line is still upward, at least for now.
Figure ES-3. Industrial customer natural gas prices (1970-January 2009)
Sector Apr-08 May-08 Jun-08 Jul-08 Aug-08 Sep-08 Oct-08 Nov-08 Dec-08 AverageResidential 15.29 17.14 22.41 23.81 24.90 21.82 18.73 12.71 10.41 18.58Commercial 14.57 15.71 18.61 19.11 19.32 17.54 15.15 11.64 10.06 15.75Industrial 9.30 9.64 10.09 11.09 10.11 8.35 6.95 7.84 9.25 9.18Electric Power 10.22 10.98 11.65 10.85 8.97 6.67 4.50 4.88 8.59
Kansas Natural gas Price in Real Dollars
$-
$2.00
$4.00
$6.00
$8.00
$10.00
$12.00
1970
1972
1974
1976
1978
1980
1982
1984
1986
1988
1990
1992
1994
1996
1998
2000
2002
2004
2006
Jan -
Aug 20
08
Oct-08
Dec-0
8
Year
$/M
MB
tu
8
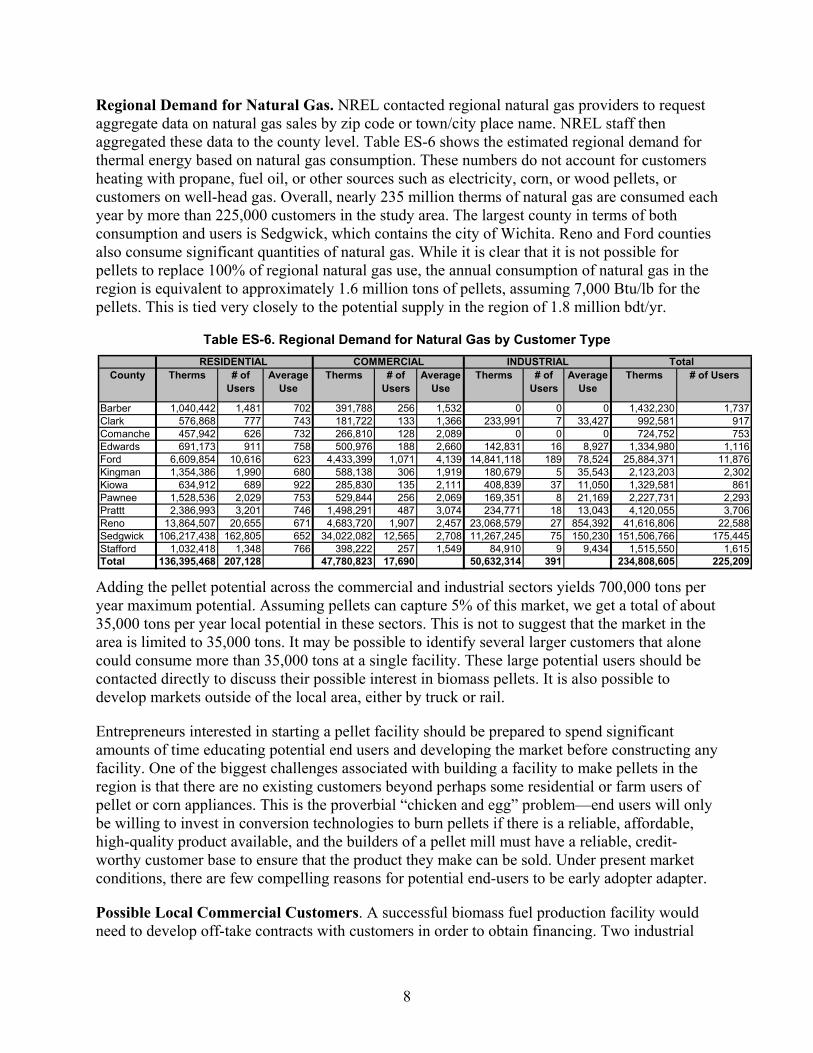
Regional Demand for Natural Gas. NREL contacted regional natural gas providers to request aggregate data on natural gas sales by zip code or town/city place name. NREL staff then aggregated these data to the county level. Table ES-6 shows the estimated regional demand for thermal energy based on natural gas consumption. These numbers do not account for customers heating with propane, fuel oil, or other sources such as electricity, corn, or wood pellets, or customers on well-head gas. Overall, nearly 235 million therms of natural gas are consumed each year by more than 225,000 customers in the study area. The largest county in terms of both consumption and users is Sedgwick, which contains the city of Wichita. Reno and Ford counties also consume significant quantities of natural gas. While it is clear that it is not possible for pellets to replace 100% of regional natural gas use, the annual consumption of natural gas in the region is equivalent to approximately 1.6 million tons of pellets, assuming 7,000 Btu/lb for the pellets. This is tied very closely to the potential supply in the region of 1.8 million bdt/yr.
Table ES-6. Regional Demand for Natural Gas by Customer Type
Adding the pellet potential across the commercial and industrial sectors yields 700,000 tons per year maximum potential. Assuming pellets can capture 5% of this market, we get a total of about 35,000 tons per year local potential in these sectors. This is not to suggest that the market in the area is limited to 35,000 tons. It may be possible to identify several larger customers that alone could consume more than 35,000 tons at a single facility. These large potential users should be contacted directly to discuss their possible interest in biomass pellets. It is also possible to develop markets outside of the local area, either by truck or rail.
Entrepreneurs interested in starting a pellet facility should be prepared to spend significant amounts of time educating potential end users and developing the market before constructing any facility. One of the biggest challenges associated with building a facility to make pellets in the region is that there are no existing customers beyond perhaps some residential or farm users of pellet or corn appliances. This is the proverbial “chicken and egg” problem—end users will only be willing to invest in conversion technologies to burn pellets if there is a reliable, affordable, high-quality product available, and the builders of a pellet mill must have a reliable, credit-worthy customer base to ensure that the product they make can be sold. Under present market conditions, there are few compelling reasons for potential end-users to be early adopter adapter.
Possible Local Commercial Customers. A successful biomass fuel production facility would need to develop off-take contracts with customers in order to obtain financing. Two industrial
County Therms # of Users
Average Use
Therms # of Users
Average Use
Therms # of Users
Average Use
Therms # of Users
Barber 1,040,442 1,481 702 391,788 256 1,532 0 0 0 1,432,230 1,737Clark 576,868 777 743 181,722 133 1,366 233,991 7 33,427 992,581 917Comanche 457,942 626 732 266,810 128 2,089 0 0 0 724,752 753Edwards 691,173 911 758 500,976 188 2,660 142,831 16 8,927 1,334,980 1,116Ford 6,609,854 10,616 623 4,433,399 1,071 4,139 14,841,118 189 78,524 25,884,371 11,876Kingman 1,354,386 1,990 680 588,138 306 1,919 180,679 5 35,543 2,123,203 2,302Kiowa 634,912 689 922 285,830 135 2,111 408,839 37 11,050 1,329,581 861Pawnee 1,528,536 2,029 753 529,844 256 2,069 169,351 8 21,169 2,227,731 2,293Prattt 2,386,993 3,201 746 1,498,291 487 3,074 234,771 18 13,043 4,120,055 3,706Reno 13,864,507 20,655 671 4,683,720 1,907 2,457 23,068,579 27 854,392 41,616,806 22,588Sedgwick 106,217,438 162,805 652 34,022,082 12,565 2,708 11,267,245 75 150,230 151,506,766 175,445Stafford 1,032,418 1,348 766 398,222 257 1,549 84,910 9 9,434 1,515,550 1,615Total 136,395,468 207,128 47,780,823 17,690 50,632,314 391 234,808,605 225,209
TotalCOMMERCIAL INDUSTRIALRESIDENTIAL
9
plants in the area, Orion Ethanol in Pratt and National Gypsum in Medicine Lodge, may be potential customers. The Pratt ethanol plant is not operating at this writing but presumably could be reactivated when more favorable business conditions return. There are many other potential customers in Dodge City and Wichita that could be identified and contacted.
As an example of a potential customer, the National Gypsum drywall manufacturing plant in Medicine Lodge could utilize biomass fuel. The plant presently consumes about 900,000 Mbtu per year of natural gas in its dryers. Offsetting 75% of this load would require on the order of 45,000 tons of biomass pellets (or 50,000 tons of 25% moisture content cedar chips) per year. As of February 2009, National Gypsum is interested in exploring the economics of switching from gas to biomass.
National Gypsum currently purchases natural gas for the NYMEX price, plus about 45 cents for delivery. Biomass costs must compete with those of natural gas. National Gypsum’s delivered cost of gas is presently about $5.00/Mbtu, although this price fluctuates daily. We do not believe that biomass pellets can be delivered to National Gypsum for $5per million Btu. If a ton of biomass pellets has 15 Mbtu, then the delivered cost would need to be $75 per ton to meet $5/Mbtu gas. The only biomass feedstock that can come close to meeting this cost at present is cedar chips.
It is interesting to consider emissions of carbon dioxide. Consumption of 675,000 Mbtu/yr of natural gas (75% of National Gypsum’s estimated use) emits 39,500 tons of CO2 per year. Since biomass is considered CO2 neutral by the U.N. International Panel on Climate Change, conversion to biomass could potentially free up carbon credits for National Gypsum under a cap and trade system. Some of these credits may need to be given to the biomass supply company to offset the emissions of the biomass pellet operation (from field to customer). Alternatively, the price of natural gas would go up by about $1.20/Mbtu if CO2 is taxed at $20 per ton. This would make biomass pellets more attractive to the plant.
Abengoa Ethanol Plant, Hugoton, Kansas. Abengoa is presently moving forward with plans to construct a 100 million gallon per year combination corn/cellulosic ethanol plant in Hugoton, Kansas. As of the writing of this report, Abengoa is in the process of conducting its environmental studies and developing its feedstock supply infrastructure. Abengoa has stated that the plant will require nearly 500,000 “as is” tons of biomass—primarily wheat straw and corn stover—as inputs for the cellulosic ethanol process, as well as to provide thermal energy for the plant. At this time, Abengoa has stated that it plans to collect feedstocks from within 50 miles of Hugoton, which would keep transportation costs as low as possible. At this time, we are unsure if Abengoa will need to go beyond this 50-mile radius and obtain feedstocks from closer to the Greensburg/Pratt areas. However, interested entrepreneurs should contact Abengoa to discuss the potential for supplying the ethanol plant with densified biomass feedstocks.
Summary of Local Market Potential. For any densified biomass product to be commercially viable, it must be at least as cost-competitive and somewhat as convenient as competing fuels. This includes wood pellets as well as fossil fuels. In most cases, pellets are truly a commodity product. A lower cost producer can ship farther and thus compete with smaller, higher production cost pellet mills, even in the smaller mill’s own backyard. Agricultural residue pellets are generally lower in grade than wood pellets. If agricultural residue pellets are available
10
in the same market as wood pellets, they would have to sell at a lower price to compete with both wood pellets and natural gas. Biomass pellets are likely to compete very favorably with propane, fuel oil, commercial natural gas rates and electricity, but so will wood pellets. Any entrepreneur who seeks to develop a biomass pelletization facility in the Greensburg/Pratt region should be prepared to spend considerable time and effort on educating potential consumers and developing the market.
Densification Options We evaluated three potential densified products that could be made from local biomass: pellets, briquettes, and bripells. All three options represent commercial technologies that would create viable market products, and all three can be used in commercial boiler systems to produce heat, power, or combined heat and power. We estimate that a 24,000-ton-per-year plant is the minimum size that should be built to take advantage of economies of scale, labor requirements, and infrastructure. It may be possible, however, to start with a smaller briquette or bripell production level, and scale up as the market develops.
Of the three products, pellets are associated with the most acceptance and consumer awareness, especially in the residential and small commercial sectors. However, the pellet market is still dominated by demand for premium, bagged pellets (less than 1% ash, high Btu) for the residential sector. Most pellet-burning appliances being sold to the residential market today are designed to handle low-ash fuels. Based on the feedstocks available in the Greensburg region, pellets made from a mixture of wood and agricultural residues will be high in alkalis, produce high ash, and contain medium Btu content (see the chemical analysis of the biomass sample pellets located in Appendix A). Without changes to pellet stove technology, there is not likely to be a high demand for this type of pellet from the residential sector. If pellets are the desired product, we suggest they be made either from 100% wood or perhaps a blend of 85%–90% wood with the remainder coming from agricultural residues. The exact blend could be determined through lab tests of various mixture percentages.
For the large commercial or industrial sectors, there are a number of boilers or furnaces on the market that are capable of handling higher ash pellets. Briquettes and bripells are also well-suited for commercial use. Appendix E contains a list of manufacturers of technologies that could burn any of these products in larger applications.
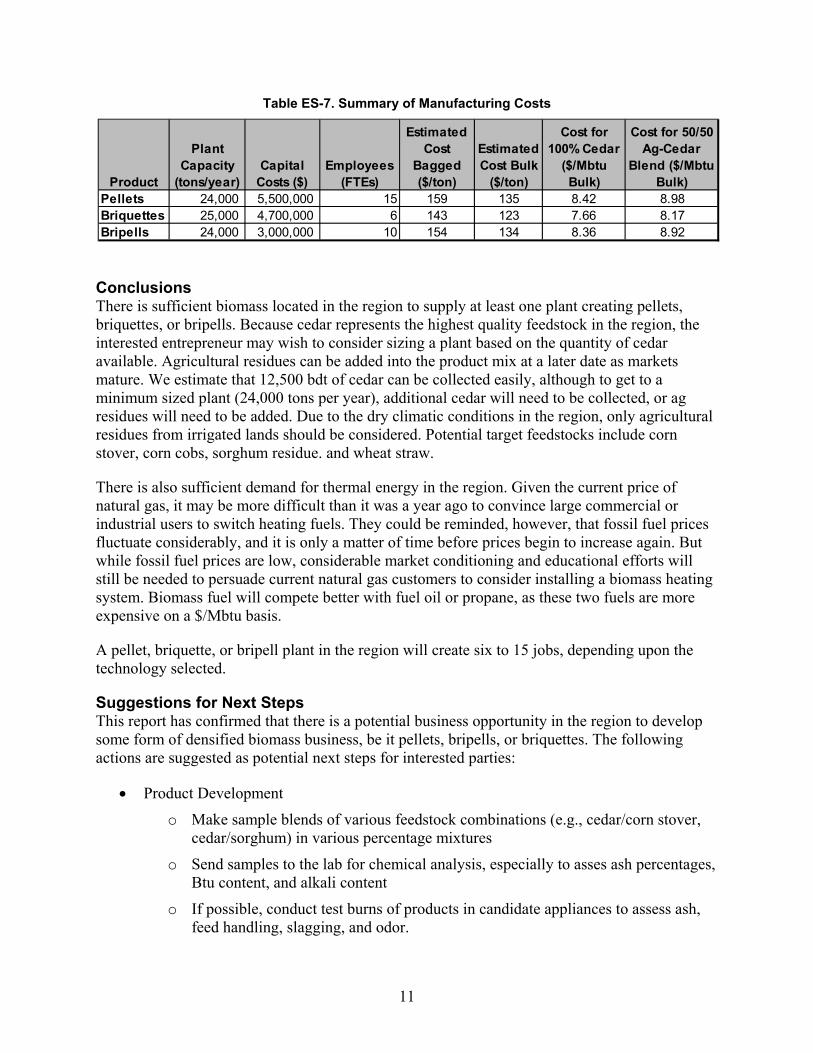
Table ES-7 shows the estimated costs of pellets, briquettes, and bripells. It must be stressed that these numbers are estimates only, and interested entrepreneurs are encouraged to develop their own detailed cost analyses before selecting one technology over another. The numbers below are sensitive to many factors, and changing one assumption can change any value. All of the numbers below were developed assuming a biomass feedstock cost of $65/bdt delivered to the plant.
11
Table ES-7. Summary of Manufacturing Costs
Conclusions There is sufficient biomass located in the region to supply at least one plant creating pellets, briquettes, or bripells. Because cedar represents the highest quality feedstock in the region, the interested entrepreneur may wish to consider sizing a plant based on the quantity of cedar available. Agricultural residues can be added into the product mix at a later date as markets mature. We estimate that 12,500 bdt of cedar can be collected easily, although to get to a minimum sized plant (24,000 tons per year), additional cedar will need to be collected, or ag residues will need to be added. Due to the dry climatic conditions in the region, only agricultural residues from irrigated lands should be considered. Potential target feedstocks include corn stover, corn cobs, sorghum residue. and wheat straw.
There is also sufficient demand for thermal energy in the region. Given the current price of natural gas, it may be more difficult than it was a year ago to convince large commercial or industrial users to switch heating fuels. They could be reminded, however, that fossil fuel prices fluctuate considerably, and it is only a matter of time before prices begin to increase again. But while fossil fuel prices are low, considerable market conditioning and educational efforts will still be needed to persuade current natural gas customers to consider installing a biomass heating system. Biomass fuel will compete better with fuel oil or propane, as these two fuels are more expensive on a $/Mbtu basis.
A pellet, briquette, or bripell plant in the region will create six to 15 jobs, depending upon the technology selected.
Suggestions for Next Steps This report has confirmed that there is a potential business opportunity in the region to develop some form of densified biomass business, be it pellets, bripells, or briquettes. The following actions are suggested as potential next steps for interested parties:
• Product Development
o Make sample blends of various feedstock combinations (e.g., cedar/corn stover, cedar/sorghum) in various percentage mixtures
o Send samples to the lab for chemical analysis, especially to asses ash percentages, Btu content, and alkali content
o If possible, conduct test burns of products in candidate appliances to assess ash, feed handling, slagging, and odor.
Product
Plant Capacity
(tons/year)Capital
Costs ($)Employees
(FTEs)
Estimated Cost
Bagged ($/ton)
Estimated Cost Bulk
($/ton)
Cost for 100% Cedar
($/Mbtu Bulk)
Cost for 50/50 Ag-Cedar
Blend ($/Mbtu Bulk)
Pellets 24,000 5,500,000 15 159 135 8.42 8.98Briquettes 25,000 4,700,000 6 143 123 7.66 8.17Bripells 24,000 3,000,000 10 154 134 8.36 8.92

12
• Feedstock Procurement
o Identify producers interested in biomass supply options
o Develop contract mechanisms for biomass supply
o Assess potential for planting Conservation Reserve Program (CRP) land in switchgrass, mixed grass prairie, or other biomass for specific production of biomass for pellets or bricks. Some sample questions to answer would be:
What is the best mix of plants for the local region?
What are the yields and economics versus alternative CRP options?
What is the best mix of plants in terms of energy content and use?
• Market Development
o Perform additional market development efforts and educate potential end users about biomass energy
o Seek state support to organize a local biomass heating workshop in the region
o Contact large commercial energy users to analyze their actual energy usage and costs. For example, potential regional targets in Kansas could include National Gypsum in Medicine Lodge; the Robert J. Dole VA Medical Center in Wichita; the new Kiowa County Memorial Hospital in Greensburg; Pratt Community College in Pratt; agricultural processing plants in Dodge City; and any federal facilities
o Continue to identify end use technologies that are commercially available and can be deployed at customer sites.
• Business Analysis
o Conduct detailed pro forma analyses for bripells, briquettes, and pellets
o Develop a business plan and conduct a detailed plant design.
F1147-E(10/2008)
REPORT DOCUMENTATION PAGE Form Approved OMB No. 0704-0188
The public reporting burden for this collection of information is estimated to average 1 hour per response, including the time for reviewing instructions, searching existing data sources, gathering and maintaining the data needed, and completing and reviewing the collection of information. Send comments regarding this burden estimate or any other aspect of this collection of information, including suggestions for reducing the burden, to Department of Defense, Executive Services and Communications Directorate (0704-0188). Respondents should be aware that notwithstanding any other provision of law, no person shall be subject to any penalty for failing to comply with a collection of information if it does not display a currently valid OMB control number. PLEASE DO NOT RETURN YOUR FORM TO THE ABOVE ORGANIZATION. 1. REPORT DATE (DD-MM-YYYY)
November 2009 2. REPORT TYPE
Technical Report 3. DATES COVERED (From - To)
4. TITLE AND SUBTITLE
Assessment of Biomass Pelletization Options for Greensburg, Kansas: Executive Summary
5a. CONTRACT NUMBER DE-AC36-08-GO28308
5b. GRANT NUMBER
5c. PROGRAM ELEMENT NUMBER
6. AUTHOR(S) S. Haase
5d. PROJECT NUMBER NREL/TP-7A2-45843
5e. TASK NUMBER IDKS1070
5f. WORK UNIT NUMBER
7. PERFORMING ORGANIZATION NAME(S) AND ADDRESS(ES) National Renewable Energy Laboratory 1617 Cole Blvd. Golden, CO 80401-3393
8. PERFORMING ORGANIZATION REPORT NUMBER NREL/TP-7A2-45843
9. SPONSORING/MONITORING AGENCY NAME(S) AND ADDRESS(ES)
10. SPONSOR/MONITOR'S ACRONYM(S) NREL
11. SPONSORING/MONITORING AGENCY REPORT NUMBER
12. DISTRIBUTION AVAILABILITY STATEMENT National Technical Information Service U.S. Department of Commerce 5285 Port Royal Road Springfield, VA 22161
13. SUPPLEMENTARY NOTES
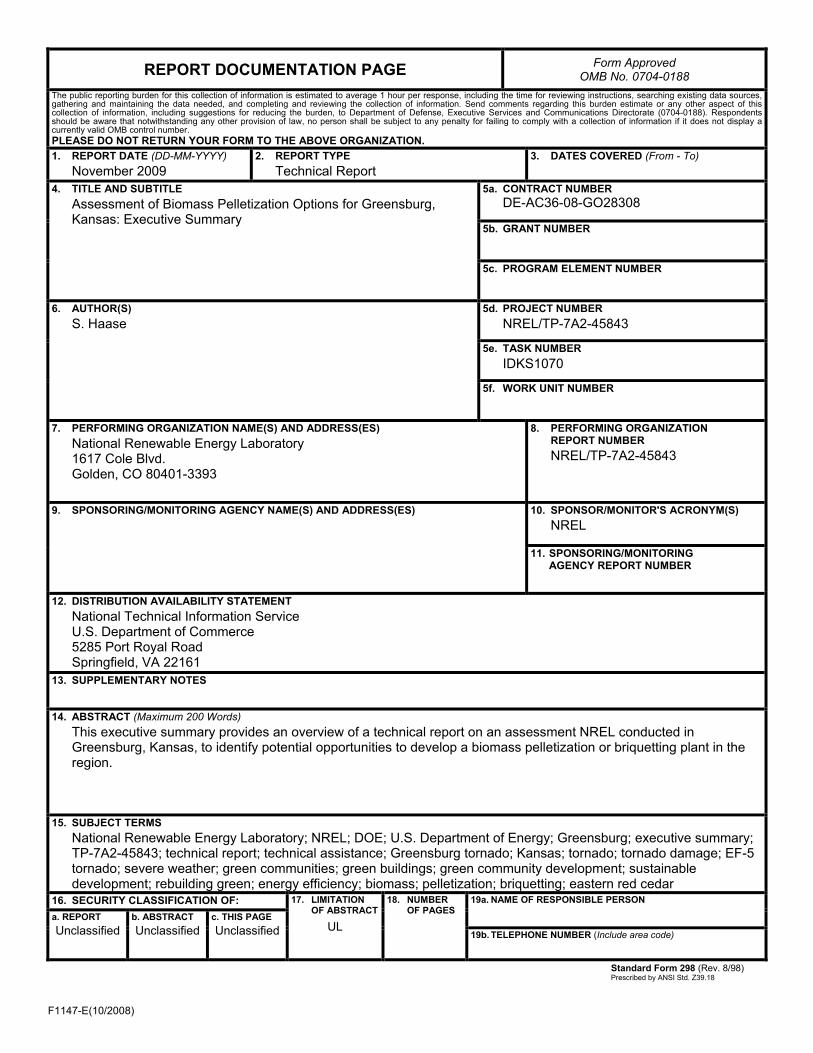
14. ABSTRACT (Maximum 200 Words) This executive summary provides an overview of a technical report on an assessment NREL conducted in Greensburg, Kansas, to identify potential opportunities to develop a biomass pelletization or briquetting plant in the region.
15. SUBJECT TERMS National Renewable Energy Laboratory; NREL; DOE; U.S. Department of Energy; Greensburg; executive summary; TP-7A2-45843; technical report; technical assistance; Greensburg tornado; Kansas; tornado; tornado damage; EF-5 tornado; severe weather; green communities; green buildings; green community development; sustainable development; rebuilding green; energy efficiency; biomass; pelletization; briquetting; eastern red cedar
16. SECURITY CLASSIFICATION OF: 17. LIMITATION OF ABSTRACT
UL
18. NUMBER OF PAGES
19a. NAME OF RESPONSIBLE PERSON a. REPORT
Unclassified b. ABSTRACT Unclassified
c. THIS PAGE Unclassified 19b. TELEPHONE NUMBER (Include area code)
Standard Form 298 (Rev. 8/98) Prescribed by ANSI Std. Z39.18