Assessment of aquifer pollution vulnerability and ... · Edited by O. Schmoll, G. Howard, J....
43
© 2006 World Health Organization. Protecting Groundwater for Health: Managing the Quality of Drinking-water Sources . Edited by O. Schmoll, G. Howard, J. Chilton and I. Chorus. ISBN: 1843390795. Published by IWA Publishing, London, UK. 8 Assessment of aquifer pollution vulnerability and susceptibility to the impacts of abstraction J. Chilton Information about subsurface conditions is needed for the area of investigation, which may be a complete catchment, the outcrop or recharge area of an aquifer or the part of the aquifer contributing water to individual public supply sources or wellfields. The latter is often referred to as the capture zone, and represents the size of the area from which adequate recharge is obtained to balance the total amount of water abstracted. The information required is that which will enable assessments to be made of both the vulnerability of the aquifer to pollution and its susceptibility to the impacts of heavy or even excessive abstraction of groundwater. This chapter first defines aquifer vulnerability and describes how it is assessed, and reviews the range of information types that are likely to be needed about the hydrogeological conditions to enable this to be done. The chapter also provides some general guidance on where such information might be found. While this information is mostly of a physical geographical and geological nature, it can also include land use, as this is often closely linked to or determined by geographical factors. An obvious example of this would be mining, the presence
Transcript of Assessment of aquifer pollution vulnerability and ... · Edited by O. Schmoll, G. Howard, J....
© 2006 World Health Organization. Protecting Groundwater for Health: Managing the Quality of Drinking-water Sources. Edited by O. Schmoll, G. Howard, J. Chilton and I. Chorus. ISBN: 1843390795. Published by IWA Publishing, London, UK.
8 Assessment of aquifer pollution vulnerability and susceptibility to the impacts of abstraction
J. Chilton
Information about subsurface conditions is needed for the area of investigation, which may be a complete catchment, the outcrop or recharge area of an aquifer or the part of the aquifer contributing water to individual public supply sources or wellfields. The latter is often referred to as the capture zone, and represents the size of the area from which adequate recharge is obtained to balance the total amount of water abstracted. The information required is that which will enable assessments to be made of both the vulnerability of the aquifer to pollution and its susceptibility to the impacts of heavy or even excessive abstraction of groundwater. This chapter first defines aquifer vulnerability and describes how it is assessed, and reviews the range of information types that are likely to be needed about the hydrogeological conditions to enable this to be done. The chapter also provides some general guidance on where such information might be found. While this information is mostly of a physical geographical and geological nature, it can also include land use, as this is often closely linked to or determined by geographical factors. An obvious example of this would be mining, the presence
200 Protecting Groundwater for Health
or absence of which is clearly determined by the geology. The chapter provides a brief summary of the ways in which abstraction can have negative consequences for groundwater. As with the other chapters in this section, a checklist is provided at the end.
NOTE Hydrogeological conditions which determine aquifer pollution potential vary greatly. They therefore need to be analysed specifically for the conditions in a given setting. The information in this chapter supports hazard analysis in the context of developing a Water Safety Plan for a given water supply (Chapter 16).
8.1 DEFINING, CHARACTERIZING AND MAPPING GROUNDWATER VULNERABILITY
8.1.1 Vulnerability of groundwater to pollution In view of the importance of groundwater for potable supplies, it might be expected that aquifer protection to prevent groundwater quality deterioration would have received due attention. However, even in and around urban and industrial areas where many actual or potential sources of pollution are located, aquifer protection has, until relatively recently, not been given adequate consideration. One important reason for this lack of consideration is that groundwater flow and pollutant transport are neither readily observed nor easily measured. These are generally slow processes in the subsurface, and there is widespread ignorance and indeed complacency about the risk of groundwater pollution amongst administrators and planners with responsibility for managing land and water resources. In the long term, however, protection of groundwater resources is of direct practical importance because, once pollution of groundwater has been allowed to occur, the scale and persistence of such pollution makes restoration technically difficult and costly. In taking care of the quality of groundwater, as in many other things, prevention is better than cure.
Natural attenuation capacity varies widely according to geological and soil conditions. Instead of applying controls on possible polluting activities everywhere, it is more cost-effective and provides less severe constraints on economic development if the degree of control is varied according to attenuation capacity. This is the general principle underlying the concept of aquifer vulnerability, and the need for mapping vulnerability distribution (Foster et al., 2002).
Given the complexity of the factors governing pollutant pathways and transport of pollutants to aquifers, it might appear that hydrogeological conditions are just too complicated for vulnerability to be mapped, and that each polluting activity or
Assessment of aquifer pollution vulnerability 201
pollutant should be treated separately. While it is clear that general vulnerability to a universal contaminant cannot really be valid, nevertheless trying to define vulnerability separately for specific pollutants is unlikely to achieve either adequate coverage or universal acceptance, and would have data requirements that are unrealistic in terms of human and financial resources.
A logical approach to assessing the likelihood of groundwater pollution is to think of it as the interaction between the pollutant load that is, or might be, applied to the subsurface environment as a result of human activity and the pollution vulnerability, which is determined by the characteristics of the strata separating the aquifer from the land surface.
In these terms, vulnerability is a function of the ease of access to the saturated aquifer for water and pollutants, and the attenuation capacity of the soil and geological strata between the pollution source and the groundwater. Information needs concerning possible pollutant loads and sources are dealt with in Chapters 9 to 13, and the general guiding principles of aquifer vulnerability are covered below. Firstly, however, some words of caution need to be born in mind in relation to the applicability of the above approach (Foster and Hirata, 1988; NRC, 1993):
NOTE All aquifers are vulnerable to persistent, mobile pollutants in the long term. Less vulnerable aquifers are not easily polluted, but once polluted they are more difficult to restore. Uncertainty is inherent in all pollution vulnerability assessments. If complex assessment systems are developed, obvious factors may be obscured, and subtle differences may become indistinguishable.
The term pollution vulnerability refers to the intrinsic characteristics of an
aquifer that represent its sensitivity to being adversely affected by an imposed contaminant load. It is, in effect, the inverse of the pollution assimilation capacity of the receiving water in river quality management, but with the difference that aquifers usually have at least some overlying strata that can provide additional protection. If such a scheme is adopted, it is possible to have high vulnerability but no pollution risk, because there is no pollution loading, or vice versa. Both are quite consistent in practice. Moreover, the contaminant load can be removed, controlled or modified, but the aquifer vulnerability, which depends on the intrinsic properties of the subsurface, cannot.

202 Protecting Groundwater for Health
8.1.2 Defining aquifer pollution vulnerability The concept of groundwater vulnerability is derived from the assumption that the physical environment may provide some degree of protection of groundwater against natural and human impacts, especially with regard to pollutants entering the subsurface environment. The term ‘vulnerability of groundwater to contamination’ was probably first introduced in France in the late 1960s (Albinet and Margat, 1970). The general intention was to show that the protection provided by the natural environment varied from place to place. This would be done by describing in map form the degree of vulnerability of groundwater to pollution as a function of the hydrogeological conditions. Thus the fundamental principle of groundwater vulnerability is that some land areas are more vulnerable to pollution than others, and the goal of a vulnerability map is to subdivide an area accordingly. The differentiation between mapped units was considered arbitrary because the maps showed the vulnerability of certain areas relative to others, and did not represent absolute values. The maps, however, would provide information from which land use and associated human activities could be planned and/or controlled as an integral part of an overall policy of groundwater protection at national, sub-national (province or state) or catchment scale.
Although the general concept has been in use for more than thirty years, there is not really a generally accepted definition of the term. The historical evolution of the concept of vulnerability was reviewed by Vrba and Zaporozec (1994). Hydrogeologists have debated in particular whether vulnerability should be determined in a general way for all pollutants, or specifically for individual or groups of pollutants. The following is considered to adequately define the concept of vulnerability:
DEF Vulnerability comprises the intrinsic properties of the strata separating a saturated aquifer from the land surface which determine the sensitivity of that aquifer to being adversely affected by pollution loads applied at the land surface.
Vrba and Zaporozec (1994) recognized that there could be more than one type
of vulnerability: intrinsic (or natural) which was defined purely as a function of hydrogeological factors, and specific for those users who wished to prepare and use maps related to specific pollutants, for example agricultural nitrate, pesticides, or atmospheric deposition. It would be more scientifically robust to evaluate vulnerability for each pollutant or class of pollutant or group of polluting activities separately (Anderson and Gosk, 1987), especially for such diverse pollutants and activities as those listed above, or unsewered sanitation and wastewater use, for example. There is, however, unlikely to be adequate data or human resources to achieve this. Development of a generally recognized and accepted definition of vulnerability does not, however, imply that there should be a standardized approach to its mapping. Hydrogeological environments and user requirements in

Assessment of aquifer pollution vulnerability 203
terms of scales are too diverse to be dealt with in a standardized way, but it is important to agree on a common basis – the definition of vulnerability – before considering approaches to the assessment of such diversified conditions.
Representation of the vulnerability of groundwater to pollution by means of maps has become an important tool by which hydrogeologists can assist the planning community. However, the inevitable limitations of such maps need to be explained to the users by the groundwater specialists who prepare them. These limitations come from the conceptual distinction between intrinsic and specific maps referred to above, from the simplifications imposed by the scale of heterogeneity of soils and aquifers compared to the scale of the map, and from deficiencies in the data available for whatever method of depicting vulnerability is adopted. Given an appreciation of these limitations, vulnerability maps have been demonstrated to play a useful part in groundwater protection (NRC, 1993; Vrba and Zaporozec, 1994).
8.1.3 Classifying aquifer vulnerability Vulnerability assessment involves evaluating likely travel times from the ground surface to the water table, or to the aquifer in the case of confined conditions. The greater the travel time, the more potential there is for pollutant attenuation by the processes outlined in Chapters 3 and 4. Aquifer vulnerability can be subdivided simply into five broad classes (Table 8.1). Extreme vulnerability is associated with aquifers having a high density of open fractures and with shallow water tables, which offer little chance for pollutant attenuation.
Table 8.1. Broad classification of aquifer vulnerability (based on Foster et al., 2002)
Vulnerability class
Definition
Extreme Vulnerable to most water pollutants with relatively rapid impact in many pollution scenarios
High Vulnerable to many pollutants, except those highly absorbed and/or readily transformed, in many pollution scenarios
Moderate Vulnerable to some pollutants, but only when continuously discharged or leached
Low Only vulnerable to the most persistent pollutants in the long term, when continuously and widely discharged or leached
Negligible Confining beds are present and prevent any significant vertical groundwater flow
Thus for preliminary assessment purposes, it is instructive to note that the
hydrogeological environments described in Chapter 2 differ greatly in the time taken for recharge entering at the land surface to reach the water table or potentiometric surface of the aquifer (Table 8.2). Table 8.1 also indicates the likely vulnerability class for each environment, and the general vulnerability of some common soils and rocks is summarized in Figure 8.1, in which the arrows

204 Protecting Groundwater for Health
indicate increasing vulnerability, and the three classes used in this earlier attempt at classification roughly correspond to the three middle classes in Table 8.1.
Figure 8.1. Vulnerability of soils and rocks to groundwater pollution (modified from Lewis et al., 1980)
Table 8.2. Hydrogeological environments and their associated groundwater pollution vulnerability (based on Morris et al., 2003)
Hydrogeological environment
Typical travel times to water-table
Attenuation potential of aquifer
Pollution vulnerability
unconfined weeks-months high-moderate moderate Alluvial and coastal plain sediments
semi-confined years-decades High low
unconfined months-years moderate moderate Intermontane valley-fill and volcanic systems
semi-confined years-decades moderate moderate-low
porous sandstones
weeks-years high moderate-high Consolidated sedimentary aquifers karstic
limestones days-weeks low extreme
Coastal limestones unconfined days-weeks low-moderate high-extreme
Glacial deposits unconfined weeks-years moderate-low high-moderate
lavas days-months low-moderate high-extreme Extensive volcanic sequences ash/lava
sequences months-years high low
unconfined days-weeks low high-extreme Weathered basement semi-confined weeks-years moderate moderate
Loessic plateaux unconfined days-months low-moderate moderate-high

Assessment of aquifer pollution vulnerability 205
Unsaturated zone travel time and aquifer residence time are important factors in any aquifer assessment because they affect the ability of the aquifer in question to protect against pollution. For instance, a residence period of a month or so is adequate to eliminate most bacterial pathogens (Chapter 3). Spillages of more intractable pollutants such as petrol or other fuels, and other organic compounds can, given time, undergo significant degradation in-situ by an aquifer’s indigenous microbial population (Chapter 4).
The soil zone is usually regarded as a principal factors in the assessment of groundwater vulnerability and the first line of defence against pollution. The main properties of soils that relate to vulnerability to pollution are discussed in Section 8.2.4 below. The soil layer is usually continuous, but the spatial variability of its physical, chemical and biological properties can be very great, and generalizations of soil parameters have to be undertaken with some care. Because of its potential to attenuate a range of pollutants, it plays a critical role when considering specific vulnerability to diffuse sources of pollution such as agricultural fertilizers, pesticides and acid deposition. Not all soil profiles and underlying materials are equally effective in attenuating pollutants, and the degree of attenuation will vary widely with the types of pollutant and polluting process in any given environment.
The soil has a particularly important position amongst vulnerability factors because the soil itself is vulnerable. The soil’s function as a natural protective filter can be damaged rather easily by such routine activities as cultivation and tillage, irrigation, compaction and drainage. Human activities at the land surface can greatly modify the existing natural mechanisms of groundwater recharge and introduce new ones, changing the rate, frequency and quality of groundwater recharge. This is especially the case in arid and semi-arid regions where there may be relatively little and infrequent natural recharge, but also applies to more humid regions. Understanding these mechanisms and diagnosing such changes are critical, and the use of soil properties in vulnerability assessment should always take into consideration whether the soils in the area of interest are in their natural state. Further, there are many potentially polluting human activities in which the soil is removed or otherwise by-passed and for these the component of protection provided by the soil does not apply.
Below the soil, the unsaturated zone is very important in protecting the underlying groundwater, especially where soils are thin and/or poorly developed. The character of the unsaturated zone and its potential attenuation capacity then determine decisively the degree of groundwater vulnerability. The main unsaturated zone properties that are important in vulnerability assessment are the thickness, lithology and vertical hydraulic conductivity of the materials. The thickness depends on the depth to the water table, which can vary significantly due to local topography and also fluctuates seasonally, and both these have to be taken into account when determining thickness. The importance of hydraulic conductivity, its distribution and its role in determining groundwater flow rates should be particularly emphasized. Porosity, storage properties, and groundwater flow direction may also be important, and another supplementary parameter in
206 Protecting Groundwater for Health
some types of aquifers and circumstances may be the depth and degree of weathering of the upper part of the unsaturated zone.
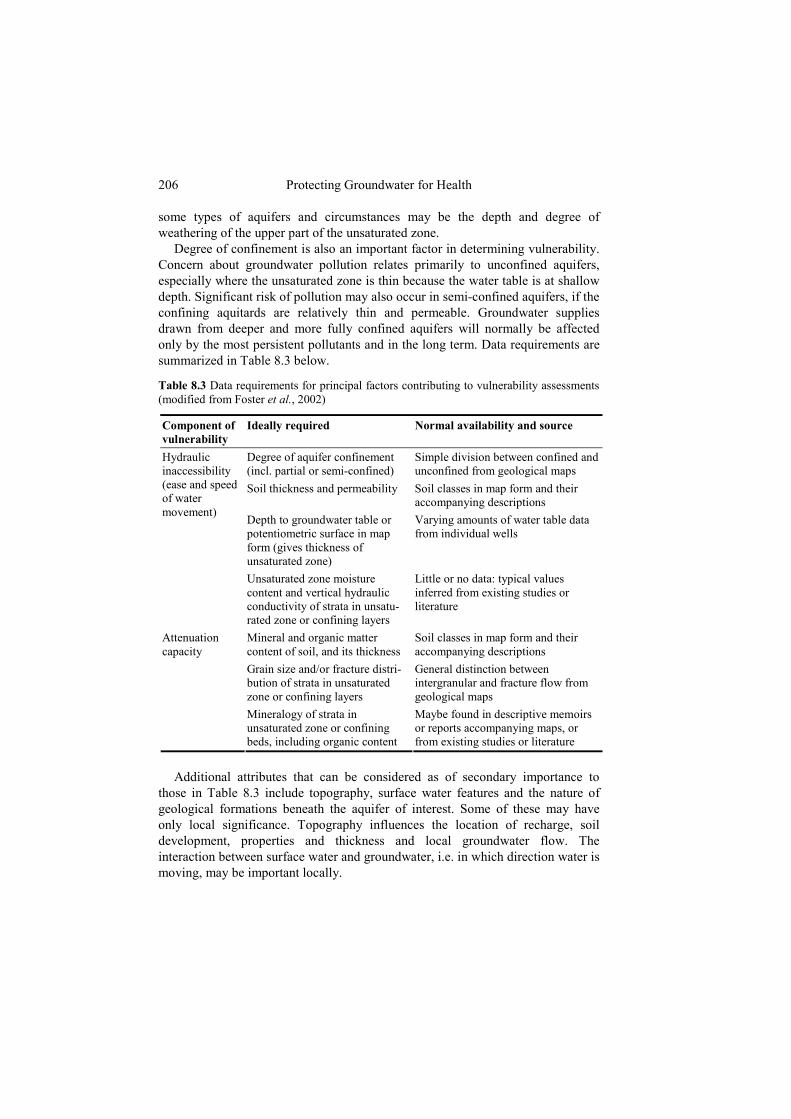
Degree of confinement is also an important factor in determining vulnerability. Concern about groundwater pollution relates primarily to unconfined aquifers, especially where the unsaturated zone is thin because the water table is at shallow depth. Significant risk of pollution may also occur in semi-confined aquifers, if the confining aquitards are relatively thin and permeable. Groundwater supplies drawn from deeper and more fully confined aquifers will normally be affected only by the most persistent pollutants and in the long term. Data requirements are summarized in Table 8.3 below.
Table 8.3 Data requirements for principal factors contributing to vulnerability assessments (modified from Foster et al., 2002)
Component of vulnerability
Ideally required Normal availability and source
Degree of aquifer confinement (incl. partial or semi-confined)
Simple division between confined and unconfined from geological maps
Soil thickness and permeability Soil classes in map form and their accompanying descriptions
Depth to groundwater table or potentiometric surface in map form (gives thickness of unsaturated zone)
Varying amounts of water table data from individual wells
Hydraulic inaccessibility (ease and speed of water movement)
Unsaturated zone moisture content and vertical hydraulic conductivity of strata in unsatu-rated zone or confining layers
Little or no data: typical values inferred from existing studies or literature
Mineral and organic matter content of soil, and its thickness
Soil classes in map form and their accompanying descriptions
Grain size and/or fracture distri-bution of strata in unsaturated zone or confining layers
General distinction between intergranular and fracture flow from geological maps
Attenuation capacity
Mineralogy of strata in unsaturated zone or confining beds, including organic content
Maybe found in descriptive memoirs or reports accompanying maps, or from existing studies or literature
Additional attributes that can be considered as of secondary importance to
those in Table 8.3 include topography, surface water features and the nature of geological formations beneath the aquifer of interest. Some of these may have only local significance. Topography influences the location of recharge, soil development, properties and thickness and local groundwater flow. The interaction between surface water and groundwater, i.e. in which direction water is moving, may be important locally.
Assessment of aquifer pollution vulnerability 207
8.1.4 Mapping aquifer vulnerability A vulnerability map shows in a more or less subjective way the capacity of the subsurface environment to protect groundwater. Like all derivative or interpreted maps, it is somewhat subjective because it must meet the requirements of the user. The maps should provide the user with the most accurate and informative assessment of the sensitivity to impacts, allowing comparison between aquifers and between different locations and different parts of the same aquifer. Preparation of the maps usually involves combining or overlaying several thematic maps of selected physical factors that have been chosen to depict vulnerability. These are discussed below, but have been grouped by Vrba and Zaporozec (1994) into those associated with:
• the hydrogeological framework – the characteristics of the soils and underlying geological materials;
• the groundwater flow system – the direction and speed of groundwater movement;
• the climate – the amount and type of recharge. A further general consideration is that vulnerability maps are normally prepared
from existing information only, without the collection of new field data. A number of approaches to the assessment and mapping of vulnerability have
been developed, using varying combinations of the soil, unsaturated and saturated zone factors outlined above. These can be considered in three groups:
• hydrogeological setting methods • parametric methods • analogical relation and numerical model methods.
All methods are briefly explained below and described in more detail by Vrba and Zaporozec (1994). The ways they are incorporated into groundwater protection strategies are discussed in Chapter 17.
The hydrogeological setting methods use the comparison of a subject area to criteria that are judged to represent vulnerable conditions in other areas. A hierarchical system of two or usually more classes is established to cover the range of vulnerability. These widely used methods evaluate the vulnerability of hydrogeological complexes and settings, using an overlay cartographic method (Albinet and Margat, 1970). These methods produce universal systems suitable for large areas and a variety of hydrogeological conditions, and therefore lend them-selves to the production of maps of large land areas, including national coverage.
The second group, parametric methods, can be further subdivided into matrix, rating or point count systems, although the overall approach is the same. Factors judged to be representative of vulnerability are selected, and each has a range that is divided into discrete hierarchical intervals (e.g. 0-5 m, 5-10 m, 10-20 m depth to water), and each interval is assigned a value reflecting its relative degree of vulnerability. Matrix systems are based on a limited number of factors for example two to four classes of vulnerability of soil and aquifer types, two or three intervals of depth to water. Vulnerability mapping of the United Kingdom follows this approach (Adams and Foster, 1992). The Jordan case study presented in Section 8.1.5 is an example of a rating system. Rating systems are largely derived

208 Protecting Groundwater for Health
from the work of Le Grand (1983). A fixed range is given to any parameter considered necessary and adequate for vulnerability assessment. The range is divided according to the variation interval of each parameter and the sum of the ratings for each parameter provides the vulnerability assessment for any point or area. The range of final scores is divided into segments representing relative vulnerability. Some rating systems use primarily soil parameters, others hydrogeological factors, but they are generic and not specific to any pollutant.
An index-based parametric method developed by Foster and Hirata (1988) has been applied in several Latin American countries (Foster et al., 2002). The GOD system uses three generally available or readily estimated parameters, the degree of Groundwater hydraulic confinement, geological nature of the Overlying strata and Depth to groundwater. Each is rated on a vulnerability scale of 0 (lowest) to 1 (highest), and multiplied together to provide an overall index of pollution vulnerability. This method has recently been further developed and adapted to take account of the soil component of vulnerability (Foster et al., 2002). Another approach specifically for karstic areas is the EPIK method developed by Doerfliger and Zwahlen (1998) and discussed by Daly et al. (2001).
Point count systems are a further development in parametric approaches in which a weighting factor or multiplier is added to represent the importance of each parameter in the vulnerability assessment. The ratings for each interval are multiplied by the weight for the parameter and the products summed to obtain a final numerical score, which is higher for greater vulnerability. However, a potential problem with this approach is the breaking down of the final scores into classes of relative vulnerability. One of the best known point count systems is DRASTIC, developed by the US EPA (Aller et al., 1987; US EPA, 1992), which has been widely tested (Kalinski et al., 1994; Rosen, 1994). The method employs seven hydrogeological factors to develop an index of vulnerability:
• Depth to water table • net Recharge • Aquifer media • Soil media • Topography (slope) • Impact on the vadose zone • hydraulic Conductivity
An index is generated by applying a weight to each hydrogeological factor that is represented numerically. As the hydrogeological factors vary spatially, the DRASTIC index provides a systematic way of mapping the relative vulnerability of groundwater to contamination and can be readily incorporated into a GIS (Kim and Hamm, 1999; Shahid, 2000). However, the large number of parameters included means that data requirements are invariably difficult to meet. Further, the large number of variables factored into the final index number may mean that critical parameters may be subdued by other parameters having little or no bearing on vulnerability in that particular setting. Some DRASTIC parameters, such as aquifer and soil media and hydraulic conductivity, are not fully independent but interact with each other.

Assessment of aquifer pollution vulnerability 209
Whichever system is used, the primary sources of data for assessing aquifer vulnerability are soil and geological maps and cross-sections, data or maps of depth to groundwater, supplemented by information from existing hydrogeological investigations that can provide additional information on subsurface transport and attenuation properties (Table 8.3).
Overall, allowing for the cautionary words at the beginning of this discussion, the concept of groundwater vulnerability has become both broadly accepted and widely used (NRC, 1993; Vrba and Zaporozec, 1994). Vulnerability maps should not be used to assess hazards where pollutants are discharged deeper into the subsurface, for example leaking tanks and landfills, or for spillages of DNAPLs. A further note of warning is that for most methods the resulting assessment of vulnerability applies only to the aquifer closest to the ground surface if there is more than one aquifer in a vertical sequence. While this is often the most important for local water supply, deeper aquifers may also be exploited. At first sight, such aquifers may appear to be more than adequately protected from pollution, but they may in fact be vulnerable to downward leakage of pollutants, which can be induced by pumping from the deeper horizons, or to pollutants moving laterally from a more remote source.
8.1.5 Case study: Groundwater vulnerability mapping in the Irbid area in Northern Jordan
The method applied The method established by the State Geological Surveys of Germany (Hölting et al., 1995) for the preparation of groundwater vulnerability maps uses a rating system for the properties of the unsaturated zone. The degree of vulnerability is specified according to the protective effectiveness (the ability of the cover above an aquifer to protect the groundwater) of the soil cover down to a depth of one metre (the average rooting depth), and the rock cover (the unsaturated zone). The following parameters are considered for the assessment of the overall protective effectiveness: effective field capacity of the soil, percolation rate factor, rock type and thickness of the rock cover above the saturated aquifer. Additional positive weightings are given for perched aquifer systems, and for aquifers under strong hydraulic pressure and upward flow conditions.
The process of calculating the overall protective effectiveness for a large area is complex and requires the use of Geographical Information System (GIS) software. Hölting et al. (1995) distinguished five classes of overall protective effectiveness of the soil and rock cover (Table 8.4). The higher the total number of points, the longer the approximate residence time for water percolating through the unsaturated zone and in consequence the greater the overall protective effectiveness.
The Irbid area was selected to test vulnerability mapping for the first time in Jordan, and this method was selected since it allows assessment of groundwater vulnerability over large areas based on existing data, i.e. at low cost and in a short amount of time.
210 Protecting Groundwater for Health
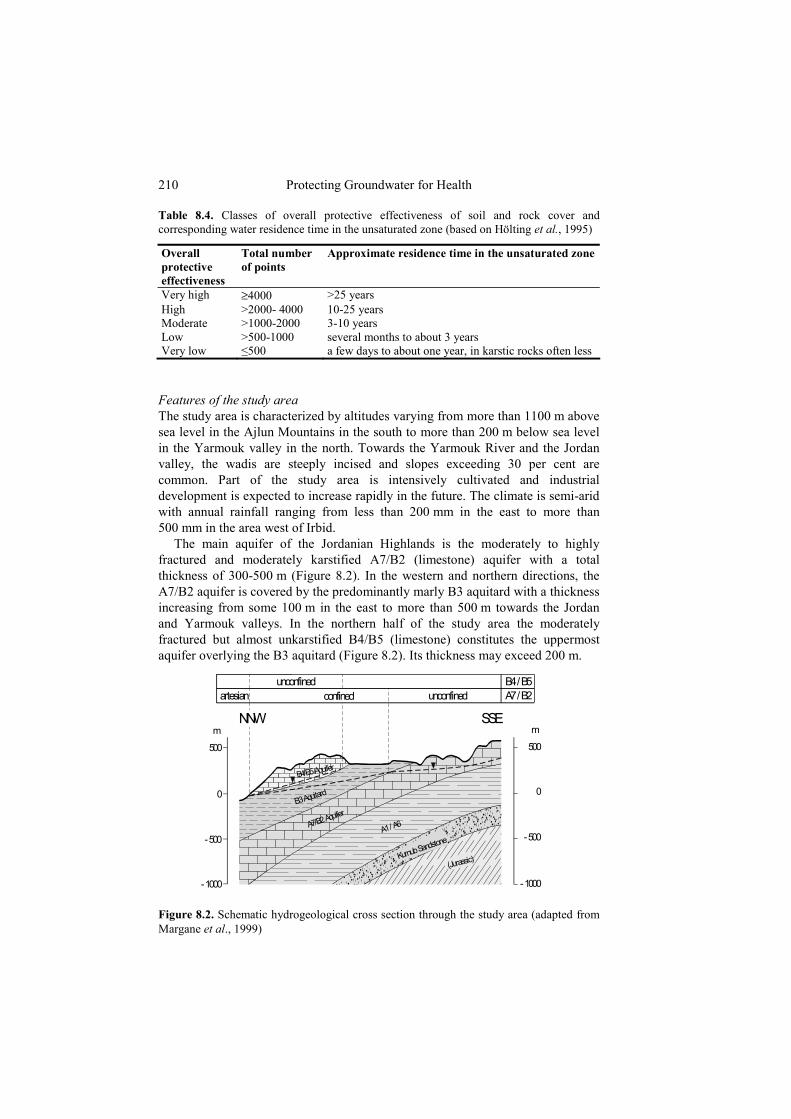
Table 8.4. Classes of overall protective effectiveness of soil and rock cover and corresponding water residence time in the unsaturated zone (based on Hölting et al., 1995)
Overall protective effectiveness
Total number of points
Approximate residence time in the unsaturated zone
Very high ≥4000 >25 years High >2000- 4000 10-25 years Moderate >1000-2000 3-10 years Low >500-1000 several months to about 3 years Very low ≤500 a few days to about one year, in karstic rocks often less
Features of the study area The study area is characterized by altitudes varying from more than 1100 m above sea level in the Ajlun Mountains in the south to more than 200 m below sea level in the Yarmouk valley in the north. Towards the Yarmouk River and the Jordan valley, the wadis are steeply incised and slopes exceeding 30 per cent are common. Part of the study area is intensively cultivated and industrial development is expected to increase rapidly in the future. The climate is semi-arid with annual rainfall ranging from less than 200 mm in the east to more than 500 mm in the area west of Irbid.
The main aquifer of the Jordanian Highlands is the moderately to highly fractured and moderately karstified A7/B2 (limestone) aquifer with a total thickness of 300-500 m (Figure 8.2). In the western and northern directions, the A7/B2 aquifer is covered by the predominantly marly B3 aquitard with a thickness increasing from some 100 m in the east to more than 500 m towards the Jordan and Yarmouk valleys. In the northern half of the study area the moderately fractured but almost unkarstified B4/B5 (limestone) constitutes the uppermost aquifer overlying the B3 aquitard (Figure 8.2). Its thickness may exceed 200 m.
Figure 8.2. Schematic hydrogeological cross section through the study area (adapted from Margane et al., 1999)
500
0
- 500
- 1000
m500
0
- 500
- 1000
m
Kurnub Sandsto
ne
(Jurassic)
B4/B5 Aquifer
B3 Aquitard
A7/B2 Aquifer
A1 / A6
artesianunconfined
confined unconfined
SSE
A7 / B2B4 / B5
NNW

Assessment of aquifer pollution vulnerability 211
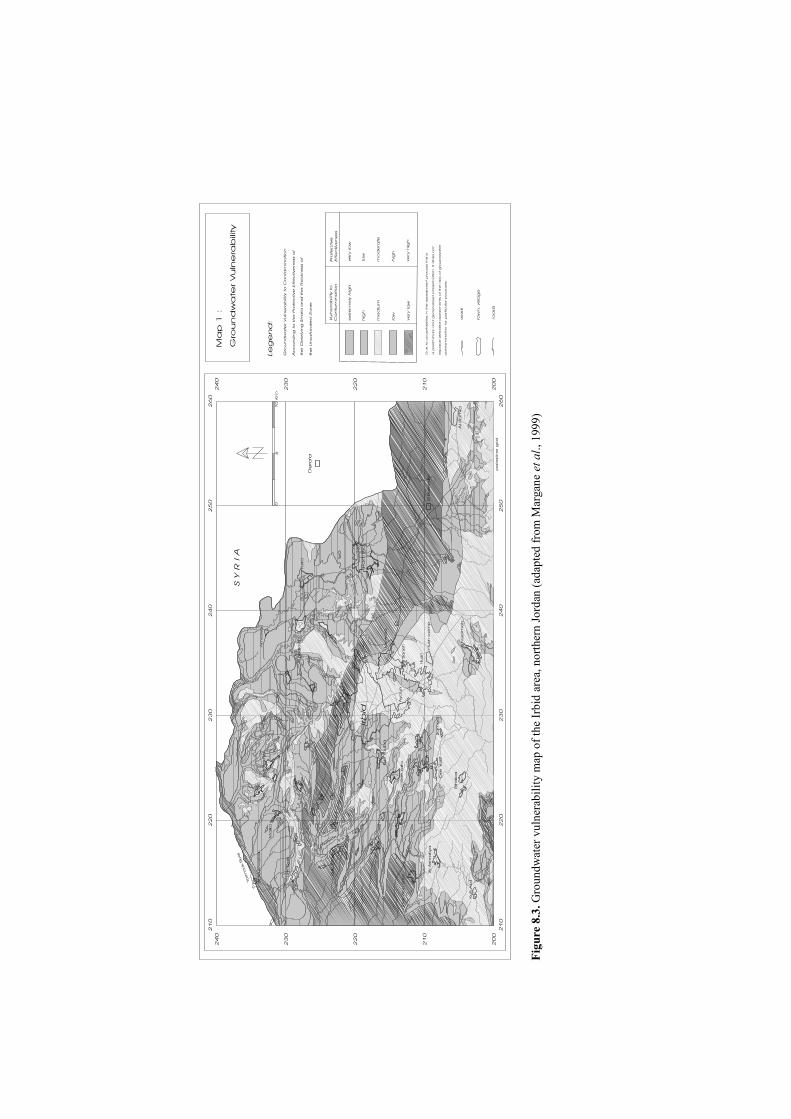
In areas where the A7/B2 aquifer is protected by the overlying B3 aquitard, observed groundwater nitrate concentrations are usually below 15 mg/l and often below 1 mg/l. At a few sites of uncovered A7/B2 aquifer, nitrate concentrations above 80 mg/l indicate anthropogenic contamination. In the B4/B5 aquifer, however, many springs cannot be used for public water supply because of chemical or bacteriological contamination. At some intensively cultivated sites nitrate concentrations exceed 100 mg/l. The resulting vulnerability map Figure 8.3 shows the resulting groundwater vulnerability map of the Irbid area. The protective effectiveness of the soil and rock cover above the saturated B4/B5 aquifer has been classified as low to very low. In the main wadis and in the areas where the groundwater is close to the ground surface, the vulnerability of the groundwater is extremely high. Protective effectiveness is classified as moderate only on the high plateaus between the deeply incised wadis running towards the Yarmouk River in the north. Vulnerability of the A7/B2 aquifer is especially high in areas where an effective soil cover is missing, the groundwater table is comparatively shallow and the aquifer is unconfined. Areas of medium vulnerability are widely distributed on the outcrop areas of the A7/B2 aquifer in the southern part of the mapped area.
Further north and west, where the A7/B2 aquifer is overlain by the predominantly marly B3 aquitard and well developed soils, the protective effectiveness of the soil and rock cover has been classified as high and, in the areas where the groundwater is confined, as very high. The Yarmouk Valley in the extreme northern part of the study area, where the B4/B5 unit has been eroded and the highly confined A7/B2 aquifer forms the uppermost aquifer, also belongs in this category. Associated mapping of potential groundwater pollution sources in the same area was also part of the study (Margane et al., 1999).
Figu
re 8
.3. G
roun
dwat
er v
ulne
rabi
lity
map
of t
he Ir
bid
area
, nor
ther
n Jo
rdan
(ada
pted
from
Mar
gane
et a
l., 1
999)

Assessment of aquifer pollution vulnerability 213
8.2 INFORMATION NEEDS AND DATA SOURCES FOR VULNERABILITY ASSESSMENT
8.2.1 Regional geological and hydrogeological setting The first important step in characterizing the physical environment for groundwater protection is to define the principal features of the regional geology so that the dominant aquifer types and hydrogeological settings outlined in Chapter 2 can be identified. The best sources of information from which the aquifer types can be defined are geological maps, which in most countries are produced by the national geological survey organization. Where these are published, printed and sold, they provide a cheap and usually easy to obtain source of this basic but vital information. However, these maps, which are often accompanied by descriptive memoirs, are prepared by, and mainly for, geologists, and this is the reason that at least some knowledge of the technical terms is required, as mentioned in Chapter 2. The associated descriptive notes or memoirs can be very useful as they usually include cross-sections showing the geometry, structure, dip and orientation of the various geological formations, from which the first indications of the likely groundwater flow system can be obtained. In some countries, such memoirs also include a general summary of the hydrogeology and groundwater development of the area covered.
An alternative and often better source of basic information about the groundwater conditions in an area is a hydrogeological map, if such exists. Their production and usage has been promoted for many years by UNESCO, which produced a universal legend to assist in the preparation of hydrogeological maps that could be easily compared with each other (UNESCO, 1970). As a result, national and regional maps showing the distribution of productive aquifers and less productive lower permeability materials now exist for much of the world. The maps distinguish between aquifers in which groundwater flow is dominantly intergranular and those in which it is dominantly through fractures, and also indicate the distribution of the main lithological types. Groundwater level contours provide a general indication of flow directions. The maps can also, therefore, be used as a source of information from which to develop a conceptual model of the groundwater flow regime. The principal groundwater supply sources – boreholes, springs or wellfields are sometimes shown. Groundwater quality information is usually restricted to indications of general groundwater salinity. Struckmeier and Margat (1995) provide a comprehensive list of hydrogeological maps, together with guidance on map preparation and a revised standard legend.
Issues of scale of information availability in relation to the scale of interest can be important. National geological mapping is often undertaken in the field at scales ranging from 1:10 000 to 1:50 000, and the final maps are usually produced at 1:50 000 to 1:100 000, or even broader scales for large countries which are being mapped for the first time. Maps of such scale can provide information about the distribution of the main rock types and may give a preliminary indication of their nature as either granular or fractured aquifers. The maps may, however, be
214 Protecting Groundwater for Health
rather scientific and technical in the names and ages of the rock types depicted, and some help and interpretation from a geologist or hydrogeologist will probably be required. Additional information and first-hand knowledge and experience can often be obtained from local technical staff of, for example, the water utility operating the groundwater supply sources which require protection. Hydrogeological maps may have more simplified depictions of the geological units and are often prepared at even broader scales, 1:250 000 being common. With increasing usage of digital technology, it may be possible to obtain digital geological or hydrogeological maps to be used as layers in a GIS approach to depicting groundwater vulnerability and planning groundwater protection.
8.2.2 Groundwater flow systems Having identified the overall hydrogeological setting and determined the lithology and geometry – the extent and depth – of the relevant aquifers in the area of interest or catchment, the next step is to develop a broad conceptual model of the groundwater flow system. In relation to groundwater protection, this means understanding where groundwater recharge occurs, how it moves and where it discharges, as this forms the hydrogeological basis for the source-pathway-receptor approach to considering pollution threats.
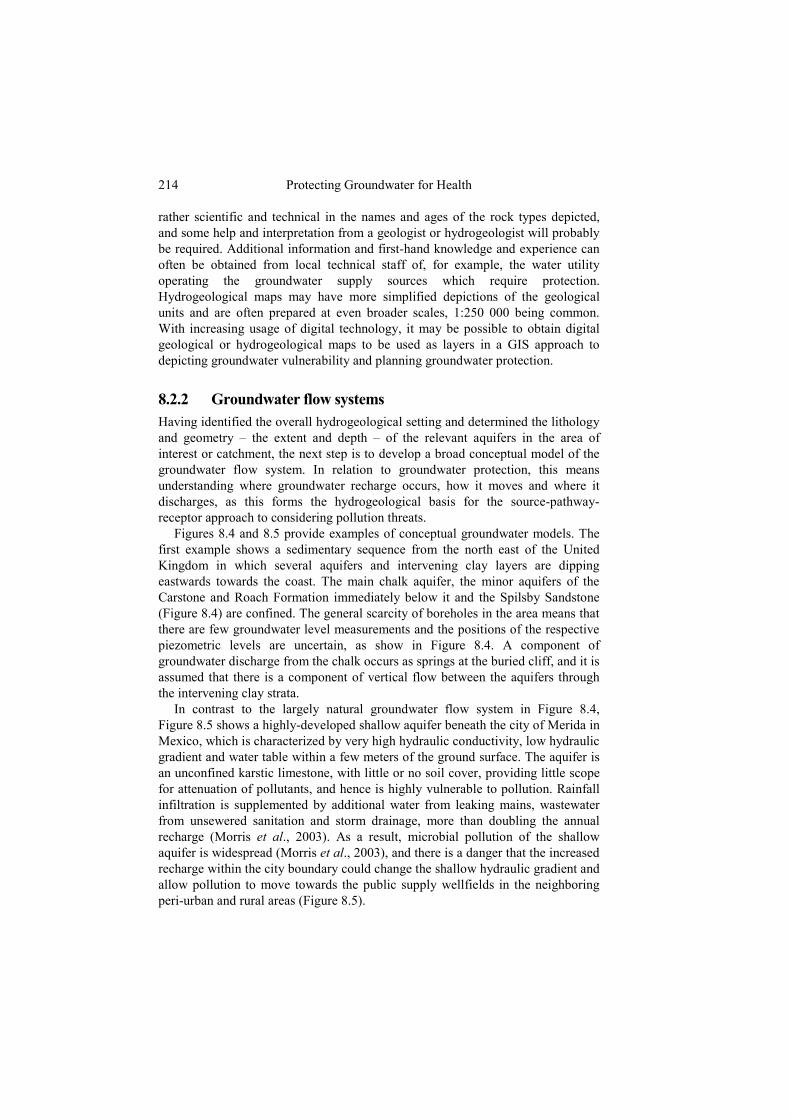
Figures 8.4 and 8.5 provide examples of conceptual groundwater models. The first example shows a sedimentary sequence from the north east of the United Kingdom in which several aquifers and intervening clay layers are dipping eastwards towards the coast. The main chalk aquifer, the minor aquifers of the Carstone and Roach Formation immediately below it and the Spilsby Sandstone (Figure 8.4) are confined. The general scarcity of boreholes in the area means that there are few groundwater level measurements and the positions of the respective piezometric levels are uncertain, as show in Figure 8.4. A component of groundwater discharge from the chalk occurs as springs at the buried cliff, and it is assumed that there is a component of vertical flow between the aquifers through the intervening clay strata.
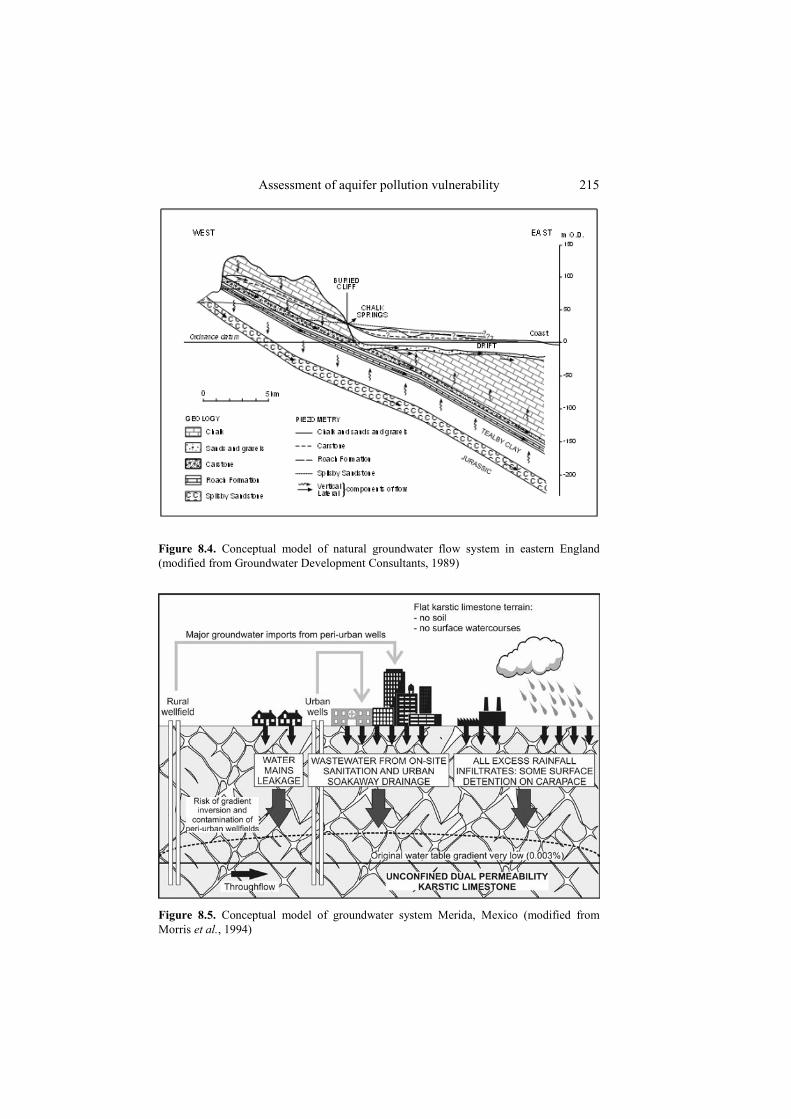
In contrast to the largely natural groundwater flow system in Figure 8.4, Figure 8.5 shows a highly-developed shallow aquifer beneath the city of Merida in Mexico, which is characterized by very high hydraulic conductivity, low hydraulic gradient and water table within a few meters of the ground surface. The aquifer is an unconfined karstic limestone, with little or no soil cover, providing little scope for attenuation of pollutants, and hence is highly vulnerable to pollution. Rainfall infiltration is supplemented by additional water from leaking mains, wastewater from unsewered sanitation and storm drainage, more than doubling the annual recharge (Morris et al., 2003). As a result, microbial pollution of the shallow aquifer is widespread (Morris et al., 2003), and there is a danger that the increased recharge within the city boundary could change the shallow hydraulic gradient and allow pollution to move towards the public supply wellfields in the neighboring peri-urban and rural areas (Figure 8.5).
Assessment of aquifer pollution vulnerability 215
Figure 8.4. Conceptual model of natural groundwater flow system in eastern England (modified from Groundwater Development Consultants, 1989)
Figure 8.5. Conceptual model of groundwater system Merida, Mexico (modified from Morris et al., 1994)
216 Protecting Groundwater for Health
The geological history and structure of the region provides some of the most important information, especially about the nature of the boundaries of the aquifers. The geological age and stratigraphic sequence define the vertical distribution of aquifers and aquitards, and the folding history determines the way in which aquifer sequences are tilted and dipping. Geological faults with significant displacement can bring permeable and impermeable materials adjacent to each other and reduce or prevent lateral groundwater flow. The geological structure may in fact help to determine the limits of the catchment or recharge area. Understanding of the aquifer boundaries and their hydraulic nature should be part of the development of a three-dimensional conceptual model of the groundwater flow system.
As introduced in Chapter 2, natural groundwater flow directions generally reflect the land surface, and movement is usually from topographically high recharge areas to lower areas of groundwater discharge (Figure 2.7). While this generalization holds for many cases, the occurrence of separate local and regional groundwater flow systems operating at different scales and depths (Figure 8.4) may mean that groundwater flow can be in opposite directions at different depths, and sometimes contrary to the topographic gradient. Also, human activities can affect the flow system by providing additional recharge sources and by abstraction of groundwater modifying or even reversing groundwater flow directions (Figure 8.5).
In many situations, there will be scope for interactions between surface water and groundwater. Thus rivers and lakes may be either losing or gaining, i.e. water can move from the surface water body downwards into the ground, or groundwater may be discharged into the river. To make matters more complicated, the direction of water movement may be different along the length of the river or lake, depending on the topographic relationship and hydraulic connection and gradient between surface water and groundwater. Thus in some places where the stream or riverbed is cut down into a shallow aquifer, groundwater will flow towards the river and augment surface water discharge. Elsewhere, a stream or canal may be located above an aquifer and separated from it by either a significant unsaturated zone or impermeable materials. Slow infiltration of water from the river to the aquifer could occur. Further, the direction of groundwater movement may be reversed at different times of the year as the relationship between river levels and groundwater table can vary seasonally. Only in karstic limestone areas is surface water largely absent, as rainfall that does not evaporate infiltrates, and there is hardly any runoff. Indeed, extreme examples of surface water/groundwater relationships changing along a river course are seen where streams flowing over relatively impermeable materials cross a geological boundary onto karstic limestones and disappear completely.
8.2.3 Physical geography and topography Having established the regional geological setting and consequent hydrogeological conditions and flow regime as outlined above, some other general physical

Assessment of aquifer pollution vulnerability 217
features of the study area are also important. Useful information can often be gained from the topographic maps of the national survey, commonly at scales of 1:50 000 or 1:25 000, and from driving around and looking at the area, and this should always be done. One of the main features directly linked to geology that is of interest from the point of view of this monograph is the occurrence of minerals and the related mining activities, which are discussed in Chapter 11.
Geology and present or past climate interact to define the topography and geomorphology, the hills, mountains, valleys, rivers and lakes and other physical expressions of surface landforms. Steepness of slopes helps define runoff to rivers and concentrates and localizes recharge to groundwater. The configuration of the drainage system defines individual catchments and sub-catchments, and may help to indicate whether there is likely to be close interaction between surface water and groundwater systems. Limestone terrains are, for example, often characterized by a lack of surface drainage, and this often shows on topographic maps. The presence of springs, caves, swallow holes, often marked by their own symbols, also provides an indication of limestone and rapid conduit flow systems. Even the names of villages, farms and natural features such as hills and rivers can provide useful information about the area.
The interaction in turn between physical geomorphology and climate defines soil conditions and fertility, and hence land use and human activities, population density and distribution. As well as controlling runoff and recharge as mentioned above, steepness of slopes also plays a key role in land use – steep slopes may be unsuitable for both cultivation and human settlement. Topographic maps can indicate the main features of land use such as forests, orchards, artificial drainage, irrigated farming, glasshouse cultivation, nature reserves and other protected areas, but actual visits and looking may be required to determine the type of crops grown, cultivation regimes and livestock farming and to provide the more detailed information specified in Chapter 9. The patterns of rural, periurban and urban settlement, and transport infrastructure such as roads, motorways, railways and airfields are also apparent from topographic maps. This overview will, however, need to be supplemented by visual inspection and specific surveys to see the types of industries and their age and degree of activity, as described in Chapter 11.
8.2.4 Characteristics of the soil The soil is the uppermost layer of the earth's crust and is the product of complex interactions between climate, living organisms, parent material and topography. Soils develop through the accumulation of unconsolidated mineral grains from the physical and chemical weathering of rock fragments and the addition of organic material from vegetation. Soil is defined and described in many ways, which differ according to the interests and requirements of the user. For the purposes of groundwater protection, it can be considered as the weathered zone into which plants will root and which experiences seasonal changes in moisture content, temperature and gaseous composition. In temperate regions, it is generally 1-2 m thick and in tropical regions can exceed 5 m. It should already be clear from

218 Protecting Groundwater for Health
Chapters 3 and 4 that the soil is an important factor in groundwater protection, because it is the most chemically and biologically active part of the subsurface environment.
The characteristics of the soil at any particular location and time depend on five main groups of factors that have helped to produce it (Palmer et al., 1995):
• physical and chemical constitution of the parent material; • past and present climate; • relief and hydrology; • length of time during which soil forming processes have operated; • the ecosystem, including the modifying effects of man's activities.
To provide a consistent and systematic basis for differentiating the characteristics and properties of soils, soil scientists develop classifications which group soils that behave in similar, and therefore predictable ways. Maps of soil types (usually called Soil Series) are based largely on the following observable or measurable criteria (Palmer and Lewis, 1998):
• texture of the whole soil profile; • soil water regime – depth to and duration of waterlogging in a soil; • substrate type – the underlying geological material from which the soil has
developed; • organic matter content.
In the United Kingdom, this approach defines the 725 Soil Series used to produce a national soil map. Given the complexity of interactions that are possible between the five groups of factors listed above, it is clear that the resulting spatial distribution of soil series within the landscape can be very complex. It may be difficult to map the variations adequately even at a scale of 1:10 000. For maps at a scale of 1:100 000 or smaller, which may be the chosen publication scale in many instances, soil series which are so intricately mixed within the landscape that they cannot be represented separately may be grouped together into soil associations. These usually reflect the same parent material (and hence the same underlying aquifer), but differ in characteristics related to texture, relief and hydrological conditions.
So that soils can contribute to the assessment of groundwater vulnerability, these series have then been classified according to their potential for allowing pollutants at the ground surface to be leached into underlying aquifers. The classification is based on knowledge of those physical and chemical properties routinely measured during soil surveys. These properties include texture, stoniness, organic matter content, presence of raw peaty topsoils and low permeability layers, and soil water regime, and they will determine the soil's tendency to encourage lateral movement of pollutants, speed of downward pollutant movement and capacity for attenuation and degradation of pollutants by the processes outlined in Chapters 3 and 4. Derivation of the resulting leaching potential classification is described by Palmer et al. (1995) and summarized in Table 8.5.
Assessment of aquifer pollution vulnerability 219
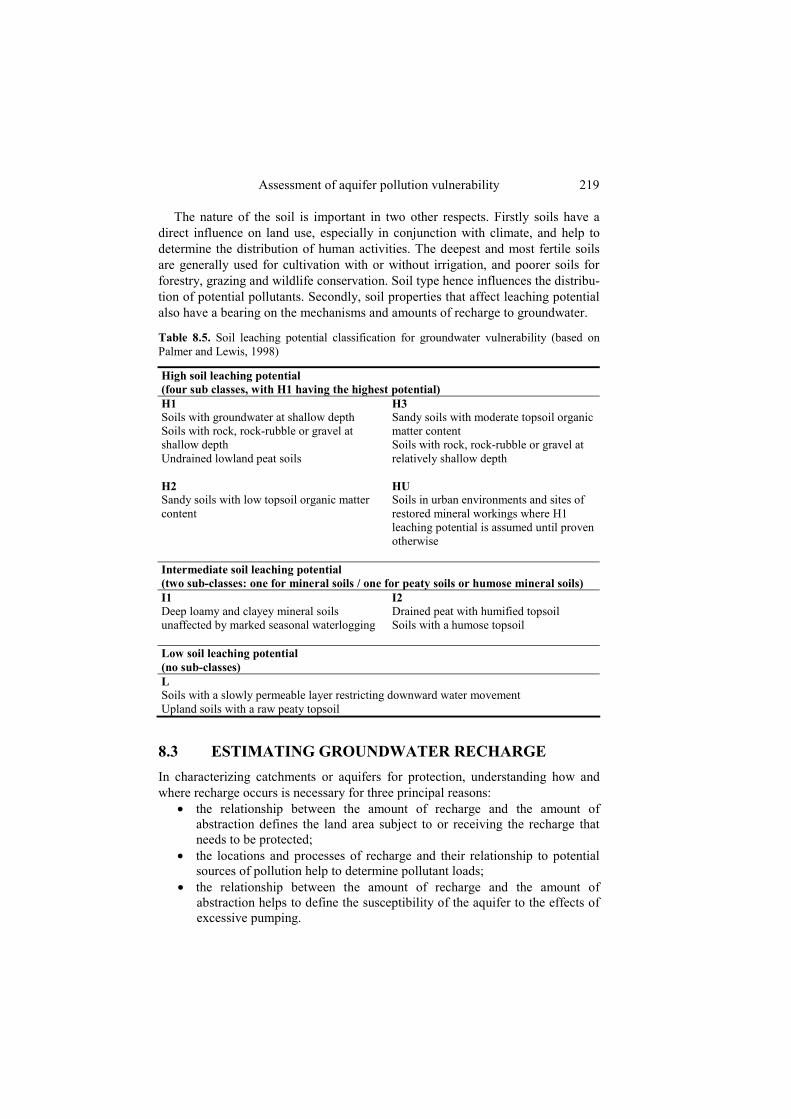
The nature of the soil is important in two other respects. Firstly soils have a direct influence on land use, especially in conjunction with climate, and help to determine the distribution of human activities. The deepest and most fertile soils are generally used for cultivation with or without irrigation, and poorer soils for forestry, grazing and wildlife conservation. Soil type hence influences the distribu-tion of potential pollutants. Secondly, soil properties that affect leaching potential also have a bearing on the mechanisms and amounts of recharge to groundwater.
Table 8.5. Soil leaching potential classification for groundwater vulnerability (based on Palmer and Lewis, 1998)
High soil leaching potential (four sub classes, with H1 having the highest potential) H1 Soils with groundwater at shallow depth Soils with rock, rock-rubble or gravel at shallow depth Undrained lowland peat soils
H3 Sandy soils with moderate topsoil organic matter content Soils with rock, rock-rubble or gravel at relatively shallow depth
H2 Sandy soils with low topsoil organic matter content
HU Soils in urban environments and sites of restored mineral workings where H1 leaching potential is assumed until proven otherwise
Intermediate soil leaching potential (two sub-classes: one for mineral soils / one for peaty soils or humose mineral soils) I1 Deep loamy and clayey mineral soils unaffected by marked seasonal waterlogging
I2 Drained peat with humified topsoil Soils with a humose topsoil
Low soil leaching potential (no sub-classes) L Soils with a slowly permeable layer restricting downward water movement Upland soils with a raw peaty topsoil
8.3 ESTIMATING GROUNDWATER RECHARGE In characterizing catchments or aquifers for protection, understanding how and where recharge occurs is necessary for three principal reasons:
• the relationship between the amount of recharge and the amount of abstraction defines the land area subject to or receiving the recharge that needs to be protected;
• the locations and processes of recharge and their relationship to potential sources of pollution help to determine pollutant loads;
• the relationship between the amount of recharge and the amount of abstraction helps to define the susceptibility of the aquifer to the effects of excessive pumping.

220 Protecting Groundwater for Health
The distinction between the last two is important. Thus in relation to the objective of groundwater protection, it may often be more critical to identify locations, mechanisms and speed of recharge rather than total volumes. General estimates of total recharge volumes are needed to help define catchments and to estimate diffuse pollution loads. A greater degree of effort is required to make estimates that are as precise and reliable as possible for groundwater resources management. Recharge estimation can be technically difficult and costly.
8.3.1 Recharge components and processes Recharge of groundwater may occur naturally from precipitation, rivers or lakes and/or from a whole range of man’s activities such as irrigation and urbanization. Further, an important way of categorizing recharge is to consider it as direct, localized or indirect (Simmers, 1997). The first is defined as water that is in excess of soil moisture deficits and evapotranspiration and which is added to the groundwater reservoir by direct vertical percolation through the unsaturated zone. The second is an intermediate form of recharge that results from percolation to the water table following surface or near-surface movement and subsequent collection and ponding in low-lying areas and in fractured zones as a result of small-scale topographic or geological variability. Indirect recharge is percolation to the water table through the beds of rivers, lakes and canals (Figure 8.6).
LOCAL RECHARGE
NATURAL ARTIFICIAL
DISTANT RECHARGE
regular intermittent
seasonalexcess rainfall
river & lakebed seepage
leakage fromoverlyingaquifers
minor excessrainfall onunvegetateddunes
infiltration offlash run-off
excessirrigation
irrigationdistributionlosses
VIA NATURALVEGETATION
SALINE AREAS
FRESHSURFACE
WATER BODIES
infiltration in adjacentpermeable hills
run-off infiltration inpiedmont areas
discrete wetlands
extensive riparianvegetation (naturalor agricultural)
coastal waters
salt lakes/playas
discrete spring flow
riverbed seepage
artificial recharge works
OTHERGROUNDWATER
BODIES
leakage to
deeper aquifers
regular or intermittent
regular and/or intermittent
DISCHARGE
DISCHARGE
SATURATED AQUIFER(large storage)
semi-permeable base
(vadose zone)
Figure 8.6. Components of groundwater recharge (Foster et al., 2000)
Assessment of aquifer pollution vulnerability 221
While important conceptually, these distinctions are in practice a simplification of complex natural environments in which both may occur. However, comprehensive reviews of the subject by Lerner et al. (1990) and Simmers (1997) concluded that the following general guidelines were evident from the literature:
• recharge occurs, albeit to a limited degree, even in the most arid environments although increasing aridity will be characterized by a decreasing net downward flux and greater time variability;
• direct recharge is likely to become less important and indirect recharge more important with increasing aridity;
• estimates of direct recharge are likely to be more readily derived than those of localized or indirect recharge.
These generalizations certainly show that successful estimation of groundwater recharge depends on first identifying the probable recharge mechanisms and the important features influencing recharge, and secondly on selecting an estimation method which is suitable for the environment. Even with this understanding, recharge estimation remains one of the most difficult tasks for the groundwater specialist and, in many circumstances, groundwater recharge has proved much more difficult to measure than other components of the hydrological cycle.
8.3.2 Methods for estimating recharge While comprehensive technical guidance on the estimation of recharge is outside the scope of this monograph, nevertheless the features that good methods of recharge estimates should have, and the most likely sources of error can be summarized. Simmers (1997) identified four general sources of error:
• Adopting an incorrect conceptual model. This is the most common and serious source of error, and arises when the groundwater flow system and recharge processes are not fully understood or the simplifying assumptions made are too great or unsound. It is important on the one hand to take account of all of the natural and artificial sources of recharge and on the other hand to avoid double accounting of any sources.
• Neglecting spatial and temporal variability. A particular rainfall amount may not cause recharge if it falls at low intensity during times of high evapotranspiration, but the same amount could produce recharge if it occurred with high intensity when evapotranspiration was low. Major errors can arise if temporal variation is not taken proper account of by using monthly, annual or longer-term average data. Recharge estimates over long periods should be obtained from the sum of values over shorter periods – soil moisture balances based on monthly data may indicate no recharge, especially in arid and semi-arid areas, whereas daily time steps will often show that recharge can occur. The high degree of spatial heterogeneity of soils and aquifers will also limit the degree to which estimates at one location can be applied regionally.
• Measurement error. This is governed by the equipment used and operator skills and, for those parameters that are readily measured such has rainfall, is unlikely to be as important as either of the two above.

222 Protecting Groundwater for Health
• Calculation errors. These can usually be avoided by taking care and by checking that the units in which the various parameters used are either compatible or correctly converted.
Further discussion of these sources of error is given in Lerner et al. (1990). There are five features that should be looked for in a recharge estimation method (Lerner et al., 1990; Simmers, 1997):
• The method should explicitly account for the water that does not become recharge.
• Most methods rely on knowledge of the processes that convert source water into recharge and of the flow mechanisms for that water. Good methods should reveal if the conceptual model underlying the method is correct.
• The method should have low errors associated with it and should not be sensitive to parameters which are difficult to measure or to estimate accurately.
• The method should be easy to use. • Methods utilizing readily and widely available data, such as rainfall are
more useful than those requiring specialized observations. The applicability of a number of recharge methods is shown in Table 8.6. The
time in the last column of the table refers to the typical period over which data are needed to apply the method. For those methods that are event, season or yearly based, the actual data for parameters used may be needed at time steps ranging from hourly through daily and weekly to monthly, depending on the hydrologic setting and the precision required. Large volumes of existing data for things like rainfall, potential evapotranspiration and river flow may need to be collected from the appropriate authorities.
Table 8.6. Direct techniques for recharge estimation (modified from Foster et al., 2000)
Technique Applicability Cost range Time Soil water balance from hydro-meteorological data D(L) +¹ ESYH Hydrological data interpretation water table fluctuations differential stream/canal flow
D(L) L
+¹ +¹
YH E
Chemical and isotopic analyses from saturated zone D and L +-++² HG Chemical and isotopic profiling of unsaturated zone Da,b ++-+++² HG Soil physics measurements Da +++ SY
D/L: diffuse(direct)/localized(indirect) distribution of recharge; a: only suitable for relatively uniform soil profiles; b: not appropriate for irrigated agricultural areas; +, ++, +++: approximate relative range of costs; 1: excluding construction and operation of basic data collection network, which is assumed to exist already; 2: isotopic analyses increase the costs substantially; E: event; S: season; Y: year; H: hydrological time; G: geological time.
Most of the methods listed in Table 8.6 have some but not all of these features, and it is therefore desirable to apply and compare a number of independent approaches. The applicability and potential accuracy of these methods depends on the superficial environment of geology, geomorphology, soils and the climatic and hydrological regime. These factors determine the spatial variability of recharge
Assessment of aquifer pollution vulnerability 223
processes, the distribution and extent of runoff, and the characteristics of the vegetation cover, particularly whether it is natural or agricultural and whether the latter is with or without irrigation. An initial indication of how variable the recharge is likely to be can be gained from the overview of the physical conditions of the area of interest outlined above. It is important also to appreciate that average groundwater recharge is not necessarily constant over time, as changes in land use, irrigation infrastructure (such as construction and operation of canals), irrigation technology and cropping regimes can produce significant changes in recharge rates and also affect the quality of the infiltrating recharge water, as shown in Chapter 9.
Two other major human activities can greatly influence recharge processes. Firstly, the covering of the land by impermeable surfaces in urban areas reduces direct infiltration, can lower evaporation and increase and accelerate surface runoff. Depending on the specific arrangements for storm drainage, overall groundwater recharge may be increased or decreased (Foster et al., 1998). Leaking water mains, on-site sanitation and leaking sewers also contribute urban recharge of differing water quality, and the preliminary physical appraisal of the catchment referred to in Chapter 6 will indicate whether a more detailed consideration of urban recharge processes, as given in Lerner et al. (1990) and Foster et al. (1998) is required to support the assessment of urban impacts in Chapters 10 to 12.
Secondly, because of ever-rising water demands and increasing scarcity of freshwater resources, artificial recharge is becoming more widely used as a component of overall resource management to maintain resources, restore groundwater levels or prevent saline intrusion (Chapter 19). Various sources of water are used in artificial recharge schemes, including rainfall harvesting and collection, river water, mains water, groundwater and reclaimed wastewater, and a wide range of technologies is employed. In general, artificial recharge may improve groundwater quality as well as increasing the available storage in an aquifer. Reclaimed wastewater, however, may contain chemical or microbial pollutants that are poorly characterized but could impact human health. Primary, secondary or tertiary treatment progressively removes these pollutants, provided the treatment facilities are of sufficient capacity, properly designed and correctly operated. Reclaimed water has been used to augment groundwater supplies in the southern USA and in Israel for many years. These are well monitored, high technology installations, but there is increasing interest in the use of untreated or partially treated wastewater to augment scarce water resources, either by direct infiltration or through irrigated cultivation (Chapter 9), and an understanding of the likely pollution threats is therefore required.
8.4 NATURAL HYDROCHEMICAL AND GEOCHEMICAL ENVIRONMENTS
Natural quality varies from one rock type to another, and also within aquifers along groundwater flow paths, as described in Chapter 4. It is important for those with responsibility for protecting groundwater quality to be aware of the
224 Protecting Groundwater for Health
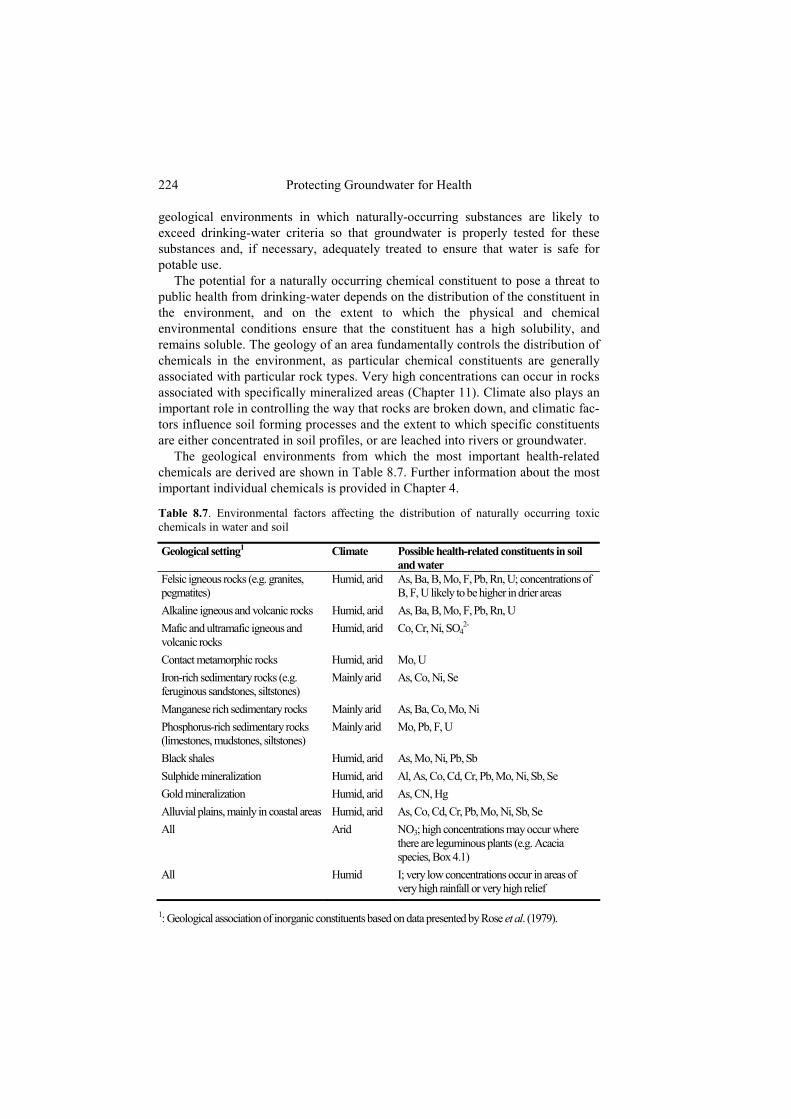
geological environments in which naturally-occurring substances are likely to exceed drinking-water criteria so that groundwater is properly tested for these substances and, if necessary, adequately treated to ensure that water is safe for potable use.
The potential for a naturally occurring chemical constituent to pose a threat to public health from drinking-water depends on the distribution of the constituent in the environment, and on the extent to which the physical and chemical environmental conditions ensure that the constituent has a high solubility, and remains soluble. The geology of an area fundamentally controls the distribution of chemicals in the environment, as particular chemical constituents are generally associated with particular rock types. Very high concentrations can occur in rocks associated with specifically mineralized areas (Chapter 11). Climate also plays an important role in controlling the way that rocks are broken down, and climatic fac-tors influence soil forming processes and the extent to which specific constituents are either concentrated in soil profiles, or are leached into rivers or groundwater.
The geological environments from which the most important health-related chemicals are derived are shown in Table 8.7. Further information about the most important individual chemicals is provided in Chapter 4.
Table 8.7. Environmental factors affecting the distribution of naturally occurring toxic chemicals in water and soil
Geological setting1 Climate Possible health-related constituents in soil and water
Felsic igneous rocks (e.g. granites, pegmatites)
Humid, arid As, Ba, B, Mo, F, Pb, Rn, U; concentrations of B, F, U likely to be higher in drier areas
Alkaline igneous and volcanic rocks Humid, arid As, Ba, B, Mo, F, Pb, Rn, U Mafic and ultramafic igneous and volcanic rocks
Humid, arid Co, Cr, Ni, SO42-
Contact metamorphic rocks Humid, arid Mo, U Iron-rich sedimentary rocks (e.g. feruginous sandstones, siltstones)
Mainly arid As, Co, Ni, Se
Manganese rich sedimentary rocks Mainly arid As, Ba, Co, Mo, Ni Phosphorus-rich sedimentary rocks (limestones, mudstones, siltstones)
Mainly arid Mo, Pb, F, U
Black shales Humid, arid As, Mo, Ni, Pb, Sb Sulphide mineralization Humid, arid Al, As, Co, Cd, Cr, Pb, Mo, Ni, Sb, Se Gold mineralization Humid, arid As, CN, Hg Alluvial plains, mainly in coastal areas Humid, arid As, Co, Cd, Cr, Pb, Mo, Ni, Sb, Se All Arid NO3; high concentrations may occur where
there are leguminous plants (e.g. Acacia species, Box 4.1)
All Humid I; very low concentrations occur in areas of very high rainfall or very high relief
1: Geological association of inorganic constituents based on data presented by Rose et al. (1979).
Assessment of aquifer pollution vulnerability 225
8.5 CHARACTERIZING GROUNDWATER ABSTRACTION
The scale of groundwater abstraction and methods of abstraction used are also important factors in assessing groundwater pollution and protecting groundwater quality. In relation to the former, abstraction sources may create pathways for groundwater pollution, either directly via the borehole or well itself or through the aquifer because heavy and prolonged pumping can modify natural groundwater flow regimes. In relation to the latter, the type, scale and numbers of groundwater abstraction sources have a bearing on the way in which groundwater protection measures can be implemented. Further, the condition of wellheads will influence the potential for direct contamination of drinking-water during abstraction, as well as the potential for ingress of pollutants into the aquifer. The situation assessment should therefore include an appraisal of the condition of the wellhead and its surroundings.
8.5.1 Groundwater abstraction types Groundwater abstraction takes many forms and employs a range of techniques. The use of traditional open dug wells goes back thousands of years, drawing water by hand or using animal power, and there are many parts of the developing world where these remain important supply sources. They are cheap, relatively easy to construct in unconsolidated aquifers and simple to maintain, and therefore remain popular in programmes in which community involvement is strongly promoted. They are, however, highly sensitive to pollution being directly introduced into the open top of the well or through the ground immediately around the well. This direct pollution can be greatly reduced by the use of proper sanitary seals and aprons around the well (Chapter 18), by covering them and by installing hand pumps. Drilled boreholes take many forms from very simple, narrow diameter holes for hand pumps producing less than 0.5 l/s to shafts up to 1 m across from which tens of litres per second can be abstracted for urban supply or irrigation (Driscoll, 1986), or wellfields of individual boreholes all connected up to a major supply, such as those of the Great Man Made River project in Libya. Groundwater is also abstracted from protected springs and from galleries such as the ancient qanats of the Middle East.
Clearly, large-scale groundwater abstraction requires major investment in drilling, borehole materials, pumps and power supplies and the associated pipelines and tanks. The loss of a major supply could be a significant problem to the operator if groundwater pollution were severe enough to render the water unusable. Treatment to remove pollutants, or the location and development of an alternative supply, both of which could be very costly, would be required, emphasizing the benefits of prevention by protecting groundwater.

226 Protecting Groundwater for Health
8.5.2 Groundwater abstraction and pollutant pathways Large and prolonged abstraction can modify groundwater flow rates and directions by reducing or reversing hydraulic gradients and producing cones of depression in the water table or piezometric surface around pumping wells and wellfields. These hydraulic changes can in turn create new pollutant pathways or modify existing ones. In multi-layered aquifer systems in urban areas, the uppermost zones have usually been developed first for groundwater supply, often with many shallow, relatively small boreholes and wells. These are typically privately owned and used for domestic, industrial and commercial supply, and often unregistered and uncontrolled. As cities have grown, the uppermost aquifer is also used, either deliberately or accidentally, as a receptor for urban waste and the shallow groundwater becomes more and more polluted, sometimes to the extent that it becomes unusable. Municipal authorities and other larger groundwater users consequently drill into deeper aquifers in search of better quality groundwater, and the increasing abstraction from depth can induce downward movement of polluted groundwater, threatening these deeper supplies, as described in Section 8.6.
In some circumstances, the very act of constructing wells or boreholes may in itself encourage groundwater pollution by puncturing protective layers above or between aquifers. There are examples both of boreholes permitting downward movement of polluted groundwater from shallow to deeper aquifers, and of deep boreholes penetrating confining layers and allowing naturally saline groundwater to move up into aquifers containing high quality water. Sometimes even observation boreholes for measuring groundwater levels or taking groundwater samples, if constructed without proper understanding of the three-dimensional hydrogeological conditions, can allow this to happen. Abandoned boreholes can, therefore, remain as a potential short-circuiting route for pollutants, and consideration may need to be given to sealing them to try to restore the protective layer. If disused or abandoned boreholes are used, perhaps covertly and illegally, for effluent disposal then their passive short-circuiting role can become an active one as a pollution source, releasing pollutants directly into what may be the most permeable and productive part of the aquifer. Backfilling and sealing may then be urgently required.
Within the situation analysis it is also necessary to assess wellhead protection/sanitary completion. It is important to bear in mind the source-pathway-receptor model introduced in Section I, as pollution at wellheads may require a number of factors to be present. These include hazards (i.e. sources of pollutants) and pathways (which often reflect specific problems with the infrastructure). In addition, it may also be useful to assess indirect or contributing factors (Howard, 2002). These do not either directly cause contamination or offer a pathway for the contamination to enter the groundwater source, but may contribute to the development of a pathway or lead to build up of contamination within the immediate vicinity of the borehole. Examples include aspects such as fencing around the groundwater source, allowing animals to gain access close to the source, lack of drainage to divert contaminated surface water from the wellhead area and deterioration in the engineering works at the wellhead (Table 8.8).

Assessment of aquifer pollution vulnerability 227
Table 8.8. Examples of pathways and contributing factors for microbial contamination (modified from ARGOSS, 2001)
Factors Conditions facilitating pollutant ingress Hazards that may cause contamination through direct ingress (hazard factors)
Open-air defecation Stagnant surface water uphill of the source Waste or refuse dumps Animal faecal matter stored above ground
Pathways for contaminants to enter the source (pathway factors)
Cracked lining Lack of seal on top of rising main Lack of cover on well Cracked or damaged apron or pump-house floor Lack of head wall on well Faulty masonry on spring protection works Eroded backfill or catchment area Rope and bucket used to withdraw water
Contributing factors to contamination (indirect factors)
Lack of fencing Lack of lockable pump-house Lack of adequate diversion drainage to remove surface water Lack of drainage to remove wastewater Animal access to source
8.5.3 Abstraction types and groundwater protection The ways in which groundwater is abstracted need to be considered when thinking about its protection. Scale and distribution are particularly important. Taking the example of the United Kingdom, three large consolidated aquifers provide half or more of the public supplies in the south, centre and east of the country from several hundred high yielding boreholes. The United Kingdom’s national approach to protecting groundwater supplies (Adams and Foster, 1992) designates zones from which the recharge is derived around these supplies, in which certain potentially polluting activities are prohibited or controlled. This and other strategies for groundwater protection are discussed in more detail in Chapter 17. While this approach is sometimes hydrogeologically problematic, given the complex local groundwater flow systems that are often encountered in aquifers, it is logistically and institutionally reasonable to establish protection zones around a relatively small number of large abstractions. This protection approach has been applied widely in Europe and North America to large groundwater supplies, both in the form of individual wells or boreholes and as wellfields – small groups of closely-spaced boreholes all drawing water from the same aquifer and feeding into a common pipeline to convey the water to where it is being used.
The situation would be very different where groundwater is drawn from a large number of much smaller groundwater supplies widely dispersed over the aquifer such as, for example, in India and Bangladesh and large parts of Africa. Not only

228 Protecting Groundwater for Health
is it more difficult to implement protection zoning on this broad scale, the shallow aquifers used for supply may be highly vulnerable to pollution, and many of the boreholes or wells may be privately owned. While this situation may occur in either rural or urban environments, protecting small groundwater supplies from the wide range of potential polluting activities in urban areas is especially problematic. Shallow hand dug wells are often particularly difficult to protect. The conventional approach of protection zoning cannot be easily applied, and the best strategy may be to ensure careful borehole or well siting in relation to pollution sources, together with good construction practice with adequate sanitary seals. This may be backed up a by a policy of resource protection, in which the whole aquifer outcrop, rather than defined zones around individual supplies, is subject to some degree of control of likely pollution sources. In practice, however, any groundwater protection measures may be difficult to implement for large numbers of small dispersed, perhaps private and usually unregistered supplies. Siting supplies to avoid pollution sources (and vice versa) and adequate sanitary protection should always be seen as important lines of defence in protecting health.
At the opposite end of the spectrum of groundwater supplies, in karstic areas large springs are often used. Because of the rapid groundwater flow and response times in karstic aquifers, these may be especially vulnerable to pollution. In addition, karst springs may be supported by groundwater recharge from large catchments that are notoriously difficult to define.
NOTE Approaches to protecting groundwater quality need to be matched not only to the hydrogeological situation, but also to the types and scales of groundwater abstraction.
8.6 SUSCEPTIBILITY OF GROUNDWATER RESOURCES TO DEGRADATION
8.6.1 Scope and scale of resource degradation As a component of the overall sustainable management of water resources, i.e. the quantity of water available for use, is largely outside the scope of this monograph, but it is nevertheless necessary to comment on the potential impacts of groundwater usage on the overall resource situation. This is because heavy and prolonged groundwater abstraction and poor management of groundwater resources can have negative consequences for groundwater quality. These consequences can be severe and are often difficult and costly to manage and remedy. Also, lack of water availability for domestic uses can have severe public health consequences, and in such circumstances health authorities may need to
Assessment of aquifer pollution vulnerability 229
ensure their needs are taken account of in overall water resources management. Approaches to managing water resources are dealt with in Chapter 19.
The availability of groundwater in an area affects current and future drinking-water quality either by the direct effects on groundwater quality or indirectly by changing the degree to which groundwater is available for use. For example, lack of future availability of groundwater may force communities to use surface water that is more contaminated or more difficult to access. Thus there is a need to interact with those outside the health sector involved in the management of groundwater to address all aspects of water management. It is also important to recognize that domestic use of groundwater for drinking-water and household purposes is but one use of groundwater. In many areas, withdrawals for other water-use sectors, particularly agriculture, but also possibly industrial uses, may far exceed withdrawals for domestic use. Worldwide, about 70 per cent of total water use (surface water and groundwater) is for agriculture, 22 per cent for industry, and 8 per cent for domestic purposes (Bowden, 2002). Heavy groundwater use for irrigation is commonly a major cause of groundwater level declines. The linkages between water quality and water quantity suggest that monitoring programmes for each should be integrated. Greater attention is needed to the long-term value of water-level data collected as part of water-quality monitoring and to the potential synergies between water quality and water level monitoring networks (Taylor and Alley, 2002).
Traditionally, surface water and groundwater have been treated as separate water resources, so that one could be utilized independently without affecting the other. With increased utilization of water resources, has come greater recognition of surface water and groundwater as fundamentally interconnected (Winter et al., 1998). Depletion of one resource eventually results in depletion of the other, and likewise, contamination of one resource can contaminate the other. This recognition of groundwater and surface water as a single resource has increased the imperative for those involved in development of groundwater to interact with those involved with surface water, and vice versa. This is true from both water quantity and water quality perspectives.
Over-exploitation of groundwater resources or individual aquifers by uncontrolled, excessive abstraction, while often not precisely definable in scientific terms is nevertheless an emotive term when used at the political or institutional level (Foster et al., 2000). At this level, concern relates more to the consequences of excessive abstraction rather than to the volumes of water themselves, although the latter need to be regularly monitored to determine whether control measures are proving effective. Many of the changes in response to groundwater pumping are subtle, and they may occur over long periods of time. Development of groundwater resources increasingly requires a more complete understanding of the effects of abstractions on groundwater systems (Alley et al., 2002).
The impacts of excessive abstraction range from the often reversible interference with springs and other wells to much less reversible degradation caused by ingress of saline or polluted water and land subsidence (Foster, 1992;
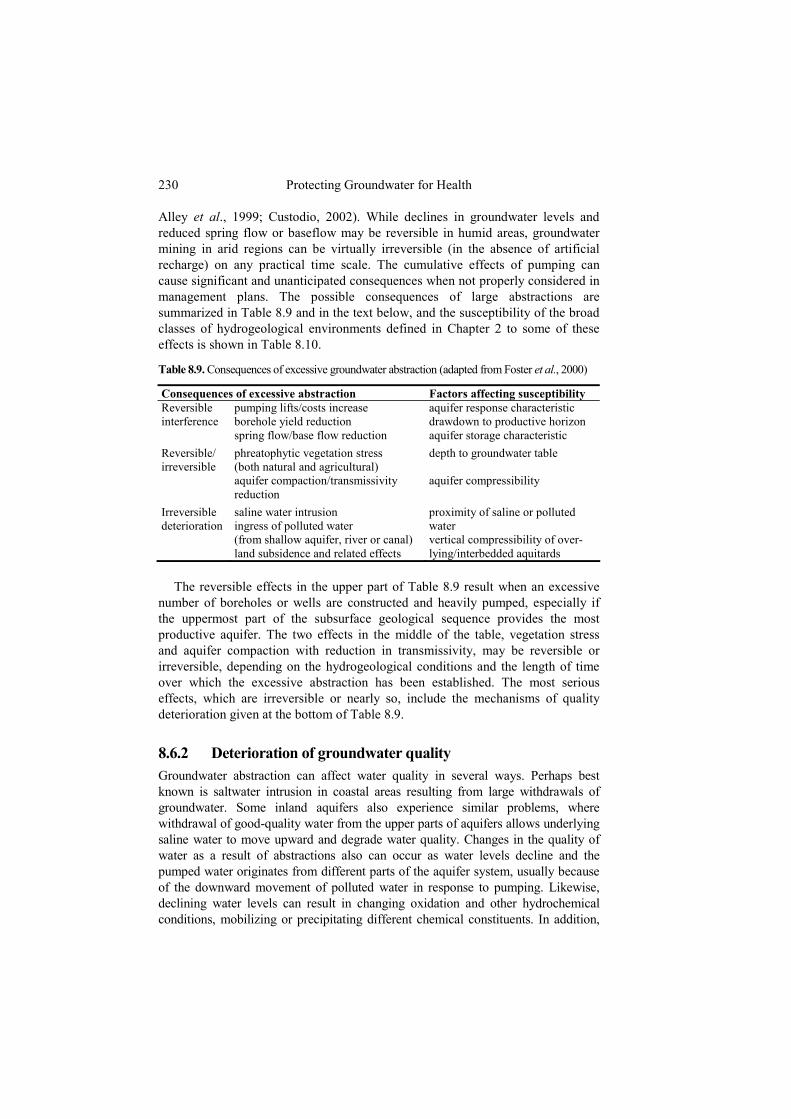
230 Protecting Groundwater for Health
Alley et al., 1999; Custodio, 2002). While declines in groundwater levels and reduced spring flow or baseflow may be reversible in humid areas, groundwater mining in arid regions can be virtually irreversible (in the absence of artificial recharge) on any practical time scale. The cumulative effects of pumping can cause significant and unanticipated consequences when not properly considered in management plans. The possible consequences of large abstractions are summarized in Table 8.9 and in the text below, and the susceptibility of the broad classes of hydrogeological environments defined in Chapter 2 to some of these effects is shown in Table 8.10.
Table 8.9. Consequences of excessive groundwater abstraction (adapted from Foster et al., 2000)
Consequences of excessive abstraction Factors affecting susceptibility Reversible interference
pumping lifts/costs increase borehole yield reduction spring flow/base flow reduction
aquifer response characteristic drawdown to productive horizon aquifer storage characteristic
Reversible/ irreversible
phreatophytic vegetation stress (both natural and agricultural) aquifer compaction/transmissivity reduction
depth to groundwater table aquifer compressibility
Irreversible deterioration
saline water intrusion ingress of polluted water (from shallow aquifer, river or canal) land subsidence and related effects
proximity of saline or polluted water vertical compressibility of over-lying/interbedded aquitards
The reversible effects in the upper part of Table 8.9 result when an excessive
number of boreholes or wells are constructed and heavily pumped, especially if the uppermost part of the subsurface geological sequence provides the most productive aquifer. The two effects in the middle of the table, vegetation stress and aquifer compaction with reduction in transmissivity, may be reversible or irreversible, depending on the hydrogeological conditions and the length of time over which the excessive abstraction has been established. The most serious effects, which are irreversible or nearly so, include the mechanisms of quality deterioration given at the bottom of Table 8.9.
8.6.2 Deterioration of groundwater quality Groundwater abstraction can affect water quality in several ways. Perhaps best known is saltwater intrusion in coastal areas resulting from large withdrawals of groundwater. Some inland aquifers also experience similar problems, where withdrawal of good-quality water from the upper parts of aquifers allows underlying saline water to move upward and degrade water quality. Changes in the quality of water as a result of abstractions also can occur as water levels decline and the pumped water originates from different parts of the aquifer system, usually because of the downward movement of polluted water in response to pumping. Likewise, declining water levels can result in changing oxidation and other hydrochemical conditions, mobilizing or precipitating different chemical constituents. In addition,
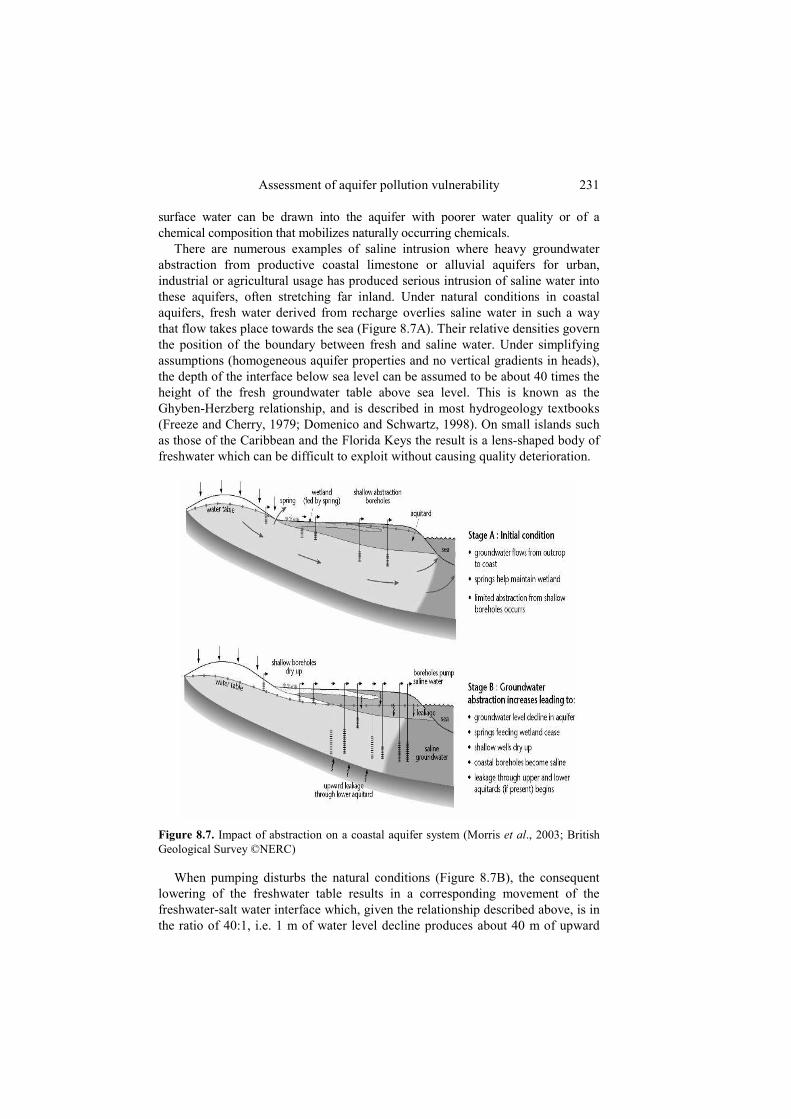
Assessment of aquifer pollution vulnerability 231
surface water can be drawn into the aquifer with poorer water quality or of a chemical composition that mobilizes naturally occurring chemicals.
There are numerous examples of saline intrusion where heavy groundwater abstraction from productive coastal limestone or alluvial aquifers for urban, industrial or agricultural usage has produced serious intrusion of saline water into these aquifers, often stretching far inland. Under natural conditions in coastal aquifers, fresh water derived from recharge overlies saline water in such a way that flow takes place towards the sea (Figure 8.7A). Their relative densities govern the position of the boundary between fresh and saline water. Under simplifying assumptions (homogeneous aquifer properties and no vertical gradients in heads), the depth of the interface below sea level can be assumed to be about 40 times the height of the fresh groundwater table above sea level. This is known as the Ghyben-Herzberg relationship, and is described in most hydrogeology textbooks (Freeze and Cherry, 1979; Domenico and Schwartz, 1998). On small islands such as those of the Caribbean and the Florida Keys the result is a lens-shaped body of freshwater which can be difficult to exploit without causing quality deterioration.
Figure 8.7. Impact of abstraction on a coastal aquifer system (Morris et al., 2003; British Geological Survey ©NERC)
When pumping disturbs the natural conditions (Figure 8.7B), the consequent lowering of the freshwater table results in a corresponding movement of the freshwater-salt water interface which, given the relationship described above, is in the ratio of 40:1, i.e. 1 m of water level decline produces about 40 m of upward

232 Protecting Groundwater for Health
movement of the interface. In practice the interface is not usually sharp and uniform, but affected by dispersion, and in detail the three-dimensional picture of saline intrusion can be particularly complicated where rapid movement along fractures and fissures permits a complex fingering of saline water far inland. Given that coastal plains are often densely populated and agriculturally productive regions, it is not surprising that groundwater abstraction has grown rapidly. The resulting serious saline intrusion problems have been encountered in many aquifers, e.g. on the Mediterranean Coast of Spain, in the Netherlands, Mexico, Florida, Cyprus and some of the Caribbean islands. Even far from coastal regions, upconing of saline water from deeper aquifers can be caused by heavy groundwater abstraction from freshwater zones above.
Induced downward movement of pollutants is widely observed in many rapidly developing urban areas underlain by multi-layered aquifer sequences in which the establishment of large-scale abstraction from deeper aquifer horizons imposes or accentuates downward hydraulic gradients and induces accelerated downward movement of polluted water from shallower aquifers. In the city of Santa Cruz in Bolivia, for example, most private boreholes supplying water for industries, small businesses and private domestic use draw groundwater from less than 90 m depth, whereas the public supply is largely dawn from deeper aquifers between 90 and 350 m below ground. The shallow groundwater has become polluted (Figure 8.8) from poor waste disposal practices, and abstraction has induced downward movement of polluted water. This general situation is rather widespread, but the degree of protection of the deeper aquifers and likely timescale of any deterioration in the quality of the groundwater abstracted from them depends on the local hydrogeological situation, and will certainly need specific assessment.
��
��
��
��
��
��
��
���
���
��
��
�
���� ������ ��������� ������ �� �������������� �������
����� ����������� ��������������� ���������� �� ������������� ������������
���
���
���
������ � �!"�#�$�����$��%&'��#%�&����"�"�#(�)���*�(�����
���� ��������� ������������� ���������� �� �������������� ������������
��
�
��
�
��
��
�
�
��
���
���
���
��
���
��
��
��
��
��
��
��
��
���
���
� �
��
Figure 8.8. Schematic cross-section illustrating downward pollutant migration induced by pumping in a multi-aquifer sequence, Santa Cruz, Bolivia (modified from Morris et al., 1994)
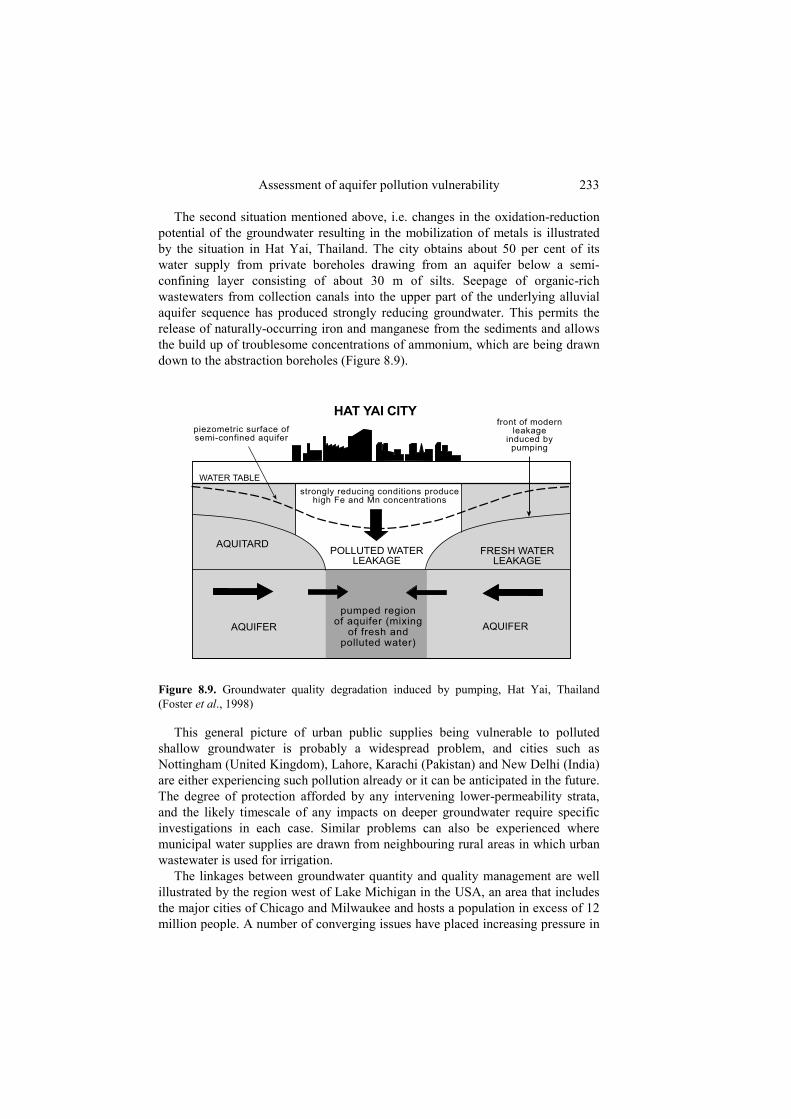
Assessment of aquifer pollution vulnerability 233
The second situation mentioned above, i.e. changes in the oxidation-reduction potential of the groundwater resulting in the mobilization of metals is illustrated by the situation in Hat Yai, Thailand. The city obtains about 50 per cent of its water supply from private boreholes drawing from an aquifer below a semi-confining layer consisting of about 30 m of silts. Seepage of organic-rich wastewaters from collection canals into the upper part of the underlying alluvial aquifer sequence has produced strongly reducing groundwater. This permits the release of naturally-occurring iron and manganese from the sediments and allows the build up of troublesome concentrations of ammonium, which are being drawn down to the abstraction boreholes (Figure 8.9).
+���,-./�0�-.1�.�2�3.
41.���0�-.1�.�2�3.
�5,6-�1/
*( *% ��%#"���$��7("$%��8 "9"�#�$�$�%�'��� *�(�% ����%�:
�5,64.1
0�-.1�-�;�.
����������
�����#<��% (&"�#�&�� "�"����*�� (&%'"#'�4%��� �=��&��&%�����"���
*"%>� %��"&��(�$�&%��$�% "�&��$"�% ��7("$%�
$������$� � %��%�?�#%"� (&% �)<*( *"�#
�5,64.1
Figure 8.9. Groundwater quality degradation induced by pumping, Hat Yai, Thailand (Foster et al., 1998)
This general picture of urban public supplies being vulnerable to polluted shallow groundwater is probably a widespread problem, and cities such as Nottingham (United Kingdom), Lahore, Karachi (Pakistan) and New Delhi (India) are either experiencing such pollution already or it can be anticipated in the future. The degree of protection afforded by any intervening lower-permeability strata, and the likely timescale of any impacts on deeper groundwater require specific investigations in each case. Similar problems can also be experienced where municipal water supplies are drawn from neighbouring rural areas in which urban wastewater is used for irrigation.
The linkages between groundwater quantity and quality management are well illustrated by the region west of Lake Michigan in the USA, an area that includes the major cities of Chicago and Milwaukee and hosts a population in excess of 12 million people. A number of converging issues have placed increasing pressure in
234 Protecting Groundwater for Health
recent years on groundwater resource for these communities, most of which rely heavily on a regional sandstone aquifer. Pumping from this aquifer has resulted in a drawdown cone that extends throughout much of the region, with water-level declines in excess of 300 m measured at some locations. This regional drawdown cone is one of the largest in the USA. Although partial recovery has taken place in some areas through reduction in withdrawals, concern continues about the drawdowns, as well as their water quality implications. For example, the presence of high levels of arsenic in the upper part of the sandstone aquifer in some areas has been attributed to the oxidation of minerals in the newly unsaturated deposits at the top of the sandstone aquifer. Likewise, proposals for artificial recharge to store Lake Michigan water in the aquifer have been hampered by the detection of arsenic in the recovered water. Drawdown in the sandstone aquifer has also coincided with increases in the concentration of total dissolved solids (TDS) in much of the aquifer from upcoming of saline water and leakage from shale beds. Radium concentrations generally show a direct correlation with the concentration of TDS, and it is anticipated that increases in TDS associated with drawdown in the sandstone aquifer may result in an increase in radium concentrations. To properly address these multi-faceted issues, cooperative efforts are needed on a region wide basis to examine various approaches such as strategically shifting water supply to surface water or to other aquifers, optimizing the location and pumping from wells so as to minimize drawdown problems across pumping centres, installation of deeper casing for new private wells or use of deeper ‘cluster’ wells for multiple households, further investigation of the water-quality effects of artificial recharge, and various treatment options.
8.6.3 Other effects of excessive abstraction As the depth to water increases, the water must be lifted higher to reach the land surface, and as the lift distance increases, greater energy is required to drive the pump. Depending on the use of the water and the cost of energy, it may no longer be economically feasible to use water for a given purpose. Furthermore, with declining water levels, well yields will decline, possibly below usable rates. In extreme cases, groundwater levels may fall below the bottom of existing pumps, necessitating the expense of lowering the pump, deepening the well, or drilling a deeper replacement well.
In many environments, surface-water and groundwater systems are intimately linked. Groundwater abstraction can reduce spring flow, or alter how water moves between an aquifer and streams, lakes, or wetlands. The decrease in contribution to surface water may occur either by intercepting groundwater flow that discharged into a surface water body under natural conditions, or by increasing the rate of water movement from surface water into an aquifer.
Although several different earth processes can cause land subsidence, a considerable amount is caused by groundwater withdrawals. For example, more than 80 per cent of the land subsidence in the USA is related to the withdrawal of groundwater (Galloway et al., 1999). Geologic conditions most susceptible to
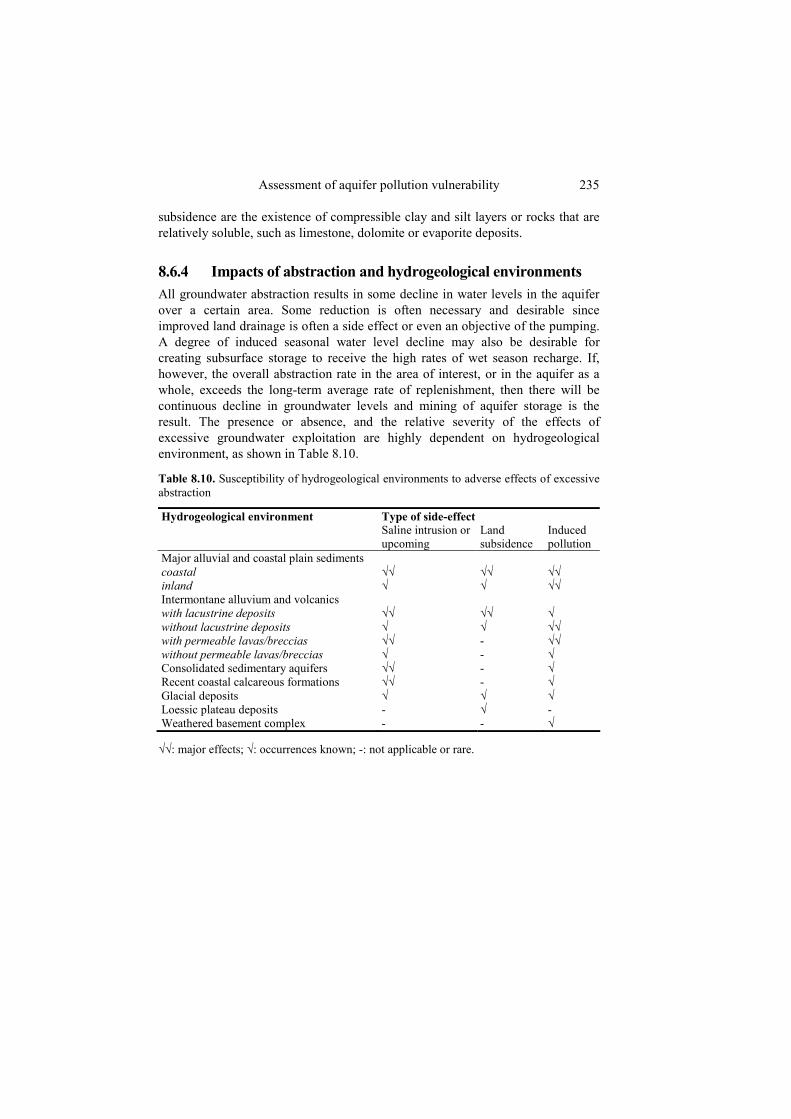
Assessment of aquifer pollution vulnerability 235
subsidence are the existence of compressible clay and silt layers or rocks that are relatively soluble, such as limestone, dolomite or evaporite deposits.
8.6.4 Impacts of abstraction and hydrogeological environments All groundwater abstraction results in some decline in water levels in the aquifer over a certain area. Some reduction is often necessary and desirable since improved land drainage is often a side effect or even an objective of the pumping. A degree of induced seasonal water level decline may also be desirable for creating subsurface storage to receive the high rates of wet season recharge. If, however, the overall abstraction rate in the area of interest, or in the aquifer as a whole, exceeds the long-term average rate of replenishment, then there will be continuous decline in groundwater levels and mining of aquifer storage is the result. The presence or absence, and the relative severity of the effects of excessive groundwater exploitation are highly dependent on hydrogeological environment, as shown in Table 8.10.
Table 8.10. Susceptibility of hydrogeological environments to adverse effects of excessive abstraction
Type of side-effect Hydrogeological environment Saline intrusion or upcoming
Land subsidence
Induced pollution
Major alluvial and coastal plain sediments coastal √√ √√ √√ inland √ √ √√ Intermontane alluvium and volcanics with lacustrine deposits √√ √√ √ without lacustrine deposits √ √ √√ with permeable lavas/breccias √√ - √√ without permeable lavas/breccias √ - √ Consolidated sedimentary aquifers √√ - √ Recent coastal calcareous formations √√ - √ Glacial deposits √ √ √ Loessic plateau deposits - √ - Weathered basement complex - - √
√√: major effects; √: occurrences known; -: not applicable or rare.

236 Protecting Groundwater for Health
8.7 CHECKLIST
NOTE The following checklist outlines information needed for assessing aquifer pollution vulnerability and susceptibility to the impacts of abstraction in the drinking-water catchment area. It supports hazard analysis in the context of developing a Water Safety Plan (Chapter 16). It is neither complete nor designed as a template for direct use but needs to be adapted for local conditions.
What is the main hydrogeological environment in the recharge area?
Establish the dominant geology and the major rock types From the geological description and lithology, check whether
intergranular or fracture flow is predominant Check whether a hydrogeological map is available which gives this
information …
Is the groundwater flow regime already known, or can a conceptual model of the regional flow system be developed?
Identify the vertical and lateral aquifer boundaries Check whether the aquifer is single or multi-layered Check whether the groundwater is confined or unconfined Check whether there are major faults which could form hydraulic
barriers Check whether there are rivers, lakes or other surface waters which
could interact with groundwater Identify recharge and discharge areas Establish whether there is hydraulic connection with and
groundwater discharge to the sea …
What are the physical conditions at the land surface?
Define the topography and slopes Estimate annual rainfall, its seasonal pattern and variability from
year to year Identify the main land use types

Assessment of aquifer pollution vulnerability 237
Identify roads, railways, airports and other major infrastructure …
What are the soil conditions?
Check whether soil maps of the area are available Identify the main soil types Assess the leaching potentials of the various soil types …
What are the main sources of recharge to groundwater?
Analyse whether there is direct recharge by infiltration from rainfall Evaluate whether the topography is such as to provide scope for
localized recharge Check whether there are sources and routes for indirect recharge Identify man-made modifications to the natural recharge regime
(e.g. canals, irrigated fields, urban storm water infiltration, leaking water mains, leaking sewers)
Identify artificial recharge facilities Check whether identified recharge sources can be quantified Evaluate whether identified recharge sources can affect groundwater
quality: is their quality known? Analyse whether the identified recharge sources are changing
significantly with time in either quantity or quality …
What is the vulnerability of groundwater to pollution?
Check whether groundwater vulnerability has already been characterized and mapped at an appropriate scale
If not, check whether a broad classification from the geology does mean that it should be formally assessed
Evaluate whether there is sufficient available information to assess groundwater vulnerability
Based on the available information, assess whether a suitable approach can be developed
…
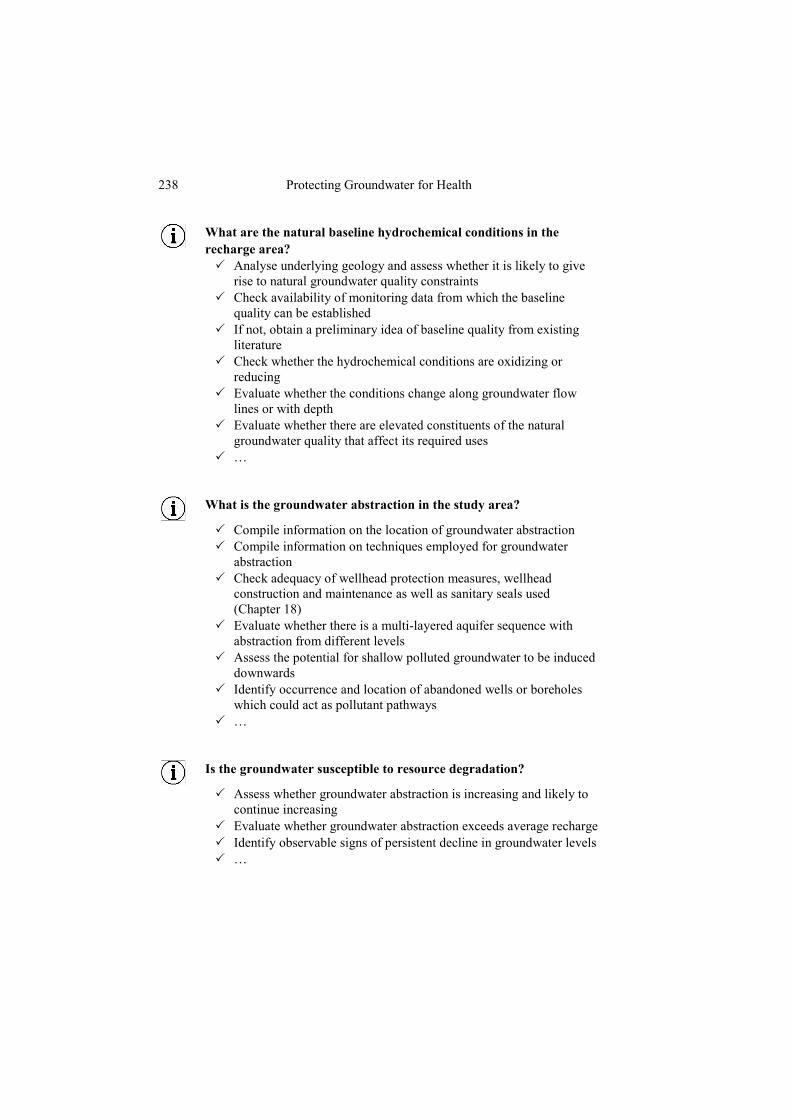
238 Protecting Groundwater for Health
What are the natural baseline hydrochemical conditions in the recharge area?
Analyse underlying geology and assess whether it is likely to give rise to natural groundwater quality constraints
Check availability of monitoring data from which the baseline quality can be established
If not, obtain a preliminary idea of baseline quality from existing literature
Check whether the hydrochemical conditions are oxidizing or reducing
Evaluate whether the conditions change along groundwater flow lines or with depth
Evaluate whether there are elevated constituents of the natural groundwater quality that affect its required uses
…
What is the groundwater abstraction in the study area?
Compile information on the location of groundwater abstraction Compile information on techniques employed for groundwater
abstraction Check adequacy of wellhead protection measures, wellhead
construction and maintenance as well as sanitary seals used (Chapter 18)
Evaluate whether there is a multi-layered aquifer sequence with abstraction from different levels
Assess the potential for shallow polluted groundwater to be induced downwards
Identify occurrence and location of abandoned wells or boreholes which could act as pollutant pathways
…
Is the groundwater susceptible to resource degradation?
Assess whether groundwater abstraction is increasing and likely to continue increasing
Evaluate whether groundwater abstraction exceeds average recharge Identify observable signs of persistent decline in groundwater levels …
Assessment of aquifer pollution vulnerability 239
Documentation and visualization of information on aquifer pollution vulnerability and impacts of abstraction
Compile summarizing report and consolidate information from checklist points above
…
8.8 REFERENCES Adams, B. and Foster, S.S.D. (1992) Land-surface zoning for groundwater protection. J.
Institution of Water & Environ. Man., 6, 312-320. Albinet, M. and Margat, J. (1970) Cartographie de la vulnerabilité à la pollution des nappes
d’eau souterraine. Bulletin BRGM 2nd Series, 3(4), 13-22. Aller, L., Bennett, T., Lehr, J.H., Pett, R.J. and Hackett, G. (1987) DRASTIC: A
Standardised System For Evaluating Groundwater Pollution Potential Using Hydrogeologic Settings. EPA/600/2-85/018, US EPA, Ada, Oklahoma.
Alley, W.M., Reilly, T.E. and Franke, O.L. (1999) Sustainability of Ground-water Resources. USGS, Circular 1186. http://pubs.water.usgs.gov./circ1186/ (accessed April 29, 2005).
Alley, W.M., Healy, R.W., LaBaugh, J.W. and Reilly, T.E. (2002) Flow and storage in groundwater systems. Science, 296, 1985-1990.
Andersen, L.J. and Gosk, E. (1987) Applicability of vulnerability maps. TNO Committee for Hydrological Research: Proceedings and information, 38, 321-332, Delft.
ARGOSS (2001) Guidelines For Assessing the Risk to Groundwater From On-site Sanitation. BGS Commissioned Report, CR/01/142, Keyworth.
Bowden, R. (2002) Water Supply: Our Impact on the Planet, Hodder Wayland, London. Chapman, D. (ed) (1996) Water Quality Assessments, 2nd edn, E & F N Spon, London. Custodio, E. (2002) Aquifer overexploitation: what does it mean? Hydrogeology J., 10,
254-277. Daly, D., Dassargues, A., Drew, D., Dunne, N., Goldschneider, N., Neale, I., Popescu, C.
and Zwahlen, F. (2001) Main concepts of the European approach for karst groundwater resource assessment and mapping. Hydrogeology J., 10, 340-345.
Doerfliger, N. and Zwahlen, F. (1998) Practical Guide to Groundwater Vulnerability Mapping in Karstic Regions. Swiss Agency for Environment, Forest and Landscape, Berne.
Domenico, P.A. and Schwartz, F.W. (1998) Physical and Chemical Hydrogeology, 2nd edn, John Wiley & Sons, New York.
Driscoll, F.G. (1986) Groundwater and Wells, 2nd edn, Johnson Division, St Paul, Minnesota.
Foster, S.S.D. (1992) Unsustainable development and irrational exploitation of groundwater resources in developing nations - an overview. In Selected Papers on Aquifer Overexploitation, vol. 3, pp. 321-336, Heise, Hannover.
Foster, S.S.D. and Hirata, R. (1988) Groundwater Pollution Risk Assessment. Pan American Centre for Sanitary Engineering and Environmental Sciences, Lima.
Foster, S., Chilton, J., Moench, M., Cardy, F. and Schiffler, M. (2000) Groundwater in Rural Development: Facing the challenges of supply and resource sustainability. World Bank Technical Paper 463, Washington, DC.
Foster, S., Lawrence, A. and Morris, B. (1998) Groundwater in Urban Development: Assessing management needs and formulating policy strategies. World Bank Technical Paper 390, Washington, DC.
240 Protecting Groundwater for Health
Foster, S.S.D., Hirata, R, Gomes, D., D’Elia, M. and Paris, M. (2002) Groundwater Quality Protection : A guide for water utilities, municipal authorities and environment agencies. The World Bank, Washington, DC.
Freeze, R.A. and Cherry, J.A. (1979) Groundwater. Prentice Hall, Englewood Cliffs, New Jersey.
Galloway, D.L., Jones, D.R. and Ingebritsen, S.E. (1999) Land Subsidence in the United States. USGS, Circular 1182. http://pubs.water.usgs.gov/circ1182/ (accessed April 29, 2005).
Groundwater Development Consultants (1989) Spilsby Sandstone Investigation. CDP 3R-56. Final Report to Anglian Water, Lincoln.
Hölting, B., Haertlé, T., Hohberger, K-H., Nachtigall, K.H., Villinger, E., Weinzierl, W. and Wrobel, J-P. (1995) Konzept zur Ermittlung der Schutzfunktion der Grundwasser-überdeckung. Geol. Jb., C-63, 5-24. [translated into English by the Federal Institute for Geosciences and Natural Resources: Concept for the Determination of the Protective Effectiveness of the Cover above the Groundwater against Pollution. – Ad-hoc Working Group on Hydrogeology, Hanover]
Howard, G. (ed) (2002) Urban Water Supply Surveillance - A Reference Manual. WEDC, Loughborough University.
Kalinski, R.J., Kelly, W.E., Bogardi, I., Ehrman, R.L. and Yamamoto, P.D. (1994) Correlation between DRASTIC vulnerabilities and incidents of VOC contamination of municipal wells in Nebraska. Ground Water, 32(1), 31-34.
Kim, Y.J. and Hamm, S.Y. (1999) Assessment of the potential for groundwater contamination using the DRASTIC/EGIS technique, Cheonju area, South Korea. Hydrogeology J., 7, 227-235.
Le Grand, H.E. (1983) A Standardised System For Evaluating Waste-Disposal Sites. National Water Well Association, Dublin, Ohio.
Lerner, D.N., Issar, A. and Simmers, I. (1990) Groundwater recharge; a guide to understanding and estimating natural recharge. Internat. Assoc. Hydrogeologists, 8, 345.
Lewis W.J., Foster S.S.D. and Drasar B.S. (1980) Risk of groundwater pollution by on-site sanitation in developing countries: a literature review. IRCWD Report 01/82
Margane, A., Hobler, M. and Subah, A. (1999) Mapping of groundwater vulnerability and hazards to groundwater in the Irbid Area, N. Jordan. Z. Angew. Geol., 45, 175-187.
Morris, B.L., Lawrence, A.R. and Stuart M.E. (1994) The Impact of Urbanization on Groundwater Quality – Project Summary Report. Technical Report WC/94/56, BGS, Keyworth.
Morris, B.L. Lawrence, A.R., Chilton, P.J., Adams, B., Calow, R. and Klinck, B.A. (2003) Groundwater and its Susceptibility to Degradation: A global assessment of the problem and options for management. Early Warning Report Series, RS 03-3, UNEP, Nairobi.
NRC (1993) Groundwater Vulnerability Assessment: Contamination potential under conditions of uncertainty. NRC, National Academy Press, Washington, DC.
Palmer, R.C. and Lewis, M.A. (1998) Assessment of groundwater vulnerability in England and Wales. In Groundwater Pollution, Aquifer Recharge and Vulnerability, pp. 191-198, Geological Society Special Publication 130, London.
Palmer, R.C., Holman, I., Robins, N.S. and Lewis, M.A. (1995) Guide to Groundwater Vulnerability Mapping in England and Wales. National Rivers Authority, HMSO, London.
Rose, A.W., Hawkes, H.E. and Webb, J.S. (1979) Geochemistry in Mineral Exploration. Academic Press, London.
Rosen, L. (1994) A study of the DRASTIC methodology with emphasis on Swedish conditions. Ground Water, 32(2), 278-285.

Assessment of aquifer pollution vulnerability 241
Shahid, S. (2000) A study of groundwater pollution vulnerability using DRASTIC/GIS, West Bengal, India. J. Environ. Hydrol., 8, 1-9.
Simmers, I. (ed) (1997) Recharge of phreatic aquifers in (semi-) arid areas. Internat. Assoc. Hydrogeologists, 19, 277.
Struckmeier, W.F. and Margat, J. (1995) Hydrogeological maps: a guide and a standard legend. Internat. Assoc. Hydrogeologists, 17, 177.
Taylor, C.J. and Alley, W.M. (2002) Ground-water-Level Monitoring and the Importance of Long-term Water-level Data. USGS, Circular 1217, http://pubs.water.usgs.gov/ circ/circ1217/ (accessed April 29, 2005).
UNESCO (1970) International Legend For Hydrogeological Maps. UNESCO/IASH/ IAH/IGS, Paris.
US EPA (1992) Handbook: Ground Water and Wellhead Protection. US EPA Report No. EPA/625/R-94/001, Washington, DC.
Vrba, J. and Zaporozec, A. (eds) (1994) Guidebook on mapping groundwater vulnerability. Internat. Assoc. Hydrogeologists, 16, 131.
Winter, T.C., Harvey, J.W., Franke, O.L. and Alley, W.M. (1998) Ground Water and Surface Water- A Single Resource. USGS, Circular 1139. http://pubs.water.usgs. gov/circ/circ1139/ (accessed April 29, 2005).