Assessment of Aircraft Noise Emissions at International ...
13
J. Aerosp. Technol. Manag., São José dos Campos, v13, e2621, 2021 https://doi.org/10.1590/jatm.v13.1204 ORIGINAL PAPER ABSTRACT Aircraſt noise emissions are a problem that negatively affects human health, directly or indirectly. For this reason, examining and managing the noise effects caused by aircraſts at the airports is important for the sustainable development of aviation. In the present study, a noise management model based on the multiapproach method, including some actions related to aircraſt noise, has been created. e model was applied to the International Eskisehir Hasan Polatkan Airport (LTBY). Within the scope of the model, in the first stage, in 365 days, day, evening and night noise levels around the airport were simulated using IMMI soſtware under the European noise directive and European Civil Aviation Conference (ECAC) doc 29-interim was also used to measure aircraſt noise. In the second stage, the noise generated by the Cessna 172-S aircraſt under different operating conditions experimentally measured was carried out. Aſter the model had been applied to LTBY, improvement opportunities for aircraſt noise were evaluated. It is thought that the study and its results will help other civil airports on the issue of noise problem at airports. Keywords: Aircraſt noise; Noise measuring; Noise management; Aviation acoustics; Aviation management; European noise directive. Assessment of Aircraft Noise Emissions at International Eskisehir Hasan Polatkan Airport with Multiple Approach Model Halil Yalcin Akdeniz 1, * , Mehmet Ziya Sogut 2 , Onder Turan 3 1.Eskisehir Osmangazi University – Eskisehir Vocational School – Mechanical Department – Eskisehir – Turkey. 2.Piri Reis University – Maritime Faculty – Marine Machinery Management Engineering – Istanbul – Turkey. 3.Eskisehir Technical University – Faculty of Aviation and Space Sciences – Department of Aircraft Airframe Engine Maintenance – Eskisehir – Turkey. *Corresponding author: [email protected] INTRODUCTION Aircraſt noise emissions from the past have become one of the important research topics in environmental management in aviation. An aircraſt has components that generate noise, such as the engine, main gear brake system, nose gear brake system and airframe system (Isermann and Bertsch 2019; Bertsch et al. 2019). In addition, aircraſt landing detail and aircraſt wheel configuration are effective parameters in noise production (Shafabakhsh et al. 2018). With technological advances, these components are more efficient in terms of reducing noise generation. Also, it is observed that aircraſt and engine manufacturers made significant improvements in noise in the production of new generation aircraſt engines to prevent noise emission caused by aircraſt. Especially in areas close to airports, people are disturbed by the noise generated by aircraſts during landing, takeoff and ground operations. It is observed that many of the existing airports in the world are mostly located near city centers and dense settlements (AIRBUS 2016). Worldwide, both planned passenger traffic and air cargo traffic are projected to exceed 4% annual growth over the next 20 years, which means doubling global air traffic (EUROCONTROL 2013). us, noise emissions will affect people living near airports more. Received: Apr. 19, 2020 | Accepted: Dec. 09, 2020 Peer Review History: Double Blind Peer Review. Section Editor: Bert Pluymers This is an open access article distributed under the terms of the Creative Commons license.
Transcript of Assessment of Aircraft Noise Emissions at International ...

J. Aerosp. Technol. Manag., São José dos Campos, v13, e2621, 2021
https://doi.org/10.1590/jatm.v13.1204 ORIGINAL PAPER
ABSTRACTAircraft noise emissions are a problem that negatively affects human health, directly or indirectly. For this reason, examining
and managing the noise effects caused by aircrafts at the airports is important for the sustainable development of aviation. In the present study, a noise management model based on the multiapproach method, including some actions related to aircraft noise, has been created. The model was applied to the International Eskisehir Hasan Polatkan Airport (LTBY). Within the scope of the model, in the first stage, in 365 days, day, evening and night noise levels around the airport were simulated using IMMI software under the European noise directive and European Civil Aviation Conference (ECAC) doc 29-interim was also used to measure aircraft noise. In the second stage, the noise generated by the Cessna 172-S aircraft under different operating conditions experimentally measured was carried out. After the model had been applied to LTBY, improvement opportunities for aircraft noise were evaluated. It is thought that the study and its results will help other civil airports on the issue of noise problem at airports.
Keywords: Aircraft noise; Noise measuring; Noise management; Aviation acoustics; Aviation management; European noise directive.
Assessment of Aircraft Noise Emissions at International Eskisehir Hasan Polatkan Airport with Multiple Approach ModelHalil Yalcin Akdeniz1,* , Mehmet Ziya Sogut2 , Onder Turan3
1.Eskisehir Osmangazi University – Eskisehir Vocational School – Mechanical Department – Eskisehir – Turkey. 2.Piri Reis University – Maritime Faculty – Marine Machinery Management Engineering – Istanbul – Turkey. 3.Eskisehir Technical University – Faculty of Aviation and Space Sciences – Department of Aircraft Airframe Engine Maintenance – Eskisehir – Turkey.
*Corresponding author: [email protected]
INTRODUCTION
Aircraft noise emissions from the past have become one of the important research topics in environmental management in aviation. An aircraft has components that generate noise, such as the engine, main gear brake system, nose gear brake system and airframe system (Isermann and Bertsch 2019; Bertsch et al. 2019). In addition, aircraft landing detail and aircraft wheel configuration are effective parameters in noise production (Shafabakhsh et al. 2018). With technological advances, these components are more efficient in terms of reducing noise generation. Also, it is observed that aircraft and engine manufacturers made significant improvements in noise in the production of new generation aircraft engines to prevent noise emission caused by aircraft. Especially in areas close to airports, people are disturbed by the noise generated by aircrafts during landing, takeoff and ground operations. It is observed that many of the existing airports in the world are mostly located near city centers and dense settlements (AIRBUS 2016).
Worldwide, both planned passenger traffic and air cargo traffic are projected to exceed 4% annual growth over the next 20 years, which means doubling global air traffic (EUROCONTROL 2013). Thus, noise emissions will affect people living near airports more.
Received: Apr. 19, 2020 | Accepted: Dec. 09, 2020Peer Review History: Double Blind Peer Review.Section Editor: Bert Pluymers
This is an open access article distributed under the terms of the Creative Commons license.

J. Aerosp. Technol. Manag., São José dos Campos, v13, e2621, 2021
Akdeniz HY, Sogut MZ, Turan O2
The fact is that the airport positions remained in the city with the development of the cities brought with its alteration of the percentage of inhabitants exposed to noise each day. The negative consequences of noise effects around airports and settlements on people, directly or indirectly, are sleep disturbance, lack of concentration, anxiety, and high blood pressure heart problems (WHO 2009).
Modeling the noise effects of Heathrow and Gatwick airports in the UK were carried out. It is stated that the noise generated by aircraft at the two airports affects 255,800 people, causing 54 myocardial infarctions, resulting in 17 early deaths each year (Wolfe et al. 2017).
The EU Environmental Noise Directive 2002/49/EC mandates that the noise level in settlers with more than 100,000 settlers be calculated and displayed on tactical noise maps that are assessed and updated every 5 years, if necessary. Noise mapping involves presenting data using a noise predictor on an actual or expected noise situation. These maps are created using specific methods and strategies aimed for public exposure assessment in residential zones. For the most part, noise maps are generated by predictions depending on both known and assessed metrics, including a description of the digital territories in 3D and aircraft GPS data (EC 2002; Ozkurt et al. 2015; Sari et al. 2014; Vogiatzis 2012).
In this study, a model was designed for sustainable noise management at airports. In the model, both noise estimation with simulations and noise measurements were made with a measuring device.
METHODOLOGY
Airports have various managerial mechanisms, but the key criteria in distinguishing these mechanisms are directly related to the size and capacity of airports. Another factor concerning the mechanism of managing is the various types of management. While the airports that also adopted the centrally controlled management strategy prefer formal organizational structures, a limited organizational structure for the airports with a versatile management approach is favored. For airports that have a versatile management strategy, management rates are seen to be less and less plain. Even so, there are airports with combined organizational mechanisms (Akyuz et al. 2019; Paşaoğlu et al. 2013; Sengur 2016).
It is determined that the noise management unit must be included in the mixed organizational mechanism at the airports. Depending on the capacity and a variety of activities, the number of noise management units and the number of staff in the team may vary. To establish and maintain the noise management unit in an airport, the upper units to which the unit is connected and the airport senior management to which it is naturally connected must be defined. In this context, the position of a sustainability manager at the airport under the top management unit and the environmental sustainability manager position as its subunit are defined, as shown in Fig. 1 (Akyuz et al. 2019).
Administration
Sustentability manager
Environmental sustainability manager
Nose unit
Figure 1. Sustainability management.

J. Aerosp. Technol. Manag., São José dos Campos, v13, e2621, 2021
Assessment of Aircraft Noise Emissions at International Eskisehir Hasan Polatkan Airport with Multiple Approach Model 3
The sustainability manager in the organizational structure is linked to the airport top management and sets sustainability policies for the airport in economic, environmental and social areas. The environmental sustainability manager makes evaluations on environmental issues at the airport (Akyuz et al. 2019).
At the airports, the noise management unit is one of the units under the airport top management and under the sustainability manager.
The methodology of the modelThe balanced approach concept of the International Civil Aviation Organization (ICAO) should be considered as the main
policy to prevent noise arising from aircraft and to struggle noise problems (ICAO 2005).Balanced approach covers the following four basic parameters:
• Reduction of noise from its source.• Planning and management of land use.• Noise reduction in operational procedures.• Operating restrictions on aircraft.
In this context, a detailed infrastructure has been developed. For this reason, a building model is shown in Fig. 2.
Airport Type
Noise Mapping
Technical Competence
Noise Measurements
Action Applications
Administrative Model
Evaluate Process
Reporting
OperatingTechnologyCapacity
Noise Process Analysis
Goals an Actions
Figure 2. Noise management action plan.
When the aircraft is close to the ground, aircraft-induced noise has been evaluated under four main headings (Basner et al. 2017; Franssen et al. 2004; Klæboe et al. 2006; Viswanathan 2018):• Taxiway and apron noise;• Takeoff noise;• Landing noise (especially due to reverse thrust);• The noise generated during maintenance of the aircraft on the ground.

J. Aerosp. Technol. Manag., São José dos Campos, v13, e2621, 2021
Akdeniz HY, Sogut MZ, Turan O4
In the created model, these four basic approaches are also considered. The information, including the multiple approach tasks, is visualized in Fig. 3.
1. Taxiway and apron noise2. Take-off noise3. Landing noise
Noise Mapping of the LTBY
Noise Mapping of the aircraft noise
4. The generated during maintenance of the aircraft on the ground
Figure 3. Summary of multiapproach tasks.
For the airport, the implementation process of this work depending on the model is shown in Fig. 4.
ResultsCapacity ActionsProcess AnalysisQualifications
(LTBY)
Figure 4. Model-based working process for LTBY.
To evaluate the mapping of the aircraft noise, aircraft noise map of the airport was modelled for the year of 2018 using IMMI software. The aircraft types and classes, maximum takeoff weights and their compatibility with the ICAO annex 16 guide chapters (ICAO 2005; ICAO 2015) were analyzed for each of the 5100 aircraft at the airport in one year.
To examine noise generated during maintenance of the aircraft on the ground, the Cessna 172-S aircraft has been identified, because Cessna 172-S aircraft, Faculty of Aeronautics, Department of Astronautics Piloting, performs approximately 55% of all aircraft operations per year within the scope of training flight activity. The measurements were made in line with ISO 3744, ISO 3746 and ISO 3740 standards (ISO 2010a; b; 2019).
Model stage 1: aircraft noise mapping of LTBYInternational Eskisehir Hasan Polatkan Airport (LTBY) is located within the boundaries of the Tepebasi district of Eskisehir
province and opened to traffic in March 1989. The coordinates of Eskisehir Hasan Polatkan Airport are 39°48’36”N; 30°31’10”E and its altitude is 2589 m. There is one terminal station inside the airport, an Air Traffic Control (ATC) center, two maintenance hangars, a firehouse, and a meteorological unit (HPH 2020). The satellite image of the airport is shown in Fig. 5 (Google 2018).
Figure 5. International Eskisehir Hasan Polatkan Airport (LTBY). Retrieved from Google Earth (2018) Eskişehir Hasan Polatkan. Image © 2018 Maxar Technologies.
J. Aerosp. Technol. Manag., São José dos Campos, v13, e2621, 2021
Assessment of Aircraft Noise Emissions at International Eskisehir Hasan Polatkan Airport with Multiple Approach Model 5
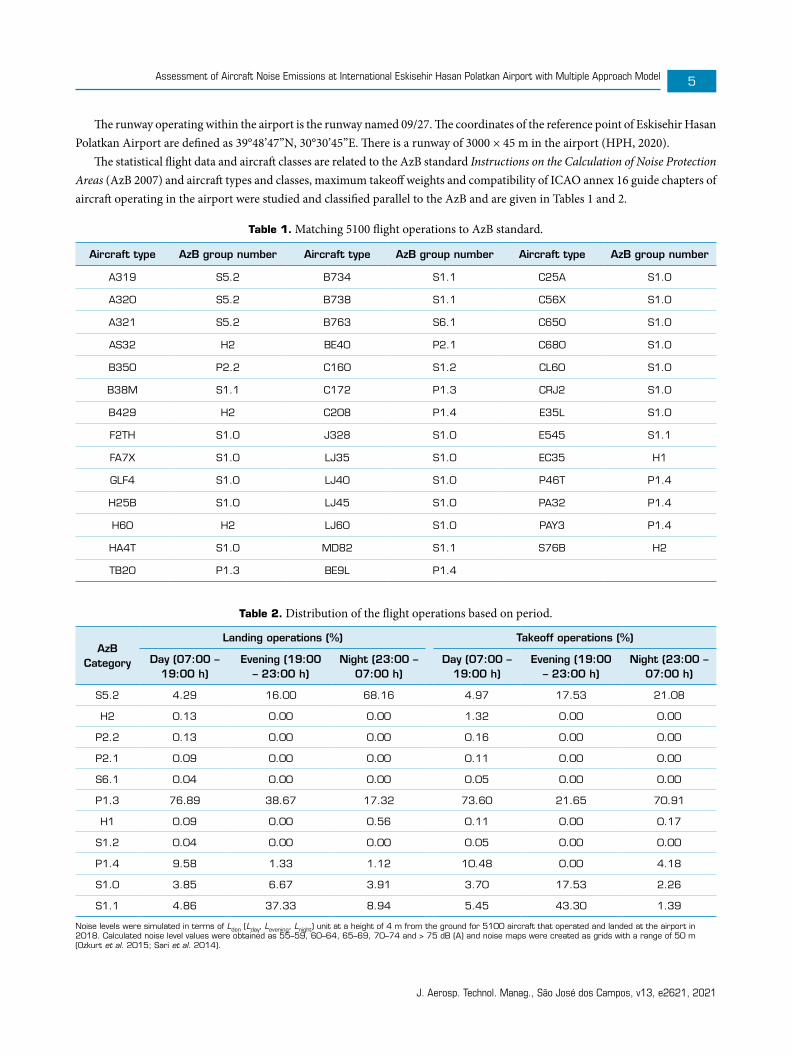
The runway operating within the airport is the runway named 09/27. The coordinates of the reference point of Eskisehir Hasan Polatkan Airport are defined as 39°48’47”N, 30°30’45”E. There is a runway of 3000 × 45 m in the airport (HPH, 2020).
The statistical flight data and aircraft classes are related to the AzB standard Instructions on the Calculation of Noise Protection Areas (AzB 2007) and aircraft types and classes, maximum takeoff weights and compatibility of ICAO annex 16 guide chapters of aircraft operating in the airport were studied and classified parallel to the AzB and are given in Tables 1 and 2.
Table 1. Matching 5100 flight operations to AzB standard.
Aircraft type AzB group number Aircraft type AzB group number Aircraft type AzB group number
A319 S5.2 B734 S1.1 C25A S1.0
A320 S5.2 B738 S1.1 C56X S1.0
A321 S5.2 B763 S6.1 C650 S1.0
AS32 H2 BE40 P2.1 C680 S1.0
B350 P2.2 C160 S1.2 CL60 S1.0
B38M S1.1 C172 P1.3 CRJ2 S1.0
B429 H2 C208 P1.4 E35L S1.0
F2TH S1.0 J328 S1.0 E545 S1.1
FA7X S1.0 LJ35 S1.0 EC35 H1
GLF4 S1.0 LJ40 S1.0 P46T P1.4
H25B S1.0 LJ45 S1.0 PA32 P1.4
H60 H2 LJ60 S1.0 PAY3 P1.4
HA4T S1.0 MD82 S1.1 S76B H2
TB20 P1.3 BE9L P1.4
Table 2. Distribution of the flight operations based on period.
AzBCategory
Landing operations (%) Takeoff operations (%)
Day (07:00 – 19:00 h)
Evening (19:00 – 23:00 h)
Night (23:00 – 07:00 h)
Day (07:00 – 19:00 h)
Evening (19:00 – 23:00 h)
Night (23:00 – 07:00 h)
S5.2 4.29 16.00 68.16 4.97 17.53 21.08
H2 0.13 0.00 0.00 1.32 0.00 0.00
P2.2 0.13 0.00 0.00 0.16 0.00 0.00
P2.1 0.09 0.00 0.00 0.11 0.00 0.00
S6.1 0.04 0.00 0.00 0.05 0.00 0.00
P1.3 76.89 38.67 17.32 73.60 21.65 70.91
H1 0.09 0.00 0.56 0.11 0.00 0.17
S1.2 0.04 0.00 0.00 0.05 0.00 0.00
P1.4 9.58 1.33 1.12 10.48 0.00 4.18
S1.0 3.85 6.67 3.91 3.70 17.53 2.26
S1.1 4.86 37.33 8.94 5.45 43.30 1.39
Noise levels were simulated in terms of Lden (Lday, Levening, Lnight) unit at a height of 4 m from the ground for 5100 aircraft that operated and landed at the airport in 2018. Calculated noise level values were obtained as 55–59, 60–64, 65–69, 70–74 and > 75 dB (A) and noise maps were created as grids with a range of 50 m (Ozkurt et al. 2015; Sari et al. 2014).

J. Aerosp. Technol. Manag., São José dos Campos, v13, e2621, 2021
Akdeniz HY, Sogut MZ, Turan O6
Model stage 2: experimental measurement of the aircraft noiseCessna 172-S is the most operated aircraft in the LTBY annually and this aircraft has been selected within the model. The aircraft
has one staff and three passenger capacity, with a curb weight of 736 kg and takeoff weight of 1113 kg. It has a power of 180 HP (134 kW), and Lycoming IO-360-L2A boxer type of engine (Cessna 2020). Eskisehir Technical University, Faculty of Aeronautics and Astronautics is used within the scope of training flight activity. Following ISO 3740, ISO 3744, ISO 3746 standards of the Cessna 172-S aircraft, acoustic noise measurement and analysis were performed, and the following operations were applied respectively.
The Cessna was placed on a flat concrete floor in a way that coincides with the center of the hemisphere with a 15 m radius. The aircraft was operated for 15 min at 725 rpm to heat the engine and reach the full rpm in the second condition.
The measurement group was carried out on the test environment, outdoors, single reflective surface and concrete ground. The noise level measurement device calibration process was performed before the measurement.
The reference box definition, which is a prismatic rectangular prism covering the components where the source emits sound, is shown in Fig. 6 and ends on the reflective plane/planes on which the noise source is located (ISO 2010a).
do
l3l2
l1
0
Figure 6. Reference box.
The characteristic source size of the reference box on a reflecting plane was calculated as in Eq. 1. The measuring radius was determined as 15 m.
d0 = + +l12
l22 (l3)2
2 2⎛⎝
⎛⎝
⎞⎠
⎞⎠ (1)
where, l1 = 11 m, l2 = 8.28 m, l3 = 2.72 m, and d0 = 7.4 m.TESTO 815 type-2 sound level meter (SLM) was used for the measurements. The SLM that appropriates the requirements of
IEC 61672-1: 2002 for measurements of the noise (IEC 2002). The measurements were made with the aircraft in no-load mode (IDLE) and full load (full thrust).
The SLM had been calibrated before starting each measurement group. The background noise level measured at every point was determined before the aircraft was operated. It was determined that the background noise was at least 15 dB less than the measurement values taken from the points. Measurements were made under conditions where the wind speed was lower than 5 m/s and there was no precipitation in the air (ISO 2010b). Microphone positions are shown in Fig. 7.
A
B
48
37
1 6
L2
L3
L1
2 5
z
y
x
Figure 7. Microphone positions, 3D view.

J. Aerosp. Technol. Manag., São José dos Campos, v13, e2621, 2021
Assessment of Aircraft Noise Emissions at International Eskisehir Hasan Polatkan Airport with Multiple Approach Model 7
where, A: measuring surface, B: reference box, L1: length of reference box, L2: width of reference box, L3: height of the reference box, r: radius of the measuring surface
RESULTS AND DISCUSSION
In line with the European Directive 2002/49/EC, and Turkish Regulation on Assessment and Management of Environmental Noise (RAMEN), the maximum allowable limit for noise is Lden = 63 dB (A) (Turkey 2010; EC 2002; Ozkurt et. al 2014; Keskin 2014). The noise mapping results of LTBY as Lden are shown in Fig. 8.
50-55 db(A)
55-60 db(A)
DENLeveldb(A)
>...-35>35-40>40-45>45-50>50-55>55-60>60-65>65-70>70-75>75-80>80-...
65-70 db(A)
RW 09
RW 27
Figure 8. Noise mapping of LTBY, Lden.
When the noise mapping results were evaluated, it was observed that the noise level, which would adversely affect human health, was not exceeded.
However, the dominant wind direction in the airport region has an impact on the noise generated at the airport and the propagation of noise emission around the airport. Propagating the sound in the direction of the wind will slightly increase its effect (Keskin 2014).
Therefore, aircraft noise has been associated with the prevailing wind direction at the airport and around it. Winds prevail in the direction of east to west in the winter and northwest in the first months of spring. At the end of spring, winds from the southwest, west and northwest can be seen (GDM 2019). In this context, when 09/27 runway at LTBY is examined and evaluated in terms of the prevailing wind direction and its surroundings during the year, the use of runway 09 during the months of winter and spring, and runway 27 during the remaining months of the year, due to the departure operations of the aircraft from the airport, will affect the noise emission. Therefore, it is recommended to pay attention to the use of runways in parallel with these arguments stated in-flight operation plans.
One of the tasks in the developed model was noise measurement. The measurement results under ISO 3746 for Cessna 172-S are given in Tables 3 and 4.
When the results of the experimental measurements were evaluated, it was observed that the values were exceeding the lowest exposure limit of 80 dB (A) (Nazlıoğlu 2014).
In this context, preventive measures were studied, and the identified improvement opportunities were presented.Under ideal conditions, spreading of sound waves and a decrease in sound pressure levels due to distance are observed.
Accordingly, due to the noise generated by the noise source during the aircraft engine tests, hydraulic and pneumatic tests in the maintenance hangar area or the front of the hangar, the safe contour zones are created because the distance data will decrease by approximately 1 r–2 from the source. The safe contour zones are shown in Fig. 9.

J. Aerosp. Technol. Manag., São José dos Campos, v13, e2621, 2021
Akdeniz HY, Sogut MZ, Turan O8
Table 3. Experimental measurement results and calculations of the operation condition: IDLE.
Source Cessna 172-S 180 HP, 134 kW
Source location Single reflective surface, concrete/asphalt ground
Ambience Outdoor environment (negligible K2)
Operation condition 725 rpm (IDLE)
Source dimensions 8.28, 11, 2.72 m
Microphone positions Eight positions
Background noise level correction value, K1A
Background noise level, LPaΔLpA
Correction value K1A
56 dB(A)15 dB(A)0 dB(A)
Measurements results dB(A)
Point 1 81.7 81.7 81.7
Point 2 79.6 79.6 79.6
Point 3 79.5 79.5 79.5
Point 4 81.7 81.8 81.7
Point 5 79.8 79.8 79.8
Point 6 81.8 81.8 81.8
Point 7 79.2 79.2 79.2
Point 8 81.7 81.8 81.8
A weighted average sound pressure level, L_
pA- dB (A) 80.76 80.78 80.77
10 log SS0
⎛⎝⎞⎠
S = hemispherical measuring surface area (m2)31.50 31.50 31.50
A weighted sound power level - dB (A) 112.26 112.28 112.27
Measurement uncertainty value
Standard deviation, σomc, dB (A)(resulting from operation conditions) 2
Standard compliance deviation of the method, σRO, dB (A) 3
Total standard deviation, σtot, dB (A) 3.6
Extended uncertainty value, U, dB(A) coverage factor k 2

J. Aerosp. Technol. Manag., São José dos Campos, v13, e2621, 2021
Assessment of Aircraft Noise Emissions at International Eskisehir Hasan Polatkan Airport with Multiple Approach Model 9
Table 4. Experimental measurement results and calculations of the operation condition: full thrust.
Source Cessna 172-S 180 HP, 134 kW
Source location Single reflective surface, concrete/asphalt ground
Ambience Outdoor environment (negligible K2)
Operation condition 2350 rpm (full thrust)
Source dimensions 8.28, 11, 2.72 m
Microphone positions Eight positions
Background noise level correction value, K1A
Background noise level, LPaΔLpA
Correction value, K1A
56 dB (A)15 dB (A)0 dB (A)
Measurements results, dB (A)
Point 1 83.9 83.7 83.8
Point 2 81.3 81.4 81.3
Point 3 81.2 81.2 81.2
Point 4 83.3 83.4 83.3
Point 5 81.8 81.8 81.8
Point 6 83.9 83.9 83.8
Point 7 83.2 83.2 83.2
Point 8 83.3 83.4 83.3
A weighted average sound pressure level, L_
pA- dB (A) 82.85 82.86 82.85
10 log SS0
⎛⎝⎞⎠
S = hemispherical measuring surface area (m2)31.50 31.50 31.50
A weighted sound power level - dB (A) 114.35 114.36 114.35
Measurement uncertainty value
Standard deviation, σomc, dB (A)(resulting from operation conditions) 2
Standard compliance deviation of the method, σRO, dB(A) 3
Total standard deviation, σtot, dBA 3.6
Extended uncertainty value, U, dB(A) coverage factor k 2

J. Aerosp. Technol. Manag., São José dos Campos, v13, e2621, 2021
Akdeniz HY, Sogut MZ, Turan O10
Figure 9. Safe contour zones for Cessna 172-S.
The first contour zone is the minimum diameter distance surrounding all components of the aircraft and will vary depending on the aircraft in maintenance. The second contour zone will end at 4 r from the center. The third contour area will end at 9 r from the center. The specified distances can be implemented in a very practical way, and it is recommended that these distances be maintained.
CONCLUSION
In this study, a noise management model based on the multiapproach method, including some actions related to aircraft noise, has been created. The model was applied to the LTBY.
Within the scope of the model, in the first stage, day, evening and night noise levels around LTBY were simulated using IMMI software under the European noise directive and the ECAC Doc 29-Interim was also used to measure aircraft noise.
According to results of the aircraft noise mapping, it was observed that the noise level, which would adversely affect human health, was not exceeded. However, these values are valid for the year of 2018; it is recommended to update aircraft noise mapping periodically to ensure sustainability. In the study, the use of the runway was evaluated in terms of the prevailing wind direction in the year around the runway. It was suggested to use runway 09 in the months of winter and spring and runway 27 in the rest of the year, due to the departure operations of the aircraft in the analyzed airport.
In the second stage, the noise generated by the Cessna 172-S aircraft, which has a piston-prop engine type, the mostly operated at the LTBY, under different operating conditions, experimentally measured was carried out. According to the noise measuring results, it was observed that the values were exceeding the lowest exposure limit of 80 dB (A). Therefore, preventive measures were examined and opportunities for improvement identified. Safe contour zones were determined for the Cessna 172-S aircraft during maintenance. Furthermore, it was emphasized that protective equipment should be used for the technicians during the maintenance of the aircraft.
After the model had been applied to LTBY, improvement opportunities for aircraft noise were evaluated. Finally, considering that there are not very common studies on the management of aircraft noise in the literature, it is thought that this study will help with the management and evaluation of aircraft noise at other civil airports.
AUTHORS’ CONTRIBUTION
Conceptualization: Sogut MZ and Turan O; Methodology: Akdeniz HY, Sogut MZ and Turan O; Investigation: Akdeniz HY; Writing – Original Draft: Akdeniz HY; Writing – Review & Editing: Akdeniz HY, Sogut MZ and Turan O; Supervision: Sogut MZ and Turan O.

J. Aerosp. Technol. Manag., São José dos Campos, v13, e2621, 2021
Assessment of Aircraft Noise Emissions at International Eskisehir Hasan Polatkan Airport with Multiple Approach Model 11
DATA AVAILABILITY STATEMENT
The data will be available upon request.
FUNDING
Not applicable.
ACKNOWLEDGEMENTS
Not applicable.
REFERENCES
[EC] European Commission (2002) Directive 2002/49/EC of the European Parliament and of the Council of 25 June 2002 relating to the assessment and management of environmental noise. Directives originating from the EU 49. Whole Directive without Annexes. [accessed Nov 27 2018]. https://www.legislation.gov.uk/eudr/2002/49/body#
[EUROCONTROL] European Organization for the Safety of Air Navigation (2013) Challenges of growth 2013: Summary report. [accessed Nov 27 2018]. https://www.eurocontrol.int/sites/default/files/content/documents/official-documents/reports/201307-challenges-of-growth-summary-report.pdf
[GDM] General Directorate of Meteorology (2019) Weather Forecasts. [accessed Oct 20 2019]. https://www.mgm.gov.tr/veridegerlendirme/il-ve-ilceler-istatistik.aspx?k=H
[HPH] Hasan Polatkan Havalimani (2020) Hasan Polatkan Havalimani. Genel Bilgiler. [accessed Nov 27 2018]. Turkish. https://hph.eskisehir.edu.tr/sayfa/genel-bilgiler
[ICAO] International Civil Aviation Organization (2005) Environmental protection. Annex 16. Vol I. [accessed Nov 27 2018].
[ICAO] International Civil Aviation Organization (2015) Aircraft Engine Emissions. [accessed Nov 27 2018].
[IEC] International Electronical Commission (2002) IEC 61672-1:2002 Electroacoustics - Sound level meters - Part 1: Specifications. [accessed April 15 2019]. https://webstore.iec.ch/publication/19902
[WG-AEN] European Commission Working Group Assessment of Exposure to Noise (2006) Good Practice Guide for Strategic Noise Mapping and the Production of Associated Data on Noise Exposure. [accessed April 15 2019]. http://sicaweb.cedex.es/docs/documentacion/Good-Practice-Guide-for-Strategic-Noise-Mapping.pdf
[WHO] World Health Organization (2009) Night Noise Guidelines for Europe. Copenhagen: WHO Regional Office for Europe.
AIRBUS (2016) Global Market: Forecast Mapping Demand 2016-2035. Blagnac: AIRBUS S.A.S. [accessed April 15 2019]. http://www.team.aero/files/airbusforecast/Airbus-GMF-2016-2035-MappingDemand-full_book.pdf
Akyuz MK, Altuntas O, Sogut MZ, Karakoc TH (2019) Energy Management at the Airports. In: Karakoc TH, Colpan CO, Altuntas O, Sohret Y, editors. Sustainable Aviation. Cham: Springer. https://doi.org/10.1007/978-3-030-14195-0_2

J. Aerosp. Technol. Manag., São José dos Campos, v13, e2621, 2021
Akdeniz HY, Sogut MZ, Turan O12
AzB (2007) Anleitung zur Berechnung von Lärmschutzbereichen. Umweltbundesamt. [accessed April 15 2019]. https://www.hlnug.de/fileadmin/dokumente/laerm/gesetze/flugverkehr/AzB_07.pdf
Basner M, Clark C, Hansell A, Hileman JI, Janssen S, Shepherd K, Sparrow V (2017) Aviation Noise Impacts: State of the Science. Noise Health 19(87):41-50.
Bertsch L, Snellen M, Enghardt L, Hillenherms C (2019) Aircraft noise generation and assessment: executive summary. CEAS Aeronaut J 10:3-9.
Cessna (2020) Cessna Skyhawk. Engineered for Training. Built for Adventure. [accessed Jan 17 2020]. https://cessna.txtav.com/en/piston/cessna-skyhawk
Franssen EAM, van Wiechen CMAG, Nagelkerke NJD, Lebret E (2004) Aircraft noise around a large international airport and its impact on general health and medication use. Occup Environ Med 61:405-413. https://doi.org/10.1136/oem.2002.005488
Google Earth (2018) Eskişehir Hasan Polatkan. 39°48'36"K 30°31'10"D”. Google Earth. [accessed Nov 27 2018]. https://earth.google.com/web/@39.80223607,30.52301864,789.96927995a,2914.68936561d,35y,0.895471h,65.46355873t,-0r
Isermann U, Bertsch L (2019) Aircraft noise immission modelling. CEAS Aeronaut J 10(1):287-31. https://doi.org/10.1007/s13272-019-00374-5
ISO (2010a) ISO 3744:2010 Acoustics — Determination of sound power levels and sound energy levels of noise sources using sound pressure — Engineering methods for an essentially free field over a reflecting plane. Berlin: ISO. [accessed April 15 2019]. https://www.iso.org/standard/52055.html
ISO (2010b) ISO 3746:2010 Acoustics — Determination of sound power levels and sound energy levels of noise sources using sound pressure — Survey method using an enveloping measurement surface over a reflecting plane. Berlin: ISO. [accessed April 15 2019]. https://www.iso.org/standard/52056.html
ISO (2019) ISO 3740:2019 Acoustics — Determination of sound power levels of noise sources — Guidelines for the use of basic standards. Berlin: ISO. [accessed Nov 15 2019]. https://www.iso.org/standard/45107.html
Keskin O (2014) Havalimanı Gürültü Haritalarının Hazırlanması: İstanbul Sabiha Gökçen Uluslararası Havalimanı Örneği [Preparation of Airport Noise Mapes: Case of Istanbul Sabiha Gokcen International Airport] (Master thesis). Istanbul: Istanbul Teknik Üniversitesi. Turkish.
Klæboe R, Engelien E, Steinnes M (2006) Context-sensitive noise impact mapping. Appl Acoust 67(7):620-642. https://doi.org/10.1016/j.apacoust.2005.12.002
Nazlıoğlu A (2014) Havaalanı Bakım Onarım Hangarında Tehlike Kaynaklarının Belirlenmesi Ve Kontrol Listesi Hazırlanması. Ankara, Türkiye. [accessed Nov 14 2019]. https://ailevecalisma.gov.tr/media/1369/aysenazlioglu.pdf
Ozkurt N, Sari D, Akdag A, Kutukoglu M, Gurarslan A (2014) Modeling of noise pollution and estimated human exposure around İstanbul Atatürk Airport in Turkey. Sci. Total Environ 482-483:486-492. https://doi.org/10.1016/j.scitotenv.2013.08.017
Ozkurt N, Hamamci SF, Sari D (2015) Estimation of airport noise impacts on public health. A case study of İzmir Adnan Menderes Airport. Transp Res D Transp Environ 36:152-159. https://doi.org/10.1016/j.trd.2015.02.002
Paşaoğlu D, Tokgöz N, Şakar N, Özler NDE, Özalp I (2013) Yönetim ve Organizasyon [Management and Organization]. Eskisehir: Anadolu Üniversitesi Yayını. Turkish.

J. Aerosp. Technol. Manag., São José dos Campos, v13, e2621, 2021
Assessment of Aircraft Noise Emissions at International Eskisehir Hasan Polatkan Airport with Multiple Approach Model 13
(LTBY)
CAPACITY QUALIFICATIONS PROCESS ANALYSIS ACTIONS RESULTS
Turkey. Çevre ve Şehircilik Bakanlığı (2010) Çevresel Gürültünün Değerlendirilmesi ve Yönetimi Yönetmeliği [Regulation on Assessment and Management of Environmental Noise]. Food and Agriculture Organization of the United Nations. [accessed Jul 20 2019]. Turkish. http://www.fao.org/faolex/results/details/en/c/LEX-FAOC164383
Sari D, Ozkurt N, Akdag A, Kutukoglu M, Gurarslan A (2014) Measuring the levels of noise at the İstanbul Atatürk Airport and comparisons with model simulations. Sci Total Environ 482-483:472-479. https://doi.org/10.1016/j.scitotenv.2013.07.091
Sengur Y (2016) Havaalanı Yönetimi [Airport Management]. In: Yönetsel Sistem Olarak Havaalanı [Airport as an Administrative System]. Eskisehir: Anadolu Üniversitesi Açıköğretim Yayınları. p. 30-59. Turkish.
Shafabakhsh G, Kashi E, and Tahani M. (2018) Analysis of runway pavement response under aircraft moving load by FEM. J Eng Des Tech 16(2):233-243. https://doi.org/10.1108/JEDT-09-2017-0093
Viswanathan K (2018) Progress in prediction of jet noise and quantification of aircraft/engine noise components. Int J Aeroacoustics 17(4-5):339-379 https://doi.org/10.1177/1475472X18778279
Vogiatzis K (2012) Airport environmental noise mapping and land use management as an environmental protection action policy tool. The case of the Larnaka International Airport (Cyprus). Sci Total Environ 424:162-173. https://doi.org/10.1016/j.scitotenv.2012.02.036
Wolfe PJ, Kramer JL, Barrett SRH (2017) Current and future noise impacts of the UK hub airport. J Aerosp Technol Manag 58:91-99. https://doi.org/10.1016/j.jairtraman.2016.09.002