assessment Modelo de deformación permanente para … · correlacionar los datos de deflexiones en...
10
Revista Ingeniería de Construcción RIC Vol 32 Nº1 2017 www.ricuc.cl ENGLISH VERSION..................................................................................................................................................................................................................................................... Revista Ingeniería de Construcción Vol 32 Nº1 Abril de 2017 www.ricuc.cl 37 Permanent deformation model for pavement condition assessment Modelo de deformación permanente para la evaluación de la condición del pavimento F. Leiva 1 *, E. Pérez *, J. Aguiar *, L. Loría * * Universidad de Costa Rica, San Pedro de Montes de Oca. COSTA RICA Fecha de Recepción: 02/08/2016 Fecha de Aceptación: 12/12/2016 PAG 37-46 Abstract For many decades, studies have addressed the development of plastic strains in flexible pavements. Currently, there are models available that allow predicting this type of failure, and it is a common practice to include them in the structural design of pavements. However, variables required for this prediction are complex and difficult to obtain on site; therefore, they are not easy to apply in the diagnostic process. The measurement of deflections is a structural evaluation method for flexible pavements, whose value may include the competence of the pavement as a whole. This research seeks to correlate deflection data on the pavement’s surface with probable plastic strains over time, and to use this prediction to calculate the pavement’s remaining service life, with the criterion of maximum rutting allowed. Real-scale data from 4 different lanes were tested by the National Laboratory of Materials and Structural Models of the University of Costa Rica. The proposed model was able to predict future rutting using as input the thickness of the pavement structure, the surface deflection measured at loads of 40 kN, and the equivalent axle repetition; a high goodness of fit was achieved. The rutting level estimate should help maintenance and rehabilitation policies of the road management system to be assessed and applied at the right time. Keywords: Plastic strains, flexible pavement, rutting, deflection pavement, productive model Resumen El desarrollo de deformaciones plásticas en pavimentos flexibles ha sido un tópico de investigación desde hace varias décadas. Actualmente se cuenta con modelos que permiten predecir este tipo de falla, siendo una práctica común considerarlos en el diseño estructural de pavimentos. Sin embargo, las variables requeridas para dicha predicción son complejas o difíciles de obtener en campo, lo que hace que su aplicación en el proceso de auscultación no sea sencilla. La medición de deflexiones es una técnica de evaluación estructural de pavimentos flexibles cuyo valor puede considerar la competencia del conjunto pavimento. Esta investigación busca correlacionar los datos de deflexiones en la superficie del pavimento con las deformaciones plásticas probables en el tiempo y usar esta predicción para estimar la vida remanente del pavimento usando como criterio el ahuellamiento máximo permisible. Se utilizaron datos adquiridos en 4 pistas distintas ensayadas a escala real por el Laboratorio Nacional de Materiales y Modelos Estructurales de la Universidad de Costa Rica. El modelo propuesto logra predecir el ahuellamiento futuro usando como insumo el espesor de la estructura de pavimento, la deflexión superficial medida a 40kN de carga, y la repetición de ejes equivalentes, logrando una bondad de ajuste alta. Con la estimación del nivel de ahuellamiento se espera que las políticas de mantenimiento y rehabilitación propias de un sistema de administración de pavimentos sean calibradas y aplicadas a su debido tiempo. Palabras clave: Deformaciones plásticas, pavimento flexible, ahuellamiento, deflexión del pavimento, modelo productivo 1. Introduction Rutting is a functional failure associated to load repetitions. It is caused by permanent deformations in any of the pavement layers, or in the subgrade, and it is mainly produced by consolidation or lateral displacement of the materials due to traffic. Severe rutting can cause hydroplaning and, eventually, the structural failure of the pavement (Huang, 2004). The increasing vehicle traffic and the percentage of heavy vehicles, as well as the uncertainty associated to their projection, make rutting one of the most frequent and severe failures affecting pavements. The current practice tends to consider probable rutting as one of the indicators to be controlled during pavement design, aiming mainly at preserving speed and safety by preventing the hydroplaning phenomenon. Therefore, it is usual to choose models that are calibrated to predict the maximum number of load cycles that the structure can bear, before presenting maximum rutting levels that can adversely affect the operation of the pavement. This criterion is commonly used in pavement design methods with a mechanistic-empirical approach; however, not many researches have offered tools for making follow-ups and predict the progress of this failure over time. It is a known trend in flexible pavements that surface deflections measured in areas affected by rutting are higher than those measured in areas without failures (Huang, 2004). This paper presents a predictive correlation model between surface deflections and traffic loads with potential plastic strains over time. The model was created with input data from measurements in four lanes tested in an accelerated way at the National Laboratory of Materials and Structural Models of the 1 Corresponding author: Laboratorio Nacional de Materiales y Modelos Estructurales. Universidad de Costa Rica. Costa Rica E-mail: [email protected]
Transcript of assessment Modelo de deformación permanente para … · correlacionar los datos de deflexiones en...

Revista Ingeniería de Construcción RIC Vol 32 Nº1 2017 www.ricuc.cl
ENGLISH VERSION.....................................................................................................................................................................................................................................................
Revista Ingeniería de Construcción Vol 32 Nº1 Abril de 2017 www.ricuc.cl 37
Permanent deformation model for pavement condition assessment Modelo de deformación permanente para la evaluación de la condición del pavimento
F. Leiva 1*, E. Pérez *, J. Aguiar *, L. Loría *
* Universidad de Costa Rica, San Pedro de Montes de Oca. COSTA RICA
Fecha de Recepción: 02/08/2016 Fecha de Aceptación: 12/12/2016
PAG 37-46
Abstract For many decades, studies have addressed the development of plastic strains in flexible pavements. Currently, there are models available that allow predicting this type of failure, and it is a common practice to include them in the structural design of pavements. However, variables required for this prediction are complex and difficult to obtain on site; therefore, they are not easy to apply in the diagnostic process. The measurement of deflections is a structural evaluation method for flexible pavements, whose value may include the competence of the pavement as a whole. This research seeks to correlate deflection data on the pavement’s surface with probable plastic strains over time, and to use this prediction to calculate the pavement’s remaining service life, with the criterion of maximum rutting allowed. Real-scale data from 4 different lanes were tested by the National Laboratory of Materials and Structural Models of the University of Costa Rica. The proposed model was able to predict future rutting using as input the thickness of the pavement structure, the surface deflection measured at loads of 40 kN, and the equivalent axle repetition; a high goodness of fit was achieved. The rutting level estimate should help maintenance and rehabilitation policies of the road management system to be assessed and applied at the right time. Keywords: Plastic strains, flexible pavement, rutting, deflection pavement, productive model Resumen El desarrollo de deformaciones plásticas en pavimentos flexibles ha sido un tópico de investigación desde hace varias décadas. Actualmente se cuenta con modelos que permiten predecir este tipo de falla, siendo una práctica común considerarlos en el diseño estructural de pavimentos. Sin embargo, las variables requeridas para dicha predicción son complejas o difíciles de obtener en campo, lo que hace que su aplicación en el proceso de auscultación no sea sencilla. La medición de deflexiones es una técnica de evaluación estructural de pavimentos flexibles cuyo valor puede considerar la competencia del conjunto pavimento. Esta investigación busca correlacionar los datos de deflexiones en la superficie del pavimento con las deformaciones plásticas probables en el tiempo y usar esta predicción para estimar la vida remanente del pavimento usando como criterio el ahuellamiento máximo permisible. Se utilizaron datos adquiridos en 4 pistas distintas ensayadas a escala real por el Laboratorio Nacional de Materiales y Modelos Estructurales de la Universidad de Costa Rica. El modelo propuesto logra predecir el ahuellamiento futuro usando como insumo el espesor de la estructura de pavimento, la deflexión superficial medida a 40kN de carga, y la repetición de ejes equivalentes, logrando una bondad de ajuste alta. Con la estimación del nivel de ahuellamiento se espera que las políticas de mantenimiento y rehabilitación propias de un sistema de administración de pavimentos sean calibradas y aplicadas a su debido tiempo. Palabras clave: Deformaciones plásticas, pavimento flexible, ahuellamiento, deflexión del pavimento, modelo productivo
1. Introduction Rutting is a functional failure associated to load repetitions. It is caused by permanent deformations in any of the pavement layers, or in the subgrade, and it is mainly produced by consolidation or lateral displacement of the materials due to traffic. Severe rutting can cause hydroplaning and, eventually, the structural failure of the pavement (Huang, 2004). The increasing vehicle traffic and the percentage of heavy vehicles, as well as the uncertainty associated to their projection, make rutting one of the most frequent and severe failures affecting pavements. The current practice tends to consider probable rutting as one of the indicators to be controlled during pavement design, aiming mainly at preserving speed and safety by preventing the hydroplaning phenomenon. Therefore, it is
usual to choose models that are calibrated to predict the maximum number of load cycles that the structure can bear, before presenting maximum rutting levels that can adversely affect the operation of the pavement. This criterion is commonly used in pavement design methods with a mechanistic-empirical approach; however, not many researches have offered tools for making follow-ups and predict the progress of this failure over time.
It is a known trend in flexible pavements that surface deflections measured in areas affected by rutting are higher than those measured in areas without failures (Huang, 2004). This paper presents a predictive correlation model between surface deflections and traffic loads with potential plastic strains over time. The model was created with input data from measurements in four lanes tested in an accelerated way at the National Laboratory of Materials and Structural Models of the
1 Corresponding author:
Laboratorio Nacional de Materiales y Modelos Estructurales. Universidad de Costa Rica. Costa Rica E-mail: [email protected]

38 Revista Ingeniería de Construcción Vol 32 Nº1 Abril de 2017 www.ricuc.cl
University of Costa Rica (LanammeUCR). The proposed model can be a useful tool for projecting the remaining service life of the pavement, which will help the responsible departments in the decision-making and planning processes.
2. Rutting prediction models Many factors may influence the development of plastic strains in the structure of asphalt pavements. Empirical methods for predicting this failure consider factors such as materials properties (e.g. resilient modulus), ambient temperature, tire inflation pressure, duration of the load, number of cycles, and travel speed (Huang, 2004). The use of these parameters have yielded successful results. However, its applicability seems to be restricted to pavement design, since it is not a common practice or needs a considerable time investment, and to be able to rely on all the information that these models require, based on an existing pavement structure. A pavement subject to repeated traffic loads will develop vertical compressive strains ( 𝜀" ), which will subsequently turn into permanent deformations, as shown in
Figure 1. Previous researches correlated vertical strain with compressive strength, calculated by the theory of elastic multilayers, on each pavement layer with its respective probable plastic strain. These models based on the mechanical behavior are representative and quite popular (Du et al., 2008). A general approach of the permanent deformation failure mode is represented by Equation 1, where 𝑁$ is the number of load repetitions for the failure, 𝜀" is the compressive strain on the upper side of the subgrade, and𝑓& and 𝑓' are coefficients obtained in the laboratory. Table 1 summarizes some of the models developed by several organizations based on this general approach (Du et al., 2008).
The models presented are based on the compressive unit strain in the subgrade surface, ignoring the effect of the permanent deformation in the upper layers. In order to mitigate this omission, the Federal Highway Administration of the United States (FHWA) developed a pavement analysis system (VESYS), which has a simple model for calculating rutting. This model assumes that permanent deformation is linearly related to resilient strains, as shown in Equation 2 (FHWA).
𝑁$ = 𝑓& 𝜀" )*+ (1)
Organization Model Asphalt Institute 𝑁$ = 1.365×10)3(𝜀"))6.677 Shell Petroleum 𝑁$ = 6.15×10)7(𝜀"))6 University of Nottingham 𝑁$ = 1.13×10)8(𝜀"))9.:7& Mn/ROAD 𝑁$ = 7.0×10&:(𝜀"))9.3<3
Table 1. Model developed by different organizations for plastic deformations
Figure 1. Strains in Flexible Pavements and Load Distribution (Du et al., 2008)
Load, W
Surface
Base and Subbase
Subgrade

Revista Ingeniería de Construcción RIC Vol 32 Nº1 2017 www.ricuc.cl
ENGLISH VERSION.....................................................................................................................................................................................................................................................
Revista Ingeniería de Construcción Vol 32 Nº1 Abril de 2017 www.ricuc.cl 39
𝜀= 𝑁 = 𝜇𝜀𝑁)? (2) Where, 𝜀= 𝑁 : is the permanent deformation after N load repetitions, 𝜇 : Linear coefficient between permanent deformation and elastic or resilient strain 𝜀: Elastic or resilient strain after 200 load repetitions 𝑁: Number of load repetitions 𝛼: Parameter of permanent compressive strain Since the VESYS system was not entirely successful, it was revised based on a biaxial and triaxial loading analysis. Another rutting prediction model (Equation 3) was developed by the Strategic Highway Research Program (SHRP), based on Equation 2 (Lytton, 1993): 𝜀= 𝑁 = 𝑎𝑁B (3) Where, 𝜀= 𝑁 : is the permanent deformation after N load repetitions, 𝑎: Intercept of the regression analysis 𝑁: Number of load repetitions 𝑏: Slope of the regression In the case of the mechanistic-empirical guideline developed in the United States at the beginning of the present century (National Cooperative Highway Research Program, 2004), the permanent deformation for a specific moment is the addition of the strains on each layer, expressed in Equation 4. For each sublayer there is an equation that depends on the type and properties of the material. 𝑃𝐷 = 𝜀=F
G)HIJKLMFN& ∙ ℎF (4)
Where, PD: Total permanent deformation n-layers: Number of sublayers εp
i: Total deformation in sublayeri hi: Thickness of sublayeri On the other hand, one of the most recent mechanistic-empirical pavement software, called CalME, uses the concept of incremental recursive damage (Ullidtz et al., 2008). Therefore, the properties of the materials are updated over time, in order to reflect the damage produced as load passes on the pavement. For any kind of deterioration, the damage model is used in terms of mechanistic responses, properties of the materials and the number of load repetitions, as shown in Equation 5.
gb
a
÷÷ø
öççè
æ´÷
÷ø
öççè
æ´´=
refref EE
resprespMNADaño
(5)
Where: MN: Load repetitions, resp: Pavement response regarding the deterioration respref: Reference response E= Modulus of updated material for each load repetition Eref= Reference modulus A, a, b, and g : Regression parameters
Finally, the Laboratory of Materials of the University of Costa Rica has developed permanent deformation models by following models shown in Equations 1 to 3 (Leiva-Villacorta et al., 2015; Avila-Esquivel et al., 2016). These models depend on the properties of the materials and the environmental conditions of the pavement, as shown in Equation 6. In order to be able to use these models in the pavement diagnosis process, they require input variables with data that are not easy to determine during the execution of a non-destructive test on site. For example, pavement responses such as stress and unit strains require an estimate based on knowing the pavement’s properties or sensors embedded in the structure of the pavement. The purpose of this study was to develop simple models that relate a quantifiable response such as deflection, through non-destructive tests, with the pavement deterioration level, in this case, rutting. Additionally, the idea is that this type of modelling serves to feed pavement management systems. 𝑃𝐷 = 𝑘&𝑋S+𝑁ST (6) Where, PD: Permanent deformation X: Group of properties depending on the material (temperature, deviator stress, confining stress, moisture content) N: Load repetitions, k1, k2, k3: Regression coefficients
3. Objective To establish a rutting model for diagnostic purposes, based on data obtained from real-scale accelerated testing.
The aim is put on estimating the rutting level of the evaluated pavement, by making a diagnosis of flexible pavements through non-destructive tests, using the falling weight deflectometer (FWD) and a known number of equivalent load repetitions. It is expected that the rutting level estimate will help maintenance and rehabilitation policies of road management systems to be assessed and applied opportunely.
In Costa Rica, the falling weight deflectometer tests are currently used to evaluate the general condition of flexible pavements. This type of diagnosis is conducted every two years along the national road network and it comprises nearly 5 thousand kilometers. The applied load corresponds to a 40 kN equivalent axle, and it is used for pavement design and maintenance and rehabilitation management by calculating the remaining service life. The present study addresses this matter, with the aim of making the most of the information obtained from the biannual evaluation.
4. Accelerated test pavement lane of the LanammeUCR
Accelerated pavement testing consists in applying load on different pavement sections, thus simulating the pavement’s useful life in a short period of time. The LanammeUCR
40 Revista Ingeniería de Construcción Vol 32 Nº1 Abril de 2017 www.ricuc.cl
has a heavy vehicle simulator HVS – Mark VI to test these lanes under accelerated conditions. This is a totally automatic, mobile equipment with capacity to apply loads between 30 kN and 100 kN, on sections of minimum 6 linear meters, with a track width (tire deviation) of 1.0 meter (Leiva-Villacorta et al., 2013). The testing section has four testing lanes with different pavement structure, which are indicated in Table 2. The present research included the records of the following instrumentation over time (Camacho-Garita y Leiva-Villacorta, 2014):
• Laser Profilometer. It is used for measuring the longitudinal and transverse profile of the surface in the test section; the records thereof allow determining the variations of the permanent deformation in the testing section. The data collecting system uses 2 Selcom laser devices of 16 Hz and each profile consists of 64 longitudinal profiles measured at transverse intervals of 25 mm. Rutting can be measured up to a depth of 100 mm with a precision of ± 1 mm.
• Pavement Surface Deflectometer (RSD, Resonating Secondary Deflectors). Essentially, the RSD is an
electronic version of the Benkelman beam, with data transferring capacity. It is used for measuring the deflection basin on the surface under the HVS load, and it has a measurement accuracy of ± 10 microns.
• Multi-depth Deflectometer (MDD). The MDD is used for measuring the instantaneous elastic deflection and the permanent deformation in several pavement layers of the test section. Displacement measurements have an accuracy of ± 10 microns.
Figure 2 show the arrangement of all sensors contained in the test lane. They include pressure, unit strain and temperature sensors and, directly related to this study, instantaneous deflection sensors (RSD and MDD). Measurements were taken at different points of these test lanes, with the aim of considering the structural response variability associated to the constructive process. All sensors and measurement points were located along the longitudinal central axis. For this study, all measurements were taken at the surface level (for RSD and MDD instantaneous deflection sensors).
Properties / Section AC1 AC2 AC3 AC4 Thickness of asphalt concrete, cm 6.1 6.3 13.2 13.2 Base thickness, cm 21.9 21.2 31.0 24.9 Thickness of granular subbase, cm 30.1 30.1 30.1 30.1 Asphalt concrete modulus @ 25°C, MPa 3800 3800 3800 3800 Base modulus, MPa 1200 170 170 1200 Subbase modulus, MPa 140 140 140 140 Subgrade modulus, MPa 70 70 70 70
Table 2. Properties of the Lanes for accelerated testing (on site)
Figure 2. Structures in accelerated test lanes, LanammeUCR (Leiva-Villacorta et al., 2015)
Revista Ingeniería de Construcción RIC Vol 32 Nº1 2017 www.ricuc.cl
ENGLISH VERSION.....................................................................................................................................................................................................................................................
Revista Ingeniería de Construcción Vol 32 Nº1 Abril de 2017 www.ricuc.cl 41
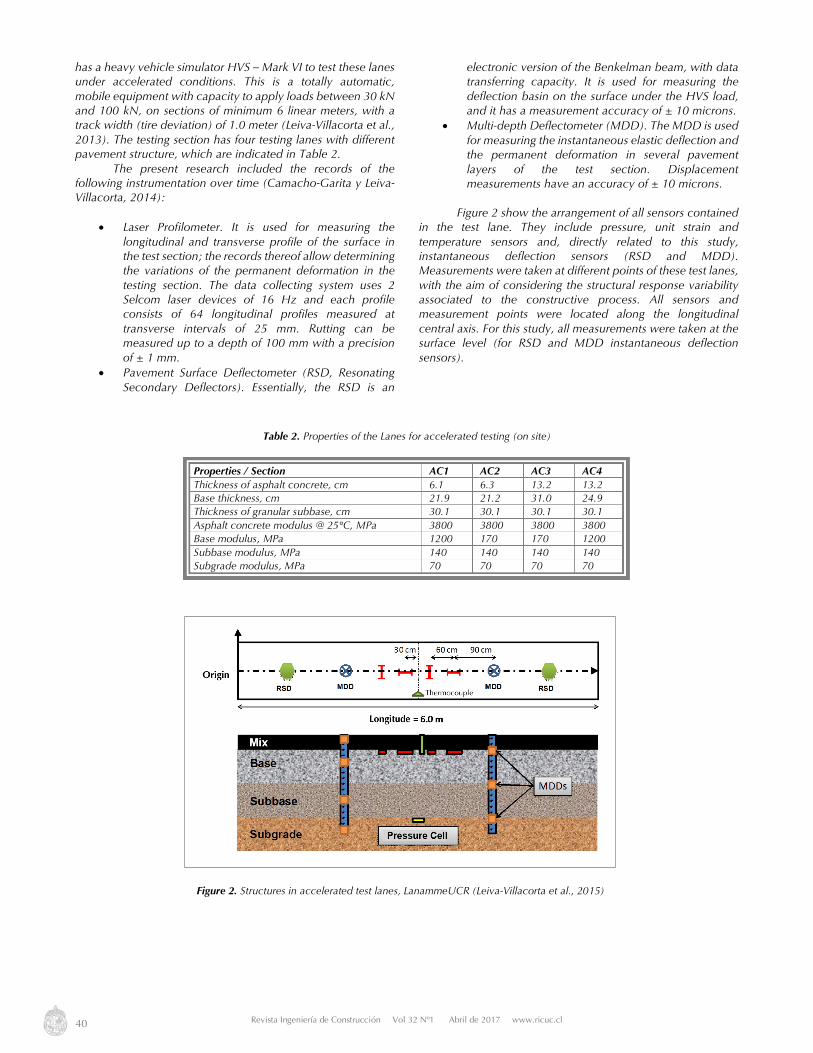
5. Model development To be able to define the overall shape of the model, the behavior of the plastic strain measured on the test lanes was analyzed individually in relation to the number of registered cycles. In order to simplify the model’s field application, the number of 80kN equivalent single axle load repetitions was used (ESAL). Table 3 describes the exact location of the points analyzed along the longitudinal central axis of each test lane, as shown in Figure 2.
Figure 3 shows the behavior trends of plastic strain over time. Consistency was observed in the strain’s expected trend. For example, the section with the highest structural capacity,
AC1, which has cement-stabilized base, presented the smallest deformations. On the contrary, the section with the lowest structural capacity, AC2, evidenced the greatest deformations. The behavior observed from measurements taken on the test lane is comparable to the descriptions in Equations 2 and 3, where a potential plastic strain trend is expected as ESALs increase. A mainly linear trendline was observed and some of the evaluated points showing potential trendlines between strain and ESALs. Figure 4 shows the coefficient of determination for each evaluated point, whose relationship follows generally a linear trendline. Points AC4-P4 and AC4-P6 evidence a low correlation between strain and ESALs, but this is due to the relative magnitude of the strains (lower than 5 mm).
Structure Location in Axis Nomenclature Sensor AC-1
2.0 m AC1-P4 RSD 3.0 m AC1-P6 MDD 5.5 m AC1-P11 RSD
AC-2
1.5 m AC2-P3 RSD 2.5 m AC2-P5 MDD
AC-3
1.5 m AC3-P3 RSD 2.5 m AC3-P5 MDD
AC-4
2.0 m AC4-P4 RSD 3.0 m AC4-P6 MDD 5.5 m AC4-P11 RSD
Table 3. Recording points in accelerated test lanes
Figure 3. Plastic Strains in all Structures vs. ESALs
42 Revista Ingeniería de Construcción Vol 32 Nº1 Abril de 2017 www.ricuc.cl
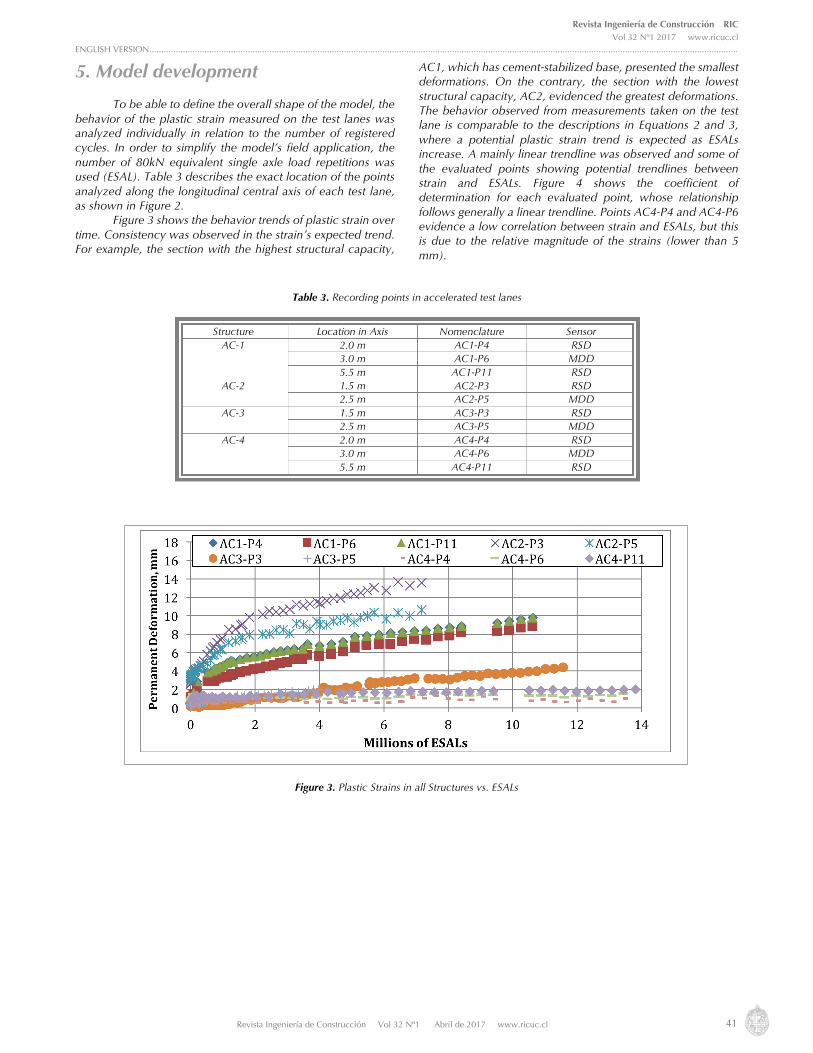
Figure 4 shows the plastic strain behavior trends in terms of surface instantaneous deflections. A mainly exponential trendline was observed with some evaluated points with linear trendlines between strain and deflection (as shown in Table 4).
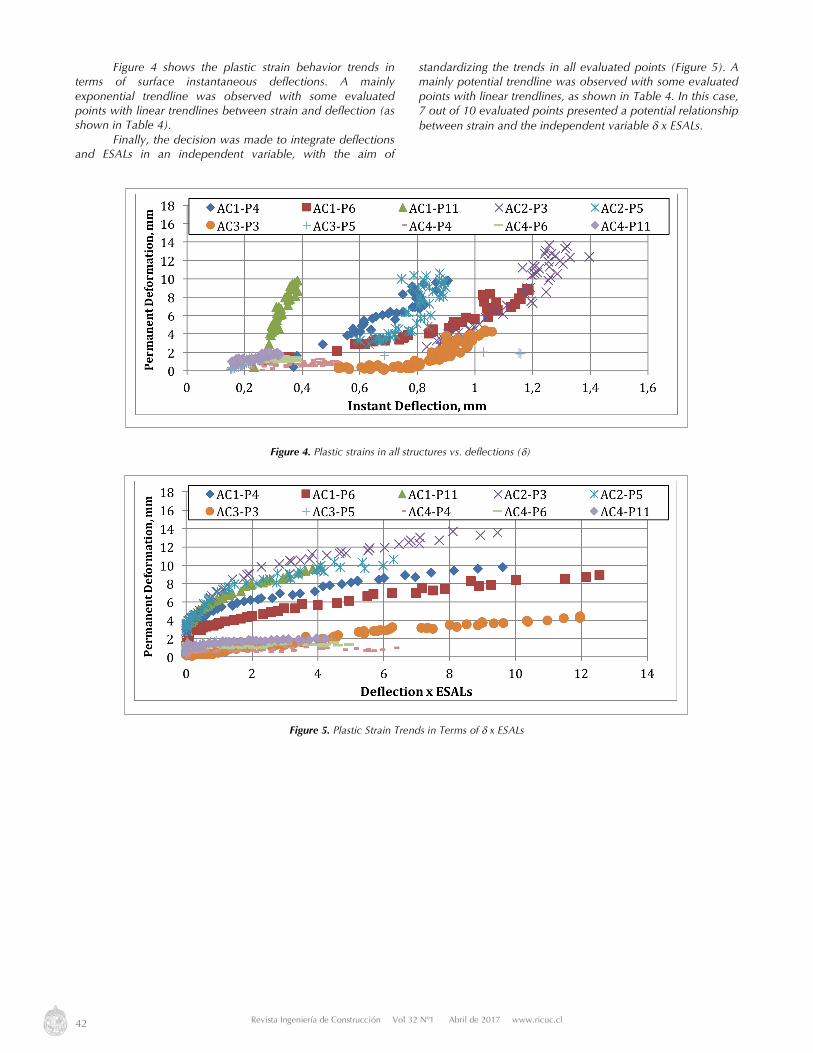
Finally, the decision was made to integrate deflections and ESALs in an independent variable, with the aim of
standardizing the trends in all evaluated points (Figure 5). A mainly potential trendline was observed with some evaluated points with linear trendlines, as shown in Table 4. In this case, 7 out of 10 evaluated points presented a potential relationship between strain and the independent variable d x ESALs.
Figure 4. Plastic strains in all structures vs. deflections (d)
Figure 5. Plastic Strain Trends in Terms of d x ESALs

Revista Ingeniería de Construcción RIC Vol 32 Nº1 2017 www.ricuc.cl
ENGLISH VERSION.....................................................................................................................................................................................................................................................
Revista Ingeniería de Construcción Vol 32 Nº1 Abril de 2017 www.ricuc.cl 43
Based on results shown in Figures 3 to 5 and Table 4, and the available plastic strain observations at different moments over time (ESALs), a time series model was considered, incorporating an auto-regressive parameter on the order of 1 or AR(1), as shown in Equation 7. 𝑅𝐷V = 𝑏&𝑋V)& B+WXBT + 𝑏6𝑋V + 𝑏:ℎ + 𝑏8 (7) In the AR(1) processes, the variable Xt-1 is determined only by the parameter values associated to the previous period (Greene, 2012), where 𝑋V)& = 𝛿×𝐸𝑆𝐴𝐿V)& (8) 𝑋V = 𝑏7ℎ + 𝑏_ 𝐸𝑆𝐴𝐿V + 𝑏3𝑋V)& (9) Where, 𝑅𝐷V = Permanent strain at moment t (mm) ℎ = Thickness of the asphalt mix layer (mm) 𝛿 = Surface deflection at 40 kN, at moment t-1 (mm) 𝐸𝑆𝐴𝐿V)& = Million equivalent axles of 80 kN, at moment t-1 𝐸𝑆𝐴𝐿V = Million equivalent axles of 80 kN expected at moment t This model uses a variable 𝑋V)& which helps to define the rutting trend more clearly in relation to the number of equivalent axles. The first term shows the potential trendline
of the expected behavior, and the rest of the model considers the surface deflection variations over time. Descriptive statistical data used in the model are summarized in Table 5, and Equations 10 to 12 describe the evaluation criteria of the model’s behavior.
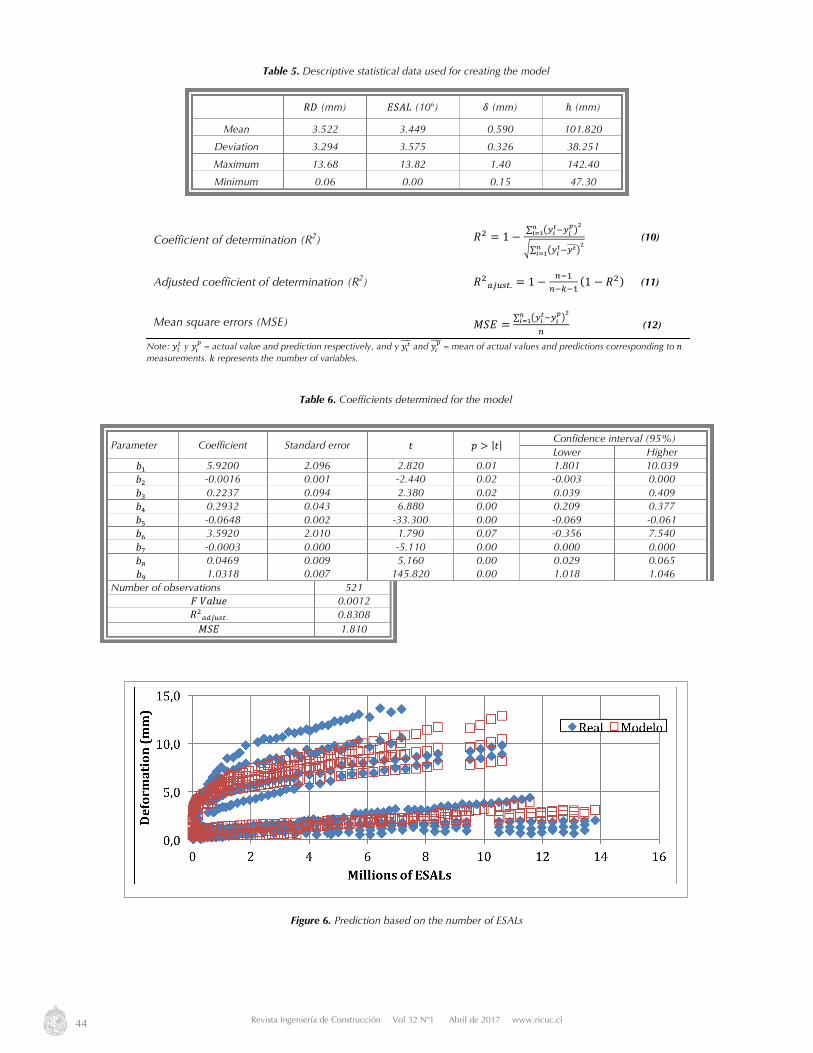
Table 6 shows the results of the regression adjustment, and the calculated values associated to the interference (Hamilton, 2012). Figure 6 shows the model’s result, compared with actual measurements for permanent deformation. This, together with the results shown in Figure 7, allow stating that the model efficiently predicts the expectations of plastic strains over time.
Finally, this model is useful to calculate the remaining service life of the pavement structure by applying the algorithm described in Figure 8. Therefore, it is necessary to know the number of ESALs at the time of taking the measurements (based on traffic data collected periodically by the department of transportation), the measured deflection value and a deflection limit value, for example, 12.5 mm is a limit value commonly used (reference criterion). The remaining service life of the evaluated pavement is obtained by the difference between ESALs estimated in the future and ESALs at the moment of the measurement. It should be noted that maximum rutting allowable is not the only criterion to calculate the remaining service life of flexible pavements and, therefore, the remaining life estimated through the indicated methodology applies for rutting only.
Measurement
vs. ESALs vs. Deflection vs. Deflection x ESALs
Linear Potential Linear Exponencial Lineal Potencial
AC1-P4 0.862 0.973 0.907 0.762 0.832 0.906
AC1-P6 0.947 0.935 0.893 0.966 0.921 0.942
AC1-P11 0.862 0.973 0.802 0.606 0.834 0.961
AC2-P3 0.882 0.855 0.91 0.942 0.865 0.871
AC2-P5 0.873 0.809 0.666 0.732 0.864 0.813
AC3-P3 0.980 0.640 0.758 0.785 0.972 0.652
AC3-P5 0.904 0.845 0.428 0.253 0.506 0.855
AC4-P4 0.218 0.300 0.111 0.126 0.214 0.280
AC4-P6 0.179 0.070 0.030 0.037 0.168 0.06
AC4-P11 0.821 0.830 0.755 0.735 0.803 0.829
Dominant
Trend
X
(6) -
X
(7)
Table 4. Coefficient of determination for analyzed trends
44 Revista Ingeniería de Construcción Vol 32 Nº1 Abril de 2017 www.ricuc.cl
𝑅𝐷 (mm) 𝐸𝑆𝐴𝐿 (106) 𝛿 (mm) ℎ (mm)
Mean 3.522 3.449 0.590 101.820
Deviation 3.294 3.575 0.326 38.251
Maximum 13.68 13.82 1.40 142.40
Minimum 0.06 0.00 0.15 47.30
Table 5. Descriptive statistical data used for creating the model
Coefficient of determination (R2) 𝑅' = 1 −∑ bJc
d)Jcef+g
chi
j∑ bJcd)Jdkkkf
+gchi
(10)
Adjusted coefficient of determination (R2) 𝑅'IlmMV. = 1 − G)&G)S)&
(1 − 𝑅') (11)
Mean square errors (MSE) 𝑀𝑆𝐸 =∑ bJc
d)Jcef+g
chi
G (12)
Note: 𝑦FV y 𝑦F= = actual value and prediction respectively, and y 𝑦pVkkk and 𝑦p
=kkkk = mean of actual values and predictions corresponding to 𝑛 measurements. 𝑘 represents the number of variables.
Parameter Coefficient Standard error 𝑡 𝑝 > |𝑡| Confidence interval (95%) Lower Higher
𝑏& 5.9200 2.096 2.820 0.01 1.801 10.039 𝑏' -0.0016 0.001 -2.440 0.02 -0.003 0.000 𝑏9 0.2237 0.094 2.380 0.02 0.039 0.409 𝑏6 0.2932 0.043 6.880 0.00 0.209 0.377 𝑏: -0.0648 0.002 -33.300 0.00 -0.069 -0.061 𝑏8 3.5920 2.010 1.790 0.07 -0.356 7.540 𝑏7 -0.0003 0.000 -5.110 0.00 0.000 0.000 𝑏_ 0.0469 0.009 5.160 0.00 0.029 0.065 𝑏3 1.0318 0.007 145.820 0.00 1.018 1.046
Number of observations 521 𝐹𝑉𝑎𝑙𝑢𝑒 0.0012 𝑅'I$lmMV. 0.8308 𝑀𝑆𝐸 1.810
Table 6. Coefficients determined for the model
Figure 6. Prediction based on the number of ESALs

Revista Ingeniería de Construcción RIC Vol 32 Nº1 2017 www.ricuc.cl
ENGLISH VERSION.....................................................................................................................................................................................................................................................
Revista Ingeniería de Construcción Vol 32 Nº1 Abril de 2017 www.ricuc.cl 45
Figure 7. Prediction vs. Actual Measurement
Figure 8. Algorithm for determining the remaining service life using the proposed model

46 Revista Ingeniería de Construcción Vol 32 Nº1 Abril de 2017 www.ricuc.cl
6. Conclusions Based on the results of the follow-up of plastic strains in the test lane of the LanammeUCR, it is concluded that the total thickness of different pavement layers placed on the subgrade base have a significant effect on the resistance to plastic strains in flexible pavements. Strains have a potential trendline, with an asymptotic behavior (lower strain rate) and deformations are much smaller in pavements with treated bases.
In relation to those currently available, the presented model offers the advantage of reducing the parameters required to predict the probable plastic strain in the structure. Only three variables are required: thickness of the asphalt layer, surface deflection and equivalent axle repetition. Other
parameters such as resilient or dynamic modulus, unit strains, properties of asphalt mix and environmental conditions are not directly considered in the prediction process; they are envisaged indirectly in the surface deflection of a specific moment. The presented model complies with predicting the plastic strain depth during the pavement’s service life, behaving with (adjusted)R2 equal to 0.831 and a MSE of 1.81.
It is recommended to use the evaluation results of the national road network (measurements of instantaneous deflection and rutting levels), as well as the traffic data obtained from the department of transportation, to calibrate the model. Additionally, it is recommended to implement the model calibrated in the road management system for national highways, so that maintenance and rehabilitation policies of the road management system are applied opportunely.
7. References Avila-Esquivel T., Araya-Porras Y., Aguiar-Moya J.P. y Loria-Salazar L.G (2016), Development of Permanent Deformation Models for Granular
Materials and Soils. Proceedings of the 95th Annual Transportation Research Board, Washington, D.C. 2016. Camacho-Garita E. y Leiva-Villacorta F. (2014), Proceso constructivo PAVELAB. Informe: LM-PI-UMP-027-R1. San José, Costa Rica: Programa de
Infraestructura del Transporte (PITRA). Universidad de Costa Rica. Du J.-C., Shen D.-H. y Cross S. (2008), Pavement Rutting Dynamic Prediction Model. International Jouranl of Pavement Research and Technology,
64-71 FHWA (1978), Predictive Design Procedures, VESYS User manual. Report N FHWA-RD-77-154 Greene W.A. (2011), Econometric Analysis, 7th Edition, Prentice Hall Hamilton L. C. (2012), Statistics with Stata (version 12), 8th Edition, Thomson Books/Cole. Huang Y. (2004), Pavement Analysis and Design. New Jersey, USA: Prentice Hall Leiva-Villacorta F., Aguiar-Moya J.P. y Loria-Salazar L.G. (2015), Ensayos De Desempeño De Laboratorio Del Primer Ensayo Acelerado A Escala
Natural En Costa Rica LM-PI-UMP-053-R1. San José, Costa Rica: Programa Infraestructura del Transporte (PITRA), LanammeUCR. Leiva-Villacorta F., Aguiar-Moya J. P. y Loría-Salazar L. G. (2013), Ensayos acelerados de pavimento en Costa Rica. Revista Infraestructura Vial /
LanammeUCR , 32-41. Leiva-Villacorta F., Aguiar-Moya J.P. y Loría-Salazar L.G. (2015), Accelerated Pavement Testing First Results At The LanammeUCR APT Facility.
Proceedings of the 94th Annual Transportation Research Board, Washington, D.C. 2015. Lytton R., Uzan J., Fernando E., Roque R., Hiltunen D. y Stoffels S. (1993), Development and validation of performance prediction models and
specifications for asphalt binders and paving mixtures. Report SHRP-A-357 National Cooperative Highway Research Program (2004), Guide for Mechanistic - Empirical Design of New and Rehabilitated Pavement
Structures. Illinois: Transportation Research Board Ullidtz P., Harvey J., Kanekanti V., Tsai B.W. y Monismith C. (2008), Calibration of Mechanistic-Empirical Models Using the California Heavy
Vehicle Simulators. Transportation Research Record: Journal of the Transportation Research Board, No. 2087, Transportation Research Board of the National Academies, Washington, D.C., pp. 20–28, 2008.