Assessment for Chemical Contaminants in Northeastern ... 1. PCB and Dioxin Levels in Fish from...
34
Quality Assurance Project Plan Assessment for Chemical Contaminants in Northeastern Washington Area Lakes November 2010 Publication No. 10-03-119
Transcript of Assessment for Chemical Contaminants in Northeastern ... 1. PCB and Dioxin Levels in Fish from...

Quality Assurance Project Plan
Assessment for Chemical Contaminants
in Northeastern Washington Area Lakes November 2010
Publication No. 10-03-119
Publication Information
This plan is available on the Department of Ecology’s website at
www.ecy.wa.gov/biblio/1003119.html.
Data for this project will be available on Ecology’s Environmental Information Management
(EIM) website at www.ecy.wa.gov/eim/index.htm. Search User Study ID, AJOH0063.
Ecology’s Activity Tracker Code for this study is 11-077.
Waterbody Numbers: Multiple lakes in WRIAs 52, 59, 60, 62.
Author and Contact Information
Art Johnson
P.O. Box 47600
Environmental Assessment Program
Washington State Department of Ecology
Olympia, WA 98504-7710
For more information contact: Communications Consultant, phone 360-407-6834.
Washington State Department of Ecology - www.ecy.wa.gov/
o Headquarters, Olympia 360-407-6000
o Northwest Regional Office, Bellevue 425-649-7000
o Southwest Regional Office, Olympia 360-407-6300
o Central Regional Office, Yakima 509-575-2490
o Eastern Regional Office, Spokane 509-329-3400
Any use of product or firm names in this publication is for descriptive purposes only
and does not imply endorsement by the author or the Department of Ecology.
To ask about the availability of this document in a format for the visually impaired,
call 360-407-6834.
Persons with hearing loss can call 711 for Washington Relay Service.
Persons with a speech disability can call 877- 833-6341.
Page 1
Quality Assurance Project Plan
Assessment for Chemical Contaminants in
Northeastern Washington Area Lakes
November 2010
Approved by:
Signature:
Date: November 2010
John Roland, Client, Toxics Cleanup Program, ERO
Signature: Date: October 2010
Mike Hibbler, Regional Manager, Toxics Cleanup Program, ERO
Signature: Date: October 2010
Arianne Fernandez, Client, HWTR Program, ERO
Signature: Date: November 2010
Lisa Brown, Regional Manager, HWTR Program, ERO
Signature: Date: October 2010
Jim Bellatty, Regional Manager, Water Quality Program, ERO
Signature: Date: October 2010
Art Johnson, Project Manager, Toxics Studies Unit, EAP
Signature: Date: October 2010
Dale Norton, Unit Supervisor, Toxics Studies Unit, EAP
Signature: Date: November 2010
Gary Arnold, Section Manager, Eastern Operations Section, EAP
Signature: Date: October 2010
Michael Friese, EIM Data Engineer, EAP
Signature: Date: October 2010 Stuart Magoon, Director, Manchester Environmental Laboratory, EAP
Signature: Date: October 2010 Bill Kammin, Ecology Quality Assurance Officer
Signatures are not available on the Internet version.
EAP: Environmental Assessment Program.
EIM: Environmental Information Management system.
HWTR: Hazardous Waste and Toxics Reduction Program.
ERO: Eastern Regional Office.
Page 2
Table of Contents
Page
List of Figures and Tables....................................................................................................3
Abstract ................................................................................................................................4
Introduction ..........................................................................................................................5
Project Description...............................................................................................................6
Study Design ........................................................................................................................7 Study Area .....................................................................................................................7
Target Chemicals ...........................................................................................................7 Waterbody Selection ......................................................................................................8
Types and Numbers of Samples ..................................................................................11
Timing of Sample Collection .......................................................................................14
Analytical Methods and Detection Limits ...................................................................15 Summary of Study Design ...........................................................................................15
Quality Objectives .............................................................................................................16 Measurement Quality Objectives .................................................................................16
Organization and Schedule ................................................................................................18
Sampling Procedures .........................................................................................................20 Sediment ......................................................................................................................20
Fish ...............................................................................................................................20
Sample Analysis.................................................................................................................22
Quality Control Procedures................................................................................................24 Field .............................................................................................................................24
Laboratory ....................................................................................................................24
Laboratory Cost Estimate ..................................................................................................25
Data Management Procedures ...........................................................................................26
Data Verification ................................................................................................................26
Data Analysis .....................................................................................................................27
Audits and Reports .............................................................................................................27 Audits ...........................................................................................................................27 Reports .........................................................................................................................27
References ..........................................................................................................................28
Appendices .........................................................................................................................30 Appendix A. PCDD, PCDF, and PBDE Congeners Being Analyzed in the
Northeastern Washington Area Lake Study. .........................................31
Appendix B. Acronyms and Units of Measurement ...................................................32
Page 3
List of Figures and Tables
Page
Figures
Figure 1. PCB and Dioxin Levels in Fish from Background Lakes and Rivers in
Washington. ..........................................................................................................5
Figure 2. Waterbodies Being Considered for Sampling in the Northeastern
Washington Area. ..................................................................................................10
Tables
Table 1. Target Chemicals for the Northeastern Washington Area Study. ..........................7
Table 2. Waterbodies Being Considered for Sampling in the Northeastern
Washington Area. ...................................................................................................9
Table 3. Summary of Types and Numbers of Samples to be Analyzed. ..............................15
Table 4. Measurement Quality Objectives: Metals and Ancillary Parameters. ....................16
Table 5. Measurement Quality Objectives: Organic Compounds. .......................................17
Table 6. Organization of Project Staff and Responsibilities. ................................................18
Table 7. Proposed Schedule for Completing Field and Laboratory Work, Data Entry
into EIM, and Reports. ...........................................................................................19
Table 8. Laboratory Procedures: Sediment Samples. ...........................................................22
Table 9. Laboratory Procedures: Fish Tissue Samples. ........................................................23
Table 10. Laboratory Quality Control Samples. ...................................................................24
Table 11. Laboratory Cost Estimate. ....................................................................................25

Page 4
Abstract
Each study conducted by the Washington State Department of Ecology (Ecology) must have an
approved Quality Assurance (QA) Project Plan. The plan describes the objectives of the study
and the procedures to be followed to achieve them. After completing the study, Ecology will
post the final report to the Internet.
This QA Project Plan is for a study to characterize levels of potentially toxic metals and organic
compounds in sediments and fish from selected lakes in the northeastern Washington area. The
data are needed to support cleanup decisions in Ecology’s Eastern Region. Bottom sediments,
fish fillets, and whole fish samples from up to 15 waterbodies will be analyzed for mercury,
other metals, polychlorinated biphenyls (PCBs), polychlorinated dibenzo-p-dioxins and
-dibenzofurans (PCDDs/PCDFs), and polybrominated diphenyl ethers (PBDEs). Sensitive
analytical methods will be used to achieve low detection limits for the target chemicals.

Page 5
Weste
rn W
ash
West
Slope
East Slope
Eastern
Wash
REGION
0
10
20
30
40
50
60
70
80
90
100
Tota
l P
CB
s (
ug/K
g)
Weste
rn W
ash
West
Slope
East Slope
Eastern
Wash
REGION
0.0
0.1
0.2
0.3
0.4
0.5
0.6
0.7
TC
DD
TE
Q (
ng/K
g)
Introduction
In 2007-2008, the Washington State Department of Ecology (Ecology) conducted a statewide
assessment of PCB and dioxin levels in fish from background lakes and rivers in Washington
(Johnson et al., 2010). Ecology needed this information to help prioritize the state’s resources
for cleaning up 303(d) listed waterbodies that do not meet human health criteria specified in the
EPA National Toxics Rule. The study showed that background levels of these chemicals were
often low in the far eastern counties (Figure 1).
Figure 1. PCB and Dioxin Levels in Fish from Background Lakes and Rivers in Washington.
(Fillet data from Johnson et al., 2010; TCDD TEQs are dioxin toxicity equivalents.)
Another Ecology study by Sloan and Blakley (2009) focused on selecting appropriate reference
areas for freshwater sediment investigations. Sloan and Blakley noted a general lack of
information on baseline chemical and biological conditions for aquatic sediments in eastern
Washington.
The regional variability and data gaps came to the attention of Ecology’s Eastern Regional
Office (ERO). ERO’s Toxics Cleanup Program (TCP), Water Quality Program (WQ), and
Hazardous Waste & Toxic Reduction Program (HWTR) expressed concern that the use of
statewide-based background values for decision-making purposes would tend to inappropriately
bias outcomes, particularly for cleanup actions. They saw a need for additional reference data
specific to northeastern Washington. In view of these concerns, TCP, WQ, and HWTR initiated
a project to assess levels for a range of metallic and organic contaminants in fish and sediments
from northeastern Washington area lakes. The results will inform a range of cleanup decisions in
the Eastern Region. TCP, WQ, and HWTR are hereafter collectively referred to as ERO.
Page 6
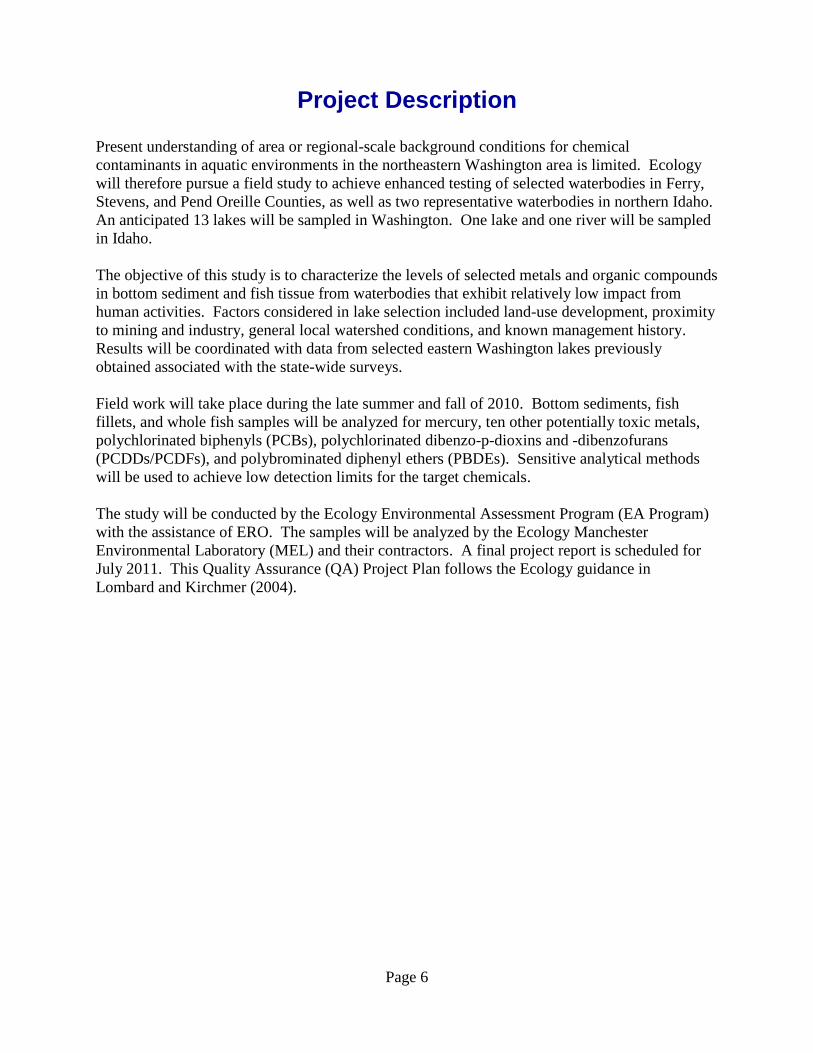
Project Description
Present understanding of area or regional-scale background conditions for chemical
contaminants in aquatic environments in the northeastern Washington area is limited. Ecology
will therefore pursue a field study to achieve enhanced testing of selected waterbodies in Ferry,
Stevens, and Pend Oreille Counties, as well as two representative waterbodies in northern Idaho.
An anticipated 13 lakes will be sampled in Washington. One lake and one river will be sampled
in Idaho.
The objective of this study is to characterize the levels of selected metals and organic compounds
in bottom sediment and fish tissue from waterbodies that exhibit relatively low impact from
human activities. Factors considered in lake selection included land-use development, proximity
to mining and industry, general local watershed conditions, and known management history.
Results will be coordinated with data from selected eastern Washington lakes previously
obtained associated with the state-wide surveys.
Field work will take place during the late summer and fall of 2010. Bottom sediments, fish
fillets, and whole fish samples will be analyzed for mercury, ten other potentially toxic metals,
polychlorinated biphenyls (PCBs), polychlorinated dibenzo-p-dioxins and -dibenzofurans
(PCDDs/PCDFs), and polybrominated diphenyl ethers (PBDEs). Sensitive analytical methods
will be used to achieve low detection limits for the target chemicals.
The study will be conducted by the Ecology Environmental Assessment Program (EA Program)
with the assistance of ERO. The samples will be analyzed by the Ecology Manchester
Environmental Laboratory (MEL) and their contractors. A final project report is scheduled for
July 2011. This Quality Assurance (QA) Project Plan follows the Ecology guidance in
Lombard and Kirchmer (2004).

Page 7
Study Design
Study Area
ERO has defined the study area for this project as encompassing Ferry, Stevens, and Pend
Oreille counties. This region includes or is adjacent to the majority of the cleanup and hazardous
waste sites in northeastern Washington and provides several waterbodies exhibiting relatively
low impact by human activities. Within the study area, however, potential exists for
atmospheric depositional influences caused by historic emissions from smelter operations in
British Columbia.
ERO requested that Upper Priest Lake and the upper St. Joe River in northern Idaho be included
in the study, in view of their natural condition and proximity to Washington. Upper Priest Lake
lies in the Pend Oreille basin. The St. Joe River flows into Lake Coeur D’Alene, which drains to
the Spokane River.
Target Chemicals
The study will analyze the following chemicals of primary concern to ERO (Table 1):
Table 1. Target Chemicals for the Northeastern Washington Area Study.
Antimony
Arsenic
Barium
Cadmium
Chromium
Copper
Iron
Lead
Manganese
Mercury
Zinc
Polychlorinated biphenyls (PCBs; 209 congeners)1
Polychlorinated dibenzo-p-dioxins (PCDDs; 7 congeners)
Polychlorinated dibenzofurans (PCDFs; 10 congeners)
Polybrominated diphenylethers (PBDEs; 36 congeners)
1 The term congener refers to different variants or configurations of a common chemical structure.
All 209 PCB congeners are being analyzed in the present study. The subset of PCDD, PCDF, and
PBDE congeners being analyzed is listed in Appendix A

Page 8
Mercury, cadmium, lead, PCBs, PCDDs, PCDFs, and PBDEs are persistent, bioaccumulative
toxics (PBTs) that are a hazard for fish and other aquatic life, wildlife, and human health
(www.ecy.wa.gov/programs/swfa/pbt). The other metals being analyzed also have toxic
properties and can bioaccumulate but are not classed as PBTs. Detailed profiles on the target
chemicals for this study - describing health effects, physical/chemical properties, production and
use, environmental occurrence, regulations, and analysis methods - have been prepared by the
Agency for Toxic Substances & Disease Registry (www.atsdr.cdc.gov/toxprofiles/index.asp).
This site profiles hazardous substances found at National Priorities List (Superfund) sites.
Ancillary parameters to be analyzed will include total organic carbon (TOC) and grain size in
sediment, and percent lipids in fish tissue. These parameters may be of use in normalizing the
data for comparing contaminant levels between waterbodies.
Waterbody Selection
For purposes of this study, the term “background” denotes a waterbody currently appearing to be
characterized by near-natural conditions or minimally influenced by non-atmospheric human
activities. ERO and the EA Program developed a preliminary list of potential background lakes
by examining Washington state maps and GIS coverages showing population density,
agricultural land use, industrial and municipal outfalls, surface mines, and public lands.
Recommendations were also provided by Bill Baker of the Washington Department of Fish and
Wildlife (WDFW) and Sheri Sears, Resident Division Fish Manager for the Colville
Confederated Tribes. This effort identified lakes that appeared to have a low probability of local
sources of contamination.
The appropriateness of each lake for inclusion in the study was then checked against Ecology’s
Facility Site Identification System, found at www.ecy.wa.gov/fs/index.html). Facility Site
identifies sites known to Ecology as having an active or potential impact on the environment.
Facility Site showed several mines or mining-related sites in the Cedar Lake watershed (Lucky
Four Mine, Redtop Mine, Northport Minerals). It was decided, however, to retain Cedar Lake in
the study following a reconnaissance visit, with the understanding that its appropriateness may
need to be re-evaluated for some target chemicals once the results are in.
Ecology and WDFW staff were contacted to verify that the lakes considered for study had not
been chemically treated to control aquatic plants, algae, or undesirable fish species. Records
showed some of these lakes had been treated with rotenone in the past as part of a WDFW
program to eliminate spiny-rayed fish and rehabilitate the trout fishery. The historic use of
rotenone, a natural product derived from derris root, was not viewed as compromising a lake’s
usefulness for this study.
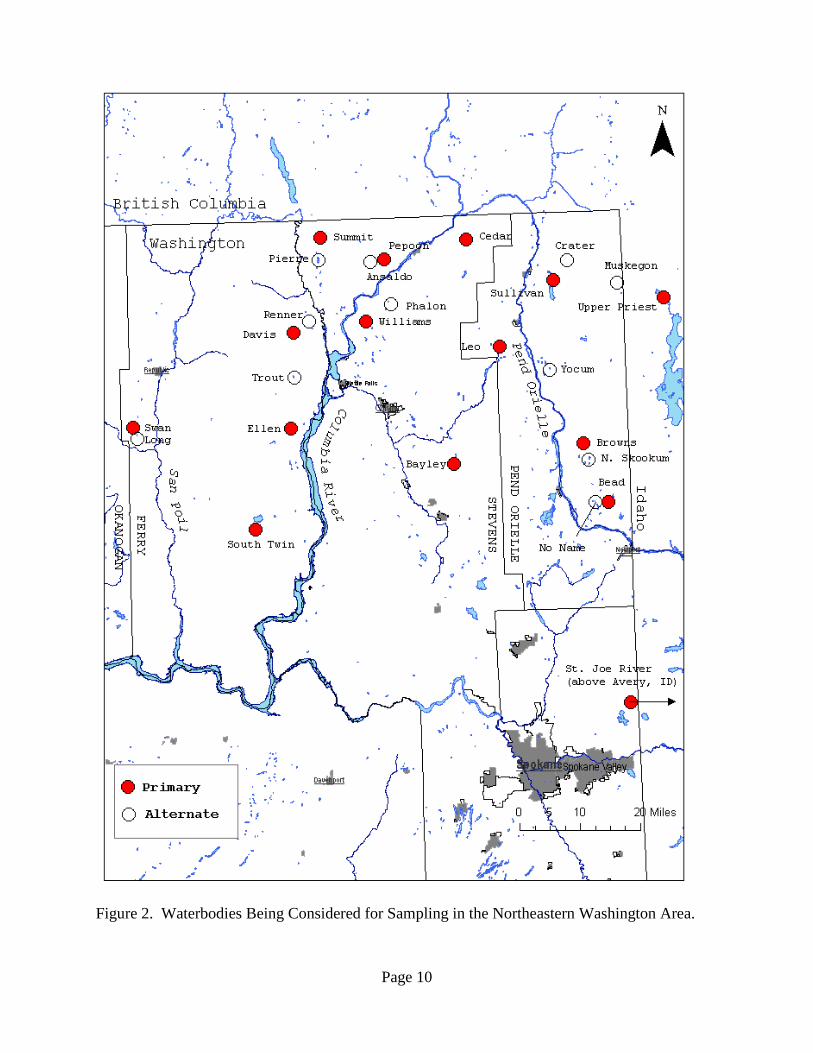
Based on the above evaluations, 26 lakes (15 primary and 11 alternate) were tentatively selected
for the background study (Table 2, Figure 2). Up to 15 of these lakes will ultimately be sampled.

Page 9
Table 2. Waterbodies Being Considered for Sampling in the Northeastern Washington Area.
(Lakes of primary interest in bold font)
Waterbody County WRIA
No.
Elevation
(feet)
Surface
Area
(acres)
Maximum
Depth
(feet)
Latitude Longitude
Swan L
Ferry
52 3,641 52 95 48.512 118.839
Long L 52 3,250 14 58 48.496 118.813
Renner L 52 2,525 9.6 no data 48.781 118.189
Davis L 60 4,550 17 no data 48.739 118.231
Trout L 58 3,000 8 no data 48.627 118.241
Ellen L 58 2,300 78 34 48.501 118.256
South Twin L 58 2,572 973 57 48.264 118.387
Summit L
Stevens
60 2,600 7 no data 48.959 118.127
Pierre L 60 2,012 106 75 48.905 118.139
Cedar L 61 2,135 52 28 48.943 117.594
Pepoon L 60 2,450 11 32 48.901 117.893
Ansaldo L 60 3,050 15 no data 48.897 117.922
Phalon L 61 2,380 23 25 48.784 117.898
Williams L 61 1,980 38 47 48.755 117.968
Bayley L 59 2,400 17 12 48.420 117.664
Crater L
Pend
Oreille
62 4,400 no data no data 48.882 117.262
Sullivan L 62 1,380 1,290 330 48.816 117.292
Muskegon L 62 3,450 7 no data 48.797 117.038
Leo L 62 2,588 39 37 48.648 117.495
Yocum L 62 2,875 42 60 48.613 117.331
Browns L 62 3,450 88 23 48.439 117.191
N. Skookum L 62 3,550 39 20 48.406 117.180
No Name L 62 2,850 18 30 48.297 117.136
Bead L 62 2,850 720 170 48.299 117.116
Upper Priest L Bonner Idaho 2,441 1,338 no data 48.786 116.889
St. Joe R Clearwater Idaho na na na above Avery
WRIA: Water Resource Inventory Area.
na: not applicable.
Page 10
Figure 2. Waterbodies Being Considered for Sampling in the Northeastern Washington Area.

Page 11
An attempt was made to distribute the sampling effort more or less evenly across the study area,
although this was not always possible. Most of the lakes lie in a north-south gradient along the
Columbia and Pend Oreille rivers. More emphasis was placed on lakes near the Columbia due to
significant transboundary pollution issues.
Size was not an important factor in selecting the lakes, absence of local pollutant sources and
geographic location being considered more important. Larger lakes tend to have longer food
chains which may result in some species attaining higher levels of bioaccumulative chemicals in
their tissues.
Elevation was generally applied in order to select waterbodies in non-mountainous zones, since
Ecology regulatory cleanup actions are rarely associated with alpine locations. High mountain
lakes are subject to enhanced atmospheric deposition of synthetic organic compounds due to
colder temperatures and larger amounts of precipitation (Wania and Mackay, 1993; Gillian and
Wania, 2005). High lakes also typically have a low diversity of fish species.
The present study will sample a diverse range of lake sizes and elevations to obtain an area-wide
estimate of the chemical background. The lakes selected for study range in size from less than
10 to over 1,000 acres, with maximum depths of 12 to 180 feet. Elevations are between about
2,000 and 4,500 feet.
Appropriate background lakes could not be located in the southern parts of Ferry and Stevens
counties, which are more highly developed. Northwestern Ferry County is lacking in lakes of
significant size except for Curlew Lake which has sources related to mining, recreation, and
other development.
Prior to initiating the field sampling program, each lake will be investigated in more detail and a
final selection of 15 waterbodies made for the study. This will include:
Searching for existing chemical data in Ecology’s Environmental Information Management
system (EIM).
Obtaining aerial and bathymetric maps of each waterbody.
Identifying location and condition of boat ramps or other means of access.
Further contacts with regional biologists.
Determining what fish species are present.
Reviewing fish stocking history.
Obtaining required permits and verifying they allow collection of species of interest.
Field reconnaissance where appropriate.

Page 12
Types and Numbers of Samples
ERO has requested data on bottom sediments and fish tissue from each waterbody. The rationale
for the specific types and numbers of samples to be collected follows.
Bottom Sediments
Sediment samples will be taken of the top10 cm layer. This layer is generally considered to
include the biologically active zone (Ecology, 2008; Blakley, 2008).
To enhance representativeness of the data, each sediment sample will be a composite of three
separate grabs. The grabs will be taken at three different lake depths: shallow, mid-depth, and
maximum depth. The grabs will be placed along a longitudinal transect, with the shallow and
mid-depth samples being taken at approximately 1/3 and 2/3 of the maximum lake depth. The
samples will be collected away from lake inflows, boat launches, cabins, camp sites, and other
such disturbances.
Sediment samples from the upper St. Joe, the only river in the study, will likewise consist of a
composite from three separate locations. These will be taken from areas where deposits of sand
and finer material occur, selected in such a way as to avoid bank-sloughed material and local
tributary inputs. Because bed sediments in a river are continually mixed, it is not critical to
adhere to a 10 cm depth increment.
The sediment samples will be analyzed for all target chemicals (see Table 1).
The budget for this project allows for one composite sediment sample to be analyzed for each
waterbody. The selected waterbodies would be expected to exhibit relatively uniform chemical
conditions. Thus, a single composite sample as planned should be representative of sediment
quality in support of this regional assessment. Chemical gradients are potentially generated by
sediment from inflows to a lake. This is being taken into account by avoiding sampling at inlets
and by compositing from several depths and locations.
Fish Tissue
The study will analyze fish fillets and whole fish. Fillet data are typically more appropriate for
comparative assessments associated with human health concerns. Whole fish data are applicable
to ecological risk assessment.
An attempt will be made to collect two predator and one bottom-feeder species from each
waterbody, with a focus, in part, on popular food fish. This is EPA’s recommended approach for
initial screening of contaminant levels in lakes and rivers (EPA, 2000). Use of fish from two
distinct ecological groups as target species reflects a range of habits, feeding strategies, and
physiological factors that can result in differences in bioaccumulation of contaminants.
Predators, for example, may have higher levels of chemicals that biomagnify. Bottom-feeders
may be elevated in chemicals they come in contact with through the sediments.

Page 13
Fillets will be analyzed from both predators and bottom-feeders, depending on the number and
type of species encountered in a given lake. Bottom-feeding species are preferred for whole
body samples due to anticipated higher levels of some of the constituents being analyzed
(discussed further below).
Each sample will consist of a composite of pooled tissues from up to five individual fish.
Composite samples provide a more cost-efficient estimate of mean contaminant concentrations
than single fish samples.
The fish species known to occur in northeastern Washington lakes (excluding very small species)
are listed below (Sears, 2010). The species listed in bold font are most commonly analyzed in
fish tissue studies in the Pacific Northwest and are preferred for the present study.
Eastern Brook Trout (P) Smallmouth Bass (P)
Rainbow Trout (P) Pumpkinseed (P)
Brown Trout (P) Bluegill (P)
Cutthroat Trout (P) Yellow Perch (P)
Kokanee (P) Tench (B)
Lahontan Cutthroat Trout (P) Carp (B)
Pygmy Whitefish (P) Largescale Sucker (B)
Lake Whitefish (P) Bridgelip Sucker (B)
Mountain Whitefish (upper St. Joe River only)
(P)
Peamouth (B)
Northern Pike Minnow (P)
Chiselmouth (B)
Largemouth Bass (P)
Brown Bullhead (B)
P - predator, B - bottom-feeder
Although the species list is relatively long, difficulties are likely to be encountered in obtaining
both a predator and a bottom-feeder at all sites. This is especially true for some of the smaller
lakes which have been managed as a trout monoculture. Where a bottom-feeder cannot be
caught, a predator species should be substituted. Wild fish will be preferred.
Planted fish have been shown to accumulate PCBs and other target chemicals during hatchery
rearing (e.g., Serdar et al., 2006). Because the chemical residues may not be representative of
the surrounding environment, planted fish will only be analyzed as a last resort and then only if
planted as small fish which then resided in that waterbody for at least one year.
Due to the likely event that the desired sample size will not be achieved for all lakes, the field
crew should retain three or four species from each lake whenever possible. A decision on which
species to analyze and whether fillet or whole will be made after the fish collection is completed.
Differences in chemical concentrations due to age and size class are of interest in this study.
Therefore, an effort will be made to collect two distinct size classes when the opportunity
presents itself. A decision on which samples to analyze by size class will be made after the fish
collection is completed.

Page 14
The fillets will be analyzed for mercury and the complete suite of organic compounds. Metals
analysis of the fillets is being limited to mercury because fish muscle is a poor accumulator for
the other metals of concern in this study. Whole fish, on the other hand, are indicators for a
range of metals (e.g., Lowe et al., 1985). The metals to be analyzed in whole fish will include
arsenic, cadmium, copper, lead, mercury, and zinc.
For budget reasons, organics analyses are not currently planned for whole fish. If fewer fish or
sediment samples are collected than planned for the study, organic compounds will be analyzed
in selected whole fish samples, with PCBs being the first priority. Excess from all project
samples will be archived frozen in the event that other analyses are wanted in the future.
The budget for this project assumes two fish fillet and one whole fish sample will be analyzed
for each waterbody. This sample size is comparable to other fish tissue surveys that have
assessed levels of chemical contaminants over a large number of waterbodies (Lowe et al., 1985;
Schmitt et al., 1990; EPA, 1992, 2009; Seiders and Deligeannis, 2009).
Timing of Sample Collection
ERO requires that this project be completed by July 2011. This stipulation, coupled with the
timing of the project request, dictates that the field work be conducted during the September –
October 2010 timeframe.
A late summer-fall sampling program is appropriate for this type of study. Seasonality is not a
concern for the sediment task. The 10 cm depth increment being analyzed will cover a
depositional history spanning multiple years. Most surveys for chemical contaminants in
resident Pacific Northwest freshwater fish are conducted during late summer or fall. This is
done primarily for reasons of logistics and endangered species concerns (high summer water
temperatures), and to include the recreational fishing season (generally April – October for
eastside lakes).
The literature does not provide clear and consistent conclusions about seasonal cycles of
chemical contaminants in fish. Several researchers have recommended that fish be sampled for
mercury during the summer or fall when uptake is most rapid and methylmercury production
greatest (e.g., Cope et al., 1990; Slotton et al., 1995). Others have found the highest mercury
levels in the spring (Ward and Neumann, 1999).
The organic compounds being analyzed are lipophilic, although many fish tissue studies have
failed to find a correlation between bioaccumulative organic compounds and lipid (fat) content
(Herbert and Keenleyside, 1995; Stow et al., 1997). During late summer and fall, spring
spawners are rebuilding their lipid reserves and the winter spawners are approaching their
highest lipid levels. In terms of an overall species average, late summer-fall probably represents
a period of generally elevated lipid levels. Percent lipids are being determined for all samples
analyzed for organic compounds.

Page 15
Seasonal differences for metals and organic compounds in fish can often be attributed to an
age/size effect. As previously described, the study will obtain some estimates of the importance
of these factors by sampling different age classes in several lakes.
Analytical Methods and Detection Limits
Low-level methods will be used to minimize the number of non-detects in the data.
Metals will be analyzed by MEL using inductively-coupled plasma/mass spectrometry (ICP/MS)
and cold vapor atomic absorbance techniques (CVAA, mercury). Reporting limits are
anticipated to be in the range of 0.005 mg/Kg for mercury and 0.l - 0.5 mg/Kg for other metals,
except 2.5 mg/Kg for iron and 5 mg/Kg for zinc. These reporting limits should allow
concentrations of target metals to be quantified in all or nearly all sediment and tissue samples
(Sloan and Blakley, 2009; Seiders, 2010; Dowling, 2010).
The organic compounds will be analyzed by MEL contract laboratories using high resolution gas
chromatography/mass spectrometry (HR-GC/MS). The contract will require detection limits
down to 20 ng/Kg for PCBs, 0.03 ng/Kg for PCDDs/PCDFs, and 2 ng/Kg for PBDEs, depending
on the congener in question. These are the lowest detection limits currently available through
laboratories accredited by Ecology for these methods. Concentrations will be reported down to
the detection limit, with concentrations between the detection and quantitation limits being
reported as estimates (J flag). Based on other Ecology sediment and fish tissue investigations, a
minimal number of non-detects is anticipated (Johnson et al., 2010; Sloan and Blakley, 2009;
Seiders, 2010; Dowling, 2010).
Summary of Study Design
Table 3. Summary of Types and Numbers of Samples to be Analyzed.
Sample
Type
Number of
Waterbodies
Number of
Composite
Samples Mer
cury
Met
als
(10)*
Met
als
(5)†
PC
Bs
PC
DD
s
PC
DF
s
PB
DE
s
TO
C
Gra
in S
ize
Lip
ids
Sediment 15 15
Fish Fillets 15 30
Whole Fish 15 15
*Sb, As, Ba, Cd, Cr, Cu Fe, Pb, Mn, Zn
†As, Cd, Cu, Pb, Zn

Page 16
Quality Objectives
Quality objectives for this project are to obtain data of sufficient quality so that uncertainties are
minimized and results are comparable to similar data from other studies. Achieving low
detection limits is of particular importance for a successful study outcome. These objectives will
be achieved through careful attention to the sampling, measurement, and quality control (QC)
procedures described in this plan.
Measurement Quality Objectives
MEL and their contractors are expected to meet all QC requirements of the analytical methods
being used for this project. Specific measurement quality objectives (MQOs) selected for the
project are shown in Tables 4 and 5. These MQOs correspond to MEL’s QC limits (metals and
ancillary parameters) or the acceptance limits specified in the analytical methods (organic
compounds). The lowest concentrations of interest shown in the tables are the lowest currently
attainable by MEL and its contract laboratories. Data outside these MQOs will be evaluated for
appropriate corrective action.
Table 4. Measurement Quality Objectives: Metals and Ancillary Parameters.
(Analyses by MEL.)
Analysis
Laboratory
Control
Samples
(recovery)
Laboratory
Duplicates
(RPD)
Matrix
Spikes
(recovery)
Matrix
Spike
Duplicates
(recovery)
Lowest Concentration
of Interest
(tissue, ww) (sediment, dw)
Antimony 85-115% ±20% 75-125% ±20% NA 0.05 mg/Kg
Arsenic 85-115% ±20% 75-125% ±20% 0.1 mg/Kg 0.1 mg/Kg
Barium 85-115% ±20% 75-125% ±20% NA 0.1 mg/Kg
Cadmium 85-115% ±20% 75-125% ±20% 0.01 mg/Kg 0.05 mg/Kg
Chromium 85-115% ±20% 75-125% ±20% NA 0.5 mg/Kg
Copper 85-115% ±20% 75-125% ±20% 0.1 mg/Kg 0.1 mg/Kg
Iron 85-115% ±20% 75-125% ±20% NA 2.5 mg/Kg
Lead 85-115% ±20% 75-125% ±20% 0.05 mg/Kg 0.05 mg/Kg
Manganese 85-115% ±20% 75-125% ±20% NA 0.5 mg/Kg
Mercury 80-120% ±20% 75-125% ±20% 0.02 mg/Kg 0.005 mg/Kg
Zinc 85-115% ±20% 75-125% ±20% 5 mg/Kg 5 mg/Kg
Percent Lipids 80-120% ±20% NA NA 0.1% NA
Total Organic
Carbon 80-120% ±20% NA NA NA 0.1%
Grain Size na ±15% NA NA NA 1%
RPD: relative percent difference.
NA: not analyzed or not applicable.
ww: wet weight.
dw: dry weight.
mg/Kg: parts per million.

Page 17
Table 5. Measurement Quality Objectives: Organic Compounds.
(Analyses by accredited contract laboratories.)
Analysis
Laboratory
Control
Samples
(recovery)
Laboratory
Duplicates
(RPD)
Labeled
Compound
Recovery
(%)
Lowest
Concentration
of Interest
PCBs 50-150% ±20% 25-150%* 20 ng/Kg
PCDDs 50-150% ±20% 25-164%† 0.03 ng/Kg
PCDFs 50-150% ±20% 24-169%** 0.03 ng/Kg
PBDEs 50-150% ±20% 25-150%†† 2 ng/Kg
*Applies to most congeners, see EPA Method 1668A.
†Applies to 2,3,7,8-TCDD; other congeners as per EPA Method 1613.
**Applies to 2,3,7,8-TCDF; other congeners as per EPA Method 1613.
††Except 20-200% for 13
C12DeBDE; see EPA Method 1614.
RPD: relative percent difference.
ng/Kg: parts per trillion.
Laboratory control samples contain known amounts of analyte and indicate bias due to sample
preparation and/or calibration. Results on laboratory duplicates (split samples) provide estimates
of analytical precision. Matrix spikes may indicate bias due to matrix effects and provide an
estimate of the precision of the results. The organics analyses will be done by isotopic dilution
methods where each sample is spiked with labeled congeners. The concentration of target
compounds is corrected for recovery of labeled congeners (some congeners are quantitated by an
internal standards technique).

Page 18
Organization and Schedule
The following people will contribute to this project. All are Ecology employees.
Table 6. Organization of Project Staff and Responsibilities.
Staff Title Responsibilities
John Roland
Toxics Cleanup Program
ERO
Phone: (509) 329-3581
TCP ERO Client
Clarifies scope of the project. Provides internal
review of the QAPP and approves the final QAPP.
Reviews project report.
Arianne Fernandez
HWTR Program
ERO
Phone: (509) 329-3498
HWTR ERO Client Provides internal review of the QAPP and approves
the final QAPP. Reviews project report.
Art Johnson
Toxics Studies Unit
SCS, EAP
(360) 407-6766
Project Manager
Writes the QAPP. Oversees field and laboratory
work. Conducts QA review of data, analyzes and
interprets data. Writes the draft and final report.
Michael Friese
Toxics Studies Unit
SCS, EAP
(360) 407-6737
Field Lead, EIM
Data Engineer Leads field work. Enters project data into EIM.
Casey Deligeannis
Toxics Studies Unit
SCS, EAP
(360) 407-7395
Field Lead Assists with field work.
Dale Norton
Toxics Studies Unit
SCS, EAP
(360) 407-6765
Unit Supervisor for
the Project Manager
Provides internal review of the QAPP. Approves the
budget and approves the final QAPP. Reviews
project report.
Gary Arnold
Eastern Operations Section,
EAP
(509) 454-4244
Section Manager for
the Study Area
Reviews the project scope and budget. Tracks
progress, reviews the draft QAPP, and approves the
final QAPP.
Stuart Magoon
Manchester Environmental
Laboratory
Phone: (360) 871-8801
Director Approves the final QAPP.
William R. Kammin
Phone: (360) 407-6964
Ecology Quality
Assurance
Officer
Reviews the draft QAPP and approves the final
QAPP.
ERO: Eastern Regional Office.
TCP: Toxics Cleanup Program.
SCS: Statewide Coordination Section.
EAP: Environmental Assessment Program.
HWTR: Hazardous Waste and Toxics Reduction.
EIM: Environmental Information Management database.
QAPP: Quality Assurance Project Plan.

Page 19
Table 7. Proposed Schedule for Completing Field and Laboratory Work, Data Entry into EIM,
and Reports.
Field and laboratory work Due date Lead staff
Field work completed October 2010 Michael Friese
Laboratory analyses completed February 2011
Environmental Information System (EIM) database
EIM user study ID AJOH0063
Product Due date Lead staff
EIM data loaded May 2011 Michael Friese
EIM quality assurance June 2011 Dale Norton
EIM complete July 2011 Michael Friese
Final report
Author lead / Support staff Art Johnson
Schedule
Draft due to supervisor April 2011
Draft due to client/peer reviewer May 2011
Final (all reviews done)
due to publications coordinator June 2011
Final report due on web July 2011

Page 20
Sampling Procedures
Sediment
Sediment collection and handling will follow the EAP SOP for freshwater sediment samples
(Blakley, 2008). The lake samples will consist of composites of three grabs taken with a 0.02 m2
Ponar sampler. A grab will be considered acceptable if not over-filled with sediment, overlying
water is present and not excessively turbid, the sediment surface is relatively flat, and the desired
depth penetration has been achieved. Stainless steel scoops will be used to sample sediments
from the upper St. Joe River.
For Ponar collected samples, overlying water will be siphoned off and the top 10 cm of sediment
removed with a stainless steel scoop, placed in a stainless steel bowl, and homogenized by
stirring. Material touching the side walls of the grab will not be taken. The scoop samples from
the upper St. Joe will be homogenized in the same way.
Subsamples of the homogenized sediment will be put into 4 oz. glass jars (Teflon lid liners) that
have been cleaned to EPA (1990) QA/QC specifications and placed on ice immediately upon
collection. The samples will be returned to Ecology headquarters and held frozen until transport
with chain-of-custody record to MEL.
Stainless steel implements used to collect and manipulate the sediments will be cleaned by
washing with Liquinox detergent, followed by sequential rinses with tap water, deionized water,
and pesticide-grade acetone. The equipment will then be air dried and wrapped in aluminum
foil. Between-sample cleaning of the Ponar at each lake will consist of thorough brushing with
on-site water.
Field data to be collected in conjunction with sediment sampling are to include date, sample site
description, latitude and longitude, water depth, penetration depth of the grab, and observations
on the type of material obtained.
Fish
Fish will be collected by electroshocking, gill nets, or hook and line, following the EA Program’s
SOP for fish collection (Sandvik, 2006a). To the extent possible, only those fish large enough to
reasonably be retained for consumption will be taken.
Field data to be collected in conjunction with fish sampling are to include date, sample site
description, latitude and longitude, and collection method.
Fish selected for analysis will be killed by a blow to the head. Each fish will be given a unique
identifying number and its length and weight recorded. The fish will be individually wrapped in
aluminum foil, put in plastic bags, and placed on ice for transport to Ecology headquarters,
where the samples will be frozen pending preparation of tissue samples.

Page 21
Tissue samples will be prepared by the study team at Ecology headquarters following the
EA Program’s SOP for resecting finfish (Sandvik, 2006b). Techniques to minimize potential
sample contamination will be used. People preparing the samples will wear non-talc nitrile
gloves and work on heavy duty aluminum foil or a polyethylene cutting board. The gloves and
foil will be changed between samples; the cutting board will be cleaned between samples as
described below.
The fish will be thawed enough to remove the foil wrapper and rinsed with tap water, then
deionized water to remove any adhering debris. For fillet samples, the fish will be scaled and the
entire fillet from one or both sides removed with stainless steel knives and homogenized to
uniform color and consistency in a Kitchen-Aid blender. The fillets will be analyzed skin-on.
For whole body samples, the fish will be rinsed with tap water and deionized water and
homogenized in a Hobart commercial grinder.
The sex of each fish will be recorded. The homogenates will be placed in precleaned 4 oz. glass
jars (Teflon lid liners) cleaned to EPA (1990) QA/QC specifications. The tissue samples will be
refrozen for later shipment to MEL. Excess will be retained for all samples and archived frozen
at Ecology headquarters.
Each tissue sample will be a composite of up to five individual fish. To the extent possible, the
length of the smallest fish in a composite will be no less than 75% of the length of the largest fish
(EPA, 2000). The composites will be prepared using equal weights from each fish.
Cleaning of resecting instruments, cutting boards, and blender/grinder parts will be done by
washing in tap water with Liquinox detergent, followed by sequential rinses with tap water, de-
ionized water, and pesticide-grade acetone. The items will then be air dried on aluminum foil in
a fume hood before use.

Page 22
Sample Analysis
Tables 8 and 9 show the anticipated number of sediment and fish samples to be analyzed,
expected range of results, required reporting limits, and analysis methods to be used for the
background study.
As previously noted, MEL will analyze metals and ancillary parameters. Organic compounds
will be analyzed by accredited contract laboratories selected by MEL.
Table 8. Laboratory Procedures: Sediment Samples.
Analysis Number
of Samples
Expected Range
of Results
Reporting
Limit
Analytical
Method
Antimony 15 0.1-0.5 mg/Kg 0.1 mg/Kg EPA 200.8
Arsenic 15 1-10 mg/Kg 0.1 mg/Kg EPA 200.8
Barium 15 50-200 mg/Kg 0.1 mg/Kg SW 6010
Cadmium 15 0.1-1 mg/Kg 0.1 mg/Kg EPA 200.8
Chromium 15 10-50 mg/Kg 0.5 mg/Kg EPA 200.8
Copper 15 1-50 mg/Kg 0.1 mg/Kg EPA 200.8
Iron 15 5,000-50,000 mg/Kg 2.5 mg/Kg SW 6010
Lead 15 1-50 mg/Kg 0.1 mg/Kg EPA 200.8
Manganese 15 100-500 mg/Kg 0.5 mg/Kg SW 6010
Mercury 15 0.005 - 0.1 mg/Kg 0.005 mg/Kg EPA 245.5
Zinc 15 20-100 mg/Kg 5 mg/Kg EPA 200.8
PCBs 15 20 - 200 ng/Kg 20 ng/Kg* EPA 1668A
PCDDs/PCDFs 15 <0.03 - 1 ng/Kg 0.03 ng/Kg* EPA 1613B
PBDEs 15 2-20 ng/Kg 2 ng/Kg* EPA 1614
Total Organic Carbon 15 0.1-10% 0.1% PSEP-TOC
Grain Size 15 10-90% fines 1% PSEP (1986)
*Varies with congener.
mg/Kg: parts per million.
ng/Kg: parts per trillion.

Page 23
Table 9. Laboratory Procedures: Fish Tissue Samples.
Analysis Number
of Samples
Expected Range
of Results
Reporting
Limit
Analytical
Method
Arsenic 15 0.1 - 0.5 mg/Kg 0.1 mg/Kg EPA 200.8
Cadmium 15 0.05 - 0.1 mg/Kg 0.05 mg/Kg EPA 200.8
Copper 15 0.1 - 1 mg/Kg 0.1 mg/Kg EPA 200.8
Lead 15 0.05 - 1 mg/Kg 0.05 mg/Kg EPA 200.8
Mercury 45 0.02 - 0.5 mg/Kg 0.02 mg/Kg EPA 245.5
Zinc 15 5-50 mg/Kg 5 mg/Kg EPA 200.8
PCBs 30 20 - 3,000 ng/Kg 20 ng/Kg* EPA 1668A
PCDDs/PCDFs 30 <0.03 - 1 ng/Kg 0.03 ng/Kg* EPA 1613B
PBDEs 30 2-20 ng/Kg 2 ng/Kg* EPA 1614
Percent lipids 30 0.1-10% 0.1% MEL SOP
#730009
*Varies with congener.
mg/Kg: parts per million.
ng/Kg: parts per trillion.
Page 24
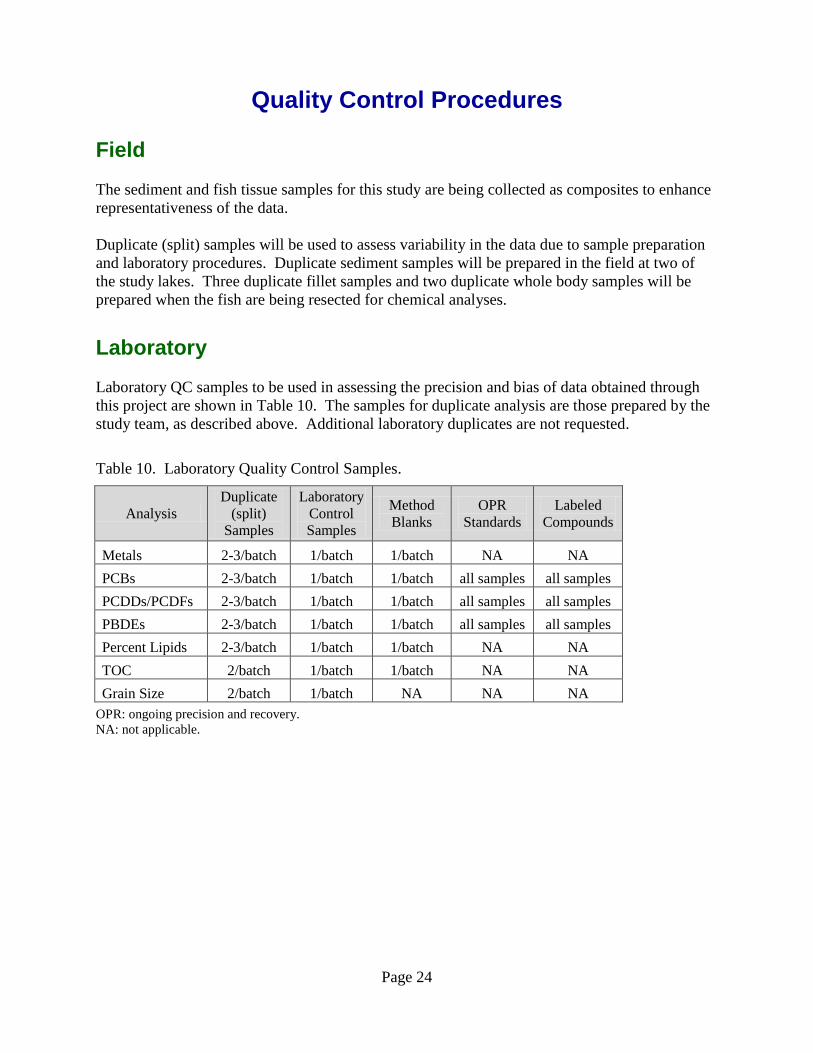
Quality Control Procedures
Field
The sediment and fish tissue samples for this study are being collected as composites to enhance
representativeness of the data.
Duplicate (split) samples will be used to assess variability in the data due to sample preparation
and laboratory procedures. Duplicate sediment samples will be prepared in the field at two of
the study lakes. Three duplicate fillet samples and two duplicate whole body samples will be
prepared when the fish are being resected for chemical analyses.
Laboratory
Laboratory QC samples to be used in assessing the precision and bias of data obtained through
this project are shown in Table 10. The samples for duplicate analysis are those prepared by the
study team, as described above. Additional laboratory duplicates are not requested.
Table 10. Laboratory Quality Control Samples.
Analysis
Duplicate
(split)
Samples
Laboratory
Control
Samples
Method
Blanks
OPR
Standards
Labeled
Compounds
Metals 2-3/batch 1/batch 1/batch NA NA
PCBs 2-3/batch 1/batch 1/batch all samples all samples
PCDDs/PCDFs 2-3/batch 1/batch 1/batch all samples all samples
PBDEs 2-3/batch 1/batch 1/batch all samples all samples
Percent Lipids 2-3/batch 1/batch 1/batch NA NA
TOC 2/batch 1/batch 1/batch NA NA
Grain Size 2/batch 1/batch NA NA NA
OPR: ongoing precision and recovery.
NA: not applicable.

Page 25
Laboratory Cost Estimate
A cost estimate for the laboratory analyses being conducted for this project is provided in Table
11. The contract laboratory prices shown for organic compounds are based on past studies.
Actual prices will be set by bids.
Table 11. Laboratory Cost Estimate.
Matrix/Analysis Samples QC Cost Subtotals
Sediment
TOC 15 2 35 595
Grain Size 15 2 90 1,530
Metals (10) 15 2 168 2,856
Mercury 15 2 50 850
PCB Congeners 15 2 800 13,600
PCDDs/PCDFs 15 2 700 11,900
PBDEs 15 2 800 13,600
44,931
Fish Fillets
% Lipids 30 3 85 2,805
Mercury 30 3 48 1,584
PCB Congeners 30 3 800 26,400
PCDDs/PCDFs 30 3 700 23,100
PBDEs 30 3 800 26,400
80,289
Whole Fish
Mercury 15 2 48 816
As, Cd, Pb, Zn, Cu 15 2 118 2,006
2,822
Total Lab = $128,042
These costs include the 50% discount for MEL. MEL’s 25% surcharge for contracting and data
review is included in the per sample cost for organics.

Page 26
Data Management Procedures
Field data will be recorded in a bound notebook of waterproof paper.
The data packages from contract laboratories will include case narratives discussing any
problems encountered with the analyses, corrective actions taken, changes to the referenced
method, and an explanation of data qualifiers. The narrative should address condition of the
samples on receipt, holding time, methods of analysis, sample preparation, instrument
calibration, recovery data, and results on QC samples. This information is needed to evaluate the
accuracy of the data and to determine whether the MQOs were met.
The contract laboratory will provide the sample results to MEL in Excel spreadsheet format and
include calculation of PCB homologue totals, total PCBs, and TEQs for PCDDs/PCDFs. TEQs
will be calculated using the TEFs (toxic equivalency factors) in Van den Berg et al. (1998).
MEL will provide results and case narratives for their analyses following MEL standard
procedures.
All project data will be entered into Ecology’s Environmental Information Management System
(EIM). Data entered into EIM follow a formal data review procedure where the data are
reviewed by the project lead, the person entering the data, and an independent reviewer.
Data Verification
MEL will conduct a review of all contract laboratory data and case narratives. MEL will verify
that methods and protocols specified in this QA Project Plan were followed; that all calibrations,
checks on quality control, and intermediate calculations were performed for all samples; and that
the data are consistent, correct, and complete, with no errors or omissions. Evaluation criteria
will include the acceptability of holding times, procedural blanks, calibration, matrix spike
recoveries, labeled compound and internal standard recoveries, ion abundance ratios, duplicates,
laboratory control samples, and appropriateness of data qualifiers assigned. MEL will prepare
written data verification reports based on the results of their data review.
A case narrative will meet the requirements for a data verification report for MEL’s chemical
data.
The project lead will examine the data reviews, case narratives, and data packages. To determine
if project MQOs have been met, results for laboratory control samples, sample duplicates, matrix
spikes, and labeled compound recoveries will be compared to QC limits. The method blanks
results will be examined to verify there was no significant contamination of the samples. To
evaluate whether the targets for reporting limits have been met, the results will be examined for
“non-detects” and to determine if any values exceed the lowest concentration of interest. Based
on these assessments, the data will be either accepted, accepted with appropriate qualifications,
or rejected and re-analysis considered.

Page 27
Data Analysis
Once the data have been verified, the project lead will determine if they can be used to make the
calculations, determinations, and decisions for which the project was conducted. If the results
are satisfactory, data analysis will proceed.
Summary statistics will be calculated for each chemical and outliers identified. The data will be
plotted to compare contaminant concentrations among waterbodies and identify spatial patterns.
If a correlation exists between chemical concentrations and ancillary parameters such as fish
lipid content or sediment TOC or percent fines, the data will also be examined on a normalized
basis. The fish tissue data will be evaluated for differences among samples analyzed by size
class.
Results from other surveys of chemical contaminants in fish and sediment in Washington
background or reference areas will be included in the data analysis as appropriate. A comparison
will be provided with available human health, aquatic life, and wildlife criteria.
Audits and Reports
Audits
MEL participates in performance and system audits of their routine procedures. Results of these
audits are available on request. No audits will be conducted of MEL contract laboratories.
Reports
The following reports will be prepared for this project:
1. A draft technical report for review by ERO and other interested parties; the tentative date for
the draft is May 2011. Responsible staff: Art Johnson.
2. The final technical report for this project will be completed by July 2011.
Responsible staff: Art Johnson.
3. The project data will be entered into EIM on or before July 2011.
Responsible staff: Michael Friese.

Page 28
References
Blakley, N., 2008. Standard Operating Procedure for Obtaining Freshwater Sediment Samples
Version 1.0. Environmental Assessment Program SOP #040. Washington State Department of
Ecology, Olympia, WA.
Cope, W.G., J.G. Wiener, and R.G. Rada, 1990. Mercury accumulation in yellow perch in
Wisconsin seepage lakes: Relation to lake characteristics. Environmental Toxicology and
Chemistry 9:931−940.
Dowling, B., 2010. Unpublished fish tissue data on Leo Lake and Pierre Lake collected by the
Washington State Toxics Monitoring Program. 9/19/10 email.
Ecology, 2008. Sediment Sampling and Analysis Plan Appendix: Guidance on the Development
of Sediment Sampling and Analysis Plans Meeting the Requirements of the Sediment
Management Standards (Chapter 173-204 WAC). Washington State Department of Ecology,
Olympia, WA. Publication No. 03-09-043. www.ecy.wa.gov/biblio/0309043.html.
EPA, 1990. Specifications and Guidance for Obtaining Contaminant-Free Sample Containers.
U.S. Environmental Protection Agency. OSWER Directive #93240.0-05.
EPA, 1992. National Study of Chemical Residues in Fish. U.S. Environmental Protection
Agency. EPA 823-R-92-008.
EPA, 2000. Guidance for Assessing Chemical Contaminant Data for Use in Fish Advisories.
Vol. 1-4. U.S. Environmental Protection Agency, Office of Water. EPA-823-B-00-007.
EPA, 2009. A National Study of Chemical Residues in Lake Fish Tissue. U.S. Environmental
Protection Agency. EPA-823-R-09-006. http://epa.gov/waterscience/fish/study/results.htm.
Gillian, L.D. and F. Wania, 2005. Organic contaminants in mountains. Environ. Sci. Technol.
39(2):385-3398.
Herbert, C.E. and K.A. Keenleyside, 1995. To normalize or not to normalize: fat is the question.
Environmental Toxicology and Chemistry 14(5):801-807.
Johnson, A., K. Seiders, and D. Norton, 2010. An Assessment of the PCB and Dioxin
Background in Washington Freshwater Fish, with Recommendations for Prioritizing 303(d)
Listings. Washington State Department of Ecology, Olympia, WA. Publication No. 10-03-007.
www.ecy.wa.gov/biblio/1003007.html.
Lombard, S. and C. Kirchmer, 2004. Guidelines for Preparing Quality Assurance Project Plans
for Environmental Studies. Washington State Department of Ecology, Olympia, WA.
Publication No. 04-03-030. www.ecy.wa.gov/biblio/0403030.html.
Lowe, T.P., T.W. May, W.G. Brumbaugh, and D.A. Kane, 1985. National Contaminant
Biomonitoring Program: Concentrations of seven elements in freshwater fish, 1978-1981.
Archives Environmental Contamination and Toxicology 14:363-388.
Page 29
Sandvik, P., 2006a. Standard Operating Procedure for Field Collection, Processing, and
Preservation of Finfish Samples at the Time of Collection in the Field. Version 1.0.
Washington State Department of Ecology, Olympia, WA. SOP Number EAP009.
Sandvik, P., 2006b. Standard Operating Procedure for Resecting Finfish Whole Body, Body
Parts, or Tissue Samples. Version 1.0. Washington State Department of Ecology, Olympia,
WA. SOP Number EAP007.
Schmitt, C.J., J.L. Zajicek, and P.H. Peterman, 1990. National Contaminant Monitoring
Program: Residues of organochlorine chemicals in U.S. freshwater fish, 1976 - 84.
Archives Environmental Contamination and Toxicology 19:748-781.
Sears, S., 2010. Colville Confederated Tribes, Nespelem, WA. 8/10/2010 email.
Seiders, K., 2010. Unpublished fish tissue data on Leo Lake and Pierre Lake collected by the
Washington State Toxics Monitoring Program. 7/21/10 email.
Seiders, K. and C. Deligeannis, 2009. Washington State Toxics Monitoring Program:
Freshwater Fish Tissue Component, 2007. Washington State Department of Ecology, Olympia,
WA. Publication No. 09-03-003. www.ecy.wa.gov/biblio/0903003.html.
Serdar, D., K. Kinney, M. Mandjikov, and D. Montgomery, 2006. Persistent Organic Pollutants
in Feed and Rainbow Trout from Selected Trout Hatcheries. Washington State Department of
Ecology, Olympia, WA. Publication No. 06-03-017. www.ecy.wa.gov/biblio/0603017.html.
Sloan, J. and N. Blakley, 2009. Baseline Characterization of Nine Proposed Freshwater Sediment
Reference Sites, 2008. Washington State Department of Ecology, Olympia, WA. Publication
No. 09-03-032. www.ecy.wa.gov/biblio/0903032.html.
Slotton, D.G., J.E. Reuter, and C.R. Goldman, 1995. Mercury uptake patterns of biota in a
seasonally anoxic northern California reservoir. Water, Air, and Soil Pollution 80:841−850.
Stow, C.A., L.J. Jackson, and J.F. Amrhein, 1997. An examination of the PCB: lipid relationship
among individual fish. Canadian Journal of Fish and Aquatic Science 54:1031-1038.
Van den Berg, M., L. Birnbaum, A.T.C. Bosveld et al., 1998. Toxic Equivalency Factors (TEFs)
for PCBs, PCDDs, and PCDFs for humans and wildlife. Environmental Health Perspective
106 (12): 775-792.
Wania, F. and D. Mackay, 1993. Global fractionation and cold deposition of low volatility
organochlorine compounds in polar regions. Ambio (22):10-18.
Ward, S.M., and R.M. Neumann, 1999. Seasonal variation in concentrations of mercury in axial
muscle tissue of largemouth bass. North American Journal of Fisheries Management 19:89-96.

Page 30
Appendices

Page 31
Appendix A. PCDD, PCDF, and PBDE Congeners Being Analyzed in the Northeastern Washington Area Lake Study
Polychlorinated Dibenzo-p-dioxins
2,3,7,8-TCDD
1,2,3,7,8-PeCDD
1,2,3,4,7,8-HxCDD
1,2,3,6,7,8-HxCDD
1,2,3,7,8,9-HxCDD
1,2,3,4,6,7,8-HpCDD
Polychlorinated Dibenzofurans (PCDFs)
2,3,7,8-TCDF
1,2,3,7,8-PeCDF
2,3,4,7,8-PeCDF
1,2,3,4,6,7,8-HpCDF
1,2,3,4,7,8,9-HpCDF
1,2,3,4,7,8-HxCDF
1,2,3,6,7,8-HxCDF
1,2,3,7,8,9-HxCDF
2,3,4,6,7,8-HxCDF
OCDF
Polybrominated Diphenyl Ethers (PBDEs)
2,6-DiBDE
2,2',3,4,4',6-HxBDE
2,2',3,4,4',6'-HxBDE
2,2',3,4,4',5'-HxBDE
2,3,3',4,4',5,-HxBDE
2,2',3,4,4',6,6'-HpBDE
2,2',3,4,4',5',6-HpBDE
2,3,3',4,4',5',6-HpBDE
2,2',3,4,4',5,5'-HpBDE
2,2',3,3',4,4',6-HpBDE
2,2',3,3',4,5',6,6'-OcBDE
2,2',3,3',4,4',6,6'-OcBDE
2,2',3,4,4',5,5',6-OcBDE
2,2',3,3',4,4',5,6'-OcBDE
2,3,3',4,4',5,5',6-OcBDE
2,2',3,3',4,5,5',6,6'-NoBDE
2,2',3,3',4,4',5,6,6'-NoBDE
2,2',3,3',4,4',5,5',6-NoBDE
DeBDE

Page 32
Appendix B. Acronyms and Units of Measurement
Acronyms
Ecology Washington State Department of Ecology
EIM Environmental Information Management database
EPA U.S. Environmental Protection Agency
ERO Eastern Regional Office
GIS Geographic Information System software
HWTR Hazardous Waste and Toxics Reduction
MEL Manchester Environmental Laboratory
MQO Measurement quality objective
PBDEs Polybrominated diphenyl ethers
PBT Persistent, bioaccumulative, and toxic substance
PCBs Polychlorinated biphenyls
PCDDs Polychlorinated dibenzo-dioxins
PCDFs Polychlorinated dibenzofurans
QA Quality assurance
QC Quality control
RPD Relative percent difference
SOP Standard operating procedures
TCP Toxics Cleanup Program
TOC Total organic carbon
WDFW Washington Department of Fish and Wildlife
WQ Water Quality
WRIA Water Resources Inventory Area
Units of Measurement
dw dry weight
mg/Kg milligrams per kilogram (parts per million)
ng/Kg nanograms per kilogram (parts per trillion)
ww wet weight