Assessment Day - Daytona State College...Unit test Final exam SLO3: Evaluate one and two-sided...
37
ASSESSMENT DAY College of Arts and Sciences School of Mathematics November 10, 2017 1
Transcript of Assessment Day - Daytona State College...Unit test Final exam SLO3: Evaluate one and two-sided...

ASSESSMENT DAY
College of Arts and Sciences
School of Mathematics
November 10, 2017
1

Academic Assessment
2
LEVEL FOCUSCONDUCTED
BYFREQUENCY
Academic
Success
Committee
Program Quality of assessment practicesCommittee of
peersYears 1 & 2
Instructional
Program
Review
Program / Cluster
Enrollment, retention, completion
Industry certifications and job
placement
Program budget and staffing
Advisory committees Curriculum changes
Committee of peers
Year 3
Assessment Day
Course/ Program
Enrollment by demographics
Graduation and retention
Average class size
Course success rate
Placement rate
SLOs, PLOs and ILOs
Program Chair and Faculty
Years 1, 2, 3

Last Assessment Day – Action Items
3
School of Mathematics (10/07/2016):
1. Provide student access to online course before the
semester starts so students can get familiar with
technology and software features;
2. Add faculty to query access to get student contact
information;
3. Provide reports for best, middle and low/challenging
SLOs.
65%70%
92%
79%
63%
77%
67%60%
0%
20%
40%
60%
80%
100%
Daytona Deland Flagler Online
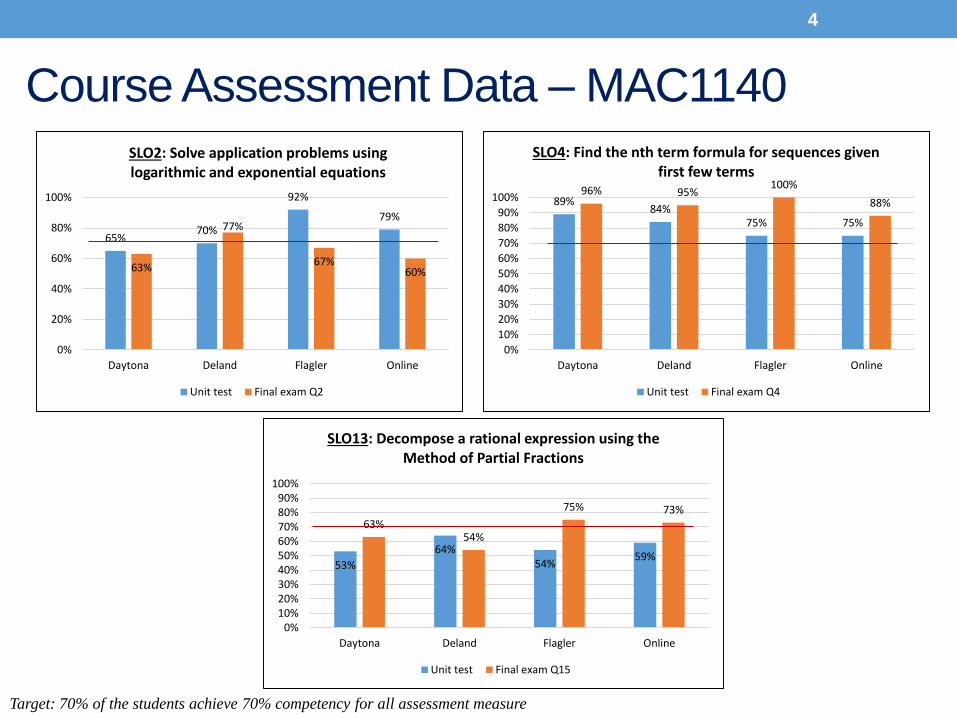
SLO2: Solve application problems using logarithmic and exponential equations
Unit test Final exam Q2
Course Assessment Data – MAC1140
4
Target: 70% of the students achieve 70% competency for all assessment measure
89%84%
75% 75%
96% 95%100%
88%
0%
10%
20%
30%
40%
50%
60%
70%
80%
90%
100%
Daytona Deland Flagler Online
SLO4: Find the nth term formula for sequences given first few terms
Unit test Final exam Q4
53%
64%54%
59%
63%54%
75% 73%
0%10%20%30%40%50%60%70%80%90%
100%
Daytona Deland Flagler Online
SLO13: Decompose a rational expression using the Method of Partial Fractions
Unit test Final exam Q15
77%72% 72%
79% 83% 87%85% 87%78%
87%78%
91%
0%10%20%30%40%50%60%70%80%90%
100%
Daytona Deland Deltona Flagler New Smyrna Online
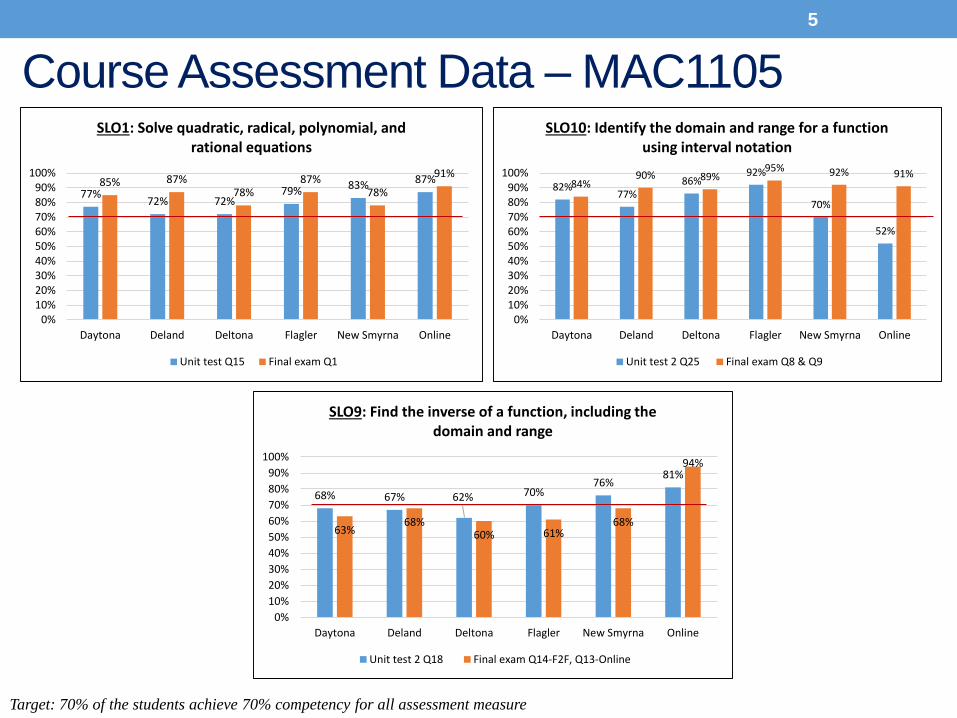
SLO1: Solve quadratic, radical, polynomial, and rational equations
Unit test Q15 Final exam Q1
Course Assessment Data – MAC1105
5
Target: 70% of the students achieve 70% competency for all assessment measure
82%77%
86%92%
70%
52%
84%90% 89%
95% 92% 91%
0%10%20%30%40%50%60%70%80%90%
100%
Daytona Deland Deltona Flagler New Smyrna Online
SLO10: Identify the domain and range for a function using interval notation
Unit test 2 Q25 Final exam Q8 & Q9
68% 67% 62% 70%76%
81%
63%68%
60% 61%68%
94%
0%
10%
20%
30%
40%
50%
60%
70%
80%
90%
100%
Daytona Deland Deltona Flagler New Smyrna Online
SLO9: Find the inverse of a function, including the domain and range
Unit test 2 Q18 Final exam Q14-F2F, Q13-Online
73%
83%87%
81%81% 81%90%
97%
0%
10%
20%
30%
40%
50%
60%
70%
80%
90%
100%
Daytona Deland Flagler
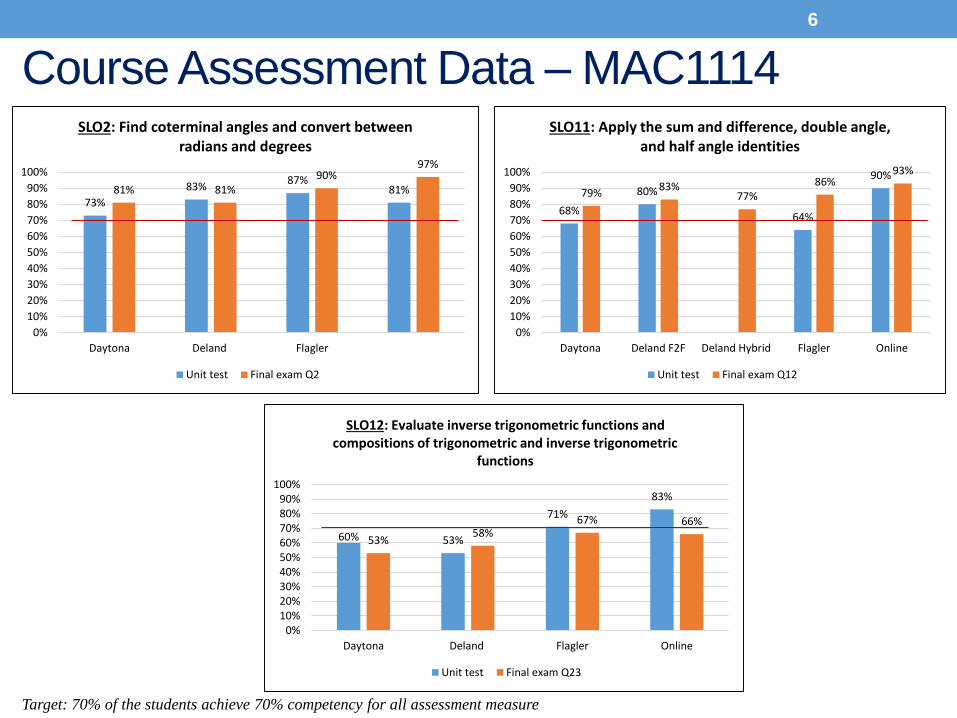
SLO2: Find coterminal angles and convert between radians and degrees
Unit test Final exam Q2
Course Assessment Data – MAC1114
6
Target: 70% of the students achieve 70% competency for all assessment measure
68%
80%
64%
90%
79%83%
77%86%
93%
0%
10%
20%
30%
40%
50%
60%
70%
80%
90%
100%
Daytona Deland F2F Deland Hybrid Flagler Online
SLO11: Apply the sum and difference, double angle, and half angle identities
Unit test Final exam Q12
60% 53%
71%
83%
53%58%
67% 66%
0%10%20%30%40%50%60%70%80%90%
100%
Daytona Deland Flagler Online
SLO12: Evaluate inverse trigonometric functions and compositions of trigonometric and inverse trigonometric
functions
Unit test Final exam Q23

67%73%
89%85%
0%
10%
20%
30%
40%
50%
60%
70%
80%
90%
100%
Unit test Final exam
SLO8: Use the product and quotient rules of differentiation
F2F Online
77%
92%
79%
65%
0%
10%
20%
30%
40%
50%
60%
70%
80%
90%
100%
Unit test Final exam
SLO3: Evaluate one and two-sided limits graphically
F2F Online
Course Assessment Data – MAC2311
7
Target: 70% of the students achieve 70% competency for all assessment measure
60%
81%82%
38%
0%10%20%30%40%50%60%70%80%90%
100%
Unit test Final exam
SLO13: Solve application problems involving, velocity and acceleration
F2F Online
66%
51%61%
40%
61%66%64%
50%58%
36%
62% 63%
0%10%20%30%40%50%60%70%80%90%
100%
Daytona Deland Deltona Flagler New Smyrna Online
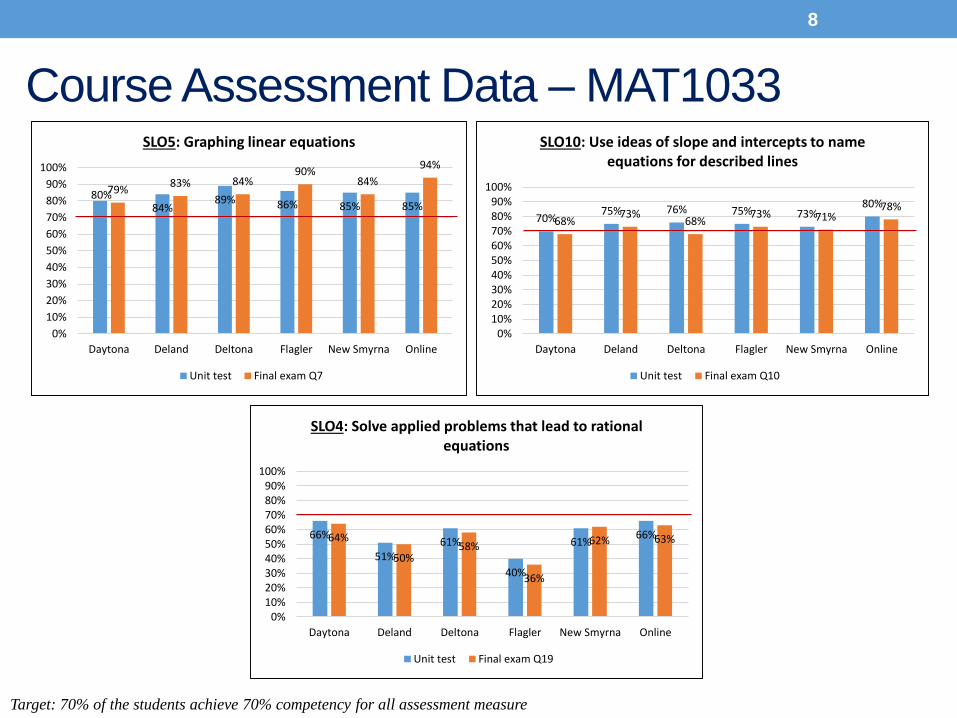
SLO4: Solve applied problems that lead to rational equations
Unit test Final exam Q19
70%75% 76% 75% 73%
80%
68%73%
68%73% 71%
78%
0%10%20%30%40%50%60%70%80%90%
100%
Daytona Deland Deltona Flagler New Smyrna Online
SLO10: Use ideas of slope and intercepts to name equations for described lines
Unit test Final exam Q10
80%84%
89% 86% 85% 85%
79%83% 84%
90%84%
94%
0%
10%
20%
30%
40%
50%
60%
70%
80%
90%
100%
Daytona Deland Deltona Flagler New Smyrna Online
SLO5: Graphing linear equations
Unit test Final exam Q7
Course Assessment Data – MAT1033
8
Target: 70% of the students achieve 70% competency for all assessment measure

34% 31%
17%
39%
5%12%
20% 19%26%
73%
48%
83%
69%
58%62%
56%
75%
51%
0%
10%
20%
30%
40%
50%
60%
70%
80%
90%
100%
DaytonaF2F
DaytonaHybrid
DelandF2F
DelandHybrid
DeltonaF2F
DeltonaHybrid
FlaglerF2F
NewSmyrna
F2F
Online
SLO6: Solve applicationa in Geometry
ALEKS Projects
85%
56% 53%
82%
42%51% 54% 51%
61%85%
40%53%
69%
53% 51%
72%82%
55%
0%10%20%30%40%50%60%70%80%90%
100%
DaytonaF2F
DaytonaHybrid
DelandF2F
DelandHybrid
DeltonaF2F
DeltonaHybrid
FlaglerF2F
NewSmyrna
F2F
Online
SLO1: Demonstrate an understanding of descriptive statistics
ALEKS Projects
91%
78%87%
92%
61%
75%85% 81% 84%
40% 43%
66%58%
66%60%
46%
0%
20%
40%
60%
80%
100%
DaytonaF2F
DaytonaHybrid
DelandF2F
DelandHybrid
DeltonaF2F
DeltonaHybrid
FlaglerF2F
NewSmyrna
F2F
Online
SLO3: Calculate Probabilities
ALEKS Projects
Course Assessment Data – MGF21069
Target: 70% of the students achieve 70% competency for all assessment measure
48%
64%69%
52%
76%
49% 50%59%
66%73%
64%77%
37%
57%
0%
10%
20%
30%
40%
50%
60%
70%
80%
90%
100%
Daytona Deland Deltona Flagler NewSmyrna
Online Hybrid
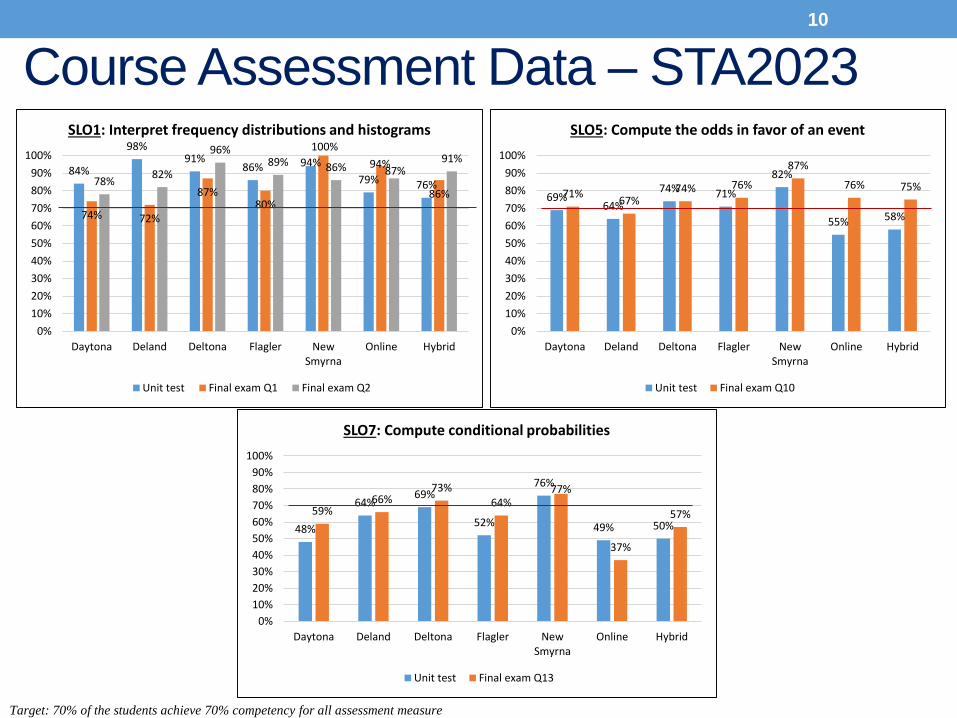
SLO7: Compute conditional probabilities
Unit test Final exam Q13
84%
98%91%
86% 94%
79% 76%
74% 72%
87%80%
100%
94%
86%78%
82%
96%89% 86% 87%
91%
0%
10%
20%
30%
40%
50%
60%
70%
80%
90%
100%
Daytona Deland Deltona Flagler NewSmyrna
Online Hybrid
SLO1: Interpret frequency distributions and histograms
Unit test Final exam Q1 Final exam Q2
Course Assessment Data – STA202310
Target: 70% of the students achieve 70% competency for all assessment measure
69%64%
74% 71%
82%
55% 58%
71%67%
74% 76%
87%
76% 75%
0%
10%
20%
30%
40%
50%
60%
70%
80%
90%
100%
Daytona Deland Deltona Flagler NewSmyrna
Online Hybrid
SLO5: Compute the odds in favor of an event
Unit test Final exam Q10
Source: IR Program Assessment Data
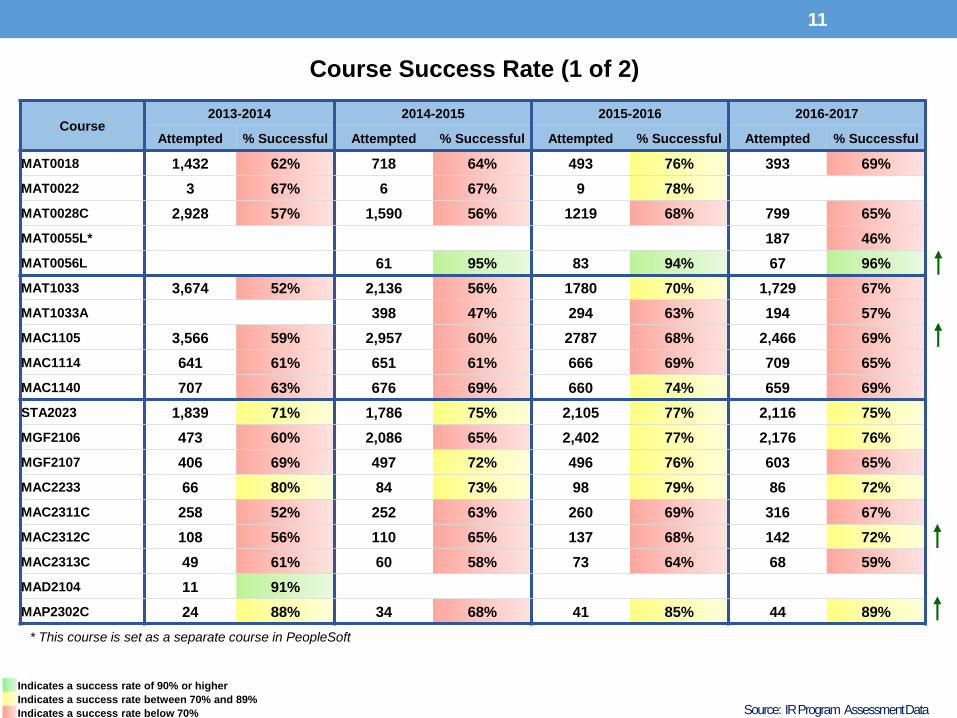
Course Success Rate (1 of 2)
11
Course2013-2014 2014-2015 2015-2016 2016-2017
Attempted % Successful Attempted % Successful Attempted % Successful Attempted % Successful
MAT0018 1,432 62% 718 64% 493 76% 393 69%
MAT0022 3 67% 6 67% 9 78%
MAT0028C 2,928 57% 1,590 56% 1219 68% 799 65%
MAT0055L* 187 46%
MAT0056L 61 95% 83 94% 67 96%
MAT1033 3,674 52% 2,136 56% 1780 70% 1,729 67%
MAT1033A 398 47% 294 63% 194 57%
MAC1105 3,566 59% 2,957 60% 2787 68% 2,466 69%
MAC1114 641 61% 651 61% 666 69% 709 65%
MAC1140 707 63% 676 69% 660 74% 659 69%
STA2023 1,839 71% 1,786 75% 2,105 77% 2,116 75%
MGF2106 473 60% 2,086 65% 2,402 77% 2,176 76%
MGF2107 406 69% 497 72% 496 76% 603 65%
MAC2233 66 80% 84 73% 98 79% 86 72%
MAC2311C 258 52% 252 63% 260 69% 316 67%
MAC2312C 108 56% 110 65% 137 68% 142 72%
MAC2313C 49 61% 60 58% 73 64% 68 59%
MAD2104 11 91%
MAP2302C 24 88% 34 68% 41 85% 44 89%
Indicates a success rate of 90% or higher
Indicates a success rate between 70% and 89%
Indicates a success rate below 70%
* This course is set as a separate course in PeopleSoft

Source: IR Program Assessment Data
Course Success Rate (2 of 2)
12
Course2013-2014 2014-2015 2015-2016 2016-2017
Attempted % Successful Attempted % Successful Attempted % Successful Attempted % Successful
MAS3105 6 83% 6 67% 10 70% 5 100%
MAS3301 4 100% 5 80% 1 100% 4 75%
MAP3401 13 62%
MAS4203 8 63% 6 67% 5 20% 10 90%
MHF4404 10 80% 10 80%
MTG4212 5 80% 5 100% 7 100%
STA4024 10 90% 5 100% 4 75% 5 80%
Total 8,181 63% 9,225 66% 13,945 72.01% 12,785 70%
Indicates a success rate of 90% or higher
Indicates a success rate between 70% and 89%
Indicates a success rate below 70%
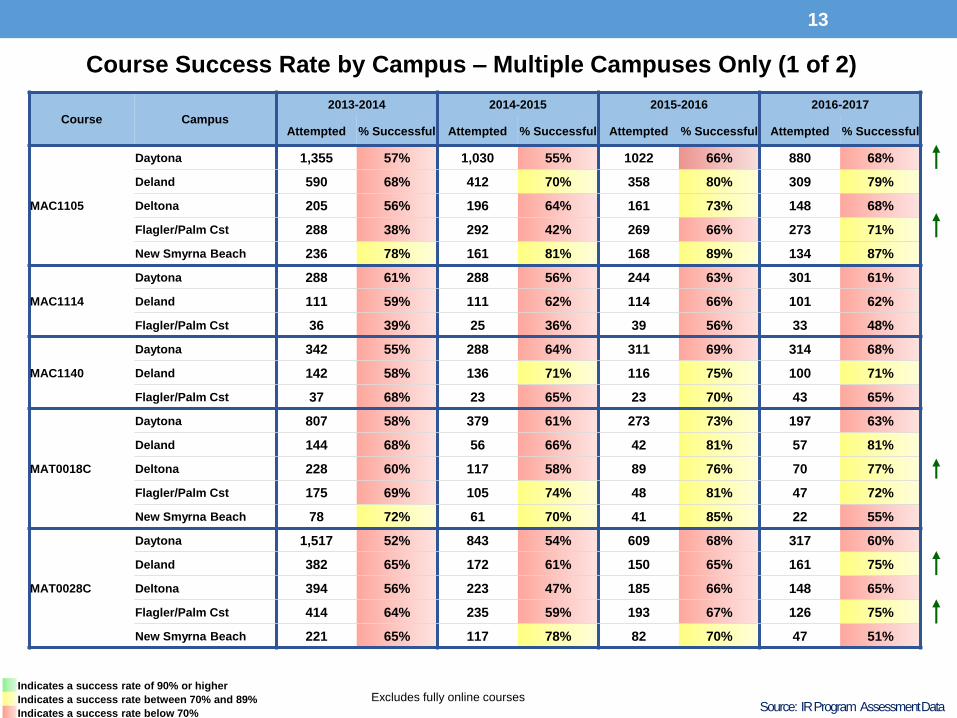
Course Success Rate by Campus – Multiple Campuses Only (1 of 2)
Source: IR Program Assessment Data
13
Course Campus
2013-2014 2014-2015 2015-2016 2016-2017
Attempted % Successful Attempted % Successful Attempted % Successful Attempted % Successful
MAC1105
Daytona 1,355 57% 1,030 55% 1022 66% 880 68%
Deland 590 68% 412 70% 358 80% 309 79%
Deltona 205 56% 196 64% 161 73% 148 68%
Flagler/Palm Cst 288 38% 292 42% 269 66% 273 71%
New Smyrna Beach 236 78% 161 81% 168 89% 134 87%
MAC1114
Daytona 288 61% 288 56% 244 63% 301 61%
Deland 111 59% 111 62% 114 66% 101 62%
Flagler/Palm Cst 36 39% 25 36% 39 56% 33 48%
MAC1140
Daytona 342 55% 288 64% 311 69% 314 68%
Deland 142 58% 136 71% 116 75% 100 71%
Flagler/Palm Cst 37 68% 23 65% 23 70% 43 65%
MAT0018C
Daytona 807 58% 379 61% 273 73% 197 63%
Deland 144 68% 56 66% 42 81% 57 81%
Deltona 228 60% 117 58% 89 76% 70 77%
Flagler/Palm Cst 175 69% 105 74% 48 81% 47 72%
New Smyrna Beach 78 72% 61 70% 41 85% 22 55%
MAT0028C
Daytona 1,517 52% 843 54% 609 68% 317 60%
Deland 382 65% 172 61% 150 65% 161 75%
Deltona 394 56% 223 47% 185 66% 148 65%
Flagler/Palm Cst 414 64% 235 59% 193 67% 126 75%
New Smyrna Beach 221 65% 117 78% 82 70% 47 51%
Excludes fully online coursesIndicates a success rate of 90% or higher
Indicates a success rate between 70% and 89%
Indicates a success rate below 70%

Course Success Rate by Campus – Multiple Campuses Only (2 of 2)
Source: IR Program Assessment Data
14
Course Campus2013-2014 2014-2015 2015-2016 2016-2017
Attempted % Successful Attempted % Successful Attempted % Successful Attempted % Successful
MAT0055L
Daytona 113 42%
Deland 34 47%
Flagler/Palm Cst 26 42%
New Smyrna Beach 14 86%
MAT0056L
Daytona 40 93% 41 95% 25 100%
Deland 7 100% 8 88% 2 100%
Deltona 11 100% 14 93%
Flagler/Palm Cst 3 100% 11 100%
New Smyrna Beach 9 89% 1 100%
MAT1033
Daytona 1,392 48% 764 55% 611 69% 601 66%
Deland 504 65% 312 65% 237 77% 163 71%
Deltona 250 52% 109 63% 108 74% 133 66%
Flagler/Palm Cst 344 42% 206 34% 171 61% 193 55%
New Smyrna Beach 197 75% 82 71% 92 82% 57 93%
MAT1033A
Daytona 211 47% 168 59% 119 53%
Deland 70 36% 37 70% 35 49%
Deltona 42 57% 16 81%
Flagler/Palm Cst 43 42% 39 56% 26 69%
New Smyrna Beach 32 59% 34 74% 14 93%
MGF2106
Daytona 33 76% 583 64% 829 77% 767 73%
Deland 79 81% 149 85% 170 82%
Deltona 77 77% 113 78%
Flagler/Palm Cst 96 66% 70 73% 45 76%
New Smyrna Beach 64 73% 81 86% 70 79%
MGF2107Daytona 25 88% 133 68% 130 84% 201 70%
Flagler/Palm Cst 18 78% 27 74% 44 70%
STA2023
Daytona 675 72% 517 73% 615 77% 630 77%
Deland 317 83% 267 85% 261 90% 252 82%
Deltona 74 69% 71 86% 86 73% 70 86%
Flagler/Palm Cst 87 79% 91 79% 98 78% 101 79%
New Smyrna Beach 153 81% 148 93% 129 91% 112 94%
Excludes fully online coursesIndicates a success rate of 90% or higher
Indicates a success rate between 70% and 89%
Indicates a success rate below 70%

Source: IR Program Assessment Data
15
Indicates a success rate of 90% or higher
Indicates a success rate between 70% and 89%
Indicates a success rate below 70%
Campus
2016-2017
Attempted % Successful
Daytona 5,025 68%
Deland 1,384 75%
Deltona 682 71%
Flagler/Palm Cst 957 68%
New Smyrna Beach 471 83%
Total 8,519 70%
School Course Success Rate by Campus – Overall
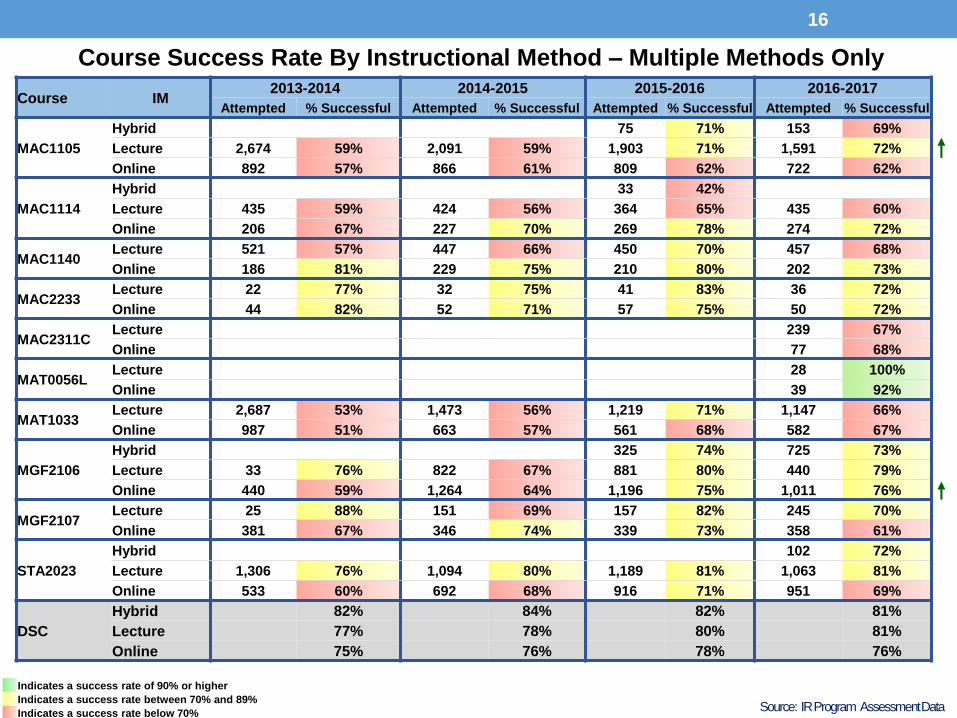
Course Success Rate By Instructional Method – Multiple Methods Only
Source: IR Program Assessment Data
16
Course IM2013-2014 2014-2015 2015-2016 2016-2017
Attempted % Successful Attempted % Successful Attempted % Successful Attempted % Successful
MAC1105
Hybrid 75 71% 153 69%
Lecture 2,674 59% 2,091 59% 1,903 71% 1,591 72%
Online 892 57% 866 61% 809 62% 722 62%
MAC1114
Hybrid 33 42%
Lecture 435 59% 424 56% 364 65% 435 60%
Online 206 67% 227 70% 269 78% 274 72%
MAC1140Lecture 521 57% 447 66% 450 70% 457 68%
Online 186 81% 229 75% 210 80% 202 73%
MAC2233Lecture 22 77% 32 75% 41 83% 36 72%
Online 44 82% 52 71% 57 75% 50 72%
MAC2311CLecture 239 67%
Online 77 68%
MAT0056LLecture 28 100%
Online 39 92%
MAT1033Lecture 2,687 53% 1,473 56% 1,219 71% 1,147 66%
Online 987 51% 663 57% 561 68% 582 67%
MGF2106
Hybrid 325 74% 725 73%
Lecture 33 76% 822 67% 881 80% 440 79%
Online 440 59% 1,264 64% 1,196 75% 1,011 76%
MGF2107Lecture 25 88% 151 69% 157 82% 245 70%
Online 381 67% 346 74% 339 73% 358 61%
STA2023
Hybrid 102 72%
Lecture 1,306 76% 1,094 80% 1,189 81% 1,063 81%
Online 533 60% 692 68% 916 71% 951 69%
DSC
Hybrid 82% 84% 82% 81%
Lecture 77% 78% 80% 81%
Online 75% 76% 78% 76%
Indicates a success rate of 90% or higher
Indicates a success rate between 70% and 89%
Indicates a success rate below 70%
Source: IR Program Assessment Data
17
Indicates a success rate of 90% or higher
Indicates a success rate between 70% and 89%
Indicates a success rate below 70%
Campus
2016-2017
Attempted % Successful
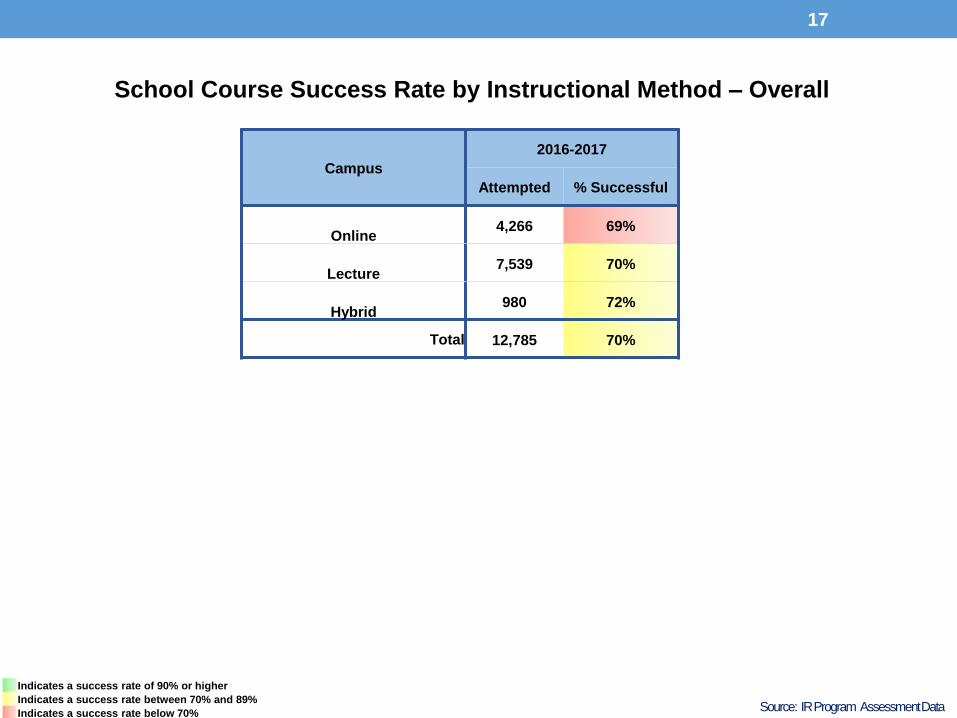
Online4,266 69%
Lecture7,539 70%
Hybrid980 72%
Total 12,785 70%
School Course Success Rate by Instructional Method – Overall

Source: IR Program Assessment Data
Course Success Rates- Multiple Sessions or Sub-sessions Only (1 of 3)
18
Course Session Sub-session2013-2014 2014-2015 2015-2016 2016-2017
Attempted % Successful Attempted % Successful Attempted % Successful
MAC1105
FA
A term 54 87% 50 82% 49 84% 106 73%
B term 52 44% 89 56%
Full term 1,643 57% 1,318 56% 1,165 71% 977 72%
SP
A term 83 69% 55 82% 133 77% 109 81%
B term 17 82% 37 54% 73 56% 63 59%
Full term 1,293 55% 1,106 59% 949 62% 819 66%
SU Full term 476 69% 391 70% 366 74% 303 69%
MAC1114
FA Full term 242 55% 262 53% 246 70% 267 63%
SP Full term 289 62% 271 65% 279 68% 304 62%
SU Full term 110 74% 118 70% 141 71% 138 75%
MAC1140
FA Full term 305 61% 291 62% 237 75% 283 69%
SP Full term 316 64% 273 72% 298 69% 259 68%
SU Full term 86 72% 112 83% 125 82% 117 76%
MAC2233
FA Full term 20 80% 25 76% 36 72% 32 78%
SP Full term 26 92% 40 73% 39 85% 27 67%
SU Full term 20 65% 19 68% 23 78% 27 70%
MAC2311C
FA Full term 113 51% 119 62% 118 74% 131 60%
SP Full term 94 55% 91 63% 100 60% 112 76%
SU Full term 51 49% 42 64% 42 79% 73 68%
MAC2312C
FA Full term 40 65% 38 58% 40 70% 55 76%
SP Full term 40 50% 53 62% 69 62% 53 58%
SU Full term 28 50% 19 89% 28 79% 34 85%
MAC2313C
FA Full term 23 52% 20 50% 30 73% 20 50%
SP Full term 13 69% 20 70% 20 40% 28 57%
SU Full term 13 69% 20 55% 23 74% 20 70%
MAP2302C
FA Full term 15 80% 16 56% 20 80% 23 87%
SP Full term 9 100% 18 78% 21 90% 21 90%
SU Full term
Indicates a success rate of 90% or higher
Indicates a success rate between 70% and 89%
Indicates a success rate below 70%

Source: IR Program Assessment Data
Course Success Rates- Multiple Sessions or Sub-sessions Only (2 of 3)
19
Course Sessio
n
Subsessio
n
2013-2014 2014-2015 2015-2016 2016-2017
Attempted % Successful Attempted % Successful Attempted % Successful Attempted % Successful
MAT0018C
FA
A term 349 68% 160 72% 129 80% 111 68%
B term 158 54% 61 49% 26 73% 18 83%
Full term 220 58% 145 53% 107 73% 71 66%
SP
A term 288 61% 126 69% 58 81% 44 70%
B term 57 51% 31 68% 30 67% 20 65%
Full term 177 58% 96 64% 81 69% 64 67%
SU Full term 183 67% 99 69% 62 84% 65 69%
MAT0022
FA Full term 2 50%
SP Full term 3 67% 3 67%
SU Full term 1 100% 9 78%
MAT0028C
FA
A term 508 64% 229 55% 199 73% 97 69%
B term 455 54% 240 50% 226 69% 130 61%
Full term 512 55% 334 51% 257 67% 203 63%
SP
A term 330 58% 151 58% 65 71% 26 69%
B term 318 57% 159 67% 110 72% 68 63%
Full term 393 45% 232 58% 210 66% 137 64%
SU Full term 412 64% 245 60% 152 57% 138 74%
MAT0055LFA Full term 131 60%
SP Full term 56 14%
MAT0056L
FA Full term 28 93% 47 96% 39 92%
SP Full term 33 97% 35 91% 19 100%
SU Full term 1 100% 9 100%
MAT1033
FA
A term 35 71% 27 85% 87 83%
B term 95 64% 50 58% 106 62% 145 63%
Full term 1,570 50% 1,037 57% 853 73% 692 66%
SP
A term 32 66% 15 80% 35 69% 79 77%
B term 105 49% 13 69% 57 67% 47 53%
Full term 1,407 51% 694 53% 487 64% 478 62%
SU Full term 430 63% 327 59% 215 73% 201 76%
Indicates a success rate of 90% or higher
Indicates a success rate between 70% and 89%
Indicates a success rate below 70%
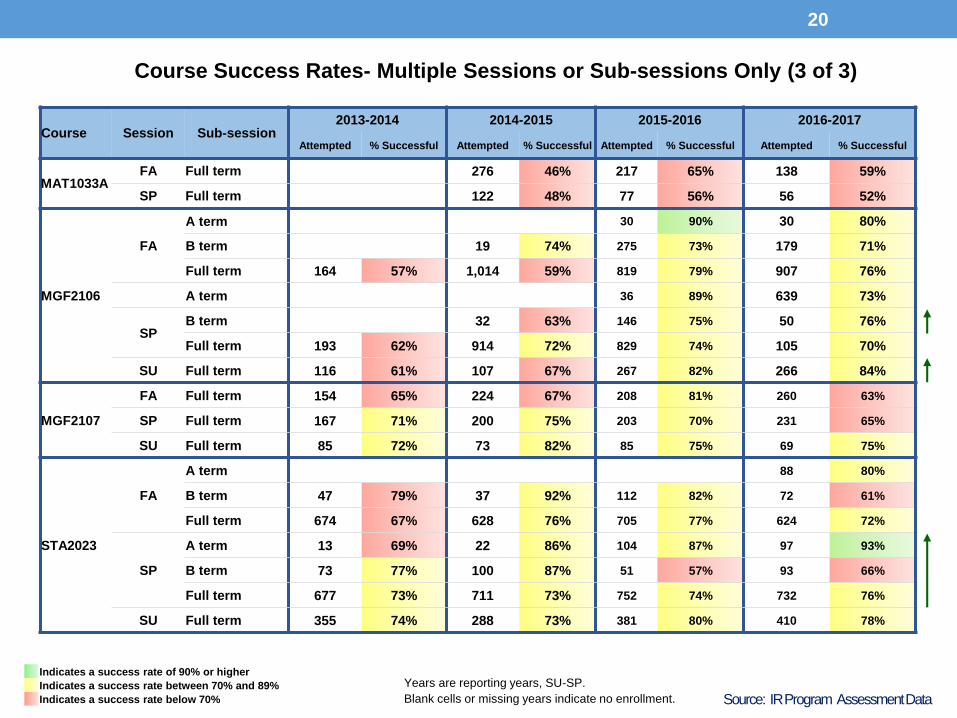
Course Success Rates- Multiple Sessions or Sub-sessions Only (3 of 3)
20
Course Session Sub-session2013-2014 2014-2015 2015-2016 2016-2017
Attempted % Successful Attempted % Successful Attempted % Successful Attempted % Successful
MAT1033AFA Full term 276 46% 217 65% 138 59%
SP Full term 122 48% 77 56% 56 52%
MGF2106
FA
A term 30 90% 30 80%
B term 19 74% 275 73% 179 71%
Full term 164 57% 1,014 59% 819 79% 907 76%
A term 36 89% 639 73%
SP B term 32 63% 146 75% 50 76%
Full term 193 62% 914 72% 829 74% 105 70%
SU Full term 116 61% 107 67% 267 82% 266 84%
MGF2107
FA Full term 154 65% 224 67% 208 81% 260 63%
SP Full term 167 71% 200 75% 203 70% 231 65%
SU Full term 85 72% 73 82% 85 75% 69 75%
STA2023
FA
A term 88 80%
B term 47 79% 37 92% 112 82% 72 61%
Full term 674 67% 628 76% 705 77% 624 72%
SP
A term 13 69% 22 86% 104 87% 97 93%
B term 73 77% 100 87% 51 57% 93 66%
Full term 677 73% 711 73% 752 74% 732 76%
SU Full term 355 74% 288 73% 381 80% 410 78%
Years are reporting years, SU-SP.
Blank cells or missing years indicate no enrollment. Source: IR Program Assessment Data
Indicates a success rate of 90% or higher
Indicates a success rate between 70% and 89%
Indicates a success rate below 70%
Source: IR Program Assessment Data
21
Indicates a success rate of 90% or higher
Indicates a success rate between 70% and 89%
Indicates a success rate below 70%
Session Sub-session
2016-2017
Attempted % Successful
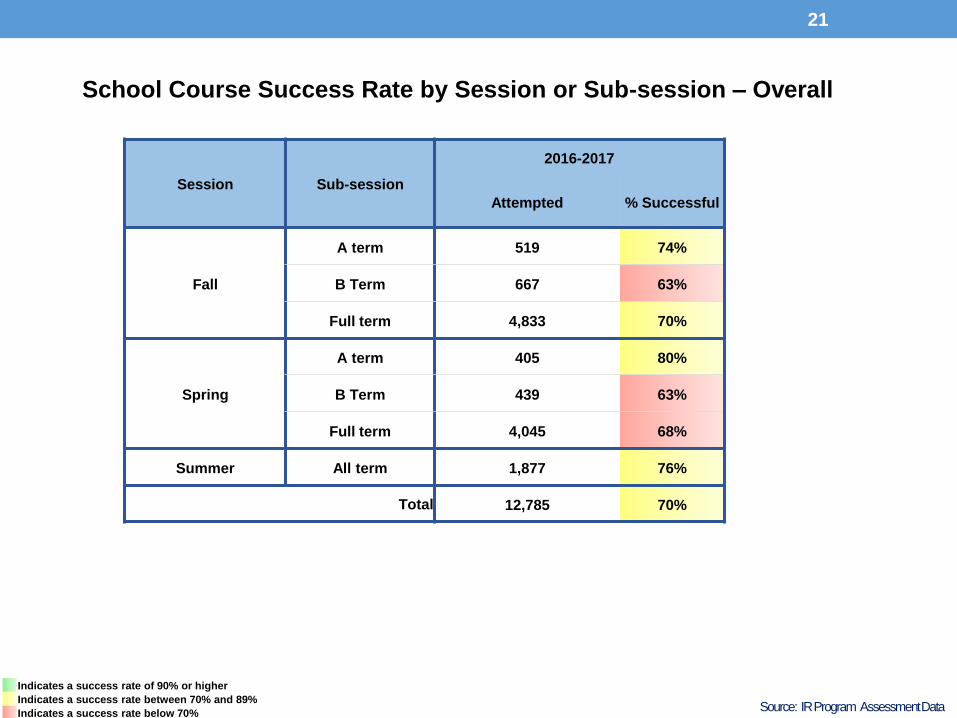
Fall
A term 519 74%
B Term 667 63%
Full term 4,833 70%
Spring
A term 405 80%
B Term 439 63%
Full term 4,045 68%
Summer All term 1,877 76%
Total 12,785 70%
School Course Success Rate by Session or Sub-session – Overall

Grade Distribution
Source: IR Program Assessment Data
22
Course
2016-2017 (SU16, FA16, SP17
Pass (A, B, C) Fail (D, F) FNs Ws W1s Incs
MAT0018C 270 65 28 13 12 0
MAT0028C 523 184 43 30 15 0
MAT0055L 86 35 12 23 4 0
MAT0056L 64 0 0 3 0 0
MAT1033 1,150 277 122 145 37 0
MAT1033A 111 40 14 25 4 0
MAC1105 1,700 379 124 225 37 0
MAC1114 459 90 37 107 15 0
MAC1140 458 92 23 76 9 0
STA2023 1,590 263 66 172 23 0
MGF2106 1,645 280 115 83 42 0
MGF2107 389 106 41 53 14 0
MAC2233 62 12 6 6 0 0
MAC2311C 213 43 12 45 3 0
MAC2312C 102 29 4 7 0 0
MAC2313C 40 16 3 7 2 0
MAP2302C 39 4 1 0 0 0
MAS3105 5 0 0 0 0 0
MAS3301 3 1 0 0 0 0
MAS4203 9 2 0 0 0 0
MTG4212 7 0 0 0 0 0
STA4024 4 0 0 1 0 0
Total 8,929 (70%) 1,918 (15%) 651 (5%) 1,021 (8%) 217 (2%) 0

Grade Distribution by Term (1 of 3)
Source: IR Program Assessment Data
23
Term Course P A B+ B C+ C D+ D F FN W W1Grand
Total
Summer
2016
MAC1105 60 37 53 23 36 18 33 17 26 303
MAC1114 36 16 28 8 15 5 9 5 15 137
MAC1140 27 13 23 6 20 5 8 4 11 117
MAC2233 3 3 6 3 4 1 3 3 1 27
MAC2311 6 12 12 7 13 6 8 2 7 73
MAC2312 6 2 6 4 11 1 1 2 1 34
MAC2313 2 1 2 5 4 2 3 1 20
MAT0018 6 7 10 3 19 5 2 7 2 61
MAT0028 38 11 24 2 27 11 11 7 5 136
MAT0056L 9 9
MAT1033 65 21 39 11 16 5 17 16 11 201
MGF2106 72 21 71 19 41 7 9 11 5 256
MGF2107 15 6 10 4 17 1 10 1 5 69
MTG4212 4 3 7
STA2023 118 44 81 23 54 1 18 26 17 27 409
Total 9 516 227 422 139 351 1 110 165 110 133 2183

Grade Distribution by Term (2 of 3)
Source: IR Program Assessment Data
24
Term Course P A B+ B C+ C D+ D F FN W W1Grand
Total
Fall
2016
MAC1105 292 105 184 88 159 1 61 103 73 103 1169
MAC1114 42 23 46 22 35 13 25 19 42 267
MAC1140 61 18 50 23 42 14 28 13 34 283
MAC2233 6 4 7 1 7 1 1 2 3 32
MAC2311C 26 12 15 9 16 5 12 8 28 131
MAC2312C 9 4 15 9 5 7 5 1 55
MAC2313C 2 1 5 1 1 3 3 1 3 20
MAP2302C 15 1 2 1 1 3 23
MAS3301 1 2 1 4
MAS4203 3 2 4 2 11
MAT0018C 53 17 36 3 29 8 33 16 4 199
MAT0028C 60 41 53 8 111 2 27 85 23 18 428
MAT0055L 28 7 21 3 19 13 16 11 12 130
MAT0056L 36 3 39
MAT1033 213 90 156 55 104 48 100 77 81 924
MAT1033A 30 7 22 3 20 12 16 13 14 137
MGF2106 265 107 205 83 183 79 74 75 45 1116
MGF2107 46 33 33 15 36 14 32 24 27 260
STA2023 177 90 137 61 98 1 47 66 34 73 784
Total 36 1329 560 989 385 872 4 352 605 389 491 6012

Grade Distribution by Term (3 of 3)
Source: IR Program Assessment Data
25
Term Course P A B+ B C+ C D+ D F FN W W1Grand
Total
Spring
2017
MAC1105 199 94 164 79 128 1 70 91 31 96 36 989
MAC1114 52 29 50 24 33 18 20 13 50 15 304
MAC1140 48 26 47 24 30 19 18 6 31 9 258
MAC2233 2 3 6 4 3 3 3 1 2 27
MAC2311C 30 12 24 9 10 7 4 2 11 3 112
MAC2312C 7 3 6 8 7 6 9 2 5 53
MAC2313C 3 3 5 5 2 3 2 3 2 28
MAP2302C 11 1 3 2 2 1 1 21
MAS3105 2 1 2 5
MAT0018C 29 19 19 2 18 5 12 5 7 11 127
MAT0028C 31 29 34 3 51 2 10 36 13 7 15 231
MAT0055L 2 2 6 3 2 2 3 2 11 4 37
MAT0056L 19 19
MAT1033 133 40 101 38 68 1 34 71 29 53 37 605
MAT1033A 5 2 10 6 6 2 9 1 11 4 56
MGF2106 197 64 142 56 120 59 52 29 34 41 794
MGF2107 35 17 42 29 51 19 30 16 21 13 273
STA2023 228 113 173 82 111 42 62 15 72 22 920
STA4024 1 1 1 1 1 5
Total 19 1015 455 833 375 646 4 298 424 168 415 212 4864
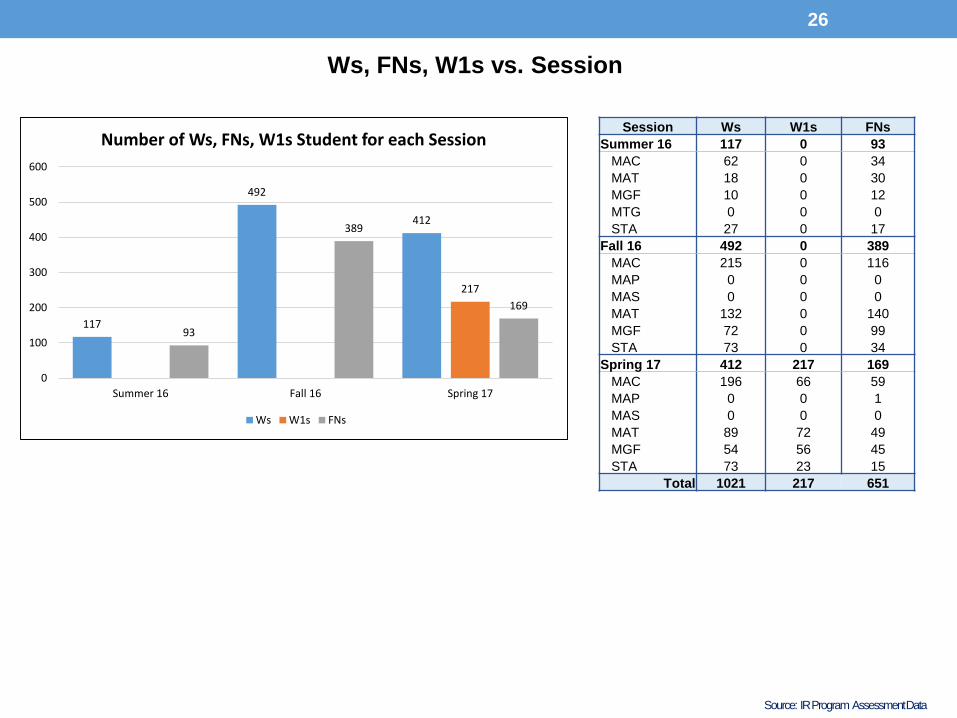
Ws, FNs, W1s vs. Session
Source: IR Program Assessment Data
26
Session Ws W1s FNs
Summer 16 117 0 93
MAC 62 0 34
MAT 18 0 30
MGF 10 0 12
MTG 0 0 0
STA 27 0 17
Fall 16 492 0 389
MAC 215 0 116
MAP 0 0 0
MAS 0 0 0
MAT 132 0 140
MGF 72 0 99
STA 73 0 34
Spring 17 412 217 169
MAC 196 66 59
MAP 0 0 1
MAS 0 0 0
MAT 89 72 49
MGF 54 56 45
STA 73 23 15
Total 1021 217 651
117
492
412
217
93
389
169
0
100
200
300
400
500
600
Summer 16 Fall 16 Spring 17
Number of Ws, FNs, W1s Student for each Session
Ws W1s FNs

Ws, FNs, W1s vs. Session and Instructional Method
Source: IR Program Assessment Data
27
Session & CoursesWs W1s FNs
Total Ws Total W1s Total FNsON P WE ON P WE ON P WE
Summer 16 71 46 0 0 58 35 117 0 93
MAC 38 24 0 0 20 14 62 0 34
MAT 5 13 0 0 12 18 18 0 30
MGF 8 2 0 0 12 0 10 0 12
MTG 0 0 0 0 0 0
STA 20 7 0 0 14 3 27 0 17
Fall 16 168 300 24 0 0 0 135 218 36 492 0 389
MAC 66 148 1 0 0 0 42 70 4 215 0 116
MAP 0 0 0 0 0 0
MAS 0 0 0 0 0 0
MAT 24 108 0 0 34 106 132 0 140
MGF 38 11 23 0 0 0 40 27 32 72 0 99
STA 40 33 0 0 19 15 73 0 34
Spring 17 150 224 38 108 87 22 59 95 15 412 217 169
MAC 59 126 11 32 31 3 16 43 0 196 66 59
MAP 0 0 1 0 0 1
MAS 0 0 0 0 0 0
MAT 21 68 25 47 11 38 89 72 49
MGF 34 4 16 34 5 17 26 7 12 54 56 45
STA 36 26 11 17 4 2 6 6 3 73 23 15
Grand Total389(38.1%) 570(55.8%) 62(6.1%) 108(49.8%) 87(40.1%) 22(10.1%) 252(38.7%) 348(53.5%) 51(7.8%) 1021 217 651
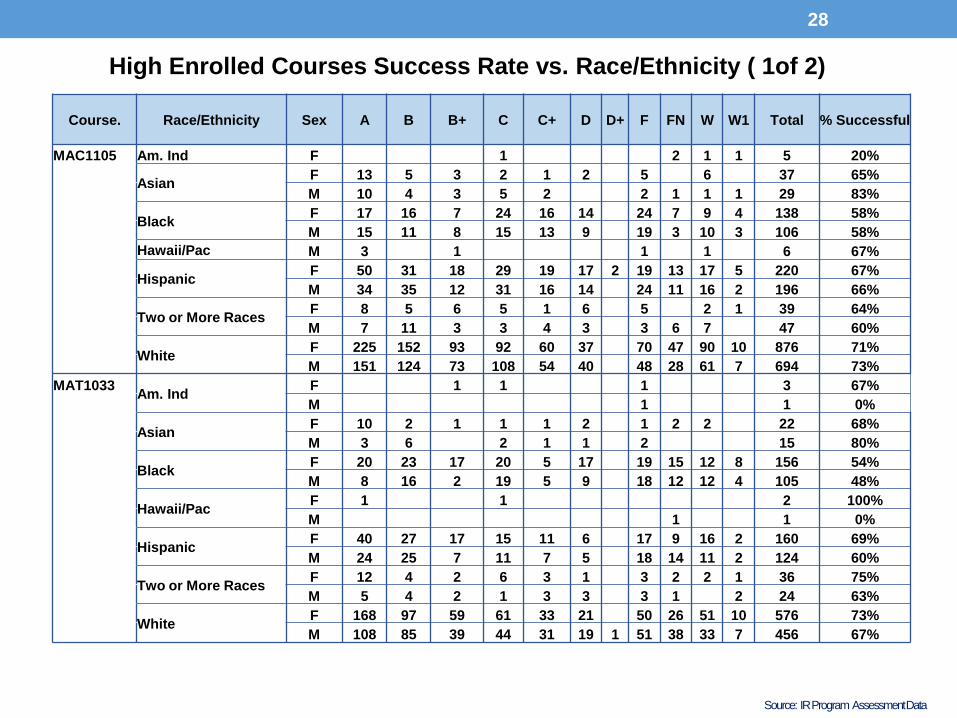
High Enrolled Courses Success Rate vs. Race/Ethnicity ( 1of 2)
Source: IR Program Assessment Data
28
Course. Race/Ethnicity Sex A B B+ C C+ D D+ F FN W W1 Total % Successful
MAC1105 Am. Ind F 1 2 1 1 5 20%
AsianF 13 5 3 2 1 2 5 6 37 65%
M 10 4 3 5 2 2 1 1 1 29 83%
BlackF 17 16 7 24 16 14 24 7 9 4 138 58%
M 15 11 8 15 13 9 19 3 10 3 106 58%
Hawaii/Pac M 3 1 1 1 6 67%
HispanicF 50 31 18 29 19 17 2 19 13 17 5 220 67%
M 34 35 12 31 16 14 24 11 16 2 196 66%
Two or More RacesF 8 5 6 5 1 6 5 2 1 39 64%
M 7 11 3 3 4 3 3 6 7 47 60%
WhiteF 225 152 93 92 60 37 70 47 90 10 876 71%
M 151 124 73 108 54 40 48 28 61 7 694 73%
MAT1033Am. Ind
F 1 1 1 3 67%
M 1 1 0%
AsianF 10 2 1 1 1 2 1 2 2 22 68%
M 3 6 2 1 1 2 15 80%
BlackF 20 23 17 20 5 17 19 15 12 8 156 54%
M 8 16 2 19 5 9 18 12 12 4 105 48%
Hawaii/PacF 1 1 2 100%
M 1 1 0%
HispanicF 40 27 17 15 11 6 17 9 16 2 160 69%
M 24 25 7 11 7 5 18 14 11 2 124 60%
Two or More RacesF 12 4 2 6 3 1 3 2 2 1 36 75%
M 5 4 2 1 3 3 3 1 2 24 63%
WhiteF 168 97 59 61 33 21 50 26 51 10 576 73%
M 108 85 39 44 31 19 1 51 38 33 7 456 67%
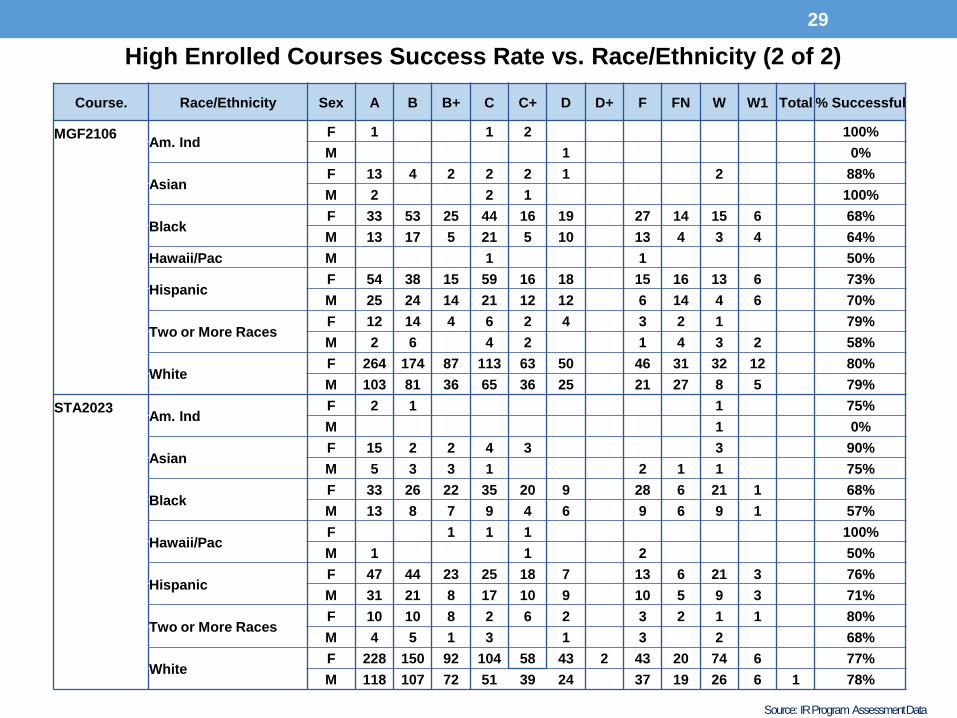
High Enrolled Courses Success Rate vs. Race/Ethnicity (2 of 2)
Source: IR Program Assessment Data
29
Course. Race/Ethnicity Sex A B B+ C C+ D D+ F FN W W1 Total % Successful
MGF2106Am. Ind
F 1 1 2 100%
M 1 0%
AsianF 13 4 2 2 2 1 2 88%
M 2 2 1 100%
BlackF 33 53 25 44 16 19 27 14 15 6 68%
M 13 17 5 21 5 10 13 4 3 4 64%
Hawaii/Pac M 1 1 50%
HispanicF 54 38 15 59 16 18 15 16 13 6 73%
M 25 24 14 21 12 12 6 14 4 6 70%
Two or More RacesF 12 14 4 6 2 4 3 2 1 79%
M 2 6 4 2 1 4 3 2 58%
WhiteF 264 174 87 113 63 50 46 31 32 12 80%
M 103 81 36 65 36 25 21 27 8 5 79%
STA2023Am. Ind
F 2 1 1 75%
M 1 0%
AsianF 15 2 2 4 3 3 90%
M 5 3 3 1 2 1 1 75%
BlackF 33 26 22 35 20 9 28 6 21 1 68%
M 13 8 7 9 4 6 9 6 9 1 57%
Hawaii/PacF 1 1 1 100%
M 1 1 2 50%
HispanicF 47 44 23 25 18 7 13 6 21 3 76%
M 31 21 8 17 10 9 10 5 9 3 71%
Two or More RacesF 10 10 8 2 6 2 3 2 1 1 80%
M 4 5 1 3 1 3 2 68%
WhiteF 228 150 92 104 58 43 2 43 20 74 6 77%
M 118 107 72 51 39 24 37 19 26 6 1 78%

Source: IR Program Assessment Data
Course Success Rates for Guaranteed Sections
30
Course
2016-2017
Overall
Attempted % Successful
MAC1105 60 85% 69%
MAT1033 80 66% 67%
MGF2106 117 69% 76%
STA2023 63 97% 75%
Total 320 77%
Indicates a success rate of 90% or higher
Indicates a success rate between 70% and 89%
Indicates a success rate below 70%
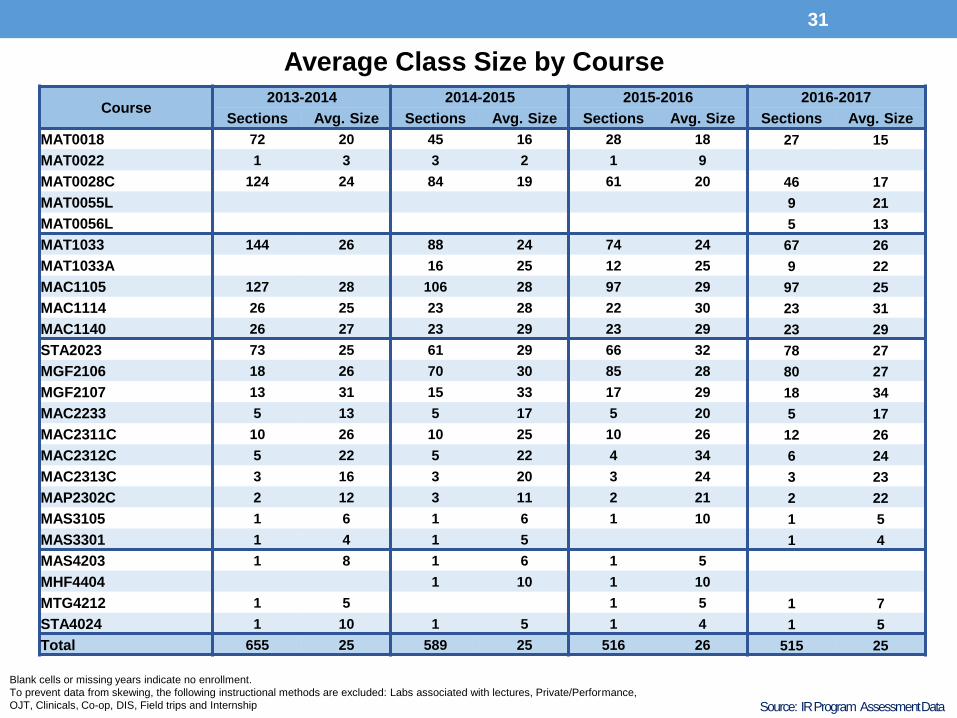
Average Class Size by Course
Source: IR Program Assessment Data
31
Course2013-2014 2014-2015 2015-2016 2016-2017
Sections Avg. Size Sections Avg. Size Sections Avg. Size Sections Avg. Size
MAT0018 72 20 45 16 28 18 27 15
MAT0022 1 3 3 2 1 9
MAT0028C 124 24 84 19 61 20 46 17
MAT0055L 9 21
MAT0056L 5 13
MAT1033 144 26 88 24 74 24 67 26
MAT1033A 16 25 12 25 9 22
MAC1105 127 28 106 28 97 29 97 25
MAC1114 26 25 23 28 22 30 23 31
MAC1140 26 27 23 29 23 29 23 29
STA2023 73 25 61 29 66 32 78 27
MGF2106 18 26 70 30 85 28 80 27
MGF2107 13 31 15 33 17 29 18 34
MAC2233 5 13 5 17 5 20 5 17
MAC2311C 10 26 10 25 10 26 12 26
MAC2312C 5 22 5 22 4 34 6 24
MAC2313C 3 16 3 20 3 24 3 23
MAP2302C 2 12 3 11 2 21 2 22
MAS3105 1 6 1 6 1 10 1 5
MAS3301 1 4 1 5 1 4
MAS4203 1 8 1 6 1 5
MHF4404 1 10 1 10
MTG4212 1 5 1 5 1 7
STA4024 1 10 1 5 1 4 1 5
Total 655 25 589 25 516 26 515 25
Blank cells or missing years indicate no enrollment.
To prevent data from skewing, the following instructional methods are excluded: Labs associated with lectures, Private/Performance,
OJT, Clinicals, Co-op, DIS, Field trips and Internship

Average Class Size – Multiple Methods Only
Source: IR Program Assessment Data
32
CourseInstructional
Method
2013-2014 2014-2015 2015-2016 2016-2017
Sections Avg. Size Sections Avg. Size Sections Avg. Size Sections Avg. Size
MAC1105
Lecture 92 29 73 29 63 30 63 25
Hybrid 3 3 25 6 26
Online 35 25 33 26 31 26 28 26
MAC1114
Lecture 18 24 16 27 13 28 14 31
Hybrid 1 33
Online 8 26 7 32 8 34 9 30
MAC1140 Lecture 19 27 15 30 15 30 15 30
Online 7 27 8 29 8 26 8 25
MAC2233 Lecture 2 11 2 16 2 21 2 18
Online 3 15 3 17 3 19 3 17
MAC2311CLecture 9 27
Online 3 26
MAT1033 Lecture 104 26 59 25 52 23 46 25
Online 40 25 29 23 22 26 21 28
MAT0056LLecture 4 7
Online 1 39
MGF2106
Lecture 1 33 27 30 28 31 18 24
Hybrid 12 27 24 30
Online 17 26 43 29 45 27 38 27
MGF2107 Lecture 1 25 5 30 6 26 8 31
Online 12 32 10 35 11 31 10 36
STA2023
Lecture 51 26 38 29 39 30 41 26
Hybrid 4 26
Online 22 24 23 30 27 34 33 29
To prevent data from skewing, the following instructional methods are excluded: labs associated with
lectures, Private/Performance, OJT, clinicals, co-op, DIS, field trips and internships.
College Total
Instructional Method2013-2014 2014-2015 2015-2016 2016-2017
Avg. Size Avg. Size Avg. Size Avg. Size
Hybrid 22 22 21 23
Lecture 23 22 22 21
Online 28 29 30 30
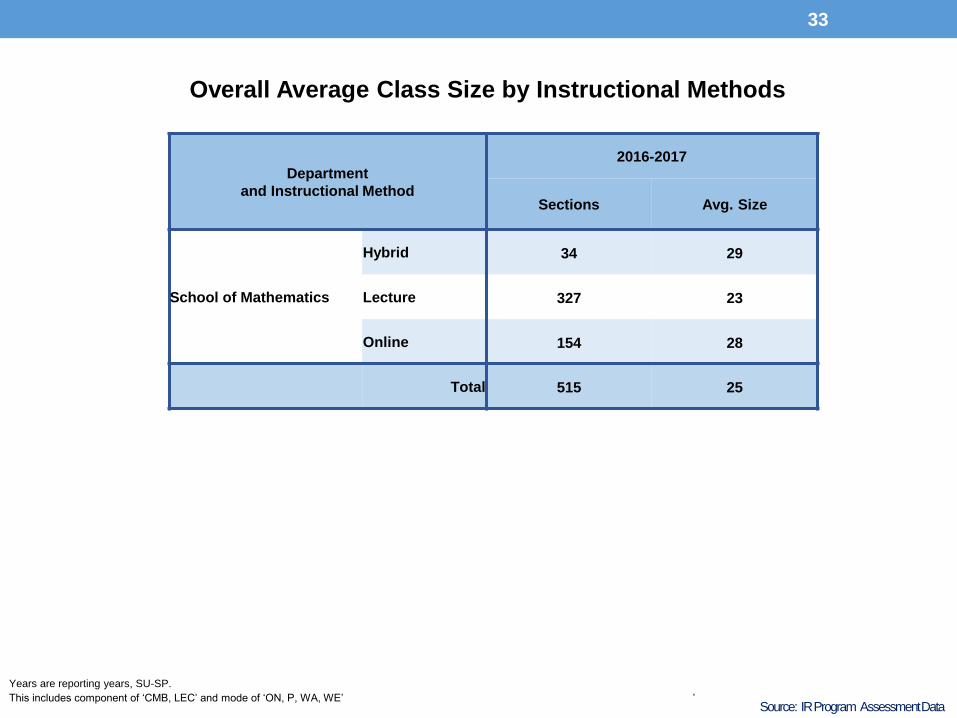
Overall Average Class Size by Instructional Methods
Source: IR Program Assessment Data
33
Department
and Instructional Method
2016-2017
Sections Avg. Size
School of Mathematics
Hybrid 34 29
Lecture 327 23
Online 154 28
Total 515 25
Years are reporting years, SU-SP.
This includes component of ‘CMB, LEC’ and mode of ‘ON, P, WA, WE’ ’
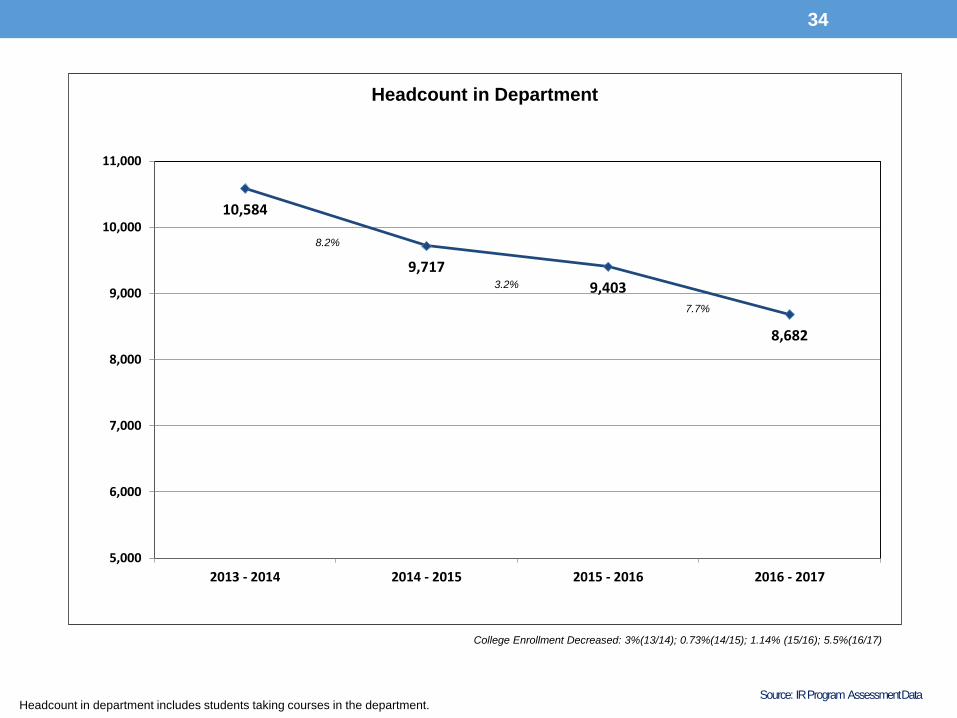
10,584
9,717
9,403
8,682
5,000
6,000
7,000
8,000
9,000
10,000
11,000
2013 - 2014 2014 - 2015 2015 - 2016 2016 - 2017
Headcount in Department
Headcount in department includes students taking courses in the department. Source: IR Program Assessment Data
34
7.7%
8.2%
3.2%
College Enrollment Decreased: 3%(13/14); 0.73%(14/15); 1.14% (15/16); 5.5%(16/17)

Calculation excludes individuals whose birthdates are not reported.Source: IR Program Assessment Data
35
28.2 28.0
25.0 25.0
26.2 25.9 26.027.0
10.0
15.0
20.0
25.0
30.0
35.0
40.0
2013 - 2014 2014 - 2015 2015 - 2016 2016 - 2017
Average Age in Department
Mathematics Daytona State College
Source: IR Program Assessment Data
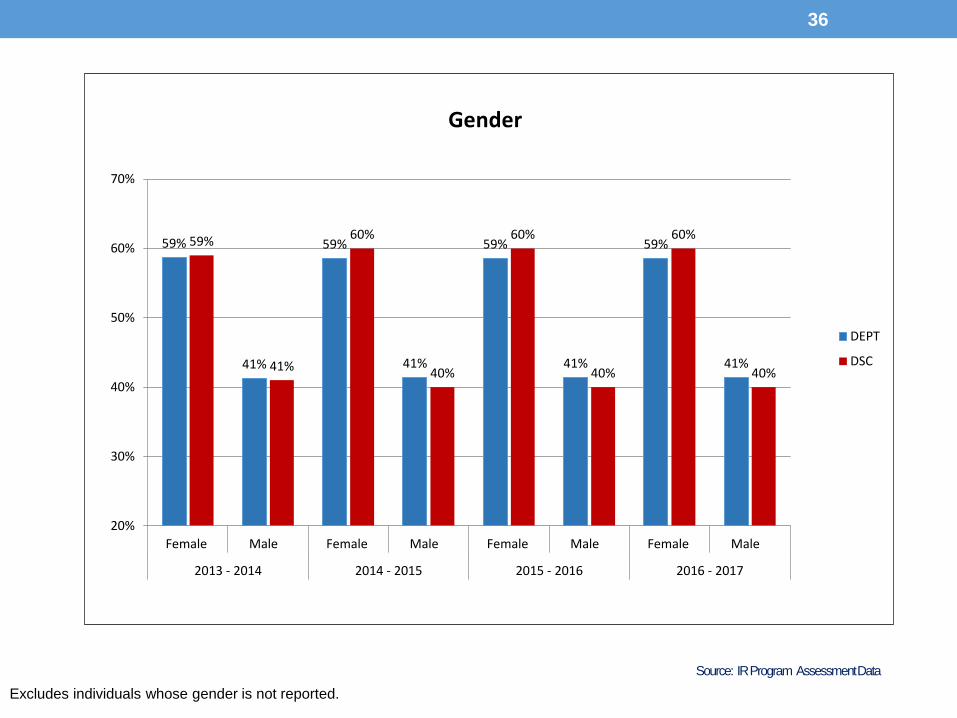
36
Excludes individuals whose gender is not reported.
59%
41%
59%
41%
59%
41%
59%
41%
59%
41%
60%
40%
60%
40%
60%
40%
20%
30%
40%
50%
60%
70%
Female Male Female Male Female Male Female Male
2013 - 2014 2014 - 2015 2015 - 2016 2016 - 2017
Gender
DEPT
DSC

American Indian / Alaska
Native 0.2%
Asian 2%
Black or African American
14%
Hispanic 18%
Native Hawaiian /
Pacific Islander0.2%
Two or More Races
3%
White 63%
2016-2017
Enrollment by Race/Ethnicity
Source: IR Program Assessment Data
37
Excludes individuals whose race / ethnicity is not reported.
American Indian / Alaska Native
1%Asian
2% Black or African American
15%
Hispanic 13%
Two or More Races
2%
White 67%
2013-2014
N=6,985
American Indian / Alaska
Native 1%
Asian 2%
Black or African American
15%
Hispanic 14%
Two or More Races
2%
White 66%
2014-2015
N=6,321
Asian 3% Black or African
American 14%
Hispanic 15%
Two or More Races
3%
White 65%
2015-2016
N=5,960
DSC Averages 2016-2017
Amer Indian/ Alaska Native Asian Black or African Amer Hispanic Nat Hawaiian Pacif Islander 2 or More Races White
0.4% 2% 14% 15% 0.2% 2% 66%
N= 8,543