
Assessment and Development of the Costa Rican Aquaculture Market
189
ANALYSIS OF THE AQUACULTURE MARKET IN THE COSTA RICAN METROPOLITAN AREA Submitted by: Brandon Boucher, Hannah Duscha, Franco Oshiro, and Smita Kurrumchand
-
Upload
phungthien -
Category
Documents
-
view
215 -
download
2
Transcript of Assessment and Development of the Costa Rican Aquaculture Market
0
ANALYSIS OF THE AQUACULTURE
MARKET IN THE COSTA RICAN
METROPOLITAN AREA
Submitted by: Brandon Boucher,
Hannah Duscha, Franco Oshiro, and
Smita Kurrumchand

i
Report Submitted to:
Prof. Jennifer Rudolph Prof. Stanley Selkow
San José, Costa Rica Project Center
By
Brandon Boucher Brandon Boucher
Hannah Duscha Hannah Duscha
Smita Kurrumchand Smita Kurrumchand
Franco Oshiro Franco Oshiro
In Cooperation With
Sr. Álvaro Otárola Fallas and Dr. Rolando Ramírez Villalobos Instituto Costarricense de Pesca y Acuicultura, Departamento de Acuicultura
ANALYSIS OF THE AQUACULTURE MARKET IN THE COSTA RICAN METROPOLITAN AREA
December 14, 2010
This project report is submitted in partial fulfillment of the degree requirements of Worcester
Polytechnic Institute. The views and opinions expressed herein are those of the authors and do not necessarily reflect the positions or opinions of the Instituto Costarricense de Pesca y Acuicultura or
Worcester Polytechnic Institute.
This report is the product of an educational program and is intended to serve as partial documentation for evaluation of academic achievement. The report should not be construed as a
working document by the reader.

ii
Abstract Our team aimed to assess and analyze the urban market for aquaculture products since these
products were not well-commercialized in the metropolitan area of Costa Rica. We accomplished
this by conducting surveys of aquaculture producers, wholesalers, market managers and consumers
of fish products. Our main deliverables included data describing the volumes and prices of fish sold,
demand for fish species, locations of purchase, consumer demographics and current advertisement
techniques as well as recommendations for developing the commercialization of aquaculture
products.

iii
Authorship Page All research conducted for this study and all writing completed in this report were done in
equal measures by Brandon Boucher, Hannah Duscha, Smita Kurrumchand and Franco Oshiro.
This final product is a collaboration by all members of the group and each member accepts full
responsibility for the contents of this paper.
From left to right: Franco Oshiro, Brandon Boucher, Hannah Duscha, and Smita Kurrumchand.

iv
Acknowledgements We would like to extend our sincerest gratitude to all of the individuals without whom this
research project would not have been possible.
First, we would like to give our most heartfelt thanks to our project liaisons, Sr. Álvaro Otárola
Fallas and Dr. Rolando Ramírez Villalobos, for the resources they provided us with to aid our work
and also for the countless hours they devoted to helping us conduct numerous interviews and
surveys.
We would also like to sincerely thank our on-site project advisors, Professor Jennifer Rudolph
and Professor Stanley Selkow, for guiding and supporting us through the research process and for
offering their advice and counseling when we needed it most.
We were lucky to have the opportunity to work with several individuals from INCOPESCA and
we would like to thank them for taking the time to escort and aid us during our data collection
process. To Sr. Carlos Luis Barrantes, Sr. Edgar Chacon Palma, Sra. Dixe Jones Grainger and Sr.
Marco Miranda Alvarez: we couldn‟t have done this without you.
We truly appreciated speaking with Sr. Marco Freer from the Wal-Mart Corporation; the
information we received during our interview with him was invaluable, as was the time he donated
to our research process.
We extend our thanks to Mr. Ken Dirst and all of the producers of trout, tilapia and shrimp who
took the time to speak with us about aquaculture production and marketing.
We also would like to thank the countless market managers, wholesalers and consumers who
were willing to participate in our interviews and surveys.
We recognize that organizing a project site takes a lot of time, effort and cooperation from a
number of people and so we would like to thank Professor Susan Vernon-Gerstenfeld, Sr. Jimmy
Music and Sra. Marcela Music for “putting a foot in the door” for us.
Thank you also to Professor Ingrid Shockey for guiding us through the preliminary stages of our
project; without her we would not have obtained all the proper skills for conducting this research.
Finally, we would like to express our gratitude to Sr. Gelman Suarez and Sra. Olga Beatriz
Rodríguez and all of their wonderful staff at Los Apartamentos Tairona for providing us with a
comfortable and friendly living and working environment for the duration of our stay in Costa Rica.

v
Table of Contents Abstract ............................................................................................................................................................... ii
Authorship Page ................................................................................................................................................ iii
Acknowledgements ........................................................................................................................................... iv
Table of Contents .............................................................................................................................................. v
Table of Figures ................................................................................................................................................ ix
Table of Tables .................................................................................................................................................. xi
Executive Summary ......................................................................................................................................... xii
Chapter 1: Introduction .................................................................................................................................... 1
Chapter 2: Background ..................................................................................................................................... 3
2.1 Brief Overview of the Aquaculture Industry in Costa Rica .............................................................................. 3
2.2 Previous Research Collaborations with INCOPESCA ..................................................................................... 7
2.3 Examination of Costa Rican Fish Imports and Exports ................................................................................... 8
2.4 Case Study – Effects of Advertising on Perceptions and Behavior: The Case of Catfish ......................... 11
2.5 Case Studies – Marketing Strategies Employed by Neighboring Countries ................................................. 12
2.5.1 Case Study 1: Nicaragua ................................................................................................................................ 12
2.5.2 Case Study 2: Honduras ................................................................................................................................ 13
2.6 General Findings .................................................................................................................................................... 14
Chapter 3: Methodology ................................................................................................................................. 15
3.1 Choosing a Representative Target Demographic ............................................................................................. 15
3.2 Market Analysis through Interviews with Local Producers ............................................................................ 17
3.3 Market Analysis through Interviews with Wholesalers .................................................................................... 18
3.4 Market Analysis through Surveys with Market Managers ............................................................................... 18
3.5 Market Analysis through Surveys of Consumers .............................................................................................. 19
3.6 Summary of Methods ............................................................................................................................................ 20
Chapter 4: Findings ......................................................................................................................................... 21
4.1 General Findings Overview ................................................................................................................................. 21
4.2 Producer Findings .................................................................................................................................................. 24
4.2.1 Trout Farm Findings ..................................................................................................................................... 25
4.2.2 Tilapia Farm Findings .................................................................................................................................... 27
4.2.3 Shrimp Farm Findings ................................................................................................................................... 30
4.3 Wholesaler Findings .............................................................................................................................................. 30
4.3.1 Wholesalers‟ Market in Heredia ................................................................................................................... 31

vi
4.3.2 Distributor from Wal-Mart ........................................................................................................................... 34
4.4 Market Manager Findings ..................................................................................................................................... 34
4.4.1 Product of Highest Demand vs. Volume of Fish Sold ............................................................................ 36
4.4.2 Market Type vs. Product of Highest Demand .......................................................................................... 36
4.4.3 A Prices vs. Product of Highest Demand .................................................................................................. 39
4.4.4 Product of Highest Demand vs. Availability of Products ....................................................................... 40
4.4.5 General Observations of Various Markets ................................................................................................ 41
4.4.6 Advertising ...................................................................................................................................................... 43
4.4.7 Comparisons with no Correlations ............................................................................................................. 44
4.5 Consumer Findings ............................................................................................................................................... 44
4.5.1 Demographic .................................................................................................................................................. 44
4.5.2 Overview of Consumer Findings ................................................................................................................ 46
4.5.3 Location of Purchase ..................................................................................................................................... 46
4.5.4 Species Consumed ......................................................................................................................................... 50
4.5.5 Desire for Accessibility of Species .............................................................................................................. 55
4.5.6 Volume of Fish Consumed .......................................................................................................................... 61
4.5.7 Frequency of Fish Consumption ................................................................................................................. 62
4.5.8 Fish Product Expenses .................................................................................................................................. 63
Chapter 5: Conclusions and Recommendations ......................................................................................... 65
5.1 Producer Conclusions and Recommendations ................................................................................................. 65
5.1.1 Trout Producer Conclusions and Recommendations .............................................................................. 65
5.1.2 Tilapia Producer Conclusions and Recommendations ............................................................................ 66
5.1.3 Shrimp Producer Conclusions and Recommendations ........................................................................... 67
5.2 Wholesaler Conclusions and Recommendations .............................................................................................. 67
5.3 Market Manager and Consumer Conclusions and Recommendations ......................................................... 67
5.3.1 Hyper- and Supermarket Conclusions and Recommendations .............................................................. 69
5.3.2 Municipal Market Conclusions and Recommendations .......................................................................... 69
5.3.3 Farmers‟ Market Conclusions and Recommendations ............................................................................ 69
5.4 Final Conclusions and Recommendations ......................................................................................................... 70
References ......................................................................................................................................................... 72
Glossary of Fish Names .................................................................................................................................. 74
Appendix A: Market Lists ............................................................................................................................... 75
Appendix A.1: Alajuela Markets ................................................................................................................................ 75

vii
Appendix A.2: Cartago Markets ................................................................................................................................. 77
Appendix A.3: Heredia Markets ................................................................................................................................ 78
Appendix A.4: San José Markets ............................................................................................................................... 79
Appendix A.5: List of Wholesalers ............................................................................................................................ 83
Appendix B: Interviews and Surveys ............................................................................................................ 85
Appendix B.1.a: Questionnaire for Producers of Aquaculture Products ............................................................ 85
Appendix B.1.b: Cuestionario para Productores de Productos de Acuicultura ................................................. 87
Appendix B.2.a: Questionnaire for Wholesalers and Exporters ........................................................................... 89
Appendix B.2.b: Cuestionario para los Comerciantes Mayoristas ........................................................................ 92
Appendix B.3.a: Questionnaires for Hypermarket, Supermarket, Municipal Market and Farmers‟ Market
Owners ........................................................................................................................................................................... 95
Appendix B.3.b: Cuestionario para Administradores de Hipermercados, Supermercados, Ferias del
Agricultor, Mercados Municipales y Ferias de Agricultor ..................................................................................... 97
Appendix B.4.a: Questionnaire for Consumers of Fish Products ........................................................................ 99
Appendix B.4.b: Cuestionario para Consumidor Final de Productos Pesqueros ............................................ 102
Appendix C: Calendar .................................................................................................................................. 105
Appendix D: Map of Onsite Locations ..................................................................................................... 106
Appendix D.1: Map of Costa Rica .......................................................................................................................... 106
Appendix D.2: Map of San José, Costa Rica ......................................................................................................... 106
Appendix E: Findings .................................................................................................................................. 107
Appendix E.1: Producer Findings ........................................................................................................................... 107
Appendix E.1.a: Trout Farm Findings ............................................................................................................... 107
Appendix E.1.b: Tilapia Farm Findings ............................................................................................................. 113
Appendix E.1.c: Shrimp Farm Findings ............................................................................................................ 120
Appendix E.2: Wholesaler Findings ........................................................................................................................ 124
Appendix E.3: Market Manager Findings .............................................................................................................. 131
Appendix E.4: Consumer Findings ......................................................................................................................... 139
Appendix E.4.a: Interview Demographics ........................................................................................................ 139
Appendix E.4.b: Standalone Findings ................................................................................................................ 142
Appendix E.4.c: Comparisons against Location of Purchase......................................................................... 145
Appendix E.4.d: Comparisons against Consumed Species ............................................................................. 150
Appendix E.4.e: Comparisons against Desire for Accessibility of Species .................................................. 156
Appendix E.4.f: Comparisons against Amount Consumed ............................................................................ 163
Appendix E.4.g: Comparisons against Frequency ............................................................................................ 164

viii
Appendix E.4.h: Comparisons against Amount Paid ...................................................................................... 165
Appendix F: Notes from Interview with Marco Freer ............................................................................ 167
Appendix G: Distribution Channel Flowchart ......................................................................................... 169

ix
Table of Figures Figure 1 - World aquaculture production: change in growth by region since 1970 (FAO, 2010) ....... 4
Figure 2 - Aquaculture Production, Costa Rica, 1950-2008 (FAO, 2010) .......................................... 5
Figure 3 - Map of Stations around Costa Rica (INCOPESCA, 2010) ............................................... 6
Figure 4 - Distribution of farm types interviewed ........................................................................... 24
Figure 5 - Typical trout restaurant sign (English translation: “Bar, Restaurant, Urasca Ranch, Sport
Fishing, Cabins, Green Lands”) ...................................................................................................... 25
Figure 6 - Example of road condition that prevents transportation of products to cities ................ 26
Figure 7 - Volume data for each trout farm .................................................................................... 27
Figure 8 - Price data for each trout farm ......................................................................................... 27
Figure 9 - Typical tilapia farm ......................................................................................................... 28
Figure 10 - Volume data for each tilapia farm ................................................................................. 29
Figure 11 - Price data for each tilapia farm ..................................................................................... 29
Figure 12 - Wholesalers' market in Heredia .................................................................................... 31
Figure 13 - Distribution of the origin of products at Cenada .......................................................... 31
Figure 14 - Average volume of species sold by wholesalers ............................................................ 32
Figure 15 - Average prices of species sold by wholesalers ............................................................... 33
Figure 16 - Distribution of market types ........................................................................................ 35
Figure 17 - Distribution of markets by city ..................................................................................... 35
Figure 18 - Methods of fish storage employed by markets .............................................................. 36
Figure 19 - Aquaculture products sold vs. marine products sold ..................................................... 38
Figure 20 - Local aquaculture products vs. imported aquaculture products ..................................... 39
Figure 21 - Comparison between product of highest demand and product availability ................... 40
Figure 22 - Typical presentation of fish at hyper- and supermarkets ............................................... 41
Figure 23 - Market manager preparing fish for sale at a municipal market ...................................... 41
Figure 24 - Typical presentation of fish at municipal and farmers‟ markets ..................................... 42
Figure 25 - Typical presentation of fish at municipal and farmers‟ markets ..................................... 42
Figure 26 - Typical farmers‟ market ................................................................................................ 43
Figure 27 - Distribution of consumers by interview location .......................................................... 44
Figure 28 - Age distribution of consumers ..................................................................................... 45
Figure 29 - Distribution of purchase location of consumers ........................................................... 47
Figure 30 - Location of purchase vs. location of interview ............................................................. 48
Figure 31 - Location of purchase vs. age ........................................................................................ 49
Figure 32 - Location of purchase vs. employment status ................................................................ 49
Figure 33 - Location of purchase vs. education level ...................................................................... 50
Figure 34 - Species consumed ........................................................................................................ 51
Figure 35 - Location of interview vs. species consumed ................................................................. 52
Figure 36 - Species consumed vs. employment status ..................................................................... 53

x
Figure 37 - Species consumed vs. age ............................................................................................. 54
Figure 38 - Species consumed vs. education level ........................................................................... 55
Figure 39 - Distribution of desire for accessibility of species .......................................................... 56
Figure 40 - Desire for accessibility of species vs. location of interview ........................................... 57
Figure 41 - Desire for accessibility of species vs. age ...................................................................... 58
Figure 42 - Desire for accessibility of species vs. marital status ....................................................... 59
Figure 43 - Desire for accessibility of species vs. employment status .............................................. 60
Figure 44 - Desire for accessibility of species vs. education level .................................................... 61
xi
Table of Tables Table 1 - Aquaculture Production in Metric Tons by Species for 2008-2009 (INCOPESCA, 2010) . 7
Table 2 - 2007 Fish Products Imports and Exports (Adapted from FAO, 2010) .............................. 9
Table 3 - Project timeline ............................................................................................................... 20
Table 4 - Wholesaler data summary ................................................................................................ 32
Table 5 - Demand of fish sold (kg/week) vs. market type .............................................................. 37
Table 6 - Comparison of data collected from market managers ...................................................... 40
Table 7 - Use of advertisements by markets ................................................................................... 43
Table 8 - Distribution of consumers' education levels .................................................................... 45
Table 9 - Volume consumed vs. demographic groups .................................................................... 62
Table 10 - Frequency of fish consumption vs. demographic group................................................. 63
Table 11 - Product expenses vs. demographic group ...................................................................... 64

xii
Executive Summary Aquaculture production has been an important cornerstone for the economy of developing
Latin American countries. The practice was first introduced to Latin America in the 1940s as a
means of fulfilling domestic consumption demands. Since the 1960s, the Latin American
aquaculture industry has been growing steadily in order to compete with other countries on a global
scale. According to the Food and Agricultural Organization of the United Nations‟ website (2010),
the Costa Rican aquaculture industry has undergone rapid development in the past 10 years.
Although Costa Rica has established an important overseas market for aquaculture products (such as
the export of tilapia to the United States), the same aquaculture products have not been competitive
at a local level.
In 1994, the Costa Rican government created the agency entitled Instituto Costarricense de
Pesca y Acuicultura (INCOPESCA). Beginning that year, INCOPESCA assumed the responsibility
for the aquaculture and fishing industry in Costa Rica and their mission to work towards the
sustainable development of the country‟s aquaculture industry has remained ever since. According to
the INCOPESCA website, one of the responsibilities of the agency is to “promote the development
of fishing and aquaculture by regulating, protecting, and managing marine resources and aquaculture
products” (INCOPESCA, 2010). Prior to our studies INCOPESCA had focused mostly on
establishing proper farming practices for the cultivation of trout, tilapia and shrimp. However, they
did not focus much on promoting local aquaculture products on the national market. Due to this
lack of assessment, we worked in conjunction with INCOPESCA to determine the state of
development of the national market for local aquaculture products in the metropolitan area of San
José and how we could improve it.
INCOPESCA identified two major long-term goals for this project: to assess the current
market for aquaculture products in the metropolitan areas of Alajuela, Cartago, Heredia and San
José and to develop suggestions for a marketing strategy that will increase aquaculture products‟
competitiveness. In order to address these goals we accomplished the following objectives:
1) Identified distribution routes for the accessibility of tilapia, trout, shrimp and other
aquaculture products in order to determine the elasticity of demand
2) Determined if the quality of local aquaculture products influenced the sales of these
products

xiii
3) Determined the level of competition between imported and local aquaculture products in the
market, and analyzed the impact of the imported products.
4) Measured the level of acceptance of the different types of products available
5) Determined current advertisement methods for Costa Rican aquaculture products
To achieve each of these objectives, we began by conducting background research. We first
investigated the development of aquaculture in Costa Rica and discovered that trout, tilapia and
shrimp were the most prominent aquaculture species. Next, we researched previous studies done by
INCOPESCA and discovered that the studies have primarily looked at the “standard practices” used
for aquaculture farming rather than the marketing aspect of the products. Furthermore, we
investigated a brief overview of the large scale imports and exports done in Costa Rica, which
helped us understand the impact of foreign goods on the local aquaculture market. As a final
preparation, we investigated three different case studies. The first involved a catfish advertisement
study that researchers conducted in the United States during the early 1990‟s in order to increase the
sales of cultivated catfish. The next two case studies were done in Nicaragua and Honduras in the
early 2000‟s in order to promote sales of aquaculture products in metropolitan markets. These
studies elucidated the procedure we should use for assessing the market in Costa Rica since these
countries share common traits with Costa Rica.
To continue with our investigation, we conducted a series of 167 interviews and surveys that
targeted producers, wholesalers, markets and consumers. We interviewed a total of 32 producers of
trout, tilapia and shrimp at their farms which were located in various regions of Costa Rica. The
trout farms were established in San Gerardo de Dota and the areas surrounding Cartago. The tilapia
farms were found in Venecia, Aguas Zarcas and La Fortuna in the region of San Carlos. The shrimp
farms were situated near Colorado next to the Gulf of Nicoya. We also interviewed 10 wholesalers
located at Cenada, a wholesaler distribution center in the city of Heredia. The market populations
were broken down further into hypermarkets, supermarkets, municipal markets and farmers‟
markets. These markets were found at various locations in the cities of Alajuela, Heredia and San
José (due to time constraints we were unable to visit markets in Cartago). Overall, 1 hypermarket, 3
supermarkets, 17 municipal markets and 9 farmers‟ markets were included in our interviews.
Additionally, we surveyed a total of 95 consumers at these markets. We conducted this study in a
one-month round of data collection which incorporated the interviews and surveys of all four
populations simultaneously. In general, we designed the interview and survey questions to provide
xiv
us with the relative volumes of aquaculture products sold, the prices of these products, where the
products were sold, public opinions on the quality of these products and reasons for buying and
consuming these products. In addition to our official interviews and surveys, we also gathered
information through personal communications with Carlos Luis Barrantes from INCOPESCA;
Marco Freer from the Wal-Mart corporation; and our liaisons from INCOPESCA, Sr. Álvaro
Otarola Fallas and Dr. Rolando Ramírez Villalobos.
After we gathered the data we proceeded with a detailed analysis. We documented the
information from interviews in Appendix E. We also used Microsoft Excel in order to document
numerical values and show relationships through graphical representations.
In our analysis, we first discovered that none of the producers were satisfied with the price at
which they purchase fish feed. Producers reported that imported feed was good quality but also very
costly and this prevented them from earning a high profit margin. Most of the producers we
interviewed owned restaurants at their farms and focused mainly on running their business rather
than concentrating on commercializing their product in the cities. When we inquired about their
reasons for not selling their products in the cities, the producers explained that they would have to
invest in both equipment for processing the fish and means for transporting the fish; many of the
producers expressed that they did not have the monetary means to accomplish this. The producers
also talked about bad road conditions which deterred them from transporting their fish to the cities.
We also made a series of findings that were specific to each type of producer. For the trout
producers, some who were situated at lower elevations spoke of an eye disease which the fish
contracted when the water temperature in the “tanks” increased too much. Another issue that trout
producers mentioned was the high level of competition between producers due to their close
proximity to one another. For the tilapia producers, their main concern was competition from large
producers that produce tilapia and also competition from other small- and medium-scale tilapia
producers. For the shrimp producers, their biggest issue was competition from Nicaragua. Products
from Nicaragua were typically cheap, which forced shrimp producers to lower their prices when they
sold their products to intermediaries. This loss of revenue resulted in a lower profit margin since
there were already so many costs involved with cultivating and harvesting the shrimp. Additionally,
the shrimp producers reported that they only sold their products to intermediaries; the price of the

xv
product consequently increased before reaching the final consumer due to the use of the
intermediaries.
All of the wholesalers reported selling marine products to the local population. Also, 4 out
of the 10 wholesalers sold cultivated products in addition to marine products. The highest-selling
product at the wholesalers‟ market was sea bass, with an average volume of 1414 kilograms sold per
month. By comparison an average volume of 375 kilograms of panga and mahi mahi (the least sold
fish) were sold per month. Furthermore, the average price of imported cultivated salmon (7000
c/kg) was the highest out of all the different prices for fish sold at the wholesalers‟ market.
For the market manager section of our findings, we analyzed a total of 30 interviews
conducted in the greater San José area. Seventy percent of the interviewees were either market
owners or managers while the other 30% were people who worked closely with fish. Many of the
markets exhibited similarities in the way that they presented the fish for sale. Nearly 100% of the
markets sold their fish fresh (preserved on ice). Almost all of the markets felt that local products
(marine and aquaculture) earned more profits than imported goods.
We also discovered that different fish were in higher demand depending on which market
was selling the fish. Certain fish were sold in different types of markets; for instance, municipal
markets sold the most sea bass and porgy out of any other market type in the study. Overall, super-
and hypermarkets mostly sold aquaculture products while municipal markets mostly sold marine
products. Additionally we found in all venues that almost 50% of the aquaculture products were
imported aquaculture products. We also found that the market was price-driven. Cheaper fish sold
more readily than more expensive fish. We additionally found that as the demand for a certain
species increased, so did its availability at that venue.
We performed a series of correlations and found that advertisement methods varied from
market to market. For example, hyper- and supermarkets employed advertising techniques and were
willing to advertise more readily than the other types of markets. Also, markets that advertised felt
that the advertisements were very effective.
Our consumer results showed that consumers thought prices were reasonable, but leaned
towards expensive. Additionally the general opinion of quality throughout was that it was of a high
caliber. The whole population had some awareness that fish had nutritional value. The main reasons

xvi
for consuming fish were due to the fact that fish is nutritious and tasty. The population liked to buy
their fish fresh. Finally, the majority of the consumers we interviewed talked about the lack of
advertisements in the marketplace and reported that they usually inquired about the products
available and their prices at the venue. Along with these general findings, we further examined other
factors.
The first factor we examined was location of purchase. If we ignore demographics, the
whole population mainly shops at hypermarkets, supermarkets, and municipal markets. We found
that the majority of consumers purchased fish at the same place we interviewed them. We also saw
that younger consumers tend to shop at hyper- and supermarkets, while older consumers shop at
municipal markets. Likewise, employed consumers tend to shop at hyper- and supermarkets, while
unemployed and pensioned consumers shop at municipal markets. For this section we also
discovered that consumers with a higher level of education tend to shop at hypermarkets and
supermarkets, while consumers with a lower level of education shop at municipal markets.
The next factor we compared was the species that consumers ate. The species that
consumers ate most commonly consumed were sea bass, shrimp, and tilapia. When comparing
species consumed to interview locations, most species stayed close to the average consumption
percentage. However, panga was mostly consumed by customers in supermarkets, porgy by
customers in farmers‟ markets, and tilapia by customers in hypermarkets. We also found that
employed consumers ate the widest variety of species and that a large percentage of employed
consumers ate tilapia. Lastly, we found it significant that consumers with a lower level of education
consumed shark, consumers with a higher level of education consumed tilapia, and a high
percentage of consumers with a university education consumed shrimp and sea bass.
Next we compared desired species and their accessibility in terms of price. In general,
shrimp and sea bass were the most desired species. Notably, a high percentage of consumers
interviewed at farmers‟ markets desired shrimp; those at hypermarkets desired sea bass and porgy;
and those at supermarkets desired sea bass, panga, and mahi mahi. When compared to age, key
findings included: younger consumers wanted more accessible salmon and shark; consumers
between 36 and 65 wanted accessible shrimp; and consumers above the age of 51 wanted accessible
porgy. With the next demographic, marital status, we found that married consumers or consumers in
a free union desired more shrimp, sea bass, and tilapia compared to single consumers. In addition
xvii
we found that employed consumers wanted accessible salmon, unemployed wanted accessible porgy,
and pensioned wanted accessible tilapia compared to the other groups. Finally we found that as a
consumer‟s education level increased, their desire for shrimp, sea bass, and salmon also increased,
and additionally consumers with a technical and university education wanted more accessible trout
compared to the other categories.
The last three factors that we compared were the volume of fish consumed, the frequency of
fish consumption, and fish product expenses. In general, consumers ate 1.34 kg of fish per week.
More specifically, in each of the demographic groups we saw that consumers above the age of 66
and consumers with a low level of education consumed the least amount of fish while employed
consumers ate the most. Furthermore, consumers ate fish an average of 5.11 times per month. To
be more specific, within each of the demographic groups we saw that consumers above the age of
66, single consumers, consumers with a low level of education, and pensioned consumers ate fish
less frequently. Lastly, consumers spent an average of 5413 colones ($10.80) per week on fish.
Our team formulated several conclusions and recommendations for INCOPESCA based on
our findings. Overall, our results indicated that producers were not satisfied with the price at which
they buy feed and were reluctant to commercialize their product nationally. They also spoke about
the competition they faced from larger corporations in the national market. We recommended that
INCOPESCA (and other organizations that focus on the betterment of local producers) work
towards providing imported feed at a lower cost, and provide facilities for producers to get their fish
ready for sale to ease the commercialization process. With regards to the problem of competition,
we recommended that INCOPESCA work in conjunction with other organizations (such as
Coonaprosal, a cooperative that aids shrimp producers to commercialize their products) to devise
methods to help producers improve their marketing skills. We also recommend (based on consumer
demand) that producers focus on the cultivation of salmon on a large scale.
From our analysis of the wholesalers‟ market we found that most wholesalers sold marine
products while only a few sold imported products. These wholesalers commercialized their product
to nearby supermarkets and other fish markets; however our analysis showed that wholesalers in
Cenada supplied a lower volume of fish in high consumer demand. With regards to this issue, we
recommended that wholesalers provide a higher volume of these species to maximize their sales and
satisfy the consumer at the same time.

xvii
i
We finally made recommendations based on the results from our surveys of market
managers and consumers. Based on the information we gathered about certain products, we
recommend that markets adjust their prices according to current consumer demand. For the future,
we recommend that each of the different venues emulate each other in the variety of products they
sell and their presentation in order to expand the variety of fish sold. Furthermore, we recommend
that markets start an advertisement campaign. For the short term, the markets should focus on the
already existing consumer demographic (average age of 51.5, mostly female, living with a spouse or
partner, gaining income, and educated). For the long term, the markets should consider expanding
this demographic. Overall, these advertisements should promote the fish‟s freshness, quality, and
nutritional value. Hyper- and supermarkets should try to promote their products‟ freshness similar
to municipal and farmers‟ markets while municipal and farmers‟ markets should attempt to achieve
the cleanliness standards of a hyper- or supermarket. Also, we found that the San José fish market is
price-driven; therefore markets should promote their products accordingly. Finally, we recommend
that markets make shrimp, sea bass, salmon and tilapia more economically accessible based on
consumer demand. This will benefit the consumers and generate more profits for different markets.
In conclusion, our group accomplished the objectives we described above. The data we
collected from trout, tilapia and shrimp farms helped us identify the distribution routes for the
accessibility of these aquaculture products and we created a flowchart that depicts these typical
channels of distribution, including channels which are extended by intermediaries. Additionally, we
surveyed 95 consumers to determine whether quality was an important factor influencing the sales
of fish products. In general, consumers admitted that their choices when buying fish were more
price-driven than quality-driven but they also said that they trusted their preferred venue to offer
products of high caliber. Additionally, we saw that almost 50% of the aquaculture products in the
market are imported. Although local aquaculture (tilapia and trout) is sold more than imported
(panga and salmon), the imported aquaculture products are cheaper than the local. In order to assess
the level of acceptance for different types of products, we questioned market managers about the
demand for different products. Our analysis showed that prices and the venue consumers shopped
at influenced the acceptance level of certain fish products. We fulfilled our final objective by
interviewing market managers and surveying consumers about current advertisement techniques. We
found that hyper- and supermarkets used different forms of advertisements while municipal and
farmers‟ markets relied on word-of-mouth.

xix
We hope that the information in this project, which includes a detailed analysis of our
findings, conclusions and recommendations from our study of the Costa Rican metropolitan area,
will help INCOPESCA to develop an effective marketing strategy for the sale of aquaculture
products. Due to the time constraints placed on our work, we were only able to focus our study on
the cities of Alajuela, Heredia and San José as a representation of the entire metropolitan area. We
believe that our project provides a very basic foundation for the development of a marketing
strategy, and therefore we recommend that INCOPESCA conducts further studies of each of these
market populations to obtain more detailed results. We propose that additional studies focus on only
one or two populations (particularly the markets or the consumers), focus on one type of product,
or be conducted over a longer time period.
1
Chapter 1: Introduction
Aquaculture production has been an important cornerstone for the economy of developing
Latin American countries. The practice was first introduced to Latin America in the 1940s; by the
1960s, the aquaculture industry had been focused on fulfilling the consumption demands at a
domestic level. Since the 1960s, the Latin American aquaculture industry has been growing steadily
in order to compete with other countries on a global scale. In Costa Rica, the aquaculture industry is
of the utmost importance to the country‟s economy. According to the Food and Agricultural
Organization of the United Nations‟ website (2010), the Costa Rican aquaculture industry has
undergone rapid development over the past 10 years. Although Costa Rica had established an
important overseas market for aquaculture products (such as the export of tilapia to the United
States), the same aquaculture products have not been competitive at a local level.
In 1994, the Costa Rican government created the agency entitled Instituto Costarricense de
Pesca y Acuicultura (INCOPESCA). Beginning that year, the responsibility for the aquaculture and
fishing industry in Costa Rica was placed on the shoulders of this organization, and it has remained
their mission to work towards the sustainable development of the country‟s aquaculture industry
ever since. According to the INCOPESCA website, one of the responsibilities of the agency is to
“promote the development of fishing and aquaculture by regulating, protecting, and managing
marine resources and aquaculture products” (INCOPESCA, 2010). Prior to our studies
INCOPESCA, in conjunction with WPI student researchers, had focused mostly on establishing
proper farming practices for the cultivation of a variety of aquaculture products. The introduction
of shrimp and tilapia (two major aquaculture products) in Costa Rica began during the 1960‟s, and
these arenas of fish farming have evolved to become major pillars of the aquaculture and fishing
industry. The cultivation of trout gained popularity shortly after the introduction of shrimp and
tilapia. Despite these advances in production, INCOPESCA did not focus on promoting local
aquaculture products on the national market. Due to this lack of assessment, INCOPESCA turned
to us to determine the state of development of the national market for local aquaculture products in
the metropolitan area of San José and how they could improve it.
For the purpose of this project, INCOPESCA identified two major long-term goals for us to
work on: to establish what the current market for aquaculture products was in the metropolitan
areas of Alajuela, Cartago, Heredia and San José and to develop suggestions for a marketing strategy
that will increase aquaculture products‟ competitiveness. A fish farming economy in which local
2
aquaculture products are more competitive has the potential to garner more profits for local
producers. In order to make this project a reality we addressed the following objectives:
1) Identified distribution routes for the accessibility of tilapia, trout, shrimp and other
aquaculture products in order to determine the elasticity of demand
2) Determined if the quality of local aquaculture products influenced the sales of these
products
3) Determined the level of competition between imported and local aquaculture products in the
market, and analyzed the impact of the imported products.
4) Measured the level of acceptance of the different types of products available
5) Determined current advertisement methods for aquaculture products
To achieve each of these objectives, we began by interviewing producers of aquaculture
products to determine the quality and variety of aquaculture products and where these products are
being sold. In addition we assessed the level of competition between imported and local aquaculture
products along with the investigation of other factors affecting the sales of local fish through
interviews of local suppliers and wholesalers. Furthermore, we interviewed sellers about the current
advertisement methods for aquaculture products and their willingness to practice more effective
marketing strategies. Simultaneously, we determined product options that appeal to local tastes and
preferences for what people would like to purchase through surveys of consumers at different
venues.
These data helped us in our search to establish the current market trends. Additionally we
made recommendations to INCOPESCA based on the information we gathered about the how
local aquaculture products could be made more competitive. The accomplishment of these
objectives addresses the goal we share with INCOPESCA: to aid their community to create a more
lucrative and thriving aquaculture business.

3
Chapter 2: Background Aquaculture, which refers to the artificial breeding and cultivation of aquatic life, has become
a necessary practice in many countries around the world where consumers of fish products have
depleted the naturally occurring resources (Kutty & Pillay, 2005, p. 3). Regions in Asia, Europe,
North America and Latin America practice aquaculture specifically to meet the demand for fish
since these areas have experienced depletion of marine resources. Costa Rica is no different from
these countries; aquaculture was established in Costa Rica to supply the demand for fish, boost the
local economy and create occupations for residents. Additionally, aquaculture products have become
a cash crop for small family farms operating in the Costa Rican countryside. While aquaculture has
proven to be successful in some ways for the Costa Rican people, it is not without faults. In the last
decade, the Instituto Costarricense de Pesca y Acuicultura (INCOPESCA) has labored to support,
expand and improve aquaculture in Costa Rica, both through their own endeavors and through
collaborations with other researchers.
In recent months, INCOPESCA representatives have questioned whether or not local
aquaculture products can feasibly compete with foreign products of the same or similar variety, with
special attention given to aquaculture sales in the metropolitan areas of San José, Alajuela, Heredia
and Cartago. To provide a basis for this project, our team examined results from past studies done
with INCOPESCA and information about imports and exports of Costa Rican fish products in
order to establish how much focus has been given to marketing local aquaculture products.
Additionally, we completed research devoted to methods of effective advertisement to better
understand how to market goods. Furthermore, we examined market studies carried out in
neighboring Latin American countries to understand successful and unsuccessful marketing
strategies in nations similar to Costa Rica. All of the above information helped us understand how
we could develop an effective marketing strategy to improve the competitive quality of local
aquaculture products against foreign goods.
2.1 Brief Overview of the Aquaculture Industry in Costa Rica According to the Food and Agriculture Organization of the United Nations‟ (FAO) website,
aquaculture experienced major global expansion from the 1700s through the 1900s due to
advancements made in seed production and involvement of new technologies of communication.
Furthermore, the aquaculture industry has undergone a substantial amount of growth over the
course of the last 50 years. FAO statistics have reported an increase of about 50 million tons of fish
4
produced in world aquaculture from 1950 to 2006. Aquaculture has become essential to satisfying
our needs for fish ever since over-harvesting of marine fish has negatively impacted the aquatic life
in the different seas and oceans. As recently as 2006, “43 per cent of fish consumed by people” were
products of the global aquaculture industry; this shows a large increase from the 9 per cent in the
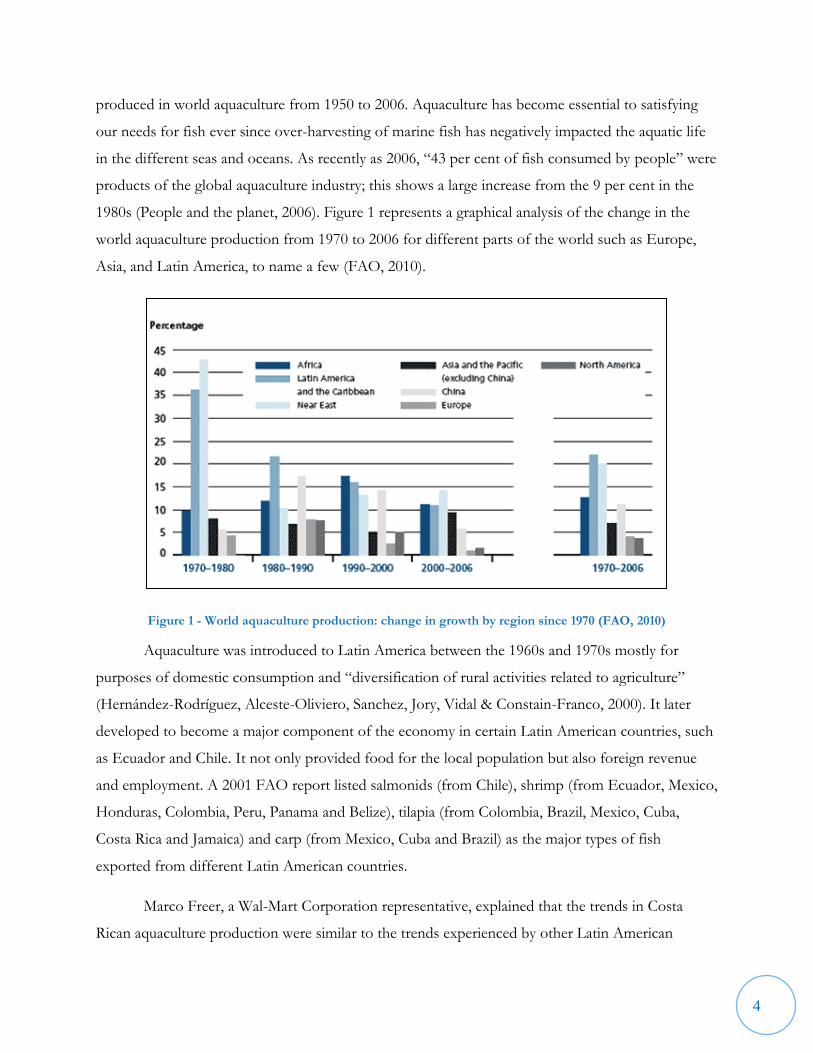
1980s (People and the planet, 2006). Figure 1 represents a graphical analysis of the change in the
world aquaculture production from 1970 to 2006 for different parts of the world such as Europe,
Asia, and Latin America, to name a few (FAO, 2010).
Figure 1 - World aquaculture production: change in growth by region since 1970 (FAO, 2010)
Aquaculture was introduced to Latin America between the 1960s and 1970s mostly for
purposes of domestic consumption and “diversification of rural activities related to agriculture”
(Hernández-Rodríguez, Alceste-Oliviero, Sanchez, Jory, Vidal & Constain-Franco, 2000). It later
developed to become a major component of the economy in certain Latin American countries, such
as Ecuador and Chile. It not only provided food for the local population but also foreign revenue
and employment. A 2001 FAO report listed salmonids (from Chile), shrimp (from Ecuador, Mexico,
Honduras, Colombia, Peru, Panama and Belize), tilapia (from Colombia, Brazil, Mexico, Cuba,
Costa Rica and Jamaica) and carp (from Mexico, Cuba and Brazil) as the major types of fish
exported from different Latin American countries.
Marco Freer, a Wal-Mart Corporation representative, explained that the trends in Costa
Rican aquaculture production were similar to the trends experienced by other Latin American

5
countries; on average, the aquaculture production levels in Costa Rica and Latin America have been
greater within the last few decades than those of all other parts of the world. Figure 1 is also a
representation of the growth trends described by Marco Freer. Costa Rica is looking to expand its
aquaculture market through sustainable development and promoting environmental friendly
practices (Freer, Personal Communication, November 11, 2010).
Aquaculture started to gain popularity in Costa Rica in 1963 with the introduction of the
Tilapia species by the Ministry of Agriculture and Husbandry. By 1974, the Costa Rican Department
of Aquaculture was created to encourage the growth of aquaculture production and facilitate the
development of aquaculture stations around Costa Rica (FAO, 2010). From there, aquaculture
production slowly increased until the 1990s as seen in Figure 2. Over time, new products (such as
trout and shrimp) became popular and their cultivation practices became standardized.
Figure 2 - Aquaculture Production, Costa Rica, 1950-2008 (FAO, 2010)
Aquaculture became more popular during the early 1990‟s; this was possibly due to
improvements in technology including better feed quality (Luis, Personal Communication,
November 17, 2010). A new institution had to be established in order to organize the expanding
practices. To address this need, the Instituto Costarricense de Pesca y Acuicultura (INCOPESCA)
was established by the Costa Rican government in 1994. Their mission statement, which has been
translated from the original Spanish, is: “to promote the development of fishing and aquaculture by
regulating, protecting, and managing marine resources and aquaculture products. This regulation

6
protects and manages marine and aquatic resources by encouraging sustainable practices as a
contribution for national economic development” (INCOPESCA 2010). The establishment of this
institution could explain the sudden boom in the mid 1990s.
INCOPESCA has established stations around Costa Rica in order to aid and educate
aquaculture farmers; the educational programs are meant to help support existing and start-up
operations. The 4 major stations can be seen in the following map.
Aquaculture Station Enrique Jiménez Núñez, in Cañas Guanacaste. Aquaculture Station Los Diamantes, in Guápiles, Limón. Aquaculture Station Cuestillas*, in San Carlos, Alajuela. Aquaculture Station Truchas, in Ojo de Agua de Dota * Cuestillas closed in 2005 and is no longer operational
Figure 3 - Map of Stations around Costa Rica (INCOPESCA, 2010)
These stations have 4 major functions. The first function of each station is to cultivate and
distribute fish fry to aquaculture producers. The second function involves investigating the
nutritional value of aquaculture products. The third function includes providing procedural
demonstrations and information about farming procedures, water quality, topography,
contamination and other related topics. The final function of each station is to conduct educational
classes on good cultivation practices (Ramirez and Otarola, Personal communication, November 8,
2010). Through the research of INCOPESCA and their associates, aquaculture production has
greatly expanded in the last decade.

7
Overall, between 2002 and 2009 the production of aquaculture products has increased. Table
1 shows the volume by weight of the three major aquaculture products (tilapia, trout, and shrimp)
for the past eight years:
Species 2002 2003 2004 2005 2006 2007 2008 2009 (estimate)
Tilapia 13,190 14,679 18,987 17,328 13,000 19,489 21,000 20,639
Trout 500 513 515 522 524 532 531 530
Shrimp 4,097 5,051 5,076 5,714 5,726 5,274 5,265 3,544
Total 17,787 20,243 24,578 23,564 19,250 25,295 26,796 24,713
Table 1 - Aquaculture Production in Metric Tons by Species for 2008-2009 (INCOPESCA, 2010)
As seen in Table 1, there have been setbacks. A major obstacle in 2006 was when contamination and
disease greatly decreased Tilapia production. A similar situation involving contamination and disease
occurred with shrimp in 2008, which caused the estimated decrease in production for 2009.
Furthermore, this disease, among other factors, increased the cost of shrimp production after 2008,
which decreased the estimated shrimp production even more (Ramirez and Otarola, Personal
communication, November 8, 2010). Although there are currently some minor obstacles in the
production of aquaculture products, the industry is still growing and seeks to expand.
2.2 Previous Research Collaborations with INCOPESCA Over the last decade, INCOPESCA has nurtured and developed its standing partnership
with Worcester Polytechnic Institute (WPI) through student research projects to improve the
aquaculture market of Costa Rica. In 2005, WPI students considered ways to regulate the production
of tilapia around the country (Broders, Douville & Slonski, 2005). In 2006, Bryand, Kadilak and Pani
conducted a project entitled “Good Management Practices for Shrimp Farming in Costa Rica” for
similar purposes regarding shrimp farming, and again in early 2010 Beland, Buckley, Miggins and
Warren submitted a report entitled “Good Practices for the Cultivation of Trout in Costa Rica”,
which described the ways in which trout production could be made more consistent and
standardized. The results and conclusions of these projects were of considerable help to this study
since the previous projects provided us with a foundation for the need to make aquaculture products
more competitive in the metropolitan area.
The goals of the previous projects were very similar, with the main difference being the type
of aquaculture product considered; all three projects sought to improve the production methods of a
specific species of aquaculture product. The research teams also chose a similar set of objectives to

8
help them accomplish their goals; each group of student researchers elected to conduct surveys with
aquaculture producers to determine the best cultivation practices. Additionally, the results of the
projects were similar since each group developed some form of literature detailing the important
aspects of the best practices they discovered. These publications were meant to be distributed to
aquaculture producers to help them improve their overall production. The past research only
devoted attention to identifying local markets for the aquaculture products and how best to market
these products at these venues, however they all lacked assessment of the potential for these
products to be sold in the metropolitan markets.
2.3 Examination of Costa Rican Fish Imports and Exports One goal that INCOPESCA and our team wanted to address in this project was how
imported fish goods impacted the local economy in Costa Rica. In order to do this, we evaluated the
trade of fish products into and out of the country. This analysis of imports and exports was
necessary in order to find a better means of marketing the aquaculture products in Costa Rica. A
study done by Rolando Ramírez Villalobos, the marketing chief of INCOPESCA, indicated that the
national aquaculture industry has been important to the local economy as well as to the economies
of surrounding countries, including the United States (Ramírez, 2007). This industry has been shown
to create jobs for the local economy; in 2002, Costa Rican fisheries made up about 0.32% ($65.6
million) of the Gross Domestic Product. This report also shows that there was a steady increase in
fish consumption by the general population from 2001 to 2004. Fisheries and fish farmers should
have had to produce more in order to meet this demand, however they have not been able to (as the
GDP indicates). In recent years, the deficit has been made up for by importing products from other
countries. If this trend continues, the local fish farming economy will be less profitable than it could
be if it were able to meet domestic demand (Ramírez, 2007).
Trout farming as a business in Costa Rica began in 1974; it did not start earning a significant
profit until ten years later. These businesses have grown at a slow rate and consequently remain on a
smaller scale than other types of fishery products. By contrast, large scale tilapia aquaculture was
introduced to the country in 1998. Tilapia, a relatively new business, was produced at a much higher
rate than other fish products, and some large scale tilapia farms are able to export their products to
surrounding countries due to the larger amount of production. In 2006, over $25 million of tilapia
was exported, and in 2008, the tilapia industry was valued at over $50 million dollars. On the other
hand, the trout industry totaled $2 million dollars. Shrimp, another Costa Rican aquaculture product,

9
was introduced to farmers in 1987. According to the FAO database, by 2008, this product was
shown to be nearly 15 times the value of trout (FAO, 2010).
A factor contributing to the increased demand for tilapia and shrimp in the local market is
the increase of exportation and the value of the fish outside the country. Since the U.S. and other
countries pay a premium price for the product, the local Costa Rican fisheries do not sell much of
the fish to the local market if they can export their product at a higher profit. A simple example of
this trend is the prices that are offered in the US market and the local Costa Rican fish marketplace.
INCOPESCA website analyses indicated that fish sold for more money in the US market in 2010
than the same type of fish did in the greater San José area (INCOPESCA, 2010). In this case, it
would not be profitable for the large-scale aquaculture industry to sell their products in the local
Costa Rican marketplace.
A simple example to show the market‟s situation is an analysis of consumer versus producer
nations throughout the world. Many countries in Central America are fish producing nations. In
contrast, the United States and some other European nations are considered to be consumer nations
of the industry since these countries import more than they export. Table 2 shows that in 2007,
Costa Rica imported nearly $45 million worth of fish products. In the same year, the country
exported over $107 million in fish products. By comparison, Honduras, Panama, and Nicaragua
imported almost $19 million, $25 million and $6.6 million respectively. The table also shows an
import to export ratio where a ratio lower than one represents a country with net exports; a ratio
above one represents net imports (FAO, 2010).
Country Imports Exports Ratio
Costa Rica $ 44,972,000 $ 107,255,000 0.4019
Nicaragua $ 6,599,000 $ 96,448,000 0.0648
Panama $ 24,999,000 $ 362,304,000 0.0690
Honduras $ 19,080,000 $ 186,934,000 0.1020
United States $ 11,966,731,000 $ 4,436,746,000 2.6972
Table 2 - 2007 Fish Products Imports and Exports (Adapted from FAO, 2010)
These data show that these Central American countries export at least ten times or more
than the amount they import. On the other hand, Costa Rica is importing fish at a higher rate in
comparison to other Central American countries. This can be problematic from a consumer‟s

10
economic standpoint because it costs money to import and export the fish, when the product could
be produced and consumed within the country (FAO, 2010).
Since exportation is so profitable, the benefits outweigh the costs. Importation, on the other
hand, is associated with competition in the market with local products. One solution to decrease
competition with foreign products is to increase the sales of the local fish products. This would
consequently increase the local market since producers would be selling the products to the local
businesses; this could potentially lead to a decrease in the amount of fish being imported. In
economic terms, this is referred to as the opportunity cost; with respect to selling fish, this translates
to decreasing the ratio of imports in relation to locally produced fish (Parkin, 2005).
In order to lower the opportunity cost, local small-scale fisheries must compete with
imported fish in the local marketplace. Problems arise if the local fisheries are not producing the
types of fish in demand by the local residents or if marketplaces are not selling those species of fish.
This issue requires that local fisheries consider growing different types of fish to meet the demand
of local expectations. We designed our market study to investigate whether or not new species are
feasible for marketing to the local population (INCOPESCA, 2010).
Another problem local fisheries face is their reputation. If local farms and distribution
centers are unregulated or unsanitary compared to the regulated imported goods, consumers will not
purchase those goods. Rolando Ramírez Villalobos‟s 2007 report identified several issues that affect
the local business; these include the means by which fish are transported, stations en route to the
market, and the market itself. According to the report, the transportation vehicles, whether they are
boats or trucks, have improper refrigeration and inadequate storage methods. The marketplaces also
usually have insufficient refrigeration and there is cross-contamination between different products
(Ramírez, 2007). All of these factors can add to the poor public perception of the local fisheries. To
address the potential problem, our team investigated the public perception of fish products.
After analyzing the amounts of imports and exports of aquaculture products in Costa Rica,
we have found that there is a potential for increasing the demand for locally raised fish by lowering
the opportunity cost. Ramírez‟s (2007) study shows the local population could have a poor
perception of the local products. By marketing these products to the local residents, perceptions can
change and profits increase.
11
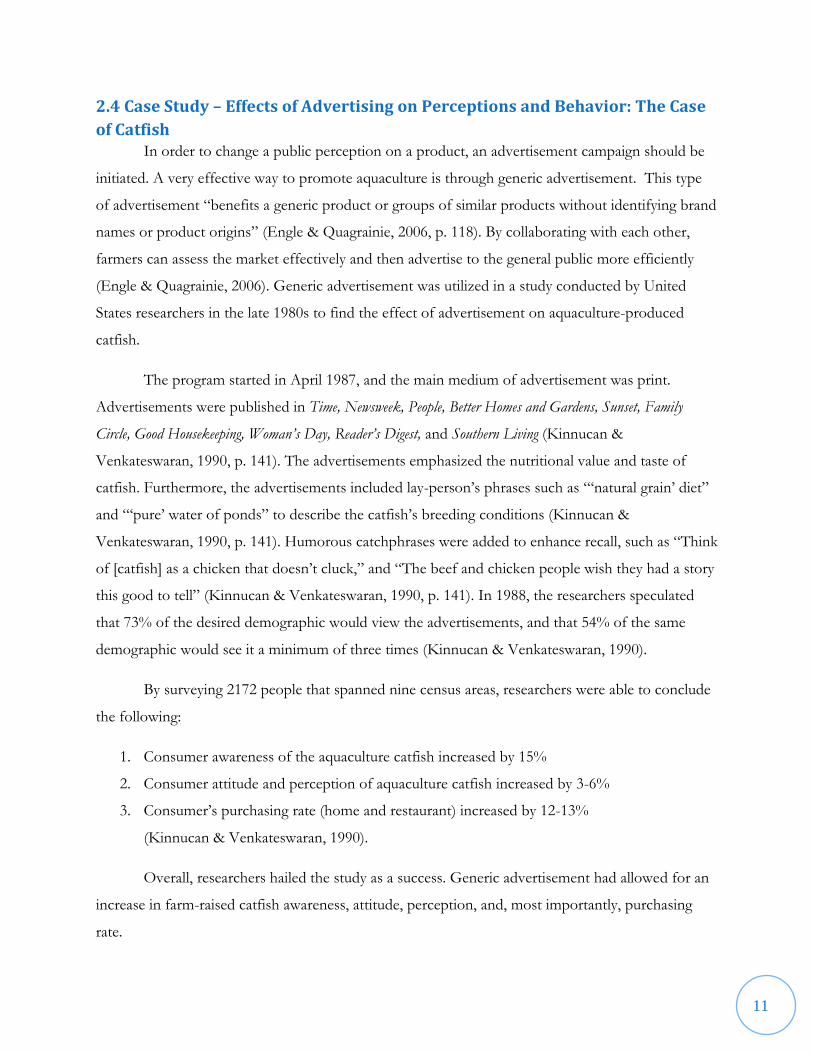
2.4 Case Study – Effects of Advertising on Perceptions and Behavior: The Case
of Catfish
In order to change a public perception on a product, an advertisement campaign should be
initiated. A very effective way to promote aquaculture is through generic advertisement. This type
of advertisement “benefits a generic product or groups of similar products without identifying brand
names or product origins” (Engle & Quagrainie, 2006, p. 118). By collaborating with each other,
farmers can assess the market effectively and then advertise to the general public more efficiently
(Engle & Quagrainie, 2006). Generic advertisement was utilized in a study conducted by United
States researchers in the late 1980s to find the effect of advertisement on aquaculture-produced
catfish.
The program started in April 1987, and the main medium of advertisement was print.
Advertisements were published in Time, Newsweek, People, Better Homes and Gardens, Sunset, Family
Circle, Good Housekeeping, Woman’s Day, Reader’s Digest, and Southern Living (Kinnucan &
Venkateswaran, 1990, p. 141). The advertisements emphasized the nutritional value and taste of
catfish. Furthermore, the advertisements included lay-person‟s phrases such as “„natural grain‟ diet”
and “„pure‟ water of ponds” to describe the catfish‟s breeding conditions (Kinnucan &
Venkateswaran, 1990, p. 141). Humorous catchphrases were added to enhance recall, such as “Think
of [catfish] as a chicken that doesn‟t cluck,” and “The beef and chicken people wish they had a story
this good to tell” (Kinnucan & Venkateswaran, 1990, p. 141). In 1988, the researchers speculated
that 73% of the desired demographic would view the advertisements, and that 54% of the same
demographic would see it a minimum of three times (Kinnucan & Venkateswaran, 1990).
By surveying 2172 people that spanned nine census areas, researchers were able to conclude
the following:
1. Consumer awareness of the aquaculture catfish increased by 15%
2. Consumer attitude and perception of aquaculture catfish increased by 3-6%
3. Consumer‟s purchasing rate (home and restaurant) increased by 12-13%
(Kinnucan & Venkateswaran, 1990).
Overall, researchers hailed the study as a success. Generic advertisement had allowed for an
increase in farm-raised catfish awareness, attitude, perception, and, most importantly, purchasing
rate.

12
2.5 Case Studies – Marketing Strategies Employed by Neighboring Countries In order to make a more comprehensive and effective study of the ways to improve the local
aquaculture market in Costa Rica, we investigated market studies in the neighboring countries of
Latin America. These countries share some common important traits with Costa Rica, including
their culture, economic stability and the importance of the domestic fish industry.
2.5.1 Case Study 1: Nicaragua
In Nicaragua, the “total fish production (fisheries and aquaculture) has shown, with some
fluctuations, an increasing trend during the decade from 1996 to 2005, having peaked in 2005 with
approximately 40,000 [tons]” (FAO, 2010). This rise in aquaculture consisting mostly of shrimp in
this case changed significantly from 1996 to 2001 from 18 percent to 34 percent of total fisheries
production. While an important aspect of aquaculture production was access to foreign currency
through exportation, the local consumption remained low since most of the fish obtained nationally
came from “industrial fishing” rather than from local farms (FAO, 2010). Aquaculture also has
many impacts on the domestic market of a country. It brings in economic benefits through the
creation of jobs and proves to be less costly than setting up an international market for a certain
product (Engle R. & Neira Ivano, 2003a, p. 1). According to the FAO (2010), shrimp farming in
Nicaragua in 2004 resulted in the creation of “11, 749 jobs; 7.855 in companies and associations
directly linked to the production, gathering and fishing 3.360 to larvae and 534 worked in
laboratories and related activities” (FAO, 2010).
As a strategy to develop the fish industry, the Nicaraguan authorities planned to expose the
local market to various types of fish production in order to obtain more revenue on the domestic
level and to develop the potential for aquaculture in different areas of the country. A study
conducted in 2001 in Nicaragua consisted of determining the feasibility of selling farm raised tilapia
in open-air marketplaces, supermarkets and restaurants (Engle R. & Neira Ivano, 2003a). The
research project was useful for gathering general information about the characteristics that
consumers look for in the fish that they buy at these venues. From the survey conducted among fish
vendors, “the researchers found that fish vendors tend to live in areas with larger population density
where the standard of living is higher” (Engle R. & Neira Ivano, 2003a, pg 7). In addition, fish
vendors affirmed that there are several factors that affect their choice of fish they display for sale:
quality, size of the fish, price and supply, with quality being the most important criterion for the fish
they buy from the fish farms (Engle R. & Neira Ivano, 2003a). Restaurant owners have many more

13
requirements for the fish they obtain from fish farms: quality, price, size, availability, odor, taste,
variety of species, ease of preparation and color (Engle R. & Neira Ivano, 2003c). When interviewed,
supermarket owners indicated that storing fish was a problem when they buy fish from wholesalers.
From these findings, we concluded that the population wanted a fish product that is tasty, flavorful,
good quality and safe for consumption (Engle R. & Neira Ivano, 2003b). Farmers and processors
therefore must ensure the quality and taste of the fish to eradicate consumer doubts and fears while
making sure that they can provide a “consistent supply” (Engle R. & Neira Ivano, 2003b, p. 18).
2.5.2 Case Study 2: Honduras
Honduras was another country of interest. The aquaculture industry proved not only to be a
major source of foreign exchange but also provided a myriad of jobs to the national population
thereby maintaining the economic stability of the country. According to the FAO, the consumption
of fish per capita increased by 2.5 kg per person from 1991 to 2000 suggesting an increase in the
demand for fish products on a national level (FAO, 2010). In a study conducted in 2001 to
determine the scope of selling farmed raised fish, namely tilapia, fish vendors were randomly
selected and interviewed. In contrast to the study carried out in Nicaragua, tilapia seemed to be a
more popular product in Honduras. A Honduran study noted, “the tilapia farming industry debuted
with small family run businesses which later expanded due to the increasing exports that made
Honduras more attractive to foreign investors” (Fúnez, Neira & Engle, 2003). Similarly in Costa
Rica, the tilapia industry was begun on a small scale with family-run businesses; later the government
started exporting tilapia overseas to bring in foreign revenue and this overseas market has proven to
be very lucrative for the Costa Rican economy.
Compared with other countries in Latin America, Honduras developed its aquaculture
industry to a higher level by focusing on diversifying the fish cultivated in the farms, especially
shrimp and tilapia, but catfish and eels as well. They also looked into expanding the aquaculture
industry to marine aquaculture through the cultivation of mollusks. As this type of aquaculture
involves breeding in cages, it would solve Honduras‟ problem of limited space (FAO, 2010). In an
effort to develop its aquaculture industry, governmental organizations in Honduras obtained
international help notably from the European Union, the Republic of China as well as Auburn
University (Alabama, USA) (FAO, 2010). To improve the aquaculture sector in the future, the
Honduran government is likely to impose new legislation to incorporate scientific research (FAO,
2010).
14
2.6 General Findings The information obtained for this background helped us develop the basis for the study for
INCOPESCA. We determined how the Costa Rican aquaculture market was begun and how it was
developed over the last half of the century. We established that previous studies have primarily
looked at the “standard practices” used in aquaculture farming rather than the marketing aspect of
the local aquaculture products. Furthermore, an overview of the large scale imports and exports
done in Costa Rica demonstrated the impact of foreign goods on the local aquaculture market. A
more developed local aquaculture industry, which could be achieved by increasing the
competitiveness of local aquaculture products, would eventually increase the profits from that local
aquaculture producers earn from their products. Additionally, there was a need to develop an
effective marketing strategy so that the national economy can benefit from the socio-economic
aspects of aquaculture. We found that in order to make this step feasible, an effective method of
advertisement should be adopted. Our research enabled us to obtain more information on how to
incorporate advertisement techniques in the marketing of fish. Finally, a detailed study of the fish
markets in neighboring countries helped us to understand the procedure we should use for assessing
the market in Costa Rica since these countries share similar economic stability trends. With this
knowledge, we established a foundation on which to build the Costa Rican aquaculture market.

15
Chapter 3: Methodology The goal of our project was to assess the current state of the Costa Rican fish market in the
cities of Alajuela, Cartago, Heredia, and San José in order to develop a marketing strategy to enhance
local aquaculture products‟ competitive edge against all other fish goods, both national and foreign.
We accomplished each of the following objectives:
1) Identify distribution routes for the accessibility of tilapia, trout, shrimp and other aquaculture
products in order to determine the elasticity of demand
2) Determine if the quality of local aquaculture products influences their sales
3) Determine the level of competition between imported and local aquaculture products in the
market, and analyze the impact of the imported products.
4) Measure the level of acceptance of the different types of products
5) Determine current advertisement methods for aquaculture products and assess the impact of
some possible changes
Our methods for achieving these objectives included gathering information through surveys and
interviews. We targeted the following populations: local producers, wholesalers, managers of
markets, and consumers of fish products. This study was conducted in one month of data collection
through interviews and surveys of all four populations. The data collected was later catalogued and
analyzed; the results of this analysis will be discussed in Chapters 4 and 5.
3.1 Choosing a Representative Target Demographic The target populations for this project consisted of the producers of aquaculture products in
Costa Rica and the wholesalers, sellers and consumers of aquaculture products in the greater San
José metropolitan area, which includes the cities of San José, Alajuela, Heredia and Cartago.
Information on producers was obtained through INCOPESCA. Lists of wholesalers‟ and sellers‟
locations and affiliations were provided by INCOPESCA. Lastly, information found by the Instituto
Nacional de Estadística y Censos provided a general demographic for the population of Alajuela,
Cartago, Heredia and San José.
Aquaculture installations are scattered all over Costa Rica. Tilapia farms are located at the
lower elevations of Costa Rica due to the fact that tilapia is more effectively cultivated in warmer
climates. On the other hand, trout is cultivated at colder climates, which means that their farms are
located at higher elevations. Lastly, shrimp farms are located in the northwestern Pacific coast of
16
Costa Rica near the Gulf of Nicoya, because they are cultivated in salt water (Ramirez and Otarola,
Personal communication, November 8, 2010).
Wholesalers are companies or individuals who buy from the producers in order to distribute
the goods to markets in bulk. Overall, there are 48 major wholesalers in Costa Rica. Markets, on the
other hand, are general venues that sell fish to consumers. These include hypermarkets,
supermarkets, municipal markets, and farmers‟ markets. The major hypermarket in Costa Rica is
Hipermas. The major supermarkets in Costa Rica are Mas x Menos, Palí, Automercado, Grupo
GESSA (Montelimar, Peri Club, Ecos, Perimercados, Jumbo Supermercados, and Super Compro),
and Corporacion Megasuper. Furthermore, there are many other smaller markets and fisheries. In
total, there are 298 markets in the greater San José metropolitan area. Divided up, there are 161
markets in San José, 59 markets in Alajuela, 42 markets in Heredia, and 36 markets in Cartago
(Ramirez and Otarola, Personal communication, November 8, 2010). Appendix A contains a
complete list of wholesalers and markets provided by INCOPESCA.
Consumers are the people living in the metropolitan regions of Costa Rica (Alajuela,
Cartago, Heredia and San José). The Instituto Nacional de Estadística y Censos has estimated the
following statistics for these cities. In San José there are a total of 349, 152 people, with 49.9% males
and 50.1% females. In Alajuela there are a total of 283,166 people, with 50.6% males and 49.4%
females. In Heredia there are 132,579 people, with 49.7% males and 50.3% females. In Cartago there
are a total of 155,402 people, with 50% males and 50% females.
As shown in the above information, we were faced with a very large geographical area to
travel and a very large amount of people to gather information from. We were also challenged by the
very brief window of time allotted for completing this study. In order to narrow down our
demographic to a manageable size, we had to make assumptions about our populations based on
information shared by our sponsors. For instance, we elected to visit producers of tilapia, trout and
shrimp because they are the most developed types of aquaculture production in Costa Rica;
therefore they have the most potential to meet the market demand. We also chose to interview
wholesalers at the Cenada wholesaler distribution center in Heredia because it distributes one of the
largest volumes of national fish products in Costa Rica. Additionally we interviewed distributors
from the Wal-Mart Corporation because they also distribute large volumes of national fish products.
Lastly, we selected hypermarkets, supermarkets, municipal markets and farmers‟ markets as the

17
particular venues to interview market managers and consumers at because these venues are
representative of different economic backgrounds. In general, we focused on the cities of Alajuela,
Cartago, Heredia and San José as representative of the metropolitan area because they are the largest
cities in Costa Rica; due to the time constraints of our project, we only visited Alajuela, Heredia and
San José because Cartago had the fewest markets to interview at and therefore would not provide as
much information as the other three cities.
3.2 Market Analysis through Interviews with Local Producers We conducted interviews with local trout, tilapia, and shrimp producers in order to
determine the current market situation and how the market could be improved. For these interviews,
we developed questions to be addressed by local farmers about the species of fish cultivated,
relevant information about their quantity and price, and the different venues at which the products
are sold. In addition, we included questions about the demand for aquaculture products and
different problems farmers encountered during the marketing of their aquaculture products. We
conducted these interviews at the local farms in November 2010. The trout farms were located in
San Gerardo de Dota and the areas surrounding Cartago. The tilapia farms were located in Venecia,
Aguas Zarcas and La Fortuna in the region of San Carlos. The shrimp farms were located in
Colorado near the Gulf of Nicoya. Appendix B.1 contains the full list of interview questions and
Appendix D shows the locations of the farms. To gather additional information, we asked further
interview questions based on our conversations with the producers and observed site-specific
conditions relevant to marketing. We took note of the sizes of the farms and some of the advertising
methods used to attract business.
We conducted these interviews and made observations in order to gather information to
make a complete analysis of the fish market in the greater San José area. Interviewing the producers
provided us with insight into whether or not proper fish farming techniques were being used, the
quantity and price of fish that were being cultivated, where the fish were being sold and producers‟
opinions about the revenue they were earning from the sales of their products. An Excel
spreadsheet was used to analyze the data to extrapolate trends found in the aquaculture market.
We also gathered information during informal interviews with Sr. Carlos Luis Barrantes who
accompanied us to all of the aquaculture farms we visited and who was also of great assistance as a

18
liaison between ourselves and the producers. We inquired about the locations of the farms we were
visiting and also about general history of each type of aquaculture production.
3.3 Market Analysis through Interviews with Wholesalers For these interviews, we developed questions for wholesalers about the different types of
fish that they sell, the organizations they represent, the venue at which the products are sold, and the
areas of the market that their sales cover. To conduct these interviews, we held individual meetings
with each wholesaler at their respective offices. We interviewed wholesalers from the following
organizations: Cenada and the Wal-Mart Corporation. The interviews took place in November 2010;
a full list of interview questions can be viewed in Appendix B.2 and the location of the wholesalers‟
market can be viewed in Appendix D.
These queries were important because wholesalers control the majority of fish distribution
after producers distribute the fish to them. Wholesalers also influence the types and quantities of
fish sold at each type of venue. The wholesalers provided us with information about current
availability and cost of most types of fish goods sold in markets. The results of these interviews were
quantified in an Excel spreadsheet to mine the data and address the questions of our problem
statement.
3.4 Market Analysis through Surveys with Market Managers For these surveys, we developed questions for market managers to inquire about the types of
fish sold at their respective venues and to determine the ratio of imported fish sold to domestic
aquaculture products sold. We also investigated the methods in which the products are preserved in
the markets and how they were advertised to consumers. We investigated four types of “markets”:
hypermarkets, supermarkets, municipal markets, and farmers‟ markets. A hypermarket is a large scale
department store with a grocery department similar to Wal-Mart or Target in the United States. One
of the biggest hypermarket companies in Costa Rica is Wal-Mart, which runs Mas X Menos,
Hipermas, and Palí. Supermarkets are small scale stores which sell mostly food. These markets
include MegaSuper and AutoMercado. Municipal markets are general fisheries in the cities of
Alajuela, Cartago, Heredia, and San José. Farmers‟ markets are markets where the producers sell
directly to the consumers. To conduct these surveys we held individual meetings with the managers
of the markets. In addition to the pre-developed interview questions, we also inquired after the
estimated volumes and prices of fish species sold. The surveys took place in November 2010;
19
Appendix B.3 contains a full list of interview questions and Appendix D shows the locations of the
markets we visited.
These surveys with market managers were important because markets are the connection
between the fish products and the consumer. Markets set prices based on the demand of consumers
and the supply of wholesalers and producers. Furthermore, markets determine how the fish are
advertised and presented to the consumer. The various types of markets provided us with general
information about the products (species, price, origin, and quantity) and how these products were
advertised. The results of these surveys were quantified in an Excel spreadsheet to determine
answers to our problem statement.
3.5 Market Analysis through Surveys of Consumers Through these surveys, we inquired about the types of fish that consumers prefer to buy and
their weekly amount of fish consumption. We additionally asked consumers about the prices they
pay for fish products, the reason for their preferences, their opinions on the quality of the products,
their awareness and opinions of the nutritional benefits of the products, and the species of fish they
would like to have more readily available. Our team proceeded to collect data through surveys of
individual consumers at marketplaces; we chose individual, random surveys as a more effective way
to collect a representative sample of the population. In order to gather data, we interviewed
consumers at different venues in the cities of Alajuela, Heredia and San José. The venues consisted
of hypermarkets (e.g., Hipermas), supermarkets (e.g., Mas x Menos), municipal markets (e.g.,
Mercado Municipal de San José) and farmers‟ markets (e.g., Mercado Central de Alajuela) in
November 2010; Appendix B.4 contains a full list of survey questions and Appendix D shows where
we interviewed the consumers.
An analysis of the market from the consumers‟ points of view was an important aspect for
our team to consider in assessing the current state of the Costa Rican aquaculture market.
Consumers are situated at the final end of the fish product distribution chain. It was necessary to
gather information from the consumers about which advertising methods were most appealing to
them as well as which methods raised their awareness of certain types of fish on sale. In addition,
consumer surveys helped us gather information about their opinions of the quantity, supply and
price of the fish products that are sold at the different venues. The collected data was tabulated in an
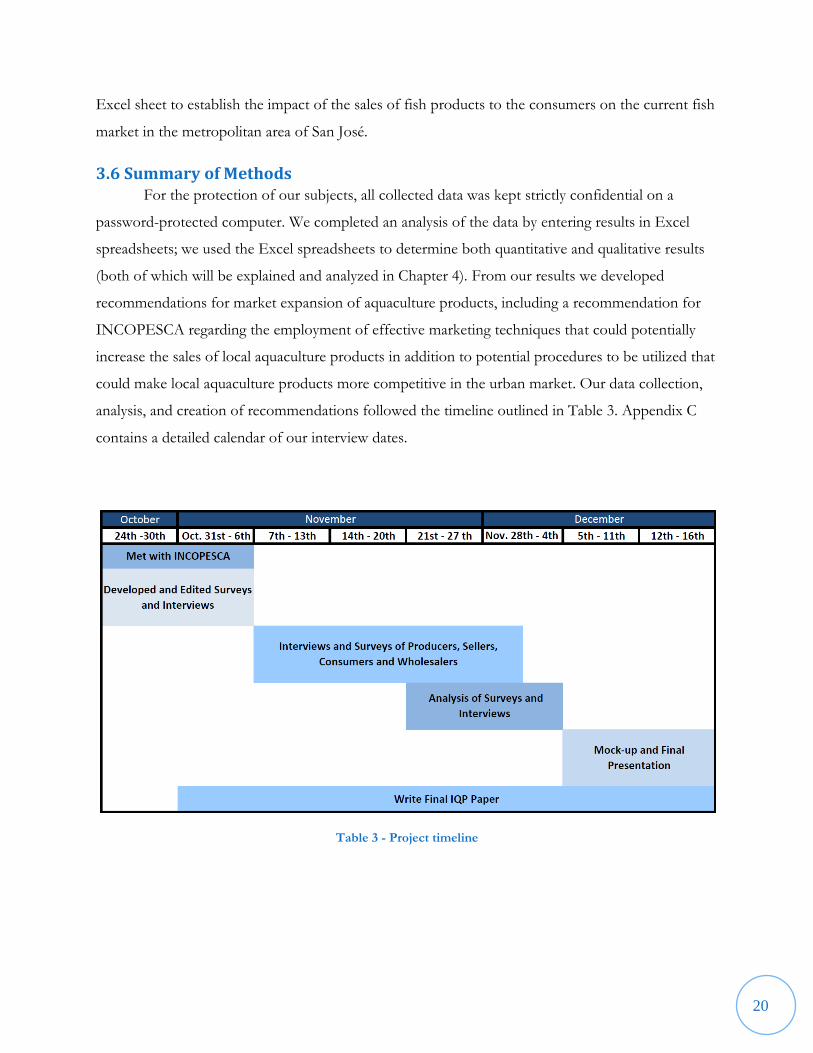
20
Excel sheet to establish the impact of the sales of fish products to the consumers on the current fish
market in the metropolitan area of San José.
3.6 Summary of Methods For the protection of our subjects, all collected data was kept strictly confidential on a
password-protected computer. We completed an analysis of the data by entering results in Excel
spreadsheets; we used the Excel spreadsheets to determine both quantitative and qualitative results
(both of which will be explained and analyzed in Chapter 4). From our results we developed
recommendations for market expansion of aquaculture products, including a recommendation for
INCOPESCA regarding the employment of effective marketing techniques that could potentially
increase the sales of local aquaculture products in addition to potential procedures to be utilized that
could make local aquaculture products more competitive in the urban market. Our data collection,
analysis, and creation of recommendations followed the timeline outlined in Table 3. Appendix C
contains a detailed calendar of our interview dates.
Table 3 - Project timeline

21
Chapter 4: Findings For the purpose of gathering data for our analysis, we conducted a grand total of 167
interviews and surveys in Costa Rica. We interviewed 32 producers, which included 13 trout farmers,
12 tilapia farmers and 7 shrimp farmers. In addition, we interviewed 10 commercial wholesalers to
gather information regarding the supply, quantity and price of the fish that they sell to the markets.
We also conducted interviews with market managers in 30 different marketplaces to gather
information about the commercialization of the types of fish that are sold at their respective venues.
Simultaneously, we surveyed 95 consumers at these market locations. The following sections are an
overview of the results from the analysis of these interviews and surveys conducted by our team. For
reference in this chapter, 500 colones (Costa Rican currency, abbreviated as “c”) is approximately
equal to one U.S. dollar in the year 2010 and Appendix G contains a distribution flowchart for the
movement of fish products through the market.
4.1 General Findings Overview In general, we made several important discoveries from each of the populations we
interviewed. First, we discovered that none of the producers were satisfied with the price at which
they purchase fish feed. Producers reported that imported feed was good quality but also very costly
and this prevented them from earning a high profit margin. Most of the producers we interviewed
owned restaurants at their farms and focused mainly on running their business rather than
concentrating on commercializing their product in the cities. When we inquired about their reasons
for not selling their products in the cities, the producers explained that they would have to invest in
both equipment for processing the fish and means for transporting the fish; many of the producers
expressed that they did not have the monetary means to accomplish this.
We also made a series of findings that were specific to each type of producer. For the trout
producers, some who were situated at lower elevations spoke of an eye disease which the fish
contracted when the water temperature in the “tanks” increased too much. Another issue that trout
producers mentioned was the high level of competition between producers due to their close
proximity to one another. For the tilapia producers, their main concern was competition from large
producers that produce tilapia and also competition from other small- and medium-scale tilapia
producers. For the shrimp producers, their biggest issue was competition from Nicaragua. Products
from Nicaragua were typically cheap, which forced shrimp producers to lower their prices when they
sold their products to intermediaries. This loss of revenue resulted in a lower profit margin since

22
there were already so many costs involved with cultivating and harvesting the shrimp. Additionally,
the shrimp producers reported that they only sold their products to intermediaries; the price of the
product is increased before reaching the final consumer due to the use of the intermediaries.
All of the wholesalers reported selling marine products to the local population. Also, 4 out
of the 10 wholesalers sold cultivated products in addition to marine products. The highest-selling
product at the wholesalers‟ market was shark, with an average volume of 2895 kilograms sold per
month. By comparison an average volume of 37.5 kilograms of panga (the least sold fish) was sold
per month. Furthermore, the price of marine shrimp was the highest (3700 c/ kg) out of all the
different prices for fish sold at the wholesalers‟ market.
For the market manager section of our findings, we analyzed a total of 30 interviews
conducted in the greater San José area. Seventy percent of the interviewees were either market
owners or managers while the other 30% were people who worked closely with fish. Many of the
markets exhibited similarities in the way that they presented the fish for sale. Nearly 100% of the
markets sold their fish fresh (preserved on ice). Almost all of the markets felt that local products
(marine and aquaculture) earned more profits than imported goods.
We also discovered that different fish were in higher demand depending on which market
was selling the fish. Certain fish were sold in different types of markets; for instance, municipal
markets sold the most sea bass and porgy out of any other market type in the study. Overall, super-
and hypermarkets mostly sold aquaculture products while municipal markets mostly sold marine
products. Additionally we found in all venues that almost 50% of the aquaculture products were
imported aquaculture products. We also found that the market was price-driven. Cheaper fish sold
more readily than more expensive fish. We additionally found that as the demand for a certain
species increased, so did its availability at that venue.
We performed a series of correlations and found that advertisement methods varied from
market to market. For example, hyper- and supermarkets employed advertising techniques and were
willing to advertise more readily than the other types of markets. Also, markets that advertised felt
that the advertisements were very effective.
Our consumer results showed that consumers thought prices were reasonable, but leaned
towards expensive. Additionally the general opinion of quality throughout was that it was of a high

23
caliber. The whole population had some awareness that fish had nutritional value. The main reasons
for consuming fish were due to the fact that fish is nutritious and tasty. The population liked to buy
their fish fresh. Finally, the majority of the consumers we interviewed talked about the lack of
advertisements in the marketplace and reported that they usually inquired about the products
available and their prices at the venue. Along with these general findings, we further examined other
factors.
The first factor we examined was location of purchase. If we ignore demographics, the
whole population mainly shops at hypermarkets, supermarkets, and municipal markets. We found
that the majority of consumers purchased fish at the same place we interviewed them. We also saw
that younger consumers tend to shop at hyper- and supermarkets, while older consumers shop at
municipal markets. Likewise, employed consumers tend to shop at hyper- and supermarkets, while
unemployed and pensioned consumers shop at municipal markets. For this section we also
discovered that consumers with a higher level of education tend to shop at hypermarkets and
supermarkets, while consumers with a lower level of education shop at municipal markets.
The next factor we compared was the species that consumers ate. The species that
consumers ate most commonly were sea bass, shrimp, and tilapia. When comparing species
consumed to interview locations, most species stayed close to the average consumption percentage.
However, panga was mostly consumed by customers in supermarkets, porgy by customers in
farmers‟ markets, and tilapia by customers in hypermarkets. We also found that employed
consumers ate the widest variety of species and that a large percentage of employed consumers ate
tilapia. Lastly, we found it significant that consumers with a lower level of education consumed
shark, consumers with a higher level of education consumed tilapia, and a high percentage of
consumers with a university education consumed shrimp and sea bass.
Next we compared desired species and their accessibility in terms of price. In general,
shrimp and sea bass were the most desired species. Notably, a high percentage of consumers
interviewed at farmers‟ markets desired shrimp; those at hypermarkets desired sea bass and porgy;
and those at supermarkets desired sea bass, panga, and mahi mahi. When compared to age, key
findings included: younger consumers wanted more accessible salmon and shark; consumers
between 36 and 65 wanted accessible shrimp; and consumers above the age of 51 wanted accessible
porgy. With the next demographic, marital status, we found that married consumers or consumers in

24
a free union desired more shrimp, sea bass, and tilapia compared to single consumers. In addition
we found that employed consumers wanted accessible salmon, unemployed wanted accessible porgy,
and pensioned wanted accessible tilapia compared to the other groups. Finally we found that as a
consumer‟s education level increased, their desire for shrimp, sea bass, and salmon also increased,
and additionally consumers with a technical and university education wanted more accessible trout
compared to the other categories.
The last three factors that we compared were the volume of fish consumed, the frequency of
fish consumption, and fish product expenses. In general, consumers ate 1.34 kg of fish per week.
More specifically, in each of the demographic groups we saw that consumers above the age of 66
and consumers with a low level of education consumed the least amount of fish while employed
consumers ate the most. Furthermore, consumers ate fish an average of 5.11 times per month. To
be more specific, within each of the demographic groups we saw that consumers above the age of
66, single consumers, consumers with a low level of education, and pensioned consumers ate fish
less frequently. Lastly, consumers spent an average of 5413 colones per week on fish.
4.2 Producer Findings We visited 32 farms while gathering information about producers, the primary suppliers of
cultivated fish in the distribution channel. We focused on trout, tilapia and shrimp farms. Figure 4
below depicts the total number of each type of farm as a percentage of the total number of farms
visited.
Figure 4 - Distribution of farm types interviewed
41%
37%
22%
Farms Distribution
Trout
Tilapia
Shrimp

25
4.2.1 Trout Farm Findings
In general, trout farms are located at high elevations because trout is a cold water fish which
requires a cooler climate for growth. During our visit to the farms located in San Gerardo de Dota
and other areas near Cartago, we observed that all trout farmers managed their own restaurants and
seemed to cultivate the trout solely for that purpose. Figure 5 below depicts a typical sign for a trout
restaurant.
Figure 5 - Typical trout restaurant sign (English translation: “Bar, Restaurant, Urasca Ranch, Sport Fishing, Cabins, Green Lands”)
Appendix E.1.a contains detailed information that we gathered during the trout farm
interviews. The data demonstrated that only 2 farmers out of a total of 13 commercialized their
product in the metropolitan area. This could be because many farmers do not want to invest in
equipment for processing trout so that it can be transported to and sold in the cities. When
questioned about problems encountered during the commercialization of trout to the city, most
farmers said that they had no problems and asserted that they were satisfied with the way they run
their business. Contrary to this, 6 farmers out of 13 said that they were not satisfied with the current
demand for trout which results in a low profit margin. Most farmers wished to focus on stimulating
and meeting the local demand before expanding to the outside market. A general observation we
made when traveling to the farms was that the roads were not in good condition which might
impede the transportation of fish to other areas; Figure 6 below depicts a common road condition
that would prevent easy transportation of products. Another observation we made was that all of the
interviewees showed a high level of interest in maintaining the freshness of the product they deliver.

26
Figure 6 - Example of road condition that prevents transportation of products to cities
With regards to the possibility of cultivating new types of fish, 9 farmers out of 13 were
willing to cultivate new species. In general most farmers believed that the climate of the trout farms
would not allow for the cultivation of other types of fish that would be in demand. Additionally,
during our data collection in the trout farm region we noticed that some trout farms experienced the
spreading of an eye disease; this was due to climate change which caused the water temperature to
be higher than usual.
Figures 7 and 8 below represent the volume of trout produced and the price charged by each
farmer. Two farmers did not specify the approximate volume of trout they sell per month. The
prices and volumes vary for each farm. Farmer 2 commercializes the highest amount of trout (8000
kg/ month) which he sells to supermarkets in San José while most of the rest cultivate trout for their
own restaurants. The prices charged by the farmers vary between 2000 c/kg to around 7000 c/ kg
due to different preparations. The individual prices for trout farmers 3 and 11 are the highest (5000
c/ kg and 6750 c/ kg respectively) which might suggest that they produce trout at a lower monthly
production level than the rest of the farmers. In general, we observed that producers sell their
products for approximately the same price (if outliers are eliminated); this is done to maintain the
competition between producers and to stay in the market.

27
Figure 7 - Volume data for each trout farm
Figure 8 - Price data for each trout farm
A common problem related to production that most producers face is expensive feed (from
Aguilar Solis) which usually results in a low profit margin. As a result, farmers typically have to sell
the product at a higher price. Another major problem that trout farmers face is competition with
other producers in the area. The concentration of trout farms in one major region far from the
metropolitan area does not facilitate commercialization and marketing.
4.2.2 Tilapia Farm Findings
The tilapia farms we visited were found in San Carlos in regions of lower elevation where the
climate is generally warmer than the climate of the trout farms. Figure 9 below depicts a typical
tilapia farm. Most of the information we gathered came from small and medium scale producers
0
2,000
4,000
6,000
8,000
10,000
1 2 3 4 5 6 7 8 9 10 11 12 13
Vo
lum
e (
kg/
mo
nth
)
Trout Farm Number
Trout Farm Volume Data
0
2000
4000
6000
8000
1 2 3 4 5 6 7 8 9 10 11 12 13
Pri
ce (
c/ k
g)
Trout Farm Number
Trout Farm Price Data
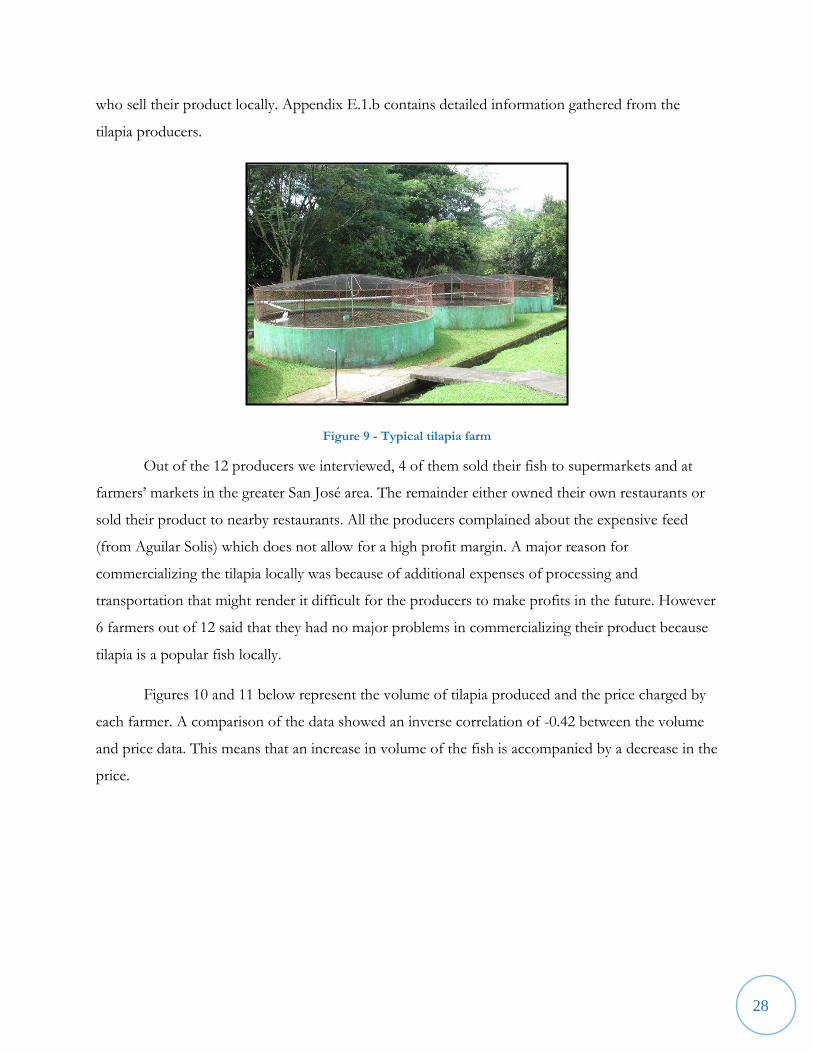
28
who sell their product locally. Appendix E.1.b contains detailed information gathered from the
tilapia producers.
Figure 9 - Typical tilapia farm
Out of the 12 producers we interviewed, 4 of them sold their fish to supermarkets and at
farmers‟ markets in the greater San José area. The remainder either owned their own restaurants or
sold their product to nearby restaurants. All the producers complained about the expensive feed
(from Aguilar Solis) which does not allow for a high profit margin. A major reason for
commercializing the tilapia locally was because of additional expenses of processing and
transportation that might render it difficult for the producers to make profits in the future. However
6 farmers out of 12 said that they had no major problems in commercializing their product because
tilapia is a popular fish locally.
Figures 10 and 11 below represent the volume of tilapia produced and the price charged by
each farmer. A comparison of the data showed an inverse correlation of -0.42 between the volume
and price data. This means that an increase in volume of the fish is accompanied by a decrease in the
price.

29
Figure 10 - Volume data for each tilapia farm
Figure 11 - Price data for each tilapia farm
A common problem that most tilapia producers mentioned was the competition they face
from other producers and corporations in the country. When the corporations sell their products at
a cheaper price, the tilapia producers are forced to lower the price of the product that they sell to
local consumers. This does not benefit them since they have to make up for costly feed. In addition,
a majority of the farmers confirmed that they were ready to cultivate other types of fish if there was
a demand for them. Since tilapia grows in warmer climates, this might be a suitable climate for other
types of fish. During our on-site visit to the farms, we observed that 2 of the producers were already
cultivating and commercializing catfish along with tilapia.
0500
100015002000250030003500
1 2 3 4 5 6 7 8 9 10 11 12
Vo
lum
e (
kg/
mo
nth
)
Tilapia Farm Number
Tilapia Farm Volume Data
0
1000
2000
3000
4000
5000
1 2 3 4 5 6 7 8 9 10 11 12
Pri
ce (
c/ k
g)
Tilapia Farm Number
Tilapia Farm Price Data
30
4.2.3 Shrimp Farm Findings
The data collected from the shrimp farms was different from the data from the tilapia and
trout farms due in part to differences in production methods. Shrimp requires more space for
cultivation compared to fish; the “tanks” used for shrimp cultivation covered many more hectares
than either the tilapia or trout farms did. The shrimp farms are located around the Gulf of Nicoya
since shrimp requires salt water for a better growth.
The commercialization of shrimp depends heavily on its weight. For instance, the shrimp
can be exported to other countries if it weighs 20 g or more. Our interviews with the shrimp farms
revealed that 5 out of 7 shrimp producers sell their product to intermediaries who in turn sell the
product to other individuals or to supermarkets in the nearby cities. Of the remaining two, one of
the producers exports his products to Spain while the other sells his in the wholesalers‟ market. The
size of the shrimp also determines its price on the market. The price is fixed at a specific weight and
is increased in increments of 100 colones per additional gram.
Major problems that shrimp farmers face are competition with products from Nicaragua, the
high price of feed and the White Spot Syndrome Disease, which arises during the dry season. The
harvest of the shrimp occurs in several cycles during the year in an attempt to obtain a larger crop of
healthy shrimp. On average, there are about 2 to 3 harvests every year. Coonaprosal, a corporation
that helps shrimp producers cultivate and sell their products, does not finance the farmers during
that period of the year. So during the dry season, some shrimp farmers use their ponds to produce
salt through the evaporation of sea water while a few others prefer to keep their farm running and
risk contracting the disease if they are late to harvest during a particular cycle. Shrimp farmers
encounter the same dilemma of expensive feed as tilapia and trout farmers, however, shrimp farmers
have the option to use locally produced feed which is of lower quality but cheaper. Overall the
farmers acknowledged preference for imported feed from Peru (Nicovita) which is more expensive
but yields a better product. In addition, 3 out of the 7 interviewed farmers complained about the
competition that their shrimp products have to face on the market due to the cheaper prices set on
Nicaraguan products. When we asked farmers about the possibility of cultivating new species, 4 out
of the 7 interviewed producers said that they were ready to cultivate new types of fish.
4.3 Wholesaler Findings For this round of data collection, we obtained information from 10 wholesalers at a
wholesalers‟ market in Heredia (see Figure 12 below) and from a Wal-Mart distributor.

31
Figure 12 - Wholesalers' market in Heredia
4.3.1 Wholesalers’ Market in Heredia
We conducted 10 interviews with wholesalers at Cenada, a wholesale distribution market in
Heredia. Figure 13 below depicts the ratio of marine products to aquaculture products sold in the
wholesale market. The fish are sold to different distributors and then sent to other venues including
municipal markets, supermarkets and hypermarkets in the cities of Alajuela, Cartago, Heredia and
San José.
Figure 13 - Distribution of the origin of products at Cenada
The data showed that all except 2 wholesalers sell imported aquaculture fish (Panga and
Salmon) to consumers of the local market. Appendix E.2 contains a full list of volumes of fish sold
and selling prices for each wholesaler. Table 4 below summarizes the most popular types of fish
commercialized by wholesalers along with the average volumes and prices.
82%
18%
Origin of Products Distribution
Marine
Cultivated
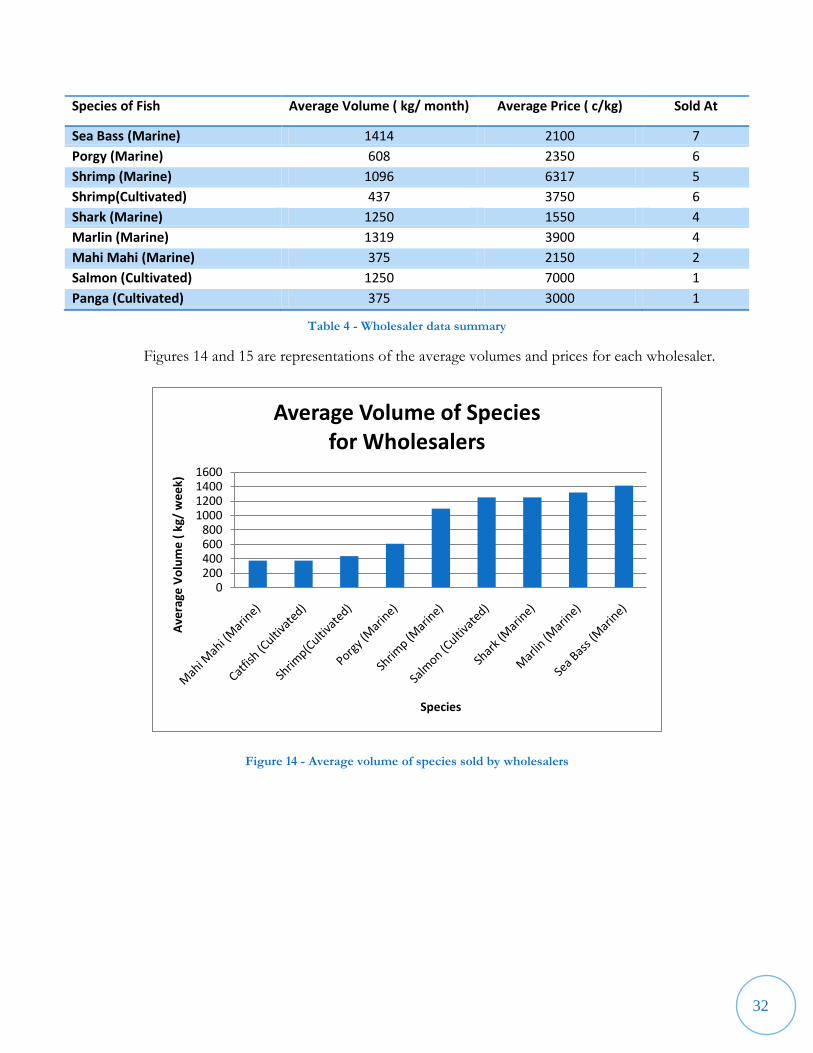
32
Species of Fish Average Volume ( kg/ month) Average Price ( c/kg) Sold At
Sea Bass (Marine) 1414 2100 7
Porgy (Marine) 608 2350 6
Shrimp (Marine) 1096 6317 5
Shrimp(Cultivated) 437 3750 6
Shark (Marine) 1250 1550 4
Marlin (Marine) 1319 3900 4
Mahi Mahi (Marine) 375 2150 2
Salmon (Cultivated) 1250 7000 1
Panga (Cultivated) 375 3000 1
Table 4 - Wholesaler data summary
Figures 14 and 15 are representations of the average volumes and prices for each wholesaler.
Figure 14 - Average volume of species sold by wholesalers
0200400600800
1000120014001600
Ave
rage
Vo
lum
e (
kg/
we
ek)
Species
Average Volume of Species for Wholesalers
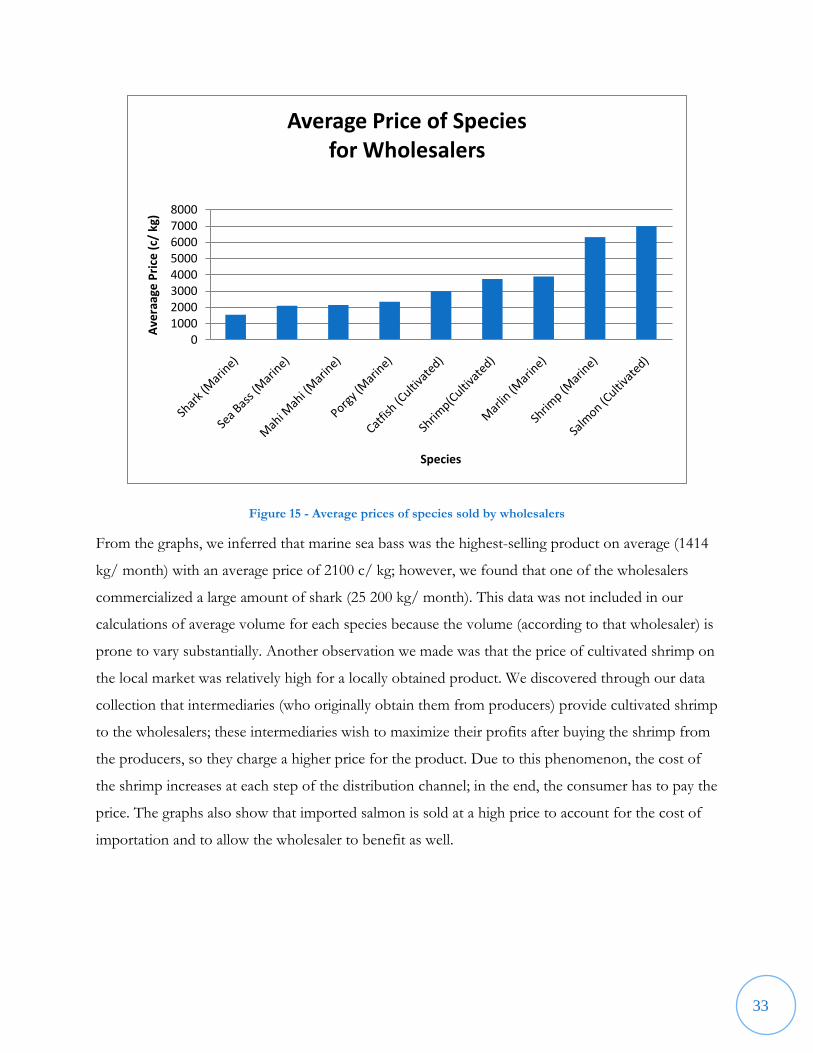
33
Figure 15 - Average prices of species sold by wholesalers
From the graphs, we inferred that marine sea bass was the highest-selling product on average (1414
kg/ month) with an average price of 2100 c/ kg; however, we found that one of the wholesalers
commercialized a large amount of shark (25 200 kg/ month). This data was not included in our
calculations of average volume for each species because the volume (according to that wholesaler) is
prone to vary substantially. Another observation we made was that the price of cultivated shrimp on
the local market was relatively high for a locally obtained product. We discovered through our data
collection that intermediaries (who originally obtain them from producers) provide cultivated shrimp
to the wholesalers; these intermediaries wish to maximize their profits after buying the shrimp from
the producers, so they charge a higher price for the product. Due to this phenomenon, the cost of
the shrimp increases at each step of the distribution channel; in the end, the consumer has to pay the
price. The graphs also show that imported salmon is sold at a high price to account for the cost of
importation and to allow the wholesaler to benefit as well.
010002000300040005000600070008000
Ave
raag
e P
rice
(c/
kg)
Species
Average Price of Species for Wholesalers
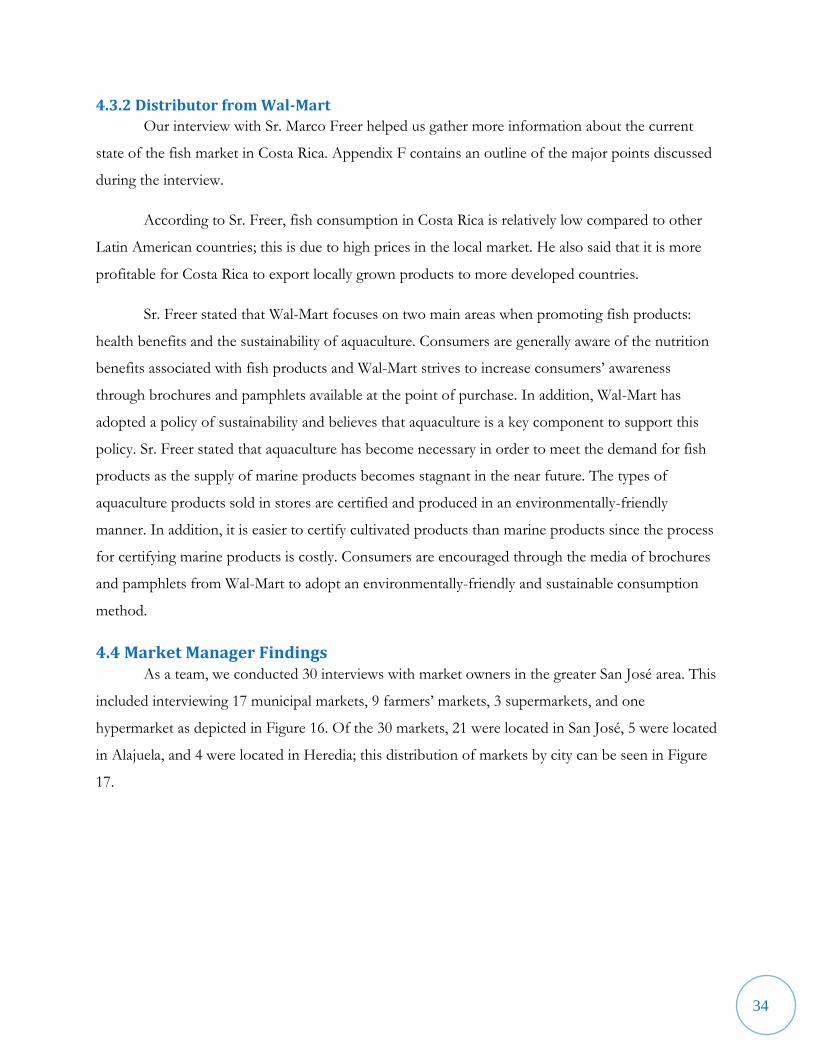
34
4.3.2 Distributor from Wal-Mart
Our interview with Sr. Marco Freer helped us gather more information about the current
state of the fish market in Costa Rica. Appendix F contains an outline of the major points discussed
during the interview.
According to Sr. Freer, fish consumption in Costa Rica is relatively low compared to other
Latin American countries; this is due to high prices in the local market. He also said that it is more
profitable for Costa Rica to export locally grown products to more developed countries.
Sr. Freer stated that Wal-Mart focuses on two main areas when promoting fish products:
health benefits and the sustainability of aquaculture. Consumers are generally aware of the nutrition
benefits associated with fish products and Wal-Mart strives to increase consumers‟ awareness
through brochures and pamphlets available at the point of purchase. In addition, Wal-Mart has
adopted a policy of sustainability and believes that aquaculture is a key component to support this
policy. Sr. Freer stated that aquaculture has become necessary in order to meet the demand for fish
products as the supply of marine products becomes stagnant in the near future. The types of
aquaculture products sold in stores are certified and produced in an environmentally-friendly
manner. In addition, it is easier to certify cultivated products than marine products since the process
for certifying marine products is costly. Consumers are encouraged through the media of brochures
and pamphlets from Wal-Mart to adopt an environmentally-friendly and sustainable consumption
method.
4.4 Market Manager Findings As a team, we conducted 30 interviews with market owners in the greater San José area. This
included interviewing 17 municipal markets, 9 farmers‟ markets, 3 supermarkets, and one
hypermarket as depicted in Figure 16. Of the 30 markets, 21 were located in San José, 5 were located
in Alajuela, and 4 were located in Heredia; this distribution of markets by city can be seen in Figure
17.

35
Figure 16 - Distribution of market types
Figure 17 - Distribution of markets by city
Each of these markets exhibited different product presentation, but because they were
marketing similar products to the same audience we observed that the venues had several things in
common. For instance, 97% of the marketplaces sold their fish fresh because consumers have
expressed a preference for fresh fish; markets have a problem commercializing fish if the only
option is frozen fish.
In order to present the product in this manner, markets have the option to choose between
different types of storage methods for their products; however, we took note that most of the
vendors used the same methods for storage. Figure 18 shows that the most popular method for
keeping fish fresh is to put it on ice. This graph also shows that many of the stores use more than
one method of cold storage.
13
17
9
Markets Distribution
Hypermarkets
Supermarkets
Municipal Markets
Farmer's Market
5
4
21
Distribution of Markets by City
Alajuela
Heredia
San Jose
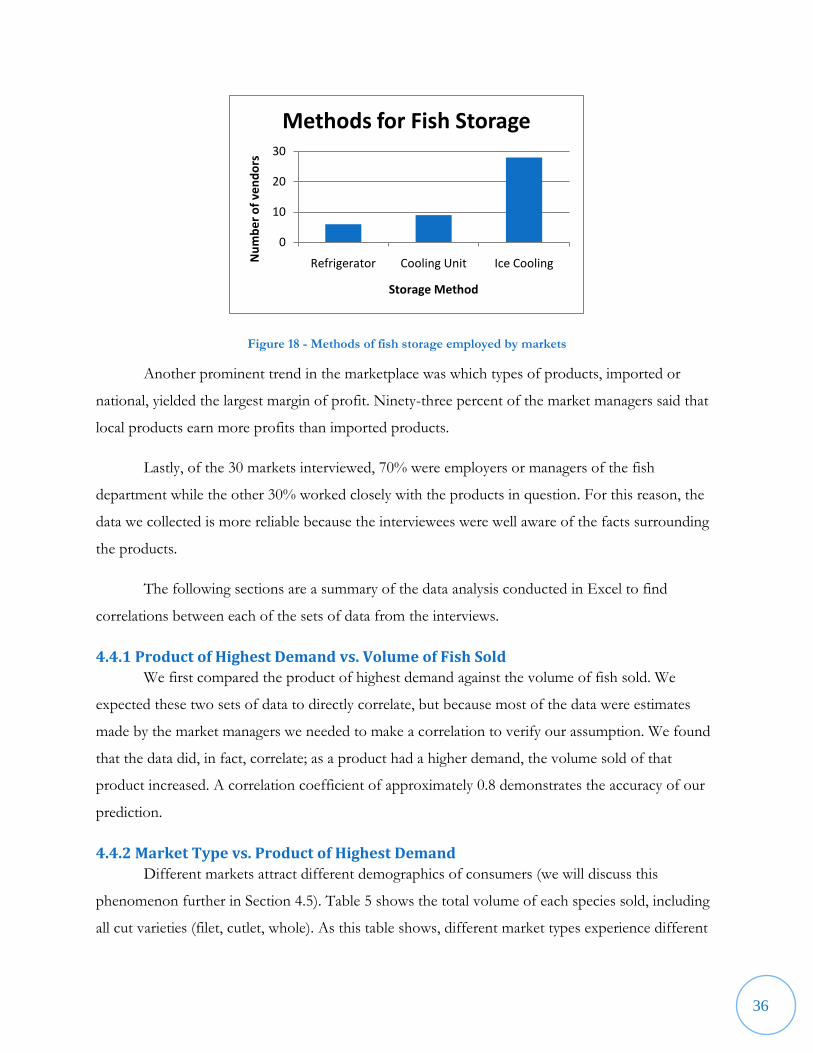
36
Figure 18 - Methods of fish storage employed by markets
Another prominent trend in the marketplace was which types of products, imported or
national, yielded the largest margin of profit. Ninety-three percent of the market managers said that
local products earn more profits than imported products.
Lastly, of the 30 markets interviewed, 70% were employers or managers of the fish
department while the other 30% worked closely with the products in question. For this reason, the
data we collected is more reliable because the interviewees were well aware of the facts surrounding
the products.
The following sections are a summary of the data analysis conducted in Excel to find
correlations between each of the sets of data from the interviews.
4.4.1 Product of Highest Demand vs. Volume of Fish Sold
We first compared the product of highest demand against the volume of fish sold. We
expected these two sets of data to directly correlate, but because most of the data were estimates
made by the market managers we needed to make a correlation to verify our assumption. We found
that the data did, in fact, correlate; as a product had a higher demand, the volume sold of that
product increased. A correlation coefficient of approximately 0.8 demonstrates the accuracy of our
prediction.
4.4.2 Market Type vs. Product of Highest Demand
Different markets attract different demographics of consumers (we will discuss this
phenomenon further in Section 4.5). Table 5 shows the total volume of each species sold, including
all cut varieties (filet, cutlet, whole). As this table shows, different market types experience different
0
10
20
30
Refrigerator Cooling Unit Ice CoolingNu
mb
er
of
ven
do
rs
Storage Method
Methods for Fish Storage

37
demands since the consumer demographic is varied. For example, panga and tilapia were in
comparatively higher demand at supermarkets and hypermarkets whereas shark and mahi mahi were
in higher demand at municipal markets. Lastly, tilapia was in higher demand at farmers‟ markets.
Type of Fish Demand of Fish Sold (kg/week) vs. Market Type
Hypermarket Supermarket Municipal Market Farmers’ Market
Shrimp 42.00 10.17 80.21 52.67
Sea Bass 42.00 17.50 195.00 80.00
Panga 224.00 47.33 57.92 80.00
Mahi Mahi
253.33 50.00
Marlin
185.36 27.50
Porgy 7.00 82.50 15.00
Salmon 21.00
Shark 42.00 8.67 377.14 22.50
Tilapia 315.00 29.83 66.50 300.00
Trout 77.00 21.00
Total 763.00 141.50 1297.96 627.67
Table 5 - Demand of fish sold (kg/week) vs. market type
With the information we gathered about the origins of the fish, we were able to compare
aquaculture products sold against marine products sold; Figure 19 shows this comparison. We were
not able to include shrimp in this analysis since we were not able to distinguish between origins; we
also could not consider the many types and sizes of shrimp in this analysis. We separated the
amounts of each species sold by each of the markets. Interestingly, the different market types sold
different amounts of each of the products. For instance municipal markets sold almost nine times
the amount of marine fish (1093 kg/week) as they did aquaculture fish (124 kg/week). On the other
hand hypermarkets (637 kg/week), farmers‟ markets (380 kg/week), and supermarkets (98 kg/week)
relied on aquaculture products for their profits instead of marine fish (84,195 and 33 kg/week
respectively).
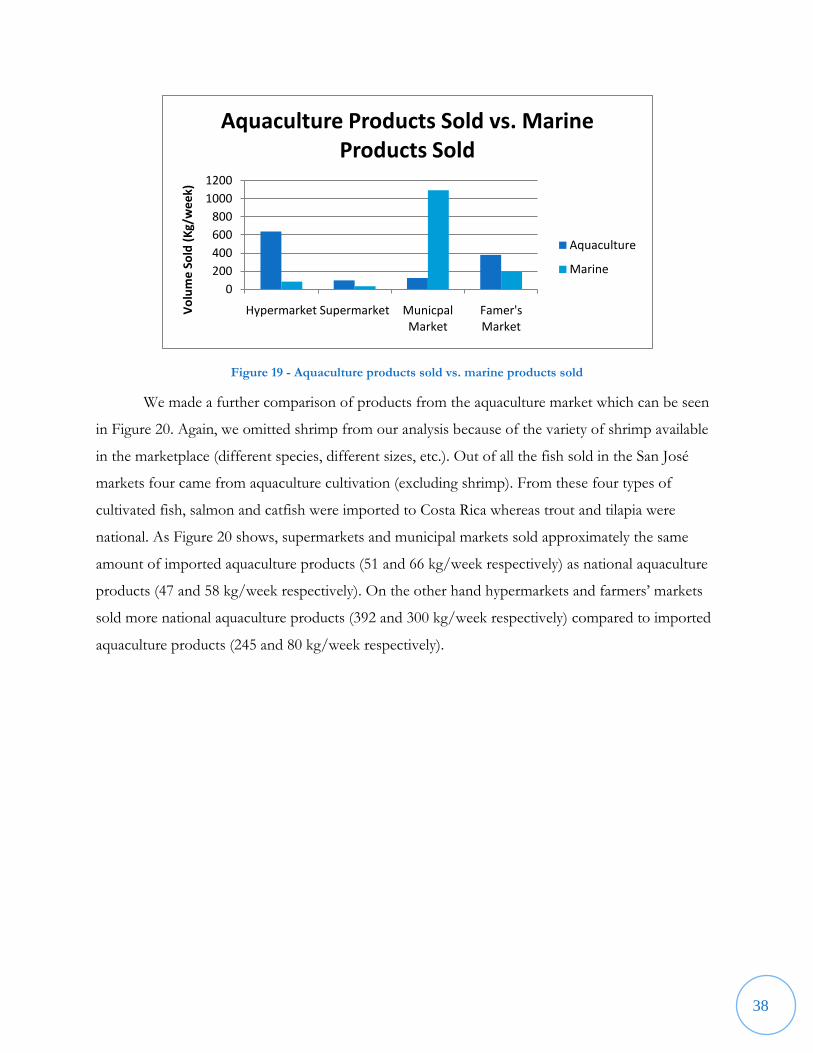
38
Figure 19 - Aquaculture products sold vs. marine products sold
We made a further comparison of products from the aquaculture market which can be seen
in Figure 20. Again, we omitted shrimp from our analysis because of the variety of shrimp available
in the marketplace (different species, different sizes, etc.). Out of all the fish sold in the San José
markets four came from aquaculture cultivation (excluding shrimp). From these four types of
cultivated fish, salmon and catfish were imported to Costa Rica whereas trout and tilapia were
national. As Figure 20 shows, supermarkets and municipal markets sold approximately the same
amount of imported aquaculture products (51 and 66 kg/week respectively) as national aquaculture
products (47 and 58 kg/week respectively). On the other hand hypermarkets and farmers‟ markets
sold more national aquaculture products (392 and 300 kg/week respectively) compared to imported
aquaculture products (245 and 80 kg/week respectively).
0
200
400
600
800
1000
1200
Hypermarket Supermarket Municpal Market
Famer's Market
Vo
lum
e S
old
(K
g/w
ee
k)
Aquaculture Products Sold vs. Marine Products Sold
Aquaculture
Marine

39
Figure 20 - Local aquaculture products vs. imported aquaculture products
4.4.3 A Prices vs. Product of Highest Demand
Table 6 below shows a side by side comparison of the price of filets (in colones per
kilogram), volume sold (in kilograms/week), highest demand according to the vendors, and the
number of venues that sold each species. We used the price of filets to keep variables equal (ceteris
paaribus). The following sections show correlations between the four columns.
We completed a correlation between the price of fish sold and the amount of fish sold in the
marketplace as well as a comparison between the product of highest demand (according to the
market managers) and the product price. We found that the demand was largely driven by price.
Holding all other variables equal, there was a relatively strong correlation between the product of
highest demand and the price of the product. For the correlations, coefficients of -0.63 (price vs.
amount) and 0.56 (price vs. demand) respectively were found.
In addition, we compared two species of aquaculture to determine their compatibility; these
fish were tilapia (a nationally grown fish) and catfish (an imported fish). Tilapia was sold at a lower
price in larger quantities, but at fewer venues. On the other hand, catfish was sold at a higher price at
more venues even though the amount sold per week was lower. This comparison shows that there is
a market for both of these fish, but only one of them is grown in Costa Rica.
0
100
200
300
400
500
HypermarketSupermarket Municpal Market
Famer's Market
Vo
lum
e S
old
(K
g/w
ee
k)
Local Aquaculture Products vs. Imported Aquaculture Products
Local Aquaculture
Imported Aquaculture

40
Species of Fish Price of Filet (in C/kg) Amount (in kg/week) Highest Demand Sold At
Shrimp 8,151 60.6 1 27
Sea Bass 4,839 144.4 9 27
Catfish 4,691 59.5 5 16
Mahi Mahi 3,578 172.0 3 17
Marlin 4,300 136.3 1 16
Porgy 4,357 62.4 4 21
Salmon 5,390 21.0 0 4
Shark 3,297 257.0 16 28
Tilapia 3,773 101.7 5 12
Trout 7,543 40.0 0 2
Table 6 - Comparison of data collected from market managers
4.4.4 Product of Highest Demand vs. Availability of Products
Our group also studied whether the availability of each fish type sold in the markets had any
impact on the demand for specific fish species. We noticed a strong correlation between the two
lists. Figure 21 shows that as the demand for a product increases, so does the availability of that
product. In this set of data, shark was sold in the most venues and it was also considered by the
market managers to be in the highest demand by consumers; the same trend holds true for sea bass
(the second most available and second most “in-demand” fish species). Shrimp was the only species
that did not adhere to this trend; many of the vendors sold shrimp but only one claimed it to be in
high demand.
Figure 21 - Comparison between product of highest demand and product availability
0
5
10
15
20
25
30
Nu
mb
er
of
Ve
nd
ors
Species
Demand vs. Availability
Places That Sell It
Highest Demand Product

41
4.4.5 General Observations of Various Markets
Each of the markets exhibited different presentations of their products. We observed that
supermarkets and hypermarkets presented their products in a similar way, and municipal and
farmers‟ markets sold their products equally. Figure 22 shows the typical presentation of fish at a
supermarket in the greater San José area. The area is clean, neat and aesthetically pleasing to look at.
Figure 22 - Typical presentation of fish at hyper- and supermarkets
By comparison, Figures 23, 24, and 25 show typical municipal markets in different parts of
the metropolitan area. Figure 23 shows a market manager preparing the fish for sale in plain view of
the consumer. At first glance, these stands appeared to have the freshest fish of all of the markets we
studied, however they did not seem to have the cleanest facilities.
Figure 23 - Market manager preparing fish for sale at a municipal market

42
Figure 24 - Typical presentation of fish at municipal and farmers’ markets
Figure 25 - Typical presentation of fish at municipal and farmers’ markets
Figure 26 shows the atmosphere of a typical farmers‟ market. Stands are set up along the
edges of a street and vendors sell fresh fruits, vegetables, meat, and fish. The presentation of the fish
in these markets was similar to that of the municipal markets because they relied on the freshness of
the fish to sell the product. Their product appears to be as fresh as the municipal markets, and,
unfortunately they too lack a certain level of cleanliness in their facilities.

43
Figure 26 - Typical farmers’ market
4.4.6 Advertising
During our interviews, we gathered data about the types of markets and their use of
advertising techniques as shown in Table 7.
Type of Market Use of Advertising
Total Yes No Percent
Hypermarkets 1 1 0 100.00%
Supermarkets 3 3 0 100.00%
Municipal Markets 17 7 10 41.18%
Farmers’ Markets 9 0 9 0.00%
Total 30 11 19 36.67%
Table 7 - Use of advertisements by markets
We found that supermarkets and hypermarkets were most likely to use advertisements whereas
farmers‟ markets were least likely to use advertisements. Within the municipal markets, the use of
advertisements was approximately equal between those that used advertisements and those that did
not. One of the reasons for the absence of advertisements in the municipal and farmers‟ markets
was their reliance on word of mouth to publicize their products.
Our team also compared market types against the effectiveness of advertising. We revealed
that supermarkets felt their advertisements were productive; all three supermarkets felt that their
advertisements were very effective. On the other hand, many municipal markets felt that their
advertisements were only “good” and many of the farmers‟ markets did not give an answer because
they do not use formal advertisements.

44
We additionally investigated markets‟ willingness to invest in more advertisements. We
discovered that 43% of the markets were willing to invest more for advertisements. The other 57%
had no interest in investing more or did not respond to the question. Many of the 43% that
responded positively also asserted that they would only invest more in advertising if it would ensure
profit gains.
4.4.7 Comparisons with no Correlations
In addition to the above comparisons, we also performed the following analyses: market
type vs. most profitable product (local or imports), city vs. product of highest demand and price vs.
species sold. These comparisons did not yield any significant relationships.
4.5 Consumer Findings We interviewed a total of 95 consumers in 4 types of markets: 20 from hypermarkets, 23
from supermarkets, 28 from municipal markets, and 24 from farmers‟ markets, as shown in Figure
27.
Figure 27 - Distribution of consumers by interview location
We first compared the locations of interviews with relevant data in order to reveal significant results.
In addition to this comparison, we analyzed 5 major demographic categories: age, sex, marital status,
employment, and education levels.
4.5.1 Demographic
The consumers we interviewed were 51.5 years old on average, with a standard deviation of
13.5 years. The age distribution can be seen in Figure 28. In order to make comparisons with other
data, we separated consumers by age groups; there were 11 consumers in the 0 to 35 group, 31 in
21%
24%30%
25%
Interview Location
Hypermarket
Supermarket
Municipal Market
Farmer's Market

45
the 36 to 50 group, 30 in the 51 to 65 group, and 11 in the 66+ group. We omitted those who did
not report their age from further age analyses.
Figure 28 - Age distribution of consumers
The consumers we interviewed were 27 % male and 73% female. In addition, 73% of the
consumers reported having a partner (married or in a free union) while 27% were single (including
those who were widowed or divorced); we used only these two general categories in order to make
our comparison simpler. Out of the total number of consumers, 57% were employed, 21% were
unemployed, 20% were pensioned, and 2% did not report their employment status. Table 8 shows
the education level distribution for the consumers we interviewed. In order to make statistical
comparisons, education levels were given a numerical value from 0 (None) to 4 (University) based
on education levels in order to find numerical correlations.
Education Level of Consumers
None 3%
Primary 21% Secondary 19% Technical Bachelor Degree 17% University 37% n/a 3%
Table 8 - Distribution of consumers' education levels
For our analysis, we calculated correlations with the age and education demographics. We
could not compute correlations for the gender, marital status, or employment status demographics
due to the nature of the data. As an alternative comparison we examined significant percentage
02468
101214
0 10 20 30 40 50 60 70 80 90 100
Fre
qu
en
cy
Age
Age Distribution

46
discrepancies for these demographics. The following is a description of the results we obtained that
were most significant to our problem statement; a full set of results can be viewed in Appendix E.4.
4.5.2 Overview of Consumer Findings
We discovered several results that are common through all the demographic categories.
These results include opinions on prices, opinions on product quality, reasons for consuming fish,
nutritional awareness, preferred product presentation, and advertisements seen by the consumer.
Consumers reported consistent opinions on product prices. On a scale of 1 (expensive) to 5
(cheap), consumers rated fish prices at 2.57 on average with a standard deviation of 0.94. This
average demonstrated to us that consumers thought prices of fish were reasonable but leaning
towards expensive. Similarly, consumers reported consistent opinions on product quality. The
average quality rating, on a scale of 1 (bad) to 5 (great), was 4.29 with a standard deviation of 0.63.
This average demonstrated to us that consumers seemed to be satisfied with the quality of the fish
they buy. Another consistent response we obtained from consumers concerned their knowledge of
the nutritional value of fish: 100% of consumers were aware of the nutritional value of fish.
Additionally, consumers reported their reasons for eating fish were nutrition (92%) and taste (68%).
We also asked consumers about their preferences in product presentation (frozen, fresh, smoked, or
canned); the majority expressed that they wanted fish presented fresh in the markets (97%). Finally,
we surveyed consumers about how they obtain information about promotions on fish products; the
majority indicated that they went to the market to see what was on sale (83%). A few mentioned
newspaper (12%) and television (8%) advertisements as their primary source of information.
4.5.3 Location of Purchase
The purchase locations that we investigated were hypermarkets/supermarkets, municipal
markets, farmers‟ markets, and independent markets. Independent markets have no affiliation with
other markets. The distribution showing what percentage of consumers shopped at certain locations
can be seen in Figure 29. In our sample 54% of consumers shopped at a hypermarket or
supermarket, 39% shopped at municipal markets, 18% shopped at farmers‟ markets, and 16%
shopped at independent markets. The following sections compare the location of purchase with the
interview location and the 5 previously mentioned demographic groups.
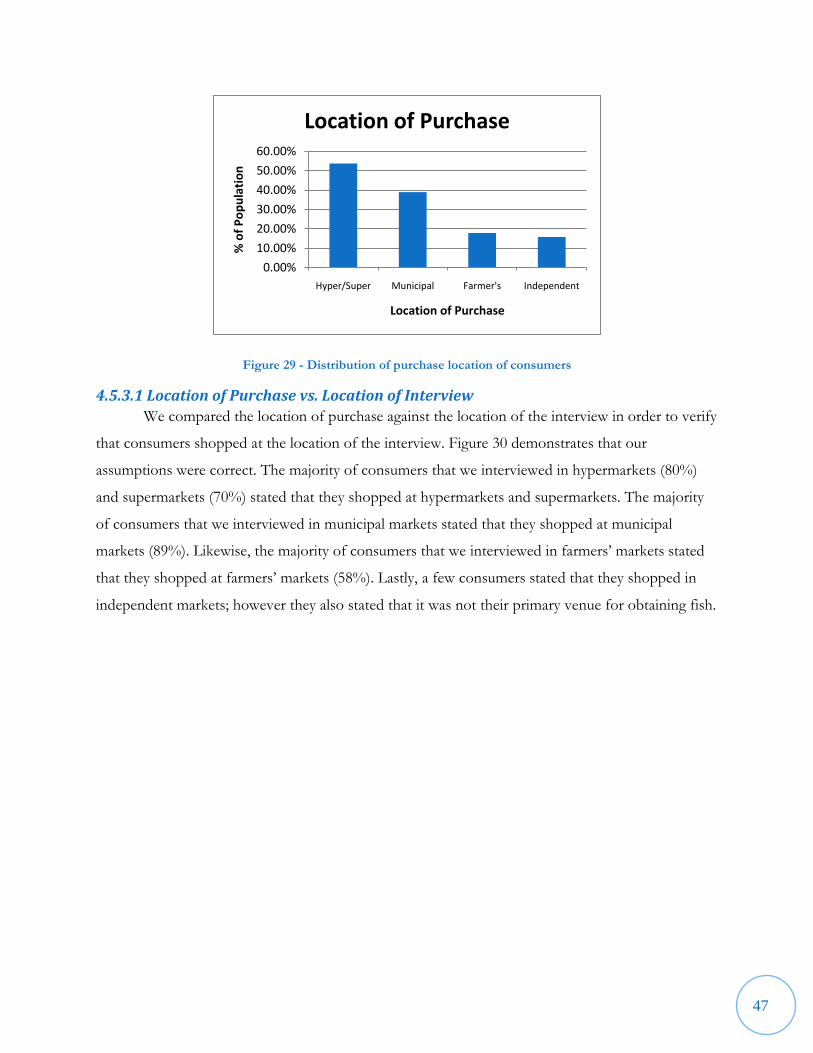
47
Figure 29 - Distribution of purchase location of consumers
4.5.3.1 Location of Purchase vs. Location of Interview
We compared the location of purchase against the location of the interview in order to verify
that consumers shopped at the location of the interview. Figure 30 demonstrates that our
assumptions were correct. The majority of consumers that we interviewed in hypermarkets (80%)
and supermarkets (70%) stated that they shopped at hypermarkets and supermarkets. The majority
of consumers that we interviewed in municipal markets stated that they shopped at municipal
markets (89%). Likewise, the majority of consumers that we interviewed in farmers‟ markets stated
that they shopped at farmers‟ markets (58%). Lastly, a few consumers stated that they shopped in
independent markets; however they also stated that it was not their primary venue for obtaining fish.
0.00%
10.00%
20.00%
30.00%
40.00%
50.00%
60.00%
Hyper/Super Municipal Farmer's Independent
% o
f P
op
ula
tio
n
Location of Purchase
Location of Purchase
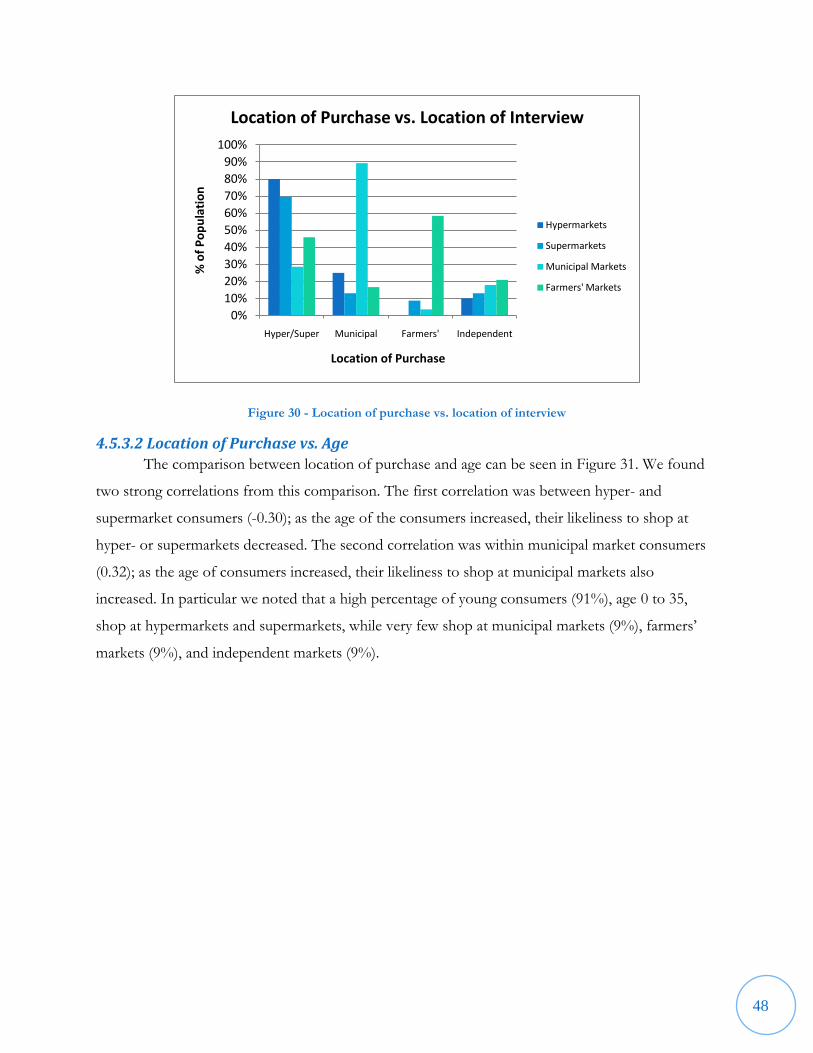
48
Figure 30 - Location of purchase vs. location of interview
4.5.3.2 Location of Purchase vs. Age
The comparison between location of purchase and age can be seen in Figure 31. We found
two strong correlations from this comparison. The first correlation was between hyper- and
supermarket consumers (-0.30); as the age of the consumers increased, their likeliness to shop at
hyper- or supermarkets decreased. The second correlation was within municipal market consumers
(0.32); as the age of consumers increased, their likeliness to shop at municipal markets also
increased. In particular we noted that a high percentage of young consumers (91%), age 0 to 35,
shop at hypermarkets and supermarkets, while very few shop at municipal markets (9%), farmers‟
markets (9%), and independent markets (9%).
0%
10%
20%
30%
40%
50%
60%
70%
80%
90%
100%
Hyper/Super Municipal Farmers' Independent
% o
f P
op
ula
tio
n
Location of Purchase
Location of Purchase vs. Location of Interview
Hypermarkets
Supermarkets
Municipal Markets
Farmers' Markets

49
Figure 31 - Location of purchase vs. age
4.5.3.3 Location of Purchase vs. Employment Status
We identified two relationships between location of purchase and employment status which
can be seen in Figure 32. We noticed that a high percentage of employed people (65%) shopped at
hypermarkets and supermarkets, while fewer shopped at municipal markets (28%), farmers‟ markets
(22%), and independent markets (17%). Furthermore, a high percentage of unemployed (60%) and
pensioned (53%) consumers shopped at municipal markets.
Figure 32 - Location of purchase vs. employment status
0%
10%
20%
30%
40%
50%
60%
70%
80%
90%
100%
Hyper/Super Municipal Farmer's Independent
% o
f P
op
ula
tio
n
Location of Purchase
Location of Purchase vs. Age
Age 0 to 35
Age 36 to 50
Age 51 to 65
Age 66+
0%10%20%30%40%50%60%70%
% o
f P
op
ula
tio
n
Location of Purchase
Location of Purchase vs. Employment Status
Employed
Unemployed
Pension
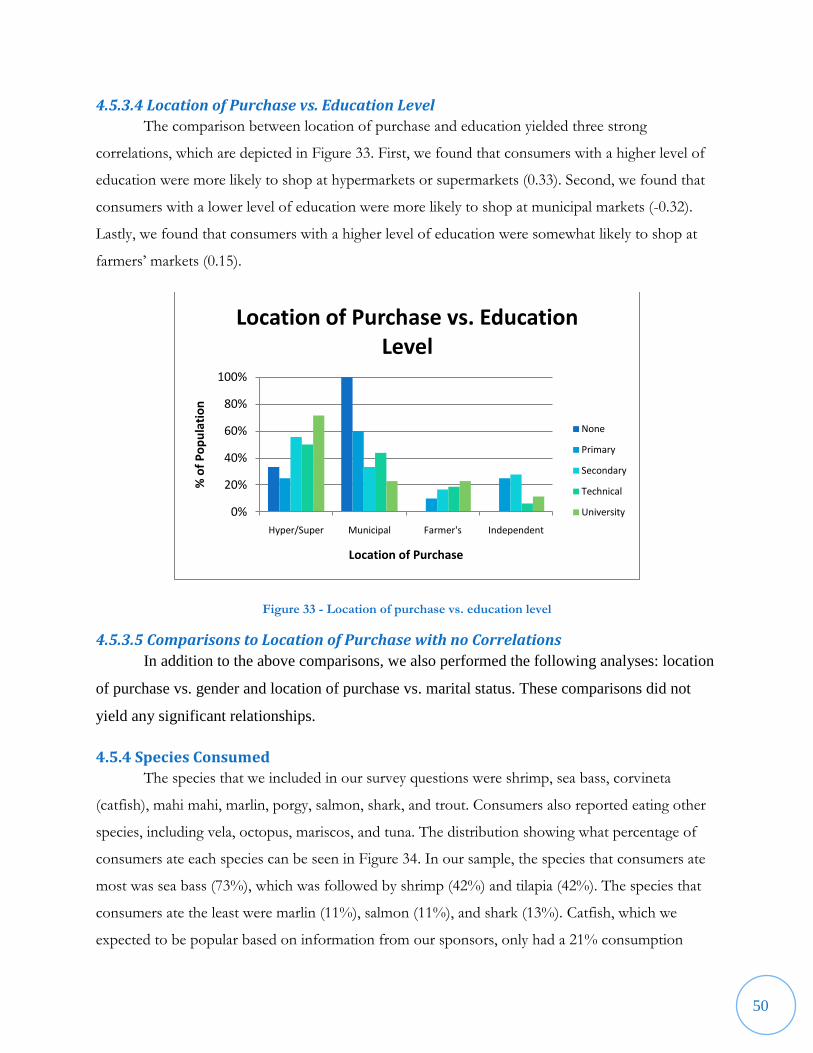
50
4.5.3.4 Location of Purchase vs. Education Level
The comparison between location of purchase and education yielded three strong
correlations, which are depicted in Figure 33. First, we found that consumers with a higher level of
education were more likely to shop at hypermarkets or supermarkets (0.33). Second, we found that
consumers with a lower level of education were more likely to shop at municipal markets (-0.32).
Lastly, we found that consumers with a higher level of education were somewhat likely to shop at
farmers‟ markets (0.15).
Figure 33 - Location of purchase vs. education level
4.5.3.5 Comparisons to Location of Purchase with no Correlations
In addition to the above comparisons, we also performed the following analyses: location
of purchase vs. gender and location of purchase vs. marital status. These comparisons did not
yield any significant relationships.
4.5.4 Species Consumed
The species that we included in our survey questions were shrimp, sea bass, corvineta
(catfish), mahi mahi, marlin, porgy, salmon, shark, and trout. Consumers also reported eating other
species, including vela, octopus, mariscos, and tuna. The distribution showing what percentage of
consumers ate each species can be seen in Figure 34. In our sample, the species that consumers ate
most was sea bass (73%), which was followed by shrimp (42%) and tilapia (42%). The species that
consumers ate the least were marlin (11%), salmon (11%), and shark (13%). Catfish, which we
expected to be popular based on information from our sponsors, only had a 21% consumption
0%
20%
40%
60%
80%
100%
Hyper/Super Municipal Farmer's Independent
% o
f P
op
ula
tio
n
Location of Purchase
Location of Purchase vs. Education Level
None
Primary
Secondary
Technical
University
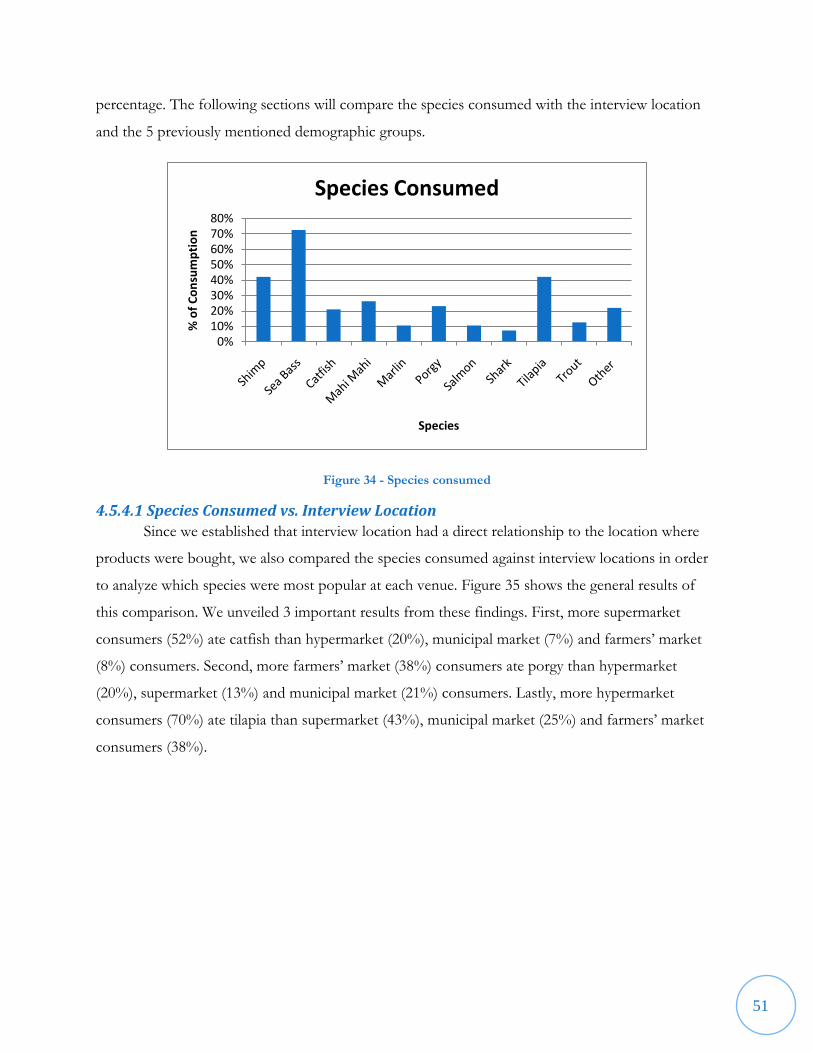
51
percentage. The following sections will compare the species consumed with the interview location
and the 5 previously mentioned demographic groups.
Figure 34 - Species consumed
4.5.4.1 Species Consumed vs. Interview Location
Since we established that interview location had a direct relationship to the location where
products were bought, we also compared the species consumed against interview locations in order
to analyze which species were most popular at each venue. Figure 35 shows the general results of
this comparison. We unveiled 3 important results from these findings. First, more supermarket
consumers (52%) ate catfish than hypermarket (20%), municipal market (7%) and farmers‟ market
(8%) consumers. Second, more farmers‟ market (38%) consumers ate porgy than hypermarket
(20%), supermarket (13%) and municipal market (21%) consumers. Lastly, more hypermarket
consumers (70%) ate tilapia than supermarket (43%), municipal market (25%) and farmers‟ market
consumers (38%).
0%10%20%30%40%50%60%70%80%
% o
f C
on
sum
pti
on
Species
Species Consumed

52
Figure 35 - Location of interview vs. species consumed
4.5.4.2 Species Consumed vs. Employment Status
We found one significant correlation from our comparison between species consumed and
the consumer‟s employment status. Figure 36 shows the results of this comparison. Employed
consumers (52%) ate more tilapia than unemployed (30%) and pensioned (32%) consumers. We also
noticed that employed consumers ate a wider variety of species. This may have been influenced by
the fact that employed consumers were able to afford more types of fish.
0%
10%
20%
30%
40%
50%
60%
70%
80%
90%
100%%
of
Co
nsu
mp
tio
n
Species
Location of Interview vs. Consumed Species
Hypermarkets
Supermarkets
Municipal Markets
Farmers' Market

53
Figure 36 - Species consumed vs. employment status
4.5.4.3 Species Consumed vs. Age
The comparison between species consumed and age can be seen in Figure 37. In this section
we found a relationship between age and two of the species. The first correlation showed that the
older the consumer, the less chance that they would consume shrimp (-0.10). Tilapia also showed a
negative correlation compared to age (-0.25). Although the numerical correlation is not strong due to
the nature of the data, there was a slight decrease in tilapia consumption between the ages of 0 to 65,
and a drastic drop in tilapia consumption after the age of 66.
0%
10%
20%
30%
40%
50%
60%
70%
80%
90%
100%%
of
Co
nsu
mp
tio
n
Species
Species Consumed vs. Employment Status
Employed
Unemployed
Pension
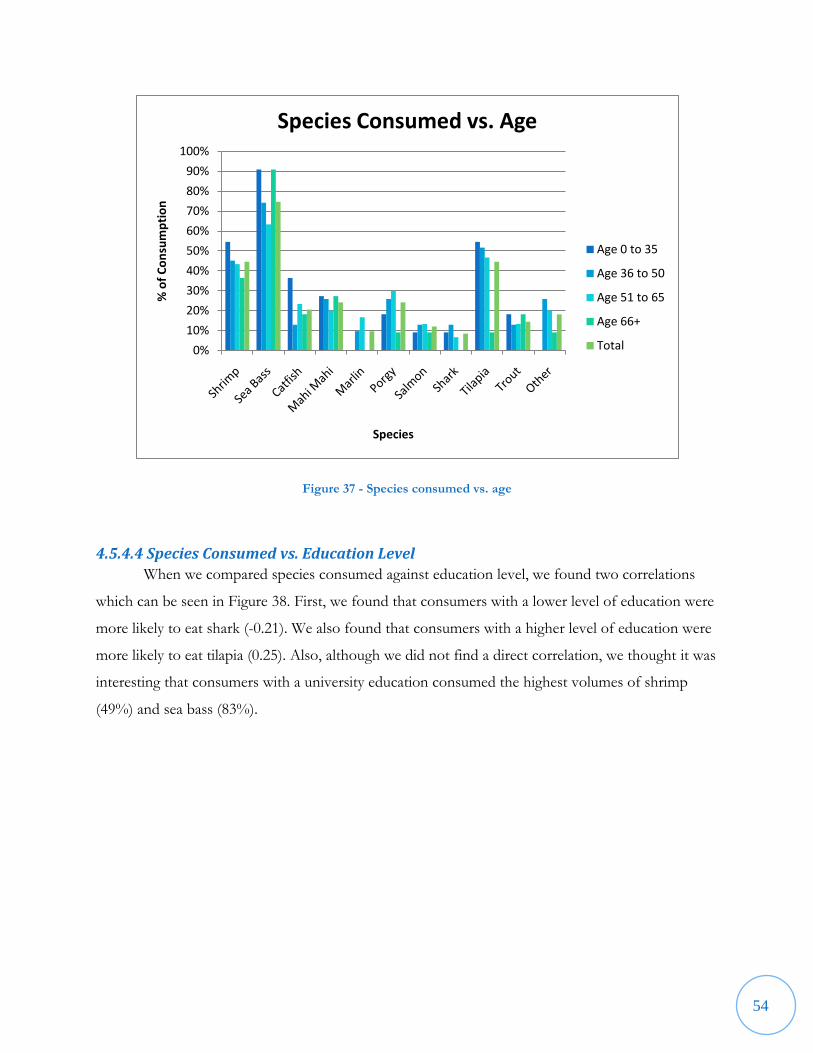
54
Figure 37 - Species consumed vs. age
4.5.4.4 Species Consumed vs. Education Level
When we compared species consumed against education level, we found two correlations
which can be seen in Figure 38. First, we found that consumers with a lower level of education were
more likely to eat shark (-0.21). We also found that consumers with a higher level of education were
more likely to eat tilapia (0.25). Also, although we did not find a direct correlation, we thought it was
interesting that consumers with a university education consumed the highest volumes of shrimp
(49%) and sea bass (83%).
0%
10%
20%
30%
40%
50%
60%
70%
80%
90%
100%%
of
Co
nsu
mp
tio
n
Species
Species Consumed vs. Age
Age 0 to 35
Age 36 to 50
Age 51 to 65
Age 66+
Total
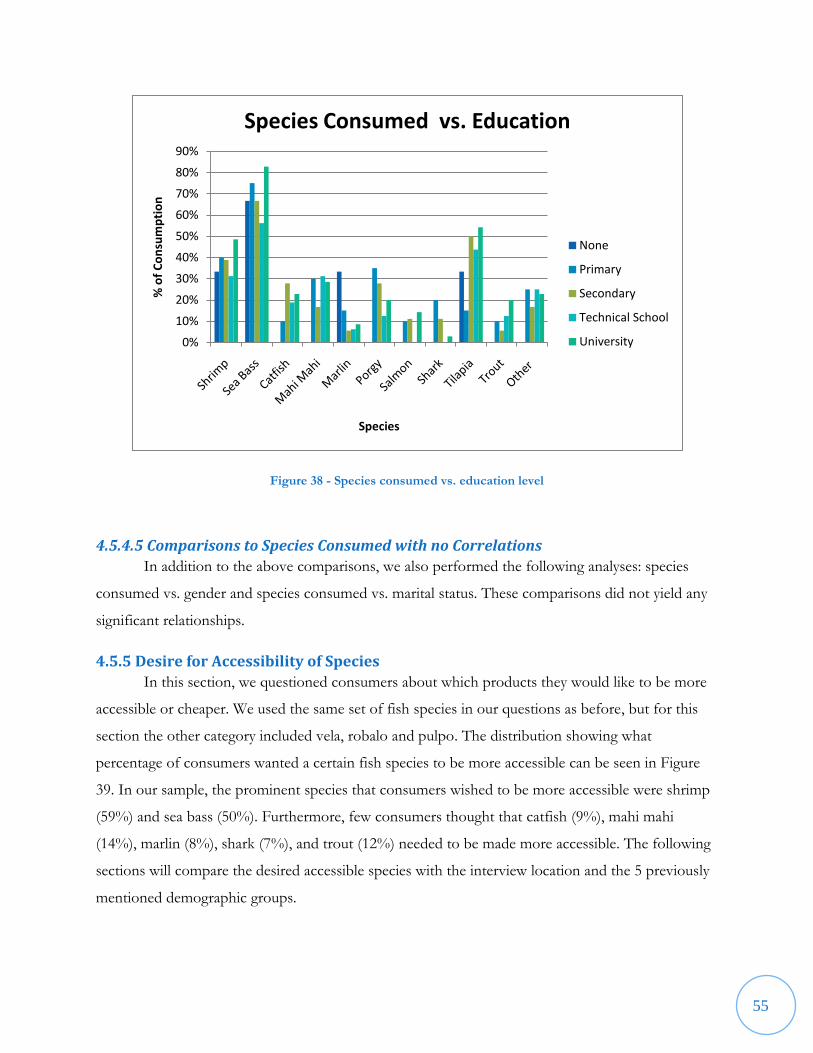
55
Figure 38 - Species consumed vs. education level
4.5.4.5 Comparisons to Species Consumed with no Correlations
In addition to the above comparisons, we also performed the following analyses: species
consumed vs. gender and species consumed vs. marital status. These comparisons did not yield any
significant relationships.
4.5.5 Desire for Accessibility of Species
In this section, we questioned consumers about which products they would like to be more
accessible or cheaper. We used the same set of fish species in our questions as before, but for this
section the other category included vela, robalo and pulpo. The distribution showing what
percentage of consumers wanted a certain fish species to be more accessible can be seen in Figure
39. In our sample, the prominent species that consumers wished to be more accessible were shrimp
(59%) and sea bass (50%). Furthermore, few consumers thought that catfish (9%), mahi mahi
(14%), marlin (8%), shark (7%), and trout (12%) needed to be made more accessible. The following
sections will compare the desired accessible species with the interview location and the 5 previously
mentioned demographic groups.
0%
10%
20%
30%
40%
50%
60%
70%
80%
90%%
of
Co
nsu
mp
tio
n
Species
Species Consumed vs. Education
None
Primary
Secondary
Technical School
University

56
Figure 39 - Distribution of desire for accessibility of species
4.5.5.1 Desire for Accessibility of Species vs. Location of Interview
We compared these data in order to see if the desire for greater accessibility of products
differed from location to location. The results can be seen in Figure 40. This comparison yielded a
number of noteworthy results. First, a relatively large percentage of consumers who were
interviewed in farmers‟ markets (79%) said they wanted more accessible shrimp whereas a smaller
percentage of hypermarket (55%), supermarket (52%), and municipal market (46%) consumers
desired shrimp to be more accessible. Also, sea bass and tilapia seemed to be desired by more
customers in markets with better organization (e.g. Hypermarkets and supermarkets). Additional
findings show that catfish, mahi mahi, and marlin are desired to be more accessible in supermarkets
(22%, 26%, and 26% respectively); percentages of consumers desiring these products at the other
venues are negligible. Also, 40% of consumers in hypermarkets and 34% of consumers in
supermarkets desired more accessible salmon, which was a high percentage compared to municipal
market (4%) and farmers‟ market (21%) consumers.
0%
10%
20%
30%
40%
50%
60%
70%
Shimp Sea Bass
Catfish Mahi Mahi
Marlin Porgy Salmon Shark Tilapia Trout Other
% o
f P
op
ula
tio
n
Species
Desired Accessible Species

57
Figure 40 - Desire for accessibility of species vs. location of interview
4.5.5.2 Desire for Accessibility of Species vs. Age
The results of our comparison between desire for greater accessibility of products and age
can be seen in Figure 41. We were able to identify two correlations. The first correlation showed us
that older consumers were less likely to wish for salmon to be more accessible (-0.18). The second
correlation showed us that older consumers were also less likely to wish for more accessible shark (-
0.15). Furthermore, we noticed that consumers between the ages of 36 to 65 exhibited a higher
demand for accessible shrimp (67%) than consumers below the age of 35 or those above age 66
(45%). In addition, we also discovered that consumers over the age of 51 reported a higher demand
for accessible porgy (29%).
0%
10%
20%
30%
40%
50%
60%
70%
80%
90%
% o
f P
op
ula
tio
n
Species
Desire for Accessibility of Species vs. Location of Interview
Hypermarkets
Supermarkets
Municipal Markets
Farmers' Market

58
Figure 41 - Desire for accessibility of species vs. age
4.5.5.3 Desire for Accessibility of Species vs. Marital Status
Our next comparison between desire for greater accessibility of products and marital status
can be seen in Figure 42. We found trends between marital status and certain species including
shrimp, sea bass, and catfish. A higher percentage of consumers with partners (65%) reported a
desire for greater accessibility to shrimp whereas single consumers (42%) reported a lesser desire for
accessibility to shrimp. Likewise, a higher percentage of consumers with partners (54%) expressed a
desire for more accessibility to sea bass, while single consumers expressed less desire for accessibility
to sea bass (38%). Additionally, we found that a higher percentage of consumers with partners
(12%) desired a greater accessibility to tilapia than single consumers (4%).
0%
10%
20%
30%
40%
50%
60%
70%
80%
% o
f P
op
ula
tio
n
Species
Desire for Accessibility of Species vs. Age
Age 0 to 35
Age 36 to 50
Age 51 to 65
Age 66+
Total

59
Figure 42 - Desire for accessibility of species vs. marital status
4.5.5.4 Desire for Accessibility of Species vs. Employment Status
Our comparison of desire for greater accessibility of products against employment status can
be seen in Figure 43. We noticed that a very small amount of employed consumers (4%) desired
catfish to be more accessible whereas unemployed (15%) and pensioned (16%) consumers expressed
a greater desire for catfish to be more accessible. Also, a comparatively large percentage of
unemployed consumers (30%) wanted more accessibility to porgy while employed (15%) and
pensioned (21%) consumers reported a lesser desire for accessible porgy. In addition, a relatively low
percentage of unemployed consumers (10%) desired more accessible salmon compared to employed
(30%) and pensioned consumers (21%). Finally, a relatively high percentage of pensioned consumers
(32%) wanted more accessible tilapia whereas employed (19%) and unemployed (20%) consumers
did not express this same level of desire.
0%
10%
20%
30%
40%
50%
60%
70%
% o
f P
op
ula
tio
n
Species
Desire for Accessibility of Species vs. Marital Status
Together
Single

60
Figure 43 - Desire for accessibility of species vs. employment status
4.5.5.5 Desire for Accessibility of Species vs. Education Level
We also compared consumers‟ desire for greater accessibility of products against their
education level; the results of this comparison can be seen in Figure 44. We discovered that
consumers with a higher level of education expressed a greater desire for more accessible salmon
(0.25). Additionally we found that consumers‟ desire for shrimp seemed to increase with their
education level, although the correlation was only 0.09. We also noticed that only consumers with an
education level above technical school desired trout to be more accessible (25% for technical and
14% for university).
0%
10%
20%
30%
40%
50%
60%
70%
% o
f P
op
ula
tio
n
Species
Desire for Accessibility of Species vs. Employment Status
Employed
Unemployed
Pension

61
Figure 44 - Desire for accessibility of species vs. education level
4.5.5.6 Desire for Accessibility of Species vs. Gender
We completed a comparison between consumers‟ desire for greater accessibility of species
and gender but found no significant correlations.
4.5.6 Volume of Fish Consumed
In addition to the other categories mentioned above, we surveyed consumers about how
much fish they ate per week. Consumers reported eating an average of 1.34 kg per week with a
standard deviation of 0.76. Table 9 shows the average volumes and standard deviations for fish
consumed by each demographic. We noticed that consumers age 66+ consumed the least amount of
fish per week (1 kg/week). In addition, we found that uneducated people consumed the least
amount of fish in the education level demographic (0.15). It was interesting to note that employed
consumers ate a larger amount of fish (1.45 kg/week) than unemployed (1.25 kg/week) and
pensioned consumers (1.08 kg/week).
0%
10%
20%
30%
40%
50%
60%
70%
80%
% o
f P
op
ula
tio
n
Species
Desire for Accessibility of Species vs. Education Level
None
Primary
Secondary
Technical
University

62
Volume Consumed (per week) vs. Demographic Groups
Average SD
Average SD A
ge G
rou
ps 0-35 1.39 0.80
Edu
cati
on
Lev
el None 0.50 0.00
36-50 1.23 0.79 Primary 1.20 0.71
51-65 1.46 0.78 Secondary 1.47 0.63
66+ 1.00 0.50 Technical 1.17 0.95
University 1.41 0.68
Gen
der
Male 1.49 0.88
Female 1.28 0.70
Emp
loym
en
t
Employed 1.45 0.88
Unemployed 1.28 0.62
Mar
ital
St
atu
s
Together 1.38 0.74 Pensioned 1.08 0.48
Single 1.24 0.81
Table 9 - Volume consumed vs. demographic groups
4.5.7 Frequency of Fish Consumption
Our fourth category included surveying consumers about how many times per month they
ate fish. Consumers reported eating fish an average of 5.11 times per month with a standard
deviation of 2.48. Table 10 shows the average frequency of fish consumption and the standard
deviations for each demographic group. We noticed that consumers age 66+ exhibited a very low
frequency of fish consumption (3.91 times/month). We also discovered a relationship within the
marital status demographic: people who reported having a partner seemed to consume fish more
frequently (5.40 times/month) than single people (4.35 times/month). Within the education
demographic we noticed a positive correlation between education level and the consumer‟s fish
consumption frequency (0.25). Additionally we found that consumers who were employed
consumed fish more frequently (5.51 times/month) than pensioned consumers (4.16 times/month),
however this may be due to the fact that pensioned consumers also belong to the 66+ age group.
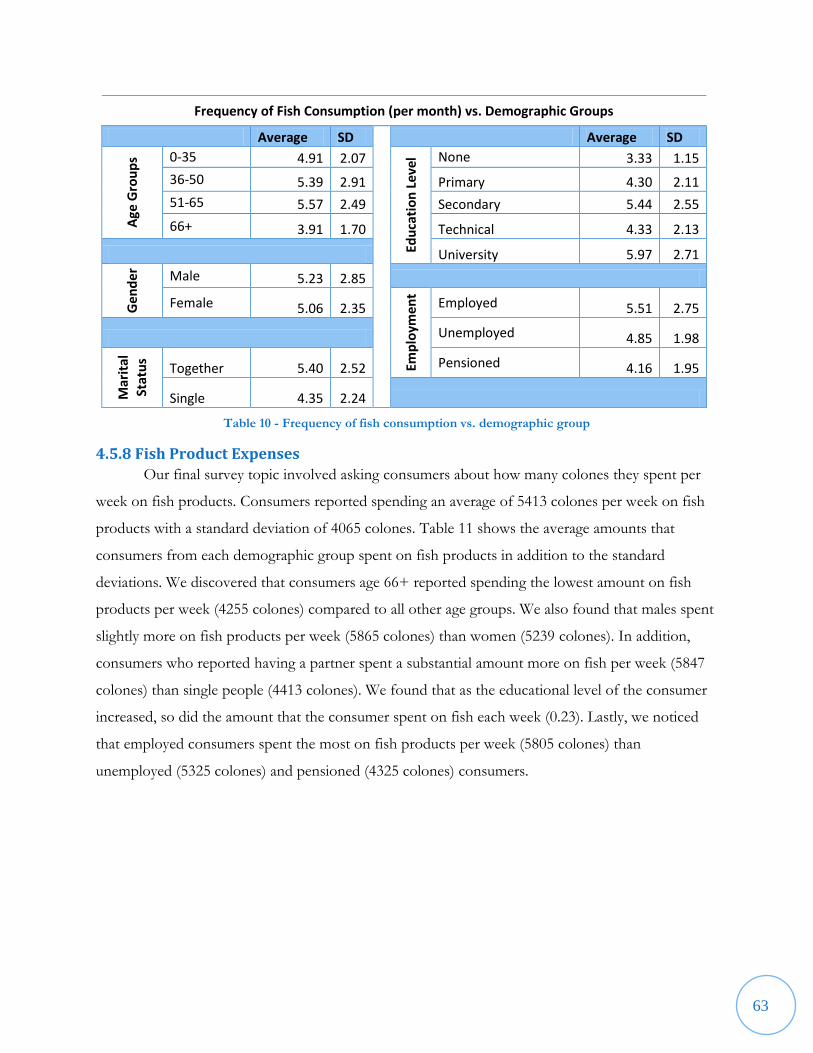
63
Frequency of Fish Consumption (per month) vs. Demographic Groups
Average SD
Average SD A
ge G
rou
ps 0-35 4.91 2.07
Edu
cati
on
Lev
el None 3.33 1.15
36-50 5.39 2.91 Primary 4.30 2.11
51-65 5.57 2.49 Secondary 5.44 2.55
66+ 3.91 1.70 Technical 4.33 2.13
University 5.97 2.71
Gen
der
Male 5.23 2.85
Female 5.06 2.35
Emp
loym
en
t
Employed 5.51 2.75
Unemployed 4.85 1.98
Mar
ital
St
atu
s
Together 5.40 2.52 Pensioned 4.16 1.95
Single 4.35 2.24
Table 10 - Frequency of fish consumption vs. demographic group
4.5.8 Fish Product Expenses
Our final survey topic involved asking consumers about how many colones they spent per
week on fish products. Consumers reported spending an average of 5413 colones per week on fish
products with a standard deviation of 4065 colones. Table 11 shows the average amounts that
consumers from each demographic group spent on fish products in addition to the standard
deviations. We discovered that consumers age 66+ reported spending the lowest amount on fish
products per week (4255 colones) compared to all other age groups. We also found that males spent
slightly more on fish products per week (5865 colones) than women (5239 colones). In addition,
consumers who reported having a partner spent a substantial amount more on fish per week (5847
colones) than single people (4413 colones). We found that as the educational level of the consumer
increased, so did the amount that the consumer spent on fish each week (0.23). Lastly, we noticed
that employed consumers spent the most on fish products per week (5805 colones) than
unemployed (5325 colones) and pensioned (4325 colones) consumers.

64
Fish Products Expenses in Colones (per week) vs. Demographic Groups
Average SD
Average SD
Age
Gro
up
s 0-35 5,255 3,747
Edu
cati
on
Lev
el
None 2,167 611
36-50 5,398 3,819 Primary 4,179 3,117
51-65 5,238 3,093 Secondary 5,103 2,243
66+ 4,255 3,799 Technical 5,914 4,329
University 6,077 4,916
Gen
der
Male 5,865 5,481
Female 5,239 3,404
Emp
loym
en
t
Employed 5,805 4,613
Unemployed 5,325 3,120
Mar
ital
St
atu
s
Together 5,847 4,230 Pensioned 4,325 3,488
Single 4,413 3,530
Table 11 - Product expenses vs. demographic group

65
Chapter 5: Conclusions and Recommendations After completing our analysis of the different market areas and sections of the distribution
channel, we were able to better assess the current market and outline several conclusions and
recommendations for INCOPESCA. Additionally, these conclusions and recommendations will be
useful to INCOPESCA when establishing a marketing strategy.
5.1 Producer Conclusions and Recommendations After studying the data we gathered from trout, tilapia and shrimp farmers, we formed
conclusions that applied to all three types of farms. Additionally, there were a few conclusions and
recommendations that were specific to different farms.
Overall, our results indicated that producers were not satisfied with the price at which they
purchase feed. All of the farmers acknowledged that imported feed was of higher quality and it
yielded a better and healthier product. We recommend that INCOPESCA (and other organizations
that focus on the betterment of local producers) work towards one of the following: providing local
feed of better quality or providing imported feed at a lower cost to producers.
In addition, most of the farmers sold their products in their locally-owned restaurant and
were not willing to commercialize their product in cities; this was due to a lack of proper equipment
for processing the products and also due to a lack of effective means for conserving freshness and
transporting the fish. We recommend that INCOPESCA, perhaps in conjunction with other
organizations, investigate means to provide producers with a facility used to get the fish ready for
sale and charge the producers a small fee for using the facility. This will help producers
commercialize their products in the metropolitan area and save them the expense of purchasing
their own equipment. This facility could also serve as a source of employment if people are needed
to operate the machinery.
5.1.1 Trout Producer Conclusions and Recommendations
Based on our data, we considered additional conclusions and recommendations specific to
trout producers which pertained mostly to the environment and socio-economic aspects.
A major problem that some trout producers encountered concerned the climate at lower
elevations. Some producers mentioned that, due to global warming, the temperature of the water in
the “tanks” was not cold enough for cultivating trout; this negatively impacts production since
warmer water causes diseases in the fish. Our recommendation for trout farmers located in regions

66
of lower elevations is that they specialize in new types of fish, such as salmon or tilapia, which grow
better at higher temperatures and are in high demand in the metropolitan market.
Some trout farmers collaborate with each other to commercialize their product due to the
lack of equipment for processing their fish. Nonetheless, they still have to face competition amongst
themselves because the farms are located in the same region. A possible solution to this problem
could be to use better visual displays or written advertisements to attract the people‟s attention as
they are passing by; these advertisements could include information about the price and presentation
of the fish.
Additionally, we recognize that the trout market is suffering in the metropolitan area since
only a small percentage of consumers reported eating trout. In order to boost the production and
sales of trout we suggest that it be promoted extensively at metropolitan venues. We also
recommend (based on consumer demand) that trout producers begin the large-scale cultivation of
salmon (a cold water fish) as one way to maximize their sales; this recommendation was based on
our market study in which we found that cultivated salmon is currently imported and sold at a high
price on the local market.
5.1.2 Tilapia Producer Conclusions and Recommendations
Farm-raised tilapia is the most common aquaculture product sold on the local market. Most
of the producers we interviewed talked about a specific socio-economic problem that they
encountered in addition to the generalized issues we mentioned above.
During our interviews, the producers spoke at length about the competition between their
products and products from larger producers. The larger producers can afford to buy the feed at a
much higher price which local producers then have to comply with. The larger producers can also
sell their product for a lower price on the national market since they produce such a large volume of
tilapia; smaller producers who cannot produce the same volumes lose money since they cannot
expect to be competitive selling their product at a higher price. To eliminate the competition
between small- and medium-scale producers and larger producers, we recommend that
INCOPESCA set up an organization similar to Coonaprosal (the organization which aids shrimp
farmers with commercializing their products). Collaboration between producers will help strengthen
the market for tilapia on all levels.

67
5.1.3 Shrimp Producer Conclusions and Recommendations
In addition to our aforementioned general recommendations, we had an additional
conclusion and recommendation to address a problem specific to shrimp producers.
We found that shrimp producers sell their product to intermediaries, and the product then
moves through several more intermediaries before reaching the final market. This causes the price of
the shrimp to be high and also decreases the freshness and quality of the product (Ken Dirst,
Personal Communication, November 23, 2010). In order to improve the distribution channel for the
commercialization of shrimp, we recommend for INCOPESCA to collaborate more with
Coonaprosal and the shrimp producers to devise methods for improving the market, including
means for eliminating some of the intermediaries.
5.2 Wholesaler Conclusions and Recommendations Our analysis of wholesalers as a member of the distribution channel provided a better
understanding of the distribution routes and the types of fish sold on the national market.
Out of all the wholesalers we interacted with, only a few stated that they sold imported
products. Most of the products sold by wholesalers on the local market were marine products rather
than cultivated products. We also discovered that aquaculture products are sold on the market to
compensate for a deficiency of marine products.
Our recommendation for wholesalers would be to increase the volume of fish species that
are in demand by consumers; this would maximize their sales and satisfy the consumer at the same
time.
5.3 Market Manager and Consumer Conclusions and Recommendations After analyzing our market and consumer findings, we made a few general conclusions about
each of the market types. In addition, we made recommendations to each of the four types of
markets included in this section with regards to the consumer.
Overall we concluded that markets could use advertisement campaigns to keep current
customers and attract additional consumers from different demographic backgrounds. Our
consumer demographic results showed information that advertisement campaigns can use for the
short term goal of retaining current customers. From our interviews with consumers, we found that
the average age of the consumer is 51.5 years old. We also discovered that the majority of consumers

68
were female. Furthermore, 73% of consumers live with a spouse or partner, 77% of consumers gain
income through either employment or pension, and 54% of consumers have attained some level of
higher education (technical or university). For the long term, markets should target the
demographics of different markets, in order to increase the variety of customers.
We also unveiled that the demand for certain fish species dictated the total amounts of each
fish species sold. We recommend that markets continue to commercialize the products they believe
are in the highest demand. In order to gain more profits, the products in lower demand should be
advertised to exhibit their health benefits and quality of taste, since the consumers expressed these
reasons for consuming fish. In these advertisements, the products in lower demand could be
compared next to higher demand products in a way that would make the products seem comparable
to one another; this would ideally increase their sales. Additionally, for frozen products, the
convenience of the product should be advertised. We came to this conclusion since 57% of our
consumer sample was employed, therefore they might want a convenient product that can be placed
in an oven or microwave at the end of a long day.
Since the market is price-driven, markets can change their prices based on the fish in highest
demand using the information we found through our surveys. With this information they may
increase the total profits for the sales of each market‟s fish.
We also recommend that different venues sell different products. We noticed in our results
that municipal markets sold large quantities of shark, but hypermarkets and supermarkets did not
sell as much. We recommend that the fish in higher demand in the municipal and farmers‟ markets
(shark and sea bass) be sold in a higher volume at the hyper- and supermarkets to increase product
variety; similarly, tilapia and catfish should be sold at the municipal and farmers‟ markets in greater
quantities to attract other customers. In order to do this, hyper- and supermarkets as well as
municipal and farmers‟ markets should consider using other wholesaler outlets that supply the other
markets. Furthermore, according to the consumer results markets should make shrimp, sea bass,
salmon and tilapia more accessible to the consumer. This can be done by buying products in bulk,
advertising sales on fish, or diminishing the number of intermediaries for products. In particular,
shrimp should be more accessible in farmers‟ markets; sea bass, salmon, and tilapia should be more
accessible in hypermarkets and supermarkets.
69
5.3.1 Hyper- and Supermarket Conclusions and Recommendations
Based on our observations, we found that hypermarkets and supermarkets displayed
evidence of good sanitation. Because their products are not processed and cleaned for the consumer
to see, freshness is not as evident as other market types. These markets should focus their
advertisements not only on the health benefits of the product but also on the freshness of the
product; this should be done to further raise awareness since these issues are important to the
consumer.
In the short term, hyper- and supermarkets should advertise to younger consumers with a
high education. Furthermore, they should keep advertising the popular aquaculture products, such as
tilapia, trout, catfish, and salmon. For the long term, these markets should advertise to older
consumers with a lower education and market more marine products.
5.3.2 Municipal Market Conclusions and Recommendations
Municipal markets should focus on the presentation of the fish they sell as well as on the
cleanliness and organization of their venue. The addition of small details, such as garnishes or
organized presentations of fish (like the supermarket arrangement), would attract more customers of
different demographic backgrounds to their stands. They should advertise to their strengths and
market their product as fresh.
For short term advertisement, municipal markets should focus on older consumer with a low
education to keep their current customers. Additionally, they should keep advertising the marine
products they sell. In the future, the municipal markets should switch their advertisements to target
younger consumers with a higher education. They should also experiment with selling more
aquaculture products to attract other demographics.
5.3.3 Farmers’ Market Conclusions and Recommendations
Since many consumers do not shop for fish at farmers‟ market, our first recommendation
for farmers‟ markets in San José would be to begin advertising their products with fliers. Since many
vendors did not wish to advertise, this should only be done if the fliers are affordable. If this is the
case, a more prominent sign depicting where the fish is sold may be a worthwhile investment
because the markets are popular and busy. Also, as with the municipal market, they should try to
arrange their products in an aesthetically pleasing way to attract more customers.

70
5.4 Final Conclusions and Recommendations In conclusion, our group accomplished several objectives set by INCOPESCA (described
previously) for a complete analysis of the current market in the metropolitan area of San José. The
data we collected from several trout, tilapia and shrimp farms helped us identify the distribution
routes for the accessibility of these aquaculture products. Appendix G contains a flowchart that
depicts the typical channels of distribution for many fish products before they reach the final
consumer. We also discovered that intermediaries extend the distribution route for some products
(such as shrimp); these intermediate steps cause the price to increase before the product reaches the
consumer. Additionally, we surveyed 95 consumers in different market areas to determine whether
quality was an important factor influencing the sales of fish products. In general, consumers
admitted that their choices when buying fish were more price-driven than quality-driven but they
also said that they trusted their preferred venue to offer products of high caliber. Additionally, we
saw that almost 50% of the aquaculture products in the market are imported. Although local
aquaculture (tilapia and trout) is sold more than imported (catfish and salmon), the imported
aquaculture products are cheaper than the local. In order to assess the level of acceptance for
different types of products, we questioned several market managers about the demand for different
products on sale. Our analysis showed that prices and the type of market consumers shopped at
influenced the acceptance level of certain fish products. For instance, sea bass was popular at
municipal markets since it was cheaper there. We fulfilled our final objective by interviewing market
managers and surveying consumers about current advertisement techniques. We found that hyper-
and supermarkets used different forms of advertisements while municipal and farmers‟ markets
relied on word-of-mouth.
We hope that the information in this project, which includes a detailed analysis of our
findings, conclusions and recommendations from our study of the Costa Rican metropolitan area,
will help INCOPESCA to develop an effective marketing strategy for the sale of aquaculture
products. Due to the time constraints placed on our work, we were only able to focus our study on
the cities of Alajuela, Heredia and San José as a representation of the entire metropolitan area. We
believe that our project provides a very basic foundation for the development of a marketing
strategy, and therefore we recommend that INCOPESCA conducts further studies of each of these
market populations to obtain more detailed results. We propose that additional studies focus on only

71
one or two populations (particularly the markets or the consumers), focus on one type of product,
or be conducted over a longer time period.

72
References Beland, D.K., Buckley, J.H., Miggins, L.M., Warren, A.L. (2010) Good Practices for the Cultivation of Trout in Costa Rica (Report No. E-project 121609-173245). Retrieved from Worcester Polytechnic Institute Electronic Projects Collection: http://www.wpi.edu/Pubs/E-project/Available/E-project-121609-173245 Broders, A.C., Douville, M.T., & Slonski, M.R. (2005) Best Practices for Small to Medium Scale Tilapia Aquaculture (Report No. E-project 071305-115404). Retrieved from Worcester Polytechnic Institute Electronic Projects Collection: http://www.wpi.edu/Pubs/E-project/Available/E-project-071305-115404 Bryand, D.L., Kadilak, A.L., & Pani, S.R. (2006) Good Management Practices for Shrimp Farming in Costa Rica (Report No. E-project-070506-110444). Retrieved from Worcester Polytechnic Institute Electronic Projects Collection: http://www.wpi.edu/Pubs/E-project/Available/E-project-070506-110444
Engle, C. R., & Neira, I. (2003a). Potential for open-air fish market outlets for tilapia in Nicaragua. Aquaculture CRSP Research Report, 03-194.
Engle, C. R., & Neira, I. (2003b). Potential for supermarket outlets for tilapia in Nicaragua. Aquaculture CRSP Research Report, 03-190.
Engle, C. R., & Neira, I. (2003c). Potential for restaurant markets for tilapia in Nicaragua. Aquaculture CRSP Research Report, 03-192.
Engle, C. R., & Quagrainie, K. (2006). Aquaculture marketing handbook. Ames, Iowa: Blackwell Publishing.
Food and Agricultural Organization of the United Nations (FAO). (2010). Retrieved from http://www.fao.org/
Fúnez, O., Neira, I., & Engle, C. (2003). Potential for open-air fish market outlets for tilapia in Honduras. Aquaculture CRSP Research Report, , 03-193.
Hernandez-Rodriguez, A., Alceste-Oliviero, C., Sanchez, R., Jory, D., Vidal, L., & Constain-Franco, L. F. (2000). Aquaculture development trends in latin america and the caribbean. Paper presented at the Aquaculture in the Third Millennium. Technical Proceedings of the Conference on Aquaculture in the Third Millennium, Bangkok, Thailand, 20-25. INCOPESCA. (2010). INCOPESCA: Instituto Costarricense de Pesca y Acuicultura. Retrieved 09/20, 2010, from http://www.incopesca.go.cr
Instituto Costarricense de Pesca y Acuicultura INCOPESCA. (2010). Retrieved from http://www.incopesca.go.cr
INEC Instituto Nacional de Estadística y Censos de Costa Rica. (2010). Retrived from http://www.inec.go.cr/Web/Home/pagPrincipal.aspx

73
Kinnucan, H. W., & Venkateswaran, M. (1990). Effects of generic advertising on perceptions and behavior: The case of catfish. Southern Journal of Agricultural Economics, 22(02)
Kutty M.N. & Pillay T.V., (2005). Aquaculture: Principles and Practices, Oxford, UK: Wiley-Blackwell Publishing
Leyva, C. M., & Engle, C. R. (2008). Optimizing tilapia, oreochromis sp., marketing strategies in Nicaragua: A mixed-integer transshipment model analysis. Journal of the World Aquaculture Society, 39(3), 339-351.
Parkin, M. (2005).The Economic Problem. In D. Clinton & A D‟Ambrosio (Eds.), Macroeconomics (pp. 31-50). New York, NY: Pearson; Addison Wesley.
People and the planet. (2006). 2006 Aquaculture key to meeting demand for fish. Retrieved from
http://www.peopleandplanet.net/?lid=28378&topic=23§ion=35
Ramírez, R. (2007). Mejoramiento de los Mercados Internos de Productos Pesqueros (No. 3111). San José, Costa Rica: INCOPESCA. Retrieved from http://www.incopesca.go.cr/Mercadeo/Varios/MERCADOS%20INTERNOS%20PROYECTO%20FAO.pdf

74
Glossary of Fish Names
Spanish Name English Name
Camarón Shrimp
Corvina (Robalo) Sea Bass
Panga (Corvineta) Catfish
Dorado Mahi Mahi
Marlín Marlin
Pargo Porgy
Tiburón (Bolillo) Shark
Vela Sail Fish
Tilapia Tilapia
Chatarra Scraps
Atún Tuna
Macarela Mackerel
Trucha Trout
Salmon Salmon
***This glossary of terms is for reference for the materials in the following appendices***
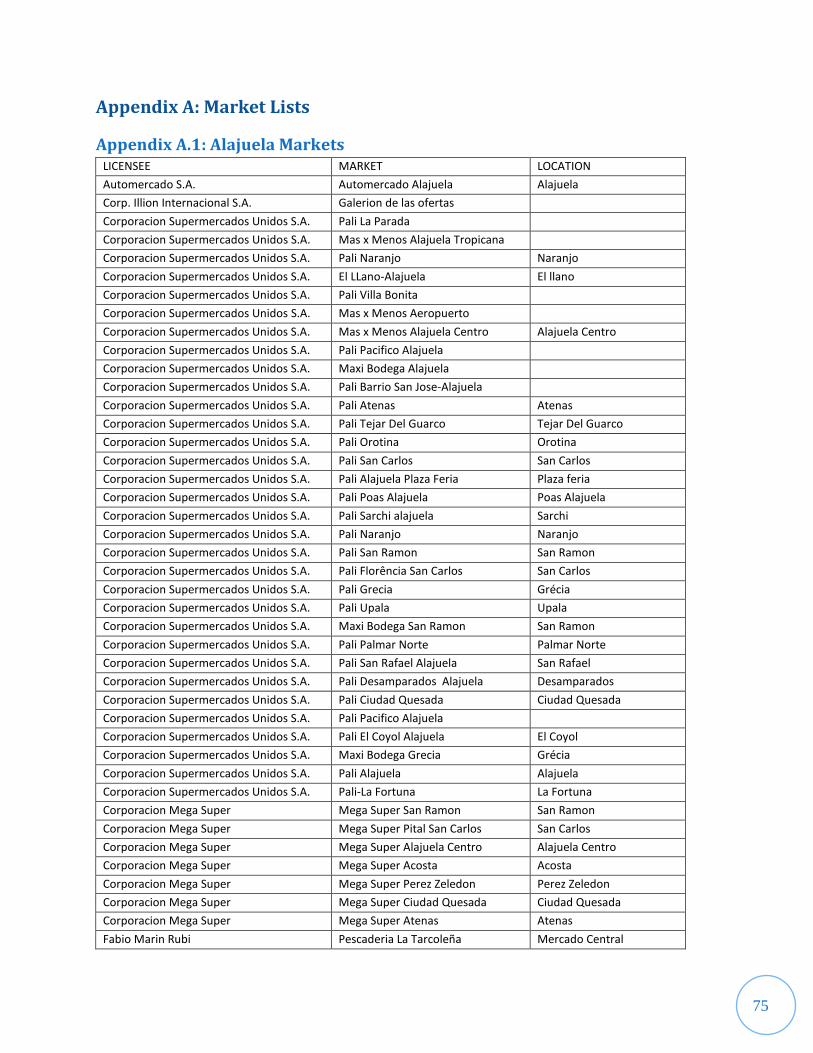
75
Appendix A: Market Lists
Appendix A.1: Alajuela Markets LICENSEE MARKET LOCATION
Automercado S.A. Automercado Alajuela Alajuela
Corp. Illion Internacional S.A. Galerion de las ofertas
Corporacion Supermercados Unidos S.A. Pali La Parada
Corporacion Supermercados Unidos S.A. Mas x Menos Alajuela Tropicana
Corporacion Supermercados Unidos S.A. Pali Naranjo Naranjo
Corporacion Supermercados Unidos S.A. El LLano-Alajuela El llano
Corporacion Supermercados Unidos S.A. Pali Villa Bonita
Corporacion Supermercados Unidos S.A. Mas x Menos Aeropuerto
Corporacion Supermercados Unidos S.A. Mas x Menos Alajuela Centro Alajuela Centro
Corporacion Supermercados Unidos S.A. Pali Pacifico Alajuela
Corporacion Supermercados Unidos S.A. Maxi Bodega Alajuela
Corporacion Supermercados Unidos S.A. Pali Barrio San Jose-Alajuela
Corporacion Supermercados Unidos S.A. Pali Atenas Atenas
Corporacion Supermercados Unidos S.A. Pali Tejar Del Guarco Tejar Del Guarco
Corporacion Supermercados Unidos S.A. Pali Orotina Orotina
Corporacion Supermercados Unidos S.A. Pali San Carlos San Carlos
Corporacion Supermercados Unidos S.A. Pali Alajuela Plaza Feria Plaza feria
Corporacion Supermercados Unidos S.A. Pali Poas Alajuela Poas Alajuela
Corporacion Supermercados Unidos S.A. Pali Sarchi alajuela Sarchi
Corporacion Supermercados Unidos S.A. Pali Naranjo Naranjo
Corporacion Supermercados Unidos S.A. Pali San Ramon San Ramon
Corporacion Supermercados Unidos S.A. Pali Florência San Carlos San Carlos
Corporacion Supermercados Unidos S.A. Pali Grecia Grécia
Corporacion Supermercados Unidos S.A. Pali Upala Upala
Corporacion Supermercados Unidos S.A. Maxi Bodega San Ramon San Ramon
Corporacion Supermercados Unidos S.A. Pali Palmar Norte Palmar Norte
Corporacion Supermercados Unidos S.A. Pali San Rafael Alajuela San Rafael
Corporacion Supermercados Unidos S.A. Pali Desamparados Alajuela Desamparados
Corporacion Supermercados Unidos S.A. Pali Ciudad Quesada Ciudad Quesada
Corporacion Supermercados Unidos S.A. Pali Pacifico Alajuela
Corporacion Supermercados Unidos S.A. Pali El Coyol Alajuela El Coyol
Corporacion Supermercados Unidos S.A. Maxi Bodega Grecia Grécia
Corporacion Supermercados Unidos S.A. Pali Alajuela Alajuela
Corporacion Supermercados Unidos S.A. Pali-La Fortuna La Fortuna
Corporacion Mega Super Mega Super San Ramon San Ramon
Corporacion Mega Super Mega Super Pital San Carlos San Carlos
Corporacion Mega Super Mega Super Alajuela Centro Alajuela Centro
Corporacion Mega Super Mega Super Acosta Acosta
Corporacion Mega Super Mega Super Perez Zeledon Perez Zeledon
Corporacion Mega Super Mega Super Ciudad Quesada Ciudad Quesada
Corporacion Mega Super Mega Super Atenas Atenas
Fabio Marin Rubi Pescaderia La Tarcoleña Mercado Central

76
Fabio Marin Rubi Pescaderia Pargo Rojo Mercado Central
Joaquin Rodriguez Cascante Geminis Mercado Atenas
John Arroyo Ugalde Pescaderia El Rey del mar Alajuela
Juan Felix Alpizar Vargas Pescaderia Jimenez Mercado Alajuela
Mariscoa de San Carlos S.A. Mariscos San Carlos Mercado San Carlos
Mariscos Zaragoza S.A. Mariscos Zaragoza Palmares
Miguel Angel Jimenez Villalta Pescaderia Jimenez Mercado Alajuela
Neftali Gdo Briceño Gonzalez Distribuidora Mariscos Mercado Alajuela
Otto Calvo Corella Mariscos Apromar Mercado Alajuela
Perimercados S.A. Perimercado San Ramon San Ramon
Perimercados S.A. Perimercado Alajuela Alajuela
Perimercados S.A. Perimercado Grecia Grecia
Prismar de Costa Rica S.A. Pricesmart Alajuela Alajuela
Rancho Portalon S.A. Rancho Portalon Tejar Alajuela
Roberto Batalla Gallegos Delicias del Mar Pacifico Coyol Alajuela
Rodrigo Jimenez Acuña Distribuidor Ebenezer Naranjo Alajuela
Ronald Fco. Solis Corrales Delicias del Mar San Carlos Alajuela
Source: Marketing Department of INCOPESCA
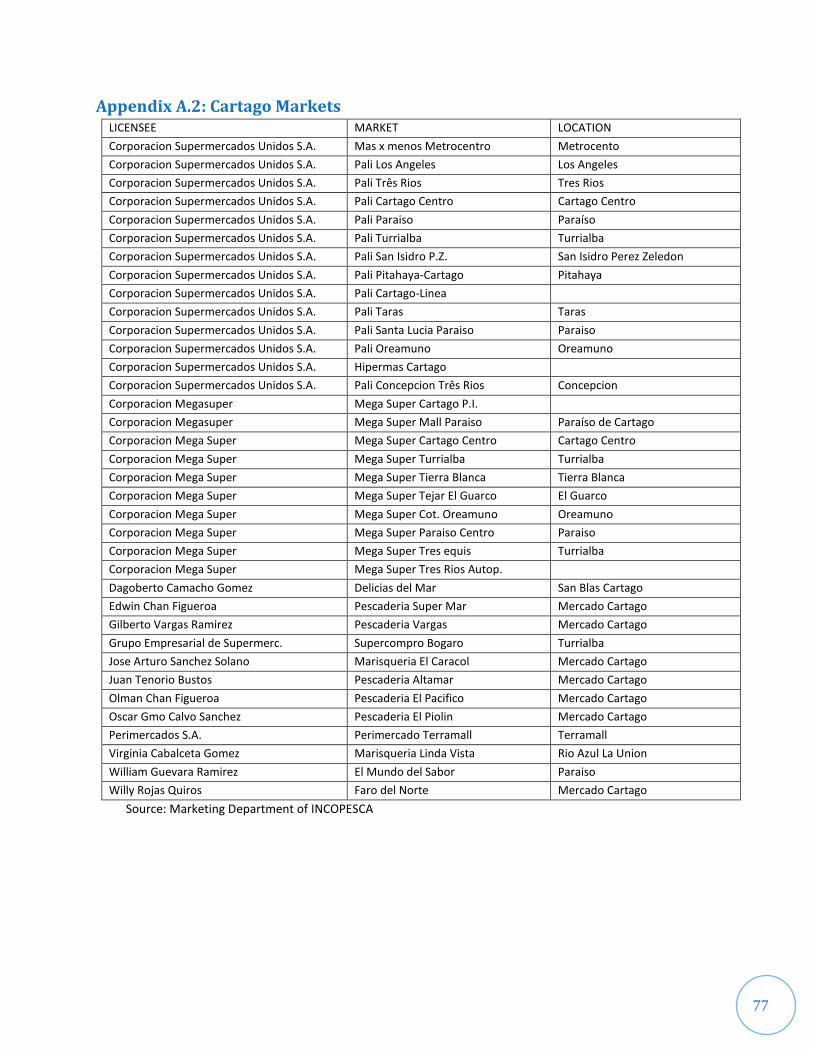
77
Appendix A.2: Cartago Markets LICENSEE MARKET LOCATION
Corporacion Supermercados Unidos S.A. Mas x menos Metrocentro Metrocento
Corporacion Supermercados Unidos S.A. Pali Los Angeles Los Angeles
Corporacion Supermercados Unidos S.A. Pali Três Rios Tres Rios
Corporacion Supermercados Unidos S.A. Pali Cartago Centro Cartago Centro
Corporacion Supermercados Unidos S.A. Pali Paraiso Paraíso
Corporacion Supermercados Unidos S.A. Pali Turrialba Turrialba
Corporacion Supermercados Unidos S.A. Pali San Isidro P.Z. San Isidro Perez Zeledon
Corporacion Supermercados Unidos S.A. Pali Pitahaya-Cartago Pitahaya
Corporacion Supermercados Unidos S.A. Pali Cartago-Linea
Corporacion Supermercados Unidos S.A. Pali Taras Taras
Corporacion Supermercados Unidos S.A. Pali Santa Lucia Paraiso Paraiso
Corporacion Supermercados Unidos S.A. Pali Oreamuno Oreamuno
Corporacion Supermercados Unidos S.A. Hipermas Cartago
Corporacion Supermercados Unidos S.A. Pali Concepcion Três Rios Concepcion
Corporacion Megasuper Mega Super Cartago P.I.
Corporacion Megasuper Mega Super Mall Paraiso Paraíso de Cartago
Corporacion Mega Super Mega Super Cartago Centro Cartago Centro
Corporacion Mega Super Mega Super Turrialba Turrialba
Corporacion Mega Super Mega Super Tierra Blanca Tierra Blanca
Corporacion Mega Super Mega Super Tejar El Guarco El Guarco
Corporacion Mega Super Mega Super Cot. Oreamuno Oreamuno
Corporacion Mega Super Mega Super Paraiso Centro Paraiso
Corporacion Mega Super Mega Super Tres equis Turrialba
Corporacion Mega Super Mega Super Tres Rios Autop.
Dagoberto Camacho Gomez Delicias del Mar San Blas Cartago
Edwin Chan Figueroa Pescaderia Super Mar Mercado Cartago
Gilberto Vargas Ramirez Pescaderia Vargas Mercado Cartago
Grupo Empresarial de Supermerc. Supercompro Bogaro Turrialba
Jose Arturo Sanchez Solano Marisqueria El Caracol Mercado Cartago
Juan Tenorio Bustos Pescaderia Altamar Mercado Cartago
Olman Chan Figueroa Pescaderia El Pacifico Mercado Cartago
Oscar Gmo Calvo Sanchez Pescaderia El Piolin Mercado Cartago
Perimercados S.A. Perimercado Terramall Terramall
Virginia Cabalceta Gomez Marisqueria Linda Vista Rio Azul La Union
William Guevara Ramirez El Mundo del Sabor Paraiso
Willy Rojas Quiros Faro del Norte Mercado Cartago
Source: Marketing Department of INCOPESCA
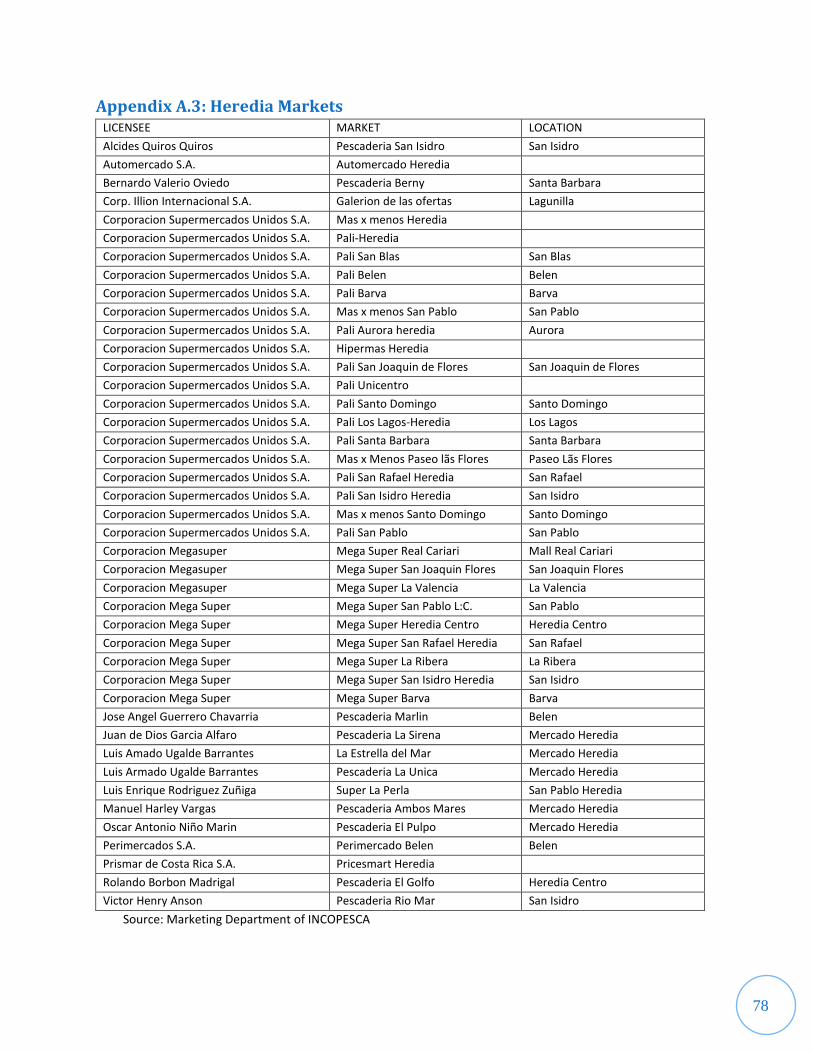
78
Appendix A.3: Heredia Markets LICENSEE MARKET LOCATION
Alcides Quiros Quiros Pescaderia San Isidro San Isidro
Automercado S.A. Automercado Heredia
Bernardo Valerio Oviedo Pescaderia Berny Santa Barbara
Corp. Illion Internacional S.A. Galerion de las ofertas Lagunilla
Corporacion Supermercados Unidos S.A. Mas x menos Heredia
Corporacion Supermercados Unidos S.A. Pali-Heredia
Corporacion Supermercados Unidos S.A. Pali San Blas San Blas
Corporacion Supermercados Unidos S.A. Pali Belen Belen
Corporacion Supermercados Unidos S.A. Pali Barva Barva
Corporacion Supermercados Unidos S.A. Mas x menos San Pablo San Pablo
Corporacion Supermercados Unidos S.A. Pali Aurora heredia Aurora
Corporacion Supermercados Unidos S.A. Hipermas Heredia
Corporacion Supermercados Unidos S.A. Pali San Joaquin de Flores San Joaquin de Flores
Corporacion Supermercados Unidos S.A. Pali Unicentro
Corporacion Supermercados Unidos S.A. Pali Santo Domingo Santo Domingo
Corporacion Supermercados Unidos S.A. Pali Los Lagos-Heredia Los Lagos
Corporacion Supermercados Unidos S.A. Pali Santa Barbara Santa Barbara
Corporacion Supermercados Unidos S.A. Mas x Menos Paseo lãs Flores Paseo Lãs Flores
Corporacion Supermercados Unidos S.A. Pali San Rafael Heredia San Rafael
Corporacion Supermercados Unidos S.A. Pali San Isidro Heredia San Isidro
Corporacion Supermercados Unidos S.A. Mas x menos Santo Domingo Santo Domingo
Corporacion Supermercados Unidos S.A. Pali San Pablo San Pablo
Corporacion Megasuper Mega Super Real Cariari Mall Real Cariari
Corporacion Megasuper Mega Super San Joaquin Flores San Joaquin Flores
Corporacion Megasuper Mega Super La Valencia La Valencia
Corporacion Mega Super Mega Super San Pablo L:C. San Pablo
Corporacion Mega Super Mega Super Heredia Centro Heredia Centro
Corporacion Mega Super Mega Super San Rafael Heredia San Rafael
Corporacion Mega Super Mega Super La Ribera La Ribera
Corporacion Mega Super Mega Super San Isidro Heredia San Isidro
Corporacion Mega Super Mega Super Barva Barva
Jose Angel Guerrero Chavarria Pescaderia Marlin Belen
Juan de Dios Garcia Alfaro Pescaderia La Sirena Mercado Heredia
Luis Amado Ugalde Barrantes La Estrella del Mar Mercado Heredia
Luis Armado Ugalde Barrantes Pescaderia La Unica Mercado Heredia
Luis Enrique Rodriguez Zuñiga Super La Perla San Pablo Heredia
Manuel Harley Vargas Pescaderia Ambos Mares Mercado Heredia
Oscar Antonio Niño Marin Pescaderia El Pulpo Mercado Heredia
Perimercados S.A. Perimercado Belen Belen
Prismar de Costa Rica S.A. Pricesmart Heredia
Rolando Borbon Madrigal Pescaderia El Golfo Heredia Centro
Victor Henry Anson Pescaderia Rio Mar San Isidro
Source: Marketing Department of INCOPESCA

79
Appendix A.4: San José Markets LICENSEE MARKET LOCATION
Abraham Salazar Blandon Pesc. Marisc. Mar y Sombra Guadalupe
Ananias Mena Perez Delicias del Mar Puriscal
Automercado del Oeste S.A. Automercado del Oeste Santa Ana
Automercado del Oeste S.A. Automercado Escazu Escazu
Automercado El Limite S.A. Automercado Moravia Moravia
Automercado El Limite S.A. Automercado Centro
Automercado Multiplaza S.A. Automercado Multiplaza
Automercado S.A. Automercado Escazu Escazu
Automercado S.A. Automercado Plaza del Sol
Automercado S.A, Automercado Plaza Mayor
Automercado S.A. Automercado Los Yoses
Carlos Enrique Espinoza Brito Pescaderia La Familiar Guadalupe
Carlos Luis Jimenez Castro Pescaderia Elias Av.2, C.6y8
Carlos Luis Serrano Mena Pescaderia La Barca Mercado Borbon
Carlos Manuel Madrigal Rojas Pescaderia Rojas Paseo Estudiantes
Cecilia Peralta Cubillo Pescaderia El Sabalo Mercado Central
Cia Pesq. Hermanos Rojas S.A. Pescaderia Marea Baja Paseo Estudiantes
Comercializ. Prod. Marinos S.A. Pescaderia Pexgo Desamparados
Coproma S.A. Pescaderia Coproma La Uruca
Corp. Illion Internacional S.A. Galeron de las Ofertas Pavas
Corp. Illion Internacional S.A. Carniceria La Paz Parque La Paz
Corp. Illion Internacional S.A. Carniceria Desamparados Desamparados
Corporacion Supermercados Unidos S.A. Mas x menos Escazu Escazu
Corporacion Supermercados Unidos S.A. Mas x menos Guadalupe Guadalupe
Corporacion Supermercados Unidos S.A. Mas x menos La Granja
Corporacion Supermercados Unidos S.A. Mas x menos San Gerardo
Corporacion Supermercados Unidos S.A. Mas x menos Hatillo
Corporacion Supermercados Unidos S.A. Mas x menos Sabanilla
Corporacion Supermercados Unidos S.A. Mas x menos Coronado
Corporacion Supermercados Unidos S.A. Mas x menos Sabana
Corporacion Supermercados Unidos S.A. Mas x menos Plaza America
Corporacion Supermercados Unidos S.A. Pali Alajuelita
Corporacion Supermercados Unidos S.A. Pali Escazu Escazu
Corporacion Supermercados Unidos S.A. Pali Estudiantes
Corporacion Supermercados Unidos S.A. Mas x menos Tibas Tibas
Corporacion Supermercados Unidos S.A. Pali Lourdes Montes de Oca
Corporacion Supermercados Unidos S.A. Pali Calle Blancos
Corporacion Supermercados Unidos S.A. Pali Tibas Tibas
Corporacion Supermercados Unidos S.A. Pali Colima- Tibas Tibas
Corporacion Supermercados Unidos S.A. Pali Ipis
Corporacion Supermercados Unidos S.A. Pali Curridabat
Corporacion Supermercados Unidos S.A. Pali La Verbena-Hatillo Hatillo
Corporacion Supermercados Unidos S.A. Pali San Sebastian
Corporacion Supermercados Unidos S.A. Pali Sauces

80
Corporacion Supermercados Unidos S.A. Pali Aserri Abajo
Corporacion Supermercados Unidos S.A. Pali San Miguel Desamparados Desamparados
Corporacion Supermercados Unidos S.A. Pali Fatima Desamparados
Corporacion Supermercados Unidos S.A. Pali Guadalupe Guadalupe
Corporacion Supermercados Unidos S.A. Hipermas San Sebastian San Sebastian
Corporacion Supermercados Unidos S.A. Mas x Menos Cuesta Moras Cuesta Moras
Corporacion Supermercados Unidos S.A. Pali Santa Aana Santa Ana
Corporacion Supermercados Unidos S.A. Pali Desmaparados Centro Desamparados Centro
Corporacion Supermercados Unidos S.A. Pali Pavas San Jose
Corporacion Supermercados Unidos S.A. Mas x Menos Desamparados Desamparados
Corporacion Supermercados Unidos S.A. Pali San Rafael Abajo San Rafael Abajo
Corporacion Supermercados Unidos S.A. Maxi Bodega El Cruce Desamparados
Corporacion Supermercados Unidos S.A. Pali El Alto Guadalupe Guadalupe
Corporacion Supermercados Unidos S.A. Pali Desamparados Desamparados
Corporacion Supermercados Unidos S.A. Pali Coronado Coronado
Corporacion Supermercados Unidos S.A. Hipermas Curridabat
Corporacion Supermercados Unidos S.A. Pali Tibas-El Parque
Corporacion Supermercados Unidos S.A. Pali Rohmoser
Corporacion Supermercados Unidos S.A. Pali San Felipe Alajuelita Alajuelita
Corporacion Supermercados Unidos S.A. Pali Concepcion Alajuelita
Corporacion Supermercados Unidos S.A. Hipermas Escazu
Corporacion Supermercados Unidos S.A. Pali Paseo Colon Paseo Colon
Corporacion Supermercados Unidos S.A. Pali Lomas Pavas Pavas
Corporacion Supermercados Unidos S.A. Mas x Menos Rohmoser Rohmoser
Corporacion Supermercados Unidos S.A. Hipermas Guadalupe Guadalupe
Corporacion Supermercados Unidos S.A. Pali Aserri Arriba Aserri
Corporacion Supermercados Unidos S.A. Pali Tirrases
Corporacion Supermercados Unidos S.A. Pali Puriscal Puriscal
Corporacion Supermercados Unidos S.A. Pali Ciudad Colon Ciudad Colon
Corporacion Supermercados Unidos S.A. Mas x Menos Santa Ana Santa Ana
Corporacion Supermercados Unidos S.A. Pali San Rafael M. de Oca Montes de Oca
Corporacion Supermercados Unidos S.A. Pali Cinco Esquinas Tibas Tibas
Corporacion Supermercados Unidos S.A. Pali Piedades Santa Ana
Corporacion Supermercados Unidos S.A. Pali San Francisco dos rios San Francisco de Dos Rios
Corporacion Mega Super Mega Super Barrio San Jose
Corporacion Mega Super Mega Super Desamparados Desamparados
Corporacion Mega Super Mega Super La Paz Parque la Paz
Corporacion Mega Super Mega Super La Uruca La Uruca
Corporacion Mega Super Mega Super San Juan Dios
Corporacion Mega Super Mega Super San Francisco
Corporacion Mega Super Mega Super San Antonio Desamparados
Corporacion Mega Super Mega Super Hatillo Hatillo
Corporacion Mega Super Mega Super Alajuelita Alajuelita
Corporacion Mega Super Mega Super Coronado Coronado
Corporacion Mega Super Mega Super Frailes
Corporacion Mega Super Mega Super Guadalupe

81
Corporacion Mega Super Mega Super Sabanilla
Corporacion Mega Super Mega Super San Rafael Abajo
Corporacion Mega Super Mega Super Santa Ana Santa Ana
Corporacion Mega Super Mega Super Moravia Moravia
Corporacion Mega Super Mega Super San Jose Borbon
Corporacion Mega Super Mega Super San rafael Abajo
Corporacion Mega Super Mega Super Cuatro Reinas Tibas
Distribuidora El Dorado S.A. Pescaderia La Corvina Mercado Central
Distribuidora El Dorado S.A. Pescaderia El Bagre Mercado carnes
Distribuidora Mariscos Altamar Dist. Mariscos Alta Mar Guadalupe
Dulce maria Chaves Herrera Pescaderia La despensa Mercado Carnes
Edwin Acuña Rodriguez Pescaderia El Mercado Mercado Coca Cola
Evelio Quesada Godinez Pesc. Y marisq Rojas Plaza Viquez
Franklin Hernandez Morales Tramo El Principe
Franmar S.A. Pescaderia Mar de Plata Mercado Borbon
Gerardo Oviedo Fernandez Almacen America
Gerardo Rodriguez Arrieta Cabo Velas San Antonio Coronado
Javier Fco. Gutierrez Alvarez La Rosa del mar S.A. Mercado Carnes
Jose Alberto Arce Arce Pesc. Marisq. Reina del Sur Paseo Estudiantes
Jose Antonio Gutierrez Quesada Pescaderia El Rey Mercado Central
Jose Eduardo Hernandez Montoya Mini Super La Cañada
Jose Eduardi Hernandez Montoya Pejibayera Las Delicias
Jose Francisco Gutierrez Acuña Pescaderia El Caracol Mercado Central
Jose Ramon Hernandez Montoya Pañalera Alejandra
Jose urbano Quesada Godinez Pescaderia Lepanto Nª1 Aserri San Jose
Jose Urbano Quesada Godinez Pescaderia Lepanto Nª2 Aserri
Laura Rojas Salazar Pescaderia Costa Rica Mercado Central
Limber Espinoza Garcia Pescaderia Faro del Norte Mercado Central
Lourdes Espinoza Garcia Pescaderia La Macarela Desamparados
Luis Angel Hernandez Montoya Tramo El Principe
Marco Antonio Morales Vargas Pesc. Mar del Plata Mercado Borbon
Maria Irza Loria Velasques Fruteria El Gato
Mario Bonilla Padilla Pescaderia San Rafael Mercado Borbon
Maritza Gutierrez Leiva Pescaderia El Dolfin Mercado Central
Mayela Rogers Barboza Pescaderia La Sabana Mercado Mayoreo
Olman Chan Figueroa Pescaderia Dos Mares Mercado Central
Pedro Picado Rodriguez Pescaderia Moravia Moravia Centro
Perimercados S.A. Perimercado Anonos
Perimercados S.A. Perimercado Guadalupe Guadalupe
Perimercados S.A. Perimercado Pavas Pavas
Perimercados S.A. Perimercado Curridabat Curridabat
Perimercados S.A. Perimercado del Sur
Perimercados S.A. Perimercado Carritos
Perimercados S.A. Perimercado Desamparados Desamparados
Perimercados S.A. Perimercado Tibas Tibas
Perimercados S.A. Perimercado Jumbo Moravia Moravia

82
Perimercados S.A. Perimercado Gran Via
Perimercados S.A. Perimercado Coronado Coronado
Perimercados S.A. Perimercado Montelimar
Perimercados S.A. Perimercado Plaza Pavas Pavas
Perimercados S.A. Perimercado Paso Ancho Paso Ancho
Perimercados S.A. Perimercado Vargas Araya
Perimercados S.A. Perimercado Tibas Centro Tibas
Pescaderia El Dorado S.A. Pescaderia El Dorado Mercado Central
Pescaderia El Dorado S.a. Pescaderia El Dorado Mercado central
Pescaderia oceano S.a. Pescaderia Oceano Desamparados
Pescaderia oceano S.a. Pescaderia Oceano Barrio Cordoba
Pescaderia Oceano S:a: Pescaderia Oceano Vargas Araya
Pescaderia Puntarenas S.A. Pesc. Puntarenas San Jose San Jose
Pescaderia Puntarenas S.A. Pesc. Puntarenas Guadalupe Guadalupe
Pescaderia Puntarenas S.A. Pesc. Puntarenas Los Yoses Los Yoses
Prismar de Costa Rica S.A. Pricesmart Curridabat Curridabat
Prismar de Costa Rica S.A. Pricesmart Escazu Escazu
Prismar de Costa Rica S.A. Pricesmart Llorente Tibas Llorente Tibas
Roberto Rojas Naranjo Pescaderia Marea Baja c.9 av 9-11
Rodolfo Acuña Aguero Pescaderia Moravia Moravia
Rodrigo A. Alvarado Naranjo Pescaderia El Principe Mercado Borbon
Ronald Agüero Morales Pescaderia Costa Azul Puriscal
Victor Manuel Chaves Arrieta Pescaderia Oriental C.8 Av.1-3
Victorino Bastos Chaves Pescaderia Galapagos Mercado Central
Yerlene Betrano Valverde Almacen Avenida
Source: Marketing Department of INCOPESCA
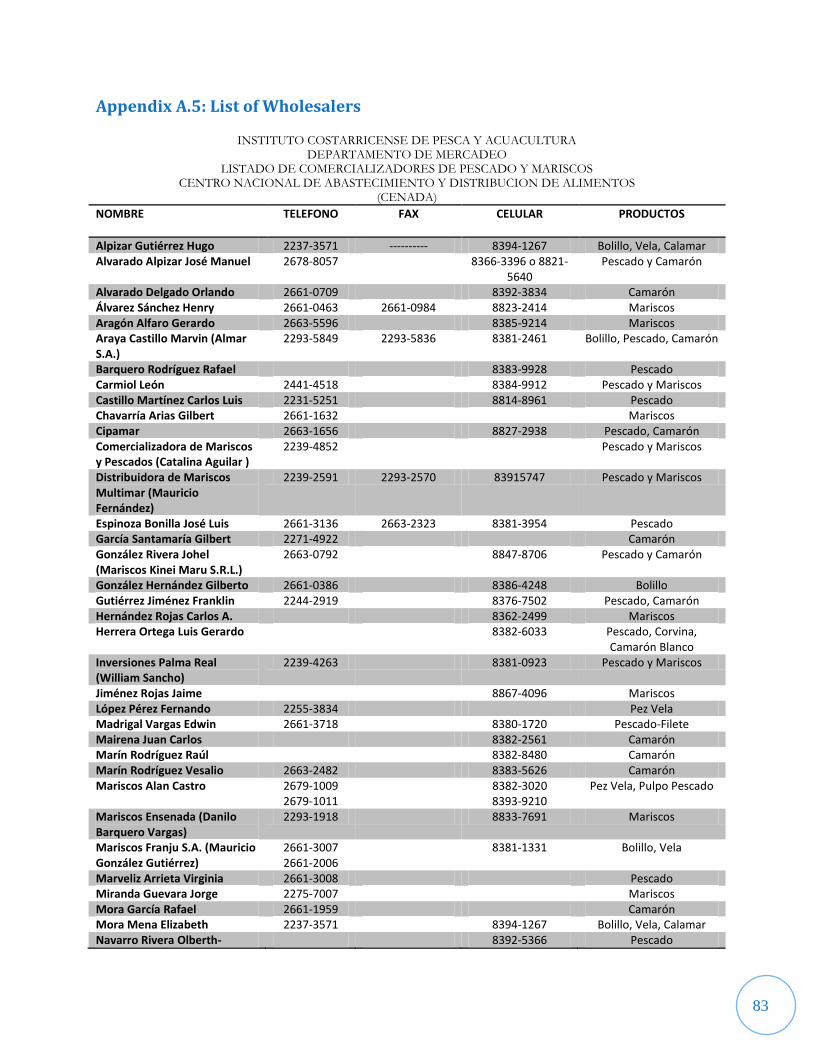
83
Appendix A.5: List of Wholesalers
INSTITUTO COSTARRICENSE DE PESCA Y ACUACULTURA DEPARTAMENTO DE MERCADEO
LISTADO DE COMERCIALIZADORES DE PESCADO Y MARISCOS CENTRO NACIONAL DE ABASTECIMIENTO Y DISTRIBUCION DE ALIMENTOS
(CENADA)
NOMBRE TELEFONO FAX CELULAR PRODUCTOS
Alpizar Gutiérrez Hugo 2237-3571 ---------- 8394-1267 Bolillo, Vela, Calamar Alvarado Alpizar José Manuel 2678-8057 8366-3396 o 8821-
5640 Pescado y Camarón
Alvarado Delgado Orlando 2661-0709 8392-3834 Camarón Álvarez Sánchez Henry 2661-0463 2661-0984 8823-2414 Mariscos Aragón Alfaro Gerardo 2663-5596 8385-9214 Mariscos Araya Castillo Marvin (Almar S.A.)
2293-5849 2293-5836 8381-2461 Bolillo, Pescado, Camarón
Barquero Rodríguez Rafael 8383-9928 Pescado Carmiol León 2441-4518 8384-9912 Pescado y Mariscos Castillo Martínez Carlos Luis 2231-5251 8814-8961 Pescado Chavarría Arias Gilbert 2661-1632 Mariscos Cipamar 2663-1656 8827-2938 Pescado, Camarón Comercializadora de Mariscos y Pescados (Catalina Aguilar )
2239-4852 Pescado y Mariscos
Distribuidora de Mariscos Multimar (Mauricio Fernández)
2239-2591 2293-2570 83915747 Pescado y Mariscos
Espinoza Bonilla José Luis 2661-3136 2663-2323 8381-3954 Pescado García Santamaría Gilbert 2271-4922 Camarón González Rivera Johel (Mariscos Kinei Maru S.R.L.)
2663-0792 8847-8706 Pescado y Camarón
González Hernández Gilberto 2661-0386 8386-4248 Bolillo Gutiérrez Jiménez Franklin 2244-2919 8376-7502 Pescado, Camarón Hernández Rojas Carlos A. 8362-2499 Mariscos Herrera Ortega Luis Gerardo 8382-6033 Pescado, Corvina,
Camarón Blanco Inversiones Palma Real (William Sancho)
2239-4263 8381-0923 Pescado y Mariscos
Jiménez Rojas Jaime 8867-4096 Mariscos López Pérez Fernando 2255-3834 Pez Vela Madrigal Vargas Edwin 2661-3718 8380-1720 Pescado-Filete Mairena Juan Carlos 8382-2561 Camarón Marín Rodríguez Raúl 8382-8480 Camarón Marín Rodríguez Vesalio 2663-2482 8383-5626 Camarón Mariscos Alan Castro 2679-1009
2679-1011 8382-3020
8393-9210 Pez Vela, Pulpo Pescado
Mariscos Ensenada (Danilo Barquero Vargas)
2293-1918 8833-7691 Mariscos
Mariscos Franju S.A. (Mauricio González Gutiérrez)
2661-3007 2661-2006
8381-1331 Bolillo, Vela
Marveliz Arrieta Virginia 2661-3008 Pescado Miranda Guevara Jorge 2275-7007 Mariscos Mora García Rafael 2661-1959 Camarón Mora Mena Elizabeth 2237-3571 8394-1267 Bolillo, Vela, Calamar Navarro Rivera Olberth- 8392-5366 Pescado

84
Valverde C. Olger Núñez Cerdas Ángel Emel (Pulpo Mar)
2661-4745 8350-9952 8391-7957
Mariscos
Ortiz Hizaba Ali 2678-0234 Pescado, Corvina, Camarón Blanco
Picado Lizano Oscar 22397022 8391-7222 Pescado, Camarón Rodríguez A. Gerardo (Pescadería Cabo Velas S.A.)
2229-3466 8365-3306 Mariscos
Rodríguez Arrieta Rafael A. 2443-4270 Mariscos Rodríguez Torres Roberto 2661-1379 Pescado Rodríguez Sánchez Jorge 2663-2578 8380-9187 Tiburón, Pescado,
Camarón Romero Quesada Henry 2777-1428 2777-1428 8393-4237 Pescado Ruiz Maroto Oscar 2663-1130 8382-6082 Bolillo, Pescado, Camarón Sánchez Cascante Gerardo (Mariscos Perlita)
2221-8126 8812-8081 8856-3234
Mariscos
Ugalde Castillo Álvaro 2661-2152 8387-4754 Bolillo, Vela, Pescado Vindel Sirias Harry 2664-1487 Pescado y Mariscos Willen Vis Michel 2663-9442 Tiburón

85
Appendix B: Interviews and Surveys
Appendix B.1.a: Questionnaire for Producers of Aquaculture Products 1) Name of interviewee:________________________
2) What type of fish do you cultivate?
___Tilapia ___Trout ___Shrimp ___Other; specify___________________
For questions 3 to 8, answer with respect to the fish you cultivate the most (from question 2). 3) Where do you sell your product?
___ Supermarkets ___ Fish markets ___ Restaurants ___ Wholesalers ___ Open air markets ___ Other; specify______________
4) Indicate the amount (in kg) of this product that you sell at the respective locations: ______kg: Supermarkets ______kg: Fish markets ______kg: Restaurants ______kg: Wholesalers ______kg: Open air markets ______kg: Other; specify______________
5) Indicate the price per kilogram that you sell this product for at the respective locations: _______: Supermarkets _______: Fish markets _______: Restaurants _______: Wholesalers _______: Open air markets _______: Other; specify______________
6) Do you practice techniques to preserve the freshness of your products? ___Yes ___No
7) Where are the fish stored? ____ Freezer ____ Cooling unit ____ Ice Storage
8) How is the fish sold? ___ Frozen ___ Dried ___ Fresh

86
___ Smoked ___ Cleaned ___ Other; specify____________________________
9) What are the major problems you encounter with the marketing of this product? ___________________________________________________________________________ ___________________________________________________________________________
10) Do you consider the demand that this product incurs satisfactory? ___Yes ___No Why? _____________________________________________________________________
For questions 9 to11, answer with respect to the current practices of your facility. 11) Have you received education on good fish farming practices within the last year?
___Yes ___No
12) If you response was positive for question 9, where did you receive your education? ___________________________________________________________________________
13) Have you been following good fish farming practices? ___Yes ___No
14) Would you be willing to cultivate other types of fish based on consumer demands? ___Yes ___No
15) Level of education of interviewee: ___Primary ___Secondary ___Bachelor‟s or Technical Degree ___University studies ___Other studies
16) Gender: ___M ___F
17) Age:_______

87
Appendix B.1.b: Cuestionario para Productores de Productos de Acuicultura 1) Nombre del entrevistado: _____________________________
2) ¿Qué especies de pescado cultiva?
____ Tilapia ____ Trucha ____ Camarón ____ Otro: especifica: ___________
Para las preguntas 3 a 8, responde con respeto al pescado más cultivado de pregunta 2. 3) ¿Dónde vende el pescado cultivado?
___ Supermercados ___ Pescaderías ___ Restaurantes ___ Comerciantes Mayorista ___ Tianguis ___ Otro, especifique ______________
4) Indique el volumen que comercializa semanalmente de este producto a los lugares respectivos (en kg). ______kg: Supermercados ______kg: Pescaderías ______kg: Restaurantes ______kg: Comerciantes Mayorista ______kg: Mercados al Aire Libre ______kg: Otro, especifique ______________
5) Indique el precio de venta por kilogramo a los lugares respectivos (en colones/kg). _______: Supermercados _______: Pescaderías _______: Restaurantes _______: Comerciantes Mayorista _______: Mercados al Aire Libre _______: Otro, especifique ______________
6) ¿Practican técnicas para conservar la frescura?
___Si ___No
7) ¿Con que tipo de instalaciones cuenta para la preservación del producto? ____ Frigoríficos ____ Cámaras de frio ____ Conservación con hielo
8) ¿Cuál es la presentación con la que comercializa este producto? ___ Congelado ___ Seco ___ Fresco

88
___ Ahumado ___ Limpio ___ Otro, especifique ______________
9) ¿Cuáles son los principales problemas a los que se enfrenta al comercializar este producto? ________________________________________________________________________ ________________________________________________________________________
10) ¿Considera que la demanda que tiene el producto se encuentra satisfecha? ___ Si ___No ¿Por qué? __________________________________________________________________
Para las preguntas 9 a 11 responde con respeto a las prácticas actuales de su complejo 11) ¿Ha recibido capacitación en buenas prácticas del cultivo de peces en el último año?
____Si ____ No
12) Si la respuesta fue positiva para pregunta 9, ¿dónde recibió la capacitación? ___________________________________________________________________________
13) ¿Ha estado siguiendo las buenas prácticas?
____Si ____No
14) ¿Estaría usted dispuesto a cultivar otros tipos de pescado basado en las demandas de los consumidores? ____Si ____No
15) Escolaridad del encuestado ____ Primaria ____ Secundaria ____ Bachillerato o técnica ____ Estudios Universitarios ____ Otros estudios
16) Sexo: ___M ___F
17) Edad:_______

89
Appendix B.2.a: Questionnaire for Wholesalers and Exporters 1) Name of the interviewee:___________________________________
2) Name of the organization or company that you represent:
________________________________________________________
3) Job Title:_________________________________________________
4) Total volume of aquaculture products and other fish products that you sell (kg): Weekly Monthly ________ ________
5) Types of local aquaculture or marine products that you sell? Average volume in kg.
Weekly Monthly Aquaculture Products
Tilapia _________ _________ Shrimp _________ _________ Trout _________ _________ Other _________ _________
Marine Products (fish and crustaceans)
Sea bass _________ _________ Mahi mahi _________ _________ Porgy _________ _________ Shark _________ _________ Marlin _________ _________ Other _________ _________
6) Types of foreign aquaculture or marine products that you sell? Average volume in kg.
Weekly Monthly Aquaculture Products
Catfish _________ _________ Trout _________ _________ Salmon _________ _________
Shrimp _________ _________ Other _________ _________

90
Marine Products (fish and crustaceans) Sea bass _________ _________ Shark _________ _________ Salmon _________ _________ Other _________ _________
7) On what scale do you sell these products?
___For exportation ___Large-scale wholesale ___Medium-scale wholesale ___Small-scale retail
8) What area of the market do you cover with the sales of this product? ___International ___National ___Regional ___Local
9) Where do you sell your products? ___Other countries:______________________________________________________________ ___Supermarkets:_______________________________________________________________ ___Fish markets:_________________________________________________________________ ___Other:_______________________________________________________________ ______________________________________________________________________
10) What is the price of your product per kg?
Local Aquaculture Products Tilapia _________ Shrimp _________ Trout _________
Local Marine Products (fish and crustaceans)
Sea bass _________ Mahi mahi _________ Porgy _________ Shark _________ Marlin _________

91
Foreign Aquaculture Products Catfish _________ Trout _________ Salmon _________
Shrimp _________ Foreign Marine Products (fish and crustaceans)
Sea bass _________ Shark _________ Salmon _________
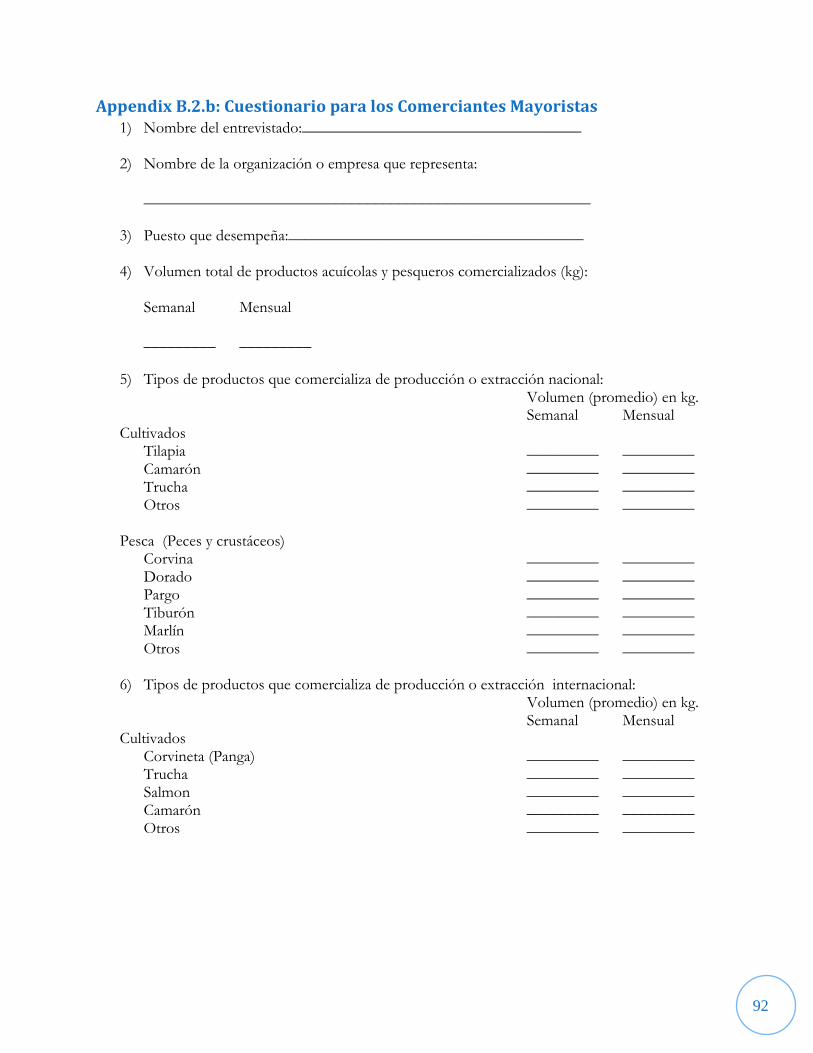
92
Appendix B.2.b: Cuestionario para los Comerciantes Mayoristas 1) Nombre del entrevistado:___________________________________
2) Nombre de la organización o empresa que representa:
________________________________________________________
3) Puesto que desempeña:_____________________________________
4) Volumen total de productos acuícolas y pesqueros comercializados (kg): Semanal Mensual _________ _________
5) Tipos de productos que comercializa de producción o extracción nacional: Volumen (promedio) en kg.
Semanal Mensual Cultivados
Tilapia _________ _________ Camarón _________ _________ Trucha _________ _________ Otros _________ _________
Pesca (Peces y crustáceos)
Corvina _________ _________ Dorado _________ _________ Pargo _________ _________ Tiburón _________ _________ Marlín _________ _________ Otros _________ _________
6) Tipos de productos que comercializa de producción o extracción internacional: Volumen (promedio) en kg.
Semanal Mensual Cultivados
Corvineta (Panga) _________ _________ Trucha _________ _________ Salmon _________ _________ Camarón _________ _________ Otros _________ _________

93
Pesca (Peces y crustáceos) Corvina _________ _________ Tiburón _________ _________ Salmon _________ _________
Otros _________ _________ 7) ¿En qué escala lo comercializa?
___Exportación ___Mayoreo ___Medio mayoreo ___Menudeo
8) ¿Qué cobertura tiene en el mercado con este producto? ___Internacional ___Nacional ___Regional ___Local
9) ¿Dónde vende su producto? __ Otros países: _________________________________________________________________ __ Supermercados: ______________________________________________________________ __ Pescaderías: _________________________________________________________________ __ Otro: _______________________________________________________________________ _______________________________________________________________________
10) ¿Cuál es el precio de su producto por kg.?
Cultivados Nacionales Tilapia _________ Camarón _________ Trucha _________
Pesca (peces y crustáceos) Nacionales
Corvineta (Panga) _________ Dorado _________ Parga _________ Tiburón _________ Marlín _________

94
Cultivados Internacionales Panga (Corvineta) _________ Trucha _________ Salmon _________
Camarón _________ Pesca (peces y crustáceos) Internacionales
Corvina _________ Tiburón _________ Salmon _________
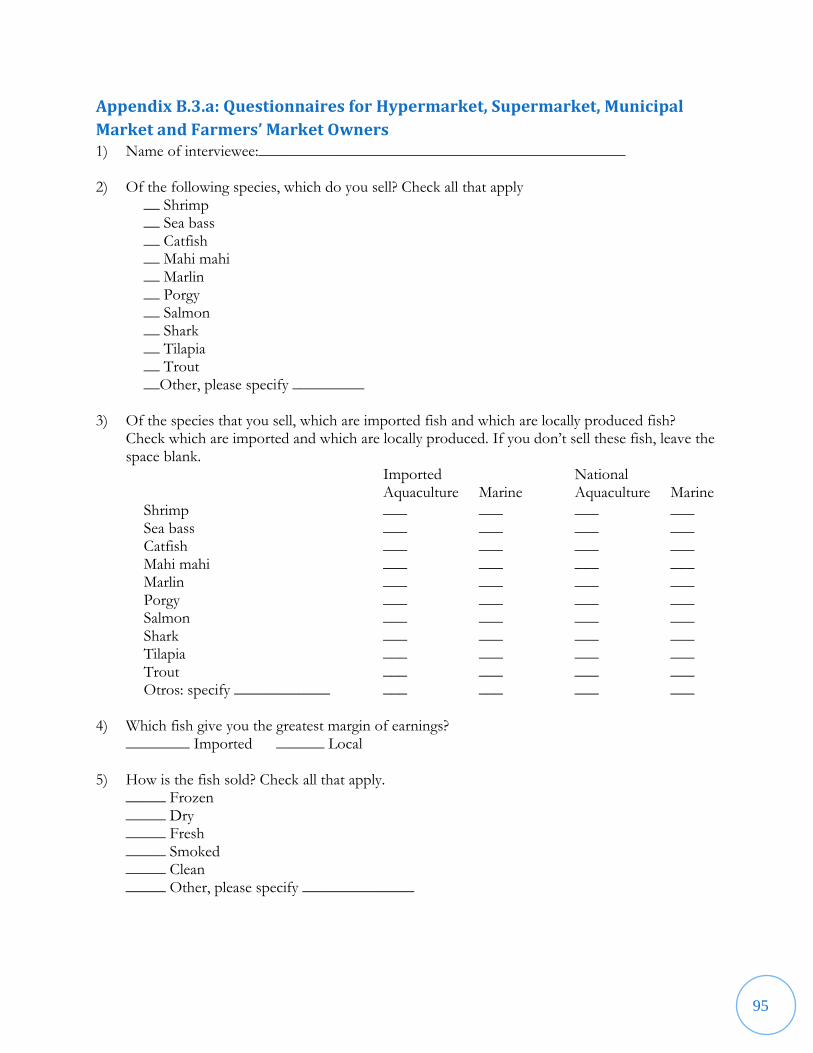
95
Appendix B.3.a: Questionnaires for Hypermarket, Supermarket, Municipal
Market and Farmers’ Market Owners 1) Name of interviewee:______________________________________________
2) Of the following species, which do you sell? Check all that apply
__ Shrimp __ Sea bass __ Catfish __ Mahi mahi __ Marlin __ Porgy __ Salmon __ Shark __ Tilapia __ Trout __Other, please specify _________
3) Of the species that you sell, which are imported fish and which are locally produced fish?
Check which are imported and which are locally produced. If you don‟t sell these fish, leave the space blank.
Imported National Aquaculture Marine Aquaculture Marine Shrimp ___ ___ ___ ___ Sea bass ___ ___ ___ ___ Catfish ___ ___ ___ ___ Mahi mahi ___ ___ ___ ___ Marlin ___ ___ ___ ___ Porgy ___ ___ ___ ___ Salmon ___ ___ ___ ___ Shark ___ ___ ___ ___ Tilapia ___ ___ ___ ___ Trout ___ ___ ___ ___ Otros: specify ____________ ___ ___ ___ ___
4) Which fish give you the greatest margin of earnings? ________ Imported ______ Local
5) How is the fish sold? Check all that apply. _____ Frozen _____ Dry _____ Fresh _____ Smoked _____ Clean _____ Other, please specify ______________

96
6) What is the main reason for selling this product in the specified way (question 3)? __________________________________________________________________________ __________________________________________________________________________
7) Is the fish sold in the same way as it is obtained from the primary supplier? ___ Yes ___ No Why? ____________________________________________
8) Do you agree with the prices of this type of fish in the current market?
____ Yes ___No Why? ________________
9) What are the major problems that you encounter with the sales of this type of fish?
__________________________________________________________________________ __________________________________________________________________________
10) Of the species of fish that you sell, which has the greatest demand? _______________________
11) Where are the fish stored, and what is the capacity of the storage unit (in kg.)?
____ Freezer ____ Cooling unit ____ Ice Storage ____ Other, please specify ________________ Capacity: _________
12) Do you use any advertisement methods for aquaculture products? If yes, which types? ___Yes ___No __________________________________________________________________________ __________________________________________________________________________
13) How effective do you think these methods are? ___ Not very effective ___ Somewhat effective ___ Very effective
14) How much are you willing to invest for additional/improved advertisement? ___________________
15) Please specify your actual occupation : ____ Employee ____ Employer

97
Appendix B.3.b: Cuestionario para Administradores de Hipermercados,
Supermercados, Ferias del Agricultor, Mercados Municipales y Ferias de
Agricultor 1) Nombre del entrevistado:______________________________________________
2) ¿De las siguientes especies, cuales comercia usted? Señale las que aplican.
__ Camarón __ Corvina __ Corvineta (Panga) __ Dorado __ Marlín __ Pargo __ Salmon __ Tiburón __ Tilapia __ Trucha __ Otro: especifique ____________________
3) De las especies acuícolas que vende, cuales son: ¿Los pescados son importados o productos locales? Señale a los que son importados. Si no son vendidos, dejen el espacio blanco.
Importado Nacional Cultivado Pesca Cultivado Pesca Camarón ___ ___ ___ ___ Corvina ___ ___ ___ ___ Corvineta (Panga) ___ ___ ___ ___ Dorado ___ ___ ___ ___ Marlín ___ ___ ___ ___ Pargo ___ ___ ___ ___ Salmon ___ ___ ___ ___ Tiburón ___ ___ ___ ___ Tilapia ___ ___ ___ ___ Trucha ___ ___ ___ ___ Otros: especifique ____________ ___ ___ ___ ___
4) ¿Cuáles especies les dejan un mayor margen de ganancia? ________ Importados ______ Locales
5) ¿Cuál es la presentación con la que comercializa este producto? Señale a los que aplican. _____ Congelado _____ Seco _____ Fresco _____ Ahumado _____ Limpio _____ Otro, especifique ______________

98
6) ¿Cuál es la razón por la que comercializa el producto en esta presentación? __________________________________________________________________________ __________________________________________________________________________
7) ¿Compra el producto con la misma presentación que lo comercializa? ___ Si ___ No
¿Por qué? ____________________________________________
8) ¿Está usted de acuerdo con los precios que actualmente tiene el producto en el mercado? ____ Si ___No ¿Por qué? _____________________
9) ¿Cuáles son los principales problemas a los que se enfrenta al comercializar este producto?
__________________________________________________________________________ __________________________________________________________________________
10) ¿De las especies que comercializa cuál tiene la mayor demanda?
_______________________
11) ¿Con que tipo de instalaciones cuenta para el almacenamiento del producto y que capacidad (en kg)? ____ Frigoríficos ____ Cámaras de frio ____ Conservación con hielo ____ Otro, especifique ________________
Capacidad: _________
12) Utilizan métodos de divulgación para los productos acuícolas. Si responde “si,” ¿Cuáles?
__ Si __ No __________________________________________________________________________ __________________________________________________________________________
13) ¿Qué tan efectivo cree que es este método? ___ Malo ___ Bueno ___ Muy Bueno
14) ¿Cuánto está dispuesto a invertir para anuncios adicionales / mejores? ___________________
15) Señale su ocupación actual: ____ Empleador ____ Empleado

99
Appendix B.4.a: Questionnaire for Consumers of Fish Products 1) What species of fish do you consume? Check all that apply
__ Shrimp __ Sea bass __ Catfish __ Mahi Mahi __ Marlin __ Porgy __ Salmon __ Shark __ Tilapia __ Trout __ Other: _____________________
For questions 2 to 14, respond with respect to the most preferred fish from question 1. 2) Do you habitually consume this fish? ___Yes ___No
(If the response is negative, go to question 17)
3) Approximately how much per month do you and your family consume? ___ 1 to 2 kg ___ more than 5 kg ___ 3 to 4 kg ___ other, specify _________
4) How often do you consume the fish? ___ 1 time per week ___ 2 times a week ___ 3 or more times per week ___ 1 time per month ___ 2 times per month ___ 3 times per month
5) How much do you usually spend on these products per month? ________
6) What is your opinion of the prices of these products?
__ Very Expensive __ Expensive __ Average __ Cheap __Very Cheap
Why? ______________________________________________________________________
7) Check the reason why you consume the fish. Check all that apply. ___ it is easy to buy ___ it is nutritious ___ it is affordable ___ it is tasty ___ other, specify: _________
8) How is the fish bought? ___ Frozen ___ Fresh ___ Smoked ___ Canned ___ Other, specify: _________

100
9) In what way would you prefer it to be sold?
___________________________
10) Where do you usually buy the product? ___ Supermarkets ___ Markets ___ Open Air Markets ___ Fish Markets ___ Other, specify: _________
11) What is your opinion on the quality of the fish you buy? Please explain.
___Very Bad ___Bad ___Average ___Good ___Very Good ________________________________________________________________________
12) Are you aware of the nutritional value that the species offers? ___ Yes ___No
13) Which products do you wish were more easily accessible? Please list them __ Shrimp
__ Sea bass __ Catfish __ Mahi Mahi __ Marlin __ Porgy __ Salmon __ Shark __ Tilapia __ Trout __ Other: _____________________
14) How do you typically find out about promotions for fish that you buy?
___ Newspapers ___ Market Advertisement ___ Fliers ___ Billboards ___ Other, specify: ____________________
15) Age and gender of interviewee: ___ Age Sex: ___M ___F
16) Marital Status: ___ Married ___ Single ___ Other, specify: ___________
17) Job Title: ___ Employer ___ Employee
18) Level of family income: ___ 1 to 2 minimum wages ___ 3 to 4 minimum wages ___ more than 5 minimum wages

101
19) Number of dependents: _______
20) Highest level of education ______ Primary ______ Secondary ______ Bachelor‟s Degree or High School Diploma ______ University ______ Others, please specify _________

102
Appendix B.4.b: Cuestionario para Consumidor Final de Productos Pesqueros 1) ¿Qué tipos de pescado compra usted? Selecciona los que aplican.
__ Camarón __ Corvina __ Corvineta (Panga) __ Dorado __ Marlín __ Pargo __ Salmon __ Tiburón __ Tilapia __ Trucha __ Otro: _____________________
Para las preguntas 2 a 14, responde con respeto al pescado más preferido de pregunta 1.
2) ¿Lo consume habitualmente? ___Si ___No (Si la repuesta fue negativa pase a la pregunta 17)
3) ¿Señale aproximadamente qué cantidad al mes consume Ud. y su familia? ___ de 1 a 2 kg ___ más de 5 kg ___ de 3 a 4 kg ___ otro, especifique _________
4) ¿Con qué periodicidad lo consume? ___ 1 vez por la semana ___ 2 veces por semana ___ 3 o más veces por semana ___ 1 vez al mes ___ 2 veces por mes ___ 3 veces por mes
5) ¿Cuánto pagan por estos productos cada mes? ________
6) ¿Cuál es su opinión de los precios de este producto?
__ Muy Caro __ Caro __ Más o menos __ Barato __Muy Barato
¿Por qué? __________________________________________________________________
7) Señale la razón por la cual lo consume: ___ Porque es fácil de adquirirlo ___ Por nutritivo ___ Porque tiene un precio accesible ___ Porque tiene un buen sabor ___ Otro, especifique ___________
8) ¿En qué presentación adquiere el producto? ___ Congelado ___ Fresco ___ Ahumado ___ Enlatado ___ Otra, especifique ___________

103
9) ¿De qué forma preferiría que sea presentado?
___________________________ 10) ¿Dónde acostumbra adquirir el producto? ___ Supermercados ___ Mercados ___ Ferias de Agricultor ___ Pescaderías ___ Otra, especifique ___________
11) ¿Cuál es su opinión de la calidad de los pescados que compra usted? Explique su respuesta.
__ Muy Mala __ Mala __ Mas o menos __ Buena __ Muy Buena ________________________________________________________________________
12) ¿Está consciente de valor nutricional con que cuenta estas especies? ___Si ___No
13) ¿Cuáles productos quisiera que sea más accesible? __ Camarón
__ Corvina __ Corvineta (Panga) __ Dorado __ Marlín __ Pargo __ Salmon __ Tiburón __ Tilapia __ Trucha __ Otro: _____________________
14) ¿Cómo se informar sobre las promociones para el pescado que usted compra? ___ Periódicos ___ Avisos en el mercado ___ Folleto ___ Cartelera ___ Otro, especifica: ____________________
15) Edad y sexo del entrevistado: ___ Edad Sexo: ___M ___F
16) Estado civil: ___ Casado ___ Soltero ___ Otro, especifica: ___________
17) Actualmente trabaja como: ___ Empleador ___ Emplead
18) Nivel de ingreso promedio familiar: ___ de 1 a 2 salarios mínimos ___ de 3 a 4 salarios mínimos ___ más de 5 salarios mínimos

104
19) ¿Número de personas que dependen económicamente de Ud.? _____
20) Nivel de escolaridad: ______ Primaria ______ Secundaria ______ Bachillerato-Técnica ______ Estudios superiores ______ Otro, especifique______________

105
Appendix C: Calendar
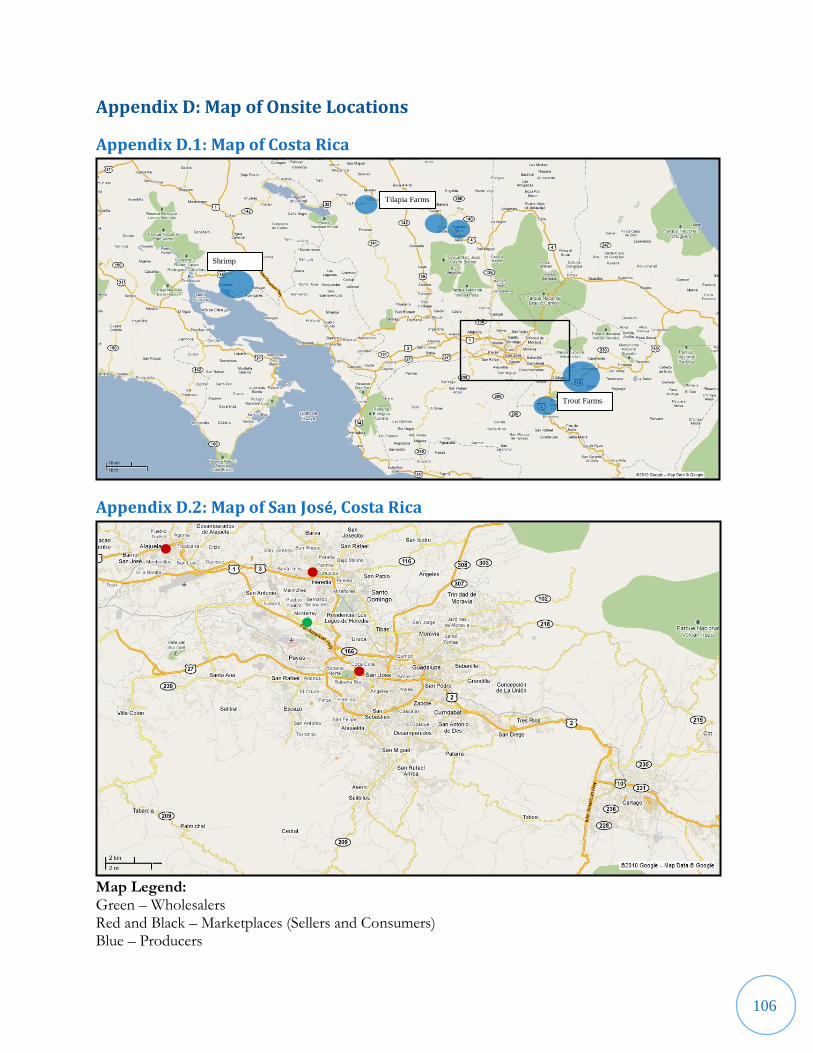
106
Appendix D: Map of Onsite Locations
Appendix D.1: Map of Costa Rica
Appendix D.2: Map of San José, Costa Rica
Map Legend: Green – Wholesalers Red and Black – Marketplaces (Sellers and Consumers) Blue – Producers
Tilapia Farms
Shrimp
Farms
Trout Farms
107
Appendix E: Findings
Appendix E.1: Producer Findings
Appendix E.1.a: Trout Farm Findings
DAY 1
Trout Farm 1
Location:
Sold at: Hotels (Local)
Volume:
o Hotels (Local): 1,700 kg / month
Price:
o Hotels (Local): 3,500 C / kg
Conserve Freshness: Yes (Refrigerator)
Presentations: Fresh, Clean
Problems: No; owns own hotel and restaurant
Demand Satisfied: Yes
Training: Yes (INCOPESCA; Personal classes in Vancouver, Canada)
Good Practices: Yes
Cultivate New Products: No
Notes:
o Owner of own restaurant
Trout Farm 2
Location:
Sold at: Supermarkets (San José); Fish Markets (Local); Restaurants (Local)
Volume:
o Supermarkets (San José): 8,000 / month
o Fish Markets (Local) and Restaurants (Local): 2,000 / month
Price:
o Supermarkets (San José): 3,200 C / kg
o Fish Markets (Local) and Restaurants (Local): 3,200 C / kg
Conserve Freshness: Yes (Ice)
Presentations: Fresh, Smoked
Problems: No
Demand Satisfied: No
Training: Yes (INCOPESCA; Experience)
Good Practices: Yes
Cultivate New Products: Yes

108
Notes:
o Biggest producer of trout in Costa Rica
o Experimenting with Salmon
o Rents some land to other trout farmers
o Farm cannot expand due to space constraints
Trout Farm 3
Location:
Sold at: Restaurant (Local)
Volume: unknown
Price: 5000 C / kg (prepared plate)
Conserve Freshness: Not needed
Presentations: Fresh
Problems: No; Want to stay local for freshness
Demand Satisfied: Yes
Training: Yes (INCOPESCA; Experience: 4 years)
Good Practices: Yes
Cultivate New Products: No
Notes:
o Owner of own restaurant/hotel
Trout Farm 4
Location:
Sold at: Supermarkets (Local); Fish Markets (Local)
Volume: 250 kg / month
Price: 2,500 C / kg
Conserve Freshness: Yes (Ice)
Presentations: Fresh (Whole)
Problems: No
Demand Satisfied: No
Training: Yes (INCOPESCA; Experience)
Good Practices: Yes
Cultivate New Products: No (Too cold)

109
Trout Farm 5
Location:
Sold at: Restaurant (Local); Producers (Biques)
Volume:
o Total: 340 kg / month
Price: 2000 C / kg
Conserve Freshness: No
Presentations: Fresh
Problems: Yes; Requirements and Preparation Certificate is too expensive; Competition with
imports and national products
Demand Satisfied: No
Training: Yes (Experience)
Good Practices: Yes
Cultivate New Products: Yes
Notes:
o Complained about Aguilar Solis; monopoly on feed
o Sells to Biques, because he has equipment for processing and transport
Trout Farm 6
Location:
Sold at: Supermarkets (Cities); Restaurants (Local); Hotels (Local)
Volume:
o Supermarkets: 800 kg / month
o Restaurants/Hotels: 200 kg / month
Price:
o Supermarkets: 3,500 C / kg
o Restaurants/Hotels: 4,500 C / kg
Conserve Freshness: Yes (Refrigerator; Ice)
Presentations: Fresh (Filete)
Problems: Yes; Feed is expensive
Demand Satisfied: No
Training: No (Experience: 25 years)
Good Practices: Yes
Cultivate New Products: Yes

110
Trout Farm 7
Location:
Sold at: Recreational (Local)
Volume: 830 kg / month
Price: 2,250 C / kg
Conserve Freshness: No
Presentations: Fresh
Problems: Yes; low demand
Demand Satisfied: Yes
Training: Yes (INCOPESCA)
Good Practices: Yes
Cultivate New Products: Yes
Notes:
o Rough roads might impede business
Trout Farm 8
Location:
Sold at: Recreational (Local)
Volume: 280 kg / month
Price: 4000 C / kg
Conserve Freshness: No
Presentations: Fresh
Problems: Yes; Very low production
Demand Satisfied: Yes
Training: Yes (University; INCOPESCA)
Good Practices: Yes
Cultivate New Products: Yes (If they can be grown)
Notes:
o Small Scale Farm
DAY 2
Trout Farm 9
Location:
Sold at: Restaurant (Local); Recreational (Local)
Volume:
o Restaurant (Local): 450 kg / month
o Recreational (Local): 50 kg / month
Price: 4000 C / kg
111
Conserve Freshness: No
Presentations: Fresh
Problems: Yes; No space for growing more; Climate change killing trout
Demand Satisfied: No
Training: Yes (INCOPESCA; Experience: 9 years)
Good Practices: Yes
Cultivate New Products: No (Trout is the best for the climate)
Notes:
o Fish become stressed at different temperature conditions
o Normal temperature: 15-20 °C
o 2008: temperatures rose to 23 °C
o Automercado made an offer, but refused so he could keep up with local demand
Trout Farm 10
Location:
Sold at: Recreational (Local)
Volume: unknown
Price: 3,500 C / kg
Conserve Freshness: No
Presentations: Fresh
Problems: No; No interest in an outside market
Demand Satisfied: Yes
Training: Yes (INCOPESCA; Experience: 10 years)
Good Practices: Yes
Cultivate New Products: Yes
Trout Farm 11
Location:
Sold at: Restaurant (Local); Recreational (Local)
Volume:
o Restaurant (Local): 45 kg / month
o Recreational (Local): 15 kg / month
Price:
o Restaurant (Local): 6750 C / kg
o Recreational (Local): 4000 C / kg
Conserve Freshness: No
Presentations: Fresh
Problems: Yes; Low production

112
Demand Satisfied: No
Training: Yes (INCOPESCA; Experience: 3 years)
Good Practices: Yes
Cultivate New Products: Yes (If fish adapts to climate)
Notes:
o Owner of own restaurant for 1 year
Trout Farm 12
Location:
Sold at: Restaurant (Local)
Volume:
o Restaurant (Local): 75 kg / month
Price:
o Restaurant (Local): 3,700 C / kg
Conserve Freshness: No
Presentations: Fresh
Problems: Yes; There is no demand
Demand Satisfied: Yes
Training: Yes (INCOPESCA; Experience: 2 years)
Good Practices: Yes
Cultivate New Products: Yes
Trout Farm 13
Location:
Sold at: Restaurant (Local)
Volume:
o Restaurant (Local): 200 kg / month
Price:
o Restaurant (Local): 3900 C / kg
Conserve Freshness: No
Presentations: Fresh
Problems: Yes; Too much competition
Demand Satisfied: Yes
Training: Yes (INCOPESCA; Experience: 12 years)
Good Practices: Yes
Cultivate New Products: Yes
Notes:
o Owner of own restaurant
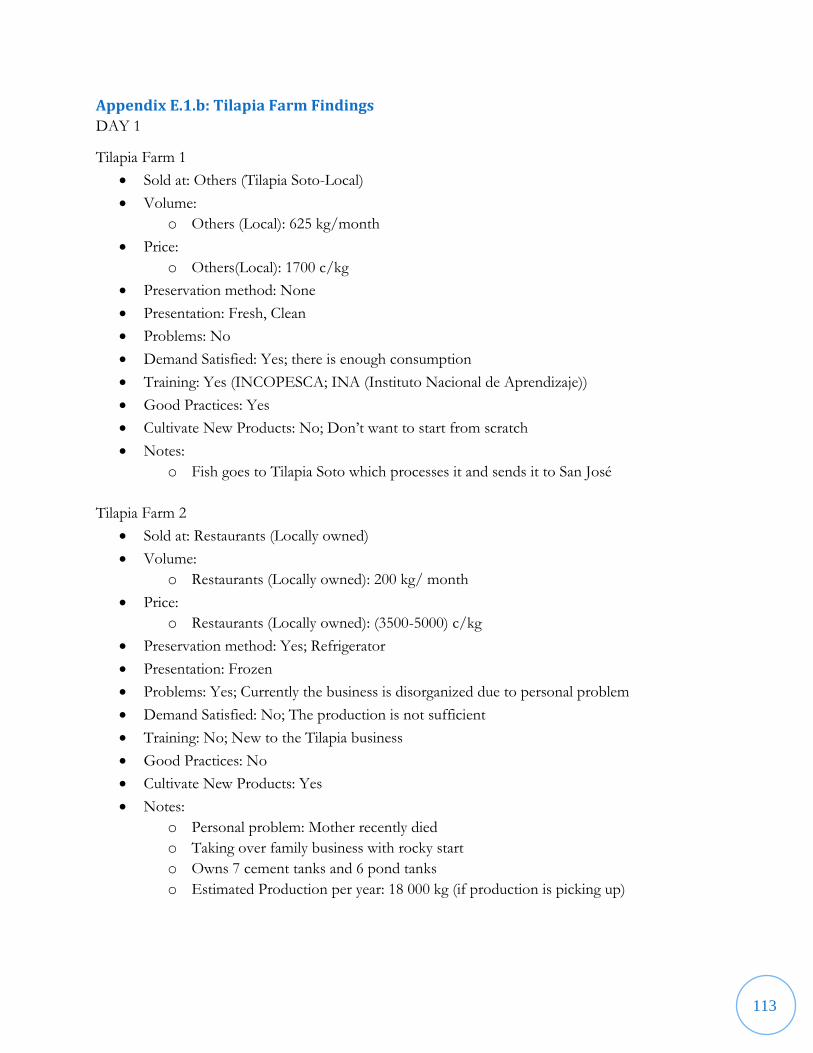
113
Appendix E.1.b: Tilapia Farm Findings
DAY 1
Tilapia Farm 1
Sold at: Others (Tilapia Soto-Local)
Volume:
o Others (Local): 625 kg/month
Price:
o Others(Local): 1700 c/kg
Preservation method: None
Presentation: Fresh, Clean
Problems: No
Demand Satisfied: Yes; there is enough consumption
Training: Yes (INCOPESCA; INA (Instituto Nacional de Aprendizaje))
Good Practices: Yes
Cultivate New Products: No; Don‟t want to start from scratch
Notes:
o Fish goes to Tilapia Soto which processes it and sends it to San José
Tilapia Farm 2
Sold at: Restaurants (Locally owned)
Volume:
o Restaurants (Locally owned): 200 kg/ month
Price:
o Restaurants (Locally owned): (3500-5000) c/kg
Preservation method: Yes; Refrigerator
Presentation: Frozen
Problems: Yes; Currently the business is disorganized due to personal problem
Demand Satisfied: No; The production is not sufficient
Training: No; New to the Tilapia business
Good Practices: No
Cultivate New Products: Yes
Notes:
o Personal problem: Mother recently died
o Taking over family business with rocky start
o Owns 7 cement tanks and 6 pond tanks
o Estimated Production per year: 18 000 kg (if production is picking up)

114
Tilapia Farm 3
Sold at: Restaurants (Local); Others: Individuals
Volume:
o Restaurants (Local): (1200-1300) kg/ month
o Others (Individuals): 40 kg/ month
Price:
o Restaurants (Local): 1850 c/kg
o Others (Individuals): 2800 c/kg
Preservation method: No
Presentation: Fresh
Problems: No; demand is ok at this time
Demand Satisfied: Yes
Training: Yes; INCOPESCA; 10 years of experience
Good Practices: Yes
Cultivate New Products: Yes
Notes:
o Profit margin is not too high
o The price of the fish feed is quite high and it is hard to have a high gain
Tilapia Farm 4
Products cultivated:
o Tilapia
o Catfish (about 2% of the farm raised fish)
Sold at: Supermarkets (San José), Farmer‟s Market
Volume:
o Supermarkets(San José): 2000 kg/ month
o Farmer‟s market: 400 kg/month
Price:
o Supermarkets(San José):
Tilapia(live): 2200 c/kg
Catfish(live): 2000 c/kg
o Farmer‟s market:
Tilapia Filet: 5700 c/kg
Tilapia Whole Fish: 2700 c/kg
Preservation method:
o Supermarkets: No
o Farmer‟s market: Yes; Preserved with ice
Presentation:
o Supermarkets: Fresh
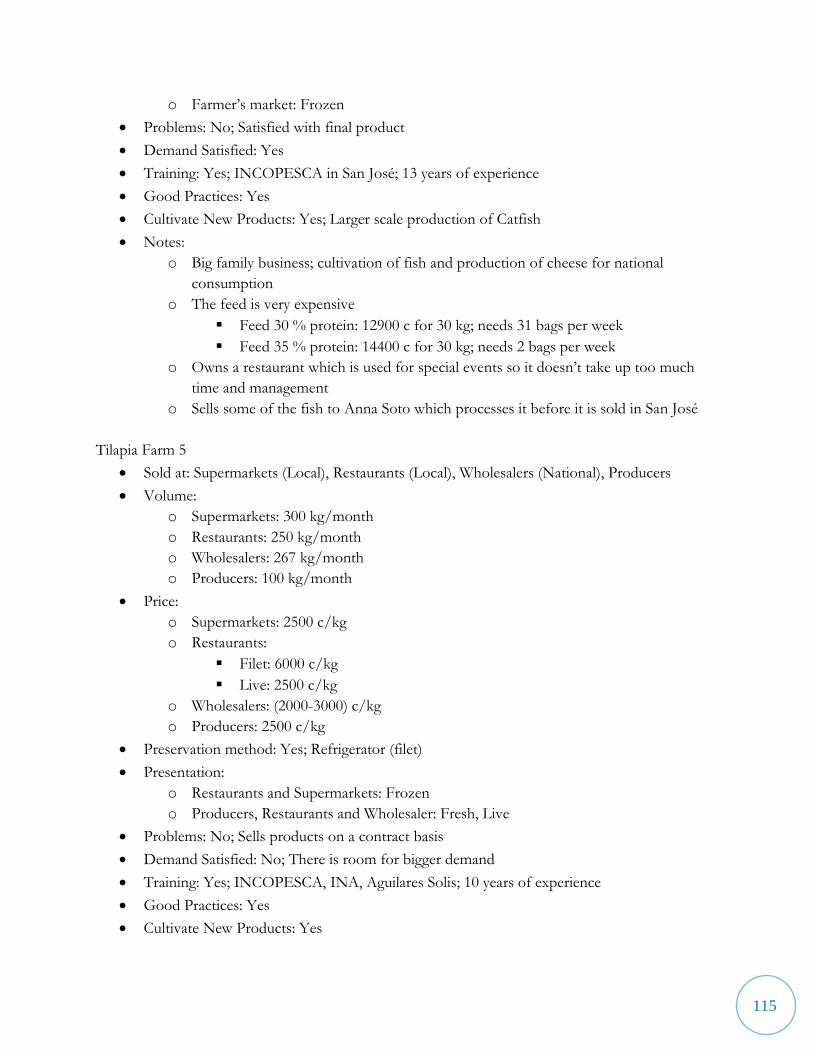
115
o Farmer‟s market: Frozen
Problems: No; Satisfied with final product
Demand Satisfied: Yes
Training: Yes; INCOPESCA in San José; 13 years of experience
Good Practices: Yes
Cultivate New Products: Yes; Larger scale production of Catfish
Notes:
o Big family business; cultivation of fish and production of cheese for national
consumption
o The feed is very expensive
Feed 30 % protein: 12900 c for 30 kg; needs 31 bags per week
Feed 35 % protein: 14400 c for 30 kg; needs 2 bags per week
o Owns a restaurant which is used for special events so it doesn‟t take up too much
time and management
o Sells some of the fish to Anna Soto which processes it before it is sold in San José
Tilapia Farm 5
Sold at: Supermarkets (Local), Restaurants (Local), Wholesalers (National), Producers
Volume:
o Supermarkets: 300 kg/month
o Restaurants: 250 kg/month
o Wholesalers: 267 kg/month
o Producers: 100 kg/month
Price:
o Supermarkets: 2500 c/kg
o Restaurants:
Filet: 6000 c/kg
Live: 2500 c/kg
o Wholesalers: (2000-3000) c/kg
o Producers: 2500 c/kg
Preservation method: Yes; Refrigerator (filet)
Presentation:
o Restaurants and Supermarkets: Frozen
o Producers, Restaurants and Wholesaler: Fresh, Live
Problems: No; Sells products on a contract basis
Demand Satisfied: No; There is room for bigger demand
Training: Yes; INCOPESCA, INA, Aguilares Solis; 10 years of experience
Good Practices: Yes
Cultivate New Products: Yes

116
Notes:
o The price of the fish feed is quite high and it is hard to have a high gain.
o Owns 4 ponds and 5 cement tanks
DAY 2
Tilapia Farm 6
Sold at: Restaurants (Local), Others: Individuals
Volume:
o Restaurants: 320 kg/month
o Others (Individuals): 80 kg/ month
Price:
o Restaurants: 2000 c/kg
o Others (Individuals): 2000 c/kg
Preservation method: No
Presentation: Clean and Fresh
Problems: Yes; Feed is too expensive
Demand Satisfied: No
Training: Yes; INCOPESCA; 15 years of experience
Good Practices: Yes
Cultivate New Products: No
Notes:
o The price of the fish feed is high thereby limiting the profit margin
Tilapia Farm 7
Sold at: Restaurant (Locally owned), Others: Individuals
Volume:
o Restaurant (Locally owned): 600 kg/month
o Others (Individuals): Varies
Price:
o Restaurants: 2600 c/kg
o Others (Individuals):
Preservation method: No
Presentation: Clean and Fresh
Problems: Yes; Feed is too expensive; Size of some tilapia fish is too big for restaurant use
Demand Satisfied: Yes; Cultivates tilapia for use in his own restaurant
Training: Yes; INCOPESCA; 11 years of experience
Good Practices: No
Cultivate New Products: Yes

117
Tilapia Farm 8
Sold at: Others
o Tilapia Soto
o Travelling Salesmen (Local)
Volume:
o Tilapia Soto: 583 kg/ month
o Travelling Salesmen (Local): 2750 kg/ month
Price:
o Tilapia Soto: 1800 c/kg
o Travelling Salesmen (Local): 2000 c/kg
Preservation method: Yes; cold storage
Presentation: Fresh and Clean
Problems: Yes; Weather affects the production, Feed price
Demand Satisfied: No
Training: Yes; INCOPESCA; 15 years of experience
Good Practices: Yes
Cultivate New Products: Yes; Preferentially Catfish if there is a sufficient demand
Notes:
o The price of the fish feed is high thereby limiting the profit margin
o Dry season is the optimum season for tilapia cultivation
Tilapia Farm 9
Sold at: Restaurant (Locally owned), Others: Individuals
Volume:
o Restaurant (Locally owned): 240 kg/month
o Others (Individuals): 480 kg/ month
Price:
o Restaurant (Locally owned): 6000 c/kg
o Others (Individuals): 2500 c/kg
Preservation method: No
Presentation: Fresh
Problems: Yes
Demand Satisfied: No; can‟t produce more
Training: Yes; INCOPESCA; 10 years of experience
Good Practices: Yes; to renew the project
Cultivate New Products: Yes; if the quality and demand are good and efficient, might invest
in oysters
Notes:
o The price of the fish feed is high thereby limiting the profit margin

118
o Demand is too high; can‟t invest to produce more because of financial problem
o Change of seasons affects the level of production
Tilapia Farm 10
Sold at: Open air markets (Place Viques, San José and La Fortuna, Arenal)
Volume:
o Open air markets: 666 kg/ month
Price:
o Filet: 5000 c/kg
o Whole Fish: 2800 c/kg
Preservation method: Yes; Refrigerator, preserved in ice
Presentation: Clean and Fresh
Problems: No
Demand Satisfied: No
Training: Yes; INCOPESCA and Senasa; 12 years of experience in processing the fish, 3
years in cultivation of tilapia
Good Practices: Yes
Cultivate New Products: Yes
Tilapia Farm 11
Sold at: Restaurant (Locally owned), Others: Individuals
Volume:
o Restaurant (Locally owned): 240 kg/month
o Others (Individuals): 400 kg/ month
Price:
o Restaurant (Locally owned): 2000 c/kg
o Others (Individuals): 3000 c/kg
Preservation method: No
Presentation: Fresh
Problems: No problem with the commercialization
Demand Satisfied: Yes
Training: Yes; INCOPESCA; 8 years of experience
Good Practices: Yes
Cultivate New Products: Yes
Notes:
o Capacity of fish tanks: 10000 but tanks are filled with 3000 fish only
o Total: 41 tanks
8 empty tanks

119
o Volume that the farm could produce is 35 000 kg/ year but produced only 5000 kg
last year
Tilapia Farm 12
Sold at: Restaurant (Local)
Volume:
o Restaurants (Local): (300-500) kg/month
Price:
o Restaurant (Locally owned): 2800 c/kg
Preservation method: No
Presentation: Fresh
Problems: Yes; Competition with bigger producers in the country
Demand Satisfied: Yes
Training: No; 10 years of experience, frequent communication with INCOPESCA
representatives
Good Practices: Yes
Cultivate New Products: Yes
Notes:
o Feed price is expensive: 12000c for 30kg; decreases the profit margin while the feed
price increased and price of the fish stayed the same
o There is competition with bigger corporations that can sell their products at a
cheaper price

120
Appendix E.1.c: Shrimp Farm Findings
DAY 1 Shrimp Farm 1
Sold at: Wholesale market (Exports to Spain)
o Export to Spain
o National
Average size of shrimp:
o Export to Spain: 22 g
o National: (13-17) g
Volume:
o Export to Spain: 35 000 kg
o National: 20 000 kg
Price of shrimp:
o Export to Spain: 2500 c/ kg
o National: 2000 c/ kg
Preservation method: Yes; Preserved in ice
Presentation: Fresh
Problems: Yes; Exportation norms and regulations
Demand Satisfied: Yes
Training: Yes; Coonaprosal, Biologists; 5 years of experience
Good Practices: Yes
Cultivate New Products: Yes; maybe tilapia
Notes:
o Difference between the price and quality of feed. Prefers Nicovita(Peru) over Aguilar
Solis(local)
o Weather affects the cultivation of shrimp (the temperature is too high over the
summer- White Spot Syndrome)
Shrimp Farm 2
Sold at: Intermediates (Local)
Average size of shrimp:
o 15 g
o 25 g
o 45 g
Volume:
o Local: 7000 kg
Price of shrimp:
o 15 g: 2000 c/ kg
o 25 g: 3000 c/ kg
o 45 g: 4000 c/ kg
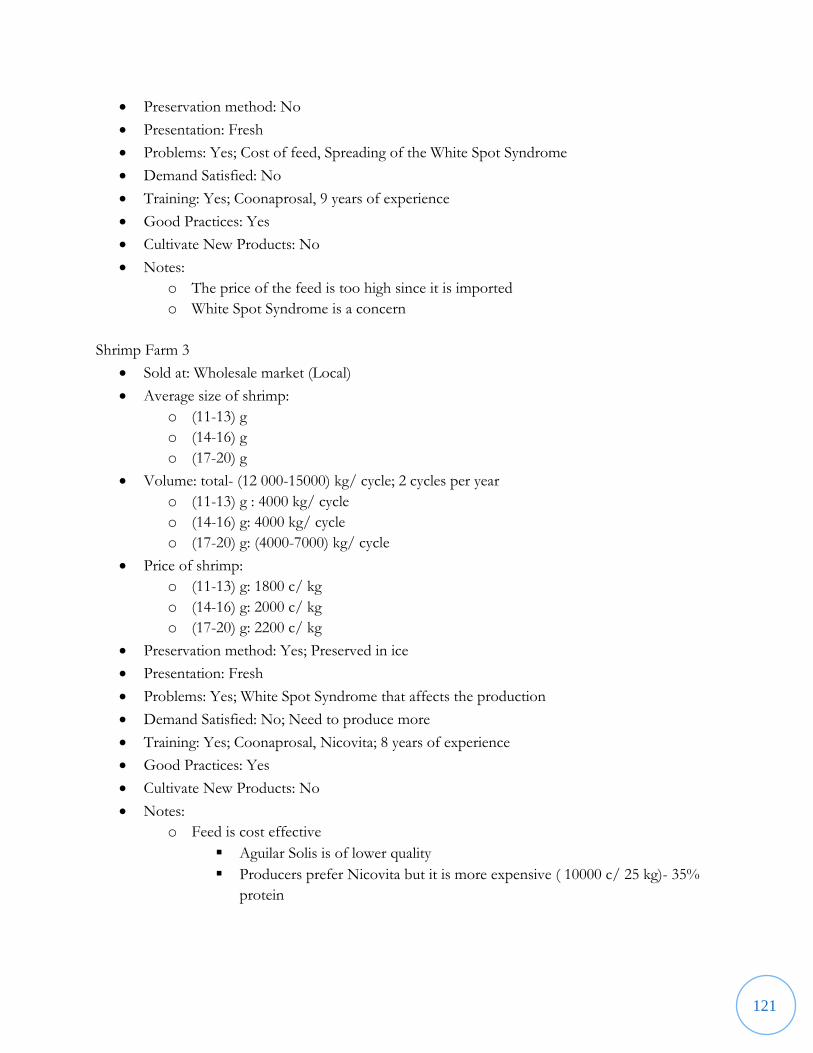
121
Preservation method: No
Presentation: Fresh
Problems: Yes; Cost of feed, Spreading of the White Spot Syndrome
Demand Satisfied: No
Training: Yes; Coonaprosal, 9 years of experience
Good Practices: Yes
Cultivate New Products: No
Notes:
o The price of the feed is too high since it is imported
o White Spot Syndrome is a concern
Shrimp Farm 3
Sold at: Wholesale market (Local)
Average size of shrimp:
o (11-13) g
o (14-16) g
o (17-20) g
Volume: total- (12 000-15000) kg/ cycle; 2 cycles per year
o (11-13) g : 4000 kg/ cycle
o (14-16) g: 4000 kg/ cycle
o (17-20) g: (4000-7000) kg/ cycle
Price of shrimp:
o (11-13) g: 1800 c/ kg
o (14-16) g: 2000 c/ kg
o (17-20) g: 2200 c/ kg
Preservation method: Yes; Preserved in ice
Presentation: Fresh
Problems: Yes; White Spot Syndrome that affects the production
Demand Satisfied: No; Need to produce more
Training: Yes; Coonaprosal, Nicovita; 8 years of experience
Good Practices: Yes
Cultivate New Products: No
Notes:
o Feed is cost effective
Aguilar Solis is of lower quality
Producers prefer Nicovita but it is more expensive ( 10000 c/ 25 kg)- 35%
protein

122
DAY 2
Shrimp Farm 4
Sold at: Intermediates (Local)
Average size of shrimp:
o (15-18) g
o 22 g
Volume:
o (15-18) g: (4000-5000) kg
o 22 g: 2500 kg
Price of shrimp:
o (15-18) g: 2600 c/ kg
o 22 g: 3100 c/ kg
Preservation method: Yes; Preserved in ice
Presentation: Fresh
Problems: Yes; Competition with products from Nicaragua
Demand Satisfied: No; White Spot Syndrome caused a decrease in the level of production
Training: Yes; Coonaprosal, Nicovita; 1.5 years of experience
Good Practices: Yes
Cultivate New Products: Yes; Oysters and Clams
Notes:
o Feed is cost effective
Shrimp Farm 5
Sold at: Intermediates (Local)
Average size of shrimp: 15 g
Volume: 5500 kg/cycle; 2.5 cycles per year
Price of shrimp: 2100 c/ kg
Preservation method: No
Presentation: Fresh
Problems: Yes; Competition with products from Nicaragua; need to lower the price to stay
in the market; White Spot Syndrome
Demand Satisfied: Yes; Level of demand for National Products is good
Training: Yes; Nicovita (Conferences organized in Boston Honduras); 15 years of experience
Good Practices: Yes
Cultivate New Products: No
Notes:
o Because of the spreading of the White Spot Syndrome disease during the dry season,
the farmer is not financed by Coonaprosal
o Still makes profits in the dry season because the product gets sold
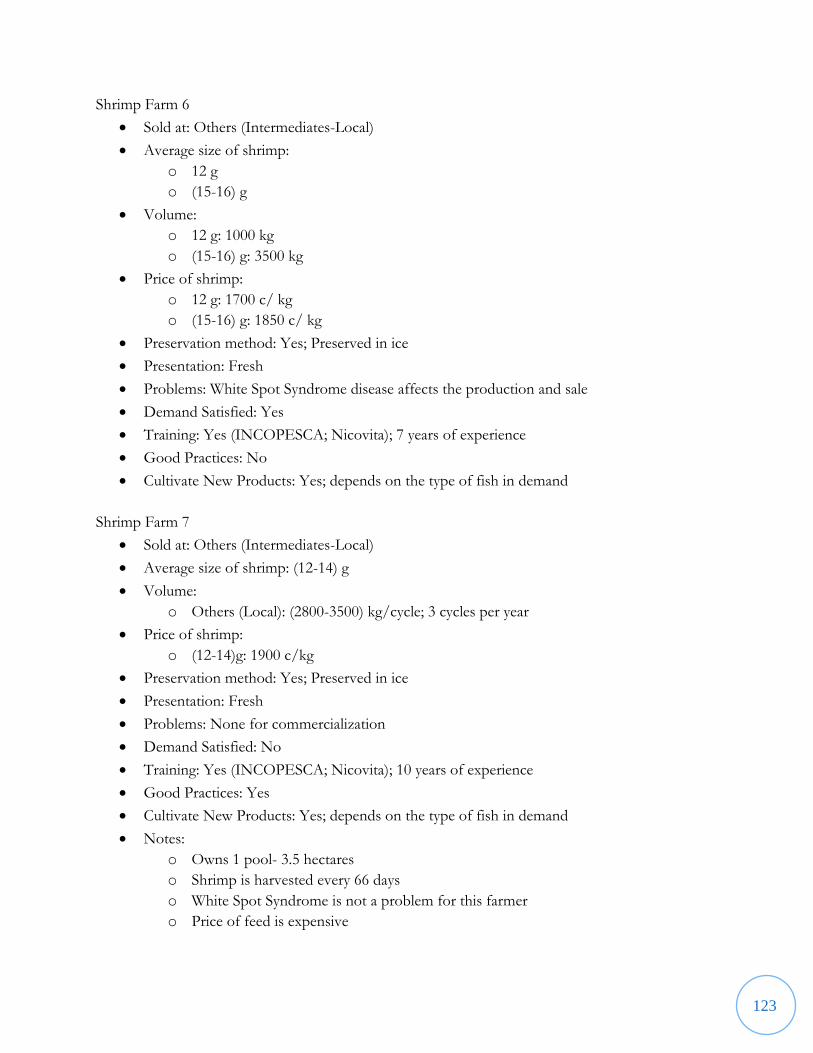
123
Shrimp Farm 6
Sold at: Others (Intermediates-Local)
Average size of shrimp:
o 12 g
o (15-16) g
Volume:
o 12 g: 1000 kg
o (15-16) g: 3500 kg
Price of shrimp:
o 12 g: 1700 c/ kg
o (15-16) g: 1850 c/ kg
Preservation method: Yes; Preserved in ice
Presentation: Fresh
Problems: White Spot Syndrome disease affects the production and sale
Demand Satisfied: Yes
Training: Yes (INCOPESCA; Nicovita); 7 years of experience
Good Practices: No
Cultivate New Products: Yes; depends on the type of fish in demand
Shrimp Farm 7
Sold at: Others (Intermediates-Local)
Average size of shrimp: (12-14) g
Volume:
o Others (Local): (2800-3500) kg/cycle; 3 cycles per year
Price of shrimp:
o (12-14)g: 1900 c/kg
Preservation method: Yes; Preserved in ice
Presentation: Fresh
Problems: None for commercialization
Demand Satisfied: No
Training: Yes (INCOPESCA; Nicovita); 10 years of experience
Good Practices: Yes
Cultivate New Products: Yes; depends on the type of fish in demand
Notes:
o Owns 1 pool- 3.5 hectares
o Shrimp is harvested every 66 days
o White Spot Syndrome is not a problem for this farmer
o Price of feed is expensive

124
Appendix E.2: Wholesaler Findings
Wholesaler 2
Species Price in c/ kg
Weekly Amount in kg
Corvina (Marine) 0 0
Pargo (Marine) 2500 300
Chatarra (Marine) 500 100
Camarón (Marine) 0 0
Camarón (Cultivated) 0 0
Cola Amarilla (Marine) 1500 100
Tiburón (Marine) 0 0
Marlín (Marine) 0 0
Vela (Marine) 0 0
Clase (Marine) 0 0
Macarela (Marine) 0 0
Mahi Mahi (Marine) 0 0
Anguila (Marine) 0 0
Espada (Marine) 0 0
Raya (Marine) 0 0
Salmon (Cultivated) 0 0
Corvineta (Imported, Cultivated) 0 0
Wholesaler 1
Species Price in c/ kg
Weekly Amount in kg
Corvina (Marine) 2000 600
Pargo (Marine) 3000 1000
Chatarra (Marine) 750 3000
Camarón (Marine) 11100 4000
Camarón(Cultivated) 0 0
Cola Amarilla(Marine) 0 0
Tiburón (Marine) 0 0
Marlín (Marine) 0 0
Vela (Marine) 0 0
Clase (Marine) 0 0
Macarela (Marine) 0 0
Dorado (Marine) 0 0
Anguila (Marine) 0 0
Espada (Marine) 0 0
Raya(Marine) 0 0
Salmon (Cultivated) 0 0
Corvineta (Imported, Cultivated) 0 0
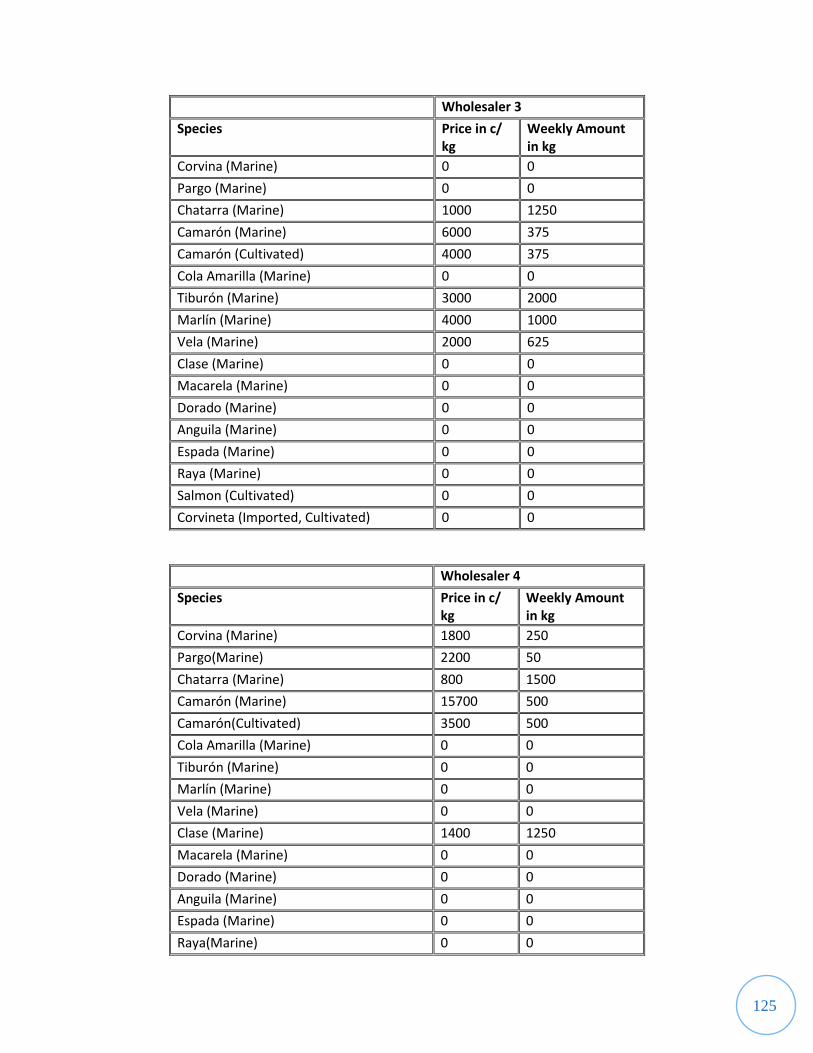
125
Wholesaler 3
Species Price in c/ kg
Weekly Amount in kg
Corvina (Marine) 0 0
Pargo (Marine) 0 0
Chatarra (Marine) 1000 1250
Camarón (Marine) 6000 375
Camarón (Cultivated) 4000 375
Cola Amarilla (Marine) 0 0
Tiburón (Marine) 3000 2000
Marlín (Marine) 4000 1000
Vela (Marine) 2000 625
Clase (Marine) 0 0
Macarela (Marine) 0 0
Dorado (Marine) 0 0
Anguila (Marine) 0 0
Espada (Marine) 0 0
Raya (Marine) 0 0
Salmon (Cultivated) 0 0
Corvineta (Imported, Cultivated) 0 0
Wholesaler 4
Species Price in c/ kg
Weekly Amount in kg
Corvina (Marine) 1800 250
Pargo(Marine) 2200 50
Chatarra (Marine) 800 1500
Camarón (Marine) 15700 500
Camarón(Cultivated) 3500 500
Cola Amarilla (Marine) 0 0
Tiburón (Marine) 0 0
Marlín (Marine) 0 0
Vela (Marine) 0 0
Clase (Marine) 1400 1250
Macarela (Marine) 0 0
Dorado (Marine) 0 0
Anguila (Marine) 0 0
Espada (Marine) 0 0
Raya(Marine) 0 0

126
Salmon (Cultivated) 0 0
Corvineta (Imported, Cultivated) 0 0
Wholesaler 5
Species Price in c/ kg
Weekly Amount in kg
Corvina (Marine) 1800 500
Pargo(Marine) 2500 400
Chatarra (Marine) 700 500
Camarón (Marine) 3500 200
Camarón(Cultivated) 0 0
Cola Amarilla (Marine) 0 0
Tiburón (Marine) 1100 1500
Marlín (Marine) 0 0
Vela (Marine) 8000 500
Clase (Marine) 0 0
Macarela (Marine) 0 0
Dorado (Marine) 0 0
Anguila (Marine) 0 0
Espada (Marine) 0 0
Raya(Marine) 0 0
Salmon (Cultivated) 0 0
Corvineta (Imported, Cultivated) 0 0
Wholesaler 6
Species Price in c/ kg
Weekly Amount in kg
Corvina (Marine) 1000 3500
Pargo(Marine) 0 0
Chatarra (Marine) 700 666
Camarón (Marine) 0 0
Camarón(Cultivated) 0 0
Cola Amarilla (Marine) 0 0
Tiburón (Marine) 0 0
Marlín (Marine) 0 0
Vela (Marine) 1300 666
Clase (Marine) 1000 666
Macarela (Marine) 0 0

127
Dorado (Marine) 0 0
Anguila (Marine) 0 0
Espada (Marine) 0 0
Raya(Marine) 0 0
Salmon (Cultivated) 0 0
Corvineta (Imported, Cultivated) 0 0
Wholesaler 7
Species Price in c/ kg
Weekly Amount in kg
Corvina (Marine) 1600 3600
Pargo(Marine) 2300 1800
Chatarra (Marine) 0 0
Camarón (Marine) 0 0
Camarón(Cultivated) 0 0
Cola Amarilla (Marine) 0 0
Tiburón (Marine) 1000 25200
Marlín (Marine) 3600 3600
Vela (Marine) 0 0
Clase (Marine) 0 0
Macarela (Marine) 0 0
Dorado (Marine) 0 0
Anguila (Marine) 0 0
Espada (Marine) 0 0
Raya(Marine) 0 0
Salmon (Cultivated) 0 0
Corvineta (Imported, Cultivated) 0 0
Wholesaler 8
Species Price in c/ kg
Weekly Amount in kg
Corvina (Marine) 1500 200
Pargo(Marine) 1600 100
Chatarra (Marine) 1050 1000
Camarón (Marine) 0 0
Camarón(Cultivated) 0 0
Cola Amarilla (Marine) 0 0
Tiburón (Marine) 0 0

128
Marlín (Marine) 3000 600
Vela (Marine) 0 0
Clase (Marine) 0 0
Macarela (Marine) 0 0
Dorado (Marine) 1300 250
Anguila (Marine) 750 100
Espada (Marine) 1200 400
Raya(Marine) 450 200
Salmon (Cultivated) 0 0
Corvineta (Imported, Cultivated) 0 0
Wholesaler 9
Species Price in c/ kg
Weekly Amount in kg
Corvina (Marine) 0 0
Pargo(Marine) 0 0
Chatarra (Marine) 0 0
Camarón (Marine) 4000 1250
Camarón(Cultivated) 0 0
Cola Amarilla (Marine) 0 0
Tiburón (Marine) 0 0
Marlín (Marine) 0 0
Vela (Marine) 0 0
Clase (Marine) 0 0
Macarela (Marine) 0 0
Dorado (Marine) 0 0
Anguila (Marine) 0 0
Espada (Marine) 0 0
Raya(Marine) 0 0
Salmon (Cultivated) 7000 1250
Corvineta (Imported, Cultivated) 0 0
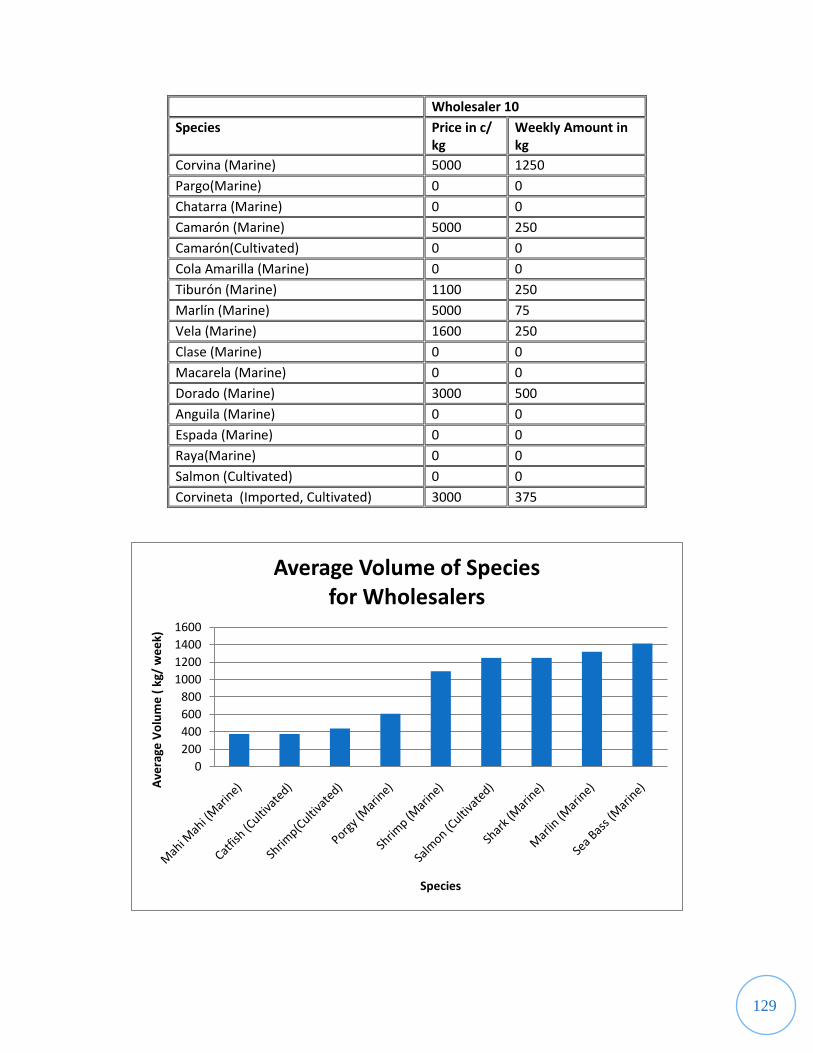
129
Wholesaler 10
Species Price in c/ kg
Weekly Amount in kg
Corvina (Marine) 5000 1250
Pargo(Marine) 0 0
Chatarra (Marine) 0 0
Camarón (Marine) 5000 250
Camarón(Cultivated) 0 0
Cola Amarilla (Marine) 0 0
Tiburón (Marine) 1100 250
Marlín (Marine) 5000 75
Vela (Marine) 1600 250
Clase (Marine) 0 0
Macarela (Marine) 0 0
Dorado (Marine) 3000 500
Anguila (Marine) 0 0
Espada (Marine) 0 0
Raya(Marine) 0 0
Salmon (Cultivated) 0 0
Corvineta (Imported, Cultivated) 3000 375
0
200
400
600
800
1000
1200
1400
1600
Ave
rage
Vo
lum
e (
kg/
we
ek)
Species
Average Volume of Species for Wholesalers

130
010002000300040005000600070008000
Ave
raag
e P
rice
(c/
kg)
Species
Average Price of Species for Wholesalers
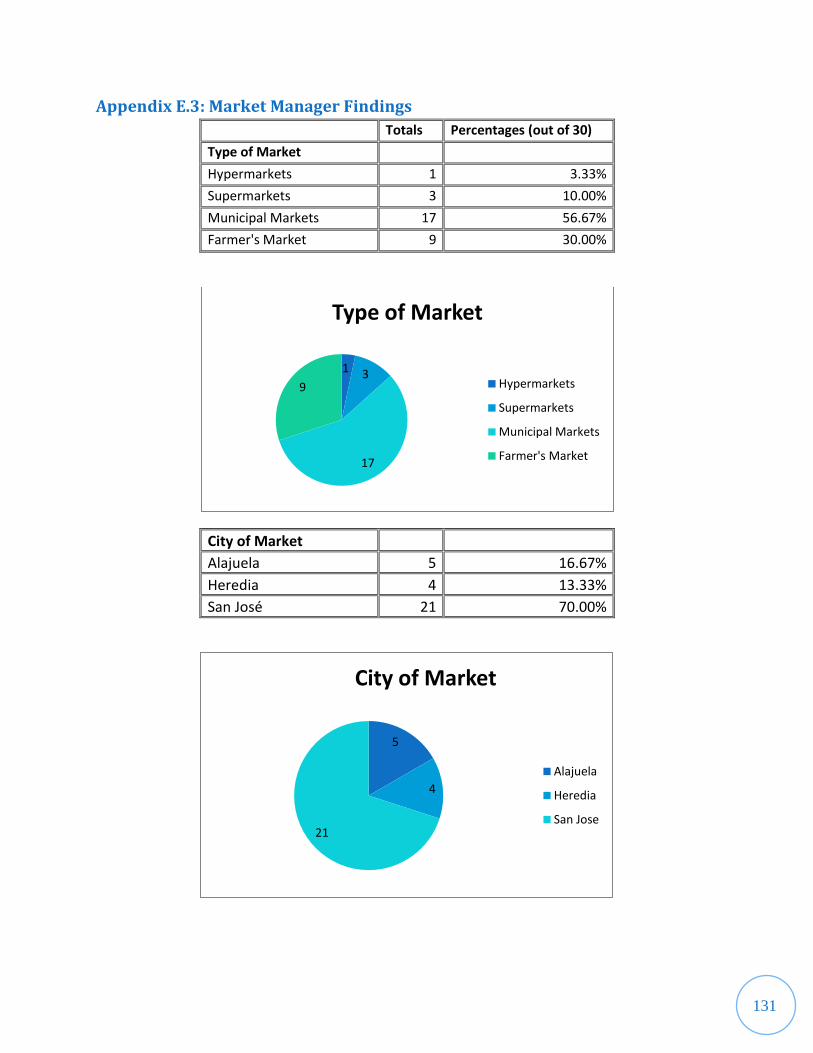
131
Appendix E.3: Market Manager Findings
Totals Percentages (out of 30)
Type of Market
Hypermarkets 1 3.33%
Supermarkets 3 10.00%
Municipal Markets 17 56.67%
Farmer's Market 9 30.00%
City of Market Alajuela 5 16.67%
Heredia 4 13.33%
San José 21 70.00%
1 3
17
9
Type of Market
Hypermarkets
Supermarkets
Municipal Markets
Farmer's Market
5
4
21
City of Market
Alajuela
Heredia
San Jose

132
Species of Fish Sold Shrimp 27 90.00%
Sea Bass 27 90.00%
Panga 16 53.33%
Mahi Mahi 17 56.67%
Marlin 16 53.33%
Porgy 21 70.00%
Salmon 4 13.33%
Shark 28 93.33%
Tilapia 12 40.00%
Trout 2 6.67%
Others 17 56.67%
Most Profitable Fish Imported 2 6.67%
National 27 90.00%
*not 100% due to unanswered data
0
5
10
15
20
25
30
Species of Fish Sold

133
Presentation Frozen 6 20.00%
Dried 2 6.67%
Fresh 29 96.67%
Smoked 1 3.33%
Cleaned 5 16.67%
Other 0 0.00%
Sold Same As Bought Yes 27 90.00%
No 4 13.33%
*Over 100% due to double answer
Agreement With Prices Yes 26 86.67%
No 4 13.33%
0
10
20
30
40
Frozen Dried Fresh Smoked Cleaned Other
Presentation
Series1
26
4
Agreement With Prices
Yes
No
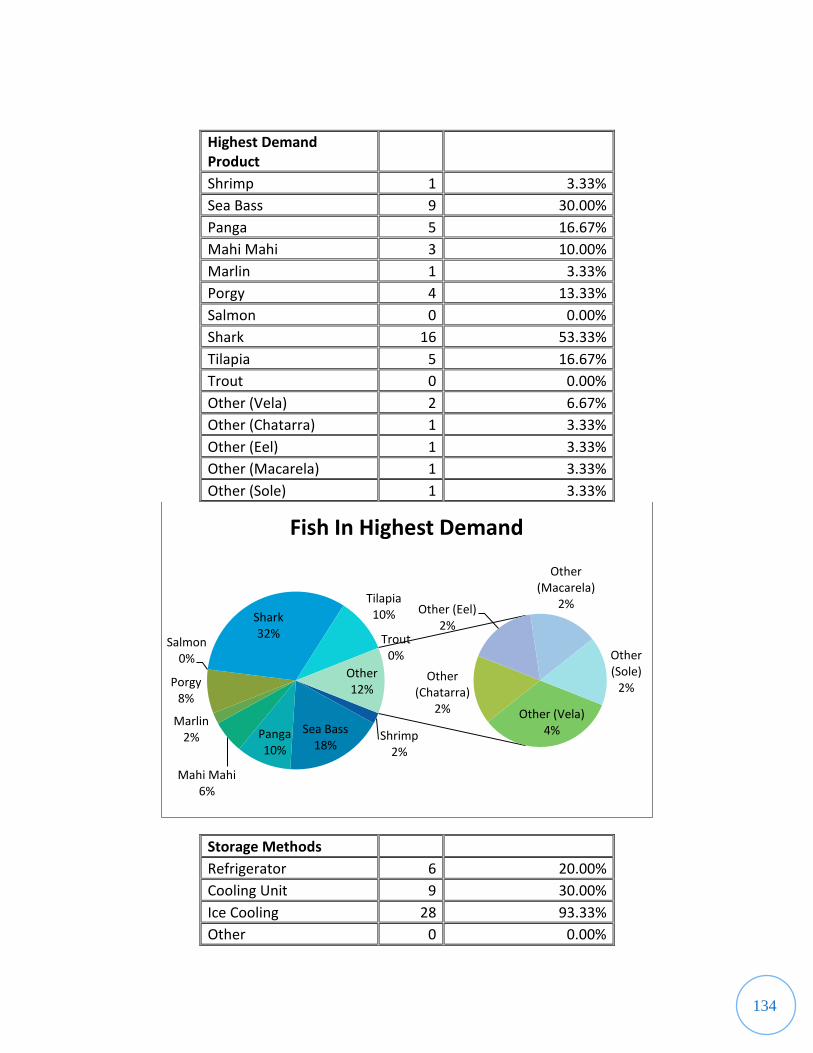
134
Highest Demand Product
Shrimp 1 3.33%
Sea Bass 9 30.00%
Panga 5 16.67%
Mahi Mahi 3 10.00%
Marlin 1 3.33%
Porgy 4 13.33%
Salmon 0 0.00%
Shark 16 53.33%
Tilapia 5 16.67%
Trout 0 0.00%
Other (Vela) 2 6.67%
Other (Chatarra) 1 3.33%
Other (Eel) 1 3.33%
Other (Macarela) 1 3.33%
Other (Sole) 1 3.33%
Storage Methods Refrigerator 6 20.00%
Cooling Unit 9 30.00%
Ice Cooling 28 93.33%
Other 0 0.00%
Shrimp2%
Sea Bass18%
Panga10%
Mahi Mahi6%
Marlin2%
Porgy8%
Salmon0%
Shark32%
Tilapia10%
Trout0%
Other (Vela)4%
Other (Chatarra)
2%
Other (Eel)2%
Other (Macarela)
2%
Other (Sole)
2%Other12%
Fish In Highest Demand
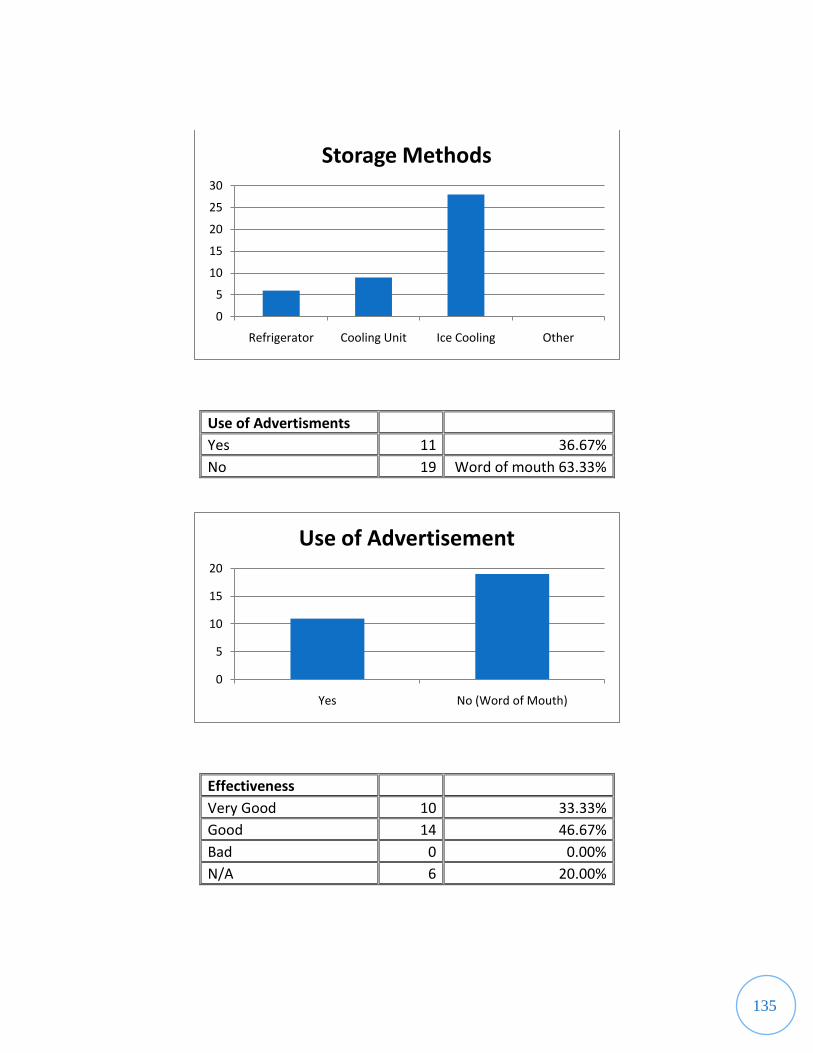
135
Use of Advertisments Yes 11 36.67%
No 19 Word of mouth 63.33%
Effectiveness Very Good 10 33.33%
Good 14 46.67%
Bad 0 0.00%
N/A 6 20.00%
0
5
10
15
20
25
30
Refrigerator Cooling Unit Ice Cooling Other
Storage Methods
0
5
10
15
20
Yes No (Word of Mouth)
Use of Advertisement

136
Willingness to Invest More
Yes; amount 13 43.33%
No 9 30.00%
N/A 8 26.67%
Occupation Employer/Manager 21 70.00%
Employee 9 30.00%
0
5
10
15
Very Good Good Bad N/A
Effectiveness of Advertising
Series1
21
9
Occupation
Employer
Employee
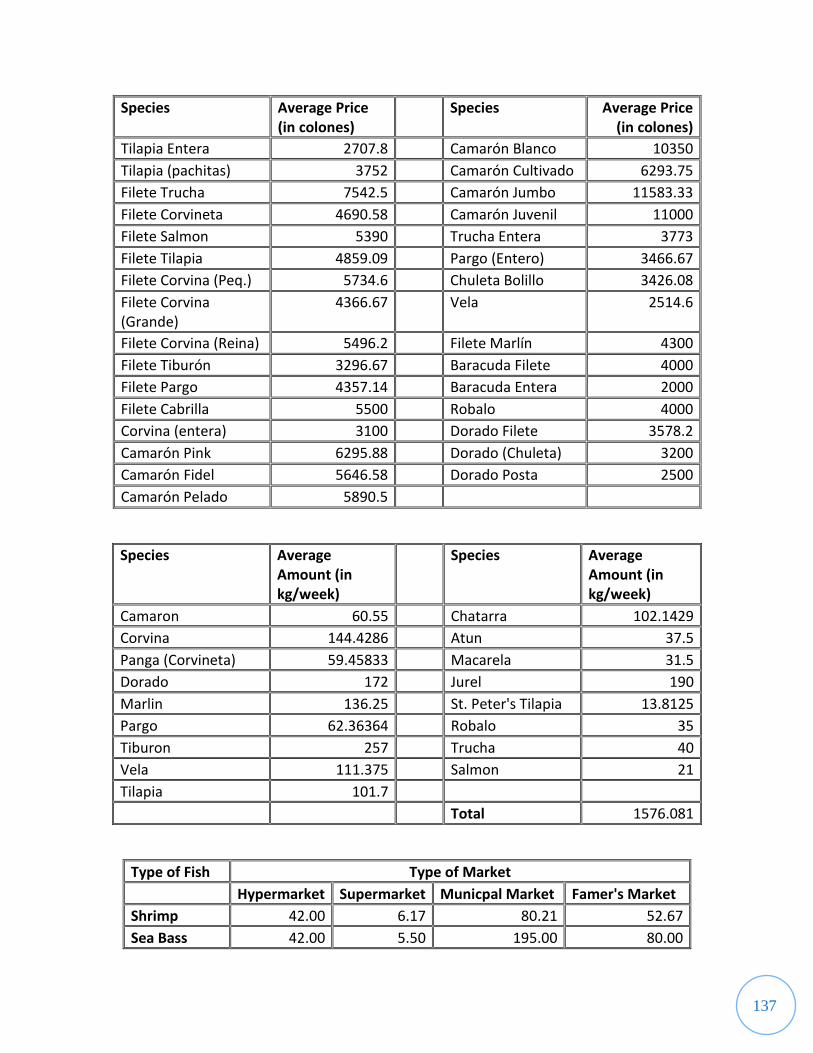
137
Species Average Price (in colones)
Species Average Price (in colones)
Tilapia Entera 2707.8 Camarón Blanco 10350
Tilapia (pachitas) 3752 Camarón Cultivado 6293.75
Filete Trucha 7542.5 Camarón Jumbo 11583.33
Filete Corvineta 4690.58 Camarón Juvenil 11000
Filete Salmon 5390 Trucha Entera 3773
Filete Tilapia 4859.09 Pargo (Entero) 3466.67
Filete Corvina (Peq.) 5734.6 Chuleta Bolillo 3426.08
Filete Corvina (Grande)
4366.67 Vela 2514.6
Filete Corvina (Reina) 5496.2 Filete Marlín 4300
Filete Tiburón 3296.67 Baracuda Filete 4000
Filete Pargo 4357.14 Baracuda Entera 2000
Filete Cabrilla 5500 Robalo 4000
Corvina (entera) 3100 Dorado Filete 3578.2
Camarón Pink 6295.88 Dorado (Chuleta) 3200
Camarón Fidel 5646.58 Dorado Posta 2500
Camarón Pelado 5890.5
Species Average Amount (in kg/week)
Species Average Amount (in kg/week)
Camaron 60.55 Chatarra 102.1429
Corvina 144.4286 Atun 37.5
Panga (Corvineta) 59.45833 Macarela 31.5
Dorado 172 Jurel 190
Marlin 136.25 St. Peter's Tilapia 13.8125
Pargo 62.36364 Robalo 35
Tiburon 257 Trucha 40
Vela 111.375 Salmon 21
Tilapia 101.7
Total 1576.081
Type of Fish Type of Market
Hypermarket Supermarket Municpal Market Famer's Market
Shrimp 42.00 6.17 80.21 52.67
Sea Bass 42.00 5.50 195.00 80.00

138
Panga 224.00 17.33 57.92 80.00
Mahi Mahi
253.33 50.00
Marlin
185.36 27.50
Porgy
1.00 82.50 15.00
Salmon 21.00 Shark 42.00 6.67 377.14 22.50
Tilapia 315.00 23.17 66.50 300.00
Trout 77.00 3.00 Total 763.00 62.83 1297.96 627.67
***Correlations with each of these sets of data were done in the results section of the IQP***

139
Appendix E.4: Consumer Findings
Appendix E.4.a: Interview Demographics
Interview Location
Interview Location Total Percentage
Hypermarket 20 21.05%
Supermarket 23 24.21%
Municipal Market 28 29.47%
Farmer's Market 24 25.26%
Age
21%
24%30%
25%
Interview Location
Hypermarket
Supermarket
Municipal Market
Farmer's Market
0
2
4
6
8
10
12
14
0 10 20 30 40 50 60 70 80 90 100
Fre
qu
en
cy
Age
Age Distribution

140
Average
Standard Deviation
Age 51.5 14.0
Gender
Total Percentage
Male 26 27.37%
Female 69 72.63%
Marital Status
27%
73%
Gender of Consumer
Male
Female
70%3%
16%
7%
4%
Marital Status of Consumer
Married
Free Union
Single
Widow
Divorce
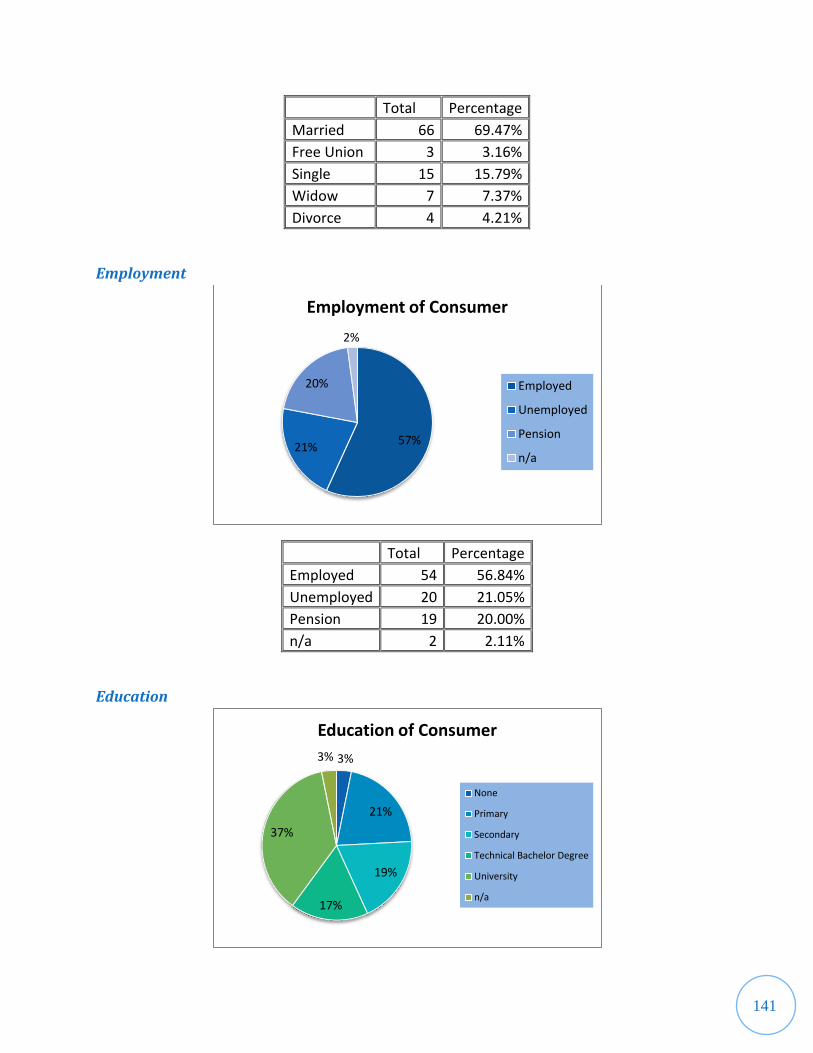
141
Total Percentage
Married 66 69.47%
Free Union 3 3.16%
Single 15 15.79%
Widow 7 7.37%
Divorce 4 4.21%
Employment
Total Percentage
Employed 54 56.84%
Unemployed 20 21.05%
Pension 19 20.00%
n/a 2 2.11%
Education
57%21%
20%
2%
Employment of Consumer
Employed
Unemployed
Pension
n/a
3%
21%
19%
17%
37%
3%
Education of Consumer
None
Primary
Secondary
Technical Bachelor Degree
University
n/a
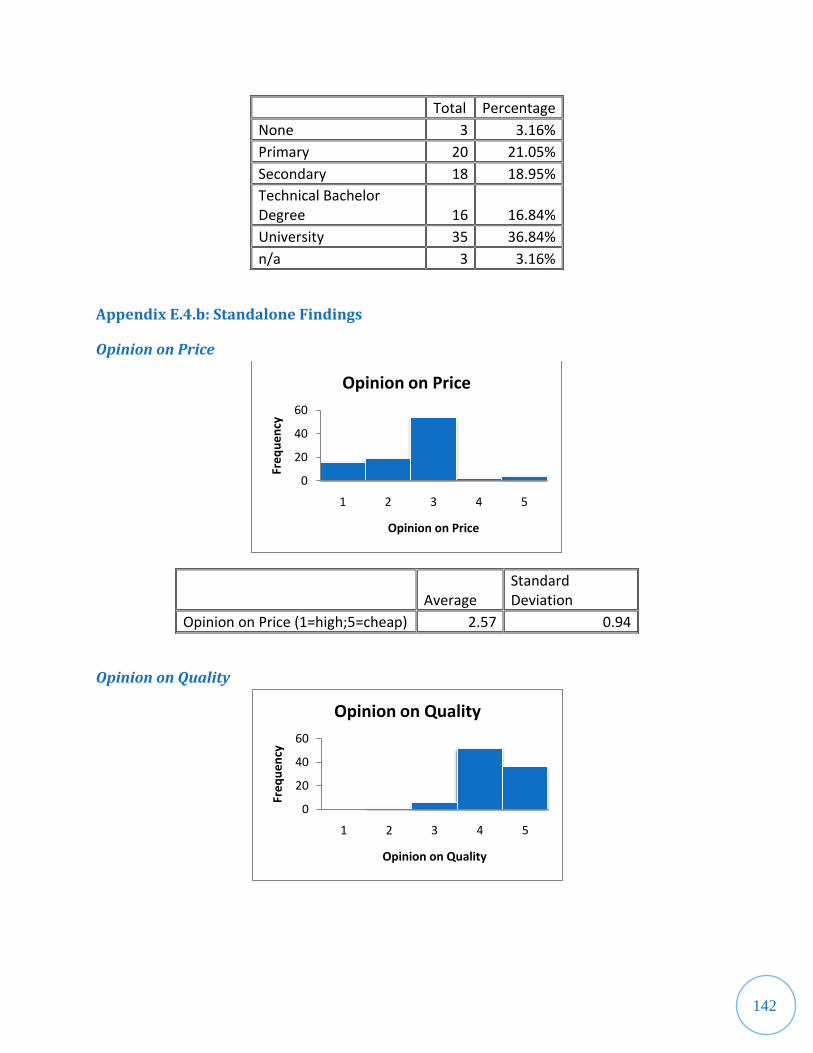
142
Total Percentage
None 3 3.16%
Primary 20 21.05%
Secondary 18 18.95%
Technical Bachelor Degree 16 16.84%
University 35 36.84%
n/a 3 3.16%
Appendix E.4.b: Standalone Findings
Opinion on Price
Average
Standard Deviation
Opinion on Price (1=high;5=cheap) 2.57 0.94
Opinion on Quality
0
20
40
60
1 2 3 4 5
Fre
qu
en
cy
Opinion on Price
Opinion on Price
0
20
40
60
1 2 3 4 5
Fre
qu
en
cy
Opinion on Quality
Opinion on Quality

143
Average
Standard Deviation
Opinion on Quality (1=bad;5=great) 4.29 0.63
Nutritional Awareness
Nutritional Awareness Total Percent
Yes 95 100.00%
No 0 0.00%
Reason for Consuming Fish
Nutritional Awareness
Yes
No
0%
10%
20%
30%
40%
50%
60%
70%
80%
90%
100%
Accessible Nutritious Cheap Tasty
% o
f P
op
ula
tio
n
Reason for Consumption
Reasons for Consuming Fish

144
Total Percentage
Accessible 11 11.58%
Nutritious 87 91.58%
Cheap 11 11.58%
Tasty 65 68.42%
Preferred Presentation
Total Percentage
Frozen 11 11.58%
Fresh 92 96.84%
Smoked 1 1.05%
Canned 7 7.37%
Advertisement Awareness
0%
20%
40%
60%
80%
100%
Frozen Fresh Smoked Canned
% o
f P
op
ula
tio
n
Presentation
Prefered Presentation
0%
20%
40%
60%
80%
100%
Newspaper At the Market
Fliers Billboard Television
% o
f P
op
ula
tio
n
Advertisement Method
Advertisement Awareness
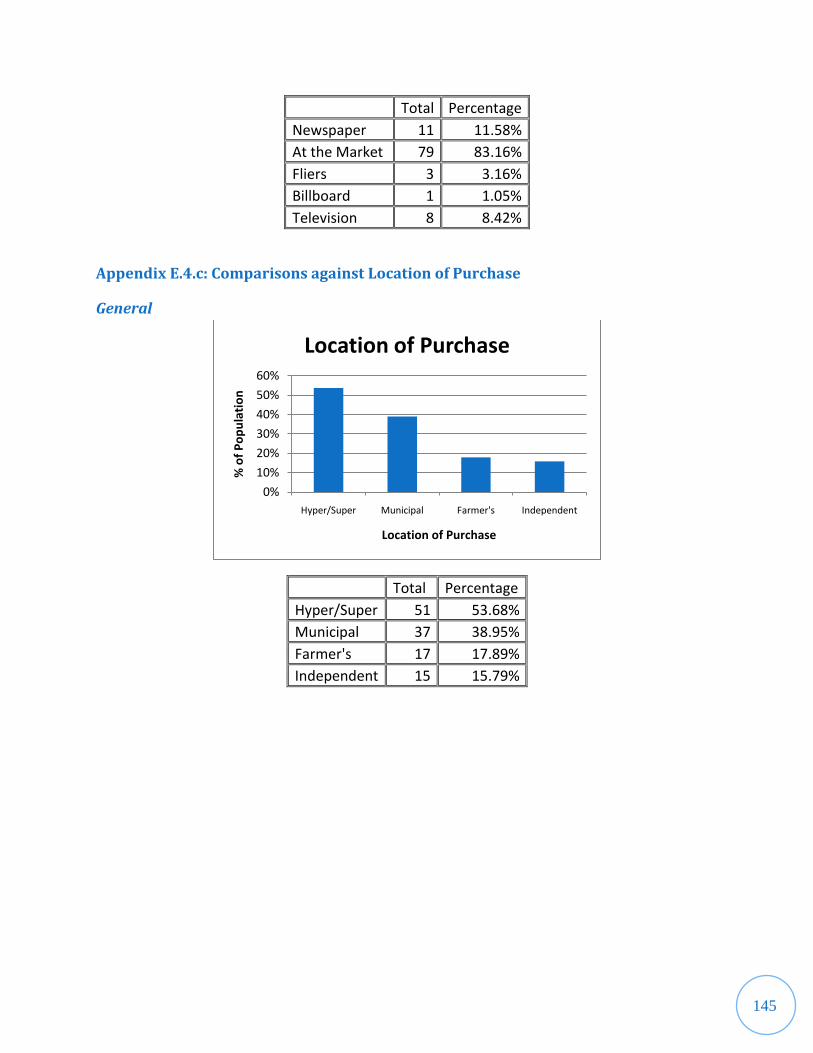
145
Total Percentage
Newspaper 11 11.58%
At the Market 79 83.16%
Fliers 3 3.16%
Billboard 1 1.05%
Television 8 8.42%
Appendix E.4.c: Comparisons against Location of Purchase
General
Total Percentage
Hyper/Super 51 53.68%
Municipal 37 38.95%
Farmer's 17 17.89%
Independent 15 15.79%
0%
10%
20%
30%
40%
50%
60%
Hyper/Super Municipal Farmer's Independent
% o
f P
op
ula
tio
n
Location of Purchase
Location of Purchase

146
Location of Purchase vs. Location of Interviewer
Hypermarkets Supermarkets
Municipal Markets
Farmers' Markets
Location of Purchase Total % Total % Total % Total %
Hyper/Super 16 80.00% 16 69.57% 8 28.57% 11 45.83%
Municipal 5 25.00% 3 13.04% 25 89.29% 4 16.67%
Farmers' 0 0.00% 2 8.70% 1 3.57% 14 58.33%
Independent 2 10.00% 3 13.04% 5 17.86% 5 20.83%
Location of Purchase vs. Age
0%
10%
20%
30%
40%
50%
60%
70%
80%
90%
100%
Hyper/Super Municipal Farmers' Independent
% o
f P
op
ula
tio
n
Location of Purchase
Location of Purchase vs. Location of Interview
Hypermarkets
Supermarkets
Municipal Markets
Farmers' Markets
0%
10%
20%
30%
40%
50%
60%
70%
80%
90%
100%
Hyper/Super Municipal Farmer's Independent
% o
f P
op
ula
tio
n
Location of Purchase
Location of Purchase vs. Age
Age 0 to 35
Age 36 to 50
Age 51 to 65
Age 66+

147
0-35 36-50 51-65 66+
Total % Total % Total % Total % Correlation
Hyper/Super 10 90.91% 19 61.29% 16 53.33% 3 27.27% -0.30
Municipal 1 9.09% 9 29.03% 13 43.33% 5 45.45% 0.32
Farmer's 1 9.09% 7 22.58% 6 20.00% 1 9.09% -0.05
Independent 1 9.09% 8 25.81% 2 6.67% 2 18.18% -0.04
Location of Purchase vs. Gender
Male Female
Total % Total %
Hyper/Super 15 57.69% 36 52.17%
Municipal 9 34.62% 28 40.58%
Farmer's 9 34.62% 8 11.59%
Independent 4 15.38% 11 15.94%
0%
10%
20%
30%
40%
50%
60%
70%
Hyper/Super Municipal Farmer's Independent
% o
f P
op
ula
tio
n
Location of Purchase
Location of Purchase vs. Gender
Male
Female

148
Location of Purchase vs. Marital Status
Together Single
Total % Total %
Hyper/Super 37 53.62% 14 53.85%
Municipal 26 37.68% 11 42.31%
Farmers' 14 20.29% 3 11.54%
Independent 11 15.94% 4 15.38%
Location of Purchase vs. Employment
0%
10%
20%
30%
40%
50%
60%
Hyper/Super Municipal Farmers' Independent
% o
f P
op
ula
tio
n
Location of Purchase
Location of Purchase vs. Marital Status
Together
Single
0%
10%
20%
30%
40%
50%
60%
70%
% o
f P
op
ula
tio
n
Location of Purchase
Location of Purchase vs. Employment
Employed
Unemployed
Pension

149
Employed Unemployed Pension
Total % Total % Total %
Hyper/Super 35 64.81% 9 45.00% 6 31.58%
Municipal 15 27.78% 12 60.00% 10 52.63%
Farmers' 12 22.22% 3 15.00% 2 10.53%
Independent 9 16.67% 3 15.00% 3 15.79%
Location of Purchase vs. Education
None Primary Secondary Technical University
Tot % Tot % Tot % Tot % Tot % Correl.
Hyper/Super 1 33.33% 5 25.00% 10 55.56% 8 50.00% 25 71.43% 0.33
Municipal 3 100.00% 12 60.00% 6 33.33% 7 43.75% 8 22.86% -0.32
Farmer's 0 0.00% 2 10.00% 3 16.67% 3 18.75% 8 22.86% 0.15
Independent 0 0.00% 5 25.00% 5 27.78% 1 6.25% 4 11.43% -0.13
0%10%20%30%40%50%60%70%80%90%
100%
Hyper/Super Municipal Farmer's Independent
% o
f P
op
ula
tio
n
Location of Purchase
Location of Purchase vs. Education
None
Primary
Secondary
Technical
University

150
Appendix E.4.d: Comparisons against Consumed Species
General
Total Percentage
Camarón 40 42.11%
Corvina 69 72.63%
Corvineta (Panga) 20 21.05%
Dorado 25 26.32%
Marlin 10 10.53%
Pargo 22 23.16%
Salmon 10 10.53%
Tiburon 7 7.37%
Tilapia 40 42.11%
Trucha 12 12.63%
Other* 21 22.11%
*Other includes: Vela, Pulpo, Seafood, and Tuna
0%10%20%30%40%50%60%70%80%90%
100%%
of
Co
nsu
mp
tio
n
Species
Consumed Species

151
Consumed Species vs. Location of Interview
Hypermarkets Supermarkets
Municipal Markets
Farmer's Markets
Total % Total % Total % Total %
Camarón 10 50.00% 9 39.13% 11 39.29% 10 41.67%
Corvina 13 65.00% 19 82.61% 18 64.29% 19 79.17%
Corvineta (Panga) 4 20.00% 12 52.17% 2 7.14% 2 8.33%
Dorado 3 15.00% 7 30.43% 9 32.14% 6 25.00%
Marlin 3 15.00% 1 4.35% 4 14.29% 2 8.33%
Pargo 4 20.00% 3 13.04% 6 21.43% 9 37.50%
Salmon 4 20.00% 4 17.39% 1 3.57% 1 4.17%
Tiburon 1 5.00% 0 0.00% 4 14.29% 2 8.33%
Tilapia 14 70.00% 10 43.48% 7 25.00% 9 37.50%
Trucha 5 25.00% 3 13.04% 2 7.14% 2 8.33%
Other* 3 15.00% 5 21.74% 9 32.14% 4 16.67%
*Other includes: Vela, Pulpo, Seafood, and Tuna
0%
10%
20%
30%
40%
50%
60%
70%
80%
90%
100%%
of
Co
nsu
mp
tio
n
Species
Consumed Species vs. Location of Interview
Hypermarkets
Supermarkets
Municipal Markets
Farmers' Market
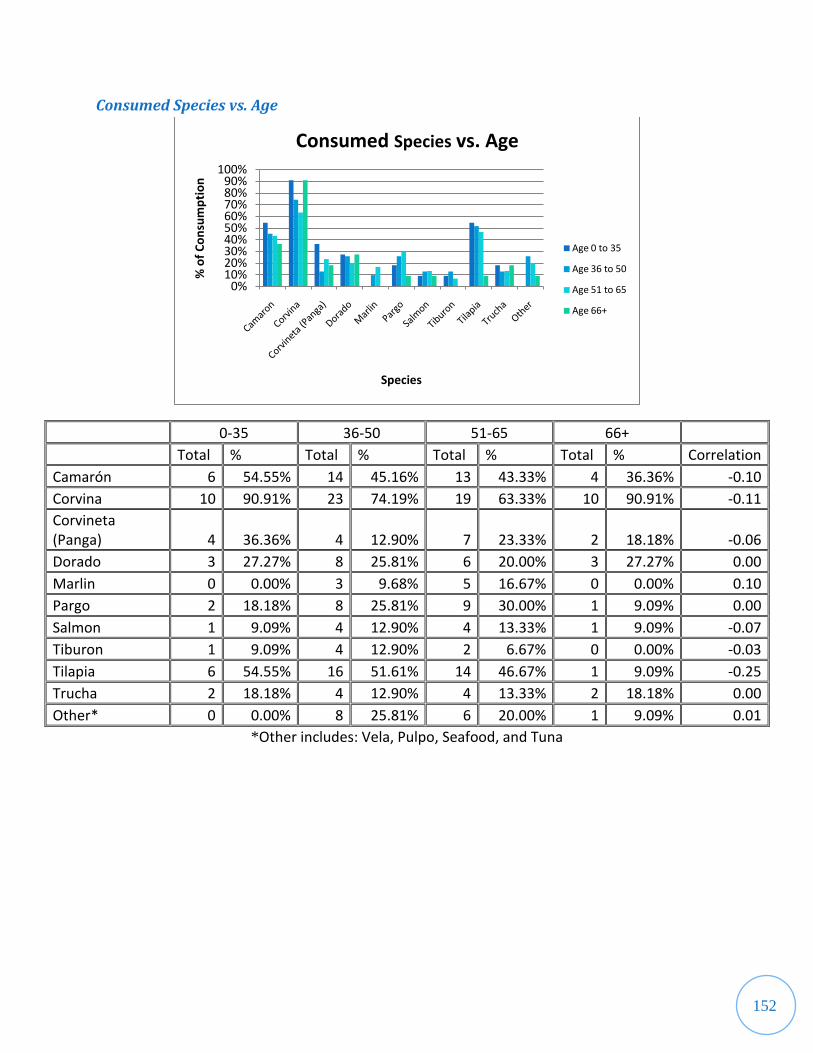
152
Consumed Species vs. Age
0-35 36-50 51-65 66+
Total % Total % Total % Total % Correlation
Camarón 6 54.55% 14 45.16% 13 43.33% 4 36.36% -0.10
Corvina 10 90.91% 23 74.19% 19 63.33% 10 90.91% -0.11
Corvineta (Panga) 4 36.36% 4 12.90% 7 23.33% 2 18.18% -0.06
Dorado 3 27.27% 8 25.81% 6 20.00% 3 27.27% 0.00
Marlin 0 0.00% 3 9.68% 5 16.67% 0 0.00% 0.10
Pargo 2 18.18% 8 25.81% 9 30.00% 1 9.09% 0.00
Salmon 1 9.09% 4 12.90% 4 13.33% 1 9.09% -0.07
Tiburon 1 9.09% 4 12.90% 2 6.67% 0 0.00% -0.03
Tilapia 6 54.55% 16 51.61% 14 46.67% 1 9.09% -0.25
Trucha 2 18.18% 4 12.90% 4 13.33% 2 18.18% 0.00
Other* 0 0.00% 8 25.81% 6 20.00% 1 9.09% 0.01
*Other includes: Vela, Pulpo, Seafood, and Tuna
0%10%20%30%40%50%60%70%80%90%
100%
% o
f C
on
sum
pti
on
Species
Consumed Species vs. Age
Age 0 to 35
Age 36 to 50
Age 51 to 65
Age 66+
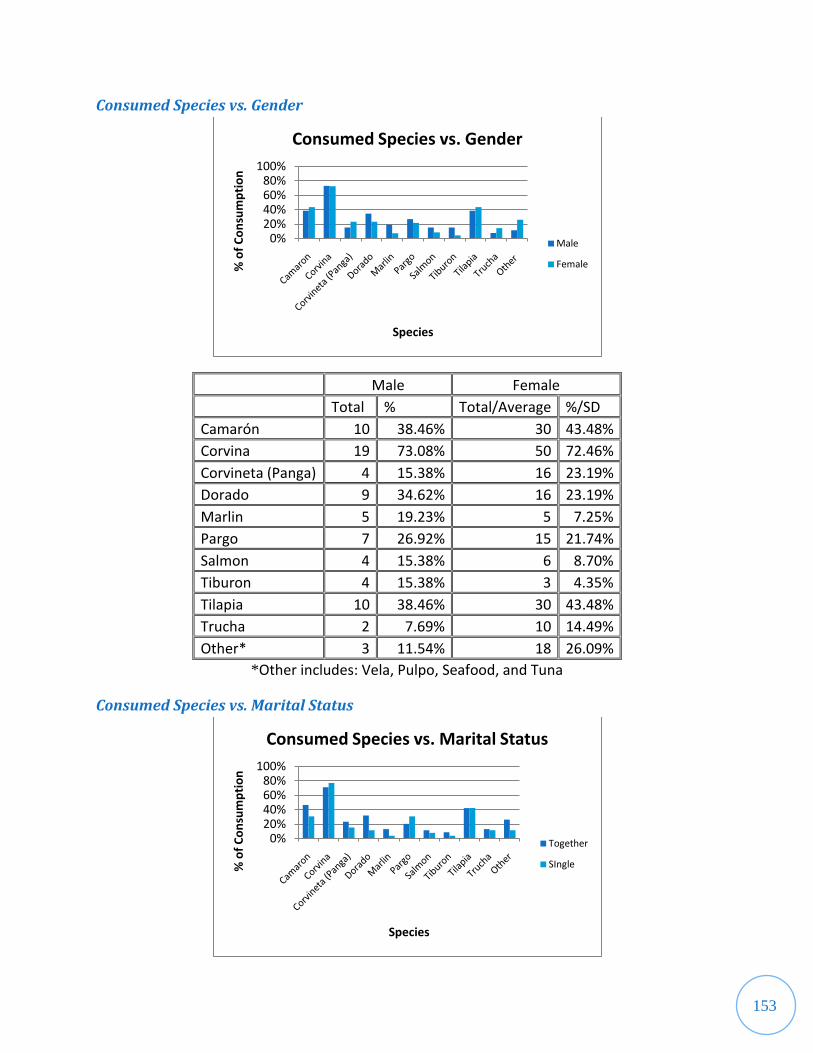
153
Consumed Species vs. Gender
Male Female
Total % Total/Average %/SD
Camarón 10 38.46% 30 43.48%
Corvina 19 73.08% 50 72.46%
Corvineta (Panga) 4 15.38% 16 23.19%
Dorado 9 34.62% 16 23.19%
Marlin 5 19.23% 5 7.25%
Pargo 7 26.92% 15 21.74%
Salmon 4 15.38% 6 8.70%
Tiburon 4 15.38% 3 4.35%
Tilapia 10 38.46% 30 43.48%
Trucha 2 7.69% 10 14.49%
Other* 3 11.54% 18 26.09%
*Other includes: Vela, Pulpo, Seafood, and Tuna
Consumed Species vs. Marital Status
0%20%40%60%80%
100%
% o
f C
on
sum
pti
on
Species
Consumed Species vs. Gender
Male
Female
0%20%40%60%80%
100%
% o
f C
on
sum
pti
on
Species
Consumed Species vs. Marital Status
Together
SIngle

154
Together Single
Total % Total %
Camarón 32 46.38% 8 30.77%
Corvina 49 71.01% 20 76.92%
Corvineta (Panga) 16 23.19% 4 15.38%
Dorado 22 31.88% 3 11.54%
Marlin 9 13.04% 1 3.85%
Pargo 14 20.29% 8 30.77%
Salmon 8 11.59% 2 7.69%
Tiburon 6 8.70% 1 3.85%
Tilapia 29 42.03% 11 42.31%
Trucha 9 13.04% 3 11.54%
Other* 18 26.09% 3 11.54%
*Other includes: Vela, Pulpo, Seafood, and Tuna
Consumed Species vs. Employment
0%10%20%30%40%50%60%70%80%90%
100%
% o
f C
on
sum
pti
on
Species
Consumed Species vs. Employment
Employed
Unemployed
Pension
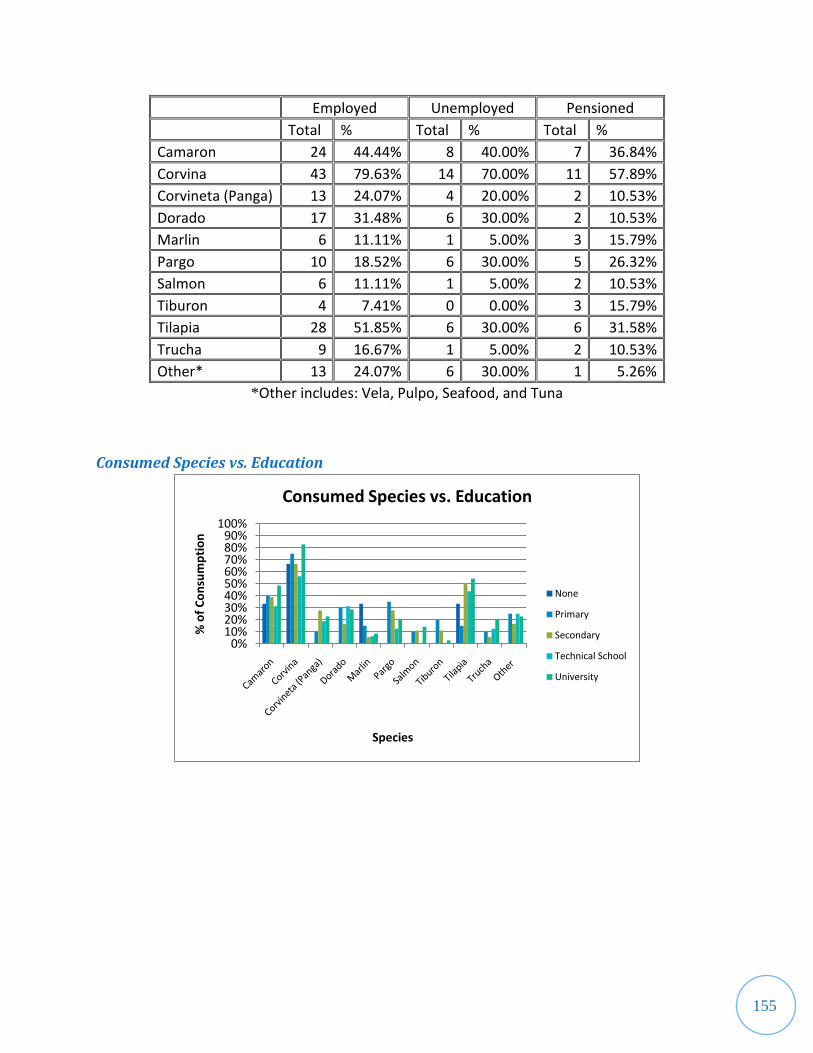
155
Employed Unemployed Pensioned
Total % Total % Total %
Camaron 24 44.44% 8 40.00% 7 36.84%
Corvina 43 79.63% 14 70.00% 11 57.89%
Corvineta (Panga) 13 24.07% 4 20.00% 2 10.53%
Dorado 17 31.48% 6 30.00% 2 10.53%
Marlin 6 11.11% 1 5.00% 3 15.79%
Pargo 10 18.52% 6 30.00% 5 26.32%
Salmon 6 11.11% 1 5.00% 2 10.53%
Tiburon 4 7.41% 0 0.00% 3 15.79%
Tilapia 28 51.85% 6 30.00% 6 31.58%
Trucha 9 16.67% 1 5.00% 2 10.53%
Other* 13 24.07% 6 30.00% 1 5.26%
*Other includes: Vela, Pulpo, Seafood, and Tuna
Consumed Species vs. Education
0%10%20%30%40%50%60%70%80%90%
100%
% o
f C
on
sum
pti
on
Species
Consumed Species vs. Education
None
Primary
Secondary
Technical School
University
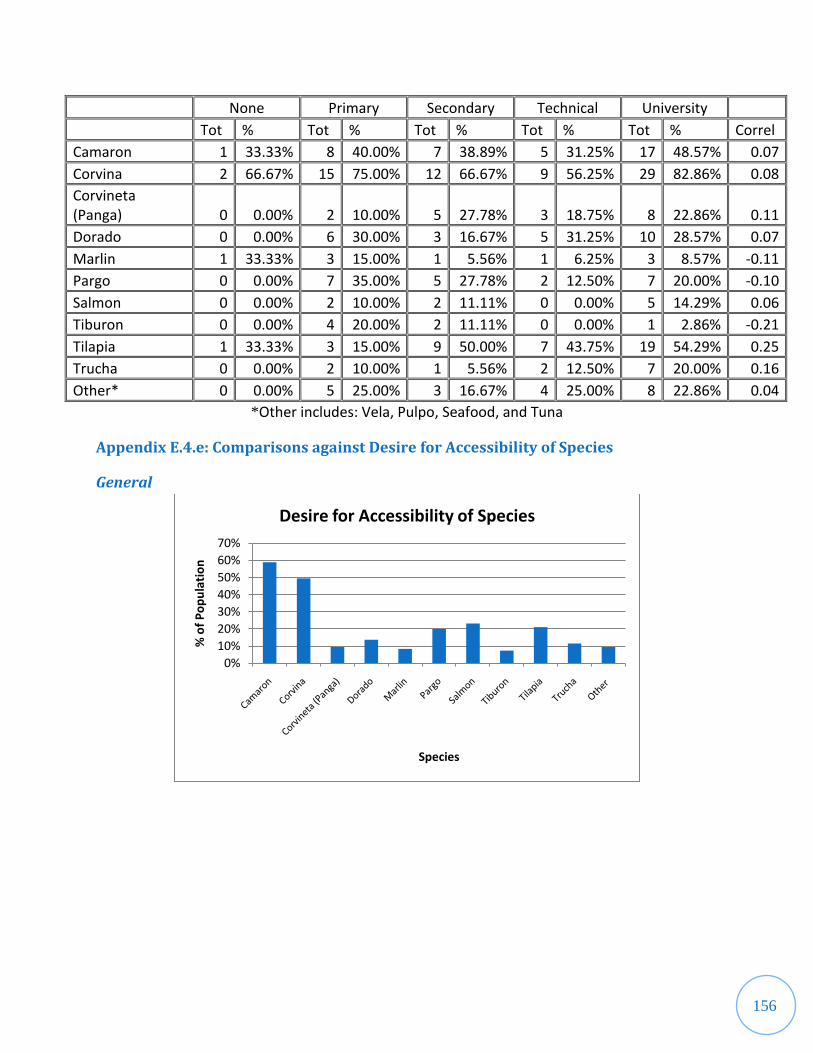
156
None Primary Secondary Technical University
Tot % Tot % Tot % Tot % Tot % Correl
Camaron 1 33.33% 8 40.00% 7 38.89% 5 31.25% 17 48.57% 0.07
Corvina 2 66.67% 15 75.00% 12 66.67% 9 56.25% 29 82.86% 0.08
Corvineta (Panga) 0 0.00% 2 10.00% 5 27.78% 3 18.75% 8 22.86% 0.11
Dorado 0 0.00% 6 30.00% 3 16.67% 5 31.25% 10 28.57% 0.07
Marlin 1 33.33% 3 15.00% 1 5.56% 1 6.25% 3 8.57% -0.11
Pargo 0 0.00% 7 35.00% 5 27.78% 2 12.50% 7 20.00% -0.10
Salmon 0 0.00% 2 10.00% 2 11.11% 0 0.00% 5 14.29% 0.06
Tiburon 0 0.00% 4 20.00% 2 11.11% 0 0.00% 1 2.86% -0.21
Tilapia 1 33.33% 3 15.00% 9 50.00% 7 43.75% 19 54.29% 0.25
Trucha 0 0.00% 2 10.00% 1 5.56% 2 12.50% 7 20.00% 0.16
Other* 0 0.00% 5 25.00% 3 16.67% 4 25.00% 8 22.86% 0.04
*Other includes: Vela, Pulpo, Seafood, and Tuna
Appendix E.4.e: Comparisons against Desire for Accessibility of Species
General
0%
10%
20%
30%
40%
50%
60%
70%
% o
f P
op
ula
tio
n
Species
Desire for Accessibility of Species

157
Total Percentage
Camarón 56 58.95%
Corvina 47 49.47%
Corvineta (Panga) 9 9.47%
Dorado 13 13.68%
Marlin 8 8.42%
Pargo 19 20.00%
Salmon 22 23.16%
Tiburon 7 7.37%
Tilapia 20 21.05%
Trucha 11 11.58%
Other* 9 9.47%
*Other includes vela, robalo, and pulpo
Desire for Accessibility of Species vs. Location of Interview
0%
10%
20%
30%
40%
50%
60%
70%
80%
90%
100%
% o
f P
op
ula
tio
n
Species
Desire for Accessibility of Species vs. Location of Interview
Hypermarkets
Supermarkets
Municipal Markets
Farmers' Market

158
Hypermarkets Supermarkets
Municipal Markets
Farmer's Markets
Total % Total % Total % Total %
Camaron 11 55.00% 12 52.17% 14 50.00% 19 79.17%
Corvina 13 65.00% 14 60.87% 13 46.43% 7 29.17%
Corvineta (Panga) 1 5.00% 5 21.74% 1 3.57% 2 8.33%
Dorado 2 10.00% 6 26.09% 2 7.14% 3 12.50%
Marlin 0 0.00% 4 17.39% 2 7.14% 2 8.33%
Pargo 6 30.00% 4 17.39% 3 10.71% 6 25.00%
Salmon 8 40.00% 8 34.78% 1 3.57% 5 20.83%
Tiburon 1 5.00% 2 8.70% 1 3.57% 3 12.50%
Tilapia 7 35.00% 5 21.74% 5 17.86% 3 12.50%
Trucha 3 15.00% 4 17.39% 2 7.14% 2 8.33%
Other* 1 5.00% 2 8.70% 4 14.29% 2 8.33%
*Other includes vela, robalo, and pulpo
Desire for Accessibility of Species vs. Age
0%
10%
20%
30%
40%
50%
60%
70%
80%
90%
100%
% o
f P
op
ula
tio
n
Species
Desired for Accessibility of Species vs. Age
Age 0 to 35
Age 36 to 50
Age 51 to 65
Age 66+
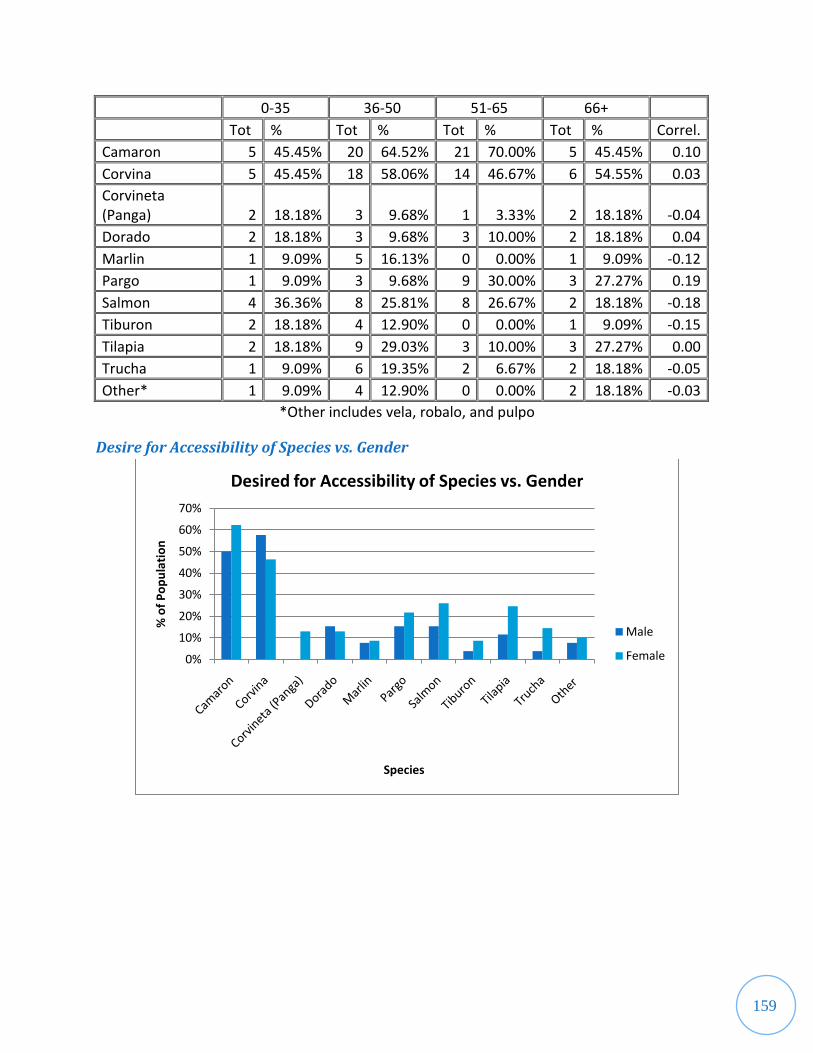
159
0-35 36-50 51-65 66+
Tot % Tot % Tot % Tot % Correl.
Camaron 5 45.45% 20 64.52% 21 70.00% 5 45.45% 0.10
Corvina 5 45.45% 18 58.06% 14 46.67% 6 54.55% 0.03
Corvineta (Panga) 2 18.18% 3 9.68% 1 3.33% 2 18.18% -0.04
Dorado 2 18.18% 3 9.68% 3 10.00% 2 18.18% 0.04
Marlin 1 9.09% 5 16.13% 0 0.00% 1 9.09% -0.12
Pargo 1 9.09% 3 9.68% 9 30.00% 3 27.27% 0.19
Salmon 4 36.36% 8 25.81% 8 26.67% 2 18.18% -0.18
Tiburon 2 18.18% 4 12.90% 0 0.00% 1 9.09% -0.15
Tilapia 2 18.18% 9 29.03% 3 10.00% 3 27.27% 0.00
Trucha 1 9.09% 6 19.35% 2 6.67% 2 18.18% -0.05
Other* 1 9.09% 4 12.90% 0 0.00% 2 18.18% -0.03
*Other includes vela, robalo, and pulpo
Desire for Accessibility of Species vs. Gender
0%
10%
20%
30%
40%
50%
60%
70%
% o
f P
op
ula
tio
n
Species
Desired for Accessibility of Species vs. Gender
Male
Female
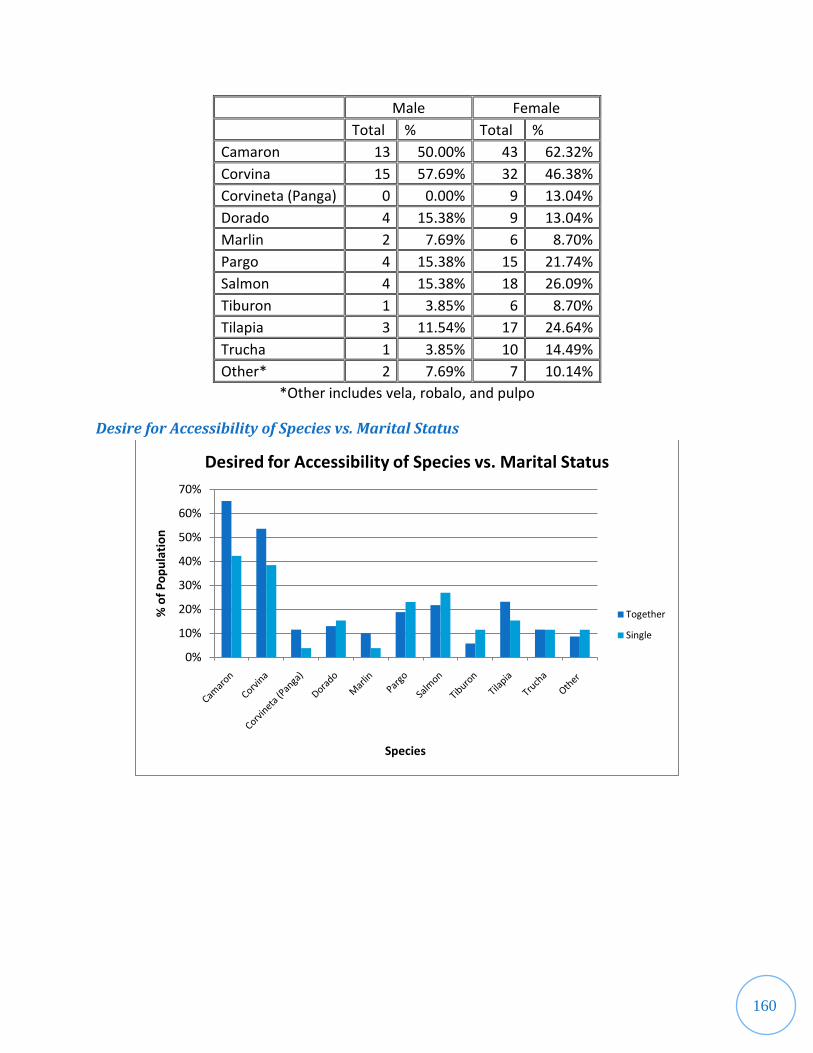
160
Male Female
Total % Total %
Camaron 13 50.00% 43 62.32%
Corvina 15 57.69% 32 46.38%
Corvineta (Panga) 0 0.00% 9 13.04%
Dorado 4 15.38% 9 13.04%
Marlin 2 7.69% 6 8.70%
Pargo 4 15.38% 15 21.74%
Salmon 4 15.38% 18 26.09%
Tiburon 1 3.85% 6 8.70%
Tilapia 3 11.54% 17 24.64%
Trucha 1 3.85% 10 14.49%
Other* 2 7.69% 7 10.14%
*Other includes vela, robalo, and pulpo
Desire for Accessibility of Species vs. Marital Status
0%
10%
20%
30%
40%
50%
60%
70%
% o
f P
op
ula
tio
n
Species
Desired for Accessibility of Species vs. Marital Status
Together
Single

161
Together Single
Total % Total %
Camarón 45 65.22% 11 42.31%
Corvina 37 53.62% 10 38.46%
Corvineta (Panga) 8 11.59% 1 3.85%
Dorado 9 13.04% 4 15.38%
Marlin 7 10.14% 1 3.85%
Pargo 13 18.84% 6 23.08%
Salmon 15 21.74% 7 26.92%
Tiburon 4 5.80% 3 11.54%
Tilapia 16 23.19% 4 15.38%
Trucha 8 11.59% 3 11.54%
Other* 6 8.70% 3 11.54%
*Other includes vela, robalo, and pulpo
Desire for Accessibility of Species vs. Employment
0%
10%
20%
30%
40%
50%
60%
70%
% o
f P
op
ula
tio
n
Species
Desired for Accessibility of Species vs. Employment
Employed
Unemployed
Pension

162
Employed Unemployed Pension
Total % Total % Total %
Camarón 30 55.56% 12 60.00% 12 63.16%
Corvina 28 51.85% 8 40.00% 9 47.37%
Corvineta (Panga) 2 3.70% 3 15.00% 3 15.79%
Dorado 7 12.96% 3 15.00% 3 15.79%
Marlin 4 7.41% 2 10.00% 2 10.53%
Pargo 8 14.81% 6 30.00% 4 21.05%
Salmon 16 29.63% 2 10.00% 4 21.05%
Tiburon 4 7.41% 0 0.00% 3 15.79%
Tilapia 10 18.52% 4 20.00% 6 31.58%
Trucha 6 11.11% 2 10.00% 3 15.79%
Other* 5 9.26% 1 5.00% 3 15.79%
*Other includes vela, robalo, and pulpo
Desire for Accessibility of Species vs. Education
0%
10%
20%
30%
40%
50%
60%
70%
80%
90%
100%
% o
f P
op
ula
tio
n
Species
Desire for Accessibility of Species vs. Education
None
Primary
Secondary
Technical
University

163
None Primary Secondary Technical University
Tot % Tot % Tot % Tot % Tot % Correl.
Camarón 1 33.33% 10 50.00% 12 66.67% 11 68.75% 21 60.00% 0.09
Corvina 0 0.00% 8 40.00% 9 50.00% 11 68.75% 17 48.57% 0.13
Corvineta (Panga) 0 0.00% 1 5.00% 2 11.11% 2 12.50% 4 11.43% 0.09
Dorado 0 0.00% 2 10.00% 1 5.56% 3 18.75% 7 20.00% 0.16
Marlin 0 0.00% 2 10.00% 1 5.56% 2 12.50% 3 8.57% 0.02
Pargo 1 33.33% 3 15.00% 5 27.78% 5 31.25% 5 14.29% -0.05
Salmon 0 0.00% 2 10.00% 3 16.67% 5 31.25% 12 34.29% 0.25
Tiburon 0 0.00% 3 15.00% 0 0.00% 1 6.25% 3 8.57% -0.02
Tilapia 1 33.33% 2 10.00% 5 27.78% 4 25.00% 8 22.86% 0.06
Trucha 0 0.00% 1 5.00% 1 5.56% 4 25.00% 5 14.29% 0.15
Other* 0 0.00% 4 20.00% 0 0.00% 3 18.75% 2 5.71% -0.08
*Other includes vela, robalo, and pulpo
Appendix E.4.f: Comparisons against Amount Consumed
Amount Consumed vs. Age
Age Average (kg. per week)
Standard Deviation
0-35 1.39 0.80
36-50 1.23 0.79
51-65 1.46 0.78
66+ 1.00 0.50
Correlation: -0.12
Amount Consumed vs. Gender
Gender Average (kg. per week) Standard Deviation
Male 1.49 0.88
Female 1.28 0.70
Amount Consumed vs. Marital Status
Marital Status Average (kg. per week)
Standard Deviation
Together 1.38 0.74
Single 1.24 0.81
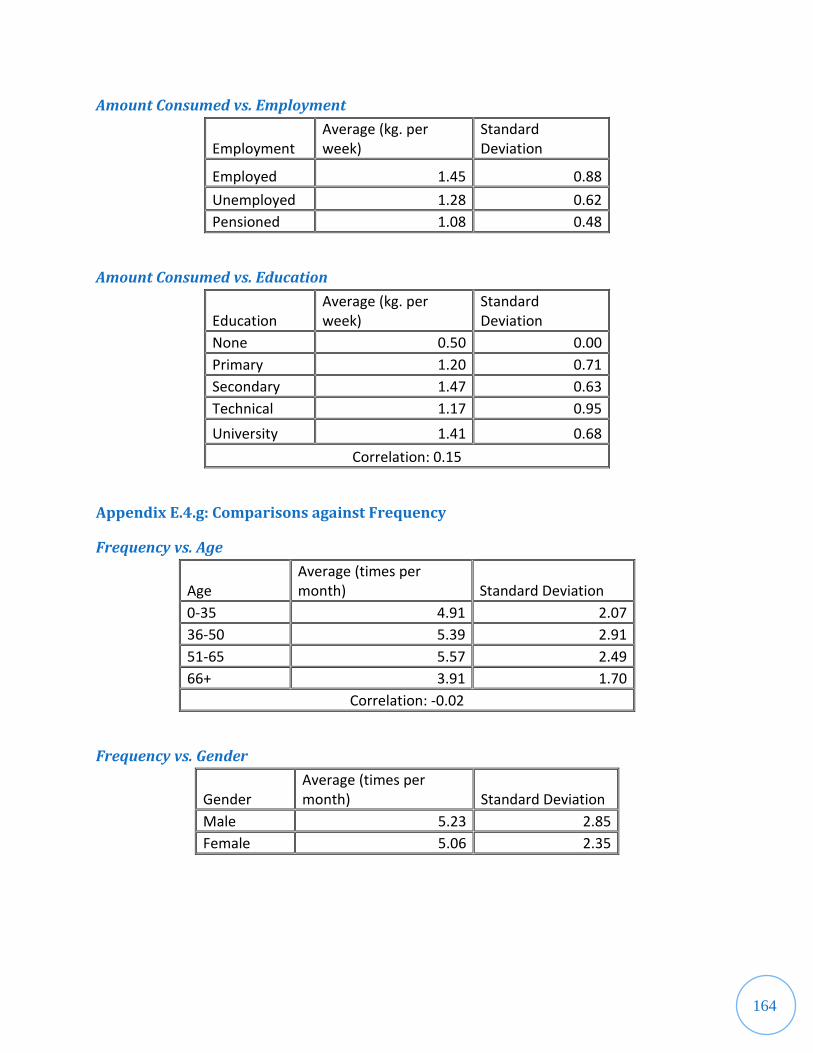
164
Amount Consumed vs. Employment
Employment Average (kg. per week)
Standard Deviation
Employed 1.45 0.88
Unemployed 1.28 0.62
Pensioned 1.08 0.48
Amount Consumed vs. Education
Education Average (kg. per week)
Standard Deviation
None 0.50 0.00
Primary 1.20 0.71
Secondary 1.47 0.63
Technical 1.17 0.95
University 1.41 0.68
Correlation: 0.15
Appendix E.4.g: Comparisons against Frequency
Frequency vs. Age
Age Average (times per month) Standard Deviation
0-35 4.91 2.07
36-50 5.39 2.91
51-65 5.57 2.49
66+ 3.91 1.70
Correlation: -0.02
Frequency vs. Gender
Gender Average (times per month) Standard Deviation
Male 5.23 2.85
Female 5.06 2.35
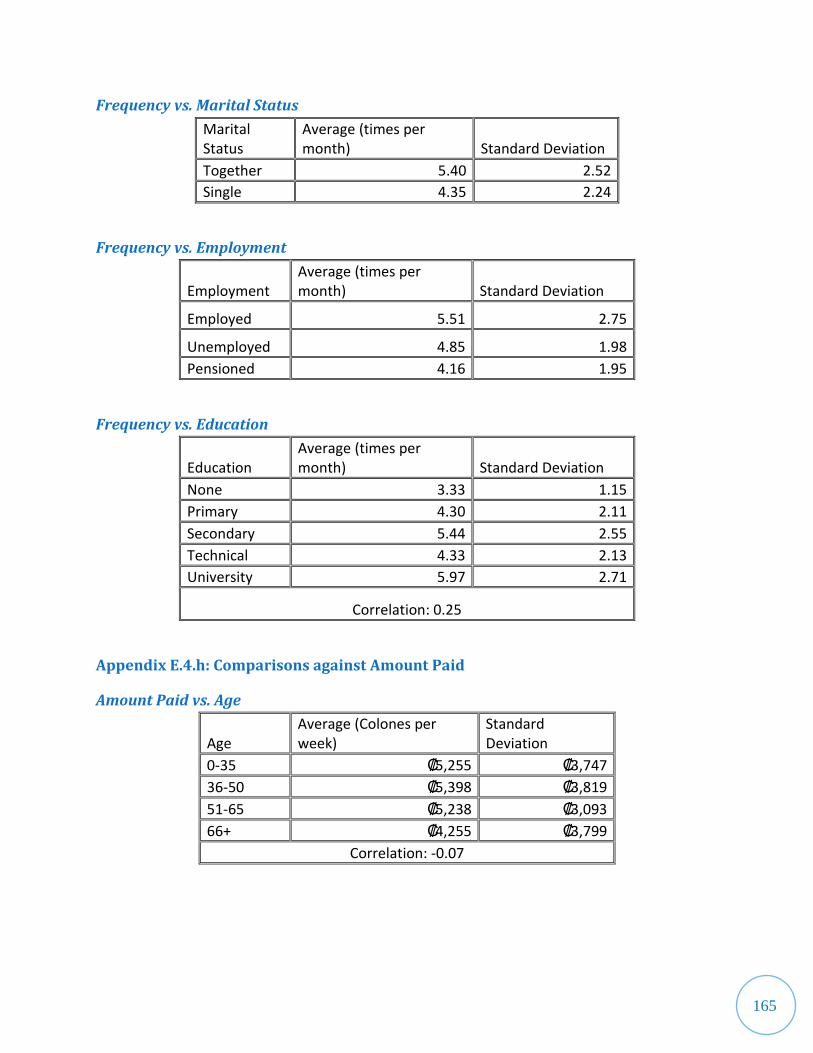
165
Frequency vs. Marital Status
Marital Status
Average (times per month) Standard Deviation
Together 5.40 2.52
Single 4.35 2.24
Frequency vs. Employment
Employment Average (times per month) Standard Deviation
Employed 5.51 2.75
Unemployed 4.85 1.98
Pensioned 4.16 1.95
Frequency vs. Education
Education Average (times per month) Standard Deviation
None 3.33 1.15
Primary 4.30 2.11
Secondary 5.44 2.55
Technical 4.33 2.13
University 5.97 2.71
Correlation: 0.25
Appendix E.4.h: Comparisons against Amount Paid
Amount Paid vs. Age
Age Average (Colones per week)
Standard Deviation
0-35 ₡5,255 ₡3,747
36-50 ₡5,398 ₡3,819
51-65 ₡5,238 ₡3,093
66+ ₡4,255 ₡3,799
Correlation: -0.07

166
Amount Paid vs. Gender
Gender Average (Colones per week)
Standard Deviation
Male ₡5,865 ₡5,481
Female ₡5,239 ₡3,404
Amount Paid vs. Marital Status
Marital Status
Average (Colones per week)
Standard Deviation
Together ₡5,847 ₡4,230
Single ₡4,413 ₡3,530
Amount Paid vs. Employment
Employment Average (Colones per week)
Standard Deviation
Employed ₡5,805 ₡4,613
Unemployed ₡5,325 ₡3,120
Pensioned ₡4,325 ₡3,488
Amount Paid vs. Education
Education Average (Colones per week)
Standard Deviation
None ₡2,167 ₡611
Primary ₡4,179 ₡3,117
Secondary ₡5,103 ₡2,243
Technical ₡5,914 ₡4,329
University ₡6,077 ₡4,916
Correlation: 0.23

167
Appendix F: Notes from Interview with Marco Freer
Species that they commercialize: Shrimp, Sea Bass, Panga, Mahi Mahi, Salmon, Snapper, Shark,
Tilapia, Trout
Species not commercialized: Marlin, SwordFish
o Stopped commercialization 3 years ago
o They are in danger of extinction because of the adoption of the environmental
policy of sustainable development
Target population: Housewives; they are the ones who shop in different markets.
Process the food to produce products in different output forms: Filet, Sausages, Food mixes,
Smoked fish.
Fish consumption is low in Costa Rica compared to other countries mainly because of high
prices.
Costa Rica imports fish for local use at a comparatively lower price than it exports
Developing countries(for example: Countries of Latin America) are mostly producers and
export to other countries; Locals don‟t buy the fish because of the high price on the local
market; Developed countries are consumers of fish products
o Consumption of fish per person in Costa Rica: (7-8) kg/ year
o Consumption of fish per person in Latin America: 15 kg/ year
o Consumption of fish per person in Japan: (70-80) kg/ year
The fish sector is very problematic right now. The key to the problem are the producers and
farmers and their revenue. If they produce a bigger quantity of product, the price on the
market will be cheaper.
The demand of fish depends on the time period, the supply, the quality and the prices charged.
o For instance, due to a problem in Chile the production of Salmon decreased
from 6000 kg/month to 500 kg/ month. Larger fish died increasing the
production and exportation of smaller fish to Costa Rica. Thus it was cheaper to
import fish at that time.
Methods to promote and market the fish products at Wal-Mart:
o Target area: Point of Purchase (Punto de Venta)
o Use of brochures on what to buy, recipes, competition and tasting of products
Wal-Mart focuses mostly on two main ideas to promote the fish products

168
o Health Benefits
The consumers are well aware of the benefits of eating fish (good blood
circulation). A clean and hygienic product is important for positively
benefiting from the product.
o Aquaculture
Wal-Mart has a policy of sustainability. Cultivated products have to be
produced using good practices which have been certified internationally.
It is too costly for countries of South America to certify marine products.
Environmental Issues
o There are specific seasons to buy protected species
Social Issues
o Promote responsible fishing, small farming projects along with NGOs (Non-
governmental organizations)
According to statistics from the FAO, if there were no aquaculture production, there would
not be enough fish for World Consumption. Further, the FAO states that in the near future,
the production of marine products will be stagnant while aquaculture production will increase.
The aquaculture industry will help in meeting the increasing demand for fish for World
Consumption. At the moment, the aquaculture industry accounts for 50% of the World Fish
Production.
Costa Rica exports the most fish from Central American Countries. Costa Rica is situated at a
strategically important point, near the United States, Mexico and Canada which are important
consumer nations.
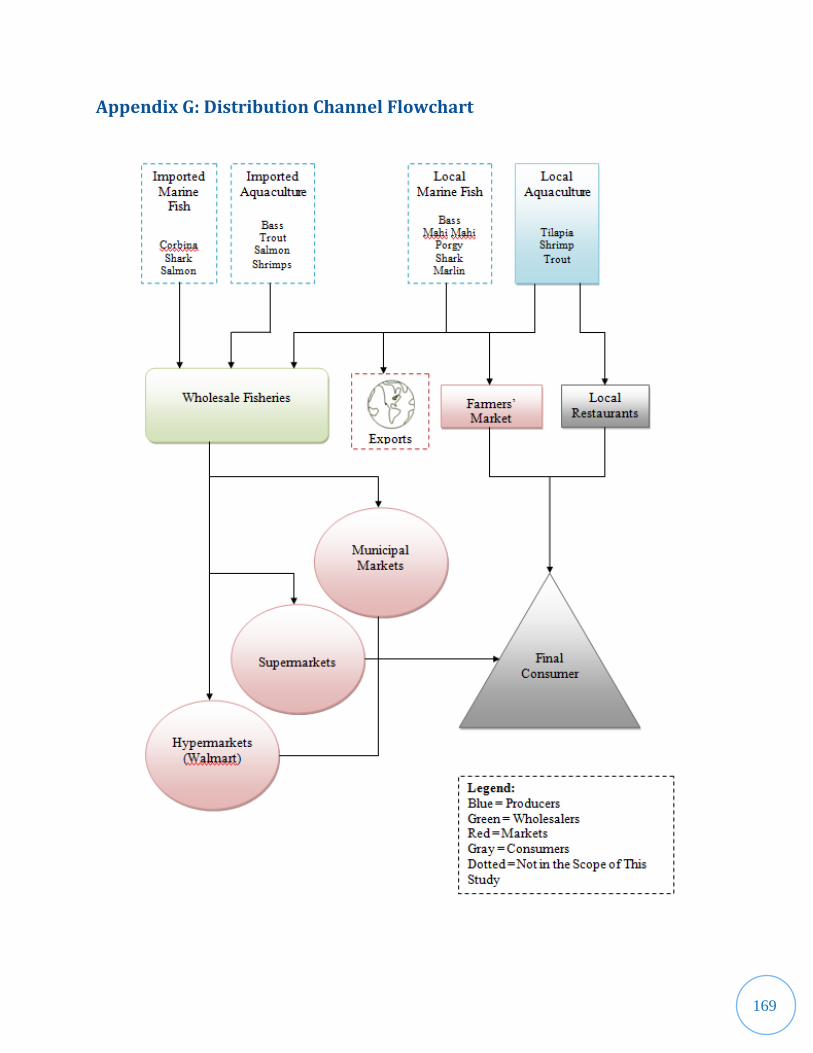
169
Appendix G: Distribution Channel Flowchart