Assessing the Value of Regulation Resources Based on Their Time Response · PDF...
83
Assessing the Value of Regulation Resources Based on Their Time Response Characteristics Y.V. Makarov J. Ma S. Lu T.B. Nguyen June 2008 Prepared for: California Energy Commission, Public Interest Energy Research Program, under Work for Others Contract No. 500-05-001. Coordinated by the Consortium for Electric Reliability Technol- ogy Solutions, Subcontract No. 6805591. PNNL - 17632
Transcript of Assessing the Value of Regulation Resources Based on Their Time Response · PDF...

Assessing the Value of Regulation Resources Based on Their Time Response Characteristics Y.V. Makarov J. Ma S. Lu T.B. Nguyen June 2008 Prepared for: California Energy Commission, Public Interest Energy Research Program, under Work for Others Contract No. 500-05-001. Coordinated by the Consortium for Electric Reliability Technol-ogy Solutions, Subcontract No. 6805591.
PNNL - 17632

DISCLAIMER
This report was prepared as an account of work sponsored by an agency of the United States Government. Neither the United States Government nor any agency thereof, nor Battelle Memorial Institute, nor any of their employees, makes any warranty, express or implied, or assumes any legal liability or responsibility for the accuracy, completeness, or usefulness of any infor-mation, apparatus, product, or process disclosed, or represents that its use would not infringe privately owned rights. Reference herein to any specific commercial product, process, or service by trade name, trademark, manufac-turer, or otherwise does not necessarily constitute or imply its endorsement, recommendation, or favoring by the United States Government or any agency thereof, or Battelle Memorial Institute. The views and opinions of authors ex-pressed herein do not necessarily state or reflect those of the United States Government or any agency thereof.
PACIFIC NORTHWEST NATIONAL LABORATORY
operated by BATTELLE
for the UNITED STATES DEPARTMENT OF ENERGY
under Contract DE-AC05-76RL01830
Printed in the United States of America
Available to DOE and DOE contractors from the Office of Scientific and Technical Information,
P.O. Box 62, Oak Ridge, TN 37831-0062; ph: (865) 576-8401 fax: (865) 576-5728
email: [email protected]
Available to the public from the National Technical Information Service, U.S. Department of Commerce, 5285 Port Royal Rd., Springfield, VA 22161
ph: (800) 553-6847 fax: (703) 605-6900
email: [email protected] online ordering: http://www.ntis.gov/ordering.htm
This document was printed on recycled paper. (8/00)
Assessing the Value of Regulation Resources Based on Their Time Response Characteristics Y.V. Makarov J. Ma S. Lu T. B. Nguyen June 2008 Prepared for California Energy Commission, Public Interest Energy Re-search Program, under Work for Others Contract No. 500-05-001. Coordinated by the Consortium for Electric Reli-ability Technology Solutions, Subcontract No. 6805591.
Pacific Northwest National Laboratory Richland, Washington 99352

iii
Abstract Fast responsive generation, demand control and energy storage are valuable power sys-tem regulation resources because they allow controls to be applied at the exact moment and in the exact amount needed. Faster control could potentially provide more reliable compliance with the North American Electric Reliability Corporation (NERC) Control Performance Standards (CPS) [1] at relatively lesser regulation capacity procurements. The current California Independent System Operator (ISO) practices and markets do not provide a differentiation among the regulation resources based on their speed of response (with the exception of some capacity bid limitations applied to generators with minimum ramping capability). California ISO practices and markets could be updated to enable more fast regulation resources into the California ISO service area.
This project meets the following objectives:
! Develop methodology to assess the relative value of generation resources used for regulation and load-following California ISO functions. This assessment was done based on physical characteristics of the California ISO regulating units in-cluding the ability to quickly change their output following California ISO signals
! Evaluate what power is worth on different time scales
! Analyze the benefits of new regulation resources to provide effective compliance with the mandatory NERC Control Performance Standards [1]
! Evaluate impacts of the newly proposed balancing authority (BA) area control er-ror (ACE) limit (BAAL) [3] and frequency responsive reserve (FRR) [5] stan-dards on the value of fast regulation resources
! Develop a scope for follow-up projects to pave a road for the new efficient types of balancing resources in California.
The work described in this report was coordinated by the Consortium for Electric Re-
liability Technology Solutions with funding provided by the California Energy Commis-sion, Public Interest Energy Research Program, under the direction of Joseph H. Eto, Lawrence Berkeley National Laboratory, CERTS Program Office.
The work has been conducted at the Pacific Northwest National Laboratory (PNNL) by the project manager and principal investigator Yuri V. Makarov and other PNNL partici-pants including Jian Ma, Shuai Lu and Tony B. Nguyen. The California ISO support team included David L. Hawkins, Clyde Loutan, Sirajul Chowdhury, Tim VanBlaricom, and others.

iv
The work included the following tasks:
! Perform California ISO regulating units’ characteristics analysis
! Perform automatic generation systems’ (AGC) analysis
! Perform regulation procurement and market analysis
! Perform fast regulation efficiency analysis
! Project the load-following and regulation requirements into the future
! Determine the value of fast responsive resources depending on their ramping ca-pability
! Identify the potential impacts of the balancing authority area control error limit, which is a part of the newly proposed NERC standard “Balancing Resources and Demand” [3]
! Identify potential impacts of the Western Electricity Coordinating Council (WECC) frequency responsive reserve standard [5]
! Provide recommendations for the next phase of the project.
The following main conclusions and suggestions for the future have been made:
! Our analysis of regulation ramping requirements shows that the regulation system should be able to provide ramps of between 40 and 60 MW per minute for a pe-riod up to 6 minutes. This requirement appears to be not fully consistent with the actual ramp-duration characteristics of the California ISO regulating system. De-pending on the California ISO interest and availability of additional information, a further analysis could be conducted to determine whether this discrepancy really takes place, how damaging it could be to the California ISO performance, whether resolving this issue could help to minimize the regulation procurement, and which measures could be suggested to mitigate it
! Determine if changes may be needed in the California ISO AGC system to effec-tively accommodate new types of fast regulation resources and minimize the Cali-fornia ISO regulation procurement
! The existing heuristic experience-based approach to calculating the required regu-lation procurement could be supplemented and verified against the more “scien-tific” method proposed in this report. This will result in minimizing the regulation procurement by better differentiation between the operating hours during a day and better adaptation to changing seasonal and monthly operating conditions
! Ramping and ramp duration requirements evaluated in this report could be useful additions to the California ISO Ancillary Service Procurement Operating Proce-dure [6]
! The California ISO might be willing to analyze advantages, disadvantages, and options for incorporating the ramping consideration into the ancillary service market design and settlement process (pricing). The California ISO may consider

v
creating better market opportunities for and incentives for fast responsive re-sources
! Develop a method for smooth transition between operating hours. The California ISO should consider whether the changing number and composition of the regu-lating units between the hours that pose performance problems or will pose prob-lems in the future
! An additional study of low probability high ramp events should be performed by the California ISO
! The California ISO may be willing to consider establishing a more relaxed target CPS2 (Control Performance Standard 2) compliance level. This measure, along with a more scientific analysis of regulation requirements could help to signifi-cantly minimize the regulation requirements without compromising the California ISO performance characteristics
! A BAAL-related study is recommended for the California ISO as soon as more clarity is achieved concerning the actual enforcement of the BAAL standard and its numerical values for the California ISO. The study may involve an assessment of advantages of the distributed frequency-based control for the California ISO system. The market-related issues that arise in this connection should also be in-vestigated
! A FRR-related study is recommended for the California ISO as soon as more clar-ity is achieved concerning the actual enforcement of the FRR standard and its numerical values for the California ISO.

vi
Purposely left blank for pagination
vii
Summary
The project work was pursuing the following objectives:
! Develop methodology to assess the relative value of generation resources used for regulation and load following California ISO functions
! This assessment should be done based on physical characteristics including the ability to quickly change their output following California ISO signals
! Evaluate what power is worth on different time scales
! Analyze the benefits of new regulation resources to provide effective compliance with the mandatory NERC Control Performance Standards [1]
! Develop a scope for the follow-up projects to pave a road for the new efficient types of balancing resources in California.
The work described in this report was coordinated by the Consortium for Electric Reli-ability Technology Solutions with funding provided by the California Energy Commis-sion, Public Interest Energy Research Program, under the direction of Joseph H. Eto, Lawrence Berkeley National Laboratory, CERTS Program Office.
Data Sources The following data sources have been used:
! California ISO operating procedures, training materials, presentations, and other information available at http://www.caiso.com
! Interviews and discussions with the California ISO engineers, consultants and managers (S. Chowdhury, C. Loutan, D. L. Hawkins, T. VanBlaricom, T. Yong, H. Alarian, J. Blatchford, J. Wong, P. De Mello, T. Wang, and others)
! California ISO open access same-time information system (OASIS) data available at http://oasis.caiso.com/
! California ISO real time information provided in process information (PI) process books
! 4-second California ISO data provided for the first 10 days of June, 2005
! California ISO 5-minute automatic dispatch system data for 2006
! California ISO real time data for each season of 2006 extracted from the Califor-nia ISO PI database (1-minute resolution) and other databases
! Projected 2010 data (1-minute resolution) used in the project “Integration of re-newable resources: Transmission and operating issues and recommendations for integrating renewable resources on the California ISO-controlled grid” [2], [34]
! Some other results and factual data used in [2].
viii
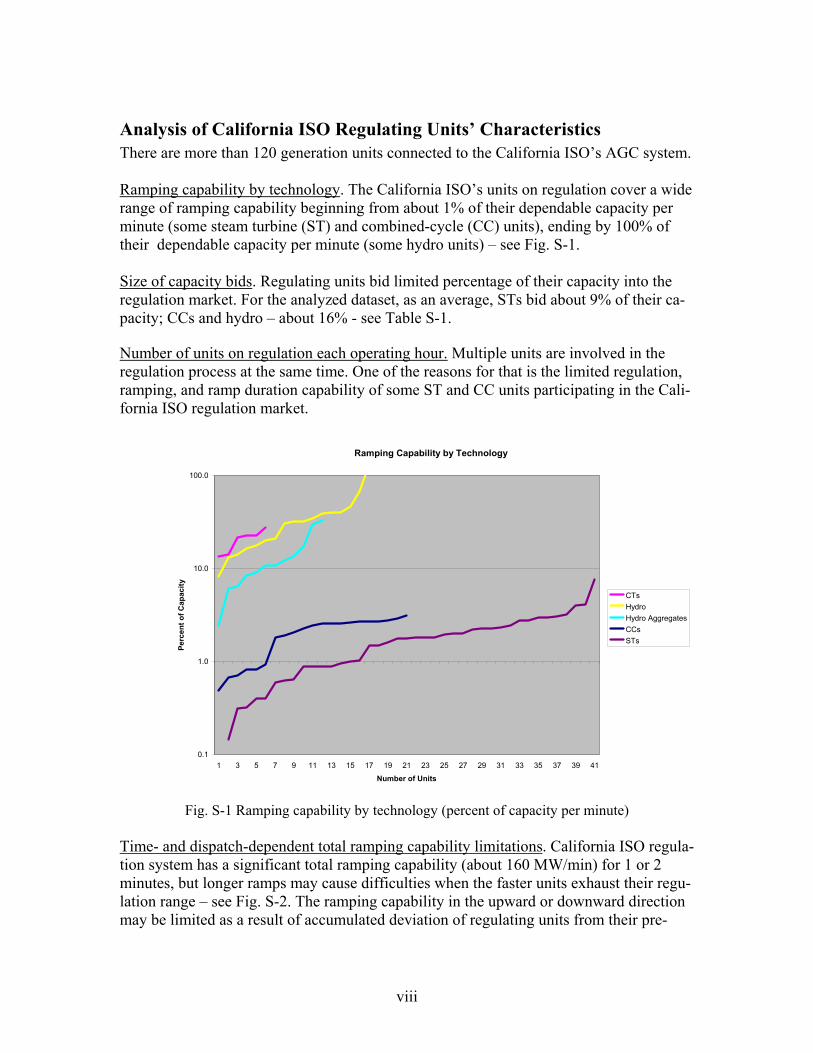
Analysis of California ISO Regulating Units’ Characteristics There are more than 120 generation units connected to the California ISO’s AGC system. Ramping capability by technology. The California ISO’s units on regulation cover a wide range of ramping capability beginning from about 1% of their dependable capacity per minute (some steam turbine (ST) and combined-cycle (CC) units), ending by 100% of their dependable capacity per minute (some hydro units) – see Fig. S-1. Size of capacity bids. Regulating units bid limited percentage of their capacity into the regulation market. For the analyzed dataset, as an average, STs bid about 9% of their ca-pacity; CCs and hydro – about 16% - see Table S-1.
Number of units on regulation each operating hour. Multiple units are involved in the regulation process at the same time. One of the reasons for that is the limited regulation, ramping, and ramp duration capability of some ST and CC units participating in the Cali-fornia ISO regulation market.
Ramping Capability by Technology
0.1
1.0
10.0
100.0
1 3 5 7 9 11 13 15 17 19 21 23 25 27 29 31 33 35 37 39 41
Number of Units
Perc
ent o
f Cap
acity
CTsHydroHydro AggregatesCCsSTs
Fig. S-1 Ramping capability by technology (percent of capacity per minute)
Time- and dispatch-dependent total ramping capability limitations. California ISO regula-tion system has a significant total ramping capability (about 160 MW/min) for 1 or 2 minutes, but longer ramps may cause difficulties when the faster units exhaust their regu-lation range – see Fig. S-2. The ramping capability in the upward or downward direction may be limited as a result of accumulated deviation of regulating units from their pre-

ix
ferred point of operation (POP). If all faster units deviate from their POP in one direction, the overall AGC system ramping capability in this direction can be significantly limited.
Table S-1 Example of regulation capacity bids and average duration of highest ramp
Unit Type Percent of Units Dependable Capacity on
Regulation, % Duration of Highest
Ramp, min
ST 9.4 3.9
CC 16.0 5.4
Hydro aggregate 16.2 1.9
Hydro 16.7 0.9
CT N/A N/A
California ISO AGC Ramp-Duration Characteristic (Hour Ending by 2 pm, Summer day)
-150.0
-100.0
-50.0
0.0
50.0
100.0
150.0
200.0
250.0
6.56.05.55.04.54.03.53.02.52.01.51.00.5
Duration, min
Ram
ping
Cap
acity
, MW
/min
Regulation UpRegulation Down
Fig. S-2 Example of California ISO ramp-duration characteristic
The analysis of regulation ramping requirements conducted in this study shows that the regulation system should be able to provide ramps of between 40 and 60 MW per minute for a period up to 6 minutes – see Fig. S-3. This requirement is not fully consistent with the actual ramp-duration characteristic presented in Fig. S-2. Depending on the California ISO interest and availability of additional information, a further analysis could be con-ducted to determine if this discrepancy really takes place, how damaging it could be to the California ISO performance, whether resolving this issue could help to minimize the regulation procurement, and which measures could be suggested to mitigate it.

x
California ISO Automatic Generation System Analysis Balancing process. In the California ISO system, the processes of achieving the balance between generation and load demand consist of day-ahead schedule, hour-ahead sched-ule, real time dispatch and AGC regulation. Day-ahead and hour-ahead schedules are hourly block energy schedules including the 20-minute ramps between the hours.
Load-following process. The load-following process is implemented as real time dispatch process conducted by the California ISO market applications using 15-minute intervals for unit commitment and 5-minute interval for economic dispatch. Units start to move toward the new dispatch operating target (DOT) 2.5 minutes before the interval begins. They are required to reach the new DOT in the middle of the interval (2.5 minutes after its beginning).
0 1 2 3 4 5 6 7 80
20
40
60
80
100
120
140
Max R
amp R
ates,
Inc/U
p, MW
/min
Regulation, Summer, Year 2010 vs. 2006, Hour 8, 9, 10
2006 Non Wind2006 Wind2010 Non Wind2010 Wind
0 1 2 3 4 5 6 7 8−120
−100
−80
−60
−40
−20
0
Duration (min)
Max R
amp R
ates,
Dec/D
own,
MW/m
in
Fig. S-3 Duration – ramp rate diagram for hour ending by 7, 8 and 9 with wind and without wind
in 2006 and 2010
Treatment of faster and slower regulating units. Within the AGC economic control zone, fast units with high ramp rates are called on first. Then slower units are dispatched. In other words, fast units take more of the regulation responsibility at the beginning, and then the regulation requirement will be evenly distributed. The ramp limiters prevent the California ISO from using setpoint signals exceeding the maximum ramping capability of a unit.
The California ISO AGC system is oriented to handle operating characteristics of con-ventional regulation resources including their limited ramping capability and virtually unlimited energy. These characteristics are different for some new types of potential

xi
regulating resources, such as flywheel or battery energy storage (providing dramatically better ramping capability but limited energy storage capability). Challenge posed by fast responsive resources. New regulating resources with very fast response time will allow implementing more efficient AGC algorithms that would help to minimize the regulation needs in the California ISO service area. Changes may be re-quired in the existing California ISO AGC system and its algorithms to accommodate some types of new regulation resources.
Suggestion. Evaluate if changes are needed in the California ISO AGC system to effec-tively accommodate new types of fast regulation resources and minimize the California ISO regulation procurement.
California ISO Regulation Procurement and Market Regulation procurement. California ISO uses a ±350-MW base procurement for its regu-lation up and regulation down needs. The average actual regulation usage for each of the 24 hours of a 7-day period, plus 25%, is used as a benchmark. An additional 2% is ap-plied for each CPS2 violation. A ±600 MW ceiling is enforced. This ceiling can be ex-ceeded because of the 2% increments caused by CPS2 violations.
Regulation capacity market. The California ISO regulation capacity procurement is made in the day-ahead (clears 10:00 am 1 day-ahead of the trading day) and real time markets (clears 75 minutes before the operating hour). Both are capacity markets; that is, regulat-ing units are paid based on their capacity, expressed in MWs, but not for the energy that they provide for the regulation service.
Treatment of faster and slower units. Regulation market does not make a favorable price difference for faster regulating units. The units are settled based on their capacity (if they are awarded regulation service). Slower units are restricted in their MW bids by the amount of regulation that can be delivered in 10 minutes (which depends on their ramp rates and, additionally for the regulation up service, on spinning and non-spinning and spinning reserve capacity provided by a particular unit). Because the California ISO has multiple slower units participating in the regulation market, this bidding capacity restric-tion may result in multiple regulation service awards made for each operating hour.
Additional market impact on the units’ regulation stress. When moving from one operat-ing hour to another operating hour, the number and composition of units providing regu-lation service can be changed. The units that are not providing regulation service any longer for the hour are moving to their POP, the units that are starting to provide regula-tion service this hour are substituting for the units that are not awarded service for the hour. For slower units, it may take up to 10 minutes to catch up with the change. The problem becomes more noticeable under the market redesign and technology upgrade (MRTU) design, where the real time unit commitment is performed for 15-minute inter-vals instead of 1-hour intervals. This creates more need for faster regulation services.
Suggestions.

xii
! More “scientific” approach to procure regulation service. The existing heuristic experience-based approach to calculating the required regulation procurement could be supplemented and verified against the more “scientific” method pro-posed in this report. This could result in minimizing the regulation procurement by better differentiation between the operating hours during a day and better adap-tation to changing seasonal and monthly operating conditions
! Operating procedures. Ramping and ramp duration requirements could be useful additions to the California ISO Ancillary Service Procurement Operating Proce-dure [6]
! Incorporating ramping considerations in pricing the ancillary services. The Cali-fornia ISO might be willing to analyze advantages, disadvantages, and options for incorporating the ramping consideration into the ancillary service market design and settlements (pricing)
! Smooth transition between operating hours. The California ISO may be interested in whether the changing number and composition of the regulating units between the hours pose performance problems or will pose problems in the future.
Efficiency of Fast Regulation Comparison with the hydro units. An ideal fast responding resource (a resource with in-stantaneous response and unlimited energy) is about 1.7 times more efficient than the av-erage hydro power units used for regulation. This means that 1 MW of “ideal” regulation capacity can substitute 1.7 MW of average hydro power regulation capacity.
Comparison with the combustion turbines. Ideal regulation capacity is 2.7 times more efficient than the average combustion turbine capacity.
Comparison with the steam turbines. Steam turbines have very low relative efficiency comparing to the “ideal” regulation resources. Their average efficiency index is about 29.
Comparison with the combined-cycle units. Combined-cycle units have relative effi-ciency similar to STs.
Impact of limited energy. Energy limitations decrease the relative efficiency of fast re-sponsive resources. The analysis done for flywheel energy storage shows that the fly-wheel regulation resource is somehow less efficient when the fastest hydro units, but it is still significantly more efficient than most of the hydro units in California. Flywheel en-ergy storage has high relative efficiency comparing with CTs, STs, and CCs.
Expected reduction of the California ISO regulation procurement as a result of fast regu-lation resources. Faster responsive resources can help to reduce California ISO’s regula-tion procurement by up to 40% (on average).
Suggestion. California ISO may consider creating better market opportunities and incen-tives for fast responsive resources.

xiii
Projection of California ISO Load-Following and Regulation Require-ments into the Future A significant increase in the California ISO ramping capability requirement is not ex-pected in the course of routine day-to-day operations. At the same time, the study con-ducted did not address very low probability “tail” events, with their potential for appear-ance of very high ramps.
Load-following. It is expected that the maximum upward and downward load-following ramping requirements in 2010 will increase by +40 MW/minute and –40 MW/minute, respectively. Although this is an insignificant increase, for the purposes of this study, it is important that the upward ramp duration is required for approximately 30 minutes, while the downward ramp duration will be required for approximately 20 minutes. This means that the ISO supplemental energy units must be able to provide longer ramps.
Regulation. It is expected that the maximum upward regulation ramping requirements for summer 2010 will increase by 10 MW/min. The maximum downward regulation re-quirement in 2010 is expected to increase by 18 MW/min. The regulation ramp duration is expected to increase by about ±10 to ±25 MW/min and could last for about 5 minutes.
Suggestion. An additional study of low probability, high ramp events is recommended to the California ISO.
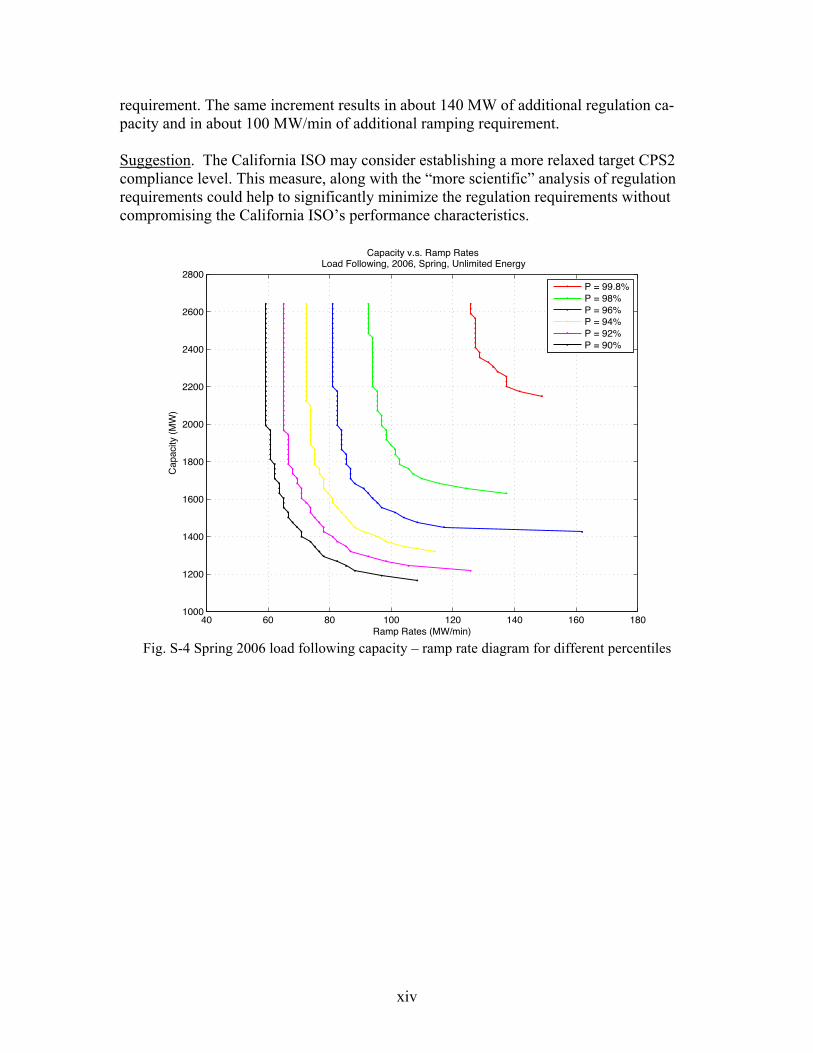
Value of Fast Responsive Resources Depending on Ramping Capability Dependence of capacity requirements on ramping capability requirements. The depend-ence of capacity requirements on ramping capability requirements has a hyperbolic shape signifying an extremely sharp increase of the capacity requirements when the maximum ramping capability is reduced below certain lower threshold. For instance, for the 98% percentile1, this level is about 110 MW/min for load following and about 45 MW/min for regulation requirements. On the other hand, there is an important upper threshold after which a further increase of the ramping capability does not provide a noticeable decrease in required capacity. For example, for the same 98% percentile, these values are about 140 MW/min for load following and only about 55 MW/min for regulation. These thresh-olds are actually way below the year 2006 maximum ramping capability of between 210 and 230 MW/min for load following and 160 MW/min for regulation – see Fig. S-4…Fig. S-6.. Impact of the desired percentile. The desired percent of the cases, where the load-following and regulation systems are capable of meeting the capacity, ramping, and en-ergy requirements, strongly influences the required amounts of the corresponding pro-curements. A percentile’s increase from 90% to 99.8% results in about 1000 MW of addi-tional load-following capacity, and in about 65 MW/min of additional ramping capability
1 The percentile approach is used in this study to reflect the probability of meeting the regulation and load- following needs in terms of the capacity, ramping capability, ramp duration, and energy requirements.
xiv
requirement. The same increment results in about 140 MW of additional regulation ca-pacity and in about 100 MW/min of additional ramping requirement. Suggestion. The California ISO may consider establishing a more relaxed target CPS2 compliance level. This measure, along with the “more scientific” analysis of regulation requirements could help to significantly minimize the regulation requirements without compromising the California ISO’s performance characteristics.
40 60 80 100 120 140 160 1801000
1200
1400
1600
1800
2000
2200
2400
2600
2800
Capacity v.s. Ramp Rates Load Following, 2006, Spring, Unlimited Energy
Ramp Rates (MW/min)
Capa
city
(MW
)
P = 99.8%P = 98%P = 96%P = 94%P = 92%P = 90%
Fig. S-4 Spring 2006 load following capacity – ramp rate diagram for different percentiles

xv
0 50 100 150 200 250 300 350150
200
250
300
350
400
450
Capacity v.s. Ramp Rates Regulation, 2006, Spring, Unlimited Energy
Ramp Rates (MW/min)
Capa
city
(MW
)
P = 99.8%P = 98%P = 96%P = 94%P = 92%P = 90%
Fig. S-5 Spring 2006 regulation capacity – ramp rate diagram for different percentiles
50 100 150 200 250 300 350 400 450
300
400
500
600
700
800
900
1000
1100
Capacity v.s. Ramp Rates Regulation, 2006, Spring
Ramp Rates (MW/min)
Capa
city
(MW
)
E = 5880 (MWH)E = 5950 (MWH)E = 6050 (MWH)E = Unlimited
Fig. S-6 Spring 2006 regulation capacity – ramp rate diagram for different energy levels

xvi
Potential Impacts of BAAL Standard The balancing authority ACE limit standard is a part of a new set of control performance standards currently under development at NERC [3]. BAAL is designed to replace CPS2. It establishes frequency-dependent ACE limits.
The following important considerations outlining potential impacts of the BAAL standard on the value of fast regulation resources can be foreseen at this moment:
! A control that opposes frequency deviations always improves area performance against the BAAL. This means that the new standard will not have potential prob-lems with compliance if the regulating resources are controlled based on the local frequency signals rather than AGC signals
! Distributed resources that react to local frequency signals will contribute to BAAL compliance without being connected to the CAISO control signal. This would dramatically increase opportunities for distributed resources and decrease associated costs (as a result of eliminating telemetry systems connecting the AGC system with distributed resources)
! BAAL is designed to replace CPS2 standard – no controversy is expected from interaction of local frequency-based controls with the CPS2 requirements
! Unlike the CPS2 standard formulated for 10-minute averages of ACE, the BAAL standard is formulated for instantaneous values of the area control error. This could noticeably increase the value of fast responsive controls to avoid potential BAAL violations
! Several control areas (for instance, Southern Company) are currently participating in an experiment to check the performance of BAAL
! California ISO is not participating in the experiment. The actual numeric values for the California ISO BAAL limits have not been established yet
! Expectation is that the BAAL standard will relax the area regulation needs and reduce the regulation burden
! The BAAL standard is currently experiencing some acceptance problems within the industry. Its future is not yet clear.
Suggestions.
! A BAAL-related study is recommended for the California ISO as soon as more clarity is achieved concerning the actual enforcement of the BAAL standard and its numerical values for the California ISO
! The study may involve an assessment of advantages of the distributed frequency-based control for the CAISO system
! The market-related issues that arise in this connection can also be investigated.
xvii
Potential Impacts of FRR Standard Frequency responsive reserve (FRR) is spinning reserve responsive to frequency. WECC is considering a possibility to introduce a FRR standard in Western Interconnection [33]. The purpose of the frequency response standard (FRS) is to assure balancing authorities are able to arrest frequency decline and support interconnection frequency during a fre-quency deviation resulting from a loss of generation. FRR establishes control areas’ shares in arresting the frequency decline and supporting frequency until the area in which the loss of generation resource occurred has recovered its ACE within the required pe-riod.
The following important considerations outlining potential impacts of the FRR standard on the value of fast regulation resources can be foreseen at this moment:
! FRR requires sufficiently fast responsiveness of participating resources
! FRR is currently under development at WECC. The final provisions, as well as numerical requirements, are not clear yet
! Market or other compensation schemes for participation resources are not yet clear
! Distributed fast frequency responsive resources could definitely and very signifi-cantly contribute to the FRR requirements.
Suggestion. A FRR-related study is recommended for the California ISO as soon as more clarity is achieved concerning the actual enforcement of the FRR standard and its numerical values for the California ISO. Recommendations for Phase 2
! Incorporating ramping considerations in pricing the ancillary services. Analyze advantages, disadvantages, and options for incorporating the ramping considera-tion and incentives for fast regulation resources (including distributed resources) into the ancillary market design and settlements (pricing).
! Operating procedures. Investigate if the ramping and ramp duration requirements could be added to the CAISO Ancillary Service Procurement Operating Proce-dure. Analyze the benefits and potential drawbacks.
! Propose and comprehensively examine a more scientific approach to procure regulation service. The existing approach to calculating the required regulation procurement could be supplemented and verified against the more “scientific” method proposed in this report. This will result in minimizing the regulation pro-curement by better differentiation between the operating hours during a day and better adaptation to changing seasonal and monthly operating conditions.
! Analyze the consequences of establishing a more “scientific” target CPS2 compli-ance level. This measure, along with the scientific analysis of regulation require-
xviii
ments, could help to significantly minimize the regulation requirements without compromising the CAISO’s performance characteristics.
! Propose and test new AGC algorithm modifications oriented for more efficient use of fast regulation resources.
! Depending on acceptance and actual availability of factual information on the BAAL and FRR standards, conduct studies reflecting the value of fast responsive resources (including distributed resources) for providing robust compliance with these standards.

xix
Acknowledgements The authors acknowledge the following contributors to this project and are very grateful to their inputs.
California Energy Commission Mike Gravely Manager, PIER Energy Systems Integration
Kristy Chew Project Manager, PIER Energy Systems Integration
Ron Hoffman Technical Advisor, PIER Energy Systems Integration
CERTS Project Manager Joseph H. Eto Lawrence Berkeley National Laboratory
California ISO Advisory Team David Hawkins Lead Industry Relations Representative
Clyde Loutan Senior Advisor - Planning and Infrastructure Development
Sirajul Chowdhury Senior Energy Management System (EMS) Engineer
Project Review Team Terry Bilke Technical Manager, Midwest ISO
Michael Potishnyak Principal Engineer, ISO New England
PNNL Susan J. Arey Project Specialist
Sheena Kanyid Contracting Officer
Evan Jones Product Line Manager

xx
Carl Imhoff Market Sector Manager, Energy Infrastructure
Mark Morgan Manager, Energy Technology Development
Jeanene Lee, Lead Administrator

xxi
Glossary
Abbrevia-tion
Term Meaning
ACE Area Control Error Area control error (ACE) is the difference between scheduled and actual electrical generation within a control area on the power grid, taking frequency bias into account.
ADS Automatic Dispatch System California ISO automated dispatch system (ADS) communicates 5-minute and hourly dispatch instructions to Market Participants as well as Startup/Shutdown instructions.
AGC Automatic Generation Control
Generation equipment that automatically responds to signals from the EMS control in real time to control the power output of electric generators within a prescribed area in response to a change in system frequency, tie line loading, or the relation of these to each other, so as to maintain the target system frequency and/or the established inter-change with other areas within the predetermined limits.
AS Ancillary Services Ancillary services are those services necessary to support the transmission of energy from resources to loads while maintaining, reliable operation of the transmission pro-vider's transmission system in accordance with good utility practice.
ASMP Ancillary Service Marginal Price
Market clearing price for ancillary services.
ATE Automatic Time Error Cor-rection
An additional term in the ACE equation establish by WECC to correct for integral de-viations of the interconnection frequency.
BA Balancing Authority The same as Control Area. BAAL Balancing Authority ACE
Limit The balancing authority ACE limit (BAAL) standard is a part of a new set of control performance standards currently under development at NERC. BAAL id designed to replace CPS2. It establishes frequency-dependent ACE limits.
BPA Bonneville Power Admini-stration
A U.S. government electric utility in the Pacific Northwest.
California ISO
California Independent System Operator Corp.
Independent system operator controlling most of the California electric power system.
CC Combined Cycle In a combined cycle power plant, a gas turbine generator generates electricity and the waste heat is used to make steam to generate additional electricity via a steam turbine; this last step enhances the efficiency of electricity generation.
CEC California Energy Commis-sion
The California Energy Commission is the state's primary energy policy and planning agency.
CERTS Consortium for Electric Reliability Technology Solutions
The Consortium for Electric Reliability Technology Solutions (CERTS) was formed in 1999 to research, develop, and disseminate new methods, tools, and technologies to protect and enhance the reliability of the U.S. electric power system and efficiency of competitive electricity markets.
--- Control Area An electric power system or combination of electric power systems to which a common automatic control scheme is applied in order to: (1) match, at all times, the power out-put of the generators within the electric power system(s) and capacity and energy purchased from entities outside the electric power system(s), with the load in the elec-tric power system(s); (2) maintain, within the limits of good utility practice, scheduled interchange with other control areas; (3) maintain the frequency of the electric power system(s) within reasonable limits in accordance with good utility practice; and (4) provide sufficient generating capacity to maintain operating reserves in accordance with good utility practice.
CPS Control Performance Stan-dard
Control performance standards established by NERC for balancing authorities (control areas). Currently, two CPS are enforced: CPS1 and CPS2.
CT Combustion Turbine Combustion turbine converts the energy of hot gases, produced by burning fuel, into mechanical power.
DAM Day-ahead Market The market for energy for the following day, or more specifically, the market for energy 24 hours in advance of a given time in any day.
DOE Department of Energy U.S. Department of Energy DOT Dispatch Operating Target Desired generation used in the California ISO real time dispatch system. EMS Energy Management Sys-
tem A computer control system used by electric utility dispatchers to monitor the real time performance of the various elements of an electric system and to control generation and transmission facilities.

xxii
Abbrevia-tion
Term Meaning
EPRI Electric Power Research Institute
The Electric Power Research Institute (EPRI) conducts research and development on technology, operations and the environment for the global electric power sector. EPRI, a non-profit organization, brings together its members, the institute’s scientists and engineers, along with experts from academia, industry and other research centers to meet challenges in electricity generation, delivery and use. EPRI supports multi-discipline research in emerging technologies, which drives long-range research and development planning.
FRR Frequency Responsive Reserve
Frequency responsive reserve is the spinning reserve responsive to frequency. The purpose of the FRR standard is to provide frequency support during unexpected generation loss events. FRR establishes a control areas share in arresting the fre-quency decline and supporting frequency until the area, in which the loss of generation resource occurred, has recovered its ACE within the required period. FRR require sufficiently fast responsiveness of participating resources. FRR is currently under development at WECC.
FRS Frequency Response Standard
The purpose of the Frequency Response Standard (FRS) is to assure Balancing Authorities are able to arrest frequency decline and support Interconnection frequency during a frequency deviation resulting from a loss of generation. This standard does not apply to the loss of load. Frequency Responsive Reserve is the measurement of the reserves’ quality and might be a subset of Contingency Reserves.
HASP Hour-ahead Scheduling Process
The hour-ahead scheduling process is a process for trading hourly energy and ancil-lary services based on bids submitted up to 75 minutes ahead of a trading hour.
IFM Integrated Forward Market The integrated forward market (IFM) at California ISO is a market for trading Energy and Ancillary Ser-vices for each hour of the next Trading Day.
ISO Independent system opera-tor
An independent, Federally regulated entity established to coordinate regional trans-mission in a non-discriminatory manner and ensure the safety and reliability of the electric system.
LMP Locational Marginal Price The market clearing marginal price for energy at the location the energy is delivered or received.
MCP Market Clearing Price The price at which supply equals demand. MPM Market Power Mitigation Procedures for mitigation of local market power exercised by generator merchants.
The MPM at California ISO performs the local market power mitigation test to deter-mine whether bids submitted allow the exercise of market power based on specific criteria.
MRTU Market Redesign and Tech-nology Upgrade
New market design currently under development at the California ISO.
NERC North America Electric Reliability Corporation
NERC’s mission is to improve the reliability and security of the bulk power system in North America. To achieve that, NERC develops and enforces reliability standards; monitors the bulk power system; assesses future adequacy; audits owners, operators, and users for preparedness; and educates and trains industry personnel. NERC is a self-regulatory organization that relies on the diverse and collective expertise of indus-try participants. As the Electric Reliability Organization, NERC is subject to audit by the U.S. Federal Energy Regulatory Commission and governmental authorities in Canada.
OASIS Open Access Same-Time Information System
A web-based information system linking individual transmission owner OASIS websites that list available capacity on specific transmission lines.
PI Process Information Sys-tem
A database developed by OSI Soft Company for storing large amounts of time domain data.
PNNL Pacific Northwest National Laboratory
U.S. Department of Energy Laboratory located in the Pacific Northwest. The Labora-tory is runn by Battelle Memorial Institution.
POP Preferred Operating Point In the California ISO system, the POP is the generation loading at which an AGC unit has pre-scheduled its energy from the energy markets.
--- Rational Buyer A cost-minimizing algorithm (called Rational Buyer's algorithm) has been in production since August 1999 at the California ISO. By allowing ISO to procure higher quality services to meet the demand for lower quality services, when doing so reduces the overall procurement cost, the Rational Buyer's algorithm minimizes the total cost of procuring ancillary services under the market rules. The minimum-cost procurement is found by a search through the domain defined by the market and cost-minimizing rules.
RC Regulation Capacity Generation capacity available for regulation.

xxiii
Abbrevia-tion
Term Meaning
RO Regulation obligation Each SC regulation obligation is determined hourly by applying its real time load ratio to the actual amount of regulation assigned to the system for that hour.
RMR Reliability Must Run RMR generation is generation the California ISO determines is required to be on line to meet applicable reliability criteria requirements. This includes: i) generation con-strained online to meet NERC and WECC reliability criteria for interconnected systems operation; ii) generation needed to meet load demand in constrained areas; and iii) generation needed to be operated to provide voltage or security support of the Califor-nia ISO or a local area.
RR Regulation rate Regulation rate that allocates regulation costs among generators in a fair and equitable manner.
RRD Reliability Requirement Determination
The RRD process allows California ISO to identify RMR requirements for RMR units.
RT Real Time --- RTCD Real Time Contingency
Dispatch The RTCD function executes upon California ISO operator action, usually following a generation or transmission system contingency. The RTCD execution is for a single 10-minute interval and includes all contingency only operating reserves in the optimiza-tion process. California ISO real time contingency dispatch (RTCD) is executed manu-ally.
RTD Real Time Dispatch Generation dispatch conducted in real time. RTED Real Time Economic Dis-
patch Real time economic dispatch (RTED) is a market for trading imbalance energy and dispatching ancillary services at regular intervals.
RTM Real Time Market Real time market (RTM) at California ISO is a market for trading energy and ancillary services in real time.
RTMD Real Time Manual Dispatch The real time manual dispatch (RTMD) is executed manually and it has a single 5-min interval.
RTPD Real Time Pre-Dispatch The real time pre-dispatch (RTPD) is a market for committing resources and for selling ancillary services at 15-min intervals.
RUC Residual Unit Commitment The RUC process provides a reliability backstop for the California ISO to commit addi-tional units in order to meet its reliability requirements. The California ISO performs a day-ahead and hour-ahead RUC process immediately after the day-ahead or hour-ahead IFM has run and feasible final schedules are established. In the event that these markets close with supplies offered below the California ISO’s load forecast, the RUC process will commit additional resources to ensure that on-line capacity is available in real time.
SC Scheduling Coordinator Scheduling coordinators (SCs) submit balanced schedules to the California ISO and provide settlement-ready meter data.
ST Steam Turbine A steam turbine is a mechanical device that extracts thermal energy from pressurized steam, and converts it into useful mechanical work.
STUC Short Term Unit Commit-ment
STUC is a reliability function for committing short and medium start units to meet the California ISO forecast of California ISO demand. The STUC function is performed hourly, in conjunction with RTUC and looks ahead three hours beyond the trading hour, at 15-minute intervals.
WECC Western Electricity Coordi-nating Council
WECC is responsible for coordinating and promoting electric system reliability in the Western Interconnection. WECC supports efficient competitive power markets, assure open and non-discriminatory transmission access among members, provide a forum for resolving transmission access disputes, and provide an environment for coordinat-ing the operating and planning activities of its members as set forth in the WECC By-laws.
xxiv
Contents Abstract .............................................................................................................................. iii Summary ........................................................................................................................... vii Acknowledgements.......................................................................................................... xix Glossary ........................................................................................................................... xxi 1. Project Objectives .......................................................................................................... 1 2. Analysis of Scheduling, Load-Following and Regulation Procedures at the California
ISO ……………………………………………………………………………………...3 2.1 California ISO Scheduling Process........................................................................... 3 2.2 California ISO Load-Following Process................................................................... 4 2.3 California ISO Regulation ........................................................................................ 5
2.3.1 Regulation procurement ................................................................................... 5 2.3.2 AGC control...................................................................................................... 6
2.4 Scheduling, Load-Following and Regulation as Parts of California ISO Balancing Process ............................................................................................................................. 7 2.5 Operating Reserves ................................................................................................. 7 2.6 Effects of Ramp Rates on Ancillary Service Procurement ..................................... 9 2.7 Summary and Conclusions for Section 2................................................................. 9
3. Market and Settlement Considerations ......................................................................... 11 3.1 California ISO MRTU Market Processes and Timelines ....................................... 11
3.1.1 Day-ahead market ............................................................................................ 11 3.1.2 Real time market ............................................................................................. 11
3.2 Settlement Process for Regulation ........................................................................ 13 3.3 Changes Expected under MRTU ........................................................................... 14 3.4 Summary and Conclusions for Section 3............................................................... 15
4. Analysis of California ISO Units Ramping Characteristics and Ramping Requirements ………………………………………………………………………………………….16 4.1 Regulating Units Ramping Characteristics............................................................. 16 4.2 Actual ADS Ramping Requirements in 2006........................................................ 19 4.3 Summary and Conclusions for Section 4............................................................... 22
5. Some New Approaches Developed for this Study....................................................... 23 5.1 Assessment of Ramping Requirements ................................................................. 23 5.2 Concurrent Statistical Analysis of the Capacity, Ramping Capability, and Energy Requirements ................................................................................................................ 24
6. Analysis of Relative Effectiveness of Fast Regulation Resources for Regulation ...... 26 6.1 “Optimal” AGC Control and Regulation............................................................... 26 6.2 Calculating ACE Without Regulation .................................................................... 27 6.3 The Concept of CPS2-based “Optimal” Control and Algorithm............................ 27 6.4 Simplified Procedure for Calculating the “Optimal” Control................................ 31 6.5 Comparing the “Ideal” Control Against the Actual Control.................................. 32 6.6 Efficiency of Fast Regulation Study Results ......................................................... 34

xxv
7. Analysis of the Load-Following and Regulation Needs at High Wind Power Penetration Levels in 2010............................................................................................. 38 7.1 Main Results of the Recent California ISO/Battelle Study ................................... 38
7.1.1 Methodology.................................................................................................... 38 7.1.2 Main Study Results .......................................................................................... 40
7.2 Summary and Conclusion forn Section 7 .............................................................. 44 8. Value of Fast Responsive Resources Depending on Ramping Capability ................... 45
8.1 Study Results ......................................................................................................... 45 8.2 Summary and Conclusion for Section 8 ................................................................. 47
9. Potential Impacts of BAAL and FRR Standards .......................................................... 49 9.1 Potential Impacts of BAAL Standard ..................................................................... 49 9.2 Potential Impacts of FRR Standard........................................................................ 50
10. Recommendations for Phase 2.................................................................................... 51 11. References................................................................................................................... 52

xxvi
Figures
Fig. S-1 Ramping capability by technology (percent of capacity per minute) ................ viii Fig. S-2 Example of California ISO ramp-duration characteristic .................................... ix Fig. S-3 Duration – ramp rate diagram for hour ending by 7, 8 and 9 with wind and
without wind in 2006 and 2010 .................................................................................. x Fig. S-4 Spring 2006 load following capacity – ramp rate diagram for different
percentiles ................................................................................................................ xiv Fig. S-5 Spring 2006 regulation capacity – ramp rate diagram for different percentiles . xv Fig. S-6 Spring 2006 regulation capacity – ramp rate diagram for different energy levels
................................................................................................................................... xv Fig. 2-1 California ISO day-ahead market timeline............................................................ 3 Fig. 2-2 California ISO hour-ahead scheduling process timeline....................................... 4 Fig. 2-3 California ISO real time dispatch timeline............................................................ 5 Fig. 2-4 Block diagram of California ISO AGC system.................................................... 7 Fig. 2-5 California ISO system scheduling and load balancing processes ......................... 8 Fig. 4-1 California ISO regulating units ramping capability ............................................ 16 Fig. 4-2 Ramping capability by technology (percent of capacity per minute) ................ 17 Fig. 4-3 Example of California ISO ramp-duration characteristic ................................... 19 Fig. 4-4 ADS ramping requirement, Winter 2006 ............................................................ 20 Fig. 4-5 ADS ramping requirement, Spring 2006............................................................. 20 Fig. 4-6 ADS ramping requirement, Summer 2006.......................................................... 21 Fig. 4-7 ADS ramping requirement, Fall 2006................................................................. 21 Fig. 5-1 "Swinging door" algorithm - idea ....................................................................... 23 Fig. 5-2 "Swinging door" algorithm – obtaining regulation, ramps, and their duration... 24 Fig. 5-3 Concurrent consideration of the capacity, ramping and energy requirements.... 25 Fig. 6-1 Understanding optimal control - A...................................................................... 29 Fig. 6-2 Understanding optimal control - B...................................................................... 30 Fig. 6-3 Illustration of "peak shaving" approach .............................................................. 32 Fig. 6-4 Comparison of the ideal (optimal) regulation against the actual regulation ....... 33 Fig. 7-1 Separation of regulation from load-following based on simulated hour-ahead
schedule..................................................................................................................... 40 Fig. 7-2 Hourly capacity diagrams for load following scenarios with wind and without
wind in 2006 and 2010.............................................................................................. 41 Fig. 7-3 Hourly ramp rate diagrams for load following scenarios with wind and without
wind in 2006 and 2010.............................................................................................. 41 Fig. 7-4 Duration – ramp rates for load-following scenario (hour ending by 7, 8 and 9)
with wind and without wind in 2006 and 2010......................................................... 42 Fig. 7-5 Hourly capacity diagrams for regulation scenarios with wind and without wind in
2006 and 2010........................................................................................................... 43 Fig. 7-6 Hourly ramp rate diagrams for regulation scenarios with wind and without wind
in 2006 and 2010....................................................................................................... 43 Fig. 7-7 Duration – ramp rates for regulation scenario (hour ending by 7, 8 and 9) with
wind and without wind in 2006 and 2010................................................................. 44 Fig. 8-1 Spring 2006 load-following capacity – ramp rate diagram for different
percentiles ................................................................................................................. 45

xxvii
Fig. 8-2 Spring 2006 regulation capacity – ramp rate diagram for different percentiles.. 46 Fig. 8-3 Spring 2006 regulation capacity – ramp rate diagram for different energy levels
................................................................................................................................... 47

xxviii
Tables
Table S-1 Example of regulation capacity bids and average duration of highest ramp .... ix Table 4-1 Regulating units ramping capability................................................................. 17 Table 4-2 Example of units’ regulation capacity and average duration capacity at highest
ramp .......................................................................................................................... 18 Table 4-3 ADS ramping Requirements in 2006, MW/min............................................... 22 Table 6-1 Relative efficiency of fast regulation (unlimited energy)................................. 35 Table 6-2 Relative efficiency of fast regulation (limited energy).................................... 36

1
1. Project Objectives This report contains results of phase 1 of the project. These include:2
! Develop a methodology and a metric to assess the relative value of the existing and new generation resources used for regulation and load-following for Califor-nia ISO functions. This assessment will be done based on physical characteristics including the ability to quickly change their output following California ISO sig-nals. In this regard, evaluate what power is worth on different time scales (from sub-seconds and seconds to minutes and hours).
! Analyze the benefits of new regulation resources to provide effective compliance with the new mandatory NERC Control Performance Standards
! Develop a scope for follow-up projects to pave a road for new efficient types of balancing resources in California.
2 “Assessing the Value of Regulation Resources Based On Their time Response Characteristics”, Statement of work, Modification 3, Subcontract No. 6805591, Battelle, Pacific Northwest Division, February 17, 2006.

2
Purposely left blank for pagination

3
2. Analysis of Scheduling, Load-Following and Regulation Procedures at the California ISO
Information in this section was collected from interviews and discussions with the Cali-fornia ISO engineers, consultants and real time dispatchers including C. Loutan, D. Haw-kins, S. Chowdhury, T. VanBlaricom, T. Yong, H. Alarian, J. Blatchford, J. Wong, and T. Wu. It is also based on the California ISO documents. Additional information can be found in [4], [7], and [8]. In the California ISO system, the processes of meeting generation and load consist of day-ahead schedule, hour-ahead schedule, real time dispatch (or load-following, in 5 minutes intervals) and AGC regulation. The regulation versus load capacity ratio is usu-ally between 1.0 and 1.6% depending on the operation hour. The scheduled energy and ancillary service capacity are procured using an auction mechanism composed of day-ahead market (DAM) and real time market (RTM). A new and improved market design called market redesign and technology upgrade (MRTU) has been implemented at the California ISO. Any generators with AGC capability can bid to the ancillary services market. Under this mechanism, the compensation (in $/MW) for resources providing an-cillary services is determined by the market price and the capacity awarded by the Cali-fornia ISO to the participating resource. 2.1 California ISO Scheduling Process Generation schedule processes in the California ISO system include day-ahead schedule and hour-ahead schedule, which are also based on block hourly energy schedules includ-ing the 20-minute ramps between the hours. Energy for these schedules is procured from day-ahead market and hour-ahead scheduling process (HASP, one of the processes in real time market, or RTM), respectively.
Mid Night
Day of DeliveryDay prior to Delivery
10:00 amClose DAM
Create Demand Forecast
1:00 pmPublish DAM
Results
Generators Submit DAM Bids
Fig. 2-1 California ISO day-ahead market timeline
4
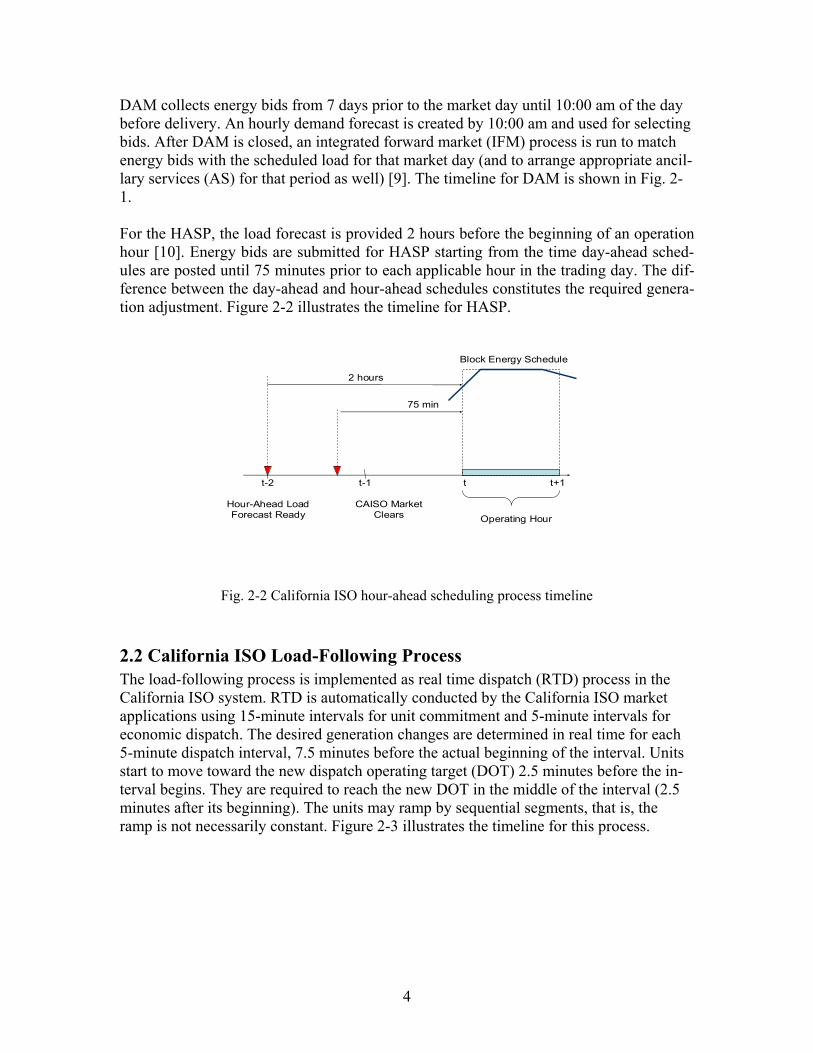
DAM collects energy bids from 7 days prior to the market day until 10:00 am of the day before delivery. An hourly demand forecast is created by 10:00 am and used for selecting bids. After DAM is closed, an integrated forward market (IFM) process is run to match energy bids with the scheduled load for that market day (and to arrange appropriate ancil-lary services (AS) for that period as well) [9]. The timeline for DAM is shown in Fig. 2-1. For the HASP, the load forecast is provided 2 hours before the beginning of an operation hour [10]. Energy bids are submitted for HASP starting from the time day-ahead sched-ules are posted until 75 minutes prior to each applicable hour in the trading day. The dif-ference between the day-ahead and hour-ahead schedules constitutes the required genera-tion adjustment. Figure 2-2 illustrates the timeline for HASP.
t t+1t-1t-2
Operating Hour
2 hours
75 min
Block Energy Schedule
CAISO MarketClears
Hour-Ahead LoadForecast Ready
Fig. 2-2 California ISO hour-ahead scheduling process timeline
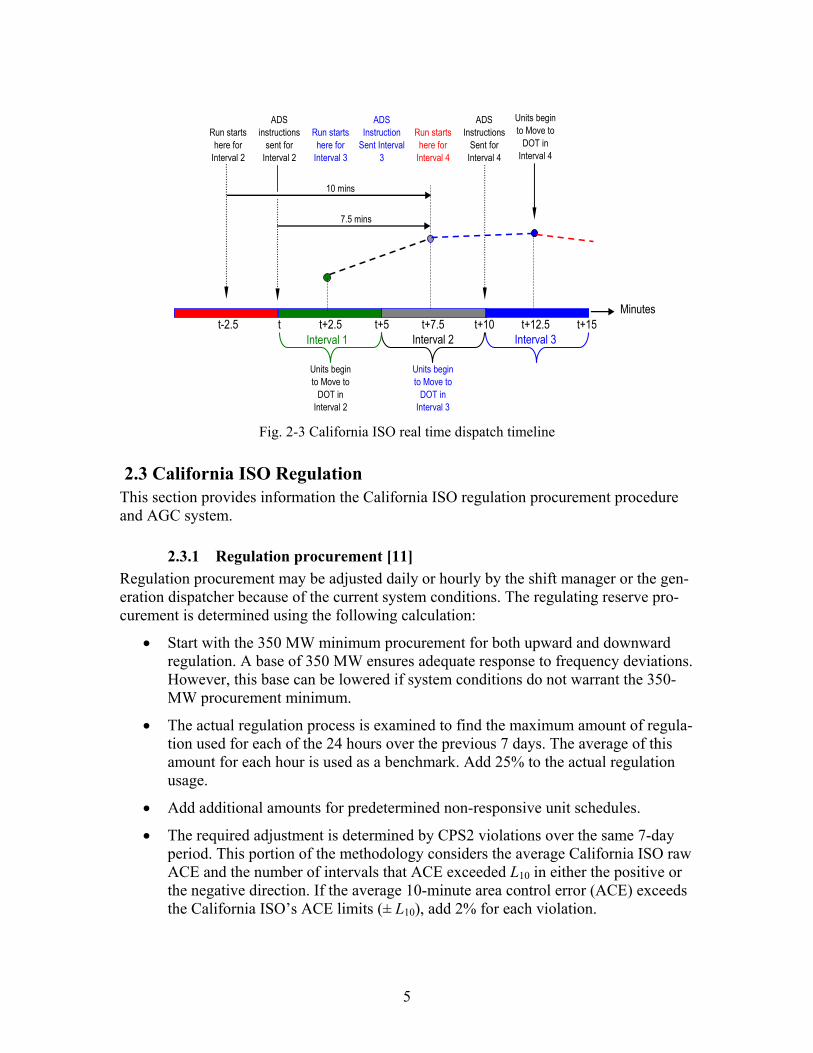
2.2 California ISO Load-Following Process The load-following process is implemented as real time dispatch (RTD) process in the California ISO system. RTD is automatically conducted by the California ISO market applications using 15-minute intervals for unit commitment and 5-minute intervals for economic dispatch. The desired generation changes are determined in real time for each 5-minute dispatch interval, 7.5 minutes before the actual beginning of the interval. Units start to move toward the new dispatch operating target (DOT) 2.5 minutes before the in-terval begins. They are required to reach the new DOT in the middle of the interval (2.5 minutes after its beginning). The units may ramp by sequential segments, that is, the ramp is not necessarily constant. Figure 2-3 illustrates the timeline for this process.
5
Run starts here for
Interval 2
ADS instructions
sent for Interval 2
Run starts here for
Interval 3
ADS Instruction
Sent Interval 3
Run starts here for
Interval 4
ADS Instructions
Sent for Interval 4
Units begin to Move to
DOT in Interval 4
10 mins
7.5 mins
Minutest-2.5 t t+2.5 t+5 t+7.5 t+10 t+12.5 t+15
Interval 1 Interval 2 Interval 3
Units begin to Move to
DOT in Interval 2
Units begin to Move to
DOT in Interval 3
Fig. 2-3 California ISO real time dispatch timeline
2.3 California ISO Regulation This section provides information the California ISO regulation procurement procedure and AGC system.
2.3.1 Regulation procurement [11]
Regulation procurement may be adjusted daily or hourly by the shift manager or the gen-eration dispatcher because of the current system conditions. The regulating reserve pro-curement is determined using the following calculation:
! Start with the 350 MW minimum procurement for both upward and downward regulation. A base of 350 MW ensures adequate response to frequency deviations. However, this base can be lowered if system conditions do not warrant the 350-MW procurement minimum.
! The actual regulation process is examined to find the maximum amount of regula-tion used for each of the 24 hours over the previous 7 days. The average of this amount for each hour is used as a benchmark. Add 25% to the actual regulation usage.
! Add additional amounts for predetermined non-responsive unit schedules.
! The required adjustment is determined by CPS2 violations over the same 7-day period. This portion of the methodology considers the average California ISO raw ACE and the number of intervals that ACE exceeded L10 in either the positive or the negative direction. If the average 10-minute area control error (ACE) exceeds the California ISO’s ACE limits (± L10), add 2% for each violation.

6
! A 600-MW procurement ceiling is utilized for regulation up or for regulation down procurements. The actual requirement may be greater than 600 MW if CPS2 violations occur.
2.3.2 AGC control
ACE signal as the input of the AGC algorithm in EMS is processed with a Butterworth and PI filters – see Figure 2-4. The Butterworth filter helps to eliminate AGC reaction to rapid changes of ACE. The PI filter has proportional and integral control gains. The inte-gral gain steadily increases the AGC signal to eliminate persistent ACE deviations. The filtered ACE is used to calculate the total regulation required in the system. This total regulation requirement is distributed to the units based on generators’ participation fac-tors with consideration of their ramp rates, regulation range and the current status. Faster units are moved faster. But nevertheless, the control signal is sent to all units currently being regulated. The look-ahead capability (feedforward AGC principle) is available in the existing AGC system, but it is not currently used.
Energy management system (EMS) dispatches AGC regulation as required, but endeav-ors to return each unit to its POP as soon as possible. Depending on the magnitude of ACE, AGC has three different operating zones.
! Dead zone. When ACE is within the dead zone, AGC moves some of the regulat-ing units up and others down to get them return to their POP.
! Economic control zone. When ACE is outside the dead zone but not very large, AGC distributes the required regulation among all the regulating units procured in the day-ahead and hour-ahead regulation market, based on their bids, ramp rates and regulation capacity. In the economic control zone, fast units with high ramp rates will be called on first. Then slow units are dispatched. In other words, fast units take more shares of the regulation responsibility at the beginning, and then the regulation requirement will be evenly distributed. Therefore, units with higher ramp rates receive higher priority in the procurement of ancillary service.
! Emergency control zone. When ACE is extremely big, the AGC dispatches any resources under its control to reduce ACE. This can be called the emergency con-trol zone.
The AGC system sends either setpoint signals or increase/decrease pulses to the AGC units. (There are some units still requiring increased or decreased pulses, but very rare now.) A regulating unit is expected to be capable of developing ramp rates provided by this unit for the ISO. But the ISO can move the unit with a lower than maximum rate. The ramp limiters prevent the ISO from sending setpoint signals exceeding the maximum ramping capability of a unit.

7
ButterworthFilter
PIFilter
Distribution Algorithm
G1
G2
G3
Gn
ACE
Filtered ACE
Units characteristics & status information Ramp
Limiters
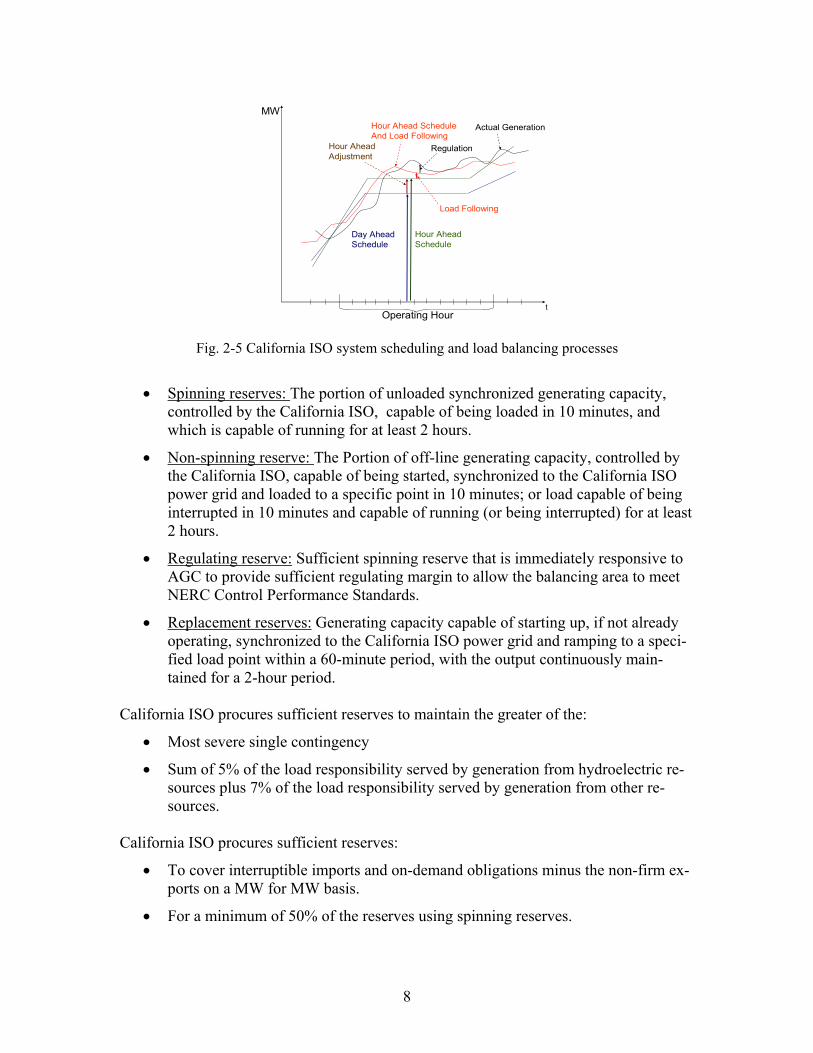
Fig. 2-4 Block-diagram of California ISO AGC system 2.4 Scheduling, Load-Following and Regulation as Parts of California ISO Balancing Process Fig. 2-5 illustrates the relationship between the scheduling and balancing processes in the California ISO system. The difference between the day-ahead and hour-ahead schedules constitute the required generation adjustment. California ISO facilitates the adjustment bids and the market. Load following is an instructed deviation from schedule caused by the real time (or supplemental) energy dispatch. Regulation covers the remaining differ-ence between the actual generation needed in the system and the resulting hour-ahead schedule plus load-following. 2.5 Operating Reserves [11] The California ISO procures operating reserves in the day-ahead market and in the real time market that are necessary to meet California ISO requirements not met by self-provided reserves. The percentage requirement of spinning and non-spinning reserves is the same as the Bonneville Power Administration (BPA) system. The standards for vari-ous types of services are described as follows:
8
MW
tOperating Hour
Hour Ahead Schedule
Day Ahead Schedule
Hour AheadAdjustment
Load Following
Actual Generation
Regulation
Hour Ahead ScheduleAnd Load Following
Fig. 2-5 California ISO system scheduling and load balancing processes
! Spinning reserves: The portion of unloaded synchronized generating capacity, controlled by the California ISO, capable of being loaded in 10 minutes, and which is capable of running for at least 2 hours.
! Non-spinning reserve: The Portion of off-line generating capacity, controlled by the California ISO, capable of being started, synchronized to the California ISO power grid and loaded to a specific point in 10 minutes; or load capable of being interrupted in 10 minutes and capable of running (or being interrupted) for at least 2 hours.
! Regulating reserve: Sufficient spinning reserve that is immediately responsive to AGC to provide sufficient regulating margin to allow the balancing area to meet NERC Control Performance Standards.
! Replacement reserves: Generating capacity capable of starting up, if not already operating, synchronized to the California ISO power grid and ramping to a speci-fied load point within a 60-minute period, with the output continuously main-tained for a 2-hour period.
California ISO procures sufficient reserves to maintain the greater of the:
! Most severe single contingency
! Sum of 5% of the load responsibility served by generation from hydroelectric re-sources plus 7% of the load responsibility served by generation from other re-sources.
California ISO procures sufficient reserves:
! To cover interruptible imports and on-demand obligations minus the non-firm ex-ports on a MW for MW basis.
! For a minimum of 50% of the reserves using spinning reserves.
9
! To satisfy the needs of local area requirements, additional operating reserves may be procured.
2.6 Effects of Ramp Rates on Ancillary Service Procurement [12] Ancillary services (AS) awards are limited by applicable ramp rates as follows:
! Regulation down service must be delivered in 10 minutes according to its bid-in regulation ramp rate. In other words, the maximum amount of regulation down service that a unit can provide is limited to the regulation ramp rate times 10 min-utes.
! Regulation up, spinning reserve and non-spinning reserve must be delivered in 10 minutes according to regulation ramp rate and operating reserve ramp rate as fol-lows:
Reg Up Spin Res+NonSpin Res 10 minutesReg Ramp Rate Operating Reserve Ramp Rate
" # (2.1)
! Resources taking longer than 20 minutes to ramp down from 1 hour's energy schedule to the next hour's energy schedule shall not be eligible to provide regula-tion down in both hours. Conversely, resources that self-provide regulation down in a given hour will have their energy schedules constrained, and if applicable their energy self-schedules (except reliability must run -- RMR) adjusted, so that this rule is not violated.
! Resources taking longer than 20 minutes to ramp up from 1 hour's energy sched-ule to the next hour's energy schedule shall not be eligible to provide regulation up, spinning reserve, or non-spinning reserve in both hours. Conversely, resources that self-provide regulation up, spinning reserve, or non-spinning reserve in a given hour will have their energy schedules constrained, and if applicable their energy self-schedules (except RMR) adjusted, so that this rule is not violated.
2.7 Summary and Conclusions for Section 2
! In the California ISO system, the processes of meeting generation and load con-sist of day-ahead schedule, hour-ahead schedule, real time dispatch and AGC regulation. Day-ahead and hour-ahead schedules are blocked hourly energy schedules including the 20-minute ramps between the hours.
! The load-following process is implemented as a real time dispatch (RTD) process conducted by the California ISO market applications using 15-minute intervals for unit commitment and 5-minute intervals for economic dispatch. Units start to move toward the new dispatch operating target (DOT) 2.5 minutes before the in-terval begins. They are required to reach the new DOT in the middle of the inter-val (2.5 minutes after its beginning).
10
! Currently, the California ISO uses a base of 350 MW for regulation procurement. The regulation reserve can be increased based on the actual regulation used (+25%), predetermined non-responsive unit schedules, and CPS2 violations. A 600-MW procurement ceiling is utilized.
! In the AGC economic control zone, fast units with high ramp rates will be called on first. Then slower units are dispatched. In other words, fast units take more shares of the regulation responsibility at the beginning, and then the regulation re-quirement will be evenly distributed. The ramp limiters prevent the California ISO AGC system from sending setpoint signals exceeding the maximum ramping capability of a unit.
! California ISO limits the regulation capacity bids by the amounts that can be de-livered within 10 minutes. This means that the slower units are restricted in the capacity that they can bid into the market. Very slow resources that are not able to follow the 20-minute ramps from 1 operating hour to another operating hour are excluded from the regulation service for these hours.
11
3. Market and Settlement Considerations This section describes market and settlement considerations at the California ISO that are relevant to this project.
3.1 California ISO MRTU Market Processes and Timelines The content of this section is based on the reference [13]. Market redesign and technol-ogy upgrade (MRTU) is a new market design currently under development at the Cali-fornia ISO.
3.1.1 Day-ahead market The day-ahead market (DAM) is a market for trading energy, ancillary services (AS), and residual unit commitment capacity for the next trading day that starts at midnight, and ends at the following midnight. The bid submission for the DAM is allowed as early as 1 week ahead and up to 10:00 am 1-day-ahead of the trading day. The results of the DAM are published by 1:00 p.m. 1-day-ahead of the trading day. The day-ahead market in-cludes several functions that are performed in sequence:
! Market power mitigation (MPM) and reliability requirement determination (RRD).
! Integrated forward market (IFM).
! Residual unit commitment (RUC).
The integrated forward market is a market for trading energy and ancillary services for each hour of the next trading day. The IFM uses the mitigated bids after MPM and RRD to clear supply and demand bids, and procure ancillary services to meet the California ISO ancillary services requirements at least bid cost over the next trading day. 3.1.2 Real-time market The real time market (RTM) is a market for trading energy and ancillary services in real time. The bid submission for a given trading hour in the RTM is allowed after the DAM result publication for the corresponding trading day and up to 75 minutes before the start of that trading hour. The real time market includes several functions that are performed in parallel, but with different periodicity:
! Market power mitigation and reliability requirement determination
! Hour-ahead scheduling process (HASP)
! Short-term unit commitment (STUC)
! Real time pre-dispatch (RTPD)
! Real time economic dispatch (RTED).

12
Market power mitigation and reliability requirements. The MPM and RRD are per-formed hourly, 7½ minutes after the close of the RTM for a trading hour, i.e., 67½ min-utes before the start of that trading hour. The MPM performs a test to determine which RTM bids are subject to mitigation for local market power based on specific criteria. If the test fails, the MPM mitigates the affected bids for that trading hour. The resultant mitigated bids are then used by all other RTM applications. The RRD determines the minimal and most efficient use of RMR resources to address local reliability in meeting the California ISO demand forecast over that trading hour.
Hour-ahead scheduling process. The hour-ahead scheduling process (HASP) is a process for trading hourly energy and ancillary services based on bids submitted up to 75 minutes ahead of a trading hour. The HASP is performed hourly and immediately after MPM and RRD. Hourly energy schedules and hourly ancillary services awards for hourly pre-dispatched resources in that trading hour are published no later than 45 minutes before the start of that trading hour.
Short-term unit commitment. The short-term unit commitment (STUC) is a reliability function for committing quick-start resources (with start-up time plus minimum up time less than 255 min) to meet the California ISO demand forecast in each 15-minute interval of the next 4 to 5 hours. The STUC is performed hourly after the HASP.
Real-time pre-dispatch. The real time pre-dispatch (RTPD) is a market for committing resources and for selling ancillary services at 15-minute intervals. The RTPD runs auto-matically every 15 minutes, at the middle of each quarter hour, i.e., at 7½ minutes, 22½ minutes, 37½ minutes, and 52½ minutes into each hour. The RTPD time horizon is com-posed of a variable number of 15-minute intervals that span the current and next trading hours. The first 15-minute interval starts 22½ minutes after the time that RTPD runs, e.g., when RTPD runs at 7½ minutes into an hour, its time horizon starts at 30 minutes into that hour. The AS awards for the first 15-minute interval are binding; the rest are advi-sory. The bids used in the next trading hour are the mitigated bids from the last execution of the MPM and RRD; these bids were submitted 75 minutes before the start of the next trading hour. The bids used in the current trading hour are the mitigated bids from the previous execution of the MPM and RRD; these bids were submitted 75 minutes before the start of the current trading hour. The RTPD execution at 52½ minutes into a given hour coincides with the HASP execution at 67½ minutes before the start of the latest trad-ing hour for which bid submission time is closed; this RTPD is performed simultaneously with the HASP.
Real time economic dispatch. The real time economic dispatch (RTED) is a market for trading imbalance energy and dispatching ancillary services at regular intervals. There are three modes for the RTED:
1) The real time interval dispatch (RTID) is the normal mode of RTED. It runs
automatically every 5 minutes, at the middle of each 5-minute interval of each hour, i.e., at 2½ minutes, 7½ minutes, 12½ minutes, etc. into each hour. The RTID time horizon is composed of a variable number of 5-minute intervals that

13
span the current and next trading hours. The first 5-minute interval starts 7½ min-utes after the time that RTID runs, e.g., when RTID runs at 2½ minutes into an hour, its time horizon starts at 10 minutes into that hour. The dispatch for the first 5-minute interval of the time horizon is binding; the rest are advisory. The bids used in the 5-minute intervals of next trading hour included in the RTID time ho-rizon are the mitigated bids from the last execution of the MPM and RRD; these bids were submitted 75 minutes before the start of the next trading hour. The bids used in the 5-minute intervals of current trading hour included in the RTID time horizon are the mitigated bids from the previous execution of the MPM and RRD; these bids were submitted 75 minutes before the start of the current trading hour.
2) The real time manual dispatch (RTMD) is executed manually; it has a single 5-
minute interval. 3) The real time contingency dispatch (RTCD) is also executed manually, but it has
a single 10-minute interval.
3.2 Settlement Process for Regulation [14] The California ISO regulation market is capacity based. This means that the regulating units bid a part of their capacity into the market, and that, if they are accepted, they are paid the market clearing price (MCP). Radial zonal structure for the MCP is used by the California ISO currently.
Regulation capacity is procured in the day-ahead and hour-ahead markets. Regulation is procured for each operating hour.
The regulation payment due scheduling coordinators (SCs) is calculated using the follow-ing basic formula: **CT RC MCP$ % (3.1) where
CT** is the charge type due SC (billable quantity for regulation capacity provided): CT005 – Day-ahead AGC/regulation up due SC CT006 – Day-ahead AGC/ regulation down due SC CT055 – Hour-ahead AGC/regulation up due SC CT056 – Hour-ahead AGC/regulation down due SC
RC is final quantity of regulation capacity accepted, MW
MCP is the market clearing price derived from rational buyer process [15] (zonal MCP for AGC/ regulation capacity), $/MW. MCP is posted on OASIS ancillary tab under final market clearing price.
Regulation charges due ISO are calculated using the following basic formula:

14
***CT RO RR$ % (3.2) where
CT*** is the charge type due SC (billable quantity for regulation capacity provided): CT115 – Regulation up due California ISO CT116 – Regulation down due California ISO
RO is net regulation obligation, MW RR is regulation rate, $/MW. 3.3 Changes Expected under MRTU This section is written based on [16] and [17]. Reference [18] contains a comparison of the current settlement system with the future system under MRTU.
With the implementation of MRTU, the current radial zonal model will be replaced with full network model and locational marginal price (LMP) model. The California ISO will procure the ancillary services, regulation up, regulation down, spinning reserve, and non-spinning reserve in the day-ahead integrated forward market (IFM) and procure incre-mentally as needed in the hour-ahead scheduling process (HASP) and in the real time market. Ancillary services (AS) are procured simultaneously with energy bids to meet regulation and operating reserve requirements, using submitted AS bids. IFM is per-formed for each hour of the next trading day. The HASP is performed hourly. Only the inter-tie AS awards in HASP are binding. The real time unit commitment performs unit commitment and AS procurement, if needed, at 15-minute intervals for the current hour and next trading hour. The AS awards published for the first 15-minute interval of the time horizon are binding; the rest are advisory. The AS pricing and settlement will be based on ancillary service marginal price (ASMP), which are calculated for each AS re-gion for each market time interval for each market.
The AS procurement cost is the payment for AS awarded bids in the day-ahead IFM, HASP, and RTM. This charge code is part of the family of charge codes for payment to scheduling coordinators (SCs) for awarded ancillary services capacity bids: (1) regulation up, (2) regulation down, (3) spinning reserve, and (4) non-spinning reserve. The fundamental concepts of settlement methodology for allocation of AS procurement cost to scheduling coordinators are as follows:
! The AS procurement cost allocation for all AS commodity types is hourly, sys-tem-wide, and across IFM, HASP, and real time markets.
! The cost of procuring the AS by the California ISO on behalf of the demand will be allocated to the demand using a system-wide user rate. The user rate is the av-erage cost of procuring a type of AS in both the forward and real-time market for the whole California ISO system.
15
! The rate for each AS incorporates the no pay/non compliance capacity and the no pay/non compliance charge to reflect the ultimate average AS cost.
! The rate for each AS reflects an average AS substitution to capture the cascaded AS procurement as it is performed optimally in each AS market. For example, settlements reflects that multiple service types are procured and substituted simul-taneously during IFM optimization.
! A difference between AS requirements and total AS obligations results in a neu-trality adjustment for each AS.
! A difference between total AS procurement and total AS requirements over all spinning, non-spinning and regulation up ancillary services results in a single up-ward neutrality adjustment for all these services.
! Ancillary services awards from intertie resources are charged explicitly for the marginal cost of congestion on the relevant intertie interface at the relevant shadow price. The cost of AS congestion charges is not recovered through the AS cost allocation, but is settled in the real time congestion offset, CC 6774.
! By design, the AS settlement methodology has the following property: If the total AS procurement matches the total AS requirements, and if the AS requirement matches the total AS obligation for each AS, the AS cost allocation is neutral.
By reflecting AS substitution in the AS rates, this AS settlement methodology eliminates neutrality loss caused by AS substitution and results in an equitable AS cost allocation to scheduling coordinators’ that self-provide AS because there is no AS substitution among self-provided AS.
3.4 Summary and Conclusions for Section 3
! Regulating units bid into the California ISO regulation market and are paid for their capacity, but not for their ramping capability.
! Because of the California ISO market characteristics, the composition of the units on regulation can be different from 1 operating hour to another operating hour. This means that at the beginning of each hour, some units that are not selected for this hour can be moving to their POP, and the AGC system is moving the other units to compensate for the lost amount of regulation. This creates an additional regulation effort that may require fast ramping capability in the system.
! Under the MRTU design, the real-time unit commitment will be performing unit commitment and AS procurement for 15-minute intervals instead of 1 hour inter-vals. This will create even more need for faster regulation service.

16
4. Analysis of California ISO Units Ramping Characteris-tics and Ramping Requirements 4.1 Regulating Units Ramping Characteristics To avoid potential confidentiality issues, unit-specific information is not included in this report. There are more than 120 generation units connected to the California ISO’s AGC sys-tem3Error! Reference source not found.. These include natural-gas-fired steam tur-bines (STs), hydro power generators, combined-cycle units (CCs), and combustion tur-bines (CTs). These units have different ramping capability - see Fig. 4-1, and they bid different capacity into the regulation and load-following markets. Most of the units have ramping capability below 42 MW/min, and many of them can provide less than 9 MW/min. The latter are mostly STs and CCs. But there are also several very fast hydro units available that can develop more than 50 MW/min.
0
5
10
15
20
25
30
0 6 12 18 24 30 36 42 48 54 60 66 72 78 84 90 96 102
108
114
120
126
132
138
144
150
Ramping Capability, MW/min
Num
ber o
f Uni
ts
Fig. 4-1 California ISO regulating units ramping capability
The ramping capability depends on the generator technology – see Fig. 4-2. STs are pre-vailing in number, but provide very limited ramping capability (between 1 and 3 % of the unit nameplate capacity per minute - see [19] and [20]). CC units provide ramping capa-bility that is very close to the ST units. Faster regulation is normally provided by the hy-dro units. CTs also have similar fast regulation potential. 3 California ISO AGC System Displays (PI Process Book Displays), July 2007.

17
0.1
1.0
10.0
100.0
1000.0
1 3 5 7 9 11 13 15 17 19 21 23 25 27 29 31 33 35 37 39 41
Number of Units
Perc
ent o
f Cap
acity
CTsHydroHydro AggregatesCCsSTs
Fig. 4-2 Ramping capability by technology (percent of capacity per minute)
Table 4-1 provides more details on the ramping capability of different generation tech-nologies. Hydro power units have a significant variance in their responses along with the fast ramping capability.
Table 4-1 Regulating units ramping capability
Unit Type Average Ramping Capability, % of Dependable Capacity per
Minute
Standard Deviation of Ramping Capability, % of Dependable
Capacity per Minute ST 1.8 1.39 CC 2.0 0.88 Hydro Aggregate 13.2 9.17 Hydro 44.5 47.07 CT 20.4 5.60
The California ISO regulation system performance is influenced by the available regula-tion capacity, ramping capability, and the ramp duration capability. (Of course, the units’ responsiveness and performance when they are following the AGC signal have also great importance.)
Generation units on regulation normally bid a fraction of their capacity into the regulation market. An example is provided in Table 4-2 (for an hour ending by 2 p.m. during a summer day in 2007). It is seen that during the analyzed summer hour, the regulating

18
units bid about 16% or less (as an average) of their dependable capacity into the regula-tion market. Table 4-2 Example of units’ regulation capacity and average duration capacity at highest ramp
Unit Type Percent of Units Dependable
Capacity on Regulation, % Average Duration Capability at
Highest Ramp, min ST 9.4 3.9 CC 16.0 5.4 Hydro Aggregate 16.2 1.9 Hydro 16.7 0.9 CT N/A N/A As a result of the limited percent of units’ dependable capacity bid into the regulation market, the units can sustain their maximum ramp for a few minutes only – see Table 4-2. Faster units are more limited in their ramp duration capability. The limited regulation, ramping, and ramp duration capability of each individual unit par-ticipating in the regulation market results in the necessity to involve multiple regulating units into the regulation process at the same time.
Another important observation is that the ISO regulation units can develop a very signifi-cant total ramping capability for the first 1 or 2 minutes; the longer rates may cause po-tential problems for the ISO regulating process. Fig. 4-3 illustrates this finding. In a very short run (about 1 minute), the ISO regulating system is capable of developing a fast ramp exceeding about 150 MW/min (up) and about -50 MW/min (down), but after 2 minutes, this characteristics goes below 50 MW/min (up) and -25 MW/min (down). After 4.5 minutes, the system completely exhausts its regulation up capability, and after 6.5 minutes, the same happens with the regulation down capability. It is important to stress that the California ISO procures a sufficient amount of regulation capacity (normally, 350 MW up and 350 MW down [11], and that the existing maximum ramping capability (about ±160 MW/min) is sufficient to provide compliance with the NERC Control Per-formance Standards [1]. The asymmetry of the ramping capability in Fig. 4-3 is explained by the total deviation of the regulating units from their POP. This deviation leaves less room for the faster units to move in certain directions (in the downward direction in Fig. 4-3).

19
California ISO AGC Ramp-Duration Characteristic (Hour Ending by 2 pm, Summer day)
-150.0
-100.0
-50.0
0.0
50.0
100.0
150.0
200.0
250.0
6.56.05.55.04.54.03.53.02.52.01.51.00.5
Duration, min
Ram
ping
Cap
acity
, MW
/min
Regulation UpRegulation Down
Fig. 4-3 Example of California ISO ramp-duration characteristic
4.2 Actual ADS Ramping Requirements in 2006 The study was based on the California ISO real-time dispatch data for each season in 2006. The data was processed to calculate the actual total ramping requirement that the California ISO automatic dispatch system (ADS) was instructing the supplemental energy (load-following) units to provide [21]. Fig. 4-4 through Fig. 4-7 show histograms of the total ramping capability requirement of the load-following process by season in 2006. The blue bars give the number of occur-rences (frequency) of a ramp within the corresponding 5 MW/min bin. The pink bars in-dicate a 99.7% percentile of the observed ramps. Table 4-3 sums up the results.

20
0
500
1000
1500
2000
2500
3000
3500
-300
-280
-260
-240
-220
-200
-180
-160
-140
-120
-100 -80
-60
-40
-20 0 20 40 60 80 100
120
140
160
180
200
220
240
260
280
300
MW/min
Freq
uenc
y
Fig. 4-4 ADS ramping requirement, Winter 2006
0
500
1000
1500
2000
2500
3000
-300
-280
-260
-240
-220
-200
-180
-160
-140
-120
-100 -80
-60
-40
-20 0 20 40 60 80 100
120
140
160
180
200
220
240
260
280
300
MW/min
Freq
uenc
y
Fig. 4-5 ADS ramping requirement, Spring 2006

21
0
500
1000
1500
2000
2500
3000
-300
-280
-260
-240
-220
-200
-180
-160
-140
-120
-100 -80
-60
-40
-20 0 20 40 60 80 100
120
140
160
180
200
220
240
260
280
300
MW/min
Freq
uenc
y
Fig. 4-6 ADS ramping requirement, Summer 2006
0
500
1000
1500
2000
2500
3000
-300
-280
-260
-240
-220
-200
-180
-160
-140
-120
-100 -80
-60
-40
-20 0 20 40 60 80 100
120
140
160
180
200
220
240
260
280
300
MW/min
Freq
uenc
y
Fig. 4-7 ADS ramping requirement, Fall 2006

22
Table 4-3 ADS ramping Requirements in 2006, MW/min
Season 99.7% Percentile Dec 99.7% Percentile IncWinter -210 210Spring -225 225Summer -215 220Fall -230 210
Dec = decrease, Inc = increase 4.3 Summary and Conclusions for Section 4
! The existing California ISO AGC system is adequate for the current regulation needs.
! The units on regulation offer a wide range of ramping capability beginning from a fraction of 1% (some ST and CC units) of their dependable capacity to 100% and more (some hydro units).
! The units participating in regulation bid a limited percentage of their total capac-ity into the regulation market. Typically, as an average, STs bid about 9% of their dependable capacity, CCs and hydro – about 16%.
! Limited regulation, ramping, and ramp duration capability of ST and CC units participating in the California ISO regulation market results in multiple regulating units used in the regulation process at the same time.
! California ISO regulation can develop a significant total ramping capability (about 160 MW/min) for a few first minutes, but longer ramps may cause poten-tial difficulties with following these ramps.
! The ramping capability in the upward or downward direction can be limited by the deviation of the regulating units from their POP. If the faster units deviate from the POP in one direction, the overall AGC system ramping capability in this direction can be significantly limited.
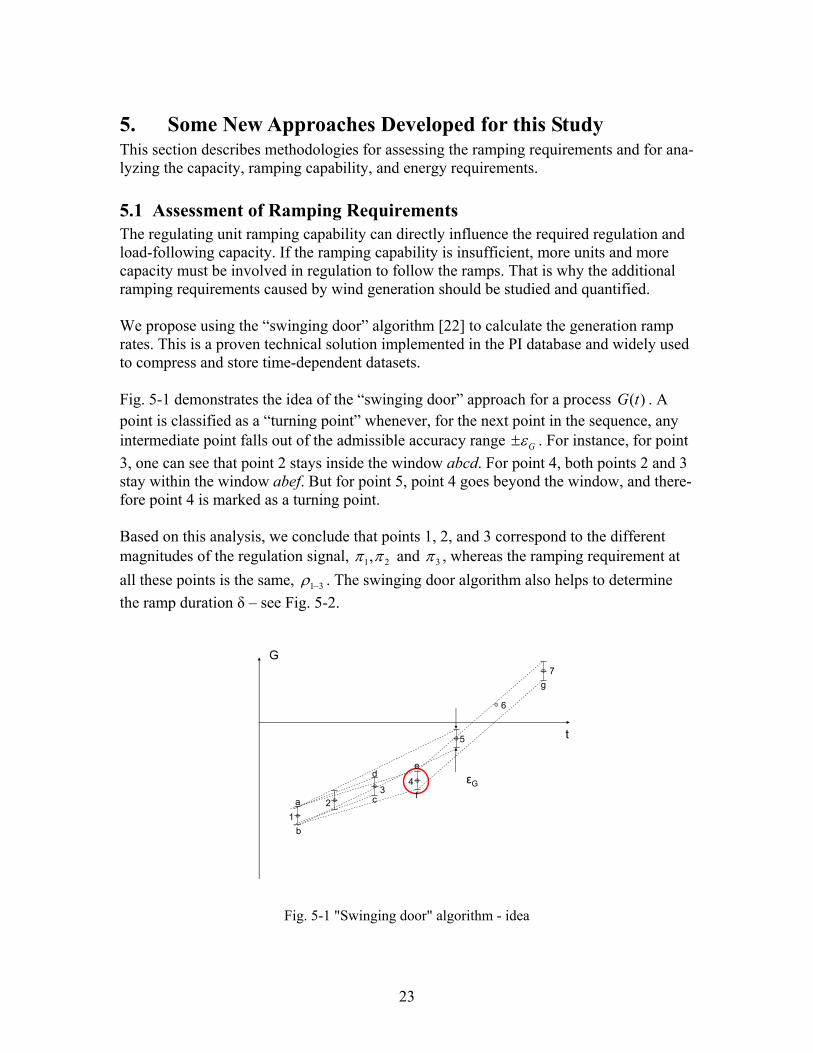
23
5. Some New Approaches Developed for this Study This section describes methodologies for assessing the ramping requirements and for ana-lyzing the capacity, ramping capability, and energy requirements.
5.1 Assessment of Ramping Requirements The regulating unit ramping capability can directly influence the required regulation and load-following capacity. If the ramping capability is insufficient, more units and more capacity must be involved in regulation to follow the ramps. That is why the additional ramping requirements caused by wind generation should be studied and quantified.
We propose using the “swinging door” algorithm [22] to calculate the generation ramp rates. This is a proven technical solution implemented in the PI database and widely used to compress and store time-dependent datasets. Fig. 5-1 demonstrates the idea of the “swinging door” approach for a process ( )G t . A point is classified as a “turning point” whenever, for the next point in the sequence, any intermediate point falls out of the admissible accuracy range G&' . For instance, for point 3, one can see that point 2 stays inside the window abcd. For point 4, both points 2 and 3 stay within the window abef. But for point 5, point 4 goes beyond the window, and there-fore point 4 is marked as a turning point.
Based on this analysis, we conclude that points 1, 2, and 3 correspond to the different magnitudes of the regulation signal, 21,(( and 3( , whereas the ramping requirement at all these points is the same, 31)* . The swinging door algorithm also helps to determine the ramp duration ! – see Fig. 5-2.
G
t
12
34
5
6
7
a
b
c
de
f
g
!G
Fig. 5-1 "Swinging door" algorithm - idea

24
G
t
"1 #1-3
#4-6
"7
"6
"5
"4"3
"2
$1
$2$3
$4
$5
Fig. 5-2 "Swinging door" algorithm – obtaining regulation, ramps, and their duration
5.2 Concurrent Statistical Analysis of the Capacity, Ramping Capabil-ity, and Energy Requirements As discussed before, the regulation capacity and ramping requirements are inherently re-lated. Insufficient ramping capability could cause additional capacity requirements.
In this section, we propose to apply a multivariable statistical analysis to provide a con-current consideration of the regulation and load-following capacity, ramping and ramp duration requirements. For the regulation/load-following requirement (curve G ), we can apply the “swinging door” algorithm and determine the sequences of its magnitudes and ramps, ,..., 21 (( ,
,..., 21 ** , and energy requirement 1 2, ,...& & . The triads + ,, ,i i i( * & can be used to populate the three-dimensional space of these parameters – see Fig. 5-3. For given ranges of these three parameters, *( -- , and &- , a box can be plotted in this space, so that some triads are inside the box ( inN ), some are outside ( outN ). This ap-proach helps to determine the probability of being outside the box,
inout
outout NN
Np"
$ (5.1)
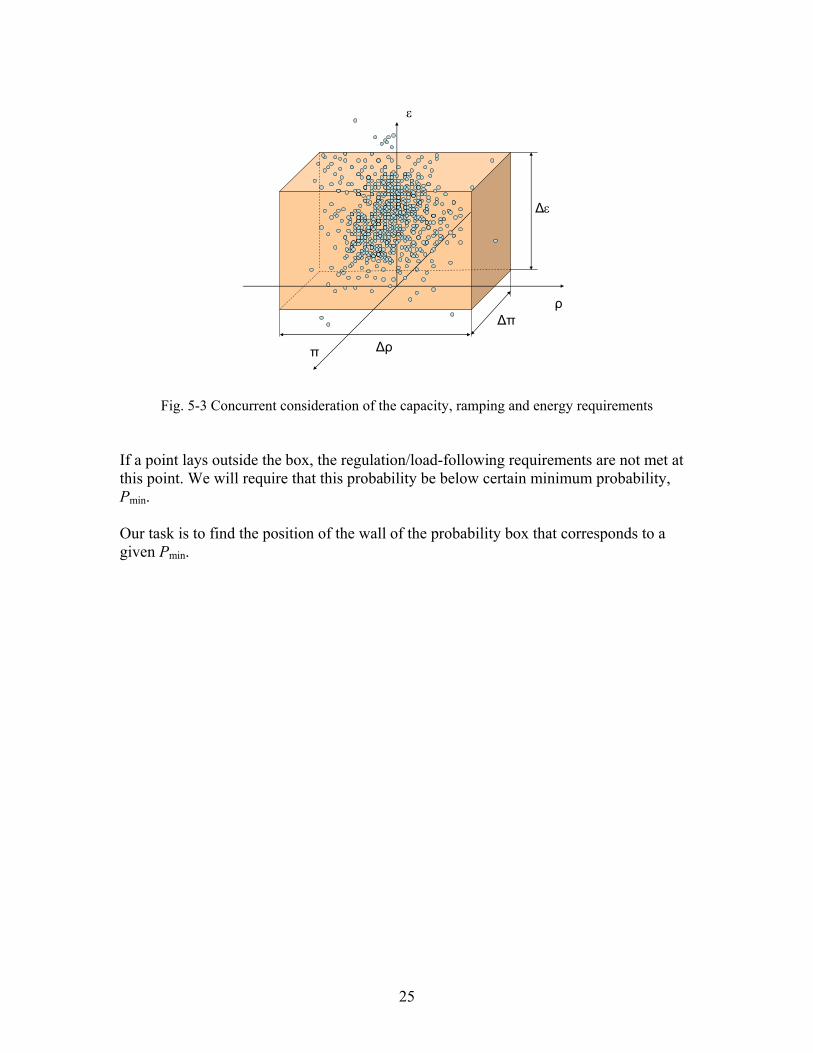
25
"
#%"
%#
%&
&
Fig. 5-3 Concurrent consideration of the capacity, ramping and energy requirements
If a point lays outside the box, the regulation/load-following requirements are not met at this point. We will require that this probability be below certain minimum probability, Pmin.
Our task is to find the position of the wall of the probability box that corresponds to a given Pmin.

26
6. Analysis of Relative Effectiveness of Fast Regulation Re-sources for Regulation The content of this section contains a significant development and revision of the initial ideas developed by Yuri Makarov in his works for the Electric Power Research Institute (EPRI) [23] and Beacon Power Corporation4, [24]. Reference [23] contains concepts of control efficiency and optimal control. Beacon power consultant report4 proposed and analyzed a relative effectiveness metric to evaluate the following merits of having fast regulation resources (flywheel energy storage) in the system. The relative effectiveness E4 is measured as the ratio of conventional capacity needed to balance the ACE to flywheel capacity required for the same purpose5:
Required Conventional Capacity, MWRequired Flywheel Capacity, MW
E $ (6.1)
It has been found that the effectiveness of the flywheel regulator is an average of 1.5 to 6 times higher comparing to the ST and CC generators. Experiments also showed that an average 1 MW of flywheel regulation capacity can substitute for about 2 MW of the tra-ditional regulation mix (average effectiveness - 2.03, minimum - 1.13, and maximum - 3.28). The Beacon Power study was based on a very limited amount of California ISO data (10 days of 1 month in summer, 2005), and available generic information on the ramping capability of different generation technologies provided in [25]. This study re-vises and improves the methodology, used more representative dataset (36 days repre-senting all 12 months of 2006), and employs the actual ramping characteristics of the units participating in the California regulation market.
6.1 “Optimal” AGC Control and Regulation The optimal AGC control concept is introduced to provide a baseline for comparing the observed AGC control against some ideal “would be” AGC control, when the regulating resources have unlimited capabilities in terms of their response time, energy output, abil-ity to frequently reverse their output, ability to respond and follow the AGC setpoint changes, and size. This type of control or its variants can be implemented using fast re-sponsive regulation resources.
The “optimal” AGC control is defined as a control algorithm that minimizes the actual amount of control to the amount that is “absolutely necessary” to provide CPS1 and CPS2 compliance based on the assumption that the response of regulating units is instan-taneous, that they have unlimited ramping and cycling capability, that the magnitude of control is unlimited, and that the ability of the resources to sustain their output is also unlimited.
4 Y.V. Makarov, “Relative Regulation Capacity Value of the Flywheel Energy Storage Resource,”, Con-sultant Report for Beacon Power Corp., November 26, 2005 5 This formula for the effectiveness metric was actually proposed by Mr. Bill Capp, Beacon Power Corp.

27
The full flexibility of the hypothetical ideal regulation resource allows basing the AGC control directly on the CPS1 and CPS2 requirements; applying the control only when it is necessary; and determining the precise application time, size, shape, and duration of the regulation signal. This flexibility allows minimizing the required amount of regulation. The efficiency concept helps to quantify the relative expected effect.
The definition of the optimal control is somewhat ambiguous (i.e., the control is actually suboptimal) because of our inability to foresee the exact future changes of ACE. Because of this evident suboptimality, there are multiple possible approaches to develop the “op-timal” control algorithms. In this report, we suggest two of them: the full predictive CPS2-based methodology and a simplified CPS2-based methodology based on the cur-rent values of ACE. The simplified version has been used to evaluate the relative effi-ciency of fast regulation resources in the California ISO system. The intention is to im-plement the full version in the subsequent research.
6.2 Calculating ACE Without Regulation The California ISO ACE contains the total regulation TotalR , Total Up DnR R R$ " (6.2) which includes regulation up and regulation down components, Up 0R . and Dn 0R / , and the automatic time error correction signal ATE, [26], [27], that helps to minimize the number of manual time error corrections in the Western Interconnection and minimize the inadvertent interchange accumulated by the California ISO. For NERC compliance purposes, ACE without ATE is used:
NERCACE ACE ATE$ ) (6.3) For simulations used in this study, we need to calculate ACE without regulation NoReg NERC TotalACE ACE R$ ) (6.4) This NoRegACE models a simulated ACE that would be observed in the system if no regu-lation is used in the system. We will need this ACE to calculate and apply an alternative regulation signal, such as the “ideal” regulation signal.
6.3 The Concept of CPS2-based “Optimal” Control and Algorithm The CPS2 performance standard requires that the 10-minute averages of the area control error (ACE)6 stay within the CPS2 L10 limits [1], [26]:
6 Note that the California ISO implements the automatic time error correction by modifying the ACE equa-tion [28]. In (6.5), one should use the ACE equation defined by NERC [1].

28
10 min 10 101.65 100 i Iavg ACE L B B&) # $ % % % (6.5) where &10 is the interconnection frequency deviations RMS limit (a constant derived from the frequency bound), Hz2; Bi is the control area bias setting, MW/0.1 Hz; BI is the inter-connection bias setting (the sum of frequency bias of the control areas in the respective interconnection), MW/0.1 Hz; and 1.65 is a statistical coefficient.
NERC requires that 90% of the available 10-minute periods within a calendar month are compliant with condition (6.5).
Let us introduce the following additional notations.
t – Time from the beginning of the current time interval, min; T = 10 min;
ACGt0 – Duration of an AGC cycle, min (e.g., 0.0667 min = 4 sec); ACE(t) – Area control error changing in time, MW; C*(t) – “Ideal” regulation signal changing in time, MW; at the beginning of
each 10-minute interval, C*(0) = 0; and
10L0 – Adjustable parameter (CPS2 compliance margin), MW.
The following expression is used to calculate the amount of optimal control for the next AGC cycle, + ,* ACGC t t0" . This expression is actually based on the CPS2 criterion (6.5). For a current point t within the interval [0, T], it calculates the absolute value of average ACE over the interval [0, T] based on the observed (0 < time # t) and predicted (t < time # T) parts of ACE, denoted as “Term 1” and “Term 2” in (6.6) correspondingly.
0 Optimal Control Is Included Expicitly For Numerical
Simulations Only; In Actual Systems ( ) Already
Includes *( )
TERM1: Observed Average ACE With Optimal
1 ( ) *( )t
ACEC
ACE C dT
11
1 1 1
2 34 54 54 5"4 54 54 54 56 7
8 !"#"$ 9 :
+ ,
10 10
TERM 2: Predicted Average ACE With Optimal Control Included After
Control Included Before
( ) *( )
*
t
t
T t ACE t C t L LT
C t
0)" " # "
;
!""""#""""$
!""""""#""""""$
(6.6)

29
Fig. 6-1explains the idea of optimal control expression (6.6).
( )ACE t
ACE
10:10 10:20t
PredictedFuturePast
TERM 1 TERM 2
10 10L L0"
Control is Needed
Average ACE
t*
Fig. 6-1 Understanding optimal control - A “Term 1” of the “Average ACE” in (6.6) is an integral of ACE(t) over the period [0, t] divided by T. This is the known (observed) part of the average ACE over the entire 10-minute interval [0, T]. Because the ACE is not known after the moment t, is assumed that ACE(t) remains con-stant for the remaining part (t, T] of the current 10-minute interval (this is so called naïve persistence forecast model). “Term 2” of the “Average ACE” in (6.6) corresponds to that predicted part of ACE. At the moment t*, the predicted average ACE exceeds the specified limit 10 10L L0" . This means that a control signal must be applied to prevent a CPS2 violation within the current 10-minute interval. The “optimal” control signal is remarkably simple: it must be opposite of a violation of ACE(t) above 10 10L L0" or below – ( 10 10L L0" ) - see Fig. 6-2.

30
, *ACE C( )ACE t
10:20t
FuturePast
TERM 2
10 10L L0"
Control
Average ACE
t* t**
TERM 1
Fig. 6-2 Understanding optimal control - B Fig. 6-2 shows the last minutes of the 10-minute period and illustrates what the optimal control would look like to the future period (t, T]. At the moment t, the forecasted aver-age ACE exceeds the specified threshold, 10 10L L0" . Point t* is the expected moment of this violation. This is a triggering signal to start applying the corrective control at the moment t. (Note that in the proposed version of the optimal control approach, the correc-tive action is actually applied before the actual violation is expected to occur.) The mag-nitude of correction is selected to oppose any further increase of the projected average ACE. The corrective action stops as soon as the projected average ACE becomes less or equal to 10 10L L0" . Therefore, the control signal selection procedure is as follows.
A) If
9 : 9 : 10 100
1 ( ) *( ) ( ) *( )t T tACE C d ACE t C t L L
T T1 1 1 0)" " " # "8 (6.7)
Then *( ) 0C t $ (6.8)
B) If
9 : 9 : 10 100
1 ( ) *( ) ( ) *( )t T tACE C d ACE t C t L L
T T1 1 1 0)" " " < "8 (6.9)
Then

31
9 :10 100
1*( ) ( ) *( ) ( )tTC t L L ACE C d ACE t
T t T0 1 1 1
= >? ?$ " ) " )@ A) ? ?B C8 (6.10)
C) If
9 : 9 : + ,10 100
1 ( ) *( ) ( ) *( )t T tACE C d ACE t C t L L
T T1 1 1 0)" " " / ) "8 (6.11)
Then
+ , 9 :10 100
1*( ) ( ) *( ) ( )tTC t L L ACE C d ACE t
T t T0 1 1 1
= >? ?$ ) " ) " )@ A) ? ?B C8 (6.12)
6.4 Simplified Procedure for Calculating the “Optimal” Control The procedure developed in this study and reported above can be simplified to meet the purpose of the fast regulation efficiency analysis. It can be reduced to the “peak shaving” approach that provides less accurate, but still satisfactory assessment.
Fig. 6-3 illustrates the “peak shaving approach”. The range from 10L) to 10L" is consid-ered as a “dead zone”. If the area control error ACE (instantaneous value) stays within that zone, no regulation is needed. If it goes beyond the dead zone, it triggers a regulation capacity requirement ( )t( . The size of this requirement is equal to the size of the viola-tion, but the sign is opposite, that is.
D E10
10 10
Violation above or below
10
( ) ( ) sign ( ) , if ( )
( ) 0, if ( )L
t ACE t ACE t L ACE t L
t ACE t L
(
(
2 3$ ) ) % <6 7
$ #
!"""""#"""""$ (6.13)
The slope of the regulation curve, shown in the bottom part of Fig. 6-3, corresponds to the regulation rate requirement or the regulation ramping requirement, which is the same:
t(* -
$-
(6.14)
In the algorithm, it is calculated as the Excel TREND function over a moving interval of 1 minute (including 15 4-second AGC cycle points).
The energy requirement is the accumulated area above 10L" or below 10L) lines in Fig. 6-3.
0
( ) ( )t
t d& ( 1 1$ 8 (6.13)

32
“Optimal”RegulationSignal
ACE
+L10
-L10
Energy
RegulationRequirement
RegulationRate
Fig. 6-3 Illustration of "peak shaving" approach
The energy consideration becomes important if the regulation resources have a limited energy storage capacity, for instance, the flywheels or batteries.
The idea of this approach is to compensate only the ACE deviations what exceed 10L" of are below 10L) . The deviations will be compensated as soon as they appear, and only in the extent necessary. This is achievable as a result of our assumption about availability of “ideal” regulating units (i.e., very fast responsive regulating resources) in the system.
It is evident that the regulation resources should be able to meet all requirements includ-ing the capacity, ramping and energy requirement in a successful regulation process. At the same time, there is no need to overdo the control objective by trying to meet these objectives 100% of the time. Based on the statistical nature of the NERC Control Per-formance Standards [1], especially based on the most limiting CPS2 standard (6.5), the AGC system must be able to do the job in a certain specified percentage *p of instances, e.g., 95%. This will make the control requirements less burdening for the system. Practi-cally, the percentile approach [29] can do the job.
6.5 Comparing the “Ideal” Control Against the Actual Control The gain achieved by the “ideal control” approach is explained by the following three considerations. First, with the “ideal” resources available, there is no risk of lagging the regulation signal behind the regulation requirement, which could result in a larger regulation requirement for the future moments (for example, because of PI filtering used in the California ISO AGC system).
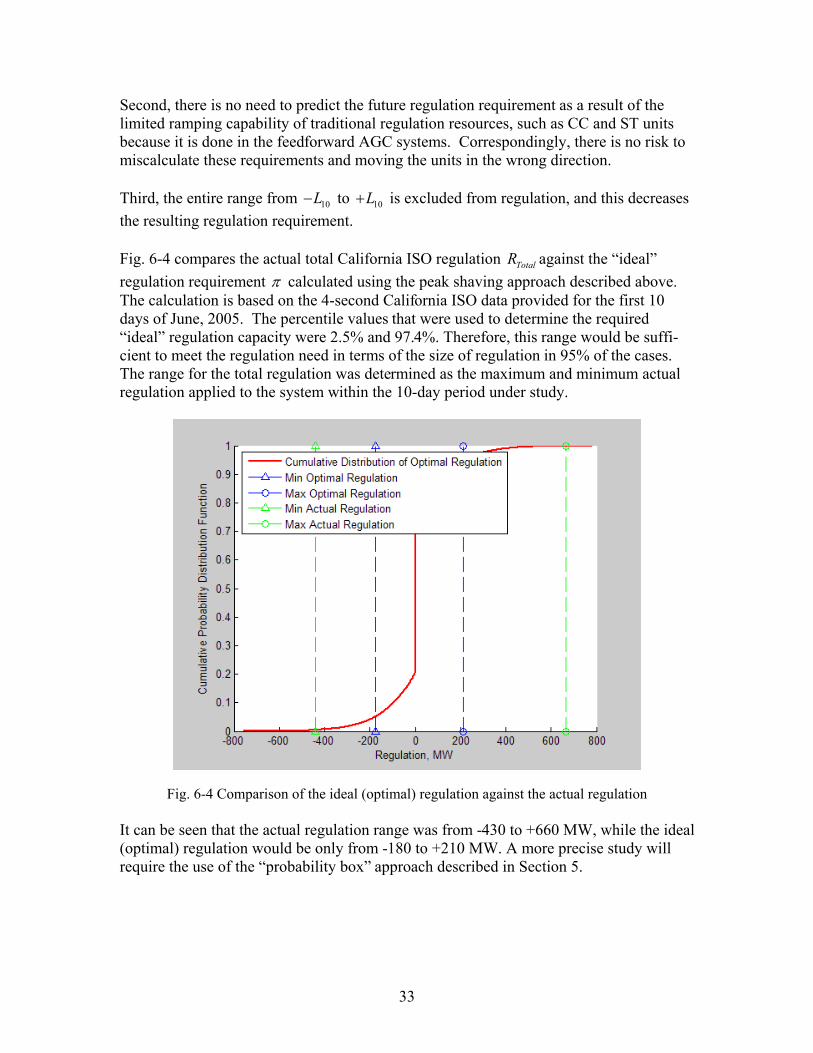
33
Second, there is no need to predict the future regulation requirement as a result of the limited ramping capability of traditional regulation resources, such as CC and ST units because it is done in the feedforward AGC systems. Correspondingly, there is no risk to miscalculate these requirements and moving the units in the wrong direction.
Third, the entire range from 10L) to 10L" is excluded from regulation, and this decreases the resulting regulation requirement.
Fig. 6-4 compares the actual total California ISO regulation TotalR against the “ideal” regulation requirement ( calculated using the peak shaving approach described above. The calculation is based on the 4-second California ISO data provided for the first 10 days of June, 2005. The percentile values that were used to determine the required “ideal” regulation capacity were 2.5% and 97.4%. Therefore, this range would be suffi-cient to meet the regulation need in terms of the size of regulation in 95% of the cases. The range for the total regulation was determined as the maximum and minimum actual regulation applied to the system within the 10-day period under study.
Fig. 6-4 Comparison of the ideal (optimal) regulation against the actual regulation It can be seen that the actual regulation range was from -430 to +660 MW, while the ideal (optimal) regulation would be only from -180 to +210 MW. A more precise study will require the use of the “probability box” approach described in Section 5.
34
6.6 Efficiency of Fast Regulation Study Results The dataset used in this study included 36 days of 4-second data for 2006. The selected days were the 1, 15 and 30 day of each month in this year (except February). The data included the following types of information:
! NERCACE - California ISO ACE, MW
! UpR , DnR - Actual ISO regulation up and down values, MW
! 10L - California ISO CPS2 limit (during 2006, it was changed from 116.27 MW to 117.33 MW)
! Ramping capability information for generating units participating in regulation from the California ISO EMS system7
! Information on the unit technology and dependable capacity [19], [20]. To avoid potential confidentiality issues, unit-specific information is not included in this report. Overall characteristics on the California ISO regulating units are provided in Sec-tion 4.
The simplified methodology described in Section 6.4 was implemented and applied to evaluate the relative efficiency of fast regulation resources against the traditional genera-tion technologies used in the California ISO regulation control loop. The efficiency met-ric (6.1) was adopted to quantify the relative efficiency for each study day.
Table 6-1 reports the study results by generation technology. Analyzed technologies in-clude hydro units, combustion turbines (CTs) fueled by natural gas, steam turbines (STs) fueled by natural gas, and combined-cycle units (CCs) fueled by natural gas. Additioally, the efficiency of existing regulation mix for one of the hours in 2007 was evaluated. Results were different depending on the ramping capability of the units. This ramping capability is shown in Table 6-1 in percent of the corresponding units’ dependable capac-ity. The relative efficiency of an ideal regulation resource, which can develop a ramp equal to 100% of its capacity per minute, equals to 1.
From Table 6-1, it can be observed that the relative efficiency of fast (ideal) regulating resources depends on the ramping capability of the traditional units. The fastest hydro units, which can develop ramps of 100% of their capacity per minute, have the same effi-ciency as the ideal regulation resources.
7 California ISO AGC System Displays (PI Process Book Displays), July 2007.

35
Table 6-1 Relative efficiency of fast regulation (unlimited energy)
Ramp, %/min MIN AVG MAX STDIdeal Resource MIN=MAX 100.0% 1.00 1.00 1.00 0.00
0.00 0.00 0.00 0.00Hydro MIN 2.5% 15.63 22.00 30.53 3.58
AVG 32.0% 1.31 1.72 2.38 0.27MAX 100.0% 1.00 1.00 1.00 0.00
CT MIN 13.4% 2.92 4.10 5.70 0.67AVG 20.4% 1.92 2.70 3.74 0.44MAX 27.9% 1.47 1.97 2.74 0.32
ST MIN 0.1% 390.80 549.92 763.16 89.50AVG 1.9% 20.57 28.94 40.17 4.71MAX 7.6% 5.14 7.24 10.04 1.18
CC MIN 0.5% 78.16 109.98 152.63 17.90AVG 2.0% 19.54 27.50 38.16 4.47MAX 3.1% 12.61 17.74 24.62 2.89
Existing mix and AGC control 1.00 1.43 1.83 0.20
As an average, an ideal resource is 1.72 times more efficient that the hydro units. This means that 1 MW of fast regulating capacity can substitute 1.72 MW of hydro generation dependable capacity for the mix of the hydro units for regulation in the California ISO service area. This relative efficiency characteristic is changing from day to day in the range from 1.31 to 2.38. The standard deviation from average is 0.27. The ideal regula-tion is between 15 and 30 times more efficient than the slowest hydro units, which can only provide ramps equal to 2.5% of their capacity per minute.
The ideal regulation is 2.7 times more efficient than combustion turbines. The fastest CTs in the ISO system develop ramps up to 28% of their capacity per minute, which corre-spond to relative efficiency E = 1.47. The worst efficiency index for CTs is 5.7.
Steam turbine units have a very low relative efficiency index compared to the ideal regu-lation resources. Their efficiency index varies from 5.14 to several hundreds, depending on their ramping capability. The average efficiency is about 29. Combined-cycle units have relative efficiency indices similar to STs. The last line in Table 6-1 provides a very interesting insight on the overall efficiency of the California ISO AGC system. Because the actual total regulation signal was compared against the ideal regulation signal, this characteristic reflects the overall efficiency of the California ISO regulation loop by comparing it with an “ideal” loop.
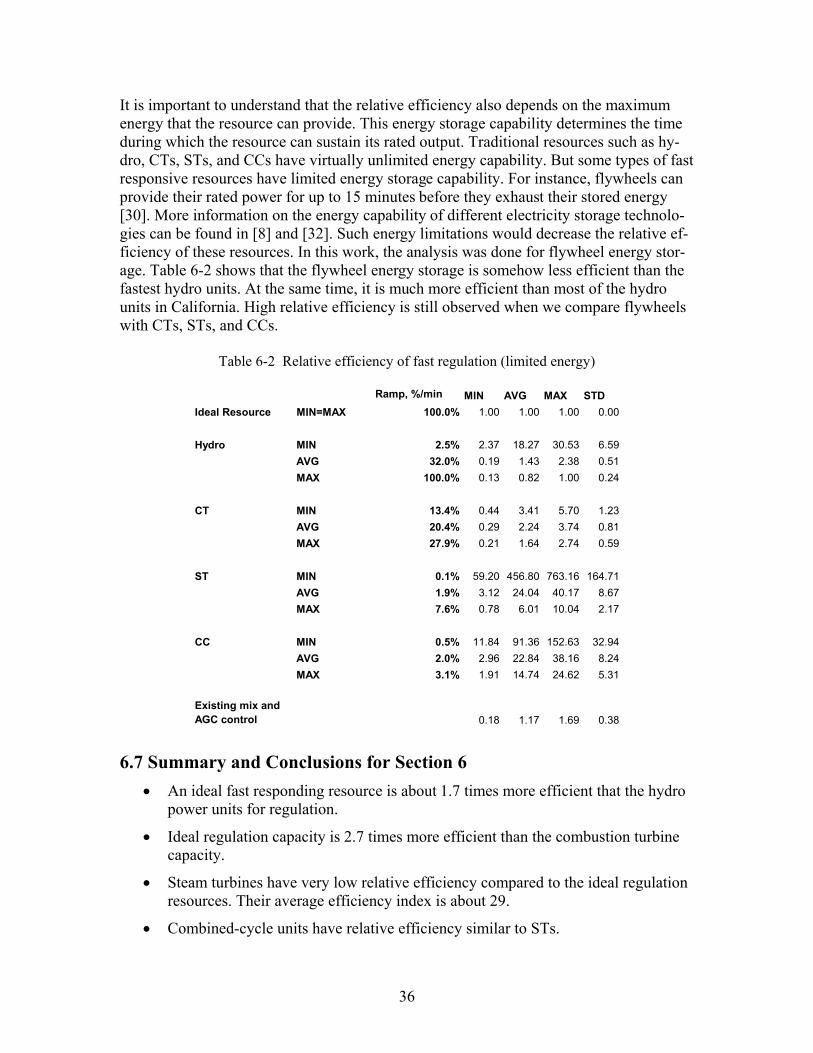
36
It is important to understand that the relative efficiency also depends on the maximum energy that the resource can provide. This energy storage capability determines the time during which the resource can sustain its rated output. Traditional resources such as hy-dro, CTs, STs, and CCs have virtually unlimited energy capability. But some types of fast responsive resources have limited energy storage capability. For instance, flywheels can provide their rated power for up to 15 minutes before they exhaust their stored energy [30]. More information on the energy capability of different electricity storage technolo-gies can be found in [8] and [32]. Such energy limitations would decrease the relative ef-ficiency of these resources. In this work, the analysis was done for flywheel energy stor-age. Table 6-2 shows that the flywheel energy storage is somehow less efficient than the fastest hydro units. At the same time, it is much more efficient than most of the hydro units in California. High relative efficiency is still observed when we compare flywheels with CTs, STs, and CCs.
Table 6-2 Relative efficiency of fast regulation (limited energy)
Ramp, %/min MIN AVG MAX STDIdeal Resource MIN=MAX 100.0% 1.00 1.00 1.00 0.00
Hydro MIN 2.5% 2.37 18.27 30.53 6.59AVG 32.0% 0.19 1.43 2.38 0.51MAX 100.0% 0.13 0.82 1.00 0.24
CT MIN 13.4% 0.44 3.41 5.70 1.23AVG 20.4% 0.29 2.24 3.74 0.81MAX 27.9% 0.21 1.64 2.74 0.59
ST MIN 0.1% 59.20 456.80 763.16 164.71AVG 1.9% 3.12 24.04 40.17 8.67MAX 7.6% 0.78 6.01 10.04 2.17
CC MIN 0.5% 11.84 91.36 152.63 32.94AVG 2.0% 2.96 22.84 38.16 8.24MAX 3.1% 1.91 14.74 24.62 5.31
Existing mix and AGC control 0.18 1.17 1.69 0.38
6.7 Summary and Conclusions for Section 6
! An ideal fast responding resource is about 1.7 times more efficient that the hydro power units for regulation.
! Ideal regulation capacity is 2.7 times more efficient than the combustion turbine capacity.
! Steam turbines have very low relative efficiency compared to the ideal regulation resources. Their average efficiency index is about 29.
! Combined-cycle units have relative efficiency similar to STs.
37
! Energy limitations decrease the relative efficiency of fast responsive resources. The analysis was done for flywheel energy storage; it is somehow less efficient with the fastest hydro units, but it is still significantly most efficient then the most of the hydro units in California. High relative efficiency is observed when we compare flywheels with CTs, STs, and CCs.
! Faster responsive resources involved in regulation can help to reduce California ISO’s regulation procurement by up to 40%.
! California ISO may consider creating better market opportunities for fast respon-sive resources.

38
7. Analysis of the Load-Following and Regulation Needs at High Wind Power Penetration Levels in 2010 The analysis has been conducted using the methodology and datasets described in [2], [34], and in Section 5. The wind generation impact analysis methodology is based on a model of the actual California ISO’s scheduling, real time dispatch, and regulation proc-esses and their timelines. Minute-to-minute variations and statistical interactions of the system parameters involved in these processes are depicted with sufficient details to pro-vide a robust and accurate assessment of the additional capacity, ramping and ramp dura-tion requirements that the California ISO automatic regulation control (AGC) and load-following automatic dispatch system (ADS) systems will be facing in the year 2010.
7.1 Main Results of the Recent California ISO/Battelle Study [34] The study provides an assessment of the additional capacity, ramping and ramp duration requirements that the California ISO regulation and load-following systems will be facing in the year 2010. These requirements are compared to 2006 requirements simulated in the same way.
7.1.1 Methodology Area control error. The California ISO’s operations control objective is to minimize its area control error (ACE) to the extent sufficient to comply with the NERC Control Per-formance Standards. Therefore, the “ideal” regulation/load-following signal is the signal that opposes deviations of ACE from zero when it exceeds a certain threshold:
+ , + ,10
min
a s a s
Neglected
s s a a
ACE I I B F F
G L G L
)$ ) )
F ) ) " ;
!""#""$
(7.1)
where Ia denotes net interchange (MW flow out of the control area); Is refers to scheduled net interchange; B is area frequency bias constant; Fa and Fs are actual and scheduled fre-quency, respectively. The generation component of the ACE equation can be represented as follows:
ws ha ha
lf r w uda s
G G GG G G G G G
$ "
$ "- "- "- "- (7.2)
where ha denotes the hour-ahead generation schedule; lf denotes instructed deviations from the hour-ahead schedule caused by generators involved into the load-following process; r denotes instructed deviations caused by generators involved into the regulation process; "Glf
and "Gr are the deviations of the regulation and load-following units from their base points; "Gw
is the deviation of the wind generators from their schedule (wind generation real-time schedule forecast error); and "Gud
is the total deviation of generators from the dispatched instructions. "Gud
is simulated similarly to the load-forecast error.

39
The total deviation of generators from dispatch instructions for the conventional units that are not involved in regulation and load-following can be represented as follows: ud
a haG G G- $ ) w w w
a ha
a ha
G G GL L L
- $ )- $ )
(7.3)
Because the control objective is ACE # 0, Equation (7.1) can be rewritten as:
udwrlf GGLGG -)-)-$-"- (7.4) where "L - is the deviation of the actual load from its real-time scheduled value (load forecast error).
Equation (7.4) is written for instantaneous values of -L, -Gw, and -Gud
. Therefore, the statistical interaction between the load forecast error and the wind generation forecast er-ror is fully preserved in Equation (7.4). The load and wind generation errors can vary de-pending on the wind generation penetration level within the California ISO control area and the accuracy of the load forecast compared to the accuracy of the wind generation forecast. Because the percent wind generation forecast error is more significant than the percent load-forecast error, the former may have a considerable impact on -Glf + -Gr. Load-following and regulation assessment. Load-following is understood as the differ-ence between the hourly energy schedule including 20-minute ramps (shown as the red line in Fig. 7.1) and the short-term 5-minute forecast/schedule and applied “limited ramp-ing capability” function (blue line). This difference is also shown as the blue area below the curves. Regulation is interpreted as the difference between the actual California ISO generation requirement and the short-term 5-minute dispatch shown as the red area be-tween the blue and green lines.
By simulating hour-ahead and 5-minute schedules for load and hour-ahead schedules for wind generation, regulation can be separated from load-following. The schedule/forecast based approach uses the short-term forecasts of wind generation and load, ,
,5minw yrtfG and
,5minyrtfL . In this case, the following formulas can be used:
, ,
,5min ,5min, ,
,5min ,5min ,1 ,1
( ) ( ) ( ) ( ) ( ),
( ) ( ) ( ) ( ) ( )
y w y y w yra a rtf rtf
lf y w y y w yrtf rtf ha hr ha hr
G m L m G m L m G m
G m L m G m L m G m
- $ ) ) "
- $ ) ) " (7.5)

40
t
MW
“Regulation”
“LoadFollowing”
ws sL G)
wa aL G)+ ,5 min 5 min
wL G) )G )
Fig. 7-1 Separation of regulation from load-following based on simulated hour-ahead schedule
7.1.2 Main Study Results Load following. Fig. 7-2 shows hourly capacity requirements for load-following “with wind” and “without wind” for 2006 and 2010. The impact of wind generation on load-following for each hour is plotted. The upper part of the diagram shows the maximum load-following capacity increase in MW, while the maximum capacity decrease is shown in the lower part of diagram. The wide green arrows show the load following capacity for each hour in 2006, and the thin red arrows denote load following capacity for 2010. The tail of each arrow represents the load following capacity requirement “without wind,” and the tip of each arrow shows the capacity necessary “with wind.” As shown, the maximum upward 2010 capacity requirement of 3500 MW occurs during HE38 and HE11. Also, the maximum downward capacity requirement of 3,450 MW occurs during HE24. The maximum increase in load-following capacity was 800 MW, which occurred during HE3 (3500 – 2700). The maximum downward capacity increase of 500 MW (3050 - 2450) occurred in HE22.
With no wind, the level of load-following capacity slightly increased in 2010 above the 2006 levels because the increase is only caused by a load growth factor of 1.5 % per year. Also, the pattern of load-following variation “with wind” between 2006 and 2010 is caused by the different trends in wind production between the two study years.
Fig. 7-3 shows the hourly load-following ramping requirements caused by wind only for 2010 (red arrow) compared to wind only for 2006 (green arrow). It is expected that the maximum upward load-following ramping requirements in 2010 will increase by 40 MW/min (HE23: 210 – 170). Similarly, the maximum downward load following ramp-ing requirements will increase by 40 MW/min (HE9:180 – 140).
8 HEXX means “hour ending by XX”.

41
1 2 3 4 5 6 7 8 9 10 11 12 13 14 15 16 17 18 19 20 21 22 23 242200
2400
2600
2800
3000
3200
3400
3600Load Following, Summer, Year 2010 vs.2006
Max L
oad F
ollow
ing C
apac
ity, In
c, MW
1 2 3 4 5 6 7 8 9 10 11 12 13 14 15 16 17 18 19 20 21 22 23 24−3600
−3400
−3200
−3000
−2800
−2600
−2400
−2200
Hours Ending
Max L
oad F
ollow
ing C
apac
ity, D
ec, M
W
Fig. 7-2 Hourly capacity diagrams for load following scenarios with wind and without wind in
2006 and 2010
1 2 3 4 5 6 7 8 9 10 11 12 13 14 15 16 17 18 19 20 21 22 23 240
50
100
150
200
250Load Following, Summer, Year 2010 vs.2006
Max L
oad F
ollow
ing R
amp R
ate, In
c, MW
/min
1 2 3 4 5 6 7 8 9 10 11 12 13 14 15 16 17 18 19 20 21 22 23 24−180
−160
−140
−120
−100
−80
−60
−40
Hours EndingMax L
oad F
ollow
ing R
amp R
ate, D
ec, M
W/mi
n
Fig. 7-3 Hourly ramp rate diagrams for load following scenarios with wind and without wind in
2006 and 2010 Fig. 7-4 shows the upward ramp duration is required for approximately 30 minutes, while the downward ramp duration will be required for approximately 20 minutes. Overall, the upward load-following capacity should be about 3500 MW, and resources within the sup-plemental stack should be able to ramp up at a rate of about 80 MW/min for at least 30
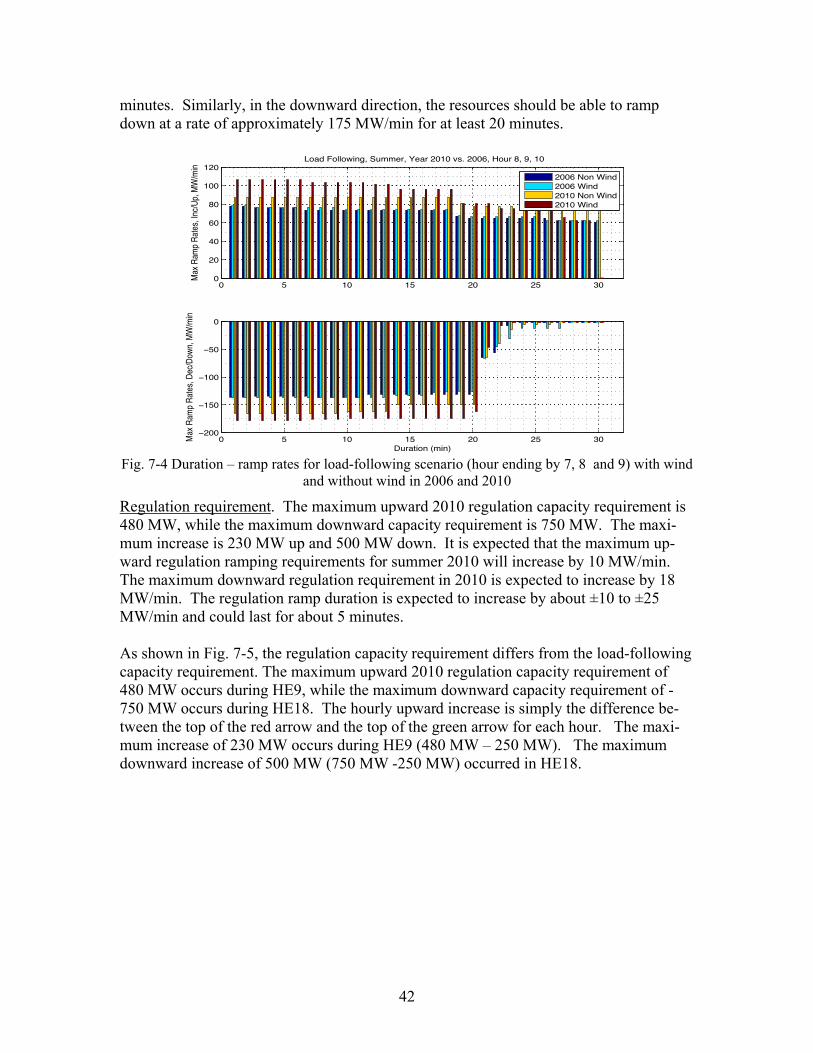
42
minutes. Similarly, in the downward direction, the resources should be able to ramp down at a rate of approximately 175 MW/min for at least 20 minutes.
0 5 10 15 20 25 300
20
40
60
80
100
120
Max R
amp R
ates,
Inc/U
p, MW
/min
Load Following, Summer, Year 2010 vs. 2006, Hour 8, 9, 10
0 5 10 15 20 25 30−200
−150
−100
−50
0
Duration (min)
Max R
amp R
ates,
Dec/D
own,
MW/m
in2006 Non Wind2006 Wind2010 Non Wind2010 Wind
Fig. 7-4 Duration – ramp rates for load-following scenario (hour ending by 7, 8 and 9) with wind
and without wind in 2006 and 2010
Regulation requirement. The maximum upward 2010 regulation capacity requirement is 480 MW, while the maximum downward capacity requirement is 750 MW. The maxi-mum increase is 230 MW up and 500 MW down. It is expected that the maximum up-ward regulation ramping requirements for summer 2010 will increase by 10 MW/min. The maximum downward regulation requirement in 2010 is expected to increase by 18 MW/min. The regulation ramp duration is expected to increase by about ±10 to ±25 MW/min and could last for about 5 minutes.
As shown in Fig. 7-5, the regulation capacity requirement differs from the load-following capacity requirement. The maximum upward 2010 regulation capacity requirement of 480 MW occurs during HE9, while the maximum downward capacity requirement of -750 MW occurs during HE18. The hourly upward increase is simply the difference be-tween the top of the red arrow and the top of the green arrow for each hour. The maxi-mum increase of 230 MW occurs during HE9 (480 MW – 250 MW). The maximum downward increase of 500 MW (750 MW -250 MW) occurred in HE18.

43
1 2 3 4 5 6 7 8 9 10 11 12 13 14 15 16 17 18 19 20 21 22 23 24200
250
300
350
400
450
500Regulation, Summer, Year 2010 vs.2006
Max R
egula
tion C
apac
ity, In
c, MW
1 2 3 4 5 6 7 8 9 10 11 12 13 14 15 16 17 18 19 20 21 22 23 24−800
−700
−600
−500
−400
−300
−200
Hours Ending
Max R
egula
tion C
apac
ity, D
ec, M
W
Fig. 7-5 Hourly capacity diagrams for regulation scenarios with wind and without wind in 2006
and 2010 Fig. 7-6 shows the hourly regulation ramping requirements caused by the addition of only wind. It is expected that the maximum upward regulation ramping requirements for 2010 summer will increase by 10 MW/min (HE10: 140 MW – 130 MW). The maximum downward regulation requirement in 2010 is expected to increase by 18 MW/min (HE10: 115 - 97). This is not expected to create any operational concerns because it falls within the ramping capability of the existing units. The regulation ramp duration is expected to increase by about ±10 to ±25 MW/min and could last for about 5 minutes.
1 2 3 4 5 6 7 8 9 10 11 12 13 14 15 16 17 18 19 20 21 22 23 2460
80
100
120
140Regulation, Summer, Year 2010 vs.2006
Max R
egula
tion R
amp R
ate, In
c, MW
/min
1 2 3 4 5 6 7 8 9 10 11 12 13 14 15 16 17 18 19 20 21 22 23 24−120
−110
−100
−90
−80
−70
−60
Hours EndingMax R
egula
tion R
amp R
ate, D
ec, M
W/mi
n
Fig. 7-6 Hourly ramp rate diagrams for regulation scenarios with wind and without wind in 2006
and 2010

44
Fig. 7-7 shows both the upward and downward ramp durations are required for about 5 minutes. Overall, the upward regulating capacity needs to be about 480 MW and re-sources within the supplemental stack should be able to ramp up at a rate of about 80 MW/min for at least 5 minutes. Similarly, in the downward direction, the regulating ca-pacity needs to be about -750 MW and resources should be able to ramp down at a rate of approximately 80 MW/min for at least 5 minutes.
0 1 2 3 4 5 6 7 80
20
40
60
80
100
120
140
Max R
amp R
ates,
Inc/U
p, MW
/min
Regulation, Summer, Year 2010 vs. 2006, Hour 8, 9, 10
2006 Non Wind2006 Wind2010 Non Wind2010 Wind
0 1 2 3 4 5 6 7 8−120
−100
−80
−60
−40
−20
0
Duration (min)
Max R
amp R
ates,
Dec/D
own,
MW/m
in
Fig. 7-7 Duration – ramp rates for regulation scenario (hour ending by 7, 8 and 9) with wind and
without wind in 2006 and 2010
7.2 Summary and Conclusion for Section 7 ! It is expected that the maximum upward and downward load-following ramping
requirements in 2010 will increase by +40 MW/min and –40 MW/min corre-spondingly. Although this is an insignificant increase, for the purposes of this study, it is important that the upward ramp duration is available for approximately 30 minutes while the downward ramp duration will be available for approxi-mately 20 minutes. This means that the ISO supplemental energy units will be re-quired to provide longer ramps.
! It is expected that the maximum upward regulation ramping requirements for 2010 summer will increase by 10 MW/min. The maximum downward regulation requirement in 2010 is expected to increase by 18 MW/min. The regulation ramp duration is expected to increase by about ±10 to ±25 MW/min and could last for about 5 minutes.

45
8. Value of Fast Responsive Resources Depending on Ramp-ing Capability
8.1 Study Results This study has been conducted in response to the SOW objective “…evaluate what power is worth on different time scales9”. The methodology used in the study and datasets were the same as the one used in Section 7.
The relationship between the capacity, ramping capability and energy has been examined using the “probability box” approach reported in Section 5. The idea behind this study is that these characteristics are inherently connected. Insignificant ramping capability could lead to additional capacity requirements.
Fig. 8-1 and Fig. 8-2 illustrate experimentally obtained dependence of the required load-following and regulation capacity on the maximum ramping capability of the units par-ticipating in these services.
40 60 80 100 120 140 160 1801000
1200
1400
1600
1800
2000
2200
2400
2600
2800
Capacity v.s. Ramp Rates Load Following, 2006, Spring, Unlimited Energy
Ramp Rates (MW/min)
Capa
city
(MW
)
P = 99.8%P = 98%P = 96%P = 94%P = 92%P = 90%
Fig. 8-1 Spring 2006 load-following capacity – ramp rate diagram for different percentiles
9 Proposed by Mike Gravely, California Energy Commission.

46
0 50 100 150 200 250 300 350150
200
250
300
350
400
450
Capacity v.s. Ramp Rates Regulation, 2006, Spring, Unlimited Energy
Ramp Rates (MW/min)
Capa
city
(MW
)
P = 99.8%P = 98%P = 96%P = 94%P = 92%P = 90%
Fig. 8-2 Spring 2006 regulation capacity – ramp rate diagram for different percentiles
A fundamental new finding here is that the dependence has a hyperbolic shape signifying an extremely sharp increase of the capacity requirements when the maximum ramping capability is reduced below certain lower thresholds. For instance, for the 98% percentile, this level is about 100 MW/min for load-following and about 45 MW/min for regulation requirements. On the other hand, there is an important upper threshold after which a fur-ther increase of the ramping capability does not provide a noticeable decrease in capacity. For example, for the same 98% percentile, these values are about 140 MW/min for load following and only about 55 MW/min for regulation. Note that these thresholds are actu-ally way below the year 2006 maximum ramping capability of 210-230 MW/min (see Section 0) for load-following and 160 MW/min for regulation. The percentile reflects the desired percent of the cases where the load following and regu-lation systems are capable of meeting the capacity, ramping, and energy requirements. Its value influences the required amounts of the corresponding procurements. For instance, a percentile’s increase from 90% to 99.8% results in about 1000 MW of additional load-following capacity needed in the system, and in about 60 MW/min of additional ramping capacity. The same increment results in about 140 MW of additional regulation capacity and in about 100 MW/min additional ramping requirement. Fig. 8-3 demonstrates the dependence of results from the energy limitations that may be caused by the regulation resources with the limited energy capacity (at 99.8% percentile). The regulation requirements appear to be very sensitive with respect to the energy limita-tions.

47
50 100 150 200 250 300 350 400 450
300
400
500
600
700
800
900
1000
1100
Capacity v.s. Ramp Rates Regulation, 2006, Spring
Ramp Rates (MW/min)
Capa
city
(MW
)
E = 5880 (MWH)E = 5950 (MWH)E = 6050 (MWH)E = Unlimited
Fig. 8-3 Spring 2006 regulation capacity – ramp rate diagram for different energy levels
8.2 Summary and Conclusion for Section 8
! The dependence of the capacity requirements on the ramping capability require-ments has a hyperbolic shape signifying an extremely sharp increase of the capac-ity requirements when the maximum ramping capability is reduced below certain lower threshold. For instance, for the 98% percentile, this level is about 100 MW/min for load-following and about 45 MW/min for regulation requirements. On the other hand, there is an important upper threshold after which a further in-crease of the ramping capability does not provide a noticeable decrease in capac-ity. For example, for the same 98% percentile, these values are about 140 MW/min for load-following and only about 55 MW/min for regulation. Note that these thresholds are actually way below the year 2006 maximum ramping capa-bility of 210-230 MW/min (see Section 4.2) for load-following and 160 MW/min for regulation.
! The desired percent of the cases, where the load-following and regulation systems are capable of meeting the capacity, ramping, and energy requirements, strongly influences the required amounts of the corresponding procurements. A percen-tile’s increase from 90% to 99.8% results in about 1000 MW of additional load following capacity needed in the system, and in about 60 MW/min of additional ramping requirement. The same increment results in about 140 MW of additional regulation capacity and in about 100 MW/min additional ramping requirement.

48
! The regulation requirements appear to be very sensitive with respect to the energy limitations.

49
9. Potential Impacts of BAAL and FRR Standards New NERC and WECC control performance standards introduce some changes to grid operations and create some additional functions that would increase the value of fast re-sponsive and distributed resources.
9.1 Potential Impacts of BAAL Standard The balancing authority ACE limit (BAAL) standard is a part of a new set of control per-formance standards currently under development at NERC [3]. BAAL is designed to re-place CPS2. It establishes frequency-dependent ACE limits.
The following important considerations outlining potential impacts of the BAAL standard on the value of fast regulation resources can be foreseen at this moment:
! A control that opposes frequency deviation always improves area performance against the BAAL. This means that the new standard will not have potential prob-lems with compliance if the regulating resources are control based on the local frequency signals rather than AGC signals.
! Distributed resources that react to local frequency signals will contribute to BAAL compliance without being connected to the CAISO control signal. This would dramatically increase opportunities for distributed resources and decrease associated costs (by eliminating telemetry systems connecting the AGC system with distributed resources).
! BAAL is designed to replace CPS2 standard – no controversy is expected by in-teraction of local frequency-based controls with the CPS2 requirements.
! Unlike the CPS2 standard formulated for 10-minute averages of ACE, the BAAL standard is formulated for instantaneous values of the area control error. This could noticeably increase the value of fast responsive controls to avoid potential BAAL violations.
! Several control areas (for instance, Southern Company) are currently participating in an experiment to check the performance of BAAL. California ISO is not par-ticipating in the experiment. The actual numeric values for the California ISO BAAL limits have not been established yet.
! Expectation is that the BAAL standard will relax the area regulation needs and reduce the regulation burden.
! The BAAL standard is currently experiencing some acceptance problems with in-dustry. Its future is not yet clear.
Suggestions.
! A BAAL-related study is recommended for the California ISO as soon as more clarity is achieved concerning the actual enforcement of the BAAL standard and its numerical values for the California ISO.
50
! The study may involve an assessment of advantages of the distributed frequency-based control for the CAISO system.
! The market-related issues that arise in this connection should also be investigated.
9.2 Potential Impacts of FRR Standard Frequency responsive reserve (FRR) is spinning reserve responsive to frequency. WECC is considering introducing a FRR standard in Western Interconnection [33]. The purpose of the frequency response standard (FRS) is to assure balancing authorities are able to arrest frequency decline and support interconnection frequency during a frequency devia-tion resulting from a loss of generation. FRR establishes control areas’ shares in arresting the frequency decline and supporting frequency until the area, in which the loss of gen-eration resource occurred has recovered its ACE.
The following important considerations outlining potential impacts of the FRR standard on the value of fast regulation resources can be foreseen at this moment:
! FRR requires sufficiently fast responsiveness of participating resources.
! FRR is currently under development at WECC. The final provisions, as well as numerical requirements, are not yet clear.
! Market or other compensation schemes for participation resources are not yet clear.
! Distributed fast frequency responsive resources could definitely and very signifi-cantly contribute to the FRR requirements.
Suggestions. A FRR-related study is recommended for the California ISO as soon as
more clarity is achieved concerning the actual enforcement of the FRR standard and its numerical values for the California ISO.

51
10. Recommendations for Phase 2 ! Incorporating ramping considerations in pricing the ancillary services. Analyze
advantages, disadvantages, and options for incorporating the ramping considera-tion and incentives for fast regulation resources (including distributed resources) into the ancillary market design and settlements (pricing).
! Operating procedures. Investigate if the ramping and ramp duration requirements could be added to the CAISO Ancillary Service Procurement Operating Procedure M-402. Analyze the benefits and potential drawbacks.
! Propose and comprehensively examine a more “scientific” approach to procure regulation service. The existing approach to calculating the required regulation procurement could be supplemented and verified against the more “scientific” method proposed in this report. This will result in minimizing the regulation pro-curement by better differentiation between the operating hours during a day and better adaptation to changing seasonal and monthly operating conditions.
! Analyze the consequences of establishing a more “scientific” target CPS2 compli-ance level. This measure, along with the scientific analysis of regulation require-ments could help to significantly minimize the regulation requirements without compromising the CAISO’s performance characteristics.
! Propose and test new AGC algorithm modifications oriented for more efficient use of fast regulation resources.
! Depending on acceptance and actual availability of factual information on the BAAL and FRR standards, conduct studies reflecting the value of fast and fast distributed resources for providing robust compliance with these standards.

52
11. References [1] “Real Power Balancing Control Performance,” NERC Standard BAL-001-0, Effec-
tive date April 1, 2005. Available online: ftp://www.nerc.com/pub/sys/all_updl/standards/rs/BAL-001-0.pdf
[2] “Integration of Renewable Resources: Transmission and Operating Issues And Rec-ommendations For Integrating Renewable Resources on The California ISO-Controlled Grid,” California ISO Report, November 2007. Available at http://www.caiso.com/1ca5/1ca5a7a026270.pdf.
[3] “Balance of Resources and Demand,” Proposed NERC Standard BAL-007-1, Feb-ruary 2, 2007. Available online: http://www.nerc.com/~filez/standards/Balance-Resources-Demand.html.
[4] “Integration of Renewable Resources: Transmission and Operating Issues And Recommendations For Integrating Renewable Resources on The California ISO-Controlled Grid,” California ISO Report, November 2007. Available online: http://www.caiso.com/1ca5/1ca5a7a026270.pdf.
[5] “Frequency Response Standard,” White Paper, Reserve Issues Task Force, WECC, November 24, 2005. Available online: http://www.wecc.biz/documents/library/RITF/FRR_White_Paper_v12_1-27-06.pdf.
[6] “Ancillary Service Procurement,” California ISO Operating Procedure M-402, Ef-fective: February 1, 2008. Available online: http://www.caiso.com/docs/1998/12/02/1998120218202714536.pdf.
[7] Yuri Makarov, Jian Ma, Shuai Lu, and Tony Nguyen, “Assessing the Value of Regulation Resources Based On Their Time Response Characteristics”, PNNL Re-port, PNNL 52182, Prepared for CERTS and California Energy Commission, De-cember 2007. (Final Editing)Y. V. Makarov, C. Loutan, J. Ma, P. de Mello, and S. Lu, “Evaluating impacts of wind generation on regulation and load following re-quirements for integrating intermittent resources,” WINDPOWER 2008, Paper #482, Houston, TX, June 1-4, 2008.
[8] Y. Makarov, B. Yang, J. DeSteese, S. Lu, C. Miller, P. Nyeng, J. Ma, D. Ham-merstorm, V. Viswanathan, “Wide-Area Energy Storage and Management System to Balance Intermittent Resources in the Bonneville Power Administration and Califor-nia ISO Control Areas”, PNNL Project Report, Prepared for the Bonneville Power Administration under Contract BPA 00028087 / PNNL 52946, June 2008.
[9] “Day ahead market,” California ISO Operating Procedure M-401 (MRTU Draft), Version 11, California ISO, Folsom, California, Apr. 21, 2008. Available online: http://www.caiso.com/1c3a/1c3a8fc4148a0.doc.
[10] “Real time market,” California ISO Operating Procedure M-403 (MRTU Draft), Version 7, California ISO, Folsom, California, Mar. 27, 2008. Available online: http://www.caiso.com/1c3a/1c3a918221da0.doc.
[11] “Ancillary service procurement,” California ISO Operating Procedure M-402, Ver-sion 6.1, Folsom, California, Effective: Nov. 4, 2005, 2008. Available online: http://www.caiso.com/docs/1998/12/02/1998120218202714536.pdf.
[12] T. Wu, “Effects of Ramp Rates on Ancillary Service Procurement,” Draft Paper, Version 1.0, California ISO, January 9, 2006. Available online: http://www.caiso.com/1779/1779bef515420.pdf.

53
[13] “Market Redesign and Technology Update Tutorial for Market Participants,” Ver-sion 1.1, 9/20/2005, updated on 8/10/06. Available online: http://www.caiso.com/docs/2005/09/22/2005092212224714566.pdf.
[14] J. Labban, “Automatic Generation Control,” CAISO Settlements Training Docu-ment, May 4, 2005. Available online: http://www.caiso.com/docs/2005/05/04/2005050417321229579.pdf.
[15] Y. Liu, M. Rothleder, Z. Alaywan, M. Assadian, and F. A. Rahimi, “Implementing Rational Buyer's algorithm at California ISO,” Proc. Power Engineering Society Win-ter Meeting, Vol. 2, 2002, pp. 1293- 1298.
[16] “BPM configuration guide: regulation down obligation settlement,” Settlements & Billing, No. CC 6694, Version 1.4, California ISO, Folsom, California, Mar. 27, 2007. Available online: http://www.caiso.com/1b6a/1b6a9f2356024.doc.
[17] “BPM configuration guide: regulation up obligation settlement,” Settlements & Billing, No. CC 6594, Version 1.5, California ISO, Folsom, California, Mar. 27, 2007. Available online: http://www.caiso.com/1b6a/1b6a9f26560214.doc.
[18] J. M. Evans, “Ancillary Services Cost Allocation,” California ISO Presentation, September 20, 2006. Available online: http://www.caiso.com/1876/18768a23201b0.pdf.
[19] “Master CAISO Control Area Generating Capability List,” September 7, 2007. Available online: http://caiso.com/14d4/14d4c4ff59780.html.
[20] “Database of California Power Plants,” California Energy Commission, September 2007. Available online: http://www.energy.ca.gov/database/index.html#powerplants.
[21] “ADS Phase1b – A Guide To Understanding Instructions,” California ISO White Paper, Draft Version 1.0, November 3, 2004. Available online: http://www.caiso.com/docs/2005/09/15/2005091515143725544.pdf.
[22] D. C. Barr, “The Use of a Data Historian to Extend Plant Life,” Proc. International Conference on Life Management of Power Plants, Edinburgh, UK, 12-14 December 1994.
[23] P. Zhang, Y.V. Makarov, M.D. Ili$ et al., “CPS Based Control Algorithms for Modern AGC Systems,” Electric Power Research Institute, Palo Alto, CA, and Cali-fornia Independent System Operator (CAISO), Folsom, CA: 2002. 100162.
[24] I. Guyk, G. Corey, G. Peek, M. Gravely, J. Sayer, and J. Arseneaux, “Flywheel-based Frequency Regulation Demonstration Projects for CEC, NYSERDA, and DOE,” DOE Energy Storage Annual Peer Review, Washington DC, November 2-3, 2006. Available online: http://www.sandia.gov/ess/About/docs/arsenaux.pdf
[25] B. Kirby and E. Hirst, “Generator response to intra-hour load fluctuations,” Oak Ridge National Laboratory, Oak Ridge, TN. Available online: www.ornl.gov/sci/btc/apps/Restructuring/Generator_Response.pdf.
[26] N. Jaleeli and L. S. VanSlyck, “Control Performance Standards and Procedures for Interconnected Operation,” TR-107813, Electric Power Research Institute, Palo Alto, CA, April 1997.
[27] N. Cohn, “Decomposition of Time Deviation and Inadvertent Interchange on Inter-connected System,” Parts I & II, IEEE Transactions on Power Apparatus and Sys-tems, Vol. PAS-101, No. 5, May 1982.

54
[28] “Description of area control error (ACE) calculation (automatic time error con-trol),” Western Electricity Coordinating Council, Oct. 4, 2002. Available online: http://www.wecc.biz/documents/2005/Standards/ACE_Description-Yuri-new_db.pdf
[29] “Percentile,” Wikipedia. Available online: http://en.wikipedia.org/wiki/Percentile [30] “Smart Energy Matrix 20 MW Frequency Regulation Plant: Industry-scale Energy
Storage for Grid Frequency Regulation,” Beacon Power Corporation. Available online : http://www.beaconpower.com/products/EnergyStorageSystems/docs/BeaconSEM20MW.pdf
[31] Y. V. Makarov, S. Lu, B. McManus, and J. Pease, “The Future Impact of Wind on BPA Power System Ancillary Services”, Proc. WindPower 2008, Paper #315, Hous-ton, TX, June 1-4, 2008.
[32] “Technology Comparison/Ratings,” Electricity Storage Association. Available Online: http://electricitystorage.org/tech/technologies_comparisons_ratings.htm.
[33] “Standard BAL-XXX-1-WECC — Frequency Response Performance,” WECC draft standard. Available online: http://www.wecc.biz/documents/library/Standards/Criteria/BAL-00X-1%20FRS%206-21-07.pdf.
[34] Y. V. Makarov, C. Loutan, J. Ma, P. de Mello, S. Lu, “Evaluating impacts of wind generation on regulation and load following requirements for integrating intermittent resources,” Proc. WindPower 2008, Paper #482, Houston, TX, June 1-4, 2008.