Assessing the quality and trustworthiness of citizen science data
13
SPECIAL ISSUE PAPER Assessing the quality and trustworthiness of citizen science data Jane Hunter 1, * ,† , Abdulmonem Alabri 1 and Catharine van Ingen 2 1 The University of Queensland, Brisbane QLD 4072, Australia 2 Microsoft Research, San Francisco, CA, USA ABSTRACT The Internet, Web 2.0 and Social Networking technologies are enabling citizens to actively participate in ‘citizen science’ projects by contributing data to scientific programmes via the Web. However, the limited training, knowledge and expertise of contributors can lead to poor quality, misleading or even malicious data being submitted. Subsequently, the scientific community often perceive citizen science data as not worthy of being used in serious scientific research—which in turn, leads to poor retention rates for volunteers. In this paper, we describe a technological framework that combines data quality improvements and trust metrics to enhance the reliability of citizen science data. We describe how online social trust models can provide a simple and effective mechanism for measuring the trustworthiness of community-generated data. We also describe filtering services that remove unreliable or untrusted data and enable scientists to confidently reuse citizen science data. The resulting software services are evaluated in the context of the CoralWatch project—a citizen science project that uses volunteers to collect comprehensive data on coral reef health. Copyright © 2012 John Wiley & Sons, Ltd. Received 5 May 2011; Accepted 2 August 2012 KEY WORDS: citizen science; data quality; trust metrics 1. INTRODUCTION Citizen science projects have grown dramatically in recent years. They combine Web-based social networks with community-based information systems to harness collective intelligence and apply it to specific scientific problems. Online communities of volunteers are now contributing data to projects that range from astronomy [1] to bird watching [2] and air quality [3]. Such projects are democratizing science in that they enable public citizens to actively participate in scientific programmes and allow them to access and use both their own data and the collective data generated by others. However, there are some inherent weaknesses to citizen science and crowd sourcing projects. The limited training, knowledge and expertise of contributors and their relative anonymity can lead to poor quality, misleading or even malicious data being submitted [4]. The absence of the ‘scientific method’ [5] and the use of non-standardized and poorly designed methods of data collection [6] often lead to incomplete or inaccurate data. Also, the lack of commitment from volunteers in collecting field data [4,7] can lead to gaps in the data across time and space. Subsequently, these issues have caused many in the scientific community to perceive citizen science data as not worthy of being considered in serious scientific research [8]. *Correspondence to: Jane Hunter, The University of Queensland, Brisbane QLD 4072, Australia. † E-mail: [email protected] Copyright © 2012 John Wiley & Sons, Ltd. CONCURRENCY AND COMPUTATION: PRACTICE AND EXPERIENCE Concurrency Computat.: Pract. Exper. (2012) Published online in Wiley Online Library (wileyonlinelibrary.com). DOI: 10.1002/cpe.2923
-
Upload
jane-hunter -
Category
Documents
-
view
214 -
download
0
Transcript of Assessing the quality and trustworthiness of citizen science data

CONCURRENCY AND COMPUTATION: PRACTICE AND EXPERIENCEConcurrency Computat.: Pract. Exper. (2012)Published online in Wiley Online Library (wileyonlinelibrary.com). DOI: 10.1002/cpe.2923
SPECIAL ISSUE PAPER
Assessing the quality and trustworthiness of citizen science data
Jane Hunter1,*,†, Abdulmonem Alabri1 and Catharine van Ingen2
1The University of Queensland, Brisbane QLD 4072, Australia2Microsoft Research, San Francisco, CA, USA
ABSTRACT
The Internet, Web 2.0 and Social Networking technologies are enabling citizens to actively participate in‘citizen science’ projects by contributing data to scientific programmes via the Web. However, the limitedtraining, knowledge and expertise of contributors can lead to poor quality, misleading or even malicious databeing submitted. Subsequently, the scientific community often perceive citizen science data as not worthy ofbeing used in serious scientific research—which in turn, leads to poor retention rates for volunteers. In thispaper, we describe a technological framework that combines data quality improvements and trust metrics toenhance the reliability of citizen science data. We describe how online social trust models can provide asimple and effective mechanism for measuring the trustworthiness of community-generated data. We alsodescribe filtering services that remove unreliable or untrusted data and enable scientists to confidentlyreuse citizen science data. The resulting software services are evaluated in the context of the CoralWatchproject—a citizen science project that uses volunteers to collect comprehensive data on coral reef health.Copyright © 2012 John Wiley & Sons, Ltd.
Received 5 May 2011; Accepted 2 August 2012
KEY WORDS: citizen science; data quality; trust metrics
1. INTRODUCTION
Citizen science projects have grown dramatically in recent years. They combine Web-based socialnetworks with community-based information systems to harness collective intelligence and apply itto specific scientific problems. Online communities of volunteers are now contributing data toprojects that range from astronomy [1] to bird watching [2] and air quality [3]. Such projects aredemocratizing science in that they enable public citizens to actively participate in scientificprogrammes and allow them to access and use both their own data and the collective data generatedby others.
However, there are some inherent weaknesses to citizen science and crowd sourcing projects. Thelimited training, knowledge and expertise of contributors and their relative anonymity can lead topoor quality, misleading or even malicious data being submitted [4]. The absence of the ‘scientificmethod’ [5] and the use of non-standardized and poorly designed methods of data collection [6]often lead to incomplete or inaccurate data. Also, the lack of commitment from volunteers incollecting field data [4,7] can lead to gaps in the data across time and space. Subsequently, theseissues have caused many in the scientific community to perceive citizen science data as not worthyof being considered in serious scientific research [8].
*Correspondence to: Jane Hunter, The University of Queensland, Brisbane QLD 4072, Australia.†E-mail: [email protected]
Copyright © 2012 John Wiley & Sons, Ltd.
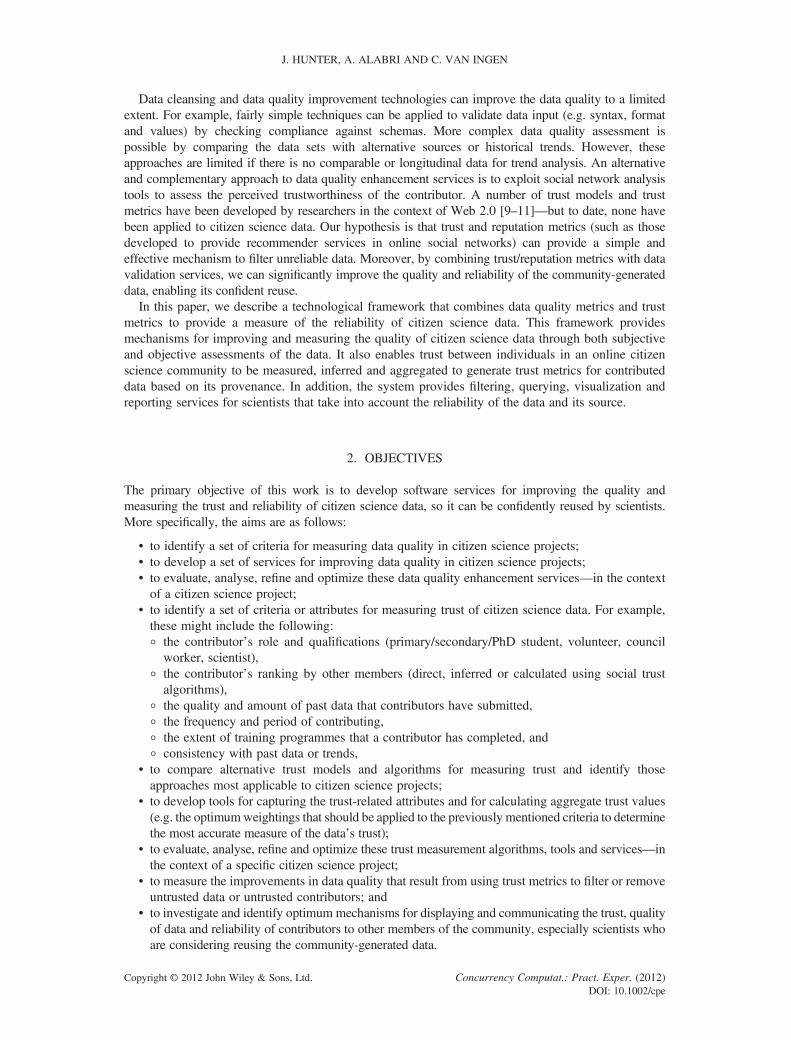
J. HUNTER, A. ALABRI AND C. VAN INGEN
Data cleansing and data quality improvement technologies can improve the data quality to a limitedextent. For example, fairly simple techniques can be applied to validate data input (e.g. syntax, formatand values) by checking compliance against schemas. More complex data quality assessment ispossible by comparing the data sets with alternative sources or historical trends. However, theseapproaches are limited if there is no comparable or longitudinal data for trend analysis. An alternativeand complementary approach to data quality enhancement services is to exploit social network analysistools to assess the perceived trustworthiness of the contributor. A number of trust models and trustmetrics have been developed by researchers in the context of Web 2.0 [9–11]—but to date, none havebeen applied to citizen science data. Our hypothesis is that trust and reputation metrics (such as thosedeveloped to provide recommender services in online social networks) can provide a simple andeffective mechanism to filter unreliable data. Moreover, by combining trust/reputation metrics with datavalidation services, we can significantly improve the quality and reliability of the community-generateddata, enabling its confident reuse.
In this paper, we describe a technological framework that combines data quality metrics and trustmetrics to provide a measure of the reliability of citizen science data. This framework providesmechanisms for improving and measuring the quality of citizen science data through both subjectiveand objective assessments of the data. It also enables trust between individuals in an online citizenscience community to be measured, inferred and aggregated to generate trust metrics for contributeddata based on its provenance. In addition, the system provides filtering, querying, visualization andreporting services for scientists that take into account the reliability of the data and its source.
2. OBJECTIVES
The primary objective of this work is to develop software services for improving the quality andmeasuring the trust and reliability of citizen science data, so it can be confidently reused by scientists.More specifically, the aims are as follows:
• to identify a set of criteria for measuring data quality in citizen science projects;• to develop a set of services for improving data quality in citizen science projects;• to evaluate, analyse, refine and optimize these data quality enhancement services—in the contextof a citizen science project;
• to identify a set of criteria or attributes for measuring trust of citizen science data. For example,these might include the following:∘ the contributor’s role and qualifications (primary/secondary/PhD student, volunteer, council
worker, scientist),∘ the contributor’s ranking by other members (direct, inferred or calculated using social trust
algorithms),∘ the quality and amount of past data that contributors have submitted,∘ the frequency and period of contributing,∘ the extent of training programmes that a contributor has completed, and∘ consistency with past data or trends,
• to compare alternative trust models and algorithms for measuring trust and identify thoseapproaches most applicable to citizen science projects;
• to develop tools for capturing the trust-related attributes and for calculating aggregate trust values(e.g. the optimumweightings that should be applied to the previously mentioned criteria to determinethe most accurate measure of the data’s trust);
• to evaluate, analyse, refine and optimize these trust measurement algorithms, tools and services—inthe context of a specific citizen science project;
• to measure the improvements in data quality that result from using trust metrics to filter or removeuntrusted data or untrusted contributors; and
• to investigate and identify optimum mechanisms for displaying and communicating the trust, qualityof data and reliability of contributors to other members of the community, especially scientists whoare considering reusing the community-generated data.
Copyright © 2012 John Wiley & Sons, Ltd. Concurrency Computat.: Pract. Exper. (2012)DOI: 10.1002/cpe

Figure 1. Use of Coral Health Chart in the field.
ASSESSING THE QUALITY AND TRUSTWORTHINESS OF CITIZEN SCIENCE DATA
3. CASE STUDY
The CoralWatch project is a citizen science project being managed by the University of Queensland thataims to ‘improve the extent of information on coral bleaching events and coral bleaching trends’ [12].Currently, the CoralWatch project has over 1300 members from 80 countries around the world. As ofMay 2011, its members have contributed over 30 000 surveys. CoralWatch provides simple colourcharts (Figure 1) that can be used by anyone (scientists, tourists, divers, school students) to provideuseful monitoring data on the extent of coral bleaching at particular reefs. Data collected through theCoralWatch programme includes: reef name, latitude and longitude, coral species, coral colour, watertemperature, date and time and the method by which the data are collected, for example, snorkelling,reef walking or fishing. As well as collecting monitoring data, the project also aims to educate thepublic about the causes and impact of bleaching on coral reefs.
New members register through the CoralWatch website.1 Once registered, the member can request a DoIt Yourself (DIY) Coral Health Monitoring Kit. The kit provides a field guide for recording observations.Each observation includes the coral types, species and colour intensity of the coral (observed by comparingit with a chart). ‘The colour charts are based on the actual colours of bleached and healthy corals. Eachcolour square corresponds to a concentration of symbionts contained in the coral tissue. Theconcentration of symbionts is directly linked to the health of the coral’ [13]. The user generates anonline survey by recording observations (species, colour, latitude, longitude, etc.) along specifictransects and inputting the data to the CoralWatch database via an online data entry page.
4. DATA QUALITY ISSUES
A detailed analysis of a subset of the legacy CoralWatch data (approx. 18 560 records, collectedbetween July 2003 and September 2009) was carried out in order to assess the quality of the legacydata. A significant number of errors were identified. Figure 2 illustrates the distribution of errortypes and the extent of errors in the data. It shows that the most errors were associated with theGlobal Positioning System (GPS) data (~64% of records) and that the most common errors were dueto missing lat and long values, incorrect signs on the lat and long values or transposed lat and longvalues. Although such errors are easily identified and corrected, if not corrected, these observationsare practically useless from a scientific perspective. There were also a significant number of errorsin the volunteers’ contact details—making it difficult to attribute errors to individuals, to holdindividuals responsible for the data or to contact volunteers to clarify, confirm or correct outlyingdata. The causes of the majority of the errors were as follows:
• lack of validation and consistency checking;• lack of automated metadata/data extraction;• lack of user authentication and automatic attribution of data to individuals;
1www.coralwatch.org
Copyright © 2012 John Wiley & Sons, Ltd. Concurrency Computat.: Pract. Exper. (2012)DOI: 10.1002/cpe

Figure 2. Survey of errors in the legacy CoralWatch data.
J. HUNTER, A. ALABRI AND C. VAN INGEN
• absence of a precisely defined and extensible data model and corresponding schema;• lack of data quality assessment measures;• lack of feedback to volunteers on their data; and• lack of graphing, trend analysis and visualization tools that enable errors or missing data to beeasily detected.
By our estimation, over 70% of the errors could be prevented by developing and incorporating newservices within the CoralWatch Portal that focus on the issues described earlier, including validationand verification services that are invoked at the time of data input, prior to ingest.
5. APPROACH AND METHODOLOGY
In this section, we describe the different components of the proposed framework (Figure 3) that enablethe objectives described in Section 2 to be achieved. Evaluation of these tools and services are carriedout in the context of the CoralWatch project, described in Section 3.
5.1. Data quality and data validation
Wand et al. [14] define data quality as a multidimensional measure of accuracy, completeness,consistency and timeliness. These dimensions can be used to specify whether data are of a highquality by measuring specific deficiencies in the mapping of the data from the real-world systemstate to the information system state. Such dimensions can be used: to develop data quality audit
Figure 3. Overview of the proposed framework.
Copyright © 2012 John Wiley & Sons, Ltd. Concurrency Computat.: Pract. Exper. (2012)DOI: 10.1002/cpe

ASSESSING THE QUALITY AND TRUSTWORTHINESS OF CITIZEN SCIENCE DATA
guidelines and procedures for improving the data quality; to guide the data collection process in thefield; and to compare the outcomes of different studies.
Currently, most organizations develop data quality measures on an ad hoc basis to solve specific dataquality issues where practical and usable data quality metrics are lacking [15]. In many cases, these dataquality measures are applied as a one-off static process either before or as the data enter the database. Thisis also apparent in citizen science projects where data quality measures are generally performed duringthe submission process only. Lee et al. [16] recommend that data quality metrics should be viewed asdynamic, continuous and embedded in an overall data quality improvement process as part of a datacollection system. To achieve data quality improvement in citizen science context, it is necessary toidentify the criteria for high quality data. To do this, we employ a data quality measure cycle thatincludes the following:
1. identifying the data quality dimensions;2. performing data quality measures;3. analysing the results and identifying discrepancies; and4. implementing tools that provide necessary actions to improve the quality of data.
To identify the necessary data quality dimensions for a citizen science project, we conductedquestionnaires and interviews with the stakeholders of the data. Table I [17] lists the data qualitydimensions that were deemed most relevant to citizen science data.
In the case of CoralWatch, the syntactic aspects of data quality are easy to measure—and in manycases easy to correct. They include problems with latitude and longitude ranges, spelling errors, invalidtemperature values and formatting errors. To reduce the syntactic errors, we implemented a metadataand data suggestion/validation process that employs XML schemas and controlled vocabularies torestrict input to permitted values/ranges and to validate the data. Registered, authenticated memberssubmit their data through a user friendly Web page that performs form validation and checking
Table I. A set of data quality dimensions [17].
Dimensions Definitions
Accessibility The extent to which information is available, or easilyand quickly retrievable.
Appropriate amount of information The extent to which the volume of the information isappropriate for the task at hand.
Believability The extent to which the information is regarded astrue and credible.
Completeness The extent to which the information is not missing andis of sufficient breadth and depth for the task at hand.
Concise representation The extent to which the information is compactly represented.Consistent representation The extent to which the information is presented in the
same format.Ease of manipulation The extent to which the information is easy to manipulate and
apply to different tasks.Free-of-error The extent to which information is correct and reliable.Interpretability The extent to which information is in appropriate languages,
symbols, units and the definitions are clear.Objectivity The extent to which the information is unbiased, unprejudiced
and impartial.Relevancy The extent to which the information is applicable and helpful
for the task at hand.Reputation The extent to which the information is highly regarded in terms
of source or content.Security The extent to which access to information is restricted
appropriately to maintain its security.Timeliness The extent to which the information is sufficiently up-to-date
for the task at hand.Understandability The extent to which the information is easily comprehended.Value-added The extent to which the information is beneficial and provides
advantages from its use.
Copyright © 2012 John Wiley & Sons, Ltd. Concurrency Computat.: Pract. Exper. (2012)DOI: 10.1002/cpe
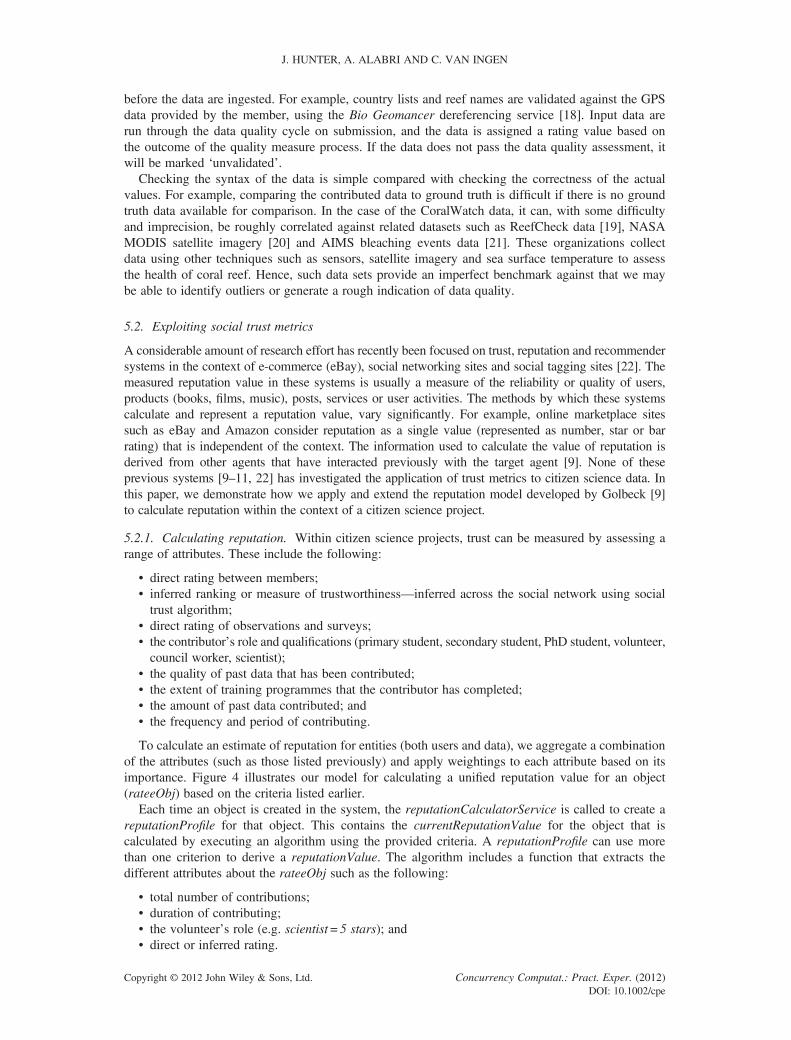
J. HUNTER, A. ALABRI AND C. VAN INGEN
before the data are ingested. For example, country lists and reef names are validated against the GPSdata provided by the member, using the Bio Geomancer dereferencing service [18]. Input data arerun through the data quality cycle on submission, and the data is assigned a rating value based onthe outcome of the quality measure process. If the data does not pass the data quality assessment, itwill be marked ‘unvalidated’.
Checking the syntax of the data is simple compared with checking the correctness of the actualvalues. For example, comparing the contributed data to ground truth is difficult if there is no groundtruth data available for comparison. In the case of the CoralWatch data, it can, with some difficultyand imprecision, be roughly correlated against related datasets such as ReefCheck data [19], NASAMODIS satellite imagery [20] and AIMS bleaching events data [21]. These organizations collectdata using other techniques such as sensors, satellite imagery and sea surface temperature to assessthe health of coral reef. Hence, such data sets provide an imperfect benchmark against that we maybe able to identify outliers or generate a rough indication of data quality.
5.2. Exploiting social trust metrics
A considerable amount of research effort has recently been focused on trust, reputation and recommendersystems in the context of e-commerce (eBay), social networking sites and social tagging sites [22]. Themeasured reputation value in these systems is usually a measure of the reliability or quality of users,products (books, films, music), posts, services or user activities. The methods by which these systemscalculate and represent a reputation value, vary significantly. For example, online marketplace sitessuch as eBay and Amazon consider reputation as a single value (represented as number, star or barrating) that is independent of the context. The information used to calculate the value of reputation isderived from other agents that have interacted previously with the target agent [9]. None of theseprevious systems [9–11, 22] has investigated the application of trust metrics to citizen science data. Inthis paper, we demonstrate how we apply and extend the reputation model developed by Golbeck [9]to calculate reputation within the context of a citizen science project.
5.2.1. Calculating reputation. Within citizen science projects, trust can be measured by assessing arange of attributes. These include the following:
• direct rating between members;• inferred ranking or measure of trustworthiness—inferred across the social network using socialtrust algorithm;
• direct rating of observations and surveys;• the contributor’s role and qualifications (primary student, secondary student, PhD student, volunteer,council worker, scientist);
• the quality of past data that has been contributed;• the extent of training programmes that the contributor has completed;• the amount of past data contributed; and• the frequency and period of contributing.
To calculate an estimate of reputation for entities (both users and data), we aggregate a combinationof the attributes (such as those listed previously) and apply weightings to each attribute based on itsimportance. Figure 4 illustrates our model for calculating a unified reputation value for an object(rateeObj) based on the criteria listed earlier.
Each time an object is created in the system, the reputationCalculatorService is called to create areputationProfile for that object. This contains the currentReputationValue for the object that iscalculated by executing an algorithm using the provided criteria. A reputationProfile can use morethan one criterion to derive a reputationValue. The algorithm includes a function that extracts thedifferent attributes about the rateeObj such as the following:
• total number of contributions;• duration of contributing;• the volunteer’s role (e.g. scientist = 5 stars); and• direct or inferred rating.
Copyright © 2012 John Wiley & Sons, Ltd. Concurrency Computat.: Pract. Exper. (2012)DOI: 10.1002/cpe

Figure 4. Unified reputation calculator model.
ASSESSING THE QUALITY AND TRUSTWORTHINESS OF CITIZEN SCIENCE DATA
The system generates reputationValues for the attributes associated with each entity—as an orderedlist from lowest to highest. Typically, reputation values are either numbers (e.g. {1,2,3,4,5} or strings{bad, fine, good, excellent}). In the case of CoralWatch, we use a 5 star rating (1–5 stars). ThereputationCalculatorService also registers all the rater objects raterObj (which can be another userin the system or an automatic rating agent) in the reputationProfile for a rateeObj. An automaticrating agent can be a process that detects the quality of the submitted data and uses thereputationCalculatorService to calculate currentReputationValue for a user based on their latestsubmission. It also keeps track of pastReputationValues recorded in the reputationProfile.
5.2.2. Inferring reputation across the network. Golbeck [9] used a Recommender System to calculatereputation based on user profile similarity. A collaborative filtering algorithm is used to calculate apredictive movie rating for a user that will best match the user’s attributes. If the user does not have adirect trust value for a person who rated a particular movie, the system will move one step out in thetrust network to find connections to users that rated the movie. The process is repeated until a path isfound between the user (user i) and a person who rated the movie (user s). Using the TidalTrustalgorithm, shown in the succeeding text, a predictive trust value is calculated between user i and user s,where tij is the trust between user i and user j and tjs is the trust between user j and user s.
tis ¼
X
j2adj ið Þtijtjs
X
j2adj ið Þtij
We use a similar approach for generating inferred trust values for each member of the CoralWatchtrust network. For example, to calculate an aggregate trust measure between a particular user and aparticular contributor, who do not know each other, we perform the following:
1. enable individuals to rate their trust of other individuals in the network and record these trustratings;
2. for the given user and given contributor, look for a direct path between them in the network;3. if no direct connection is found between the given user and contributor, the process moves out
one step to find neighbouring users in the network, until a path is found between the user andthe contributor;
4. the process then uses the aforementioned algorithm to estimate a measure of inferred trustbetween the user and the contributor; and
5. the system then calculates the aggregate trust value for the contributor (from the specific usersperspective) by weighting the trust value calculated earlier and combining it with the otherweighted attributes (e.g. role, amount of contributed data, duration of contributing).
Copyright © 2012 John Wiley & Sons, Ltd. Concurrency Computat.: Pract. Exper. (2012)DOI: 10.1002/cpe
J. HUNTER, A. ALABRI AND C. VAN INGEN
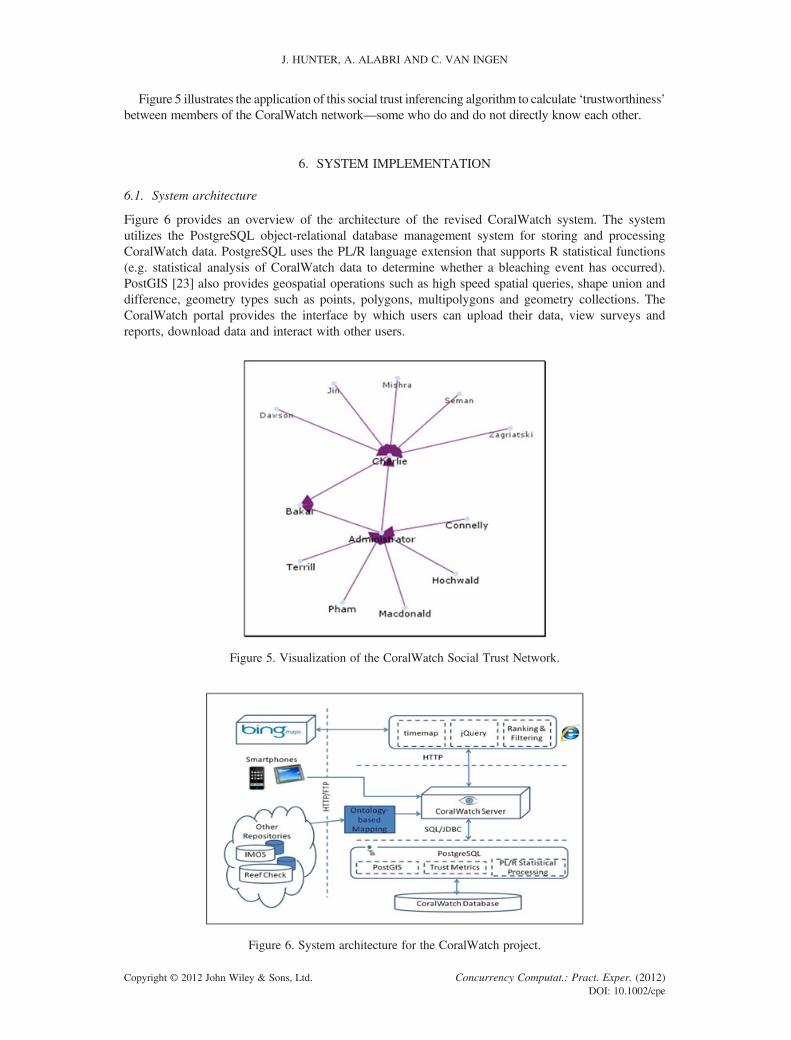
Figure 5 illustrates the application of this social trust inferencing algorithm to calculate ‘trustworthiness’between members of the CoralWatch network—some who do and do not directly know each other.
6. SYSTEM IMPLEMENTATION
6.1. System architecture
Figure 6 provides an overview of the architecture of the revised CoralWatch system. The systemutilizes the PostgreSQL object-relational database management system for storing and processingCoralWatch data. PostgreSQL uses the PL/R language extension that supports R statistical functions(e.g. statistical analysis of CoralWatch data to determine whether a bleaching event has occurred).PostGIS [23] also provides geospatial operations such as high speed spatial queries, shape union anddifference, geometry types such as points, polygons, multipolygons and geometry collections. TheCoralWatch portal provides the interface by which users can upload their data, view surveys andreports, download data and interact with other users.
Figure 5. Visualization of the CoralWatch Social Trust Network.
Figure 6. System architecture for the CoralWatch project.
Copyright © 2012 John Wiley & Sons, Ltd. Concurrency Computat.: Pract. Exper. (2012)DOI: 10.1002/cpe

ASSESSING THE QUALITY AND TRUSTWORTHINESS OF CITIZEN SCIENCE DATA
The server component is built using Java and JSP. The server interfaces with third party systems andclients through the following:
1. a Web browser (e.g. Internet Explorer) with an OpenLayers mapping interface (e.g. Bing maps)and SIMILE timeline —that enable spatio-temporal search and browsing across the data;
2. a Smartphone interface (e.g. an iPhone app) that enables data to be uploaded directly from thefield (with automatic extraction of GPS data, date and time); and
3. customized integration tools that harvest data from related repositories (e.g. IMOS, NASAMODIS satellite imagery, AIMS Coral Bleaching data) and map it to a common ontology, soit can be correlated against CoralWatch data. These datasets provide the benchmark or ‘groundtruth’ for measuring the quality of the volunteers’ data.
6.2. User interface for assigning and displaying trust
Users first need to register via the CoralWatch Web site. Registration requires users to enter their contactdetails, current role (secondary student, undergrad, postgrad, post-doc, research fellow, professor,teacher, volunteer), expertise and professional qualifications. Once registered, a user profile is storedand they are assigned a user id and password.
Authenticated users create a new survey by first entering the metadata for the survey. The metadataincludes the survey’s location (reef name, latitude and longitude), date/time, weather conditions andwater temperature. A validation process then checks compliance of the input data against an XMLschema and controlled vocabularies. Once the user has created a new survey, they can enter the setof observations of coral species and colour (Figure 7) along the transect.
Every time the user submits an observation, the data are instantaneously analysed on the server side.The charts generated from the data analysis show the colour distribution across the transect. Users candetermine whether a bleaching event has occurred by analysing the change in colour over time.
Once the survey data have been entered, the next step is to calculate trust metrics for it. To date,we have developed simple tagging tools whereby members of the network can assign trust rankingsto other members. The aggregate community trust value on a member is calculated by weighting andaggregating both direct and inferred trust values plus additional attributes (e.g. role, expertise,quality of past data, frequency and extent of past contributions) as described in Section 5.2.The calculated aggregate trust value is displayed as a 1 to 5 star rating in the user’s profile(Figure 8)—this information is visible only to the system administrator. Users are not aware of thetrust value that has been assigned to them and that is associated with the data uploaded by them.
Figure 7. Submitting data via the CoralWatch Online Data Input/Upload Form.
Copyright © 2012 John Wiley & Sons, Ltd. Concurrency Computat.: Pract. Exper. (2012)DOI: 10.1002/cpe

Figure 8. User profile showing trust as 1–5 star rating.
J. HUNTER, A. ALABRI AND C. VAN INGEN
6.3. Trust-aware querying and visualization
Finally, we have developed simple filtering, querying and presentation methods that take into accountthe quality and trustworthiness of the individual surveys. Figure 9 shows the interactive user interfacethat enables users to browse, query and analyse the data. Surveys are displayed simultaneously on boththe map and the timeline above the map (via drawing pin markers). When the timeline is draggedhorizontally to a specific date, the surveys that were conducted around that date are displayed on themap. Users can click on the survey markers on either the timeline or the map to display the detailedsurvey metadata and observational data.
Users are also able to specify the level of trust required. For example, they can enter queries such as:‘Show me all CoralWatch observations for Masthead Reef between 2007 and 2009 with a ranking of 3
Figure 9. Interactive user interface for exploring the CoralWatch survey data.
Copyright © 2012 John Wiley & Sons, Ltd. Concurrency Computat.: Pract. Exper. (2012)DOI: 10.1002/cpe
ASSESSING THE QUALITY AND TRUSTWORTHINESS OF CITIZEN SCIENCE DATA
or more stars’. Alternatively, users can display all surveys, but they are colour-coded according to theirtrust metric (red = 1 star, purple = 2 stars, yellow = 3 stars, white = 4 stars and green = 5 stars).
7. EVALUATION
Following the implementation of the revised CoralWatch system described earlier, evaluations werecarried out on different aspects of the system to determine the extent of improvements to data qualityand reliability, and the effectiveness of the user interface, system functionality and performance
• We compared the type and distribution of syntactic errors in the submitted data before and afterthe implementation of the data validation services. As anticipated—through the use of pull-downmenus, controlled vocabularies, range checking and XML schema compliance, we reduced thenumber of syntactic errors in the input data by over 70%.
• A survey of feedback from the users and administrators of the CoralWatch data indicated that the trustmetrics associated with individual users should be hidden—so as not to deter volunteers—but thattrust metrics associated with specific datasets should be explicit. Poor trust metrics associated withindividual volunteers could be used to target online training modules. Good trust metrics could beused to reward, encourage and retain volunteers.
• The response from users to the ranking/tagging tools and the improved filtering, search andbrowse interfaces—was that these tools were relatively simple to use and greatly improved users’ability to understand the temporal, seasonal and spatial trends in coral bleaching events.
• Deliberate submission of consistently poor data by dummy users was picked up eventually by othermembers of the network who assigned low rankings to these contributors. But there was a delayperiod during which the data and the user was unknown and assigned an ‘average’ ranking—whichwas not sufficient to filter it out.
Further effort is required in order to:
• identify the best algorithms, weightings and approaches for measuring trust attributes and forcalculating overall trust;
• measure the performance, accuracy, efficiency and scalability of the trust metric tools as the sizeof the community and the database grows; and
• monitor the impact of the system on the number and frequency of contributing volunteers, theretention of existing volunteers and the attraction of new volunteers.
8. FUTURE WORK
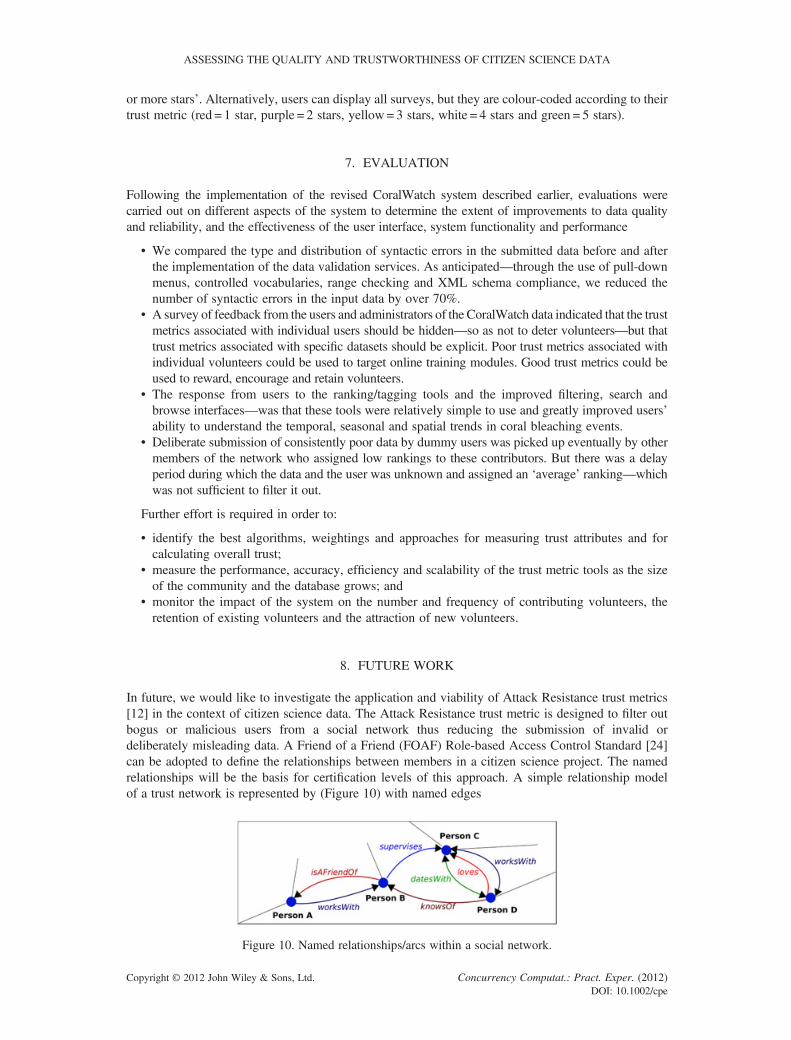
In future, we would like to investigate the application and viability of Attack Resistance trust metrics[12] in the context of citizen science data. The Attack Resistance trust metric is designed to filter outbogus or malicious users from a social network thus reducing the submission of invalid ordeliberately misleading data. A Friend of a Friend (FOAF) Role-based Access Control Standard [24]can be adopted to define the relationships between members in a citizen science project. The namedrelationships will be the basis for certification levels of this approach. A simple relationship modelof a trust network is represented by (Figure 10) with named edges
Figure 10. Named relationships/arcs within a social network.
Copyright © 2012 John Wiley & Sons, Ltd. Concurrency Computat.: Pract. Exper. (2012)DOI: 10.1002/cpe

J. HUNTER, A. ALABRI AND C. VAN INGEN
Each edge between nodes will be assigned a certification level that will be used to calculate thecapacities of accounts. Periodic execution of this trust metric will remove any bad nodes (uncertifiedaccounts) within the network. This will ensure that only certified and genuine volunteers remain inthe system.
We also plan to extend and evaluate the tagging tools to enable ranking/tagging of geo-locatedcitizen science data. A good example is the approach of Rezel et al. [25] that enables users to addtags to data/observations through a mapping interface. For example, users will be able to attachranking tags and other annotations to specific observations to highlight data quality issues
9. CONCLUSIONS
Citizen science is democratizing science in that it enables public citizens and the scientific communityto work together in monitoring, managing, maintaining and understanding the environment around us.A literature review has revealed that there is a critical need for methods to improve the quality and trustof citizen science data—and that there exists a range of technologies from the data quality and socialtrust fields that can potentially be combined to maximize the quality and reuse of citizen science data.
Using the CoralWatch project as a case study, we have implemented a system that demonstrates thatit is possible to significantly improve the quality of community-generated observational data through aset of validation and verification tools. We have also shown that it is possible to calculate a measure ofthe reliability or trustworthiness of citizen science data using a weighted aggregation of both direct andinferred attributes. By explicitly enabling this metric to be displayed to users, and taken into account byquerying, filtering and reporting services, we have enhanced the potential reuse of citizen science databy scientists.
REFERENCES
1. Lintott CJ, Schawinski K, Slosar A, Land K, Bamford S, Thomas D, Raddick MJ, Nichol RC, Szalay A, AndreescuD, Murray P, van den Berg J. Galaxy Zoo: morphologies derived from visual inspection of galaxies from the SloanDigital Sky Survey. Monthly Notices of the Royal Astronomical Society 2008; 389(3):1179–1189.
2. Cooper CB, Dickinson J, Phillips T, Bonney R. Citizen science as a tool for conservation in residential ecosystems.City, 2007.
3. M. E. S. S. A. G. E. Project Overview. Mobile Environmental Sensing System Across Grid Environments (MESSAGE):City, 2010. http://bioinf.ncl.ac.uk/message/?q=node/5 [Accessed on 28 August 2012].
4. Foster-Smith J, Evans SM. The value of marine ecological data collected by volunteers. Biological Conservation2003; 113(2):199–213.
5. Paulos E. Designing for doubt citizen science and the challenge of change. Proceedings of the Engaging Data: FirstInternational Forum on the Application and Management of Personal Electronic Information, MIT, 2009.
6. Silvertown J. A new dawn for citizen science. Trends in Ecology & Evolution 2009; 24(9):2832–2842.7. Galloway AWE, Tudor MT, Haegen WMV. The reliability of citizen science: a case study of Oregon White Oak
Stand Surveys. Wildlife Society Bulletin 2006; 34(5):1425–1429.8. Delaney DG, Sperling CD, Adams CS, Leung B. Marine invasive species: validation of citizen science and implications
for national monitoring networks. Biological Invasions 2007; 10(1):117–128.9. Golbeck J. Trust and nuanced profile similarity in online social networks. ACM Transactions on the Web 2009;
3(4):1–33.10. Massa P, Souren K, Salvetti M, Tomasoni D. Trustlet, open research on trust metrics. Scientific International Journal
for Parallel and Distributed Computing 2008; 9(4):341–351.11. Advogato.org. Advogato’s Trust Metric. Advogato.org: City, 2010. http://www.advogato.org/trust-metric.html.
[Accessed on 28 August 2012].12. Reid C, Marshall J, Logan D, Kleine D. Coral Reefs and Climate Change: The Guide for Education and Awareness.
CoralWatch: Brisbane, 2009.13. CoralWatch. Coral Health Chart. http://www.coralwatch.org/web/guest/coral-health-chart [Accessed on 26 August
2012].14. Wand Y, Wang RY. Anchoring data quality dimensions in ontological foundations. Communications of the ACM
1996; 39(11):86–95.15. Huang K-T, Lee YW, Wang RY. Quality Information and Knowledge. Prentice Hall PTR, 1999.16. Lee YW, Pipino L, Strong DM, Wang RY. Process-embedded data integrity. Journal Database Management 2004;
15(1):87–103.17. Pipino LL, Lee YW, Wang RY. Data quality assessment. Communications of the ACM 2002; 45(4):211–218.
Copyright © 2012 John Wiley & Sons, Ltd. Concurrency Computat.: Pract. Exper. (2012)DOI: 10.1002/cpe

ASSESSING THE QUALITY AND TRUSTWORTHINESS OF CITIZEN SCIENCE DATA
18. The BioGeoMancer Project. Available at: http://biogeomancer.sourceforge.net/, 2010.19. ReefCheck Australia. http://www.reefcheckaustralia.org/ [Accessed on 28 August 2012].20. NOAA Satellite and Information Service, Coral Reef Watch. “Calculating thermal stress and predicting coral bleaching:
a lesson in NOAA coral reef watch methodology”. Available at: http://coralreefwatch.noaa.gov/satellite/education/bilko_lesson.html. [Accessed on 28 August 2012].
21. AIMS data centre. Available at: http://data.aims.gov.au/metadataviewer/faces/search.xhtml [Accessed on 28 August2012].
22. Sabater J, Sierra C. Review on computational trust and reputation models. Artificial Intelligence Review 2005;24(1):33–60.
23. PostGIS. What is PostGIS? PostGIS Website, http://postgis.refractions.net/, 2010. [Accessed on 28 August 2012].24. Grzonkowski S, Kruk S. D-FOAF: Role-based Access Control Standard. DERI International: Galway, http://
foafrealm.org/documentation/AccessControl/, 2007. [Accessed on 7 August 2012].25. Rezel R, Liang S. SWE-FE: extending folksonomies to the sensor Web. Proceedings of the International Symposium
on Collaborative Technologies and Systems (CTS 2010), Chicago, USA, 2010.
Copyright © 2012 John Wiley & Sons, Ltd. Concurrency Computat.: Pract. Exper. (2012)DOI: 10.1002/cpe