Assessing the Notch Sensitivity of High Strength Wires Abstract High strength wires, which have a...
16
2423 Abstract High strength wires, which have a poor notch sensitivity perfor- mance, are currently been used on many offshore applications where high stresses without yielding are demanded. To assess these wires notch sensitivity, an integrated approach was implemented. An experimental program was conducted, through the realization of fatigue tests to obtain the fatigue limit for notched and notched free specimens to assess the fatigue stress concentration factor. A numerical approach using Finite Element Method, and an analyti- cal model, available in technical literature, were used to assess the stress concentration factor. With both results, the notch sensitivity could be obtained. Keywords Fatigue, notch sensitivity, staircase method. Assessing the Notch Sensitivity of High Strength Wires 1 INTRODUCTION The notch sensitivity (q) is a very important design parameter, since its estimation directly influences the design against fatigue failure of mechanical parts. Also notch sensitivity is associated with many other mechanical design concepts such as: stress concentration factor (SCF) or Kt, fatigue SCF or Kf and short cracks propagation. Indeed, the SCF is a well-known parameter used in mechanics of solids to estimate the stress amplification caused by a mechanical part discontinuity, like a notch. Its esti- mation depends entirely on the loading type and the geometry of the discontinuity. It is also well- known that for variable load the stress amplification, for ductile materials, is usually overestimated by Kt. To reduce the conservatism in the design of mechanical parts that are subjected to variable load- ing, the fatigue SCF is used. This variable is also a function of notch sensitivity factor (q) that takes Carlos Filipe Cardoso Bandeira a Paulo Pedro Kenedi a,* Luis Felipe Guimarães de Souza a a PPEMM - Programa de Pós-Graduação em Engenharia Mecânica e Tecnologia de Materiais, CEFET/RJ - Av. Maracanã, 229 - Maracanã - RJ - CEP 20271-110 – Brazil [email protected] [email protected] [email protected] * Corresponding Author http://dx.doi.org/10.1590/1679-78253728 Received 26.01.2017 In revised form 26.07.2017 Accepted 05.09.2017 Available online 15.09.2017
Transcript of Assessing the Notch Sensitivity of High Strength Wires Abstract High strength wires, which have a...

2423
Abstract High strength wires, which have a poor notch sensitivity perfor-mance, are currently been used on many offshore applications where high stresses without yielding are demanded. To assess these wires notch sensitivity, an integrated approach was implemented. An experimental program was conducted, through the realization of fatigue tests to obtain the fatigue limit for notched and notched free specimens to assess the fatigue stress concentration factor. A numerical approach using Finite Element Method, and an analyti-cal model, available in technical literature, were used to assess the stress concentration factor. With both results, the notch sensitivity could be obtained. Keywords Fatigue, notch sensitivity, staircase method.
Assessing the Notch Sensitivity of High Strength Wires
1 INTRODUCTION
The notch sensitivity (q) is a very important design parameter, since its estimation directly influences the design against fatigue failure of mechanical parts. Also notch sensitivity is associated with many other mechanical design concepts such as: stress concentration factor (SCF) or Kt, fatigue SCF or Kf
and short cracks propagation. Indeed, the SCF is a well-known parameter used in mechanics of solids to estimate the stress amplification caused by a mechanical part discontinuity, like a notch. Its esti-mation depends entirely on the loading type and the geometry of the discontinuity. It is also well-known that for variable load the stress amplification, for ductile materials, is usually overestimated by Kt. To reduce the conservatism in the design of mechanical parts that are subjected to variable load-ing, the fatigue SCF is used. This variable is also a function of notch sensitivity factor (q) that takes
Carlos Filipe Cardoso Bandeira a Paulo Pedro Kenedi a,*
Luis Felipe Guimarães de Souza a a PPEMM - Programa de Pós-Graduação em Engenharia Mecânica e Tecnologia de Materiais, CEFET/RJ - Av. Maracanã, 229 - Maracanã - RJ - CEP 20271-110 – Brazil [email protected] [email protected] [email protected] * Corresponding Author http://dx.doi.org/10.1590/1679-78253728
Received 26.01.2017 In revised form 26.07.2017 Accepted 05.09.2017 Available online 15.09.2017

2424 C.F.C. Bandeira et al. / Assessing the Notch Sensitivity of High Strength Wires
Latin American Journal of Solids and Structures 14 (2017) 2423-2438
into account, for notches, both: notch radius (r) and material ultimate strength (Sut), recognizing that material influences on the stress amplification near notch discontinuity.
Research has been done in this area by Castro and Meggiolaro (2013), which associated the notch sensitivity with the relatively fast generation of tiny non-propagating cracks at notch root. According to the authors it indicates that the crack initiation is controlled by the stresses acting at notch tip and the fatigue crack growth behavior of short cracks emanating from notch root could be affected by the generated stress gradients. So, a crack could start at a notch tip and then stop after a short growth, due to the decreasing of the driving force in spite of its growing size. Thus, q should depend not only on the notch tip radius but also on the notch depth. Castro et al. (2014) addresses semi-empirical q factors that consider the notch tip stress gradient influencing on the fatigue behav-ior of short cracks. According to the authors, properly calculation of q values can be done from its fatigue limit (Se), and crack propagation threshold (ΔKth), considering all the notch geometry and loading characteristics, without the need of any adjustable parameter.
Hu et al. (2012) made a review of various concepts that are related to q as fracture process zone, damage process zone and theory of critical distance (TCD), suggesting an exponent m to es-timate q. The results indicate that there is an optimal m value for each material. Also, Arola and Williams (2002) evaluated the apparent Kt of surface texture on the fatigue life of high-strength low-alloy steels (HSLAS). It was found that the fatigue life of the used HSLAS was surface-texture-dependent, with the fatigue strength decreasing with the increase of the surface roughness.
Chapetti and Gerrero (2013) proposed the integration of fracture mechanics concepts to account for both: the fatigue notch sensitivity and the notch size effect. In fact, for components tested under cyclic loading containing notches or holes of a given Kt, with their fatigue strengths measured, the smaller are the notch or hole sizes, smaller is the decrement of Kf value.
In this article, an integrated approach was implemented to estimate the notch sensitivity of high strength wires (HSW). To accomplish it, Kf was obtained from experimental results of notched and notched free specimens. The estimation of Kt was implemented through the use of finite ele-ment commercial software, double-checked by an analytic approach as in Young (1989). Thus, the estimation of q was obtained through the utilization of classical relationships between Kt and Kf. 2 EXPERIMENTAL APPROACHES
The experimental approaches were divided in: material characterization, fatigue apparatus and fatigue procedure. The material characterization was divided in chemical analysis, tensile tests, optical mi-croscopy, hardness and roughness tests. The fatigue apparatus describes the specimen dimensions, servo-hydraulic machine setup and test accessories. The fatigue procedure explains the staircase meth-od used to determine the fatigue limits. The material characterization is addressed in sequence. 2.1 Material Characterization
The material characterization was done through the implementation of chemical analysis, tensile tests, optical microscopy, hardness and roughness tests of the HSW specimens. Table 1 shows the results of chemical analysis done by the use of optical emission spectroscopy technique. Table 2 shows the tensile tests results performed to determine the material main monotonic mechanical
C.F.C. Bandeira et al. / Assessing the Notch Sensitivity of High Strength Wires 2425
Latin American Journal of Solids and Structures 14 (2017) 2423-2438
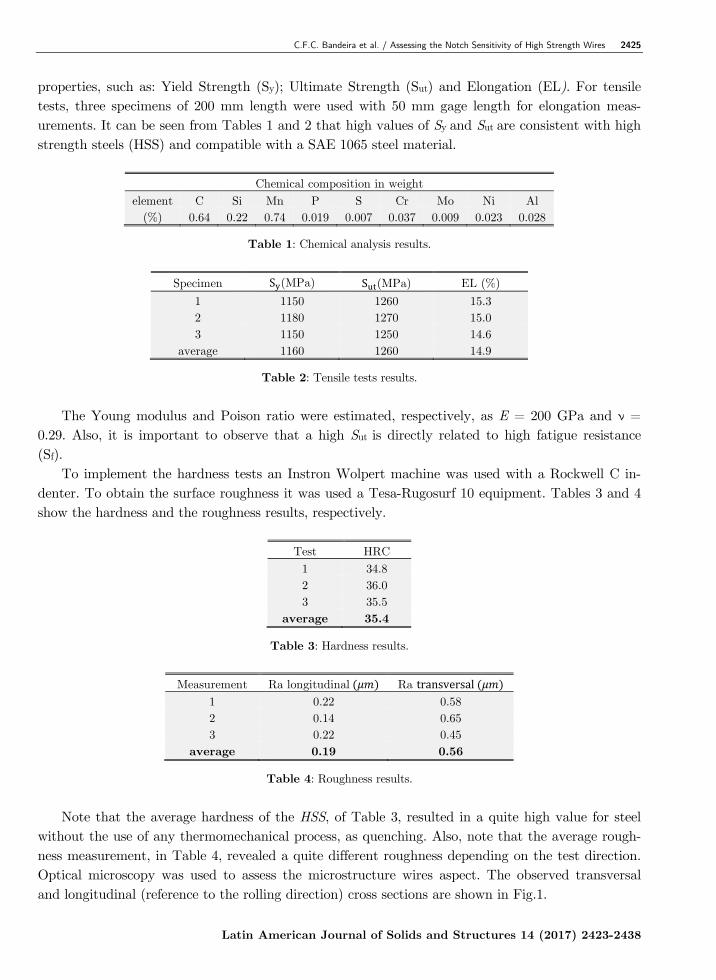
properties, such as: Yield Strength (Sy); Ultimate Strength (Sut) and Elongation (EL). For tensile tests, three specimens of 200 mm length were used with 50 mm gage length for elongation meas-urements. It can be seen from Tables 1 and 2 that high values of Sy and Sut are consistent with high strength steels (HSS) and compatible with a SAE 1065 steel material.
Chemical composition in weight element C Si Mn P S Cr Mo Ni Al
(%) 0.64 0.22 0.74 0.019 0.007 0.037 0.009 0.023 0.028
Table 1: Chemical analysis results.
Specimen S (MPa) S (MPa) EL (%)
1 1150 1260 15.3 2 1180 1270 15.0 3 1150 1250 14.6
average 1160 1260 14.9
Table 2: Tensile tests results.
The Young modulus and Poison ratio were estimated, respectively, as E = 200 GPa and ν =
0.29. Also, it is important to observe that a high Sut is directly related to high fatigue resistance (Sf).
To implement the hardness tests an Instron Wolpert machine was used with a Rockwell C in-denter. To obtain the surface roughness it was used a Tesa-Rugosurf 10 equipment. Tables 3 and 4 show the hardness and the roughness results, respectively.
Test HRC 1 34.8 2 36.0 3 35.5
average 35.4
Table 3: Hardness results.
Measurement Ra longitudinal Ra transversal
1 0.22 0.58 2 0.14 0.65 3 0.22 0.45
average 0.19 0.56
Table 4: Roughness results.
Note that the average hardness of the HSS, of Table 3, resulted in a quite high value for steel
without the use of any thermomechanical process, as quenching. Also, note that the average rough-ness measurement, in Table 4, revealed a quite different roughness depending on the test direction. Optical microscopy was used to assess the microstructure wires aspect. The observed transversal and longitudinal (reference to the rolling direction) cross sections are shown in Fig.1.

2426 C.F.C. Bandeira et al. / Assessing the Notch Sensitivity of High Strength Wires
Latin American Journal of Solids and Structures 14 (2017) 2423-2438
(a) (b)
Figure 1: Microstructural aspect observed by optical microscopy. (a) Transversal and (b) longitudinal
cross sections. Etching: nital 2%. Magnification: 1000 X. Bandeira et al. (2014).
It can be observed that the microstructure is composed of elongated grains, in the rolling di-
rection, of ferrite and pearlite. The volumetric fraction of pearlite is consistent with an eutectoid carbon steel composition. It can be also observed fine elongated white areas between pearlite grains which correspond to the primary ferrite. Such microstructural aspect suggests a severe cold working, compatible with the last rolling pass that could be applied under the critical tempera-ture. Such procedure is in line with materials aiming to attain high yield strength and ultimate tensile strength levels. The fatigue apparatus is addressed in sequence. 2.2 Fatigue Apparatus
To experimentally assess Kf value, it was necessary to obtain the notched and notched free speci-mens fatigue limits. To accomplish this objective notches and notched free specimens were tested in a servo-hydraulic test machine, equipped with a four points bending fixture.
The specimens were submitted to different loading levels, maintaining the same loading ratio R = σmin / σmax. All specimens were manufactured in house by cutting 200 mm length bars. Concern-ing the specimen’s surface finishing, they were far from highly polished; indeed all surface finishing was maintained as received, with arithmetic average of absolute values of roughness (Ra) shown in Table 4. In this way, it was considered that the fatigue curves were related to real parts rather than the usual high polished specimens. Fig. 2 shows both specimens types.
(a) (b)
Figure 2: Specimen technical drawing (dimensions in mm). (a) notched free and (b) notched.

C.F.C. Bandeira et al. / Assessing the Notch Sensitivity of High Strength Wires 2427
Latin American Journal of Solids and Structures 14 (2017) 2423-2438
The dimensions were identical for both specimens’ types, notched and notched free, unless by a 0.4 mm shallow notch for the notched specimens generated (at transversal direction) by a broaching process in half its longitudinal length. Figure 3 shows the servo-hydraulic test machine used to im-plement the experimental fatigue tests, where Fig. 3.a shows the servo-hydraulic test machine gen-eral view and Fig. 3.b shows a specimen positioned on the inferior part of the four points bending fixture.
(a) (b)
Figure 3: Servo-hydraulic test machine: (a) general view and (b) four points
bending fixture (only the bottom part is shown).
Fig. 4 shows the four points bending fixture schematic drawing that is used to show some im-
portant geometric and loading characteristics.
Figure 4: The four points bending fixture schematic drawing.
The distances between rollers were defined in function of the specimen length. The bending
moment is considered uniform between the upper rollers. The experimental tests were conducted using pulsating loads, to guarantee the upper rollers contact with specimen during the tests. The fatigue loading levels were defined as a ratio between the specimen maximum stress (σmax) and the Sut, always maintaining the same loading ratio R.

2428 C.F.C. Bandeira et al. / Assessing the Notch Sensitivity of High Strength Wires
Latin American Journal of Solids and Structures 14 (2017) 2423-2438
The maximum force (Fmax) applied by the test machine was calculated as in Crandall et al. (1978):
F2 ∙ Ia ∙ c
(1)
Where, I is the specimen second moment of area, a is the distance between lower and upper rollers (see Fig.4) and c is the specimen semi-height (note that for notched specimen, the notch depth is deducted).
The four points bending apparatus was used, as shown schematically in Fig.4, to apply the pul-sating load. The ratio was maintained at R = 0.1. As the pulsating sine load has nonzero mean stress it was necessary to transform both, mean stress (σm) and alternating stress (σa), on equiva-lent alternating stress (σa_eq), as in Budynas and Nisbett (2014) and Castro and Meggiolaro (2016):
_
or _ (2)
It is also possible to rewrite equation 2.b to be a function of σa_eq:
σ 2 _
1 1 _
(3)
The fatigue procedure is addressed in sequence. 2.3 Fatigue Procedure
One of the main objectives of this article is focused in obtaining, with maximum possible accuracy, fatigue limits of both notched and notched free HSS specimens. To accomplish this objective the staircase method was used, as in Dixon (1965) and Dixon (1948). This method uses a simple idea: a specimen is submitted to a certain stress level, after a certain number of cycles if this specimen breaks, the next specimen has the stress level decreased by a pre-defined stress decrement. However, if the specimen doesn’t break, then the stress level is increased by a pre-defined stress increment. This process continues until all specimens are used or reaches a significant number of specimens that are statistically representative according to Dixon and Mood (1948). The staircase method flowchart is presented in Fig. 5. This simple method can produce a much better estimative of the notched and notched free specimen fatigue limits than the traditional Wohler approach.
Where C1 is a positive constant smaller than one that multiplies Sut to estimate the first maxi-mum stress σmax1, C2 is a positive constant bigger than one that divides the constant C1 to generate the fraction of Sut called stress increment. s is the increment or the decrement of stress and n is the number of specimens utilized. i is a counter that varies from 1 to n+1.
is the ith term of max-
imum stress applied to specimen. CPi is an output variable that has two values: B or NB, which means that a specimen has broken or has not broken.
The numerical approach is addressed at the next section.

C.F.C. Bandeira et al. / Assessing the Notch Sensitivity of High Strength Wires 2429
Latin American Journal of Solids and Structures 14 (2017) 2423-2438
Figure 5: Staircase method flowchart – specimen test sequence. Pollack et al. (2006)
3 NUMERICAL APPROACH
It is well known that the SCF produced by a given notch depends on the mode of loading and on the notch geometry. There are many ways to estimate it: by theory of elasticity, as in Timoshenko and Goodier (1951); by experimental measurements as in Pilkey and Pilkey (2008); using, for ex-ample, photoelasticity method, as in Dally and Riley (1991), or by using a numerical method like finite element method, as in Fish (2007). In this section a numerical approach, using finite element method, is used to estimate the stress concentration factor of the shallow notch. 3.1 Numerical Model
In this article it was used the commercial software ANSYS WORKBENCH v14.0 to evaluate SCF produced by a shallow notch broached on HSS specimen. For numerical model purposes the speci-men material was considered isotropic and linear elastic. The mesh was generated with hexahedrons elements PLANE 186 with plane stress option, with one node at each vertex, as shown in Fig. 6.a. The finite element model was created in 2-D dimension (in the X-Y plane) to reduce the computa-tional effort, as shown in Fig. 6.b.
The 2D model with plane stress option was considered based on E399 ASTM standard (2009). In item 7.1.3 of this standard, the minimum specimen width to develop plane strain condition is related to the material Sy/E ratio. Using the HSS material properties, this ratio was calculated as 0.0058, which corresponds in this standard to a minimum recommended width of 64 mm to develop plain strain condition. However, as the HSW specimen has 9 mm of width, it is quite reasonable to

2430 C.F.C. Bandeira et al. / Assessing the Notch Sensitivity of High Strength Wires
Latin American Journal of Solids and Structures 14 (2017) 2423-2438
suppose that the state of stress is much closer, even at half specimen width, to plane stress than to plane strain condition.
(a) (b)
Figure 6: Finite element model: (a) element PLANE 186 and (b) 2-D geometry.
Due to the notch depth is much smaller than the specimen height, in fact it is a shallow notch, and to ensure good elements aspect ratio, mainly around the notch, a refined region around it was provided as shown in Fig. 7.a. Figure 7.b shows a photo of the real notch machined by a manual broaching machine.
(a) (b)
Figure 7: (a) Specimen mesh details (δ = 0.075 mm) and (b) optical microscopy photo of the notch.
To guarantee the finite element model implementation consistency, a mesh convergence analysis was implemented, refining the element size, (δ) around the notch radius. Different δ were evaluated: 0.6, 0.5, 0.4, 0.3, 0.2, 0.1, and 0.075 mm. The mesh convergence was studied in function of the max-imum normal stresses in the x-direction (see Fig. 6.b). Fig. 8 shows a graphical representation of the mesh convergence study.

C.F.C. Bandeira et al. / Assessing the Notch Sensitivity of High Strength Wires 2431
Latin American Journal of Solids and Structures 14 (2017) 2423-2438
Figure 8: Mesh convergence study.
The mesh refinement of δ = 0.075 mm was selected for this analysis because the notch bounda-
ry can be described with a reasonable accuracy. Both, experimental and numerical results are pre-sented at the next section. 4 RESULTS
The results are divided in two parts: experimental and numerical. At experimental part, the fatigue limit results obtained from the experimental tests are shown and, at numerical part, the SCF result obtained from the finite element method is shown. 4.1 Experimental Results
Fig.9 shows a representation of the test sequence, for both notched and notched free specimens, applying the staircase method, as in Pollack et al. (2006), which algorithm can be seen in Fig. 5.
(a) (b)
Figure 9: Up-and-down sequence of staircase method: (a) notched free (b) notched specimens.

2432 C.F.C. Bandeira et al. / Assessing the Notch Sensitivity of High Strength Wires
Latin American Journal of Solids and Structures 14 (2017) 2423-2438
Note that all stresses are divided by Sut, generating a ratio (σa_eq / Sut)·100, which varies from 0 to 100%. Fig.10 presents all fatigue results, with common points that were obtained by usual fa-tigue approach and up-and-down points by using staircase method. The common points are repre-sented by black squares and the up-and-down points are represented by blue circles. Note that an arrow represent that specimen didn’t fail, for all figures. There is one arrow per specimen, unless in Fig. 10.b, where the not broken specimens were so near each other, that just one arrow was used.
(a) (b)
Figure 10: Fatigue results: both common points and up-and-down points for
(a) notched free, (b) notched specimens.
The fatigue results which are graphically shown in Fig. 10, correspond to actual fatigue results
values that are shown at Appendix, in Tables 6 and 7. Also in Fig. 14, at the same Appendix, the staircase method flowchart explains, in a graphical way, the two Se estimation, which are represent-ed by blue lines in Fig. 10. In Figs. 11.a and 11.b show a detailed view of up-and down points.
(a) (b)
Figure 11: Fatigue results, in details, for: (a) notched free and (b) notched specimens.

C.F.C. Bandeira et al. / Assessing the Notch Sensitivity of High Strength Wires 2433
Latin American Journal of Solids and Structures 14 (2017) 2423-2438
The fatigue limit results shown on Table 5 were obtained through the utilization of staircase method flowchart – estimation of Se range, shown in Fig. 14 at Appendix. The experimental fatigue results are available at Tables 6 and 7, also at Appendix, or graphically in Fig. 10.
Specimen μ σ Fatigue Limit (%)
Common points notched free 35.5
4.5%4.5%
33.9 ≤ ⁄ ∙ 100≤ 37.1
notched 15.5 4.5%4.5%
14.8 ≤ ⁄ ∙ 100≤ 16.2
Up-and-down points notched free 32.7
1.1%1.0%
32.3 ≤ ⁄ ∙ 100≤ 33.0
notched 12.7 1.1%1.0%
12.6 ≤ ⁄ ∙ 100≤ 12.8
Note: μ and σ were maintained from the notation adopted in Pollack et al. (2006).
Table 5: Fatigue limits, mean μ and the standard deviation σ.
The mean and the standard deviation of fatigue limit, respectively, μ and σ, of Table 5 were as-
sessed for two cases: if the failures were the majority event, the lower stress level of survival occur-rence was estimated or if the survivals were the majority event, the lower stress level of failure oc-currence was estimated. Note in Table 5 that fatigue limit for both notched and notched free spec-imens were estimated with less dispersion when it was used the up-and-down approach, based in the staircase method when compared with the common points, obtained with usual approach.
The numerical results were assessed in sequence. 4.2 Numerical Results
To calculate the SCF, the specimen model was loaded in pure bending, to simulate the four points bending test. The bending moment value was imposed to generate a unity normal stress on longitu-dinal fiber at the same height of the notch root but far from it. Using this approach, the maximum stress value at the notch root turns out to be exactly the value of the SCF. Fig. 12.a shows the finite element results in a usual representation and in Fig.12.b it was used a path approach, at the same height of the notch root, to explicitly show the stress concentration distribution.
As expected, the stresses form a high gradient curve in the neighborhood of the shallow notch root. The ratio between maximum stresses at notch root and nominal stresses at a region far from notch, was used to estimate Kt:
Kσ _
σ
2.841
2.84 (4)
Note that using the analytical approach shown at Appendix the Kt was estimated as 2.79,
which is quite close to the finite element estimative of 2.84. So, the value was estimated inside the following range: 2.79 2.84.
At next section, the material notch sensitivity factor is assessed.

2434 C.F.C. Bandeira et al. / Assessing the Notch Sensitivity of High Strength Wires
Latin American Journal of Solids and Structures 14 (2017) 2423-2438
(a)
(b)
Figure 12: Finite element longitudinal stresses (x-axis): (a) usual presentation
and (b) path approach (only left half is shown).
5 DISCUSION
In this section the results obtained by experimental and numerical approaches are used to estimate the HSW notch sensitivity factor.
The fatigue limit range for each specimen condition can be obtained from Table 5: 32.3 ≤ _⁄
∙ 100≤ 33.0 and 12.6 ≤ ⁄ ∙ 100≤ 12.8. The fatigue stress con-
centration factor can be stated, as Budynas and Nisbett (2014):
K_⁄
⁄ (5)
So the fatigue stress concentration factor Kf can be estimated, within the following range: 2.56 2.58. In sequence, the notch sensitivity can be estimated through the utilization of a classic
Peterson’s equation, as Budynas and Nisbett (2014):
qK 1K 1
(6)
Finally, applying the ranges calculated, respectively SCF and fatigue SCF ranges in equation (06), the range within the notch sensitivity can be estimated as: 0.86 0.87.
Analyzing the range for notch sensitivity factor, it can be said that the notch sensitivity narrow range obtained by the application of the proposed integrated approach revealed to be quite effec-

C.F.C. Bandeira et al. / Assessing the Notch Sensitivity of High Strength Wires 2435
Latin American Journal of Solids and Structures 14 (2017) 2423-2438
tive, manly due the use of the staircase method in the assessment of fatigue limits of the notched and the notched free specimens. On the other hand, the notch sensitivity range revealed to be high, indicating a probable brittle behavior, which is compatible to high strength materials. In fact, alt-hough the high ultimate strength is a desirable mechanical property to increase the fatigue re-sistance, the high notch sensitivity can induce deleterious effects to mechanical structures submitted to fatigue loading. 6 CONCLUSIONS
An integrated approach was used to assess the notch sensitivity of HSW. Material characterization was obtained through the implementation of chemical analysis, tension tests, hardness tests, rough-ness tests and optical microscopy of the HSW. Fatigue tests were accomplished with two types of wire specimens, the notched and the notched free, resulting in very distinct fatigue limits, which were used to estimate the fatigue SCF. Finite element method and analytical approaches were used to estimate the SCF with good matches between them. Finally, the notch sensitivity factor was obtained through the utilization of a well know Peterson’s equation.
In fact the utilization of the experimental/numerical integrated approach for this research was revealed quite promising in generating an estimative of HSW notch sensitivity value. In particular, the utilization of staircase method at experimental approach, really improves the fatigue limit esti-mation, which taking into account the natural tendency of fatigue results dispersion, contributed, in a very significant way, to obtain such a reasonable estimative of notch sensitivity. References
Arola, D., Williams C.R. (2002). Estimating the fatigue stress concentration factor of machined surfaces. Int. Journal of Fatigue, 24: 923-930.
Bandeira, C.F.C., Kenedi. P.P. and Souza, L.F.G. (2014). Analysis of Notch Sensitivity of High Strength Wires. VIII Congresso Nacional de Engenharia Mecânica – CONEM 2014, Uberlândia, Brazil.
Budynas, R. G. and Nisbett, J. K. (2014). Shigley's Mechanical Engineering Design. 10th Edition. McGraw Hill Education.
Castro, J.T.P. and Meggiolaro, M.A. (2016). Fatigue Design Techniques under Real Service Loads – Volume I – High-Cycle Fatigue, Amazon Books
Castro, J.T.P., Landim, R.V., Leite, J.C.C., Meggiolaro, M.A. (2014). Prediction of notch sensitivity effects in fa-tigue and in environmentally assisted cracking. Fatigue Fract Engng Mater Struct, 38:161–179, doi: 10.1111/ffe.12156.
Castro, J.T.P. and Meggiolaro, M.A. (2013). Is notch sensitivity a stress analysis problem? Frattura ed Integrità Strutturale, 25: 79-86, DOI: 10.3221/IGF-ESIS 25.12.
Chapetti, M.D., Guerrero, A.O. (2013). Estimation of notch sensitivity and size effect on fatigue resistance. Procedia Engineering, 66:323-333.
Crandall, S.H., Dahl, N.C., Lardner, T.J. (1978). An Introduction to the Mechanics of Solids. Second Edition with SI units, McGraw Hill International Editions.
Dally, J.W. and Riley, W.F. (1991). Experimental Stress Analysis. McGraw-Hill. ISBN-10: 0070152187.
Dixon, W.J. (1965). The up-and-down method for small samples. J. Am. Stat. Assoc. 60: 967–978.

2436 C.F.C. Bandeira et al. / Assessing the Notch Sensitivity of High Strength Wires
Latin American Journal of Solids and Structures 14 (2017) 2423-2438
Dixon, W.J., Mood, A.M. (1948). A method for obtaining and analysing sensitivity data. J. Am. Stat. Assoc. 43: 109–126.
E399_09 ASTM standard (2009). Linear Elastic Plane Strain Fracture Toughness KIC of Metallic Materials.
Fish, J. (2007). A First Course in Finite Elements. Wiley. ISBN-10: 0470035803.
Hu, X. A., Yang, X. G., Wang, J. K., Shi, D. Q., Huang, J. (2012). A simple method to analyze the notch sensitivi-ty of specimens in fatigue tests. Fatigue Fract Engng Mater Struct, 36:1009–1016, doi: 10.1111/ffe.12053.
Pilkey W.D. and Pilkey, D.F. (2008). Peterson's Stress Concentration Factors. 3rd Edition, Wiley.
Pollak, R., Palazotto, A., Nicholas, T. (2006). A simulation-based investigation of the staircasemethod for fatigue strength testing. Mechanics of Materials, 38:1170-1181.
Thimoshenko, S. and Goodier, S.N. (1951). Theory of Elasticity. McGraw-Hill.
Yang, Z., Kim, Kim, C.B., Cho,C., Beom,H.G. (2008).The concentration of stress and strain in finite thickness elas-tic plate containing a circular hole. International Journal of Solids and Structures, 45:713-731.
Young, W.C., (1989) Roark’s Formulas for Stress and Strain. Sixth Edition with SI units, McGraw Hill International Editions.
APPENDIX
A.1. Expressions for SCFs:
Fig. 13 shows the geometry of the notches used by analytic approach:
(a) (b)
Figure 13: SCFs for rectangular cross-section beam submitted to pure moment:
(a) U notch and (b) V notch. Young (1989).
The estimative of SCFs shown in Fig.13.a is, Young (1989):
k K for 0.5 ⁄ 4.0
where,
0.721 2.394 ∙ ⁄ 0.127 ∙ ⁄ 0.426 8.827 ∙ ⁄ 1.518 ∙ ⁄ 2.161 10.968 ∙ ⁄ 2.455 ∙ ⁄ 1.456 4.535 ∙ ⁄ 1.064 ∙ ⁄
K _ k
The estimative of SCFs shown in Fig.13.b is, Young (1989):
K _ 1.11 ∙ k 0.0275 0.1125 ∙ ∙ for 150°

C.F.C. Bandeira et al. / Assessing the Notch Sensitivity of High Strength Wires 2437
Latin American Journal of Solids and Structures 14 (2017) 2423-2438
According to Young (1989) the SCFs of a V–notch is estimated as the smaller value between Kt_U and Kt_V.. For this particular case where h = 0.4 mm, r = 0.3 mm, h/r = 1.33 mm, D = 6 mm and θ = 45º, the results are Kt_U = 2.79 and Kt_V. = 2.88, which results in an estimative of Kt = 2.79. A.2. Flowchart:
Fig. 14 shows a staircase method flowchart to estimate of Se range, as shown in Fig.10:
Figure 14: Staircase method flowchart – Estimation of Se range. Pollack et al. (2006).
Where A, B and C are constants defined in the flowchart, i_max is number of specimens that
have survived if the failures was the majority event (FME), S0 is the lower stress level of survival occurrence and mi corresponds to the number of specimens which have survived at each stress level or i_max is number of specimens that have failed if the survival was the majority event (SME), S0
is the lower stress level of failure occurrence and mi corresponds to the number of specimens which have failed at each stress level. Se is the fatigue limit; μ and σ are, respectively, the fatigue limit mean and the standard deviation.

2438 C.F.C. Bandeira et al. / Assessing the Notch Sensitivity of High Strength Wires
Latin American Journal of Solids and Structures 14 (2017) 2423-2438
A.3. Tables:
Several tests were performed with two types of specimen. Tables 6 and 7 summarize the results.
∙ 100 (%) _ ∙ 100 (%) number of cycles
common
set 0 up-and-down
set 0 up-and-down
set 1 50 31 1866774 1012461 1017371 52 32.8 - 174463 185197 54 34.6 - 1021397 166963 56 36.4 - 205270 - 60 40.3 138934 - - 70 51.2 75026 - - 80 64.3 44790 - - 90 80.2 36380 - -
Table 6: Fatigue test results – notched free specimens.
∙ 100 (%) _ ∙ 100 (%) number of cycles
common
set 0 common
set 1 common
set 2 up-and-down
set 0 up-and-down
set 1 up-and-down
set 2
18 9 - - - 1011280 - - 21.5 11 1163500 - - 1093159 1001769 - 24.9 13 - - - 1042841 344703 788188 28.2 15 - - - 178635 - - 35.7 20 105162 76117 90535 - - - 46.4 28 47501 32698 28350 - - - 55.6 36 24117 20234 20420 - - 66.3 47 16000 13501 12040 - - - 91 82 6141 - - - - -
Table 7: Fatigue test results – notched specimens.
The Tables 6 and 7 first and the second columns were calculated with the use of (03) and (02.b)
equations, respectively. Note that the specimens with number of cycles values marked with a grey rectangle represents the spent cycles until the test suspension of an unbroken specimen.