Assessing the Credit Worthiness of Italian SMEs and Mini ...pages.stern.nyu.edu/~ealtman/Assessing...
24
1 Assessing the Credit Worthiness of Italian SMEs and Mini-bond Issuers Edward I. Altman a , Maurizio Esentato b , Gabriele Sabato c, * a NYU Salomon Center, Leonard N. Stern School of Business, New York University, 44 West 4 th Street, New York, NY 10012, USA b Classis Capital SIM S.p.A, Via Vittor Pisani, 19 - 20124 Milano, Italy c Wiserfunding Ltd., Grand Union House, 20 Kentish Town Road, London NW1 9NX, UK Abstract A number of innovations have been introduced in the last five years to counter the devastating impact of credit rationing in Europe, particularly from traditional bank lending. This is a major problem for the small and medium size firms’ sector in Europe, which has also suffered from bank regulatory concerns of capital adequacy, heightened emphasis on default risk of bank counterparties and the general malfunctioning of credit extension and private sector growth. In Italy, some of these less traditional sources of funding for SMEs have started to become more popular and the development of the mini-bond market is a clear example. In this study, we develop a new innovative model to assess SMEs’ creditworthiness and we test it on the companies that have issued mini-bonds from this market’s inception in 2013 to 2015. These models are constructed not only for Italian SMEs, but specific models for four distinct industrial sectors are also provided. Furthermore, we apply, for the first time, Altman’s Mortality Rate Approach to determine the Bond Rating Equivalent and the probability of default for the SMEs that have issued mini-bonds. We review the risk/return tradeoff of the new bond market and confirm that the amount of information asymmetry is significant, potentially reducing the number of investors and small businesses that would be interested in using this new channel to fund their business growth. Last, we prove that the risk profile of the SMEs that have issued mini-bonds in the period considered is better than the average of our SME development sample. This supports the conclusion that SMEs that have chosen the new mini-bond market have done it consciously and not because they could not access bank lending. JEL Classification: G21; G28 Keywords: SME finance; Modelling credit risk for SMEs; Mini-bonds; Market efficiency * Corresponding author: Email at [email protected]
Transcript of Assessing the Credit Worthiness of Italian SMEs and Mini ...pages.stern.nyu.edu/~ealtman/Assessing...

1
Assessing the Credit Worthiness of Italian SMEs and Mini-bond Issuers
Edward I. Altmana, Maurizio Esentatob, Gabriele Sabatoc, *
a NYU Salomon Center, Leonard N. Stern School of Business, New York University, 44 West 4th Street, New York, NY 10012, USA
b Classis Capital SIM S.p.A, Via Vittor Pisani, 19 - 20124 Milano, Italy c Wiserfunding Ltd., Grand Union House, 20 Kentish Town Road, London NW1 9NX, UK
Abstract
A number of innovations have been introduced in the last five years to counter the devastating
impact of credit rationing in Europe, particularly from traditional bank lending. This is a major problem for
the small and medium size firms’ sector in Europe, which has also suffered from bank regulatory concerns
of capital adequacy, heightened emphasis on default risk of bank counterparties and the general
malfunctioning of credit extension and private sector growth. In Italy, some of these less traditional sources
of funding for SMEs have started to become more popular and the development of the mini-bond market is
a clear example. In this study, we develop a new innovative model to assess SMEs’ creditworthiness and
we test it on the companies that have issued mini-bonds from this market’s inception in 2013 to 2015. These
models are constructed not only for Italian SMEs, but specific models for four distinct industrial sectors are
also provided. Furthermore, we apply, for the first time, Altman’s Mortality Rate Approach to determine
the Bond Rating Equivalent and the probability of default for the SMEs that have issued mini-bonds. We
review the risk/return tradeoff of the new bond market and confirm that the amount of information
asymmetry is significant, potentially reducing the number of investors and small businesses that would be
interested in using this new channel to fund their business growth. Last, we prove that the risk profile of
the SMEs that have issued mini-bonds in the period considered is better than the average of our SME
development sample. This supports the conclusion that SMEs that have chosen the new mini-bond market
have done it consciously and not because they could not access bank lending.
JEL Classification: G21; G28 Keywords: SME finance; Modelling credit risk for SMEs; Mini-bonds; Market efficiency
* Corresponding author: Email at [email protected]
2
1. Introduction
In the years following the last financial crisis, the credit transmission channel has been
damaged as regards to the quantity, price, and distribution of credit. This is a major problem for
the small and medium size firms’ sector in Europe, which has also suffered from bank regulatory
concerns of capital adequacy, heightened emphasis on default risk of bank counterparties and the
general malfunctioning of credit extension and private sector growth. New regulatory requirements
have forced banks to offload inventories of corporate and mid-market debt assets, and to scale
back traditional lending for the foreseeable future. Banks are mandated to simplify their businesses
and shrink balance sheets. In 2012, the International Monetary Fund estimated that European banks
needed to reduce their asset base by $2.6 trillion. Being heavily reliant on traditional bank lending,
small and medium-sized enterprises (SMEs), are confronted with difficult financing constraints in
a deleveraging environment. This has been especially true in Italy.
A number of innovations have been introduced in the last five years to counter the
devastating impact of credit rationing in Europe, particularly from traditional bank lending. Both,
large corporates and SMEs have started to drastically reduce their reliance on bank lending
supporting the development of new alternative sources of funding (see Figure 1).
For larger enterprises, especially in Northern Europe and the U.K., the high-yield, non-
investment-grade bond market has grown from about €100 billion in 2010 to almost €500 billion
by the end of 2015, with almost 700 different corporate issuers, of late. But, this market is only
available to relatively large corporates. For smaller entities, and retail credit in particular, the
internet-based “crowd-funding” market has shown considerable growth and promise, but still lacks
regulatory scrutiny, size and sustainability issues persist in anticipation of continued tepid
macroeconomic growth and a possible new economic downturn. In addition, non-bank market-

3
based lending, or shadow-banking, from institutional lenders can improve the flow of credit to
SMEs, but will not be sufficient, in our opinion, to provide wide participation to the varied types
of SMEs across Europe.
Figure 1. Reliance on bank lending by non-financial corporations
This graph shows the reliance of corporates on bank lending. Albeit this has decreasing substantially in the last 10 years, it remains significantly above the one of the US.
Source: Authors compilation based on EIF 2015 report “Investment and investment finance”.
Private debt is emerging as an important funding component for fast-growing, medium-
sized companies, whose capital structure and competitive advantage have been seriously
challenged by the new banking regulatory environment (Basle III) and the heightened
globalization forces. Private debt comprises mezzanine and other forms of debt financing that
comes mainly from institutional investors such as funds and insurance companies – but not from
banks. In contrast to publicly listed corporate bonds, private debt instruments are generally illiquid
and not regularly traded on organized markets. They originate in the UK and the USA, where they
are an established form of funding and have long been used for financing growth and buyouts, but
new initiatives are spreading across Europe.

4
In this study, we build upon several studies (Altman and Sabato, 2005, 2007; Altman et al.,
2009; Ciampi and Gordini, 2013; Ciampi, 2015) to develop a new innovative set of models at
industry sector level to assess SMEs’ creditworthiness and we test it on the companies that have
issued mini-bonds since the market’s inception in 2013 to 2015. Our findings confirm that the
amount of information asymmetry is significant in the market and is affecting the level of
risk/return trade off potentially reducing the number of investors and small businesses that would
be interested in using this new channel to fund their business growth. We improve upon the
existing literature in various ways.
First, for the first time, we prove that a default prediction model developed for SMEs can be
used to predict the creditworthiness of companies that have not taken a loan, but have issued bonds,
mini-bonds in particular.
Second, we demonstrate that Altman’s Mortality Rate Approach to determine the Bond
Rating Equivalent and their relative PD could be mapped to an SME score to allow to transform a
relative risk assessment into an absolute one.
Third, by using our sophisticated model, we demonstrate that the risk-return tradeoff of the
Italian mini-bond market is not efficient. The average yield to maturity is substantially flat across
all BRE classes.
Last, we demonstrate that the average credit quality of mini-bond issuers is above the
average of the sample used to build our SME model. This confirms that the SMEs that have so far
chosen to raise funds through the mini-bond channel, have not done so because of lack of
alternatives, but to avail of a number of advantages including access to capital markets, debt
diversification, reduction of dependence on bank’s financing, brand promotion, better balance
sheets (lengthening average maturity of financing sources and stability of credit) and tax
incentives.
5
1.1 The Emergence of mini-bonds in Italy
Historically, the Italian economy relied heavily on banks to fund businesses. As a
consequence, immediately after the crisis, which led to bank deleveraging, there was no
established capital market solution able to provide the necessary liquidity for mid-market
corporates. The relative withdrawal of banks, continued low interest rates and the search for yield
and spreads have given a major boost to disintermediation in Italy and the rest of Europe.
To answer the call for wider credit accessibility for SMEs in Europe, a few countries have
experimented with bond financing. For example, in Germany, the mechanism is called
“Mittlestand-Anleihen Bonds,” but its growth and impact has been mediocre, at best. In Italy, the
market for SME bonds is known as “mini-bonds,” and it is this market that we address in this
report and suggest a critical ingredient to its eventual success.
Mini-bond is not a technical term: it is used in Italy to refer to debt securities (bonds) that
can take advantage of a simplified issuing mechanism due to package of reforms in 20121. The
objective of the law was to facilitate access by SMEs and unlisted companies to capital markets.
SMEs are defined as companies with less than 250 employees and annual turnover of no more than
€50m. The corporate law reforms excluded Micro companies, i.e. businesses with less than 10
employees and annual turnover not exceeding €2m (EU recommendation 2003/361).
The new segment of the Extra-MOT market dedicated to listing of bonds, commercial
paper, project finance bonds – whose trading is allowed only to professional investors – started in
February 2013. The number of issuers as of the end of March 2016 is about 120 and the total
amount of listed issuances since February 2013 is 160 (but only 134 mini-bonds are still
1 Mini-bonds were introduced by Law Decree no. 83 of 22 June 2012 converted with Law 134/2012 (the so–called Decreto Sviluppo or Development Decree) as amended by Law Decree 179 of 18 October 2012 converted with Law 221/2012 (the Development Decree bis).

6
outstanding) for a total issued amount of about €3.5bn. The vast majority (i.e. 86%) of the
issuances has a size below €50m (see Figure 2).
Figure 2. Italian Mini-bond market
These graphs show the development of the Italian mini-bond market from 2013 to 2015. Almost 90% of the issuances in these 3 years had a size less than €50m.
Source: Authors compilation of Mini-bonds listed on Borsa Italiana Extra MOT Pro platform.
2. The ZI-Score SME Model2
To achieve the required risk assessment transparency, we suggest strongly that models be
introduced and tested, built specifically to estimate default risk on Italian SMEs. Since the mini-
bond market is very new, there does not yet exist data to include recovery rates on defaults nor any
long-term market default rate statistics. We suggest, therefore, to concentrate on individual issuer
default probabilities, an area we have had considerable experience in and now focus upon for
Italian SMEs (see Altman and Sabato (2005, 2007) and Altman et al. (2010)).
2 These models were constructed by the authors in collaboration with the firm Classis Capital, SIM, S.p.A.

7
2.1 Existing Literature Small business lending has been under the attention of researchers and practitioners mainly
over the last ten years. Several aspects have been analysed. Most of the literature has focused on
the difficulties and the potentials of small business lending, investigating the key drivers of SME
profitability and riskiness for US banks (Kolari and Shin, 2004) or the lending structures and
strategies (Berger and Udell, 2006). Berger and Frame (2005) have analysed the potential effects
of the small business credit scoring on credit availability. They find that banking organizations
that implement automated decision systems (such as scoring systems) increase small business
credit availability.
Similarly, several authors (Altman and Sabato, 2005, 2007; Altman et al., 2010) conclude
that small business lending has a strong positive effect on bank profitability and they find, in
contrast with Kolari and Shin (2004), that lending to SMEs is riskier than to large corporates (see
also Saurina and Trucharte, 2004; Dietsch and Petey, 2004). As a consequence, they demonstrate
that banks should develop credit risk models specifically addressed to SMEs in order to minimize
their expected and unexpected losses. Many banks and consulting companies already follow this
practice of separating large corporates from small and medium sized companies when modeling
credit risk.
Altman and Sabato (2007) also demonstrate that, excluding self-employed and sole trader
micro business, the complexity of the other bigger companies cannot be managed only with bureau
information, but a financial analysis is needed. Grunert et al. (2005) and Altman et al. (2010) have
demonstrated how the combined use of financial and qualitative variables increases the accuracy
in estimating the default.
In the literature, we have found that several authors have focused on Italian SMEs. Dainelli
et al. (2013), combining accounting information and credit history in the same variable, develop a
8
logit model based on 188 Italian SMEs. They find the usage of credit lines as being an important
variable for explaining the probability of default. On contrary they show how capitalization does
not affect ratings. Similar results are obtained by Norden and Weber (2010) who find the credit
line usage, the limit violations, and the cash inflows exhibit abnormal patterns approximately 12
months before default. They conclude that measures of account activity substantially improve the
model accuracy, especially for the small business.
Cannata et al. (2002) provide an empirical estimation of PD for SMEs, using a logistic
model. The data consist of quantitative, but not qualitative information on a sample of 180,000
Italian firms, collected by Company Accounts Register (Cerved) and Credit Register of the Bank
of Italy. In this study, the definition of default used is narrower than the one proposed by the new
Basel Accord. A stepwise procedure is used to select significant explanatory variables and the
procedure is run conditionally on the economic sectors (manufacturing, trade, construction) across
which SMEs are distributed. The authors show that SMEs have higher PD than large corporates.
Ciampi e Gordini (2013) develop a default prediction model for Italian SMEs using neural
network methodologies. Their findings reveal neural network to be very effective to increase
models’ prediction power compared to other methodologies and in particular for micro firms.
Last, Ciampi (2015) analyses the importance of corporate governance characteristics on
default prediction models for SMEs. His results show that CEO duality, owner concentration, and
a reduced number of outside directors on the board (no more than 50%) are significantly and
negatively correlated with small company default and ii) corporate governance variables
significantly improve the default prediction accuracy.

9
2.2 Data description The main idea is compare the financial profiles of Italian SMEs, which have either
defaulted or not in the past, in order to build a multivariate model for predicting the probability of
default of those firms who have already, or could potentially, tap the mini-bond market for debt
financing. The model(s) also can indicate the relative health of firms within specific sectors.
Based on a database extracted from AIDA, we assessed 15,452 active and 1,000 non-active
Italian SMEs.3 After cleansing this data, approximately 13% (2,032 companies) were not included
due to missing information. The final sample included financial data on 14,420 Italian SMEs over
the period 2004-2013 (see Figure 3).
Figure 3. Development sample
This table shows the structure of the Italian SME development sample. In the first and second row, the number and the percentage of non-defaulted and defaulted firms are shown.
Number Percentage
Non-defaulted firms 13,990 96.3%
Defaulted firms 520 3.7%
Total 14,510 100%
3 AIDA is a database owned by Bureau Van Dijk and contains comprehensive information on companies in Italy, with up to ten years of history.

10
Figure 4. Distribution of total assets and sales in the Italian SME sample
This figure shows the distribution of total assets and sales for the Italian SMEs included in our sample. More than 75% of the companies have total assets and sales less than €15m. This reflects the shape of the Italian SMEs that tend to be relatively smaller in size than the European average.
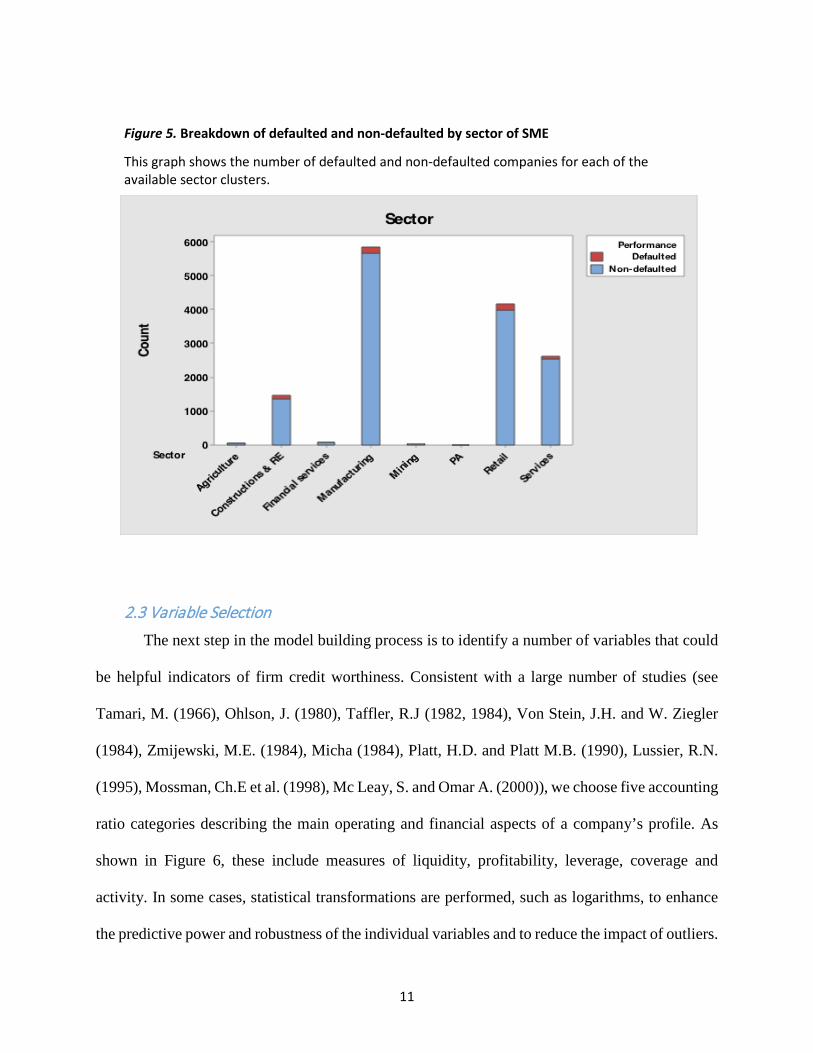
The breakdown by solvency status and size of Total Assets and Sales is given in Figure 4.
Note that most firms had Total Assets between €1-30 million and Sales between €5-45 million.
The number of employees ranges essentially between 5-150 and the business sectors are primarily
in the (1) Manufacturing, (2) Retail, (3) Services, and (4) Construction and Real Estate groupings.
The breakdown of defaults and non-defaults by Sector is given in Figure 5.
11
Figure 5. Breakdown of defaulted and non-defaulted by sector of SME
This graph shows the number of defaulted and non-defaulted companies for each of the available sector clusters.
2.3 Variable Selection The next step in the model building process is to identify a number of variables that could
be helpful indicators of firm credit worthiness. Consistent with a large number of studies (see
Tamari, M. (1966), Ohlson, J. (1980), Taffler, R.J (1982, 1984), Von Stein, J.H. and W. Ziegler
(1984), Zmijewski, M.E. (1984), Micha (1984), Platt, H.D. and Platt M.B. (1990), Lussier, R.N.
(1995), Mossman, Ch.E et al. (1998), Mc Leay, S. and Omar A. (2000)), we choose five accounting
ratio categories describing the main operating and financial aspects of a company’s profile. As
shown in Figure 6, these include measures of liquidity, profitability, leverage, coverage and
activity. In some cases, statistical transformations are performed, such as logarithms, to enhance
the predictive power and robustness of the individual variables and to reduce the impact of outliers.

12
Figure 6. Original financial variables
This table shows what variables have been used to calculate the ratios and indexes that have entered the final models.

13
Experience over the years by researchers in choosing appropriate variables has provided
important guidance and has resulted in reduced outliers and more robust estimates. Next, we
apply a statistical forward stepwise selection procedure to construct models for each of the four
sectors, previously identified (see Lo, 1985). The final choice of variables is determined by:
(1) Their individual statistical discrimination between the default and non-default groups. (2) Their covariance with each other; we eliminate some variables which provide similar information to those already selected. (3) Their accuracy levels on a multivariate basis, both in the original and test samples.
2.4 Model results We utilize a logistic regression technique, whereby a forward step-wise variable selection
method determined the final variable-set for each of the four sector models. The resulting models
included a range of 6 to 8 variables, each subject to several transformations to enhance their
predictive power. Each model was built on an original sample of 80% of the total sample, with
holdout (secondary) samples for our test results on 20% of each of the defaulted and non-defaulted
SME groups.
Based on data from one financial statement prior to default, we assess the Type I
and Type II error rates for each major sector. The Type I error (Column 1 in Figure 7) measures
the percentage of defaulted firms that are classified as non-default and the Type II error (Column
2) measures those firms classified as default but which did not default. The resulting overall
Accuracy Rate (Column 3) is simply 1-Average Error Rate for the entire sample. Note that these
results are based on both the original sample of defaulted and non-defaulted firms and just below,

14
in parentheses, the holdout samples of firms not used to build the model but used to “test” the
accuracy of the models on unbiased samples.
Figure 7. Accuracy tests of the four sectors for the SME default models
This table shows the misclassification rates and the accuracy ratios of the four different models. The first column shows the type I error rate, i.e. the percentage of defaulted firms classified as non-defaulted. In the second column, the type II error rate is illustrated. This rate represents the percentage of non-defaulted firms classified as defaulted. The third column shows the average accuracy of the model, calculated as 1 minus the average of the two error rates. In the last column, the accuracy ratio, defined as the ratio of the area between the cumulative accuracy profile (CAP) of the scoring model being validated and the CAP of the random model, and the area between the CAP of the perfect model and the CAP of the random model, is shown. The values in the brackets result from the application of the different models on the hold-out sample.
Type I error
rate Type II error
rate 1- Average Error Rate
Accuracy ratio
Manufacturing Model 6.92% (8.23%)
26.57% (27.64%)
83.26% (82.07%)
93.08% (92.21%)
Retail Model 16.77% (18.54%)
27.78% (28.89%)
77.73% (76.29%)
83.23% (81.76%)
Services Model 12.05% (14.88%)
24.54% (26.43%)
81.70% (79.35%)
87.94% (84.12%)
Constructions and Real Estate
8.89% (10.12%)
26.02% (28.24%)
82.55% (80.82%)
91.11% (89.86%)
In addition, we list the Accuracy Ratio, defined as the ratio of the area between the
cumulative accuracy profile (CAP) of the scoring model being validated and the CAP of the
random model, and the area between the CAP of the perfect model and the CAP of the random
model. Note that the more critical Type I error ranged from as low as 6.92% (8.23% holdout test)
for the manufacturing sector (our most important sector in terms of number of firms [see Figure
5]), to a higher error, but still impressive 16.77% (18.54% holdout) for the retail sector. The latter
was the only sector with a lower than 80% overall accuracy rate but still had an acceptable
15
accuracy ratio of over 80%. In general terms, our accuracy results were quite satisfactory in terms
of predicting whether a firm was likely to default or not within one year.
2.5 Bond Rating Equivalents and Probabilities of Default While it is useful to assess the accuracy ratio of a Default-Non-Default statistical model,
the bi-variate result does not indicate the probability of and the expected timing of the default.
These dimensions are critical for investors in terms of assessing the investment risk/return tradeoff
and also are extremely helpful in providing an important metric for the relative health of firms
across sectors and over time.
In order to provide additional measures of credit worthiness, we introduce the concept of
Bond Rating Equivalents (BRE) and Probabilities of Default (PD). Our benchmarks for
determining these two critical variables are comparisons to the financial profiles of thousands of
companies rated by one of the major international rating agencies (Standard & Poor’s) and the
incidence of default given a certain bond rating when the bond was first issued. The latter is based
on E. Altman’s Mortality Rate Approach (Altman, 1989). The actual process is a three-step
approach:
1. Build a credible and accurate credit scoring model.
2. Assign BREs to each firm based on its proximity to the Average Scores of the relevant bond
ratings of constituent firms, as assigned by S&P (for each of the four sector models).
3. For mini-bonds issued in the last two years, utilize the most recent updated marginal and
cumulative Mortality Rate Matrix (Figure 8) of actual Default Frequencies given the history of

16
new issue defaults by original bond rating over the extended period 1971-2015.4 For more
seasoned issues, use the standard cumulative default rate matrices from the rating agencies.
Each firm’s logistic credit score is first compared with the various average scores by S&P
Bond Rating (based on the most recent annual data compilations). The resulting BRE is then
assigned to the firm and referenced to the Default Probability Table found in Figure 8. As such,
we can assign a one-year, two-year, three-year, etc. PD for each firm. Examples of the one-year
and three-year PDs assigned to each BRE is given later in Figure 9.
4 The latest Annual update can be found in E. Altman and B. Kuehne’s “Default and Returns in the High-Yield Bond and Distressed Debt Market: The Year 2015 in Review and Outlook,” NYU Salomon Center, February 10, 2016.

17
Figure 8. Mortality Rates by Original Rating
All Rated Corporate Bonds*
1971-2015
Years after Issuance
*Rated by S&P at Issuance
Based on 2,903 issues
Source: Standard & Poor’s (New York) and Author’s Compilation

18
3. Assessing the SME ZI-Score Model on Italian Mini-bond Issuers
We assessed the credit worthiness on a sample of 102 Italian mini-bond issuers that have
issued mini-bonds in the last three years. Only a few companies (5) could not be analyzed due to
lack of sufficient financial data. The size of the Mini-bond issuers’ sample, registered and traded
in the secondary market by Borsa Italiana, were slightly larger than the SME population that we
used to construct the four sectors’ credit scoring models. We therefore felt it appropriate to assess
this mini-bond sample using our SME-derived models. We expect that an objective and rigorously
determined model will be extremely helpful to investors and issuers and help promote secondary
trading after issuance.
We now can observe the various metrics of mini-bond issuer credit worthiness. We apply
the latest financial data available on 98 issuers and assess each firms’ BRE and its associated one-
year and three-year probability of default from Figure 9. We can observe the BRE distribution and
their current yield, as given in Figure 10. It is not surprising, indeed expected, that the majority
(almost 70%) of mini-bond issuers have non-investment grade financial profiles. This is to be
expected amongst a list of SME, privately-held issuers. As such, over time, we can expect some
defaults from this population, which is perfectly normal as long as it is consistent with expected
returns. Comparisons between Italian mini-bond issuers and large corporate bond issuers in the
United States is likely to find (as we did) a majority of SME issuers to be non-investment grade,
or high-yield.
19
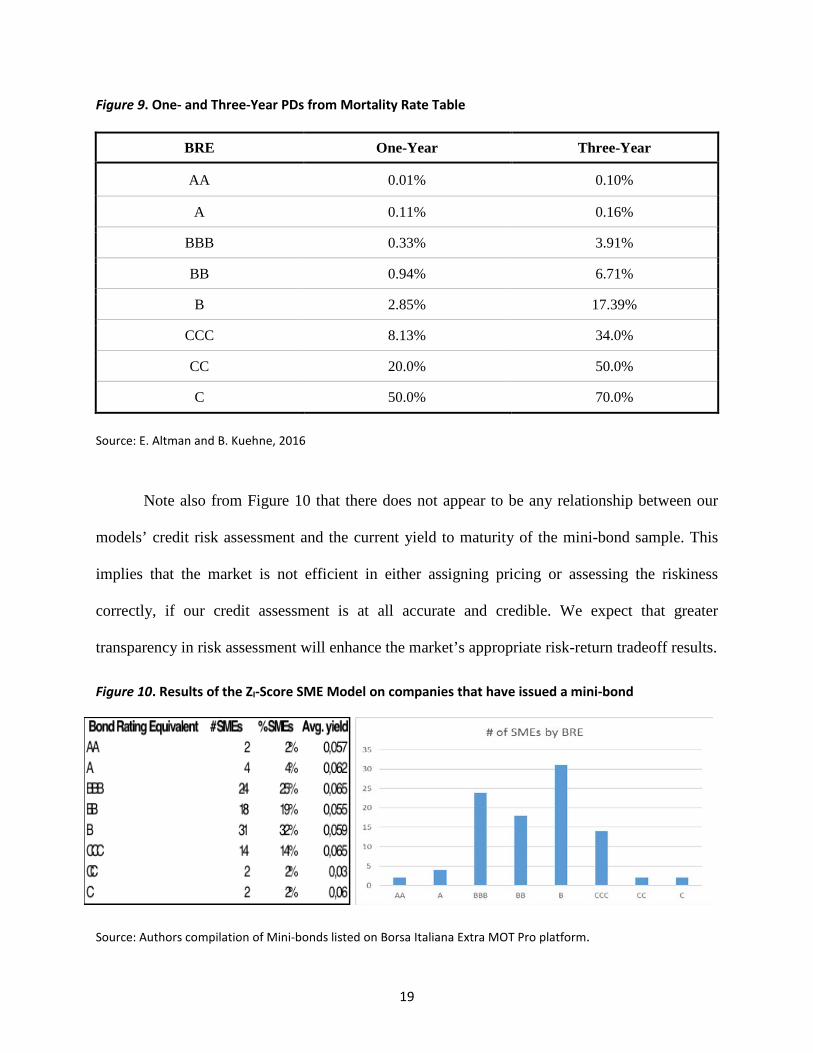
Figure 9. One- and Three-Year PDs from Mortality Rate Table
BRE One-Year Three-Year
AA 0.01% 0.10%
A 0.11% 0.16%
BBB 0.33% 3.91%
BB 0.94% 6.71%
B 2.85% 17.39%
CCC 8.13% 34.0%
CC 20.0% 50.0%
C 50.0% 70.0%
Source: E. Altman and B. Kuehne, 2016
Note also from Figure 10 that there does not appear to be any relationship between our
models’ credit risk assessment and the current yield to maturity of the mini-bond sample. This
implies that the market is not efficient in either assigning pricing or assessing the riskiness
correctly, if our credit assessment is at all accurate and credible. We expect that greater
transparency in risk assessment will enhance the market’s appropriate risk-return tradeoff results.
Figure 10. Results of the ZI-Score SME Model on companies that have issued a mini-bond
Source: Authors compilation of Mini-bonds listed on Borsa Italiana Extra MOT Pro platform.
20
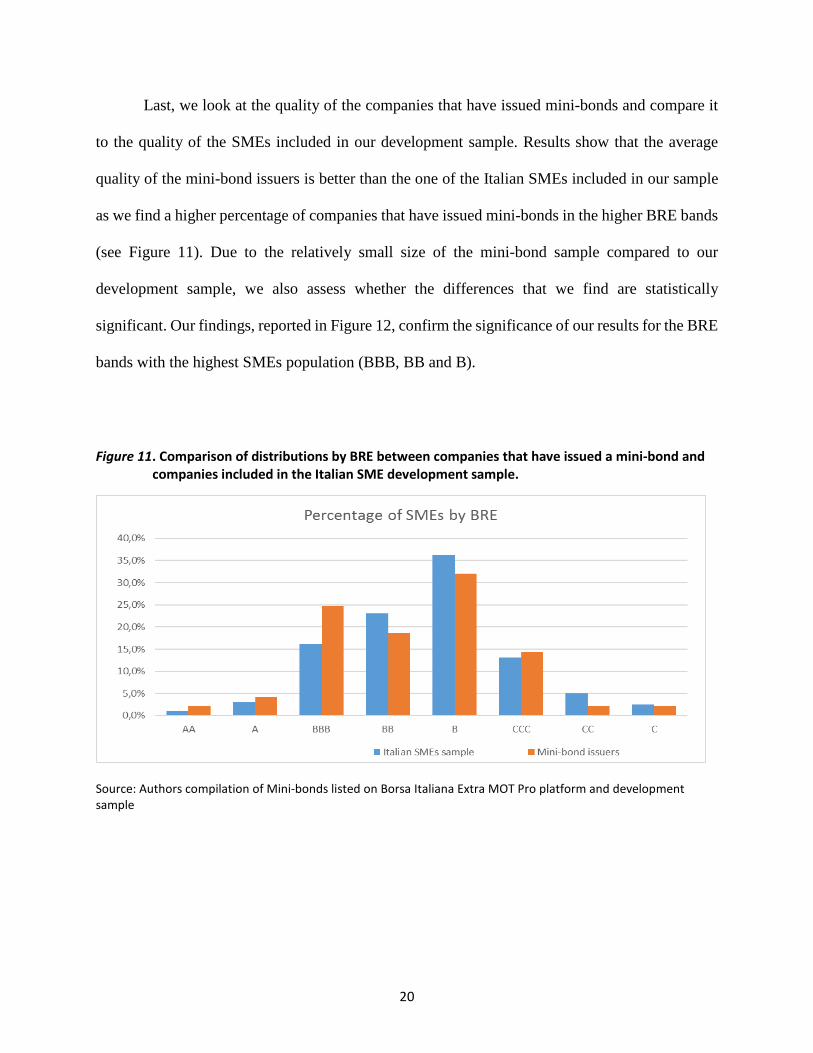
Last, we look at the quality of the companies that have issued mini-bonds and compare it
to the quality of the SMEs included in our development sample. Results show that the average
quality of the mini-bond issuers is better than the one of the Italian SMEs included in our sample
as we find a higher percentage of companies that have issued mini-bonds in the higher BRE bands
(see Figure 11). Due to the relatively small size of the mini-bond sample compared to our
development sample, we also assess whether the differences that we find are statistically
significant. Our findings, reported in Figure 12, confirm the significance of our results for the BRE
bands with the highest SMEs population (BBB, BB and B).
Figure 11. Comparison of distributions by BRE between companies that have issued a mini-bond and companies included in the Italian SME development sample.
Source: Authors compilation of Mini-bonds listed on Borsa Italiana Extra MOT Pro platform and development sample

21
Figure 12. Difference in means test to assess the statistical significance of the differences in the two distributions.
4. Conclusions
The SME ZI-Score model is a powerful tool that provides an assessment of a company’s
risk profile based on the last two years of financial information. Based on four separate models,
each specifically developed for a major industrial sector category, the family of ZI-Score models
successfully classified and predicted default or non-default on large samples of Italian SMEs.
Utilizing creative transformations of standard financial ratio metrics and combining them with
powerful statistical techniques, accuracy levels of at least 80% were achieved and these results
were robust across the major business risk sectors, over the last decade.
We have investigated whether default prediction model developed for SMEs would be
effective to predict the creditworthiness of mini-bond issuers. The findings demonstrate that our
SME Zi-Score model has significant discriminatory power on mini-bond issuers and represents a
good tool to evaluate their credit-worthiness. We improve upon the existing literature in various
ways.
First, for the first time, we prove that a default prediction model developed for SMEs can be
used to predict the creditworthiness of companies that have not taken a loan, but have issued bonds,
mini-bonds in particular.
BRE # MEAN1 ST DEV1 # MEAN2 ST DEV2 p value SignificanceAA 2 1403 564,89 149 1323 244,52 0,8409A 4 795 104,46 448 694 81,89 0,0539 *
BBB 24 515 97,14 2389 456 63,38 0,0032 ***BB 18 387 48,58 3434 427 51,92 0,0005 ***B 31 329 43,38 5376 352 47,14 0,0033 ***
CCC 14 239 29,61 1941 255 23,76 0,044 **CC 2 198 12,04 747 187 15,54 0,2128C 2 175 18,89 373 159 10,29 0,2229
Mini-bond sample Italian SMEs sample
22
Second, we demonstrate that Altman’s Mortality Rate Approach to determine the Bond
Rating Equivalent and their relative PD could be mapped to an SME score to allow to transform a
relative risk assessment into an absolute one.
Third, by using our sophisticated suite of industry specific models, we demonstrate that the
risk-return tradeoff of the Italian mini-bond market is not efficient. The average yield to maturity
is substantially flat across all BRE classes.
Last, we demonstrate that the average credit quality of mini-bond issuers is above the
average of the sample used to build our SME model. This confirms that the SMEs that have so far
chosen to raise their funds through the mini-bond channel, have not done so because of lack of
alternatives, but to avail of a number of advantages including access to capital markets, debt
diversification, reduction of dependence on bank’s financing, brand promotion, better balance
sheets (lengthening average maturity of financing sources and stability of credit) and tax
incentives.
In conclusion, we believe mini-bonds can be a success in Italy as long as the market supplies
an attractive risk/return tradeoff to investors as well as affordable and flexible financing for
borrowers. As for the risk dimensions, the usual categories apply, namely, market, liquidity and
credit risk. All bonds face these risks, but it is credit risk that is most critical for relatively
unknown, smaller enterprises. Assessments of credit risk must be convincing and objective,
providing complements to the traditional rating agency process. Indeed, the latter may not be
available in many cases. It must be made absolutely clear to investors that defaults will occur over
time and the loss from such events must be rigorously measured and then compared to the promised
yields on firms and portfolios to determine their attractiveness.

23
References
Altman, Edward I. (1989), “Measuring Corporate Bond mortality and performance”, Journal of
Finance, 44, 4.
Altman, Edward I. and Gabriele Sabato (2005), “Effects of the new Basel Capital Accord on Bank Capital Requirements for SMEs”, Journal of Financial Services Research, Vol. 28.
Altman, Edward I. and Gabriele Sabato (2007), “Modeling Credit Risk for SMEs: Evidence from the US Market”, ABACUS, Vol. 43, No.3, pp. 332-357.
Altman, Edward I., Gabriele Sabato and Nick Wilson (2010), “The Value of Non-Financial Information in SME Risk Management”, Journal of Credit Risk, Vol. 6, No. 2, pp. 5-25.
Altman, Edward I. and B. Kuehne (2016), “Default and Returns in the High-Yield Bond and Distressed Debt Market: The Year 2015 in Review and Outlook,” NYU Salomon Center, February 10, 2016.
Berger, Allen N. and Scott W. Frame (2005), “Small Business Credit Scoring and Credit Availability”, Federal Reserve Bank of Atlanta, Working Paper Series Nr. 10.
Berger, Allen N. and Gregory F. Udell (2006), “A more complete conceptual framework for SME finance”, Journal of Banking and Finance, 30(11).
Cannata F., Fabi F., Laviola S. (2002), “Rating interni e gestione del rischio di credito: la misurazione della probabilità di insolvenza”, Bancaria, 4.
Ciampi, F. (2015), “Corporate governance characteristics and default prediction modeling for small enterprises. An empirical analysis of Italian firms”, Journal of Business Research, 68(5).
Ciampi, F. and N. Gordini (2013), “Small enterprise default prediction modeling through artificial neural networks: An empirical analysis of Italian small enterprises”, Journal of Small Business Management, 51(1).
Dainelli, Francesco, F. Giunta and F. Cipollini (2013), “Determinants of SME credit worthiness under Basel rules: the value of credit history information”, PSL Quarterly Review, 66 (264).
Dietsch, M. and J. Petey (2004), “Should SME Exposures be treated as Retail or as Corporate Exposures? A Comparative Analysis of Default Probabilities and Asset Correlation in French and German SMEs”, Journal of Banking and Finance, 28(5).
Grunert, Jens, Lars Norden and Martin Weber (2005), “The role of non-financial factors in internal credit ratings”, Journal of Banking & Finance, 29(2).
Kolari, J. W. and H. G. Shin (2004), “Assessing the Profitability and Riskiness of Small Business Lenders in the U.S. Banking Industry”, www.sba.gov.

24
Lo, Aandrew W. (1985), “Logit versus discriminant analysis”, Journal of Econometrics, Vol. 31.
Lussier, R.N. (1995), “A non-financial business success versus failure prediction model for young firms”, Journal of Small Business Management, Vol. 33, nr. 1.
Mc Leay, S. and Omar A. (2000), “The sensitivity of prediction models to the non-normality of bounded an unbounded financial ratios”, British Accounting Review, Vol. 32.
Micha, B. (1984), “Analysis of business failures in France”, Journal of Banking and Finance, Vol. 8.
Mossman, Ch.E., Bell G.G., Swartz L.M., and Turtle H. (1998), “An empirical comparison of bankruptcy models”, The Financial Review, Vol. 33, nr. 2.
Norden, Lars and Martin Weber (2010), “Credit Line Usage, Checking Account Activity, and Default Risk of Bank Borrowers” Review of Financial studies, 23.
Ohlson, J. (1980), “Financial ratios and the probabilistic prediction of bankruptcy”, Journal of Accounting Research, Vol. 18, nr. 1.
Platt, H.D. and Platt M.B. (1990), “Development of a class of stable predictive variables: the case of bankruptcy prediction”, Journal of Business Finance & Accounting, Vol. 17, nr. 1.
Saurina, Jesùs and Carlos Trucharte (2004), “The Impact of Basel II on Lending to Small-and-Medium-Sized Firms: A Regulatory Policy Assessment Based on Spanish Credit Register Data”, Journal of Finance Services Research 26.
Taffler, R.J. (1982), “Forecasting company failure in the UK using discriminant analysis and financial ratio data”, Journal of the Royal Statistical Society, Vol. 145, Part 3.
Taffler, R.J. (1984), “Empirical models for the monitoring of UK corporations”, Journal of Banking and Finance, Vol. 8.
Taffler, R.J. and Tisshaw H. (1977), “Going, Going, Gone - Four Factors Which Predict”, Accountancy, Vol. 88.
Von Stein, J.H. and Ziegler W. (1984), “The prognosis and surveillance of risks from commercial credit borrowers”, Journal of Banking and Finance, Vol.8.
Zmijewski, M.E. (1984), “Methodological issues related to the estimation of financial distress prediction models”, Journal of Accounting Research, Supplement to Vol. 22.